Embed Size (px)
Citation preview
1
ACKNOWLEDGEMENTS
With the name of almighty Allah, I feel great honor and privilege to record my
deep sense of gratitude to my learned and kind hearted supervisor, Dr. Mohammad
Ishaq, Associate professor, Institute of Chemical Sciences, University of Peshawar for
his valuable guidance, inspiring and ever encouraging attitude throughout this research
work.
I extend my gratitude to Dr. Imtiaz Ahamad, Assistant professor, Institute Of
Chemical Sciences, University of Peshawar for his wonder full support and positive
criticism, who make me able to complete this research work.
I am much thankful to Prof. Dr. M. Rasool Jan, Director Institute of Chemical
Sciences, University of Peshawar for providing all the research facilities during this
work.
I am obliged to Dr. M. Shakirullah, Dr. Habib-u-Rahaman and Dr. Yousaf
Iqbal for their encouragement and positive suggestions.
I am grateful to DR. Murad, Dr. Iqbal, Mr. Nazeer khan, Mr. Thamur
Ahmad, Mr. Mehtab Faisal, senior scientific officers (SSO), PCSIR laboratories,
Peshawar, especially microbiology section for providing all the available research
facilities during this work.
I am obliged to the fuel laboratory staff, Mr. Rahman-u-din, Mr. Haroon Gul,
Mr. Falaknaz and Mr. Sabaz Ali khan for their cordial cooperation.
I am also much thankful to my friends like Mr Imram, Mr Fazal Mabood, MR
Rasool Khan , Mr Noor Zada and Mr Fazal Akbar for their cooperations.
2
A lot of thanks to the library staff; namely Mr. Aziz-u-Rahaman and Mr.
Ashfaq Khan for providing library facilities.
I am extremely thankful to all my friends whose help and good wishes made this
research work a success.
I feel obliged to mention the directorate of collages, who provided an
opportunity to complete my Ph.D theses.
Last but not least, I extend special thanks to my parents, brothers and the whole
family who supported me financially and morally throughout my study and prayed for
my success and bright future. I can never compensate their unlimited love and kindness.
Syed Mohammad Naeem
3
ABSTRACT
Sulfur in crude oil and in the products derived from it, is perhaps the most talked
about subject in public because it has a pivotal bearing on the environment on one side
and nuisance to the refiner on the other side. During combustion, sulfur and its analogues
are oxidized to SOx which are thrown into the environment with several implications.
The public awareness in term of pollutants has grown up tremendously, hence the refiners
have to resort to desulfurize even residues before they are put to use.
The present study was focused on to desulfurize the distillate fractions chemically
as well as biologically to make such products sweet for environmentally friendly
utilization and to help the refiners to remove even the least traces of sulfur and to enable
them to adhere strictly with environmental codes and regulations in vogue.
Crude oil sample was collected from Attock oil refinery (Pakistan) and was
fractionated into three distillate fractions i.e. light fraction; b.pt 30-1000C, middle
fraction; b.pt 101-2000C and heavy fraction; b.pt 201-3000C. In the first set of
experiments, each of the fractions was scrubbed with four different chemical reagents e.g.
HCl, NaOH, Na2HAsO4 and NH4VO3, separately. The various sulphur moieties like
elemental sulfur, total sulfides, aliphatic sulfides, mercaptan sulfur, hydrogen sulfides,
dibenzothiophene and benzothiophene were determined in original oil fractions and then
in residual oil fractions from each chemical scrubbing. The percent reduction in sulphur
anologues was also calculated to decide about the suitability of each scrubbing agent
understudy for removal of a particular sulphur moiety.

4
In the second set of experiments, oil fractions understudy were cultivated with
two bacterial strains cultured in coal mine water collected fro Much coal, mine, Pakistan.
The bacterial strains identified were pseudomonas putida and thiobacillus thioxidans.
The inoculations were performed for time duration of 12 hr, 24 hr, 48 hr, one week, and
one month.
Sulfur and its analogues in the original and residual samples from chemical and
biological treatments were investigated by using various analytical protocols. Elemental
sulfur, total sulfides, aliphatic sulfides, mercaptan sulfur, & hydrogen sulfides were
determined by gravimetric, potentiometric, titrimetric, and UV spectrophotometric
methods. GC Mass specrtrophotometry was used for identification of dibenzothiophene
and benzothiophene.
From the results obtained with chemical desulphurization, it is inferred that
ammonium vendate (NH4VO3) is proposed to be the best desulphurization reagent among
the four reagents studied which caused significant sulfur depletion.
Among the bacterial strains, thiobacillus thioxidans was found to be the best than
pseudomonas putida in term of sulfur removal capability. T. thioxidans caused 72%
sulfur depletion compared to Ps. putida which reduced nearly 63 % sulphur in one month
inoculation time.
The percent reduction data obtained for all inoculations performed reveals that
desulphurization was enroute when the time was extended beyond 12 hr even up to one
month .However, form the reduction data calculated between 00 hr-12 hr, 12 hr-24 hr, 24
hr-48 hr, 48 hr-one week, and one week- one month inoculations, it is suggested that 12
hr is the optimum time for significant removal of sulphur moieties.

5
From the comparative study of both chemical and biochemical desulphurization
attempted, it is note worthy that biodesulfurization is more easy, economical, less tedious,
more environmentally friendly method than chemical desulphurization.
6
TABLE OF CONTENTS
S. No Title Page
ACKNOWLEDGEMENT 01
ABSTRACT 03
1.0 CHAPTER—1 INTRODUCTION 12
1.1 Crude petroleum oil 14
1.2 Naturally occurring hydrocarbon groups in crude oils 14
1.2.1 Paraffins 14
1.2.2 Aromatics 15
1.2.3 Naphthenes 15
1.3 Other hydrocarbons 16
1.3.1 Alkenes 16
1.3.2 Dienes and alkynes 16
1.4 Non hydrocarbons compounds 17
1.4.1 Sulfur compounds 17
1.4.2 Oxygen compounds 18
1.4.3 Nitrogen compounds 18
1.4.4 Trace metals 18
1.4.5 Salts 19
1.5 Major refinery products 19
1.5.1 Gasoline 19
1.5.2 Kerosene 19
1.5.3 Liquefied petroleum gas (LPG) 20
1.5.4 Distillate fuels 20
1.5.5 Residual fuels 20
1.5.6 Coke and asphalt 21
1.5.7 Solvents 21
1.5.8 Lubricants 21
1.6 Common refinery chemicals 21
1.6.1 Leaded gasoline additives 21
1.6.2 Oxygenates 21
1.6.3 Caustics 22
1.6.4 Sulfuric acid and hydrofluoric acid 22
1.7 Sulfur distribution in crude oil 22
1.7.1 Elemental sulfur 23
1.7.2 Hydrogen sulfide 24
1.7.3 Mercaptan 24
1.7.4 Sulfide 26
1.7.5 Disulfides 26
1.7.6 Non-Reactive Sulfur 27
1.8 Desulphurization of crude oil 27
1.8.1 Conventional or chemical desulphurization 27
1.8.1.1 hydrodesulphurization (HDS) 28
7
1.8.1.1(a) Hydrodesulphurization catalysts 28
1.8.1.1(b) Chemistry of catalytic hydrodesulphurization 29
1.8.1.2 Solvent extraction method 29
1.8.1.3 Absorption method 30
1.8.1.4 Caustic treating method 31
1.8.1.5 Adsorption method 32
1.9 Biodesulfurization (BDS) 33
1.9.1 Model systems for desulphurization 34
1.9.2 Sulfur-specific PASHs metabolism 34
1.9.3 Conversion to the sulfuone 35
1.9.4 Cleavage of the first C-S linkage 35
1.9.5 Liberation of inorganic sulfur 35
1.9.6 The supply of reducing equivalents 36
1.9.7 Regulation of the activity in the cell. 36
1.9.8 Developing the technology 37
1.9.9 Biodesulfurization processes 38
2.0 CHAPTER—2 EXPERIMENTAL 39
2.1 Crude oil samples 39
2.1.1 Distillation study of crude oil 39
2.1.2 Chemicals treatment 40
2.4 Biological desulphurization of crude oil sample 40
2.4.1 Collection of the microorganism (bacteria). 40
2.4.2 Confirmatory study of bacteria 41
2.4.3 Microorganism, media, and culture conditions 41
2.4.4 determination of desulphurization rate 42
2.5. Physicothermal properties 43
2.5.1 Specific gravity 43
2..5.2 Viscosity: 43
2.5.3. Aniline point 44
2.5.4 Pour point: 44
2.5.5 Cloud point 45
2.5.6 Flash point 45
2.5.7 Ash content 45
2.5.8 Conradson carbon residue 46
2.6. Sulfur (reactive to copper) in cutting oil sample 47
2.6.1 Determination of total sulfur by flask combustion method 51
2.6.2 Determination of total sulfur by bomb combustion method. 55
2.6.3 Determination of elemental sulfur Specrtrophotometrically 56
2.6.4 Determination of total sulfides by potentiometric method 58
2.6.5 Determination of aliphatic sulfides by Specrtrophotometric method 59
2.6.6 Determination of mercaptan sulfur potentiometric method 60
2.6.7 Determination of hydrogen sulfide by volumetric method 62
2.6.8 Determination of dibenzothiophene Specrtrophotometrically 63
2.6.9 Determination of benzothiophene Specrtrophotometrically 64
3 CHAPTER—3 RESULTS AND DISCUSSION 65
8
3.1 Physicochemical properties 66
3.1.1 Chemically treated crude oil and its distillates 66
3.1.2 Biologically treated crude oil and its distillate fractions 67
3.1.2.1 Removal with P .putida and T.Thiooxidane 67
3.2. Desulphurization study of Crude and its distillate fractions 74
3.2.1 Removal of sulfur (reactive to copper) in fraction distillates by volumetric
method
75
3.2.2. Removal of total sulfur in crude oil and its distillates by flask combustion
method
90
3.2.3 Determination of total sulfur in petroleum products by bomb combustion
method.
102
3.2.5 Determination of elemental sulfur in crude oil and its distillates
Specrtrophotometrically
113
3.2.6 Determination of total sulfides in crude oil and its distillates by
potentiometric method.
128
3..2.7 Determination of Aliphatic sulfide in crude oil distillates
Specrtrophotometrically
140
3.2.8. Determination of Mercaptan sulfur potentiomatrically 155
3.2.9 Determination of hydrogen sulfide volumetrically 166
3.2.10 Determination of dibenzothiophene Specrtrophotometrically 178
3.2.11. Determination of benzothiophene Specrtrophotometrically 199
3.4 CONCLUSION 222
4.0 CHAPTER –4. REFERENCES 223
TABLES AND FIGURES.
Table-1(a) Physicothermal properties of virgin crude oil and its distillation fractions. 70
Table-1(b) Physicothermal properties of the chemically treated crude oil and its
distillation fractions.
71
Table-1(c) Physicothermal properties of the pseudomonas treated crude oil and its
distillation fractions.
72
Table-1(d) Physicothermal properties of the thiobacillus thioxidans treated crude oil
and its distillation fractions
73
Figure-1 Level of copper reactive sulfur determined (%) in chemically treated
samples
79
Figure-2 Reduction percentage (%) of copper reactive sulfur in chemically treated
samples.
80
Figure-3 Copper reactive sulfur (%) determined in pseudomonas putida treated
samples.
82
Figure-4 Reduction percentage (%) of copper reactive sulfur in pseudomonas
putida treated sample as function of inoculation time.
83
9
Figure-5 Level of copper reactive sulfur (%) determined in thiobacillus thioxidans
treated samples as function of inoculation times.
88
Figure-6 Reduction percentage (%) of copper reactive sulfur in thiobacillus
thioxidans treated sample as function of inoculation time
89
Figure-7 Level of total sulfur determined (%) by flask combustion method in
chemically treated samples.
92
Figure-8 Reduction percentage (%) of total sulfur flask by combustion method in
chemically treated samples.
93
Figure-9 Level of total sulfur determined (%) by flask combustion in pseudomonas
treated samples as a function of inoculation time.
96
Figure-10 Reduction percentage (%) of total sulfur by flask combustion method in
pseudomonas treated sample as function of inoculation time.
97
Figure-11 Level of total sulfur determined (%) by flask combustion method in
thiobacillus thioxidans treated sample as function of inoculation time.
100
Figure-12 Reduction percentage of total sulfur flask combustion method in
thiobacillus thioxidans treated samples as function of inoculation time
101
Figure-13 Level of total sulfur determined (%) by bomb method in chemically
treated samples.
104
Figure-14 Reduction percentage (%) of total sulfur bomb method in chemically
treated samples.
105
Figure-15 Level of total sulfur (%) determined by bomb method in pseudomonas
treated as function of inoculation time.
108
Figure-16 Reduction percentage (%) of total sulfur by bomb method in
pseudomonas treated samples as a function of inoculation time.
109
Figure-17 Level of total sulfur (%) determined by bomb method in thiobacillus
thioxidans treated sample as function of inoculation times.
111
Figure-18 Reduction percentage (%) of total sulfur by bomb method in thiobacillus
thioxidans samples as function of inoculation times.
112
Figure-19 Level of elemental sulfur (ppm) in chemically treated samples. 115
Figure-20 Reduction percentage (%) of elemental sulfur in chemically treated
samples
116
Figure-21 Level of elemental sulfur (ppm) in pseudomonas treated sample as
function of inoculation times.
120
Figure-22 Reduction percentage (%) of elemental sulfur in pseudomonas putida
treated samples as function of inoculation times.
121
Figure-23 Level of elemental sulfur (ppm) in thiobacillus thioxidans treated sample
as function of inoculation times.
125
Figure-24 Reduction percentages (%) of elemental sulfur in thiobacillus thioxidans
treated samples as function of inoculation times
126
Figure-25 Level of total sulfides (%) in chemically treated samples. 130
Figure-26 Reduction percentage (%) of total sulfides in chemically treated samples. 131
Figure-27 Level of total sulfides (%) in pseudomonas treated samples as function of
inoculation times.
133
10
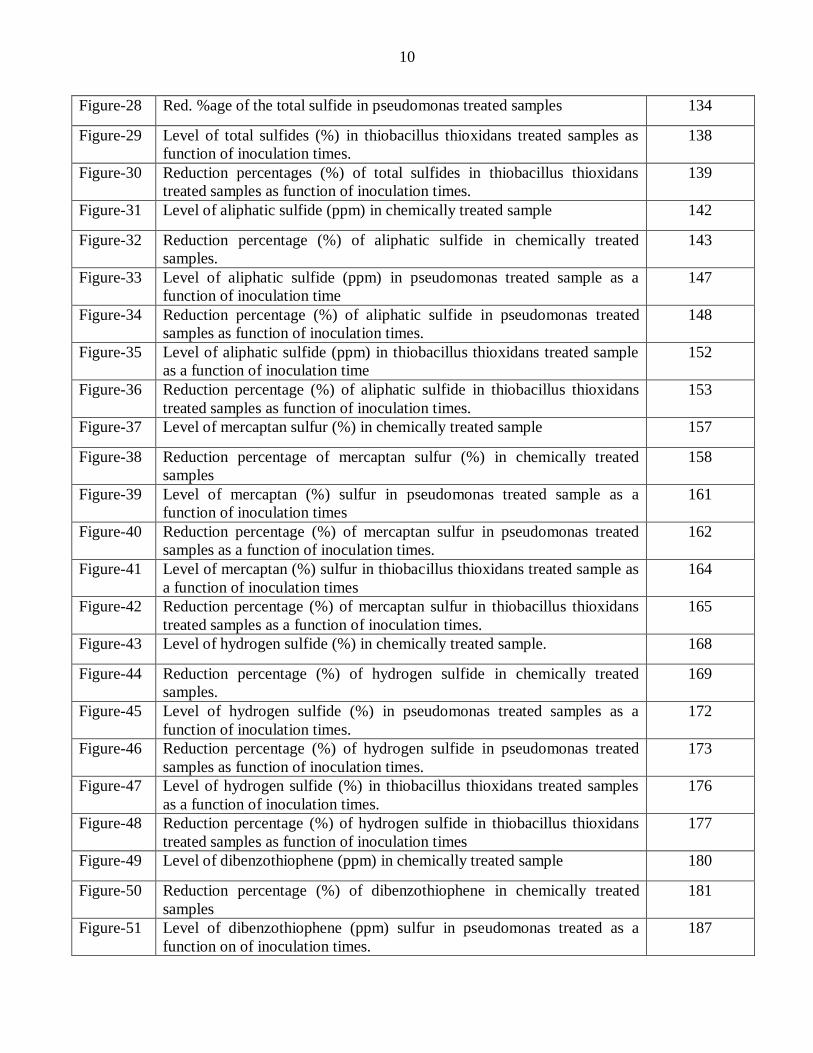
Figure-28 Red. %age of the total sulfide in pseudomonas treated samples 134
Figure-29 Level of total sulfides (%) in thiobacillus thioxidans treated samples as
function of inoculation times.
138
Figure-30 Reduction percentages (%) of total sulfides in thiobacillus thioxidans
treated samples as function of inoculation times.
139
Figure-31 Level of aliphatic sulfide (ppm) in chemically treated sample 142
Figure-32 Reduction percentage (%) of aliphatic sulfide in chemically treated
samples.
143
Figure-33 Level of aliphatic sulfide (ppm) in pseudomonas treated sample as a
function of inoculation time
147
Figure-34 Reduction percentage (%) of aliphatic sulfide in pseudomonas treated
samples as function of inoculation times.
148
Figure-35 Level of aliphatic sulfide (ppm) in thiobacillus thioxidans treated sample
as a function of inoculation time
152
Figure-36 Reduction percentage (%) of aliphatic sulfide in thiobacillus thioxidans
treated samples as function of inoculation times.
153
Figure-37 Level of mercaptan sulfur (%) in chemically treated sample 157
Figure-38 Reduction percentage of mercaptan sulfur (%) in chemically treated
samples
158
Figure-39 Level of mercaptan (%) sulfur in pseudomonas treated sample as a
function of inoculation times
161
Figure-40 Reduction percentage (%) of mercaptan sulfur in pseudomonas treated
samples as a function of inoculation times.
162
Figure-41 Level of mercaptan (%) sulfur in thiobacillus thioxidans treated sample as
a function of inoculation times
164
Figure-42 Reduction percentage (%) of mercaptan sulfur in thiobacillus thioxidans
treated samples as a function of inoculation times.
165
Figure-43 Level of hydrogen sulfide (%) in chemically treated sample. 168
Figure-44 Reduction percentage (%) of hydrogen sulfide in chemically treated
samples.
169
Figure-45 Level of hydrogen sulfide (%) in pseudomonas treated samples as a
function of inoculation times.
172
Figure-46 Reduction percentage (%) of hydrogen sulfide in pseudomonas treated
samples as function of inoculation times.
173
Figure-47 Level of hydrogen sulfide (%) in thiobacillus thioxidans treated samples
as a function of inoculation times.
176
Figure-48 Reduction percentage (%) of hydrogen sulfide in thiobacillus thioxidans
treated samples as function of inoculation times
177
Figure-49 Level of dibenzothiophene (ppm) in chemically treated sample 180
Figure-50 Reduction percentage (%) of dibenzothiophene in chemically treated
samples
181
Figure-51 Level of dibenzothiophene (ppm) sulfur in pseudomonas treated as a
function on of inoculation times.
187
11
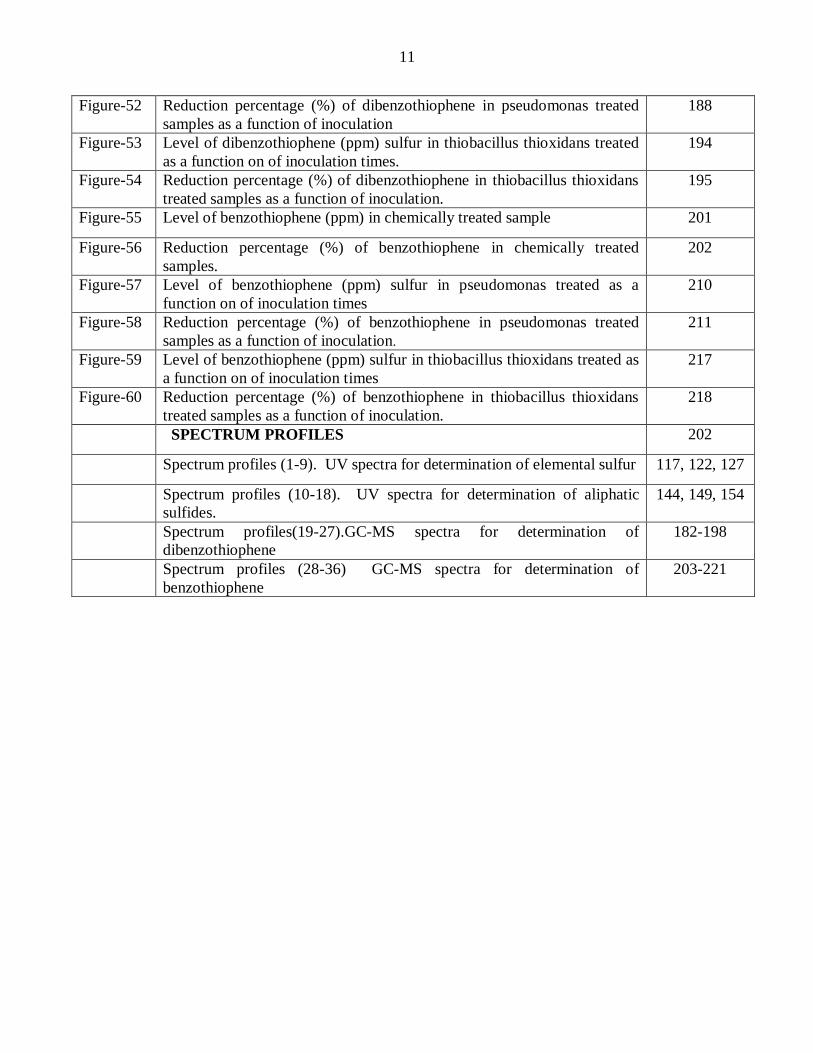
Figure-52 Reduction percentage (%) of dibenzothiophene in pseudomonas treated
samples as a function of inoculation
188
Figure-53 Level of dibenzothiophene (ppm) sulfur in thiobacillus thioxidans treated
as a function on of inoculation times.
194
Figure-54 Reduction percentage (%) of dibenzothiophene in thiobacillus thioxidans
treated samples as a function of inoculation.
195
Figure-55 Level of benzothiophene (ppm) in chemically treated sample 201
Figure-56 Reduction percentage (%) of benzothiophene in chemically treated
samples.
202
Figure-57 Level of benzothiophene (ppm) sulfur in pseudomonas treated as a
function on of inoculation times
210
Figure-58 Reduction percentage (%) of benzothiophene in pseudomonas treated
samples as a function of inoculation.
211
Figure-59 Level of benzothiophene (ppm) sulfur in thiobacillus thioxidans treated as
a function on of inoculation times
217
Figure-60 Reduction percentage (%) of benzothiophene in thiobacillus thioxidans
treated samples as a function of inoculation.
218
SPECTRUM PROFILES 202
Spectrum profiles (1-9). UV spectra for determination of elemental sulfur 117, 122, 127
Spectrum profiles (10-18). UV spectra for determination of aliphatic
sulfides.
144, 149, 154
Spectrum profiles(19-27).GC-MS spectra for determination of
dibenzothiophene
182-198
Spectrum profiles (28-36) GC-MS spectra for determination of
benzothiophene
203-221
12
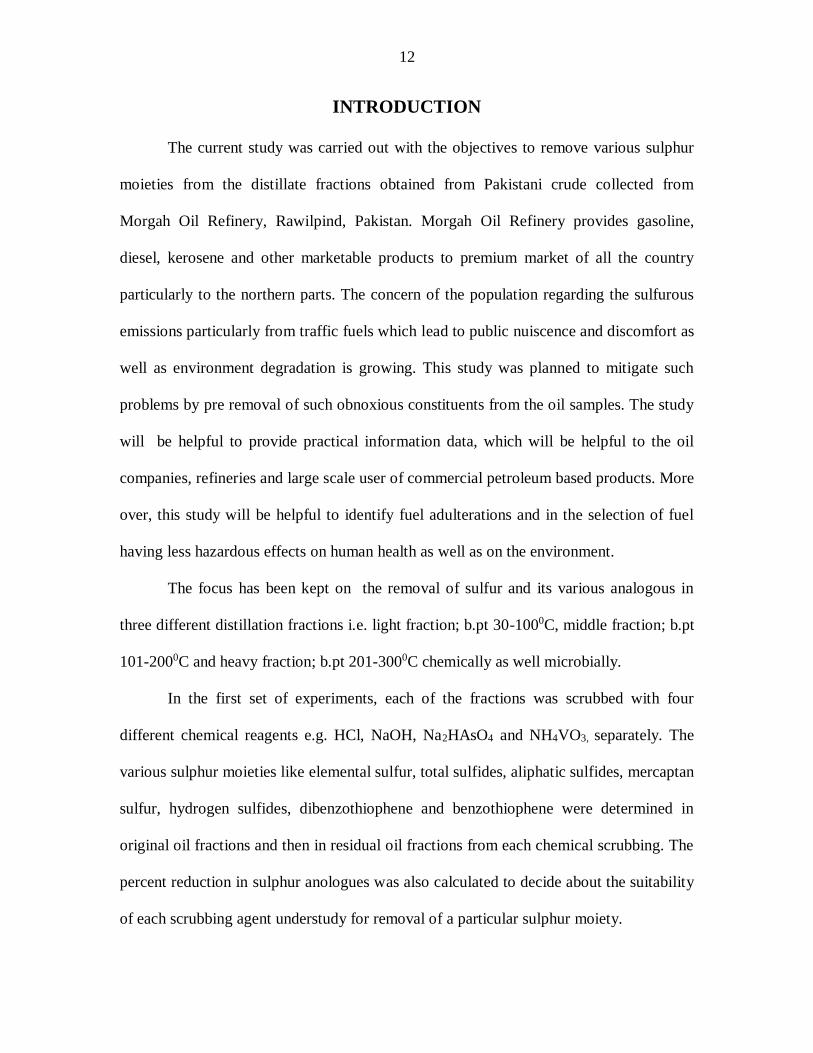
INTRODUCTION
The current study was carried out with the objectives to remove various sulphur
moieties from the distillate fractions obtained from Pakistani crude collected from
Morgah Oil Refinery, Rawilpind, Pakistan. Morgah Oil Refinery provides gasoline,
diesel, kerosene and other marketable products to premium market of all the country
particularly to the northern parts. The concern of the population regarding the sulfurous
emissions particularly from traffic fuels which lead to public nuiscence and discomfort as
well as environment degradation is growing. This study was planned to mitigate such
problems by pre removal of such obnoxious constituents from the oil samples. The study
will be helpful to provide practical information data, which will be helpful to the oil
companies, refineries and large scale user of commercial petroleum based products. More
over, this study will be helpful to identify fuel adulterations and in the selection of fuel
having less hazardous effects on human health as well as on the environment.
The focus has been kept on the removal of sulfur and its various analogous in
three different distillation fractions i.e. light fraction; b.pt 30-1000C, middle fraction; b.pt
101-2000C and heavy fraction; b.pt 201-3000C chemically as well microbially.
In the first set of experiments, each of the fractions was scrubbed with four
different chemical reagents e.g. HCl, NaOH, Na2HAsO4 and NH4VO3, separately. The
various sulphur moieties like elemental sulfur, total sulfides, aliphatic sulfides, mercaptan
sulfur, hydrogen sulfides, dibenzothiophene and benzothiophene were determined in
original oil fractions and then in residual oil fractions from each chemical scrubbing. The
percent reduction in sulphur anologues was also calculated to decide about the suitability
of each scrubbing agent understudy for removal of a particular sulphur moiety.
13
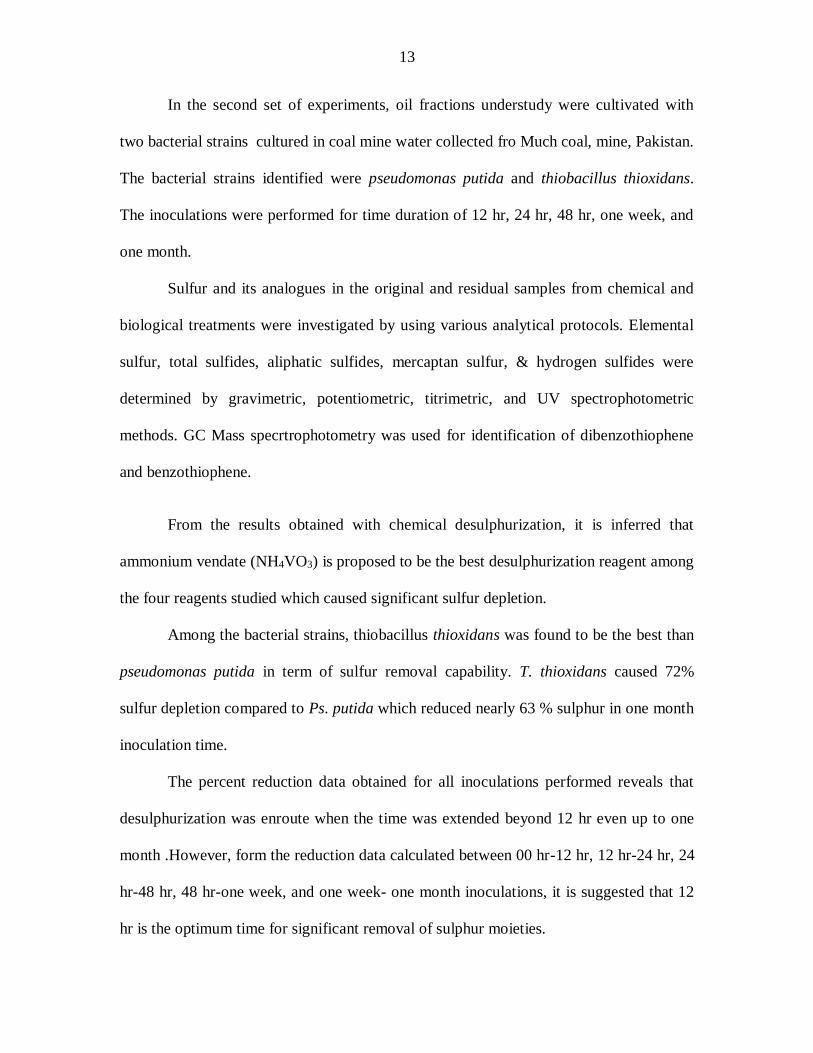
In the second set of experiments, oil fractions understudy were cultivated with
two bacterial strains cultured in coal mine water collected fro Much coal, mine, Pakistan.
The bacterial strains identified were pseudomonas putida and thiobacillus thioxidans.
The inoculations were performed for time duration of 12 hr, 24 hr, 48 hr, one week, and
one month.
Sulfur and its analogues in the original and residual samples from chemical and
biological treatments were investigated by using various analytical protocols. Elemental
sulfur, total sulfides, aliphatic sulfides, mercaptan sulfur, & hydrogen sulfides were
determined by gravimetric, potentiometric, titrimetric, and UV spectrophotometric
methods. GC Mass specrtrophotometry was used for identification of dibenzothiophene
and benzothiophene.
From the results obtained with chemical desulphurization, it is inferred that
ammonium vendate (NH4VO3) is proposed to be the best desulphurization reagent among
the four reagents studied which caused significant sulfur depletion.
Among the bacterial strains, thiobacillus thioxidans was found to be the best than
pseudomonas putida in term of sulfur removal capability. T. thioxidans caused 72%
sulfur depletion compared to Ps. putida which reduced nearly 63 % sulphur in one month
inoculation time.
The percent reduction data obtained for all inoculations performed reveals that
desulphurization was enroute when the time was extended beyond 12 hr even up to one
month .However, form the reduction data calculated between 00 hr-12 hr, 12 hr-24 hr, 24
hr-48 hr, 48 hr-one week, and one week- one month inoculations, it is suggested that 12
hr is the optimum time for significant removal of sulphur moieties.
14
1.1. Crude petroleum
Crude oil is complex mixture of various hydrocarbon species which have different
chemical composition based on the locality of the oil field. Crude oils have a variety of
colors ranging from transparent clear to back and its nature is from water like to tar like
solids. An ordinary crude oil is composed of 85-89% C, 10-13% H, 0.25-4% S, and less
than 1% N, O, metals, and salts [1].
1.2. Naturally occurring hydrocarbon groups in crude oil
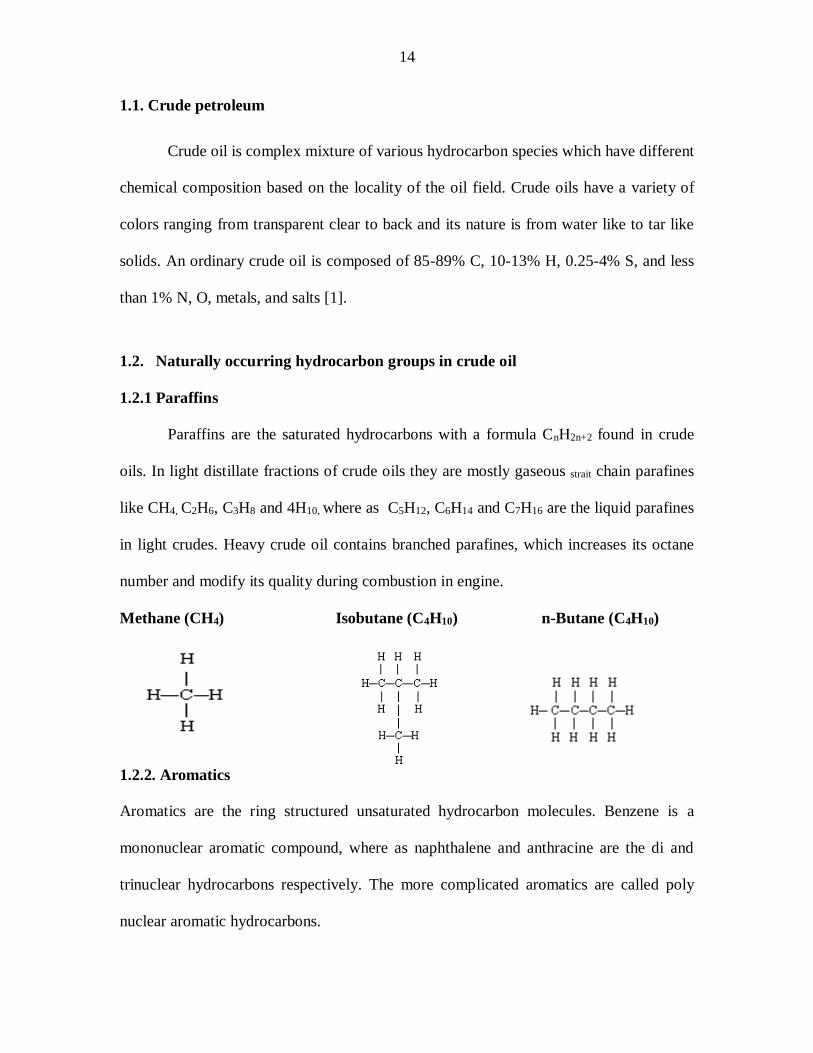
1.2.1 Paraffins
Paraffins are the saturated hydrocarbons with a formula CnH2n+2 found in crude
oils. In light distillate fractions of crude oils they are mostly gaseous strait chain parafines
like CH4, C2H6, C3H8 and 4H10, where as C5H12, C6H14 and C7H16 are the liquid parafines
in light crudes. Heavy crude oil contains branched parafines, which increases its octane
number and modify its quality during combustion in engine.
Methane (CH4) Isobutane (C4H10) n-Butane (C4H10)
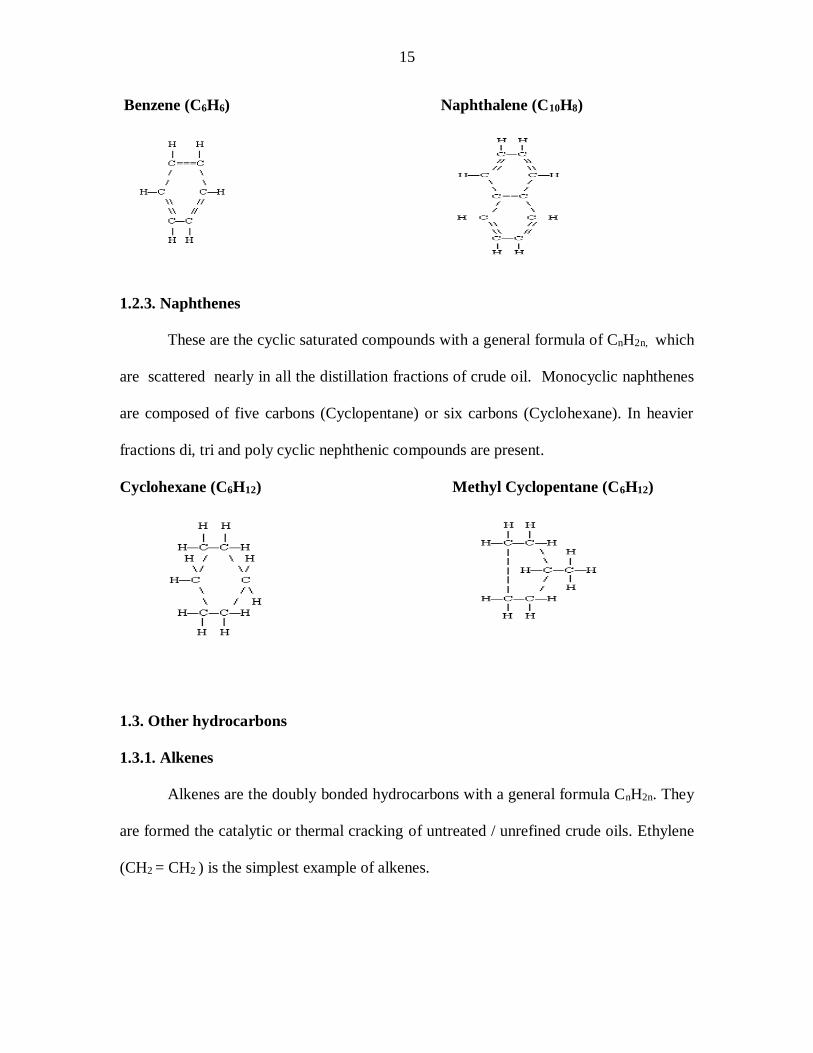
1.2.2. Aromatics
Aromatics are the ring structured unsaturated hydrocarbon molecules. Benzene is a
mononuclear aromatic compound, where as naphthalene and anthracine are the di and
trinuclear hydrocarbons respectively. The more complicated aromatics are called poly
nuclear aromatic hydrocarbons.
15
Benzene (C6H6) Naphthalene (C10H8)
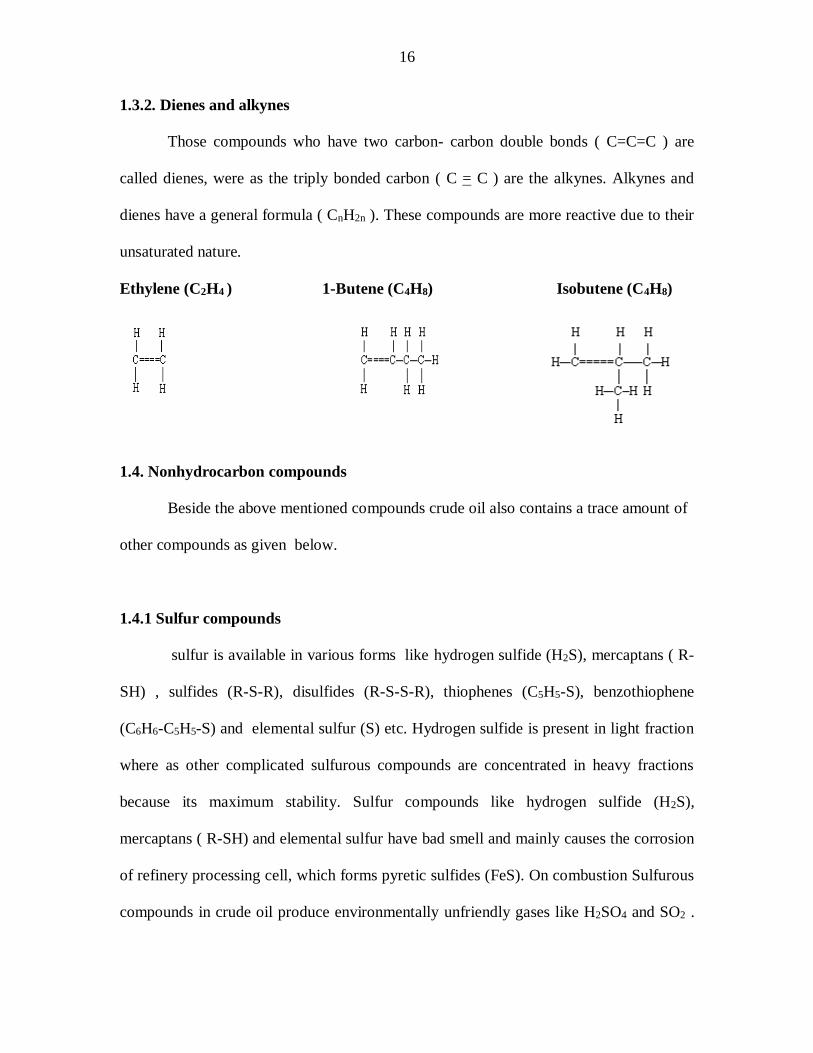
1.2.3. Naphthenes
These are the cyclic saturated compounds with a general formula of CnH2n, which
are scattered nearly in all the distillation fractions of crude oil. Monocyclic naphthenes
are composed of five carbons (Cyclopentane) or six carbons (Cyclohexane). In heavier
fractions di, tri and poly cyclic nephthenic compounds are present.
Cyclohexane (C6H12) Methyl Cyclopentane (C6H12)
1.3. Other hydrocarbons
1.3.1. Alkenes
Alkenes are the doubly bonded hydrocarbons with a general formula CnH2n. They
are formed the catalytic or thermal cracking of untreated / unrefined crude oils. Ethylene
(CH2 = CH2 ) is the simplest example of alkenes.
16
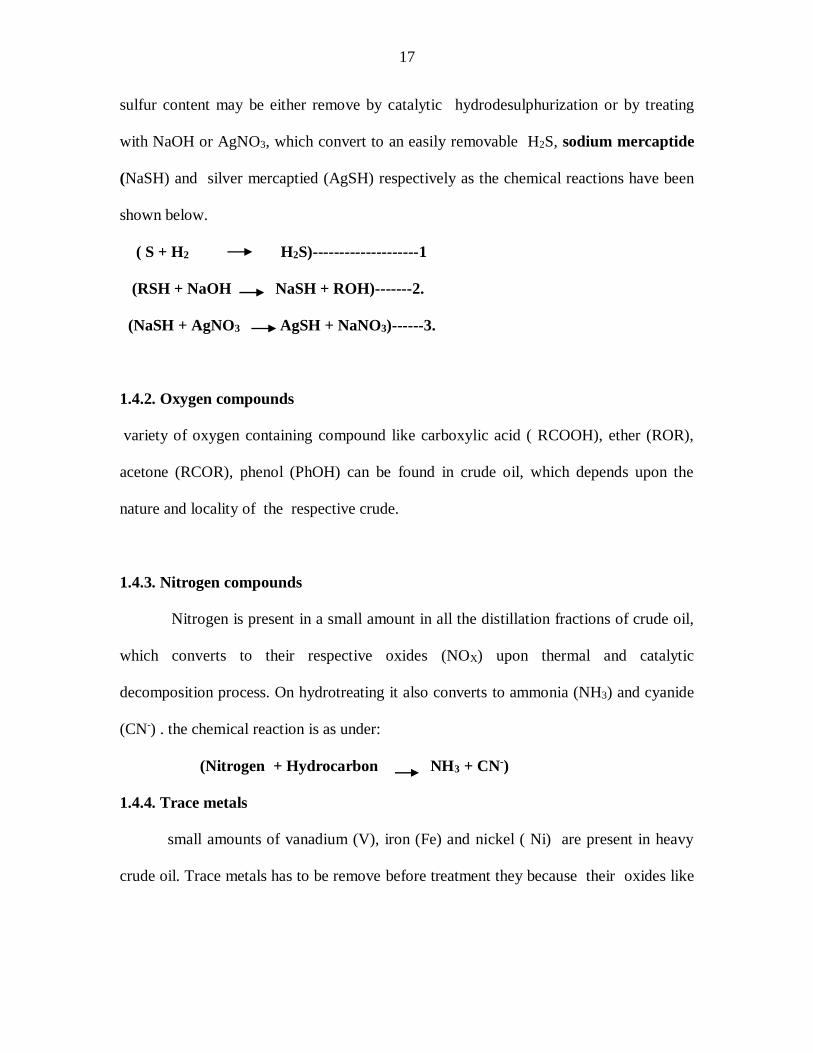
1.3.2. Dienes and alkynes
Those compounds who have two carbon- carbon double bonds ( C=C=C ) are
called dienes, were as the triply bonded carbon ( C = C ) are the alkynes. Alkynes and
dienes have a general formula ( CnH2n ). These compounds are more reactive due to their
unsaturated nature.
Ethylene (C2H4 ) 1-Butene (C4H8) Isobutene (C4H8)
1.4. Nonhydrocarbon compounds
Beside the above mentioned compounds crude oil also contains a trace amount of
other compounds as given below.
1.4.1 Sulfur compounds
sulfur is available in various forms like hydrogen sulfide (H2S), mercaptans ( R-
SH) , sulfides (R-S-R), disulfides (R-S-S-R), thiophenes (C5H5-S), benzothiophene
(C6H6-C5H5-S) and elemental sulfur (S) etc. Hydrogen sulfide is present in light fraction
where as other complicated sulfurous compounds are concentrated in heavy fractions
because its maximum stability. Sulfur compounds like hydrogen sulfide (H2S),
mercaptans ( R-SH) and elemental sulfur have bad smell and mainly causes the corrosion
of refinery processing cell, which forms pyretic sulfides (FeS). On combustion Sulfurous
compounds in crude oil produce environmentally unfriendly gases like H2SO4 and SO2 .
17
sulfur content may be either remove by catalytic hydrodesulphurization or by treating
with NaOH or AgNO3, which convert to an easily removable H2S, sodium mercaptide
(NaSH) and silver mercaptied (AgSH) respectively as the chemical reactions have been
shown below.
( S + H2 H2S)--------------------1
(RSH + NaOH NaSH + ROH)-------2.
(NaSH + AgNO3 AgSH + NaNO3)------3.
1.4.2. Oxygen compounds
variety of oxygen containing compound like carboxylic acid ( RCOOH), ether (ROR),
acetone (RCOR), phenol (PhOH) can be found in crude oil, which depends upon the
nature and locality of the respective crude.
1.4.3. Nitrogen compounds
Nitrogen is present in a small amount in all the distillation fractions of crude oil,
which converts to their respective oxides (NOX) upon thermal and catalytic
decomposition process. On hydrotreating it also converts to ammonia (NH3) and cyanide
(CN-) . the chemical reaction is as under:
(Nitrogen + Hydrocarbon NH3 + CN-)
1.4.4. Trace metals
small amounts of vanadium (V), iron (Fe) and nickel ( Ni) are present in heavy
crude oil. Trace metals has to be remove before treatment they because their oxides like
18
Ni-oxide, V-oxides and Fe-oxide leaves deposits on boilers, ducts and pipes during
refining process and also poisoned catalysts and deactivate it.
1.4.5. Salts
Deferent forms of inorganic salts like NaCl, MgCl2 and CaCl2 are present in the
entrained water, they must be remove or neutralized before their input to the refinery
because they deactivate the catalysts and also causes refinery plant corrosion. On
hydrolyses HCl forms which combine with ammonia to produce NH4Cl which causes
fouling and refinery processing unit corrosion.
(NH3 + HCL NH4CL).
1.5. Major refinery products
1.5.1. Gasoline
It is the important component of refined crude oil, which is used as vehical fuel. It
quality is based on octane number, volatility and vapor presser which evolves it uniform
oxidation and to minimizes its knocking character. Its boiling point is up to 4000F.
Special chemical additives like toluene (C5H6-CH3), xylene (CH3-C6H4- CH3), TML
pb(CH3)4 and TEL pb(CH3- CH2)4 are used for enhancement of gasoline quality
1.5.2kerosene
Kerosene is a common fuel distillate, which is mainly using for cooking, space heating
and aircrafts. It boiling point range is from 130 to 550 0F. Kerosene quality is based on its
flash point, freezing point etc.
19
1.5.3. Liquefied petroleum gas (LPG)
propane and butane are the two main components of liquefied petroleum gas (LPG),
which is using for cooking purposes as domestic fuel and as raw material for
manufacturing of perochemicals. Its quality is based on vapor pressure and purity.
1.5.4. Distillate fuels
Diesel fuels boiling point is ranging from 400 to 700 0F. Their qualities are based
on controlled flash and pour points, clean burning, no deposit formation in storage tanks,
and its uniform combustion efficiency depends upon cetane number..
1.5.5. Residual fuels
residual fuels are using on large scale like marine vessels, power plants,
commercial buildings and industries etc. its quality is mainly based on viscosity and less
amount of sulfur contents.
1.5.6. Coke and asphalt
The pure most carbon is called coke whereas asphaltene is the residual heavy fraction of
the crude oil. The main applications of coke are from electrode, bets etc where as
asphaltene is mainly sues for matlling of roads which is resistive to the chemicals and
weather conditions.
1.5.7. Solvents
various liquid hydrocarbons like benzene, toluene, and xylene etc are present in crude
oil, which dissolved the other substances and acts as solvents.
1.5.8. Lubricants
20
Good quality of lubricating oil can be prepared from the crude oil distillates with the
contamination of special additives to improve its viscosity, viscosity index to perform in
industries, vehicles etc at high temperature.
1.6. Common refinery chemicals
1.6.1. Leaded gasoline additives
Useful gasoline additives are xylene, toluene etc, which forms due to reforming process
of crude oil. In the early time TML and TEL has been commonly used but they are not
environmentally friendly chemicals. These additives mainly improve octane number of
the gasoline.
1.6.2. Oxygenates
Mostly ethereal compounds like tertiary amyl methyl ether (TAME), methyl
tertiary butyl ether (MTBE), Ethyl tertiary butyl ether (ETBE), for the reduction of
carbon dioxide (CO) emission and octane number up gradation.
1.6.3. Caustics
Caustics like NaOH and AgNO3 are added for the desalting of crude oil to reduce the
chlorides concentration and to overcome the corrosion of refinery processing plant units
Caustics are added for desalting water to neutralize acids and reduce corrosion.
They are also added to desalte crude in order to reduce the amount of corrosive chlorides
in the tower overheads. They are used in some refinery treating processes to remove
contaminants from hydrocarbon streams.
21
1.6.4. Sulfuric acid and hydrofluoric acid
During alkylation in the reforming process of hydrocarbons H2SO4 and HF are commonly
using as catalysts.
1.7. Sulfur distribution in crude oil
in crude oil sulfur contents are present in various forms, which should have to be
removed before the crude induction to the refinery because it causes various impacts on
environment during combustion to produce (SOX) and damages refinery metallic plant
due to corrosion. The high quantity sulfured crude oil is termed as sour crude where as
the low sulfured crudes are termed as sweet crudes.
Sulfur can be found in all the distillation fractions of crude oil, but its
concentration is more in heavy fraction s as compared to light fractions. Various sulfur
compounds has been observed in crude oils, which are given below:
a. Elemental sulfur
b. Hydrogen sulfide
c. Mercaptans
d. Sulfides
e. Disulfides
f. Non-Reactive Sulfur
g. Thiophenes
22
1.7.1. Elemental sulfur
Elemental sulfur is occurring rarely in crude oil products but it form during refining and
thermal cracking at high temperature. It causes corrosion to the refinery and reacts
rapidly with the other compounds and creates serious problems to refiners, which can be
removed with copper test easily [2].
1.7.2. Hydrogen sulfide
Hydrogen sulfide is almost present in crude oil, especially in the light fractions. It is very
much corrosive in nature even if present at 1 to 2 ppm level and can be removed by
treating with NaOH solution to convert H2S to sodium sulfide. The chemical reaction is
as (H2S + 2NaOH Na2S + 2H2O) [3].
1.7.3. Mercaptan
This is volatile sulfurous compound present mainly in the lower fractions of crude oil. Its
general formula is R-SH and its name is thiol or thioalcohal, which has a bad odor there
fore it is contaminated in Liquefied petroleum gases (LPG) and its concentration is
decreasing along the boiling point of crude oil [4]. They are soluble in caustic solutions
there fore can be easily remove by NaOH solution and to convert to environmently
friendly compounds as under [5-6].
(CH3SH + NaOH NaSH + CH3OH).
(C2H5SH + NaOH NaSH + C2H5OH).
23
1.7.4. Sulfides
They are present in all the distillation fractions of crude oil, which are known as
thioethers and their general formula is R1-S-R2, which can not be removed by simple
caustic treatments, there fore they has to be removed by hydrodesulphurization (HDS).
Methyl ethyl sulfide (CH3-S-C2H5) is the common example of sulfides.
1.7.5. Disulfides
These compounds are found in crude oil fractions. Disulfides are formed by the oxidation
of mercaptans sulfur. Its general formula is R1-S-S-R2.
2RSH + 1/2O2 RSSR + H2O
Dimethyl disulfide (CH3-S-S-CH3) is the general example disulfides.
1.7.6. Non-Reactive Sulfur
Mostly aromatic sulfurous complex compounds are examples of this category. These
compounds are dominantly present in heavier fractions of crude oils. Thiophenes
(C4H4S), Benzothiophene (Ph-C4H4S) and Dibenzothiophene (Ph-C4H4S-ph) are the
common examples of these compounds (7).
1.8. Desulfurization of crude oil
Removal of sulfur and their sulfurous analogues from the crude oil and their
distillate fractions is called desulphurization. It can be categorize in to two main
techniques.
a. Conventional or chemical desulfurization
b. Biological desulphurization or biodesulfurization.
24
1.8.1. Conventional or chemical desulphurization
Conventional desulphurization is a particular technique, where various chemicals can
be used to remove sulfurous compounds and get desulphurization. Three general
methods have been used for conventional desulphurization.
a. Catalytic hydrodesulphurization (HDS)
b. Solvent extraction method
c. Adsorption method.
1.8.1.1. Hydrodesulphurization (HDS)
Hydrodesulphurization involves the reaction of sulfur compounds with hydrogen
in the presence of catalyst, resulting in the formation of hydrogen sulfides and
hydrocarbon remnants of the original sulfur compounds. This is the most broadly
applicable process for desulfurization.
(a) Hydrodesulphurization catalysts
The most commonly used desulfurization catalysts are cobalt oxide and
molybdenum oxide or nickel oxide and molybdenum oxide dispersed on high surface
area alumina supports [8]. Molybdenum is generally regarded as the active
desulfurization component with cobalt or nickel acting as a promoter, which increase
catalytic activity. The catalysts are manufactured with a metal in their oxide state. In
active form they are in sulfide states, which are obtained by sulfiding the catalyst either
prior to use, or with the feed during the actual use. Any catalyst, which exhibits
hydrogenation, will catalyze hydrodesulfurization to some extent however the Group VIB
25
metals (chromium molybdenum and tungsten) are particularly active for desulfurization
especially, when promoted with metals from the iron Group (iron, cobalt, nickel). CoMo
catalysts are by for the most popular choice for desulfurization, particularly for strait run
petroleum fractions. NiMo has often chosen instead of CoMo when higher activity for
polyaromatic saturation or nitrogen removal is required, or when more refractory sulfur
compounds such as those in cracked stock must be desulfurized. In some application at
least, Nickel-cobalt-molybdenum (NiCoMo) catalyst appear to offer a useful balance of
hydrotreating activity [9]. Nickel-tungsten (NiW) is usually chosen only when fast
activity for aromatic saturation is required along with activity for nitrogen removal.
(b) Chemistry of catalytic hydrodesulfurization
As mentioned above catalytic hydrodesulfurization can accomplish more than just
desulphurization. De-nitrogenation and olefin saturation can occur as well as the removal
of oxygen in certain applications. Different types of sulfur compounds found in light
hydrocarbon streams (boiling point below 4000F) [10]. The fallowing reaction equations
illustrate that desulphurization is accomplished by the cleavage of carbon-sulfur bonds.
Carbon-hydrogen and sulfur-hydrogen bonds replace these bonds. In a similar manner
nitrogen and oxygen are removed in catalytic hydrotreating by the cleavage of C-N and
C-O bonds respectively.
1. H2S None- usually separated by stripping
2. (R-SH) +H2 R-H +H2S
3. R-S-R/ + 3H2 R-H + R/-H + 2H2S
4. R-S-S-R/ + 3H2 R-H + R/_H +2H2S
5. Cyclic sulfides (C5H10S)+ 2H2 C5H12 +H2S
26
From the chemical reactions it is clear that H2S has been the desire product in
each reaction and rest of the products are purely hydrocarbons.
1.8.1.2. Solvent extraction method
Solvent extraction removes the entire sulfur-bearing molecules from hydrocarbon
streams while absorption is widely employed for removing acid gases (H2S and CO2)
from natural gas and light petroleum gases. Popular solvents for these purposes are
aqueous or alcohol solutions or alkali amines and aqueous solutions of alkali carbonates.
Caustic treating usually with aqueous sodium hydroxides widely practiced to removed
mercaptan and organic acids from gasoline and occasionally from light petroleum
distillates. Some process combine caustic treating with air oxidation of mercaptan to
convert it to di- sulfides as such “sweetening” process eliminates the bad odor and
corrosiveness associated with mercaptan sulfur from hydrocarbon stream. Extraction is
not economically feasible for removing sulfur from heaver fraction of petroleum because
of high yield losses. However during extraction of heavy gas oil with phenol to
manufacture lubricating oil base stocks, sulfur compound are concentrated in the extracts.
This is observed since sulfur is pre-dominantly contained in the aromatic structures which
are preferentially removed as extracts [11].
1.8.1.3. Absorption method
Amine treating is an absorption process that is widely used to remove H2S, CO2
and other acid gases from natural and light petroleum gases. The process employs an
organic amine (mono-di-, trithaloamine) which will absorb H2S at temperature up to
1800F. The process is relatively simple. The untreated gas is passed up flow through a
27
packed or bubbled tray tower counter to the amine solution at approximately 1000F and
operating line pressure. Treated gas is removed at the top of the tower and the spent
solution is regenerated by steam stripping at higher temperatures (200 to 3000F). Other
processes have developed that are basically very similar to amine treating but which
employ a different type of reagent. Some popular reagents are solutions of potassium,
phosphate, amino acids or potassium carbonates [12], which can be alternatively used for
the removal of sulfur compounds counter currently.
1.8.1.4. Caustic treating method
Caustic treating is basically an extraction process that removes organic acids,
mercaptan sulfur, H2S and phenolic sulfur compounds from petroleum fractions. The
process is usually applied to light distillates, but yield losses are too great with heaver
stock [13]. The major caustic treating today is the removal of mercaptan from light strait-
run gasoline. Caustic treating is accomplished by contacting a 5 to 20 wt% caustic
solution counter currently with untreated stream in a packed tower. The treating is carried
at pressure ranging from 10 to 50 lb/in2 gauges and at temperatures between 70 and
1200F. The ratio of product to caustic can be varying up to 10:1. The spent caustic can be
regenerated either by steam stripping or air contacting. The regeneration condition
depends on the concentration of the impurities in the caustic solution. The caustic is not
100% regenerate able. There are a number of licensed caustic treating process that have
been adequately described else where [14]. Many of these processes employ promoter,
which are when added to the caustic either improve mercaptan removal or some other
useful service. Popular solubility promoters are methanol, cresols, crystals, phenols,
28
phenolate, and ferrocynides, which combines caustic treating with oxidation sweetening.
The caustic treating removes the H2S and most of the mercaptan while the oxidation-
sweetening step converts the mercaptan to less objectionable disulfides.
(2RSH +1/2O2 RSSR + H2O)
As the reaction equation indicates, oxidation sweetening does not remove the
sulfur content of the stream; it only converts the sulfur to a more acceptable form.
Disulfide however reduces the lead susceptibility of gasoline and for this reason
processes which remove the sulfur altogether are more popular than sweetening. But still
sweetening is useful process for certain applications. Some sweetening processes that
have enjoyed popularity are for the doctor, copper chloride, hypochlorite and lead sulfide
processes. Probably the most widely used sweetening process is inhibitor sweetening,
which employs phenylenediamine type compound. This method is popular because of its
low cost.
1.8.1.5. Adsorption method
Adsorption on molecular sieves is widely used to remove sulfur compound from
natural gas and from light hydrocarbon streams such as propane, butane, pentane and
even light gasoline. This process is effective for removing hydrogen sulfide, light
mercaptan, sulfide and disulfide. It simultaneously used for drying the hydrocarbon and
will also remove carbon dioxide from natural gas streams.
Molecular sieve are commonly used to selectively adsorb water and sulfur
compounds from light hydrocarbon streams such as LPG, propane, butane, pentane, light
olefin, and alkylation’s feed. Sulfur compounds that can be removed as H2S, sulfide,
29
disulfides, and mercaptan in the process [15]. The sour feed usually passes through a bed
of sieves at ambient temperature. The operating pressure must be high enough to keep
feed in the liquid phase. The operation is cyclic, in that the adsorption is stopped at the
predetermined time before sulfur break through occurs. Sulfur and water are removing
from the sieves by purging with fuel at 400 to 6000F. There are various types of
molecular sieves and the choice depend on the particular application types 4A, 5A and
13X sieves are alkali metals alumino-silicates which are quite similar to some natural
clays and feldspars [16]. All of these can adsorb sulfur and water, but 13X have
somewhat higher capacity. In addition 13X sieves have a larger critical diameter.
Molecular sieves process has gain an importance over the years and sieves are
now used for a variety of purposes in the petroleum and petrochemical industry [17-18].
Molecular sieves has an active sites, which has affinities towards sulfur containing
compounds that trapped them inside petroleum products.
1.9. Biodesulfurization (BDS)
This is a particular process that removes sulfur from crude oil and their distillation
fractions using a series of microorganisms. Refineries remove organic sulfur from crude
oil and its fractions by hydrodesulfurization (HDS) process. HDS is a catalytic process,
that convert organic sulfur to hydrogen sulfide gas by reacting crude oil fractions with
hydrogen at pressures between 150-3,000 lb/in2 and temperature between 290-455 oC,
depending upon the feed and level of desulfurization required. Organic sulfur compounds
in the lower fractions of petroleum, e.g. the gasoline range are mainly thiols, sulfides and
thiophenes, which are readily removed by HDS process. However, the middle distillate
fractions e.g. diesels and fuel oil range, contains significant amount of benzothiophens
30
(BTHs), dibenzothiophenes (DBTs) which are considerably more difficult to remove by
HDS process. Among the most refractory type compounds are the DBTs with substitution
adjacent to sulfur moiety compounds of this types are refer to as, sterically hindered
compounds because the substitution is believed to strictly hinder, access of the sulfur
atom to the catalyst surface [19]. Biodesulfurization has been studied as an alternative to
HDS process for the removal of sulfur from crude oils. This is a significant way towards
desulphurization of petroleum products, the high cost and inherent chemical limitations
associated with HDS (chemicals desulphurization) process make alternative to this
technology of interest to the petroleum industry [20-27].
1.9.1. Model systems for desulphurization
Poly aromatic sulfur hydrocarbons (PASH) are selected as suitable compounds for
biodesulfurization. They have been used for many years in the development of
conventional catalysts for hydrodesulphurization, because these compounds were very
hard to chemical desulphurization, because structural symmetry was not fit for
conventional desulphurization and bacteria can easily breakdown its C-S bond during
biodesulfurization [28-29].
1.9.2. Sulfur-specific PASHs metabolism
Biodesulfurization of PASHs via (4S) metabolism pathway was introduced by Iain
Campbell and Kee Rhee and it was tested on various bacterial strains by Kilbane in 1988
[30]. Sulfur moieties are insoluble in water so they are transfer in to the bacterial cell,
where they convert to hydrophilic sulfurous compounds and desulfursed with help of dsz
genes [31].
31
1.9.3. Conversion to the sulfone
in this stage two step oxidation of sulfur takes place inside a cell by desulphurization
gene (dszC) [32]. In this case enzyme monooxygenase flavin mononucleotide (FMN
oxidoreductase) catalyzes the reaction where an electron transfers from flavin
mononucleotide (FMN) to PASHs to reduce it and by self oxidized. Thus PASHs
converts to PASHsO, and PASHsO2 and FMN to FMNH and FMNH2 in two steps [33].
1.9.4. Cleavage of the first C-S linkage
This C-S bond cleavage is, mainly performed by dszA a gene which accelerates the
sulfone monooxygenase (FMNH2: PASHsO2 oxidoreductase activity which shifts another
electron from FMNH2 to PASHsO2) [34].
1.9.5. Liberation of inorganic sulfur
In this step specifically catalyzed by desulfinase (dszB) genes which converts sulfurous
moieties to sulfite where it reacts with hydrocarbon molecule at the last and produces oil
soluble hydroxy biphenyl (HBP). Bacteria takes sulfur from an oil source and is
incorporating into sulfur containing amino acid (cystene) and vitamins required for
growth.
1.9.6. The supply of reducing equivalents
Reduced nicotinamide adenosine dinucleotide (NADH): FMN oxidoreductase is
another enzyme which maintains the supply of reduced FMN in control equity [35].
1.9.7. Regulation of the activity in the cell
32
Bacteria strains are exposed to carbon rich and sulfur poor environment, which would
favor cells expressing biodesulfurization genes. If the cells are grow in a sulfured
environment its phenotype genes (dsz) possessing then stops presumably by repressing
enzyme synthesis at the level of transcription [36].
1.9.8. Developing the technology
Development of biodesulfurization has been the desire of the refiners because sulfone
like oxidized compound can be easily removed from the oil medium [37].
Monooxygenase enzyme of bacteria provide an activated oxygen on the surface of
biocatalyst particularly for desulphurization, which is much specific than chemical
desulphurization of crude oil. Biodesulfurization is very simple to manipulate chemical
desulphurization, where one bacteria cane be replace by another for to show better
performance [38].
1.9.9. Biodesulfurization processes
biodesulfurization can be applied on large industrial scale. In this technique the
bacteria is introduced into a simple stirred-tank reactor where the oil may also poured
into the same reactor in the presence of air and a little quantity of water. In this case the
hydrophobic sulfur compounds of the oil medium may converted into hydrophilic
sulfurous products and pushes it into an aqueous phase. From the reactor two streams of
water water-biocatalyst-sulfur-by product stream and the oil. The oil is subjected to
further refining and the oil-water-biocatalyst-sulfur-byproduct emulsion is rutun to the
reactor for reused [39].
33
EXPERIMENTAL
2.1. Collection of samples
Sample of the crude oil was collected from Attock oil refinery Morgah
Rawalpindi (Pakistan) in tin made gallons. This is situated in south east to the city of
Rawlpindi. It is one of the leading refineries in Pakistan, which provides refined oil to the
cities and remote areas parts of the northern parts of the country.
2.2. Distillation study of crude oil
Preliminary distillation study was performed adopting IP 24/84 standard method
using Stanhope-seta limited model 11860-distillation apparatus [40]. 100 ml sample was
taken in a distillation flask fitted with a thermometer (ranging up to 4000C temperature).
The sample was evaporated by heating through in built heating system of the apparatus.
The vaporized part of the crude was condensed in cooling tubes, and collected in a
measuring graduated cylinder. When the first drop of the condensate was recovered,
temperature (initial boiling point or dew point) was noted. The distillates obtained were
collected in a separate bottle for further study.
Three main distillation fractions were collected, which are given below.
1. Light fraction boiling point ranges from 700C – 2000C.
2. Middle fraction boiling point ranges from 2010C – 3000C.
3. Heavy fraction boiling point ranges from 3010C – 3600C.
All the distillation fractions were safely stored separately.
34
2.3. Chemical treatment
The distillation fractions were scrubbed with various chemicals for the purpose of
chemical desulphurization. The chemicals used are:
1. Hydrochloric acid (HCl) 1 M.
2. Sodium hydroxide (NaOH) 1%.
3. Sodium arsenate (Na2 HAsO4) 1%.
4. Ammonium vendate (NH4VO3) 1%.
Chemicals were put in the distillation flasks and 100 ml of each distillate was put
and redistilled. The condensates from such attempt were collected separately in receiving
flasks safely. The original as well as the distillates after chemical treatment were tested
for different parameters and sulphur moieties.
2.4. Biological desulphurization
This is another method viewed for removal of sulfur and their respective
compounds from the crude oil distillation fractions by inoculating / fermenting with two
selected microbial strains i.e. Ps.putida and T.Thioxidanes .
2.4.1. Collection of the microorganism (bacteria).
Two samples were collected from the coalmines of Pakistan
1. Much coals mine (Balochistan): This is situated 70 Km away from Quetta city
towards Sibi (Bolon pass).
2. Tharie coal mine (NWFP). This is 35 Km apart from Hango city towards Doaba.
35
Both of the samples were collected from the different spots of coalmines in
polyethylene bottles. Water samples were incubated for a period of 24 hr in an incubator
at 37oC. After incubation, the samples were tested with microscope for bacterial
existence.
2.4.2. Confirmatory study of bacteria
Bacterial presence was confirmed by preparing more than 100 slides. Firstly, the
slides were cleaned carefully, and then dried in an oven. Small spots were made from the
coal mine water sample right on the mid position of the slides. The spots were fixed with
the burner flame to stick the microorganism firmly. The slides were rinsed with colored
ink to make the spot clear, washed and then dried again. Then, the slides were studied
under microscope. Various types of microorganisms were seen under microscope and
finely from their structural and physiological study, two of bacteria Thiobacillus
thioxidans and pseudomonas putida capable of desulfurizing distillates were isolated by
physiological and their morphological identification. After conforming their existence,
their mobility was also checked by taking a small amount of coal mine water sample in
a cleaned Petri dish and added clear distilled water, it was found that they were freely
moving which conformed that bacteria were in living state.
2.4.3. Microorganism, media, and culture conditions
Strains of Thiobacilus thioxidans and pseudomonas putida were cultured
according to the procedure reported else where [41-42]. Each strain was grown in 1L
fermentor by using basic salts middle with glucose (2%) as the carbon source and sulfur
(2%) as an energy source. Once the cultured bacteria reached to an optical density at
36
600 nm (OD600), cells were harvested by centrifugation at 16,000 × g and stored at 25°C.
Culture densities were determined by diluting the suspension with distilled water and
measuring the optical densities (OD) in a Beckman DU 650 spectrophotometer with a 1-
cm-path-length cuvette. The cell content of the harvested paste ranged from 35-40%
solids (grams dry cell weight [DCW] per gram and wet cell weight [WCW]). DCW,
WCW, and percent solids were determined by placing a sample of paste on a tarred glass
fiber pad, weighing the pad (WCW), and then drying it to a constant weight (DCW) in a
CEM 9000 microwave oven with balance (CEM Corp.). A calibration curve was
generated for correlating OD to DCW.
2.4.4. Determination of desulphurization rate
The standard procedure for desulphurization experiments was to first suspend the
cell paste in 150 ml phosphate buffer, pH 5.5, with 2% glucose at a concentration of
16.7 g DCW liter 1. Next, 750 ml of the suspension was transferred to a 2-liter stirred
vessel (Applikon Inc.) equipped with temperature, agitation, pH control, and dissolved
oxygen (DO) monitoring system and then allowed to mix for about 60 min at 37°C. Air
flow was set to 400 ml min 1 to maintain DO levels above 40% of air saturation. The pH
was controlled through the automatic addition of 10% NaOH in water, as needed. To
initiate desulfurization, 25 ml of oil sample of known sulfur concentration was added and
the contents except sulfur were mixed at 1,000 rpm [43-44].
Microbial activity was monitored by measuring sulfur concentration of the known
solutions. This is measured by taking the samples with a syringe and were analyzed for
sulfur compounds by adopting different IP standard techniques, and compared the data
37
obtained from the virgin and bacterially treated samples. Some of the sulfur contents
were removed from the bacterial treated samples, which caused desulphurization of the
crude oil sample.
2.5. Physicochemical properties
2.5.1. Specific gravity
Specific gravity was determined according to IP 160/87-method [45] using
Stanhope-seta-limited hydrometer. A 100 mL aliquot of sample was taken in a glass
cylinder. A thermometer was immersed in the sample for recording the temperature.
Hydrometer was then allowed to float in the oil sample and the reading of hydrometer
was noted from the graduated vertical stem. Specific gravity at 60/60 0F was then found
out using ASTM / IP petroleum measurement tables (IP 1250/84). API gravity was
calculated using the given formula.
API gravity = 141.5 -131.5
Sp.gr.60/60 0F
2.5.2. Viscosity
Kinematic viscosity of crude oil was determined by Stanhope-seta kinematics
viscometer adopting IP 71/ 87 method [46].
Very small amount of the sample (0.3 ml) was introduced in to the glass
viscometer using a micro syringe. Temperature of bath was maintained at 100 0F. The
sample was allowed to flow between the two marks encircled on the glass viscometer and
the time of flow was determined with the help of timer built in the instrument. Calibration
38
constants were read out from the viscometer, which has a specific constant value for
every viscometer. Kinematic viscosity was calculated by the formula:
Kinematic viscosity = C x t.
Where C is the calibration constants and t is the time of meniscus flow between the two
marks.
2.5.3. Aniline point
Aniline point of the crude oil sample was determined by Stanhope-seta limited
aniline point apparatus adopting IP 2/78 standard method. [47].
The apparatus was thoroughly cleaned and dried in an oven. 10 mL portion of
crude oil distillation fractions sample and 10 mL portion of aniline were taken in the test
tube with a pipette. An agitator and a thermometer were fitted inside the tube with the
help of cork. The test tube was placed in the outer jacket tube containing paraffin oil.
Aniline was not miscible with sample at room temperate. The outer jacket tube was
heated using a burner at a rate of 10C per minute temperature rise until the sample
becomes completely miscible with aniline. The temperature was thus recorded as aniline
point of the sample.
2.5.4. Pour point
Pour point was determined using Stanhope-seta limited pour point apparatus
adopting IP 15/67 standard method [48]. The sample of crude oil was placed in the glass
jar having flat bottom up to the level mark on the tube. The jar was tightly closed with a
cork fixing a thermometer with temperature measuring range of –36 to 120 0F. The jar
39
was placed in the jacket, which was turned immersed in freezing mixture (ice +NaCl
mixture). The jar was periodically brought and checked until the oil did not show any
movement when the jars were horizontally tilted for 5 seconds. This temperature was
recorded. To this temperature 30C were added and were expressed as pour point of the
sample.
2.5.5. Cloud point
For cloud point determination, the same pour point apparatus was used. The
procedure adopted for cloud point determination was the same as for pour point. The
temperature at which the haziness observed in the side of the jar was reported as cloud
point of the sample.
2.5.6. Flash point
Flash point was determined using Pensky-Martins closed cup flash point tester
adopting IP 34/87 standard method [49]. Before performing the test, all parts of the tester
were thoroughly cleaned with petroleum spirit and dried. The sample cup was then filled
with the sample up to the mark. Heat was supplied at the rate of 60C / minute temperature
rise.
The test flame was applied after each 1 0C rise in the temperature until distinct
flame was observed inside the cup. The temperature was recorded as flash point.
2.5.7. Ash content
Ash content of crude oil distillation fractions sample was determined adopting 1P
4/81 standard method [50]. A porcelain evaporating dish of 120 ml capacity was washed,
cleaned and dried at 800 0C for 10 minute. Crucible was cooled to room temperature in
40
the desiccator and weighted. China dish was heated and cooled several time until constant
weight was attained.
Crude oil sample was taken in the China dish and was re-weighted. Weighing was
performed with the help of sortorius balance. The dish was heated and the sample was
ignited with the flame. Temperature was maintained in such a way that sample burnt with
a uniform and moderate rate leaving behind only ash and carbon residues.
The residue was heated in the muffle furnace at 800 0C until all the carbonaceous
material disappeared. The dish was cooled in the desiccator to room temperature and
weighted. The dish was reheated upto 800 0C for 30 minute, cooled and weighed. Heating
was repeated until constant weighing was attained.
Ash was calculated as a percentage of the original sample, as follows.
Ash percent = w/W 100
w = weight of ash in grams.
W = weight of sample in grams.
2.5.8. Conradson carbon residue
Carbon residue was determined adopting IP 13/82 standard method [51].
A known amount of sample was taken in a silica crucible. This crucible was
placed in the center of the Skidmore crucible. The Skidmore crucible was then placed in
the center of iron crucible. A little sand was placed beneath the Skidmore crucible. Both
the crucible was covered loosely.
The crucible was placed on the nichrome wire triangle. The sheet iron hood was
then placed on the crucibles. The sample was heated strongly. When smoke appeared
above the chimney, the burner was tilted strongly for vapors to catch fire. When all the
41
vapors burnt and caused the smoke disappeared, the burner was removed and the
apparatus was allowed to cool. The Skidmore crucible was cooled in a desiccator and
weighed. Carbon residue was calculated as percentage of that of the original sample.
Carbon residue, percent = w / W x 100
w = weight of carbon residue in grams.
W = weight of sample in grams.
2.6: Determination of Various sulphur analogues
2.6.1. Sulfur (reactive to copper) ASTM IP [242/83]
Apparatus.
1. Oil bat-capable of being controlled at the required temperature + 10C .
2. Test tubes- 150 mm x 12.5-mm aprox.
3. Filter paper- watman No. 42.
4. Glass stirring rods.
5. Conical flasks-500 ml.
6. Distillation apparatus-consisting of a 1-liter, long neck digestion flask fitted with
a nitrogen inlet, 250ml- dropping funnel and still – head.fitted to the still-head is a
leibig water condenser (overall length approx. 490 mm) and a 250 ml receiver
with a gas out let. Three 250-ml dreschel bottles are connected in series to the gas
out let.
7. Digestion flask-1-liter round bottom long necked flask. Necked length 145 mm
overall length 310 mm; B24 socket.
42
8. Multiple adopter-3 necks –2 parallel with B19 socket 1 angled at 450 with B 19
socket; B 24 cone.
9. Dropping funnel- 250-ml capacity with B 19 socket and cone.
10. Splash head –B19cones.
11. Liebig condenser – over all length 490 mm; B 19 socket; B 24 cone.
12. Conical flasks-250 ml; height 140 mm B 24 sockets.
13. Three dreschel bottles- 250 ml; sockets.
14. Three dreschel bottles heads –B 24 cones and sintered ends.
15. 2 Cone Screw-thread Adopters – B 19 cones to accept 6 to 7 mm glasses tubing
through Screw cap.
Materials.
1. Copper-bronze powder –96-99% coppers and free from sulfur.
2. Toluene- sulfur free and conforming to the current IP specification.
3. Acetone.
4. Zinc acetate solution-approx. 0.01M.
5. Antimony trichloride solution (20 g SbCl3/liter) –prepared by dissolving 2g SbCl3 in
50 ml conc. hydrochloric acid and adding 50 ml distilled water.
6. Stannous chloride-solid.
7. Hydrobromic acid-48%.
43
8. Ethylene Diamine Tetra-acetic Acid EDTA (Disodium salt) solution 0.01 M
accurately standardized.
9. Erichorme Black T Indicator – prepared by dissolving 0.2 g of Erichorme Black Tin
15 ml of tri-ethanolamine and 5 ml ethanol.
11. Buffer solution (pH=11)-prepared by dissolving 17.5 g ammonium chloride in 142 ml
0.88 % ammonia and making up to 250 ml with distilled water.
12. Nitrogen-cylinder.
Procedure:
0.5 g of the oil and 1.0 g of the copper bronze powder was weighed in to the test
tube and stirred well with a glass rod immersed the test tube in to a depth of at least 75-
mm in the oil bath maintained at the correct temperature. After two hours, the test tube
was removed and cooled to room temperature.
Using toluene, the copper bronze powder and oil mixture was transferred to a
Wattman No.42 filter paper. The test tube and glass rod were thoroughly washed with
toluene to remove all the copper bronze powder and the washings were added to the filter
paper. The filter paper was washed with toluene and acetone until the washing freed from
oil.
The filter paper and copper bronze powder were transferred to the digestion flask
of the distillation apparatus and 125 ml distilled water was added. 50 ml of the 0.01M
zinc acetate solution was put in to the first dreschel bottle and 25 ml into each of the other
two. To the distillation apparatus, 75 ml Hydrobromic acid (HBr) (48%) was added. A
crystal of stannous (SnCl2) chloride was dissolved in this acid and then 2 ml of antimony
trichloride (SbCl3) was added. The nitrogen supply connection was made through side
44
arm to the distillation apparatus. The solution from the separating funnel was run in to the
distillation flask and the nitrogen gas through an apparatus at approximately 5 ml per min
was purged. The flask and contents were heated to boiling and the boiling was continued
for approximately 30 min.
Dreschel bottles were disconnected and combine the contents in a 500 ml conical
flask. Each dreschel bottle was washed with three 10 ml portion of distilled water and
added the washing to the conical flask. A known amount of the standard 0.01M EDTA
solution (in excess of 100 ml) was added followed by 2 ml of buffer solution and 2 – 3
drops of indicator solution. The solution was then titrated against the 0.01M zinc acetate
solution. The end point was being indicated by the change in color from blue to wine
red.
Blank titration was carried out as above using the same volume of 0.01M zinc acetate
solution as charged in to the drushel bottles [52].
Calculation:
Each of the determinations of the percentage of sulfur reactive to copper was Calculate in
the sample as fallow.
Reactive sulfur, % mass = 32 M x (A-B)
10 (100 + B) W
Where
A = volume of 0.01 M zinc acetate solution used for the titration of the sample, ml
B = volume of 0.01 M zinc acetate solution used for the titration of blank
M = Morality of EDTA solution;
W = weight of the oil sample taken, g;
X =volume of standard EDTA solution added, ml
45
2.6.1. DETERMINATION OF TOTAL SULFUR BY FLASK COMBUSTION
METHOD (ASTM D 1226 -IP 107)
Apparatus:
1. Combustion flask: made of borosilicate glass of 500 –1000 ml capacity and
provided with a conical B24 ground glass stopper with a fused-in platinum wire.
The platinum carries U-shaped platinum gauze of a platinum gauze basket.
2. Safety shield- of suitable design to protect the operator wile carrying out
manipulation operation during the combustion stage.
3. Teflon sleeves – to fit B24 joint.
4. Syringe: - 0.05-ml capacity with 0.01-ml divisions.
5. Lighter – any, suitable of small flame fed with sulfur free fuel. The standard wick-
fed burner and flask specified in ASTM D 1226 -IP 107 and filled with alcohol, is
suitable.
6. Microburette assembly –10-ml burette with 0.02 ml or finer graduation and
supply bottle of borosilicate glass. A piston type burette is recommended
7. Photoelectric colorimeter -equipped with a 520 mm interference filter or an
equivalent means of isolating a spectral bands at this wavelength, a stirrer and an
aperture for the titration assembly. This is required only for sulfur contents of less
than 0.4 % wt.
8. Daylight blue lamp- 100 watts.
9. Magnetic stirrer –optional.
46
Reagent and materials:
1. Purity of reagents; Analytical grade chemical shall be used in all tests unless
otherwise indicated. It is intended that all should conform to established or
recognized specifications for analytical reagent grade chemicals, where such
specifications are available. Other may be used, provided it is first ascertained
that the reagent is of sufficiently high purity to permit its use with the accuracy of
determinations.
2. Purity of water- unless otherwise indicated, reference to water shall be understood
to mean distilled water or water of equal purity.
3. Filter paper – Ash free filter paper (e.g. Watman No 40). Strips were prepared of
the specific size and shape. Then the strip was folded along the dotted line to an
M–shaped and stored an open bottle in the vicinity of balance.
4. Absorbent pellets- from cellulose these wadding were prepared B.P.C standard as
follows. Wet a piece of cellulose was washed thoroughly with water and squeezed
out. Repeat it for four times. Then the piece of the wet wadding was taken and
rolled into spherical shape of about 100-mg mass and 100 mm diameter. Dry in an
oven at 1200C for two hours and stored in open bottle in the vicinity of balance.
Alternatively filter paper pulp was used to prepare the pellet.
5. Oxygen- free of sulfur compounds and extraneous matter.
6. Hydrogen peroxide – 1.5 % w/v solution was dilute to 30 % w/v hydrogen
peroxide with distilled water shortly before use.
47
7. Thorine indicator solution- 0.2 % wt aqueous solution of thorin (disodium 4-(2)
arsonophenylazo)-3- hydroxynaphthalene –2, 7-disuphonate). Protect from light
and labeled.
3. Sulfuric acid solution – 0.05 N and 0.01 N
4. Perchloric acid –10 % W.
5. Barium perchlorate solution –0.005 N and 0.01 N. Dissolved 0.975 and 1.95 g
respectively perchlorate trihydrate in 200 ml of distilled water and make up to 1
liter with isopropanol. Adjust the apparent pH of the solution to ¾ with a few
drops of 10 % perchloric acid.
Procedure:
An absorbent pellet in a filter strip was wrapped and clamped it in to the platinum basket
with fused protruding. A syringe was filled with sample and weight into the nearest 0.1
mg. About 30 mg of the sample was injected into and reweigh the syringe. Care was
taken to keep the fuse dries. Ignite with out delay
To the flask 4+ 0.5 ml of the 1.5 w/v hydrogen peroxide solutions was added. Teflon
sleeve in the cone of the flask was taken. Air was replaced in the flask by passing a rapid
stream of oxygen through the flask for 30 second. The oxygen was introduced near the
bottom of the flask but not in the absorption liquid.
The flask was holded in one hand behind the safety screen. filter paper fuse was ignited
with a sulfur free flame and immediately put the stopper in to flask, holded it firmly in
place. Rapidly but carefully the flask was inverted and holded it in an inclined position. It
was ensured that flame does not touch the walls of the flask and that the absorption liquid
48
forms seals at the neck of the flask. Avoided tilting the flask at too great an angle
otherwise the sample may fall out of the holder.
After the complete combustion, the flask was shaken for about 1-min. and allowed to
stand for 10 min. Weted between the combustion flask and the stopper with isopropanol
and open the flask allowing the liquid to be drown in. the stopper was washed, neck of
the flask, and the platinum gauze with isopropanol using a total of 16 ml isopropanol
placed the stopper to one side.
Tree drops of thorine indicator solution was added and titrate with standard 0.01N
barium perchlorate solution to the first permanent color changed form yellow to pink.
After complete titration washed the flask thoroughly with water. For blank titration the
same reagents were used but omitting the sample [53]
Calculations:
Calculate the sulfur content of the sample by means of following equation.
Sulfur, % wt = (V – v) x N x 1603
W
Where
V = volume of barium perchlorate solution used for sample titration;
v = volume of barium perchlorate solution used for blank titration;
N = normality of barium perchlorate solution;
W = weight of the sample in milligrams
49
2.6.2. DETERMINATION OF TOTAL SULFUR BY BOMB COMBUSTION
METHOD (IP 61/84).
Total Sulfur was found adopting IP 61/84 standard method [54]. A known weight
of the sample was taken in the clean sample cup 500 mL of the aqueous solution of
sodium carbonate, which was taken in the bomb. The later was rotated in such a manner
that its interior got moistens by the solution, the ignition and cotton wires were set
accordingly. Lid of the bomb was tightly screwed and charged with an oxygen gas of 30
bars. The sample was then fired. Ten minutes after the fired bomb was taken out, dried
and the pressure was released slowly. The interior of the oil cup and the inner of the
bomb cover were rinsed with a fine jet of distilled water and the washing was collected in
100 mL beaker. Based of the terminal was also washed in to the beaker. Ten mL of the
bromine water was added to the contents of the beaker. The sample cup was placed in a
500 mL beaker 5 mL of the standard bromine water, 2 mL of concentrated HCl and
enough distilled water were added to the cup. The contents of the beaker were heated just
below the boiling point fore 3 minutes. The contents were added to the bomb washings.
The combine washing was evaporated to 20 mL on hot plate. Upon boiling 10 mL
portion of BaCl2 solution was added drop wise . The solution was stirred for 2 minutes
and was then covered with a fluted watch glass. The boiling was continued till the
volume was reduced to 75 mL. The beaker was removed and cooled for 1 hour. Then
contents of the beaker were filtered through watman ash less filter paper. The precipitates
were washed with water until it was free from any chloride. The filter paper along with
the precipitate was then transfered to the pre- weighed crucible and was dried at low heat.
The paper was then charred and finally ignited in bright red heat until white residue was
50
obtained. The crucible was cooled and re weighed. Weight of the precipitate BaSO4 was
calculated by subtracting the weight of empty crucible from the final weight.
Sulfur contents of the oil was calculated as
S % (by weight) = P x 12.73 W
P = grams of BaSO4
W = grams of sample
2.5.3. DETERMINATION OF ELEMENTAL SULFUR
SPECTROPHOTOMETRICALLY.
Apparatus
UV-160A, UV-VIS, RECORDING SPECTROPHOTOMETER (P/N204-04550)
equipped with the photo multiplier attachment, and one pair of fused quarts.
Reagents and solutions;
1. Acetone solvent. Fifty milliliter of water were diluted to 1 liter with technical
grade acetone
2. Sodium cyanide solution. This solution was prepared by dissolving 0.1 g of
sodium cyanide in 100 ml of acetone solvent. When first prepared, the solution
was cloudy but become clear upon standing for few ours.
51
3. Ferric chloride solution. This solution was prepared by dissolving 0.4 gram of
ferric chloride of hexahydrated in 100 ml of acetone solvent. Hydrolytic
precipitation of part of the iron occurred, shortly after preparation. After the
precipitate was settled for 24 hours the supernatant liquid was decanted into a dry
bottle. The resulting solution was fond to be stable for several weeks.
4. Standard sulfur solution. A standard solution containing 50ppm sulfur on a
weight per volume basis was prepared by dissolving 50 mg of powdered roll
sulfur in exactly of 1 liter of petroleum ether. The solvent had a boiling point
range of 770C to 1100C and a density of 0.73 at 250C.
Procedure:
5 ml sample of the solution in a 25 ml was placed in a volumetric flask. If the
sample containing more than 50 ppm elemental sulfur, a suitable dilution was made with
petroleum ether to gave a sample, which contains sulfur between 5 and 50 ppm. Add 15
ml of sodium cyanide solution mixed and allowed to stand for about 2 minutes. To the
mark solution was made with acetone solvent and withdraw a 5-ml aliquot. Exactly 5 ml
of the ferric chloride solution was added to the aliquot and mix. Absorbance was
determined at 329 nm against a blank which has been prepared by mixing 5 ml of the
acetone solvent with 5 ml of the ferric chloride solution, made the absorption reading
within 10 min after preparing the solution or stored the solution in darkness, if the optical
measurements are to be made at a latter time. A blank correction was made in case of
color sample by carrying a 5 ml aliquot through the procedure with exception that no
cyanide should be added. Concentration of elemental sulfur was determine the from the
calibration curve, which was prepared by treatment of a series of standard sulfur solution
in petroleum ether in the same way [55].
52
2.6.4 DETERMINATION OF TOTAL SULFIDES BY POTENTIOMETRIC
METHOD.
Reagents:
1. Potassium iodate (0.1N KIO3).
2. Glacial acetic acid ( CH3COOH)
3. Hydrochloric acid (HCl 1N).
4. Benzene ( C6H6)
Procedure:
The total sulfides content in the distillates were determined by titration with 0.1 N
potassium iodate solution (KIO3). The sample was dissolved in a solution of glacial acetic
zacid +50 ml benzene + 5ml HCl (N). Which was then potentiomatrically titrated against
0.1N KIO3 solution in 80 percent glacial acetic acid, employing a platinum electrode as
indicating electrode and calomel electrode as reference electrode. It was found that 90%
glacial acetic acid was recommended in the original method which does not dissolved the
salt completely but by changing the concentration of the glacial acetic acid to 80 %
strength of the solution, it was found that it completely dissolved the salts and there fore
used in the present work. The potential drop and corresponding equivalent point of the
sulfide oxidation by the reaction was observed at a potential of about 0.7v. -14) [56]
53
2.6.5. DETERMINATION OF ALIPHATIC SULFIDES BY
SPECTROPHOTOMETRIC METHOD
Apparatus:
UV-160A, UV-VIS, RECORDING SPECTROPHOTOMETER (P/N204-04550)
equipped with the photo multiplier attachment, and one pair of fused quarts, volumetric
flask, and pipette
Reagents and Chemicals:
Carbon tetrachloride,
Iodine-analytical grade,
Iodine reagent solution: Prepared by dissolving exactly 10grams of iodine in carbon
tetrachloride and diluting to1 liter.
Procedure:
Weighed sample was dissolved in carbon tetrachloride and diluted to the proper
volume, dilution of this solution was be prepared in order to produce absorption of the
sample iodine blend falling in the range of optimum accuracy. For very small samples
such as chromatographic fractions micro or semi-micro balance was used to weigh the
required quantity of the samples for dilution to 25 mL in order to conserve material.
1mL iodine reagent was diluted to 10mL with the above sample solution at the
proper concentration.
1 mL of carbon tetrachloride was also diluted to 10 mL with same sample
solution and uses this solution as the reference solution for the spectrophotometer
measurements.
54
Immediately after preparing the sample-iodine blend and the reference solution,
obtained the absorbance of the blend at 310 nm. The measurement was made as soon as
the solutions have been placed in the cell compartment. As the absorbance has been
noticed to increase slowly, in case of the crude oils, if the iodine-blend was allowed to
stand. For blank value the iodine reagent was obtained as fallow: One milliliter of the
iodine reagent was diluted to 10 mL with carbon tetrachloride and the absorbance of this
solution was measured at 310nm using carbon tetrachloride as reference solution. All the
samples were quantitatively determined by UV-160A, UV-VIS Recording
Spectrophotometer (P/N204-04550) automatically [57].
2.6.6 DETERMINATION OF MERCAPTAN SULFUR BY POTENTIOMETRIC
METHOD.
Reagents and materials
1. Cadmium sulfate (CdSO4.8 H2O)
2. Potassium iodide (KI).
3.Silver nitrate alcoholic solution (AgNO3 )
3. Distilled water ( H2O )
4. Oil Sample.
Procedure:
Sample was quantitatively tested for hydrogen sulfide (H2S) by shaking 5 mL of
the sample with 5 mL of the acid cadmium sulfate solution. The sample was analyzed
55
because no precipitate appeared. If the yellow precipitates were appeared then H2S were
have to be removed. Measured with a safety pipette or weighed 20-50 mL of the original
or treated sample in to a 300 mL titration flask containing 100 mL of appropriate titration
solvent. The beaker was Immediately placed on titration stand and adjusted its position
so that the electrode was about half immersed. The burette was filled with 0.01 N
alcoholic AgNO3, solution and placed the burette in position in the titration assembly so
that the tip extent approximately 25 mm below the surface of the liquid in the beaker. The
speed of the stirrer was adjusted to give vigorous stirring with out separating. Recorded
the initial burette and cell potential readings. A small portions of 0.01N AgNO3 solution
and was added, after waiting until a constant potential has been established, recorded the
burette and meter reading. Consider the potential constant if it changes less than 6
mV/min. When the potential change was small for each increase of AgNO3 solution,
added volume as large as 0.5 ml. When the change of potential became near the end point
of the titration, then 0.05 ml was added increase of 0.01 N AgNO3 solution near the end
point of the titration, 5, 10 min were elapsed before a constant potential is obtained.
Although it is important to wait for equilibrium conditions, it is also important that the
duration of titration be as shot as possible in order to avoid oxidation of the sulfur
compounds by atmospheric oxygen. Once the titration started, it must never be
interrupted and resumed later. Continue the titration until the meter reading has passed
+350 mV and the cell potential per 0.1 ml of 0.01 N AgNO3 solutions has become
relatively constant. This was considered as the end point [58].
56
Calculations.
Mercaptan sulfur, wt = (AN x 3.206)/ W.
Where
A = milliners of AgNO3 solution required to reach the end point.
N = normality of the AgNO3 solution;
W = gram of the sample used;
= 100 x meq weight S in mercaptan.
2.6.7. DETERMINATION OF HYDROGEN SULFIDE BY VOLUMETRIC
METHOD
Reagents
1. Cadmium sulfate (CdSO4. 8H2O)
2. Sodium thio sulfate ( Na2SO3. 5H2O )
3. Iodine solution 0.1 N
4. Starch solution
5. Hydrochloric acid (HCl 18 %)
6. Nitrogen gas
Procedure:
A suitable quantity of the sample was added in the separating funnel containing
35 ml of the cadmium sulfate solution and shaken vigorously for 5 minutes. Content of
the separating funnel was filtered. Precipitates were washed and transfered it and any
57
portion of filter paper to which precipitate has been adhered to a 250 ml titration flask
containing 25 ml 0.1N iodine solution. 10 ml of hydrochloric acid solution (18%) was
added and titrate the excess iodine with 0.1N sodium thio sulfate solution using starch as
indicator. A blank test was also made by titrating a further 25 ml portion of the iodine
solution in a flask containing 10 ml of hydrochloric acid solution [59].
Calculation:
Hydrogen sulfide, % = N (a-b) x 0.01 W
Where
a = volume of the sodium thio sulfate taken for the blank titration in ml;
b = volume of the sodium thio sulfate taken for the titration of the excess iodine in ml;
N = normality of the sodium thio sulfate solution;
W = weight of the sample in gram.
2.6.8. DETERMINATION OF DIBENZOTHIOPHENE
SPECTROPHOTOMETRICALLY.
10 ml of oil was filtered through a 0.22-µm-pore-size Millex-GP filter (Millipore,
Bedford, Mass.) to remove any residual cellular particles. Quality assurance
samples of the known concentrated solutions of dibenzothiophene (DBT) were
run before the first and after the last testing sample for calibration of the GC-MS.
For quantitative determinations of DBT an HP 5890 II plus GC with a 5972 mass
spectrometer (MS) (Hewlett-Packard) operated in selective ions monitoring (SIM)
mode was applied. A 1-µl filtered oil sample was injected onto a 0.25-mm-
58
interior-diameter; 30-m column with a 0.5-µm film RTX-1 column (Restek)
operated at 50.7-cm s1 linear velocity of helium carrier gas. The injector and
detector temperatures were set to 90 and 220°C, for light fraction (2000C) then
195 and 305°C for middle fraction (300°C) whereas 295°C and 370°C for heavy
fraction (360°C) respectively [60].
2.5.9. DETERMINATION OF BENZOTHIOPHENE
SPECTROPHOTOMETRICALLY.
Procedure.
10 ml of the testing oil was filtered through a 0.22-µm-pore-size Millex-GP filter
(Millipore, Bedford and Mass) to remove any residual cellular particles. For
quantification of benzopthiophene (BTH) an HP 5890 II plus GC with a 5972 mass
spectrometer (MS) (Hewlett-Packard) operated in selective ion monitoring (SIM) mode
was applied. A 1-µl filtered oil sample was injected onto a 0.25-mm-interior-diameter;
30-m column with a 0.5-µm film RTX-1 column (Restek) operated at 50.7-cm s 1 linear
velocity of helium carrier gas. The injector and detector temperatures were set to 90 and
220°C, for light fraction (2000C) then 195 and 305°C for middle fraction (300C°)
whereas 295°C and 370°C for heavy fraction (360°C) respectively [60].
GC-MS was calibrated with a standard benzopthiophene (BTH) solution of
known concentration and noted the results obtained, and then the treated and
untreated crude oil distillates were run through GC-MS, and determined
benzothiophene concentration in the understudy distillates in a similar way.
59
RESULTS AND DISCUSSIONS
Quality of the crude oil and its distillate fractions depends upon their chemical
nature, heteroatom contents and physico chemical properties. As, heteroatom contents of
these products are of serious environmental concern due to their endless consequences on
the environment. Hence, in this study, crude oil distillates (light, middle and heavy
fractions) were studied for chemical and biological removal of sulphur moieties in order
to mitigate the environmental pollution associated with their utilization as traffic fuels
and to comply with the environmental codes and regulations to ensure clean and clear
environment. Sulphur and its different moieties (analogues) in the original and variously
chemically and microbially desulphurized samples were determined using different
analytical protocols. For chemical desulphurization, hydrochloric acid (HCl), sodium
hydroxide (NaOH), sodium arsenate (Na2HAsO4) and ammonium vendate (NH4VO3)
were used in order to evaluate the capability of each leachant for removal of the
aforementioned sulphur moieties. Two bacterial strains i,e Ps.Putida and T.Thioxidans
were cultivated with the distillates and their capability for removal of sulphur moieties as
a function of inoculation time was measured. The inoculation was performed for time
duration of 12 hr, 24 hr, 48 hr, one week and one month. The reduction (%) was
calculated in each residual sample and reported. The physico-chemical properties of the
original and the residual samples from chemical and biological desulphurization attempts
were determined using standard ASTM methods with the objective to investigate any
changes in such properties upon two different desulphurization approaches. The data
obtained is reported in Tables-1(a) to Table-1(d) and discussed in the proceeding
sections.
60
3.1. Physicochemical properties
3.1.1 Chemically treated crude oil and its distillate fractions
The physicochemical properties determined in case of original crude oil sample
were: specific gravity; 0.873, API gravity; 24.7, kinematic viscosity; 10.35 cst, aniline
point ; 143.7 oF, cloud point; 28.00 oF , pour point ; 21.8 oF , flash point; 183.3 oF, ash
content; 0.056 %, Conrad son value ; 2.49 % and carbon residue ; 2.80 % as provided in
Table-1(a).
The physicochemical properties of the original light fraction (b:pt 25-100 0C),
middle fraction (b:pt 100-200 0C ) and heavy fraction (b:pt 200-300 0C ) were also
determined. The values are provided in Table-1 (a).These were: specific gravity;0.713,
API gravity;15.3, kinematic viscosity;8.2cst, aniline point ; 109.3 oF, cloud point;11.3oF
, pour point ; 12.8 oF , flash point;140.5oF, ash content;0.0031%, Conrad son value ; 0.87
and carbon residue ;0.64% . The physicochemical properties determined in case of
middle oil were: specific gravity;0.745, API gravity;18.4, kinematic viscosity;9.3cst,
aniline point ;119.4oF, cloud point; 19.4oF , pour point ;18.3 oF , flash point; 159.6oF,
ash content; 0.008 %, Conrad son value ;0.87% and carbon residue ; 0.98% and those
determined in case of heavy fraction were: specific gravity; 0.798, API gravity; 21.3,
kinematic viscosity; 10.10 cst, aniline point ; 135.0 oF, cloud point; 26.3 oF , pour
point ; 20.8 oF , flash point; 173.5 oF, ash content; 0.029 %, Conrad son value ; 1.84%
and carbon residue ; 1.87%.
It is observed that physicochemical properties of the light fraction are quit varied
from middle and heavy fractions. This is because of the complexity of hydrocarbons
constituting each fraction. It is also observed from the data that all the properties of
61
distillate fractions are lying below the values of original crude oil. It means that crude oil
is more complex and contains long and complex molecular chain hydrocarbons,
compared to the distillate fractions which contain low molecular weight and simple
hydrocarbons.
The distillate fractions were chemically scrubbed with four chemical reagents
separately i,e hydrochloric acid (HCl), sodium hydroxide (NaOH), sodium arsenate
(Na2HAsO4) and ammonium vendate (NH4VO3) .The physico chemical characteristics of
the fractions after chemical desulphurization were determined. The data has been
assembled in Table-1 (b).
From the comparative study, it is concluded that the chemical treatments have
caused a significant alteration in all the physicochemical properties. It can be suggested
that such treatments may break some bonds of the sulfur complex compounds and hence,
caused an alteration in physicochemical properties compared to the original crude oil.
3.1.2 Biologically treated crude oil and its distillate fractions
3.1.2.1 Removal with P .putida and T.Thiooxidane
Desulphurization of crude oil and its distillate fractions was performed using
strains of P.putida and T.Thiooxidans, separately keeping in view their intrinsic
capabilities to degrade sulfur through oxidative pathway. Physicochemical properties of
the crude and its distillate fractions after biological desulphurization were studied. The
data obtained in case of P.putida is given in Table-1(c) and in case of T.Thiooxidanes in
Table- 1(d).
The physicochemical properties determined in case of original crude oil sample
were: specific gravity; 0.873, API gravity; 24.7, kinematic viscosity; 10.35 cst, aniline
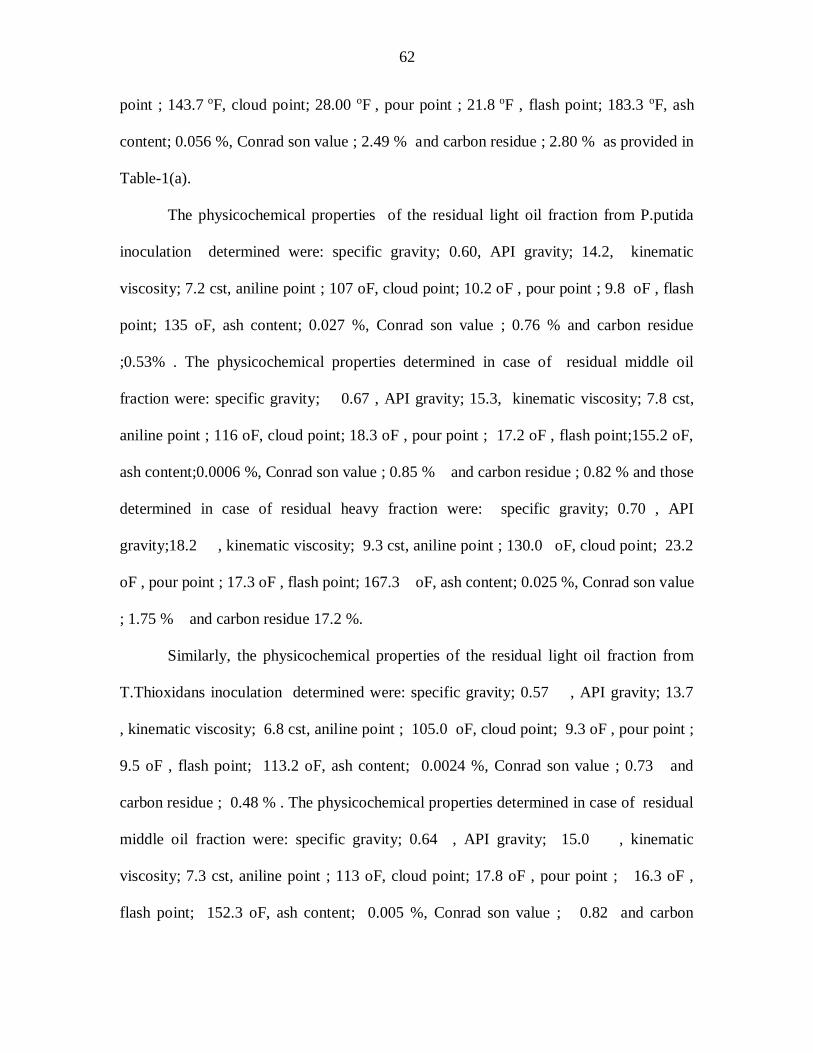
62
point ; 143.7 oF, cloud point; 28.00 oF , pour point ; 21.8 oF , flash point; 183.3 oF, ash
content; 0.056 %, Conrad son value ; 2.49 % and carbon residue ; 2.80 % as provided in
Table-1(a).
The physicochemical properties of the residual light oil fraction from P.putida
inoculation determined were: specific gravity; 0.60, API gravity; 14.2, kinematic
viscosity; 7.2 cst, aniline point ; 107 oF, cloud point; 10.2 oF , pour point ; 9.8 oF , flash
point; 135 oF, ash content; 0.027 %, Conrad son value ; 0.76 % and carbon residue
;0.53% . The physicochemical properties determined in case of residual middle oil
fraction were: specific gravity; 0.67 , API gravity; 15.3, kinematic viscosity; 7.8 cst,
aniline point ; 116 oF, cloud point; 18.3 oF , pour point ; 17.2 oF , flash point;155.2 oF,
ash content;0.0006 %, Conrad son value ; 0.85 % and carbon residue ; 0.82 % and those
determined in case of residual heavy fraction were: specific gravity; 0.70 , API
gravity;18.2 , kinematic viscosity; 9.3 cst, aniline point ; 130.0 oF, cloud point; 23.2
oF , pour point ; 17.3 oF , flash point; 167.3 oF, ash content; 0.025 %, Conrad son value
; 1.75 % and carbon residue 17.2 %.
Similarly, the physicochemical properties of the residual light oil fraction from
T.Thioxidans inoculation determined were: specific gravity; 0.57 , API gravity; 13.7
, kinematic viscosity; 6.8 cst, aniline point ; 105.0 oF, cloud point; 9.3 oF , pour point ;
9.5 oF , flash point; 113.2 oF, ash content; 0.0024 %, Conrad son value ; 0.73 and
carbon residue ; 0.48 % . The physicochemical properties determined in case of residual
middle oil fraction were: specific gravity; 0.64 , API gravity; 15.0 , kinematic
viscosity; 7.3 cst, aniline point ; 113 oF, cloud point; 17.8 oF , pour point ; 16.3 oF ,
flash point; 152.3 oF, ash content; 0.005 %, Conrad son value ; 0.82 and carbon
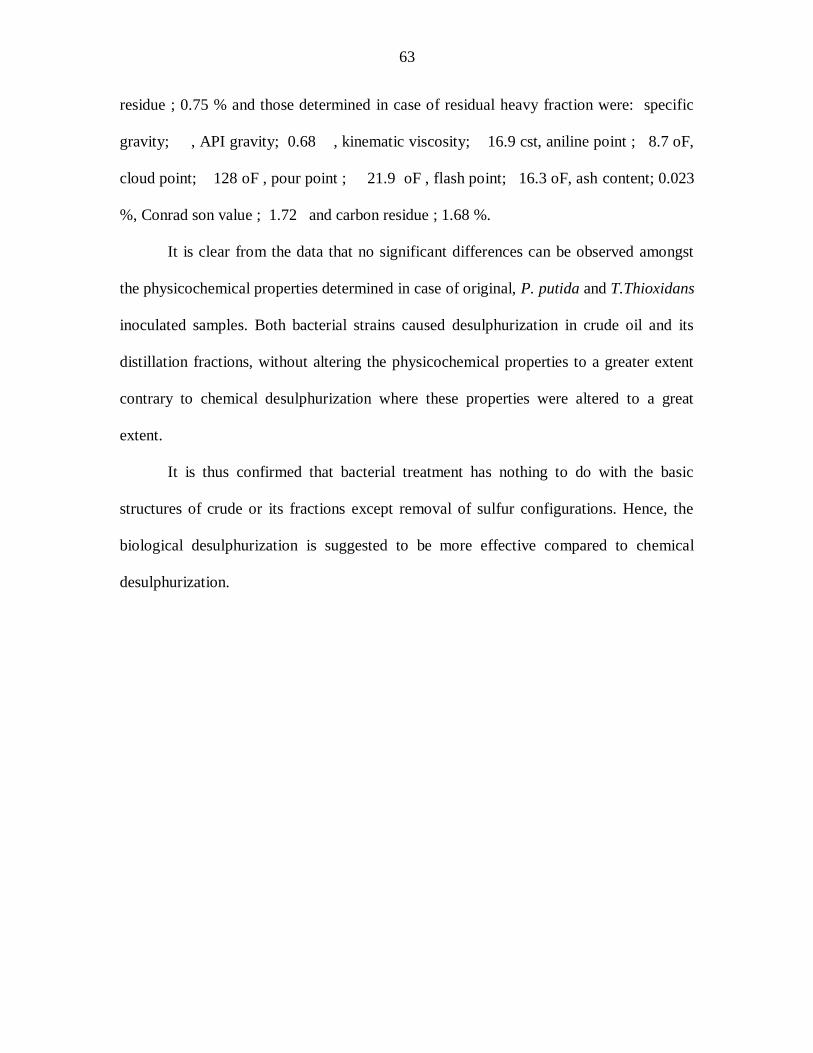
63
residue ; 0.75 % and those determined in case of residual heavy fraction were: specific
gravity; , API gravity; 0.68 , kinematic viscosity; 16.9 cst, aniline point ; 8.7 oF,
cloud point; 128 oF , pour point ; 21.9 oF , flash point; 16.3 oF, ash content; 0.023
%, Conrad son value ; 1.72 and carbon residue ; 1.68 %.
It is clear from the data that no significant differences can be observed amongst
the physicochemical properties determined in case of original, P. putida and T.Thioxidans
inoculated samples. Both bacterial strains caused desulphurization in crude oil and its
distillation fractions, without altering the physicochemical properties to a greater extent
contrary to chemical desulphurization where these properties were altered to a great
extent.
It is thus confirmed that bacterial treatment has nothing to do with the basic
structures of crude or its fractions except removal of sulfur configurations. Hence, the
biological desulphurization is suggested to be more effective compared to chemical
desulphurization.
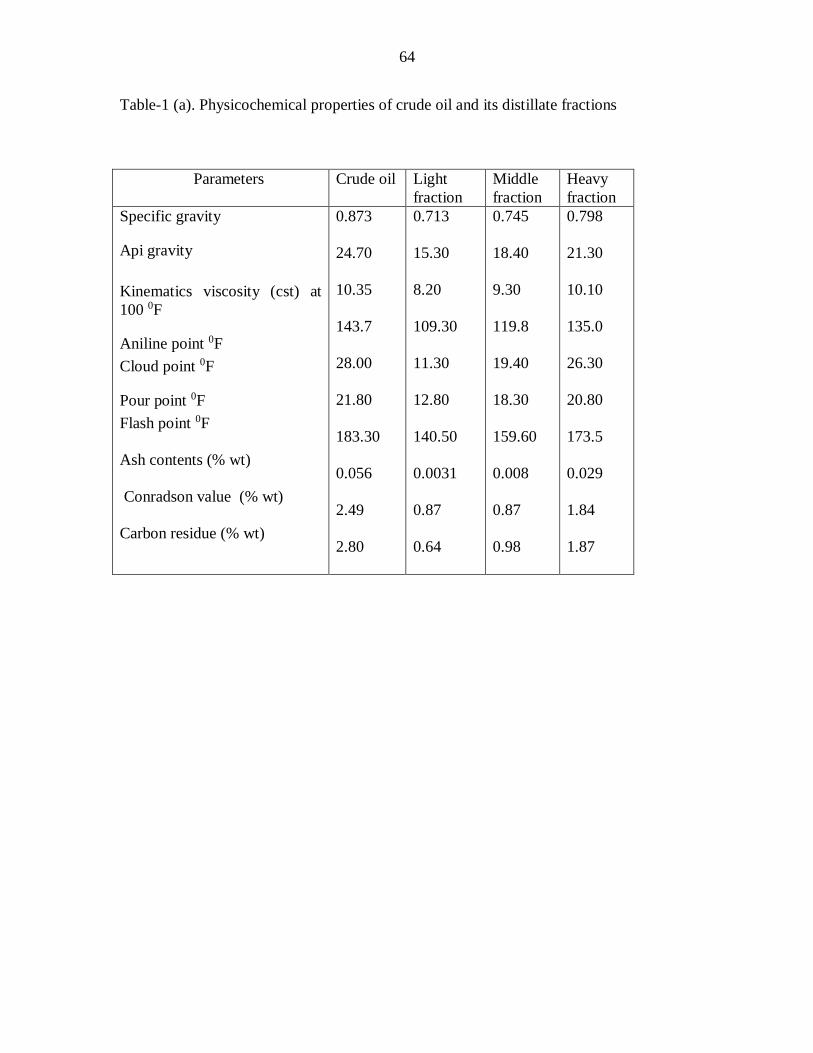
64
Table-1 (a). Physicochemical properties of crude oil and its distillate fractions
Parameters Crude oil Light
fraction
Middle
fraction
Heavy
fraction
Specific gravity
Api gravity
Kinematics viscosity (cst) at
100 0F
Aniline point 0F
Cloud point 0F
Pour point 0F
Flash point 0F
Ash contents (% wt)
Conradson value (% wt)
Carbon residue (% wt)
0.873
24.70
10.35
143.7
28.00
21.80
183.30
0.056
2.49
2.80
0.713
15.30
8.20
109.30
11.30
12.80
140.50
0.0031
0.87
0.64
0.745
18.40
9.30
119.8
19.40
18.30
159.60
0.008
0.87
0.98
0.798
21.30
10.10
135.0
26.30
20.80
173.5
0.029
1.84
1.87
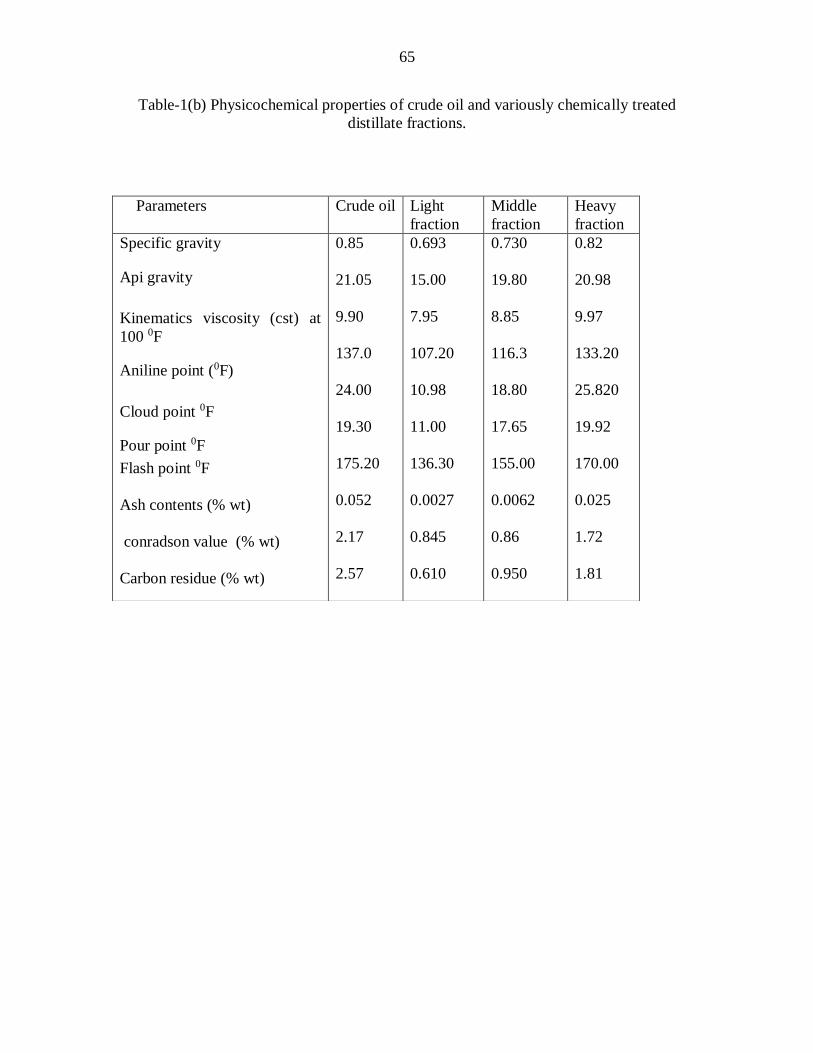
65
Table-1(b) Physicochemical properties of crude oil and variously chemically treated
distillate fractions.
Parameters Crude oil Light
fraction
Middle
fraction
Heavy
fraction
Specific gravity
Api gravity
Kinematics viscosity (cst) at
100 0F
Aniline point (0F)
Cloud point 0F
Pour point 0F
Flash point 0F
Ash contents (% wt)
conradson value (% wt)
Carbon residue (% wt)
0.85
21.05
9.90
137.0
24.00
19.30
175.20
0.052
2.17
2.57
0.693
15.00
7.95
107.20
10.98
11.00
136.30
0.0027
0.845
0.610
0.730
19.80
8.85
116.3
18.80
17.65
155.00
0.0062
0.86
0.950
0.82
20.98
9.97
133.20
25.820
19.92
170.00
0.025
1.72
1.81
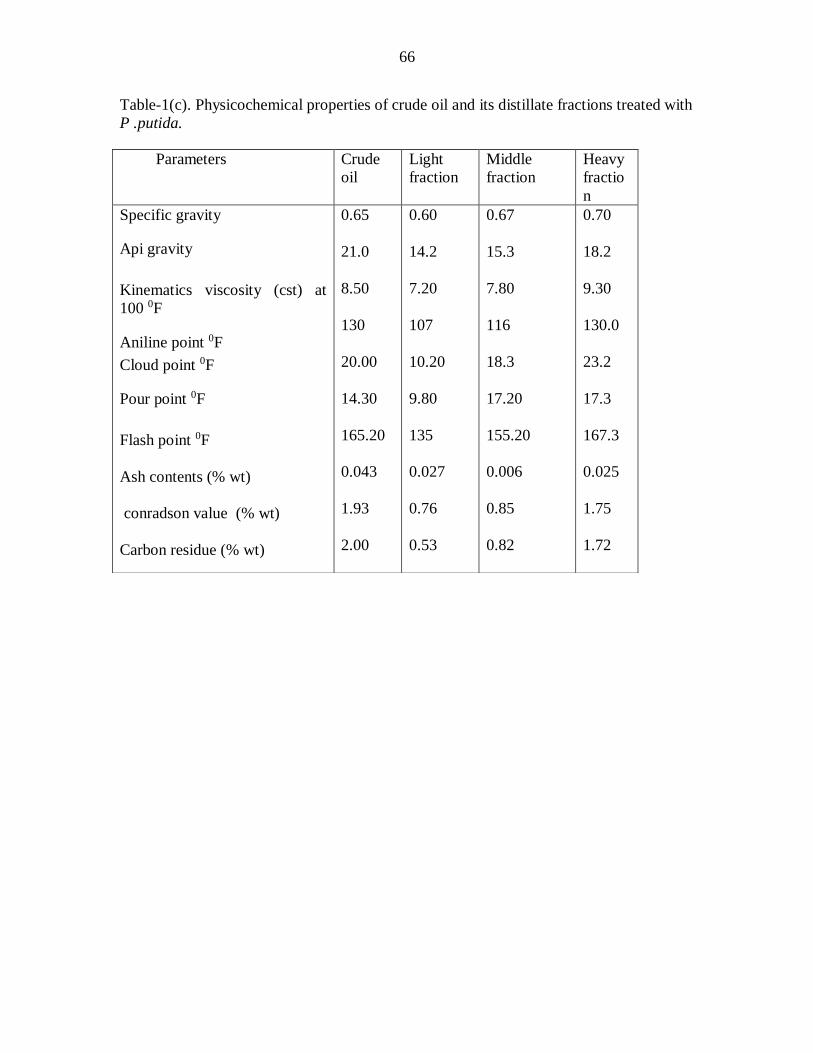
66
Table-1(c). Physicochemical properties of crude oil and its distillate fractions treated with
P .putida.
Parameters Crude
oil
Light
fraction
Middle
fraction
Heavy
fractio
n
Specific gravity
Api gravity
Kinematics viscosity (cst) at
100 0F
Aniline point 0F
Cloud point 0F
Pour point 0F
Flash point 0F
Ash contents (% wt)
conradson value (% wt)
Carbon residue (% wt)
0.65
21.0
8.50
130
20.00
14.30
165.20
0.043
1.93
2.00
0.60
14.2
7.20
107
10.20
9.80
135
0.027
0.76
0.53
0.67
15.3
7.80
116
18.3
17.20
155.20
0.006
0.85
0.82
0.70
18.2
9.30
130.0
23.2
17.3
167.3
0.025
1.75
1.72
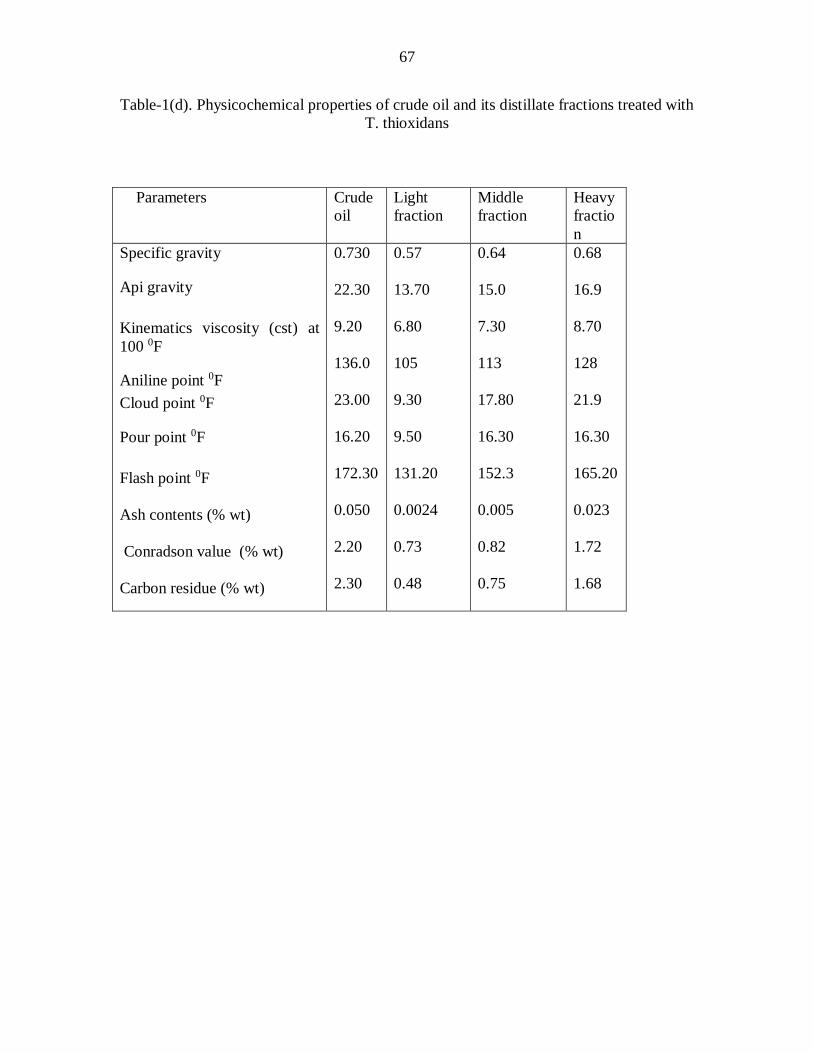
67
Table-1(d). Physicochemical properties of crude oil and its distillate fractions treated with
T. thioxidans
Parameters Crude
oil
Light
fraction
Middle
fraction
Heavy
fractio
n
Specific gravity
Api gravity
Kinematics viscosity (cst) at
100 0F
Aniline point 0F
Cloud point 0F
Pour point 0F
Flash point 0F
Ash contents (% wt)
Conradson value (% wt)
Carbon residue (% wt)
0.730
22.30
9.20
136.0
23.00
16.20
172.30
0.050
2.20
2.30
0.57
13.70
6.80
105
9.30
9.50
131.20
0.0024
0.73
0.48
0.64
15.0
7.30
113
17.80
16.30
152.3
0.005
0.82
0.75
0.68
16.9
8.70
128
21.9
16.30
165.20
0.023
1.72
1.68
68
3.2. Desulphurization study of Crude and its distillate fractions
Sulfur concentration in crude oil has been found to be varied from 0.05 to 5.0%
(by weight), but some time its concentration goes beyond even the permissible range
(8%) and attain a value of (13.95%) (61). Concentration of the sulfur compounds
increases along the boiling points of the various distillate fractions (61). Upon
combustion, sulfur in petroleum products causes air pollution in terms of particulate
matter and acidic gases, such as sulfur dioxide (SO2), sulfur trioxide (SO3) etc, which
ultimately converts to sulfuric acid (62). To overcome all these problems sulfur contents
in crude oils may be kept as low as possible during refining processing, because
Sulfur causes the poisoning of catalysts, where it deactivates the catalysts which
cannot perform its functions properly. Sulfur contents in crude oil also corrode the
metallic portion of the refinery plant and reduce the life of industry.
Various sulfurous compounds have been determined in original, chemically and
bacterially treated distillate fractions in current investigation. These include sulfur
(reactive to copper), total sulfur, elemental sulfur, aliphatic sulfides, total sulfides,
mercaptane sulfur, hydrogen sulfide, benzothiophene and dibenzothiophen. Values of
each corresponding sulfur analogue determined before and after particular chemical and
biological treatment have been given in the respective tables and the graphical
representations have also been shown for first glance comparison. For confirmation, UV
analysis and GC-MS studies have also been performed in case of elemental sulfur,
aliphatic sulfides, benzothiophene and dibenzothiophene.
69
3.2.1 Removal of sulfur (reactive to copper) in distillate fractions
Sulphur reactive to copper was determined adopting volumetric method (ASTM
IP (242 /83).
Reactive sulfur is defined as the sulfur present in crude oil and its fractions in
such a state that it will react with metallic copper, when they are heated together. This is
an elemental form of sulfur, which is much reactive form of sulfur. In this case, sulfur
liberates in the form of hydrogen sulfide (H2S) gas.
Hydrodesulphurization (HDS) technique is mostly adopted by the refiners to
remove sulfur contents from the petroleum based products. HDS is a catalytic process,
which converts sulfur contents to hydrogen sulfide (H2S) gas, if crude oil interacts with
hydrogen gas at pressures between 150 and 3,000 lb/in2 and temperatures between 290
and 455°C. The pressure and temperature conditions depend upon the nature of crude oil
and level of desulphurization required (62).
Chemical Desulphurization
In the present study, chemical removal of sulphur reactive to copper was viewed
in case of the three distillate fractions (light, middle and heavy). The sulfur contents
observed in light, middle and heavy fractions before chemical treatments were found to
be 0.0748, 0.1037 & 0.1028 %, respectively as shown in Fig.-1. The same distillate
fractions were then scrubbed with four different chemical reagents i.e. hydrochloric acid
(HCL), sodium hydroxide (NaOH), sodium arsenate (Na2HAsO4) and ammonium
vendate (NH4VO3). These chemicals were used in order to evaluate their desulphurization
potential in term of their efficiency for removal of sulphur moiety which is reactive to
copper.
70
Among the chemicals used, HCl has the ability to convert sulfur to hydrogen
sulfide (H2S) gas, and reduces the sulfur contents in liquid petroleum, because H2S is a
volatile gas and emanates the petroleum surface at high temperature and pressure. From
the chemically treated samples, it is clear that up to some extent, sulfur level has been
reduced. In HCl scrubbed fractions, sulphur was found to be 0.0703 % in case of light
fraction, 0.0901% in case of middle fraction and 0.0971% in case of heavy fraction as
compared to the values determined in these fractions before scrubbing i,e 0.0748 % in
case of light fraction, 0.1037 % in case of middle fraction and 0.1028 % in case of heavy
fraction.
The influence of scrubbing the same samples with NaOH on sulphur depletion
was also viewed. The sulphur observed in the residual fractions from this treatment was
0.0655 % in case of light fraction, 0.0838 % in case of middle fraction and 0.0853 % in
case of heavy fraction. The data shows a considerable reduction in sulfur contents with
this particular scrubber. This can be attributed due to the fact that NaOH converts sulfur
to sodium sulfide (Na2S) or may further oxidize to sodium sulfate (Na2SO4) during the
chemical interaction, which ultimately causes desulphurization of the crude oil distillates.
In the next step, sodium arsenate (Na2HAsO4) was used in order to view its
desulphurization capability. The sulfur observed in residual fractions from this treatment
was 0.0645 % in case of light fraction, 0.0754 % in case of middle fraction and 0.0742%
in case of heavy fraction. Upon comparing the desulphurization activity with HCl and
NaOH, this scrubbing agent seems to be more efficient for the removal of sulphur
reactive to copper. The reason can be thought for this significant sulphur depleting ability
71
is the conversion of sulphur to sodium sulfides and arsenic sulfides. Which then easily
emanate from the bulk.
Ammonium vendate (NH4VO3) was also used to view its dulphurization
capability. From the data obtained, it is quite clear that NH4VO3 has caused removal of a
significant quantity of sulfur reactive to copper than the rest of the three scrubbing agents
used. The sulphur levels observed using this reagent was 0.0628 % in case of light
fraction, 0.0732% in case of middle fraction and 0.0639 % in case of heavy fraction. The
reason can be thought for this significant depletion is this reagent has the ability to
convert sulfur to ammonium sulfides and vanadium sulfides by reacting with the NH+4
and vanadium which are volatile products and quickly desorb from the surface and bulk
of the distillates.
It can be concluded from the afore mentioned findings that the chemical reagents
particularly ammonium vendate proved to be excellent sulfur extractor or depletor for
fractions understudy. The effect of ammonium vandate is quite significant in the heavy
fraction.
The capability of each scrubbing agent was calculated on the basis of % depletion.
Fig. 2 shows the percent reduction noticed in case of these scrubbers against the value of
sulphur determined in original samples. It is inferred from the results that among the
reagents used, HCl has reduced 6.016 % sulphur in case of light fraction, 13.114 % in
case of middle fraction and 5.544 % in case of heavy fraction. Similarly, the depletion
observed using NaOH was 12.433 % in case of light fraction, 19.1530 % in case of
middle fraction, and 17.0233 % in case of heavy fraction
72
Na2HAsO4 caused a significant reduction in all the three distillates studied. The
depletion noticed was 13.7700, 27.4302 & 27.8210 % in case of light, middle and heavy
fractions, respectively. The reduction seems to be comparatively better than HCl and
NaOH.
In case of NH4VO3, the reduction is quite significant, which was noted as
16.042, 28.873 & 37.8404 %, which was 10.026, 15.76 & 32 % ; I3.61, 9.72 & 20.82 % ;
2.27, 1.44 % 10.02 % times more than HCl, NaOH and Na2HAsO4 in case of light,
middle and heavy fractions, respectively.
Chemical treatments have also been studied buy other researches e.g. Landau et
al, has studied Israeli shale oil for chemical desulphurization, where they hydrotreated the
oil based products at elevated temperature and pressure for the removal of sulfur contents
[63] and obtained very good results.
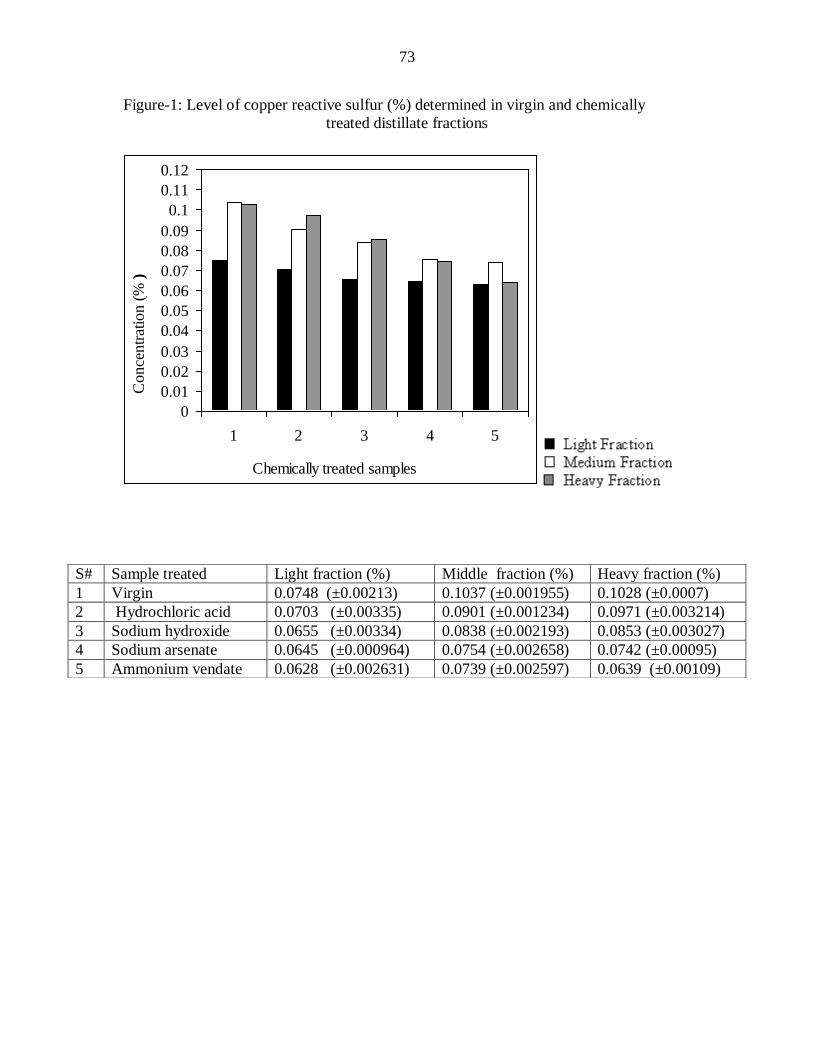
73
Figure-1: Level of copper reactive sulfur (%) determined in virgin and chemically
treated distillate fractions
0
0.01
0.02
0.03
0.04
0.05
0.06
0.07
0.08
0.09
0.1
0.11
0.12
1 2 3 4 5
Chemically treated samples
Co
nce
ntr
atio
n (
% )
S# Sample treated Light fraction (%) Middle fraction (%) Heavy fraction (%)
1 Virgin 0.0748 (±0.00213) 0.1037 (±0.001955) 0.1028 (±0.0007)
2 Hydrochloric acid 0.0703 (±0.00335) 0.0901 (±0.001234) 0.0971 (±0.003214)
3 Sodium hydroxide 0.0655 (±0.00334) 0.0838 (±0.002193) 0.0853 (±0.003027)
4 Sodium arsenate 0.0645 (±0.000964) 0.0754 (±0.002658) 0.0742 (±0.00095)
5 Ammonium vendate 0.0628 (±0.002631) 0.0739 (±0.002597) 0.0639 (±0.00109)
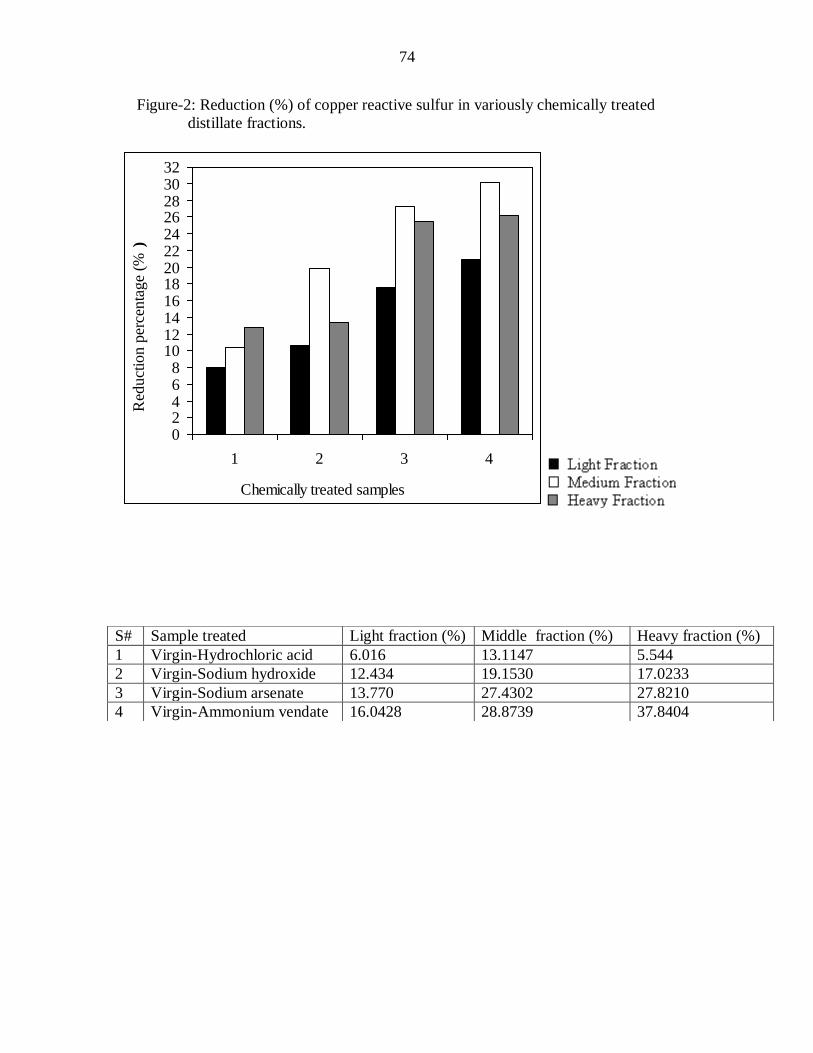
74
Figure-2: Reduction (%) of copper reactive sulfur in variously chemically treated
distillate fractions.
02468
101214161820222426283032
1 2 3 4
Chemically treated samples
Red
uct
ion p
erce
nta
ge
(% )
S# Sample treated Light fraction (%) Middle fraction (%) Heavy fraction (%)
1 Virgin-Hydrochloric acid 6.016 13.1147 5.544
2 Virgin-Sodium hydroxide 12.434 19.1530 17.0233
3 Virgin-Sodium arsenate 13.770 27.4302 27.8210
4 Virgin-Ammonium vendate 16.0428 28.8739 37.8404
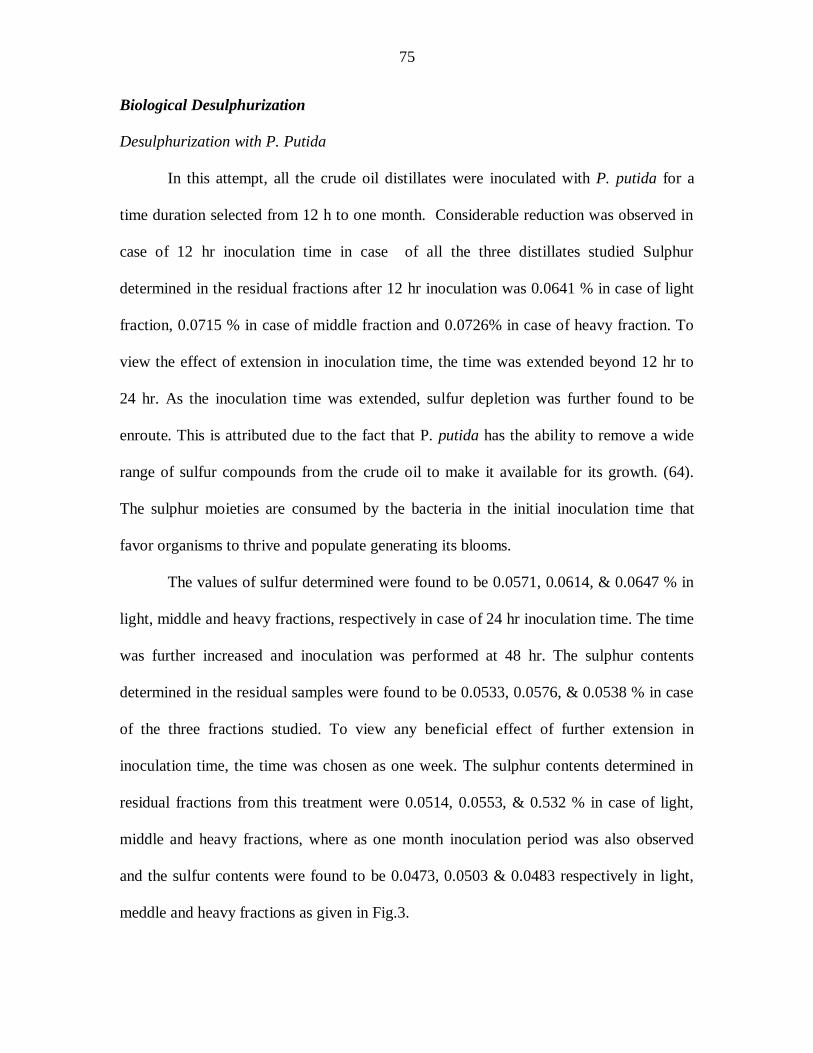
75
Biological Desulphurization
Desulphurization with P. Putida
In this attempt, all the crude oil distillates were inoculated with P. putida for a
time duration selected from 12 h to one month. Considerable reduction was observed in
case of 12 hr inoculation time in case of all the three distillates studied Sulphur
determined in the residual fractions after 12 hr inoculation was 0.0641 % in case of light
fraction, 0.0715 % in case of middle fraction and 0.0726% in case of heavy fraction. To
view the effect of extension in inoculation time, the time was extended beyond 12 hr to
24 hr. As the inoculation time was extended, sulfur depletion was further found to be
enroute. This is attributed due to the fact that P. putida has the ability to remove a wide
range of sulfur compounds from the crude oil to make it available for its growth. (64).
The sulphur moieties are consumed by the bacteria in the initial inoculation time that
favor organisms to thrive and populate generating its blooms.
The values of sulfur determined were found to be 0.0571, 0.0614, & 0.0647 % in
light, middle and heavy fractions, respectively in case of 24 hr inoculation time. The time
was further increased and inoculation was performed at 48 hr. The sulphur contents
determined in the residual samples were found to be 0.0533, 0.0576, & 0.0538 % in case
of the three fractions studied. To view any beneficial effect of further extension in
inoculation time, the time was chosen as one week. The sulphur contents determined in
residual fractions from this treatment were 0.0514, 0.0553, & 0.532 % in case of light,
middle and heavy fractions, where as one month inoculation period was also observed
and the sulfur contents were found to be 0.0473, 0.0503 & 0.0483 respectively in light,
meddle and heavy fractions as given in Fig.3.
76
Figure-3: Copper reactive sulfur (%) determined in P. putida treated distillate fractions as
a function of inoculation time
0
0.01
0.02
0.03
0.04
0.05
0.06
0.07
0.08
0.09
0.1
0.11
1 2 3 4 5 6
Inoculation time
Conce
ntr
atio
n (
% )
S# Sample treated Light fraction (%) Middle fraction (%) Heavy fraction (%)
1 Virgin 0.0748 (±0.00212) 0.1037 (±0.00199) 0.1028 (±0.00213)
2 12 hours 0.0641 (±0.002641) 0.0715 (±0.0017) 0.0726 (±0.001769)
3 24 hours 0.0571 (±0.002488) 0.0614 (±0.00158) 0.0647 (±0.002883)
4 48 hours 0.0533 (±0.003759) 0.0576 (±0.001823) 0.0538 (±0.002702)
5 One week 0.0514 (±0.00153) 0.0553 (±0.00153) 0.0532 (±0.000153)
6 One month 0.0473 (±0.00020) 0.0503 (±0.00153) 0.0483 (±0.00208)
77
From the sulphur data, it is certain that upon extension in time, the required
sulphur is not available for effective flourish of the microorganism and its growth and
culture is suppressed.
In these inoculation time
Various sulfur specific desulphurization bacteria has been previously isolated,
that are capable to desulfurize a variety of sulfurous compounds particularly found in
petroleum based products through a sulfur selective oxidative pathway (65).
In order to ascertain the effect of extension in inoculation time,
percent reduction was calculated in each case. Reduction between each treated and
untreated sample was calculated and provided in Fig. 4. Satisfactory results have
been achieved in all the inoculations e.g. 12 hr, 24 hr, 48 hr, one week and one
month. During these inoculations, enough reduction has been shown by P. putida
in light, middle and heavy fractions which was 14.304, 31.0511 & 29.377 %
observed in case of 12 hr, 23.663, 40.790 & 37.062 % observed in case of 24 hr,
26.069, 44.455 & 47.665 % observed in case of 48 hr and 31.283, 46.6730 &
48.249 % observed in case of one week inoculation, respectively.
The reason for quite promising reduction observed in case of all fractions particularly in
case of heavy fraction is due to the reason that bacteria have an enzymatic pathway which
removes covalently bonded sulfur without disturbing carbon-carbon bonds in crude oils.
The DNA sequences of these microorganisms are composed of special desulphurization
genes necessary to follow the desulphurization pathway. These are particularly sulfur
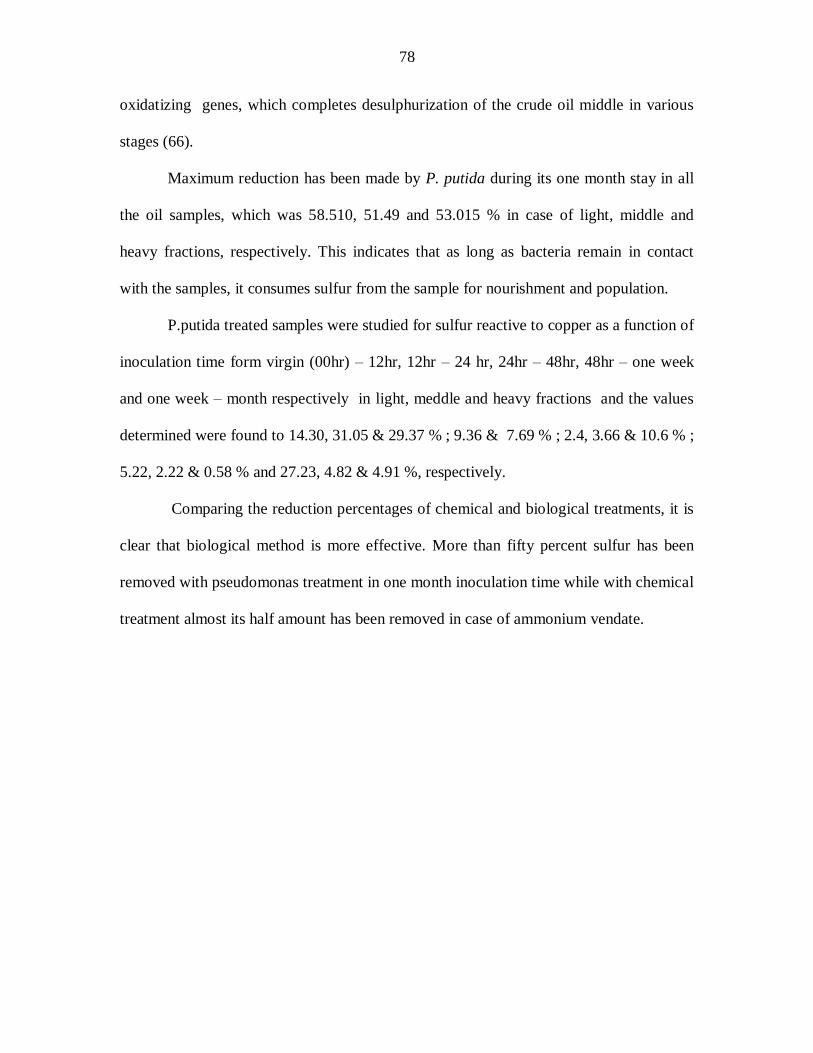
78
oxidatizing genes, which completes desulphurization of the crude oil middle in various
stages (66).
Maximum reduction has been made by P. putida during its one month stay in all
the oil samples, which was 58.510, 51.49 and 53.015 % in case of light, middle and
heavy fractions, respectively. This indicates that as long as bacteria remain in contact
with the samples, it consumes sulfur from the sample for nourishment and population.
P.putida treated samples were studied for sulfur reactive to copper as a function of
inoculation time form virgin (00hr) – 12hr, 12hr – 24 hr, 24hr – 48hr, 48hr – one week
and one week – month respectively in light, meddle and heavy fractions and the values
determined were found to 14.30, 31.05 & 29.37 % ; 9.36 & 7.69 % ; 2.4, 3.66 & 10.6 % ;
5.22, 2.22 & 0.58 % and 27.23, 4.82 & 4.91 %, respectively.
Comparing the reduction percentages of chemical and biological treatments, it is
clear that biological method is more effective. More than fifty percent sulfur has been
removed with pseudomonas treatment in one month inoculation time while with chemical
treatment almost its half amount has been removed in case of ammonium vendate.
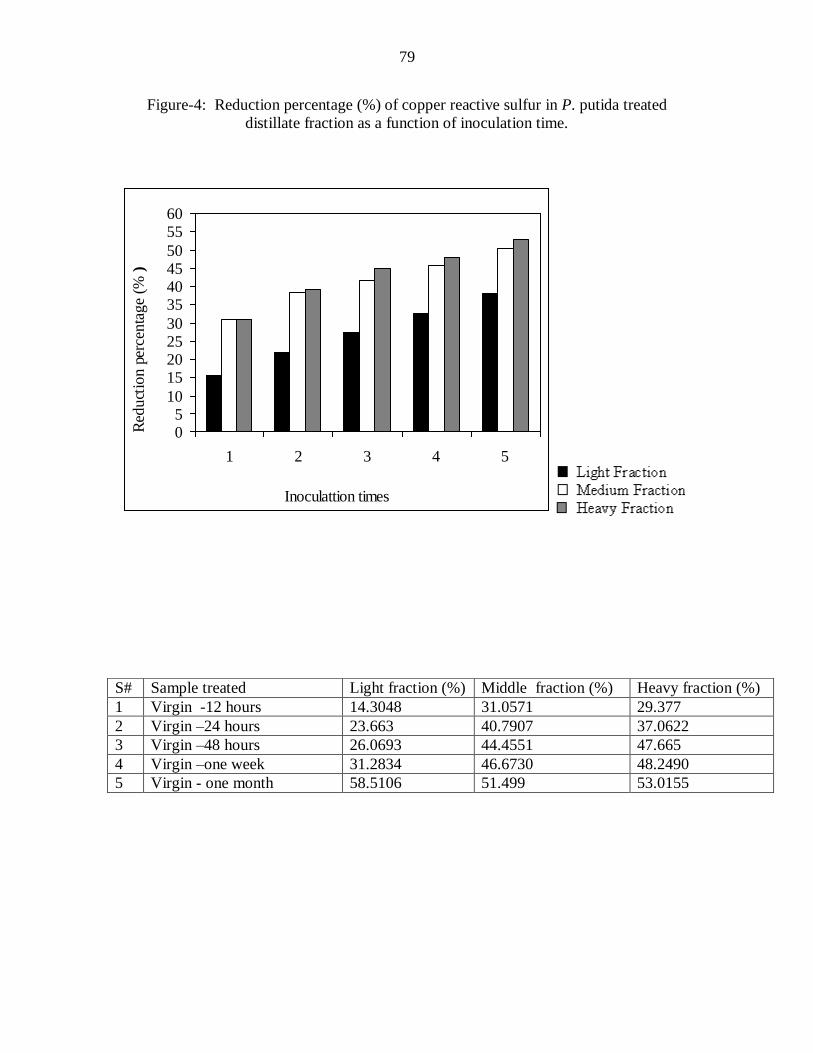
79
Figure-4: Reduction percentage (%) of copper reactive sulfur in P. putida treated
distillate fraction as a function of inoculation time.
05
10
15202530
35404550
5560
1 2 3 4 5
Inoculattion times
Red
uct
ion
perc
enta
ge
(% )
S# Sample treated Light fraction (%) Middle fraction (%) Heavy fraction (%)
1 Virgin -12 hours 14.3048 31.0571 29.377
2 Virgin –24 hours 23.663 40.7907 37.0622
3 Virgin –48 hours 26.0693 44.4551 47.665
4 Virgin –one week 31.2834 46.6730 48.2490
5 Virgin - one month 58.5106 51.499 53.0155
80
Desulphurization with T. Thioxidanes
In this attempt, all the crude oil distillates were treated with T. thioxidanes and its
desulphurization ability was evaluated. The samples were inoculated for the same contact
time chosen in case of P. putida. T. thioxidans has caused sulfur removal significantly. It
is because of the fact that the microorganism has the ability to erode the sulfur crystal, to
reduce its size in the area immediately adjacent to the cell (67) for effective assimilation
by the body.
The sulfur contents observed in residual samples from each inoculation were
determined in case of 12 hr, 24 hr, 48 hr, one week and one month inoculation time. The
sulphur contents observed in light, middle and heavy fractions in case of 12 hr were
found to be 0.0641, 0.0718 & 0.0726 %, respectively. Similarly, the sulphur contents
determined in residual light, middle and heavy fractions from the afore mentioned
bacteria inoculated for 24 hr were 0.0571, 0.0614 & 0.0647 %.
The time was extended to 48 hr and the sulphur contents observed were 0.0553,
0.0576 & 0.0537 %. Inoculation time was further increased to one week. The sulphur
contents determined in the residual fractions from this treatment were 0.0513, 0.0553 &
0.0532 %. The sulphur contents determined in the residual fractions from one month
inoculation time were 0.0473, 0.0504 & 0.0483 %, in case of light, middle and heavy
fractions, respectively. The sulphur contents determined in all cases show a significant
depletion compared to original samples (0.0748, 0.1037 & 0.1028 % in light, middle and
heavy fractions) as shown in Fig.-5.
The percent reduction in each case was also calculated and represented in Fig. 6.
81
Where 14.305, 30.618 and 29.961 % depletion was observed in case of light, middle and
heavy fractions, respectively in the first 12 hr. As the fermentation time was extended
beyond 12 hr up to one month, the depletion rate also increased along with the extension
in time. Same effect has been studied by other workers (68).
The percent reduction calculated in case of 24 hr, 48 hr, one week and one month
was quite significant i.e. 23.663, 40.791 and 37.0622 % in case of 24 hr in light, middle
and heavy fractions, respectively. Similarly, the percent reduction observed in case of 48
hr inoculation time was 26.337, 44.45 and 48.443 %, and that observed in case of one
week was 31.417, 46.673 and 46.303 %.The depletion observed in light, middle, and
heavy fractions in case of one month inoculation was 37.033, 51.398 and 53.015 %,
respectively.
It was observed that 14.30, 30.61 & 29.96 %, 9.36, 10.18 & 7.1 % ; 2.67, 3.66 &
10.7 % ; 5.08, 2.22 & 0.48 % ; 5.62, 4.72, & 4.77 % reduction percentage has been made
from one inoculation time to another in case of 12 - 24hr, 24 - 48hr, 48 - one week and
one week - one month in light, middle and heavy fraction, respectively.
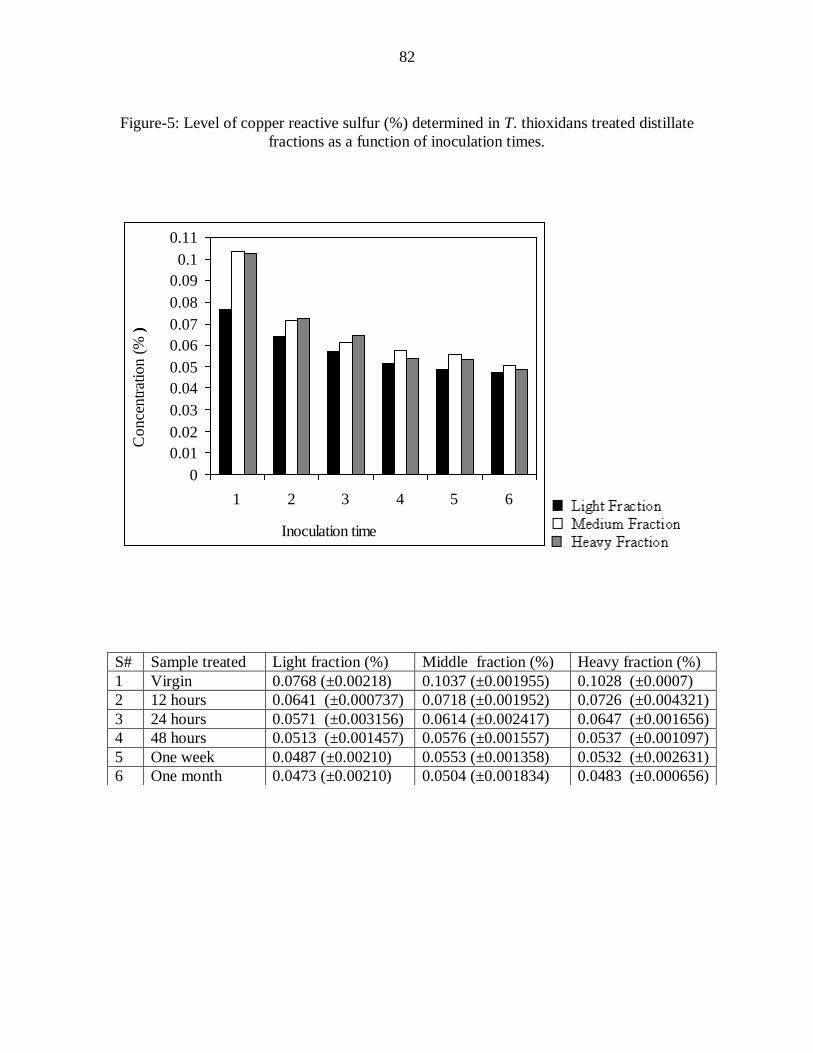
82
Figure-5: Level of copper reactive sulfur (%) determined in T. thioxidans treated distillate
fractions as a function of inoculation times.
0
0.01
0.02
0.03
0.04
0.05
0.06
0.07
0.08
0.09
0.1
0.11
1 2 3 4 5 6
Inoculation time
Conce
ntr
atio
n (
% )
S# Sample treated Light fraction (%) Middle fraction (%) Heavy fraction (%)
1 Virgin 0.0768 (±0.00218) 0.1037 (±0.001955) 0.1028 (±0.0007)
2 12 hours 0.0641 (±0.000737) 0.0718 (±0.001952) 0.0726 (±0.004321)
3 24 hours 0.0571 (±0.003156) 0.0614 (±0.002417) 0.0647 (±0.001656)
4 48 hours 0.0513 (±0.001457) 0.0576 (±0.001557) 0.0537 (±0.001097)
5 One week 0.0487 (±0.00210) 0.0553 (±0.001358) 0.0532 (±0.002631)
6 One month 0.0473 (±0.00210) 0.0504 (±0.001834) 0.0483 (±0.000656)
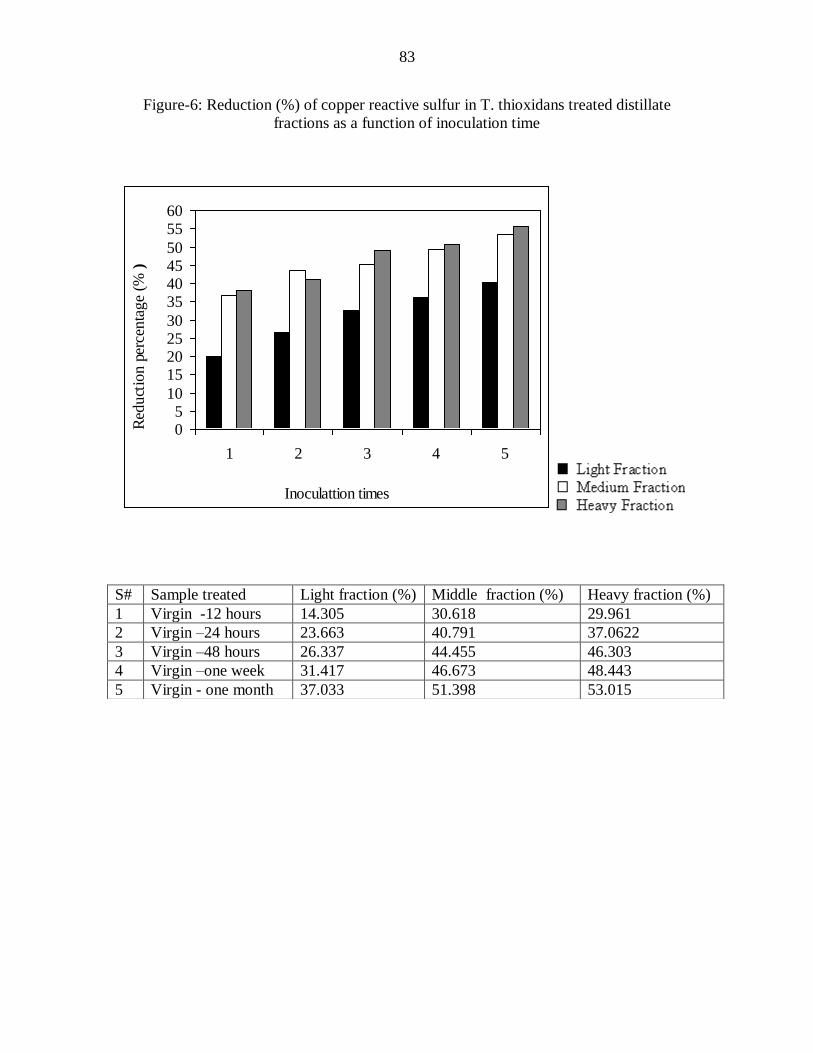
83
Figure-6: Reduction (%) of copper reactive sulfur in T. thioxidans treated distillate
fractions as a function of inoculation time
05
10
15202530
35404550
5560
1 2 3 4 5
Inoculattion times
Red
uct
ion
perc
enta
ge
(% )
S# Sample treated Light fraction (%) Middle fraction (%) Heavy fraction (%)
1 Virgin -12 hours 14.305 30.618 29.961
2 Virgin –24 hours 23.663 40.791 37.0622
3 Virgin –48 hours 26.337 44.455 46.303
4 Virgin –one week 31.417 46.673 48.443
5 Virgin - one month 37.033 51.398 53.015
84
3.2.2. Removal of Total sulfur in crude oil distillate fractions
Chemical treatment
All kind of organic and inorganic sulfurous compounds present in petroleum oils
are termed as total sulfur. The samples are combusted in the presence of oxygen and the
combustion products are absorbed in hydrogen peroxide (H2O2) solution, and the amount
of sulfuric acid (H2SO4) formed is determined by titration with standard barium per
chlorate solution using thorine as indicator.
Crude oil distillates were analyzed for total sulfur using ASTM D method (1226-
IP 107).
In case of virgin samples, total sulfur concentration was found to be 0.4312, 0.523
& 0.7684% in case of light, middle and heavy fractions, respectively. All the distillation
fractions were then scrubbed with the four chemicals reagents i.e. HCl, NaOH,
Na2HAsO4 and NH4VO3. The depletion profile is given in Fig.-7.
In case of HCl treatment, the sulphur contents observed in the residual fractions
were found to be 0.4208, 0.4910 & 0.7162 % in case of the three distillate fractions
studied. Upon comparing the values with the original samples, the removal seems to be
quite insignificant. Thus, this scrubbing agent is not recommended for effective removal
of total sulphur. NaOH was viewed as reagent for total sulphur depletion. The data is
provided in the same Fig. It is evident that NaOH has reduced some amount of total
sulfur (0.4117, 0.4654 & 0.6698 %). Na2HASO4 and NH4VO3 also caused depletion of
total sulphur. The total sulphur contents determined in light, middle and heavy fractions
in case of residual fractions from Na2HASO4 treatment were 0.3747, 0.4321, & 0.6425 %
and those in case of NH4VO3 were 0.3539, 0.4061, & 0.6231 %, respectively.
85
It is clear from this figure that most of the sulfur contents have been reduced in
case of ammonium vendate (NH4VO3) as compared to other chemicals.
In chemical desulphurization the scrubbing capacities of the used leaching
chemicals was found to be 2.41, 6.18 & 6.79 % ; 2.11, 4.83 & 6.13 % ; 8.6, 6.37 & 3.35
% ; and 4.82, 4.97 & 0.03 % , respectively in cases virgin – HCl, HCl- NaOH, NaOH -
Na2HAsO4 and Na2HAsO4 - NH4VO3 in light, middle and heavy fractions.
The effect of the chemicals desulphurization has also been shown in the form of
reduction percentages and the values are given in Fig.-8.Where most of the sulfur was
reduced in the three distillates by ammonium vendate i.e. 17.926, 22.351 and 16.410 %
followed by NA2HAsO4 (13.102, 17.380 and 16.384 % ) followed by NaOH (4.522,
11.013 and 12.831 %) where as HCl has caused the least reduction (2.411, 6.185 and
6.793 %).
Yitzhaki has given specific methods for chemical desulphurization but only for
heavy atmospheric gas oil, using catalysts (Co-Mo-Al). The effects of these catalysts
were temporary sulfur adsorption upon their surfaces. They have further used oxidation
regenerated catalysts Co-Mo/Al2O3 for hydrodesulphurization of heavy atmospheric gas
oil (HAGO) in batch and trickle-bed reactors at high temperature, sulfur level in the
hydrotreated heavy atmospheric gas oil (HAGO) was decreased by 50-350 ppm due to
sulfur adsorption on the surface of catalyst for periods of 20-50 hrs [69].
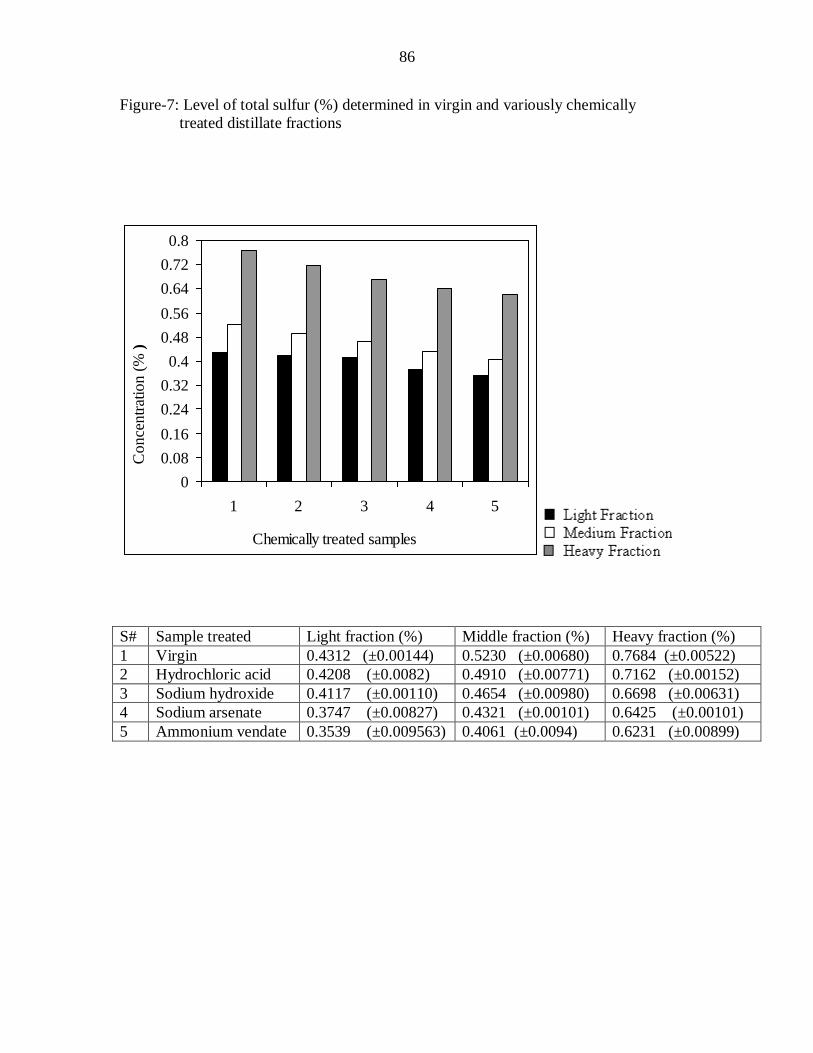
86
Figure-7: Level of total sulfur (%) determined in virgin and variously chemically
treated distillate fractions
0
0.08
0.16
0.24
0.32
0.4
0.48
0.56
0.64
0.72
0.8
1 2 3 4 5
Chemically treated samples
Conce
ntr
atio
n (
% )
S# Sample treated Light fraction (%) Middle fraction (%) Heavy fraction (%)
1 Virgin 0.4312 (±0.00144) 0.5230 (±0.00680) 0.7684 (±0.00522)
2 Hydrochloric acid 0.4208 (±0.0082) 0.4910 (±0.00771) 0.7162 (±0.00152)
3 Sodium hydroxide 0.4117 (±0.00110) 0.4654 (±0.00980) 0.6698 (±0.00631)
4 Sodium arsenate 0.3747 (±0.00827) 0.4321 (±0.00101) 0.6425 (±0.00101)
5 Ammonium vendate 0.3539 (±0.009563) 0.4061 (±0.0094) 0.6231 (±0.00899)
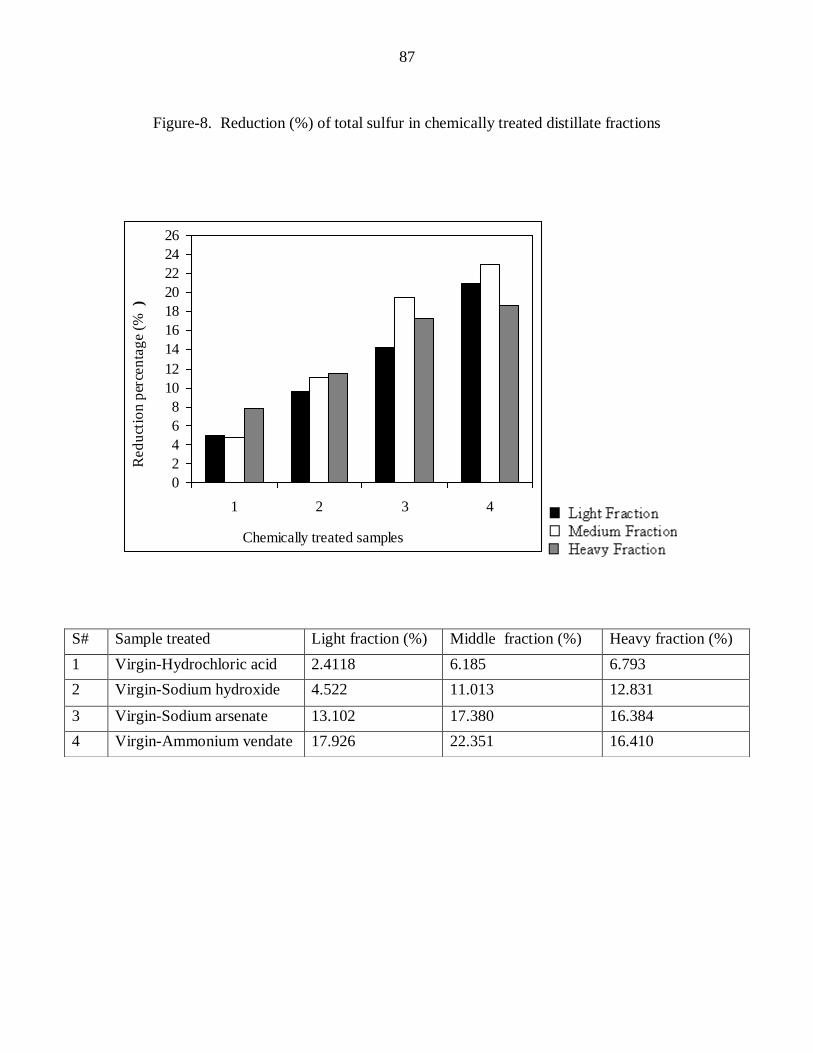
87
Figure-8. Reduction (%) of total sulfur in chemically treated distillate fractions
0
2
4
6
8
10
12
14
16
18
20
22
24
26
1 2 3 4
Chemically treated samples
Red
uct
ion p
erce
nta
ge (
% )
S# Sample treated Light fraction (%) Middle fraction (%) Heavy fraction (%)
1 Virgin-Hydrochloric acid 2.4118 6.185 6.793
2 Virgin-Sodium hydroxide 4.522 11.013 12.831
3 Virgin-Sodium arsenate 13.102 17.380 16.384
4 Virgin-Ammonium vendate 17.926 22.351 16.410
88
Biological Removal
Removal of total sulfur with P. putida
Fig.9 indicates the values of sulfur depletion observed in various inoculations
performed with P. putida. The sulfur contents observed in case of residual fractions
from inoculation performed for 12 hr were 0.2801, 0.3051 and 0.5178 % in case of light,
middle and heavy fractions, respectively. Upon comparing the sulphur contents
determined in original fractions (0.0.4312, 0.5230 & 0.7684 %), a significant reduction in
total sulphur can be noticed. The reason can be thought for this depletion is the presence
of specific cells in P. putida which can bio catalyze the oxidation of total sulphur (70).
The influence of extension in inoculation time was viewed by extending time
from 12 hr to 24 hr. The total sulphur contents determined in the residual fractions were.
0.2354, 0.2789, & 0.4971 %. Similarly, the time was further extended to 48 hr. The
sulphur contents found in the residual samples from this inoculation were 0.2326, 0.2625
& 0.4675 % .The time was next extended to one week and then to one month. The
sulphur contents determined in case of one week were 0.1911 , 0.2518 & 0.4460 % and
in case of one month inoculation, were 0.174 , 0.2353 & 0.414 % in light, middle and
heavy fractions, respectively.
Percent reduction of all the inoculation times has been given in Fig.10. Where
35.0417, 41.663 & 32.613 % reduction can be observed in case of 12 hr A reduction of
46.0575, 46.673 & 35.307 % can be observed in case of 24h inoculation. As the
inoculation time was extended beyond 24 hr to 48 hr, one week and one month its
percentage reduction was further increased to (46.0788, 49.808, 39.159), (55.6818,
89
51.854, 41.957) and ( 59.647, 55.0095, 46.460 ) % respectively in the cases of 48 hr, one
week and one month contact times as can be seen from the Fig .10.
In different inoculation times various sulphur amounts has been examined, which
were 35.00, 41.66 & 32.61 % ; 11.01, 5.01, & 2.69 % ; 0.02, 3.31 & 3.85 % ; 9.61, 2.05
& 2.80 % ; and 3.96, 3.15 & 4.51 % respectively in the cases of virgin – 12hr, 12hr – 24
hr, 24hr – 48hr, 48hr – one week and one week – month.
These bacteria take up the organic and inorganic sulfurous compounds from oil
middle, and as a wander full desulphurization biocatalyst
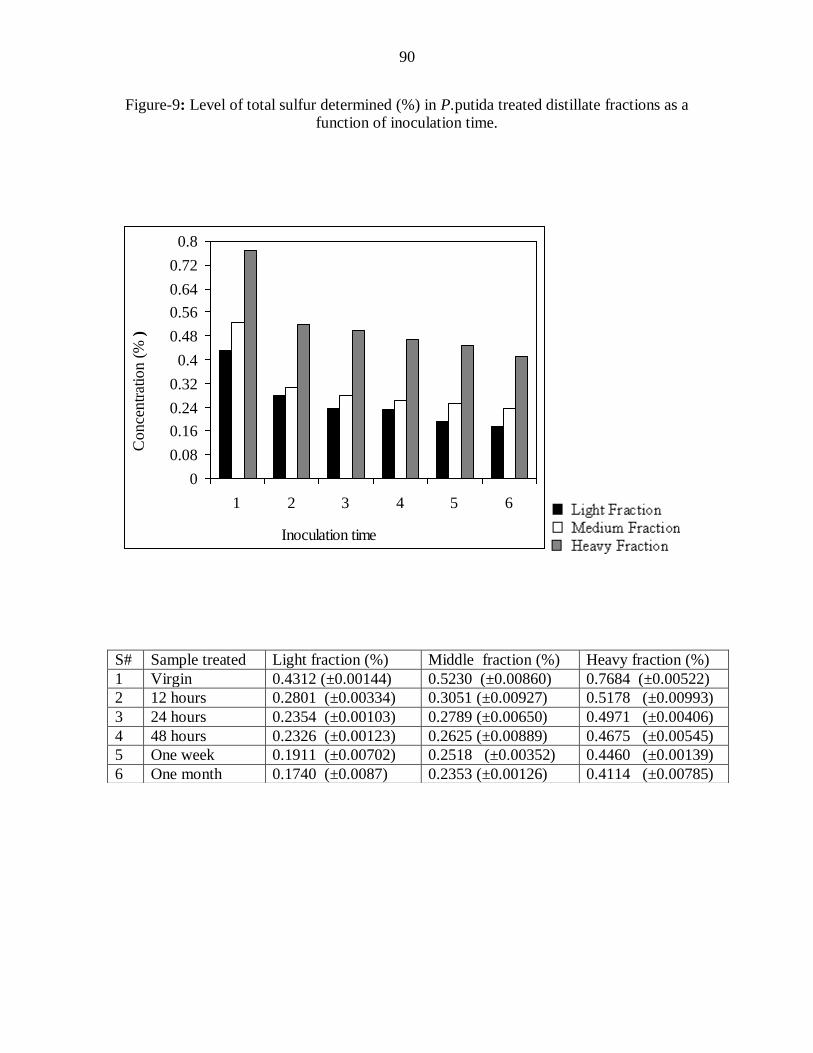
90
Figure-9: Level of total sulfur determined (%) in P.putida treated distillate fractions as a function of inoculation time.
0
0.08
0.16
0.24
0.32
0.4
0.48
0.56
0.64
0.72
0.8
1 2 3 4 5 6
Inoculation time
Conce
ntr
atio
n (
% )
S# Sample treated Light fraction (%) Middle fraction (%) Heavy fraction (%)
1 Virgin 0.4312 (±0.00144) 0.5230 (±0.00860) 0.7684 (±0.00522)
2 12 hours 0.2801 (±0.00334) 0.3051 (±0.00927) 0.5178 (±0.00993)
3 24 hours 0.2354 (±0.00103) 0.2789 (±0.00650) 0.4971 (±0.00406)
4 48 hours 0.2326 (±0.00123) 0.2625 (±0.00889) 0.4675 (±0.00545)
5 One week 0.1911 (±0.00702) 0.2518 (±0.00352) 0.4460 (±0.00139)
6 One month 0.1740 (±0.0087) 0.2353 (±0.00126) 0.4114 (±0.00785)
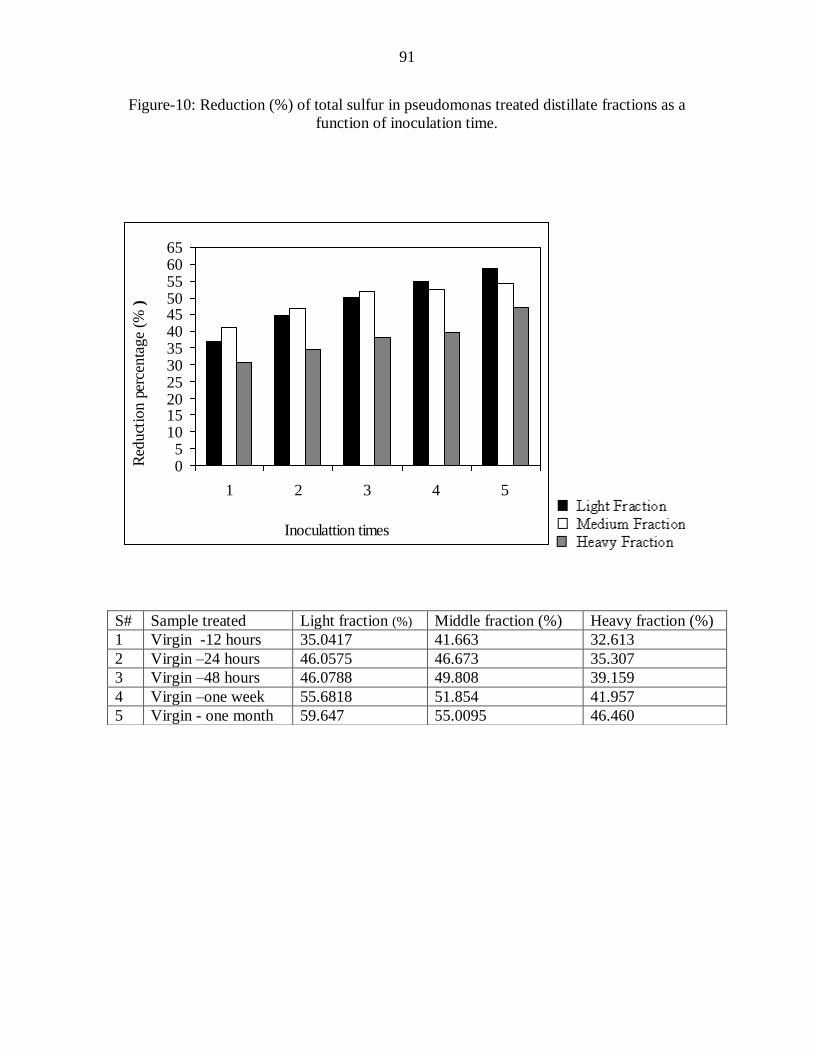
91
Figure-10: Reduction (%) of total sulfur in pseudomonas treated distillate fractions as a
function of inoculation time.
05
101520253035404550556065
1 2 3 4 5
Inoculattion times
Red
uct
ion
perc
enta
ge
(% )
S# Sample treated Light fraction (%) Middle fraction (%) Heavy fraction (%)
1 Virgin -12 hours 35.0417 41.663 32.613
2 Virgin –24 hours 46.0575 46.673 35.307
3 Virgin –48 hours 46.0788 49.808 39.159
4 Virgin –one week 55.6818 51.854 41.957
5 Virgin - one month 59.647 55.0095 46.460
92
Removal with T.Thioxidans
The effect of inoculation time selected in case of T.putida was also studied by
cultivating the same oil fractions with T.Thioxidans. The results obtained have been
presented in Fig.11. Significant amount of this particular form of sulfur has been depleted
by this strain, which take up the sulfur from the crude oil distillates for its growth and
decreases its concentration in the oil middle. T.Thioxidans is strictly autotrophic bacteria,
which grow on sulfur present in petroleum based products, build up keto acids, and as
long as it remains inside the oil middle, it continuously decreases the sulfur concentration
(71).
The study was undertaken in the same fashion and inoculations were performed
for time duration ranges from 12 hr to a maximum of one month. The total sulphur
determined in residual samples from all these inoculations shows a considerable
depletion. From the data collected, it can easily be concluded that there is a progressive
depletion occurred when the time was extended to 12 hr, then to 24 hr, 48 hr, one week
and one month. Significant depletion can be observed in case of inoculation performed
for one month. Sulphur contents have been dropped to 0.2554, 0.2707, 0.3740 %,
0.2361, 0.2420 & 0.3404 %, 0.2217, 0.2224 & 0.3140 %, 0.2105, 0.1933 & 0.2624, and
0.2075, 0.1716 & 0.224 % , respectively in cases of 12 hr , 24 hr, 48 hr, one week and
one month in all the distillation fractions. It can also be seen from the compiled data that
the depletion is quite noticeable in case of heavy fraction when cultivated with the strain
understudy for one month where the amount of total sulphur has reduced from 0.7685 to
0.224 %.
93
The effect of bio desulphurization on some petroleum fractions has been studied
previously [72]. Our results are quite satisfactory particularly in case of heavy fraction.
Reduction percentages were also calculated to know about the percent depletion
made in each inoculation. The results are provided in Fig. 12. A depletion of 38.4508,
48.240 & 51.3337 % can be seen in case of 12hr. It has increased to 45.2458, 53.728 &
55.7059, 48.5853, 57.476, & 59 in the 24hr and 48hr inoculations, respectively.
Reduction of 51.182, 63.040 & 65.855 % and 51.878, 67.189 & 70.8522% can be
noticed in case of one week and one month inoculation time.
It was studied that 38.45, 48.24 & 51.33 % ; 6.79, 5.48 & 4.37 % ; 3.34, 3.75 &
3.44 % ; 2.6, 5.57 & 6.71 % and 0.69, 4.14 & 5.00 % reduction was being observed in
inoculation times from virgin – 12hr, 12hr – 24 hr, 24hr – 48hr, 48hr – one week and one
week – month in light, meddle and heavy fractions.
Comparing the results with the P. Putida, it is concluded that T. Thioxidans has
caused much focused desulphurization. It is therefore, suggested that T. Thioxidans is the
best sulfur removal strain for distillates fractions understudy particularly heavy fraction.
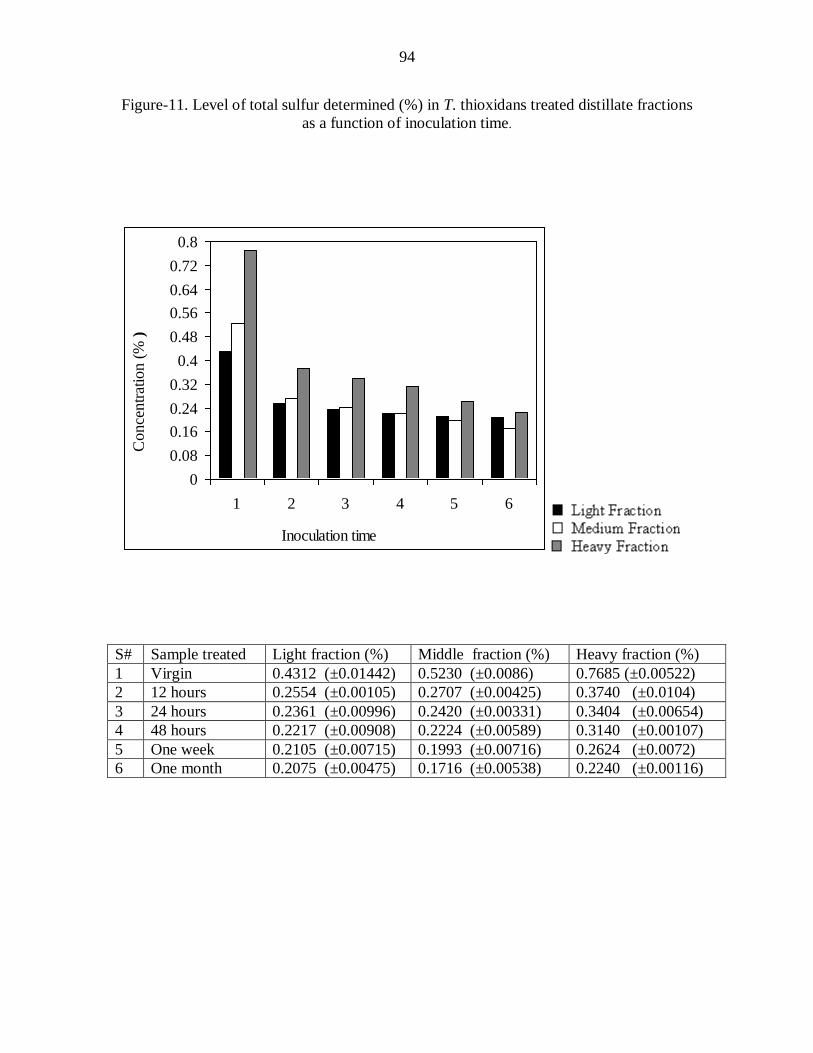
94
Figure-11. Level of total sulfur determined (%) in T. thioxidans treated distillate fractions
as a function of inoculation time.
0
0.08
0.16
0.24
0.32
0.4
0.48
0.56
0.64
0.72
0.8
1 2 3 4 5 6
Inoculation time
Conce
ntr
atio
n (
% )
S# Sample treated Light fraction (%) Middle fraction (%) Heavy fraction (%)
1 Virgin 0.4312 (±0.01442) 0.5230 (±0.0086) 0.7685 (±0.00522)
2 12 hours 0.2554 (±0.00105) 0.2707 (±0.00425) 0.3740 (±0.0104)
3 24 hours 0.2361 (±0.00996) 0.2420 (±0.00331) 0.3404 (±0.00654)
4 48 hours 0.2217 (±0.00908) 0.2224 (±0.00589) 0.3140 (±0.00107)
5 One week 0.2105 (±0.00715) 0.1993 (±0.00716) 0.2624 (±0.0072)
6 One month 0.2075 (±0.00475) 0.1716 (±0.00538) 0.2240 (±0.00116)
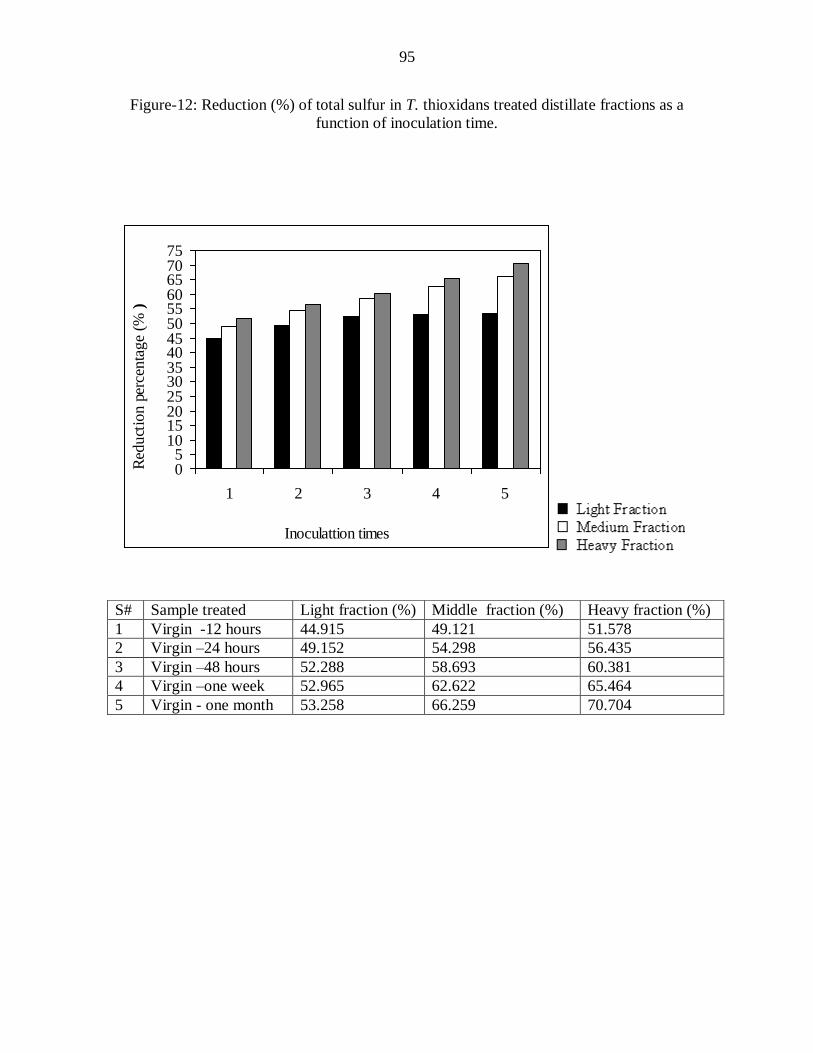
95
Figure-12: Reduction (%) of total sulfur in T. thioxidans treated distillate fractions as a
function of inoculation time.
05
1015202530354045505560657075
1 2 3 4 5
Inoculattion times
Red
uct
ion
perc
enta
ge
(% )
S# Sample treated Light fraction (%) Middle fraction (%) Heavy fraction (%)
1 Virgin -12 hours 44.915 49.121 51.578
2 Virgin –24 hours 49.152 54.298 56.435
3 Virgin –48 hours 52.288 58.693 60.381
4 Virgin –one week 52.965 62.622 65.464
5 Virgin - one month 53.258 66.259 70.704
96
3.2.3. Total sulfur in crude oil distillate fractions by bomb combustion method
Total sulfur in samples understudy was determined by bomb combustion method
(ASTM IP (61/84).
This method describes the procedure for the determination of total sulfur in
petroleum products, which cannot be burnt completely in other combustion methods.
The sample is oxidized by combustion in a bomb containing oxygen under
pressure. The sulfur, as sulfate in bomb washing is titrated with barium chloride (BaCl2)
and is determined as barium sulfate (BaSO4) gravimetrically. This is to compare the
results for the two methods for crosschecking.
Chemical removal
The contents of total sulfur determined in all the original distillate fractions were
analyzed and the cumulative data has been shown in Figur-13. The sulphur contents of
these samples were: light fraction, 0.4652 %; middle fraction, 0.5612 % and heavy
fraction, 0.7786%. The fractions were then chemically desulphurized. The sulphur was
determined in each chemically scrubbed sample. The values are graphically provided in
Fig.13. The sulphur contents determined in HCl treated samples were: 0.4344, 0.4986, &
0.7432 %, where as those determined in NaOH scrubbed samples were: 0.4235, 0.4712,
& 0.7213 %. Similarly, in case of Na2HASO4 scrubbed fractions, the values noted
were:0.3985, 0.4432, & 0.6905 %.The scrubbed fractions from NH4VO3 treatment show
0.3733 , 0.4212, & 0.6655 % sulfur levels determined in case of light , middle and heavy
fractions, respectively.
Variety of chemical reagents has been used in term of chemical desulphurization
of fuel products with different hydrodesulphurization (HDS) techniques [73].
97
Comparative investigations in the form of reduction percentages are provided in
Fig-14 for original as well as chemically treated crude oil distillates. Significant reduction
is noticed in case ammonium vendate treated samples (19.754 , 24.946 & 14.526 %)
followed by sodium arsenate (14.337 , 21.206 , & 11.315%), followed by sodium
hydroxide (8.963 , 16.037, & 7.359 %) and followed by hydrochloric acid (6.620 ,
11.154, & 4.546 %) in case of light, middle and heavy fractions, respectively.
From the data it is evident it is clear that 6.62, 11.15 & 4.54 % ; 6.30, 4.88 &
2.76h , 5.37, 4.99 & 3.96 % and 5.42, 3.92 & 3.21 % has been fonud in the cases of
virgin – HCL, HCL - NaOH, NaOH - Na2HAsO4 and Na2HAsO4 - NH4VO3 in
light, middle and heavy fractions.
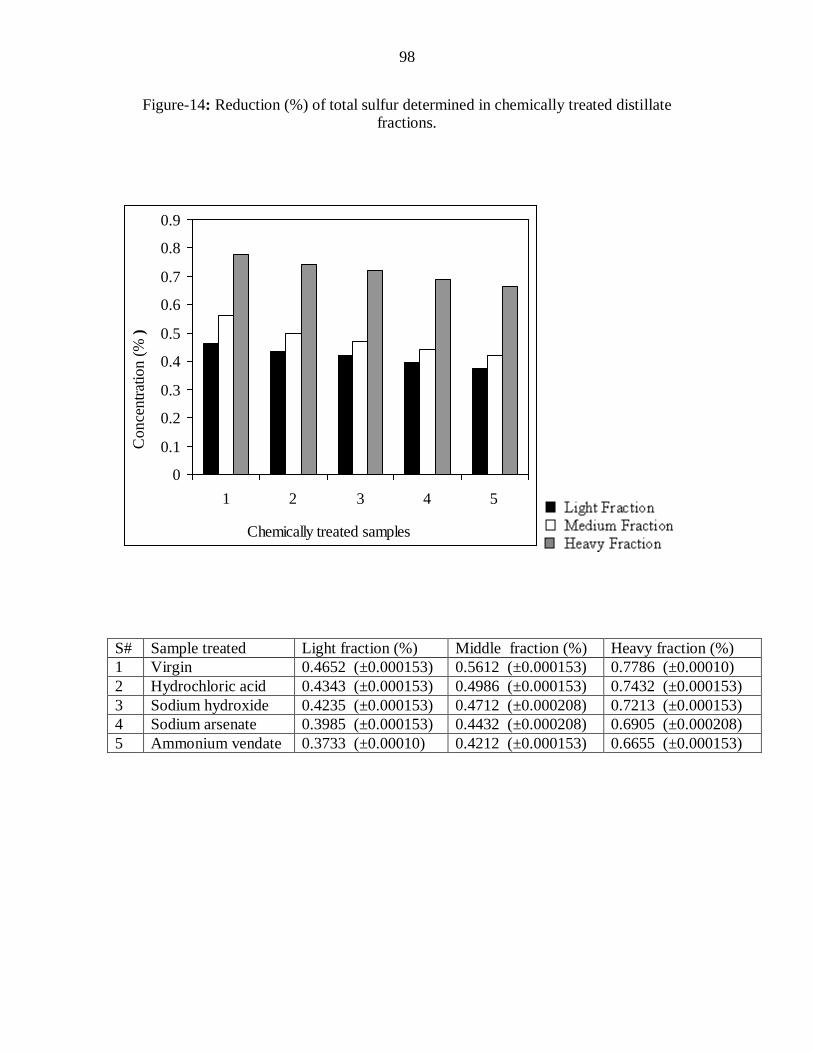
98
Figure-14: Reduction (%) of total sulfur determined in chemically treated distillate fractions.
0
0.1
0.2
0.3
0.4
0.5
0.6
0.7
0.8
0.9
1 2 3 4 5
Chemically treated samples
Con
centr
atio
n (
% )
S# Sample treated Light fraction (%) Middle fraction (%) Heavy fraction (%)
1 Virgin 0.4652 (±0.000153) 0.5612 (±0.000153) 0.7786 (±0.00010)
2 Hydrochloric acid 0.4343 (±0.000153) 0.4986 (±0.000153) 0.7432 (±0.000153)
3 Sodium hydroxide 0.4235 (±0.000153) 0.4712 (±0.000208) 0.7213 (±0.000153)
4 Sodium arsenate 0.3985 (±0.000153) 0.4432 (±0.000208) 0.6905 (±0.000208)
5 Ammonium vendate 0.3733 (±0.00010) 0.4212 (±0.000153) 0.6655 (±0.000153)
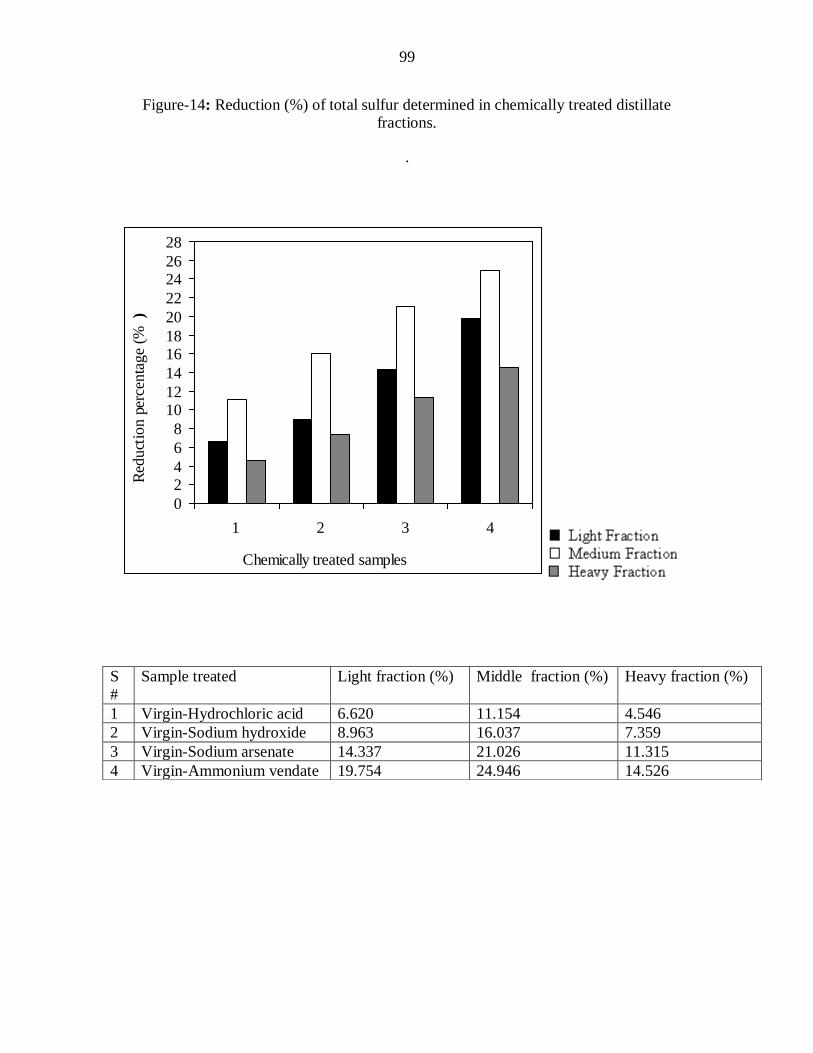
99
Figure-14: Reduction (%) of total sulfur determined in chemically treated distillate fractions.
.
0
24
6
8
1012
14
1618
20
22
2426
28
1 2 3 4
Chemically treated samples
Red
uct
ion
perc
enta
ge
(% )
S
#
Sample treated Light fraction (%) Middle fraction (%) Heavy fraction (%)
1 Virgin-Hydrochloric acid 6.620 11.154 4.546
2 Virgin-Sodium hydroxide 8.963 16.037 7.359
3 Virgin-Sodium arsenate 14.337 21.026 11.315
4 Virgin-Ammonium vendate 19.754 24.946 14.526
100
Removal of Total sulphur with P. Putida
Total sulfur removal capability of p. putida was investigated. The inoculation time
was kept same as in aforementioned investigations. The data obtained is graphically
represented in Fig.15. It can be see that in virgin sample, sulfur has reduced when it has
been kept cultivated with pseudomonas putida bacterium. In case of 12 hr inoculation
time, the total sulphur contents determined were 0.322 , 0.334 & 0.554 % compared to
their values determined in uncultivated samples (0.465 , 0.5612 and 0.778%).
The inoculation time was increased beyond 12hr to 24hr. The sulfur contents
decreased to 0.287, 0.300 and 0.434%, and then further depletion was made by this
bacteria with onward increase in inoculation time and finely during the longest contact
time (one month), sulfur contents observed were 0.199, 0.234 and 0.345 % , respectively
in light, middle and heavy fractions as shown in Fig.15.
Percent reduction between the treated and untreated samples was calculated. The
data is graphically represented in Fig.16. A significant depletion can be observed in all
inoculation times. In the initial contact time (12hr), the reduction was 30.71, 40.396 &
28.80 % determined in light, middle and heavy distillation fractions, respectively.
P. putida is a solvent tolerant microorganism, which has the potential to remove
sulfur contents from the crude oil. In the beginning, sulfur contents are available in much
more concentration, there fore; P. putida has rapidly increased its colonies in the first
cultivation time i,e 12 hr and reduced about 30.73, 40.377 % 28.53 % of the total sulfur
in light, middle and heavy fractions. Total sulphur reduction has been further increased
as long as the bacteria remained in the sample oil fraction, which may be used for its
growth. In case of 24 hr, 48 hr, one week and one month fermentation brewing time, the
101
reduction attained values of 38.17 , 46.43 , & 44.19 % ; 44.62 , 50.55 , & 48.93 %;
49.57 , 53.72 , & 51.50 % and 57.09 58.26 , & 55.59 % in light, middle and heavy
distillates, respectively as shown in Figure-16.
From the figure it seems that 30.73, 40.37 & 28.53 % ; 7.44, 6.06 & 15.66, 6.45,
4.12 & 4.74 % ; 4.95, 3.17 & 2.57 % and 7.52, 4.54 & 4.09 percent reduction has been
observed in various inoculation times from virgin – 12hr, 12hr – 24 hr, 24hr – 48hr,
48hr – one week and one week – month in light, meddle and heavy fractions.
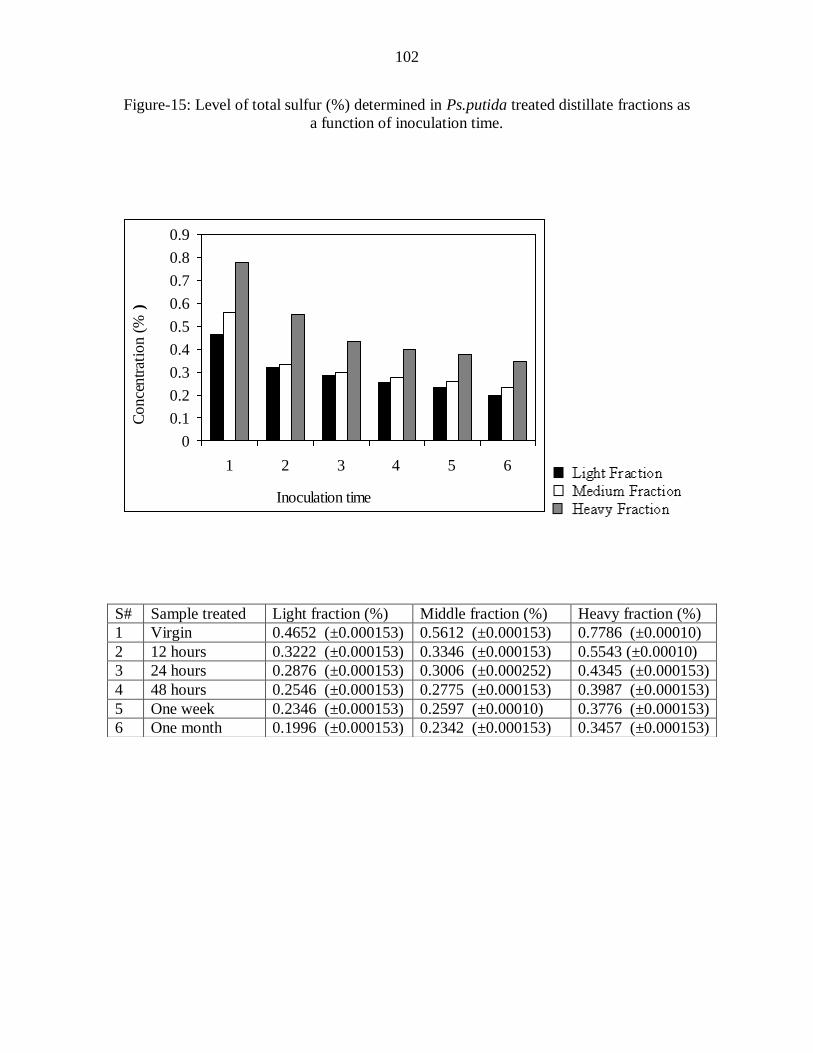
102
Figure-15: Level of total sulfur (%) determined in Ps.putida treated distillate fractions as
a function of inoculation time.
0
0.1
0.2
0.3
0.4
0.5
0.6
0.7
0.8
0.9
1 2 3 4 5 6
Inoculation time
Co
nce
ntr
atio
n (%
)
S# Sample treated Light fraction (%) Middle fraction (%) Heavy fraction (%)
1 Virgin 0.4652 (±0.000153) 0.5612 (±0.000153) 0.7786 (±0.00010)
2 12 hours 0.3222 (±0.000153) 0.3346 (±0.000153) 0.5543 (±0.00010)
3 24 hours 0.2876 (±0.000153) 0.3006 (±0.000252) 0.4345 (±0.000153)
4 48 hours 0.2546 (±0.000153) 0.2775 (±0.000153) 0.3987 (±0.000153)
5 One week 0.2346 (±0.000153) 0.2597 (±0.00010) 0.3776 (±0.000153)
6 One month 0.1996 (±0.000153) 0.2342 (±0.000153) 0.3457 (±0.000153)
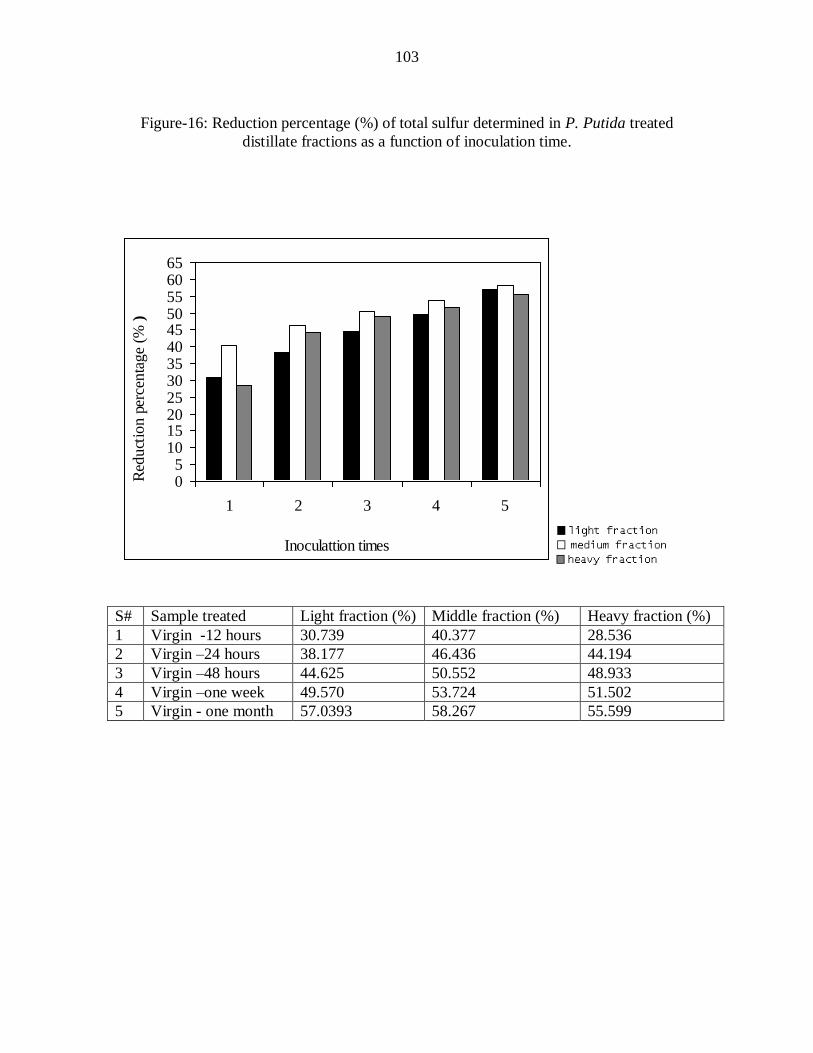
103
Figure-16: Reduction percentage (%) of total sulfur determined in P. Putida treated
distillate fractions as a function of inoculation time.
05
101520253035404550556065
1 2 3 4 5
Inoculattion times
Red
uct
ion
perc
enta
ge
(% )
S# Sample treated Light fraction (%) Middle fraction (%) Heavy fraction (%)
1 Virgin -12 hours 30.739 40.377 28.536
2 Virgin –24 hours 38.177 46.436 44.194
3 Virgin –48 hours 44.625 50.552 48.933
4 Virgin –one week 49.570 53.724 51.502
5 Virgin - one month 57.0393 58.267 55.599
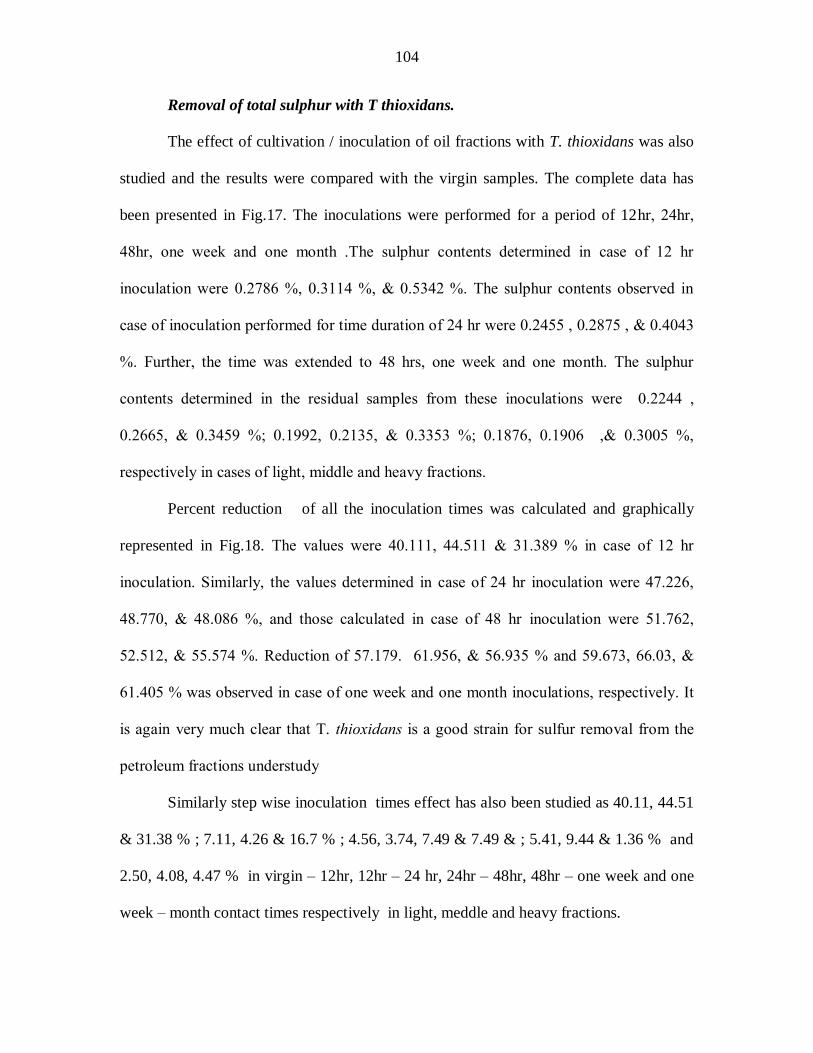
104
Removal of total sulphur with T thioxidans.
The effect of cultivation / inoculation of oil fractions with T. thioxidans was also
studied and the results were compared with the virgin samples. The complete data has
been presented in Fig.17. The inoculations were performed for a period of 12hr, 24hr,
48hr, one week and one month .The sulphur contents determined in case of 12 hr
inoculation were 0.2786 %, 0.3114 %, & 0.5342 %. The sulphur contents observed in
case of inoculation performed for time duration of 24 hr were 0.2455 , 0.2875 , & 0.4043
%. Further, the time was extended to 48 hrs, one week and one month. The sulphur
contents determined in the residual samples from these inoculations were 0.2244 ,
0.2665, & 0.3459 %; 0.1992, 0.2135, & 0.3353 %; 0.1876, 0.1906 ,& 0.3005 %,
respectively in cases of light, middle and heavy fractions.
Percent reduction of all the inoculation times was calculated and graphically
represented in Fig.18. The values were 40.111, 44.511 & 31.389 % in case of 12 hr
inoculation. Similarly, the values determined in case of 24 hr inoculation were 47.226,
48.770, & 48.086 %, and those calculated in case of 48 hr inoculation were 51.762,
52.512, & 55.574 %. Reduction of 57.179. 61.956, & 56.935 % and 59.673, 66.03, &
61.405 % was observed in case of one week and one month inoculations, respectively. It
is again very much clear that T. thioxidans is a good strain for sulfur removal from the
petroleum fractions understudy
Similarly step wise inoculation times effect has also been studied as 40.11, 44.51
& 31.38 % ; 7.11, 4.26 & 16.7 % ; 4.56, 3.74, 7.49 & 7.49 & ; 5.41, 9.44 & 1.36 % and
2.50, 4.08, 4.47 % in virgin – 12hr, 12hr – 24 hr, 24hr – 48hr, 48hr – one week and one
week – month contact times respectively in light, meddle and heavy fractions.
105
Figure-17: Level of total sulfur (%) determined in T. thioxidans treated distillate fractions
as a function of inoculation time
0
0.1
0.2
0.3
0.4
0.5
0.6
0.7
0.8
0.9
1 2 3 4 5 6
Inoculation time
Conce
ntr
atio
n (%
)
S# Sample treated Light fraction (%) Middle fraction (%) Heavy fraction (%)
1 Virgin 0.4652 (±0.000153) 0.5612 (±0.000153) 0.7786 (±0.00010)
2 12 hours 0.2786 (±0.000252) 0.3114 (±0.000252) 0.5342 (±0.000153)
3 24 hours 0.2455 (±0.000208) 0.2875 (±0.000153) 0.4043 (±0.00010)
4 48 hours 0.2244 (±0.000208) 0.2665 (±0.000153) 0.3459 (±0.000153)
5 One week 0.1992 (±0.000153) 0.2135 (±0.000153) 0.3353 (±0.00020)
6 One month 0.1876 (±0.00020) 0.1906 (±0.000153) 0.3005 (±0.000153)
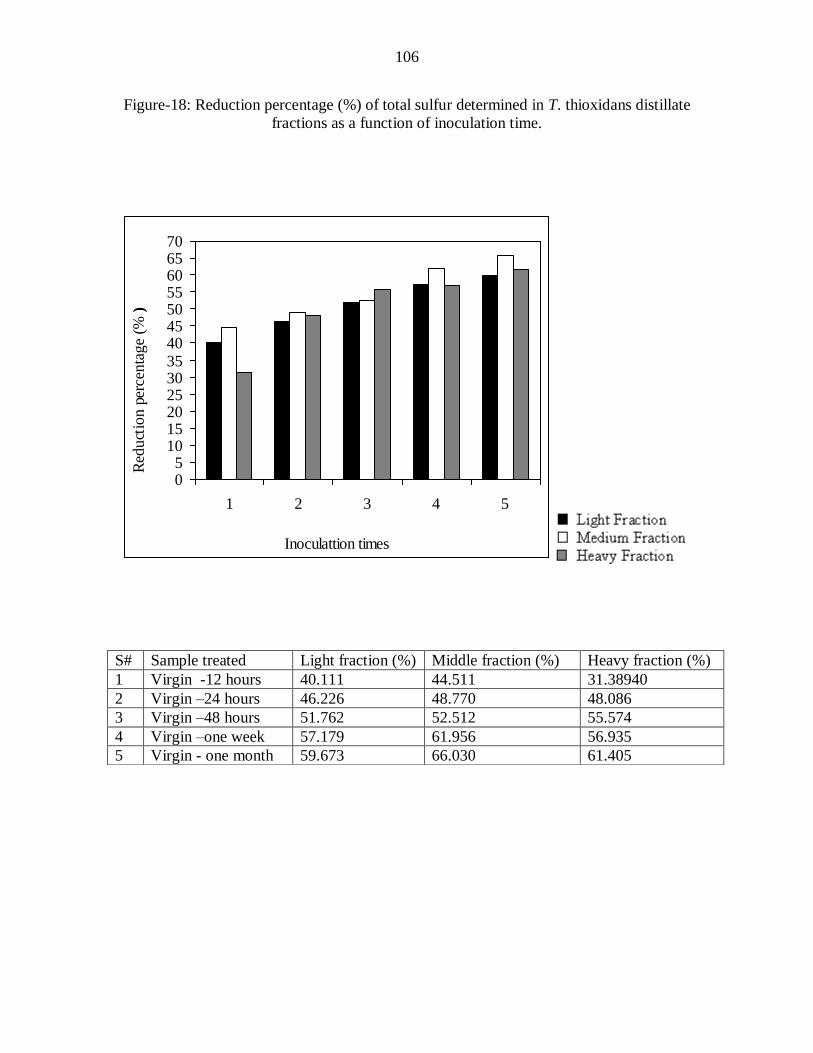
106
Figure-18: Reduction percentage (%) of total sulfur determined in T. thioxidans distillate
fractions as a function of inoculation time.
05
10152025303540455055606570
1 2 3 4 5
Inoculattion times
Red
uct
ion
perc
enta
ge
(% )
S# Sample treated Light fraction (%) Middle fraction (%) Heavy fraction (%)
1 Virgin -12 hours 40.111 44.511 31.38940
2 Virgin –24 hours 46.226 48.770 48.086
3 Virgin –48 hours 51.762 52.512 55.574
4 Virgin –one week 57.179 61.956 56.935
5 Virgin - one month 59.673 66.030 61.405
107
3.2.5 Desulphurization of Elemental sulfur in crude oil distillates fractions.
A rapid and accurate method for the determination of elemental sulfur in
hydrocarbons has been adopted in this section because it has been found that in acetone
solution, sulfur react rapidly.
Chemical removal of elemental sulphur
Various oil fractions i.e. light, middle and heavy fractions were chemically
scrubbed to view the influence of each chemical reagent on elemental sulphur removal.
The elemental sulfur contents were determined in virgin samples (untreated) and residual
fractions from each chemical treatment. The data is presented in Fig.19. The sulphur
levels found in original samples were 63.422, 49.380 & 45.929 ppm. After the chemical
treatment, these values were decreased to 55.715 , 44.042, & 43.228 ppm in case of
scrubbing the fractions with HCl. NaOH was also used to evaluate its elemental sulphur
removing capability. The elemental sulphur contents determined in residual oil samples
from this treatment were 53.470, 42.079 & 38.597 ppm, Na2HAsO4 and NH4VO3 were
used as sulphur scrubbing agents. The sulphur contents determined in the residual
samples from these treatments were 50.762, 37.347, & 35.070 ppm, in case of Na2HAsO4
treatment and 46.574, 34.459, & 31.231 ppm in case of NH4VO3 treatment. This UV
spectra of virgin and variously chemically treated, fractions as provided in profilies-1 to
profiles-3 for light, middle and heavy fractions, respectively. It was found that up to some
extent, desulphurization has been made by the chemicals reagents used as shown by the
decrease in the intensity of corresponding absorption bands in the UV profiles.
A variety of the chemical catalysts have been designed, which has the ability to
remove sulfurous compounds from the petroleum based products. These chemicals
108
accelerate the C-S cracking activities to cause the maximum desulphurization of the
crude oils [74].
Percent reduction was calculated in each case and plotted in Fig. 20. It is seen that
considerable amount of sulphur was removed by ammonium vendate i,e 26.564, 30.216
& 32.000 % in case of light, middle and heavy fractions, respectively. Sodium arsenate
caused 19.960, 24.360 & 23.643 % while sodium hydroxides caused 15.691 , 14.785 &
16.068 % and hydrochloric acid caused 12.151, 10.511 & 5.880 % sulfur removal in
light, middle and heavy fractions, respectively.
It was found that 12.15, 10.811 & 5.88 % ; 3.54, 3.97 & 10.18 % ; 4.27, 9.58 &
7.58 % and 6.66, 5.58 & 8.36 % in the cases of virgin – HCL , HCL – NaOH, NaOH-
Na2HAsO4 and Na2HAsO4- NH4VO3 in light , middle and heavy fractions.
Figure-19. Level of elemental sulfur (%) determined in virgin and chemically
treated distillate fractions
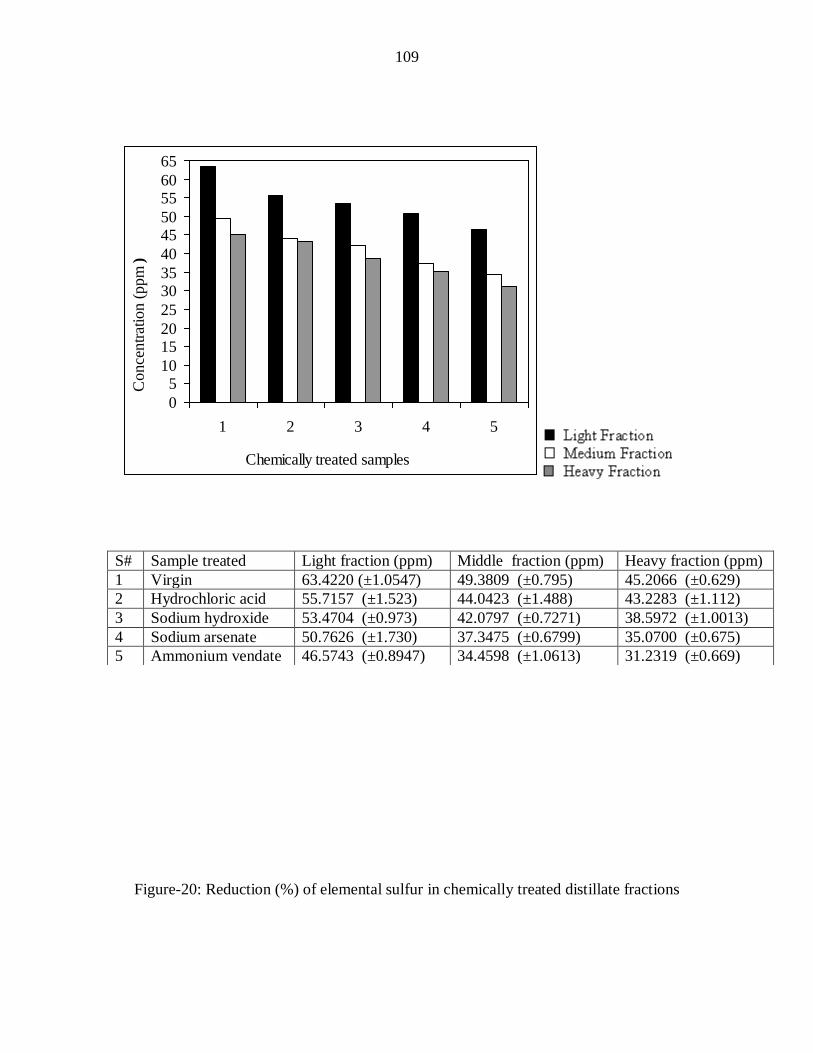
109
0
510
1520
25
3035
40
4550
5560
65
1 2 3 4 5
Chemically treated samples
Co
nce
ntr
atio
n (
pp
m )
Figure-20: Reduction (%) of elemental sulfur in chemically treated distillate fractions
S# Sample treated Light fraction (ppm) Middle fraction (ppm) Heavy fraction (ppm)
1 Virgin 63.4220 (±1.0547) 49.3809 (±0.795) 45.2066 (±0.629)
2 Hydrochloric acid 55.7157 (±1.523) 44.0423 (±1.488) 43.2283 (±1.112)
3 Sodium hydroxide 53.4704 (±0.973) 42.0797 (±0.7271) 38.5972 (±1.0013)
4 Sodium arsenate 50.7626 (±1.730) 37.3475 (±0.6799) 35.0700 (±0.675)
5 Ammonium vendate 46.5743 (±0.8947) 34.4598 (±1.0613) 31.2319 (±0.669)
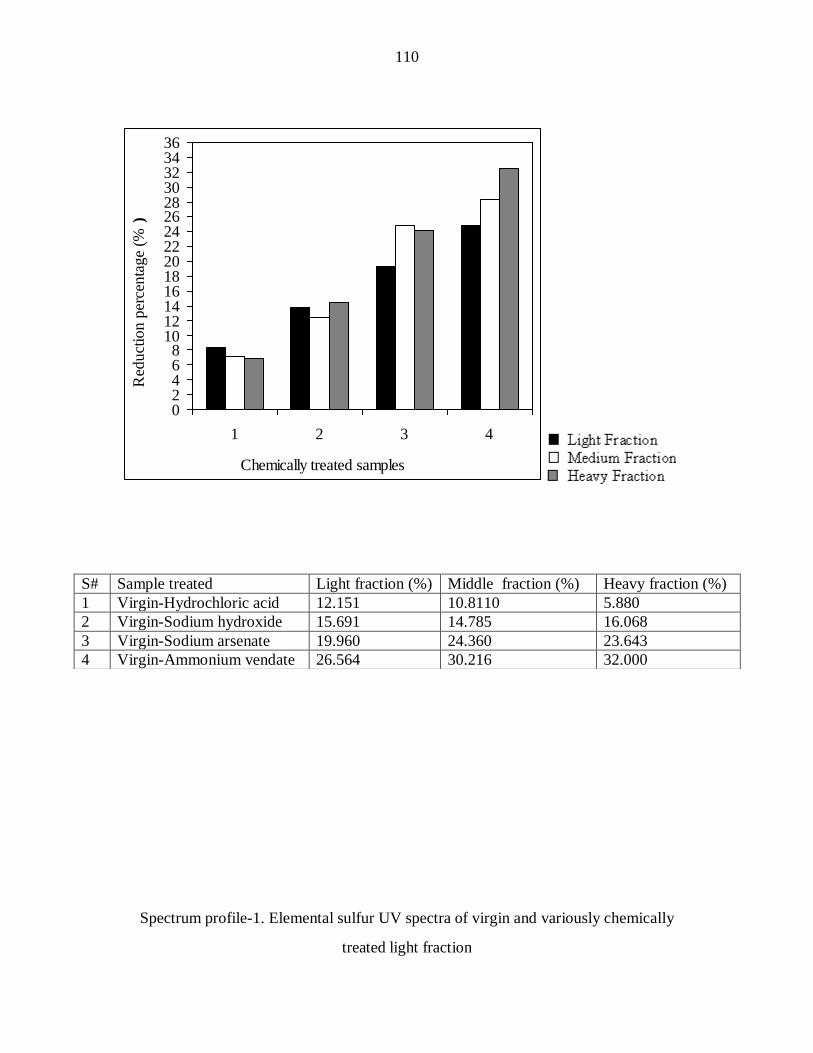
110
02468
1012141618202224262830323436
1 2 3 4
Chemically treated samples
Red
uct
ion p
erce
nta
ge
(% )
Spectrum profile-1. Elemental sulfur UV spectra of virgin and variously chemically
treated light fraction
S# Sample treated Light fraction (%) Middle fraction (%) Heavy fraction (%)
1 Virgin-Hydrochloric acid 12.151 10.8110 5.880
2 Virgin-Sodium hydroxide 15.691 14.785 16.068
3 Virgin-Sodium arsenate 19.960 24.360 23.643
4 Virgin-Ammonium vendate 26.564 30.216 32.000
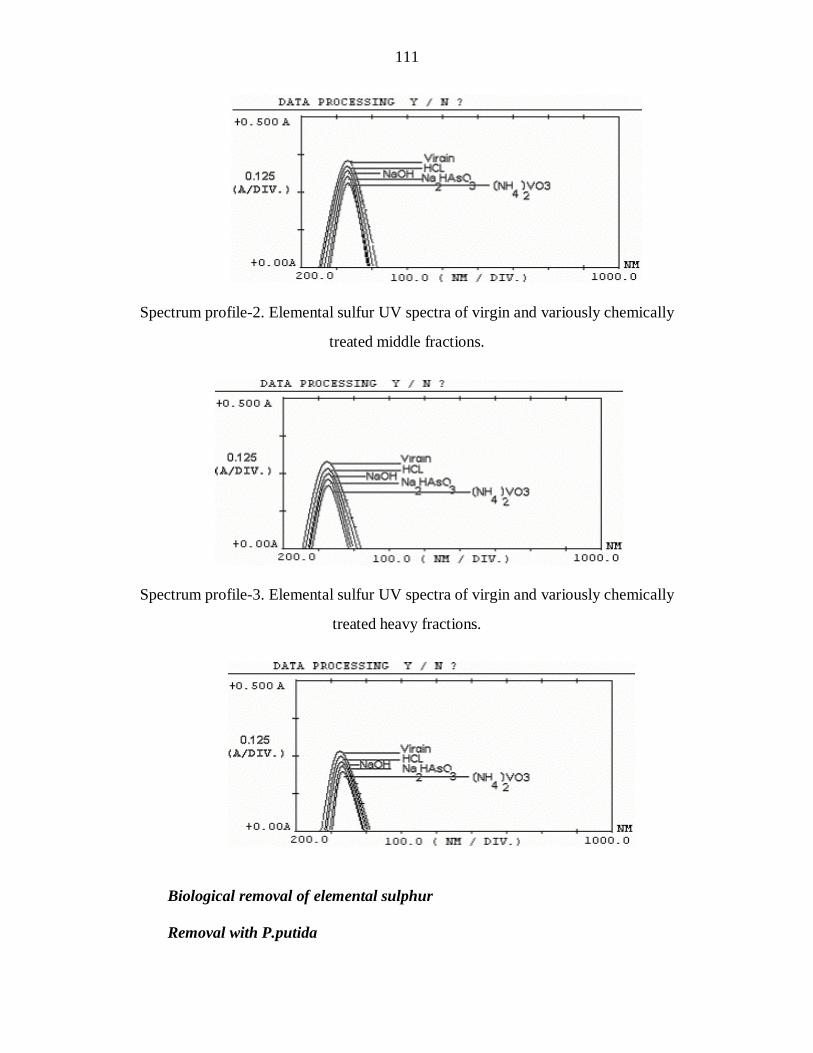
111
Spectrum profile-2. Elemental sulfur UV spectra of virgin and variously chemically
treated middle fractions.
Spectrum profile-3. Elemental sulfur UV spectra of virgin and variously chemically
treated heavy fractions.
Biological removal of elemental sulphur
Removal with P.putida
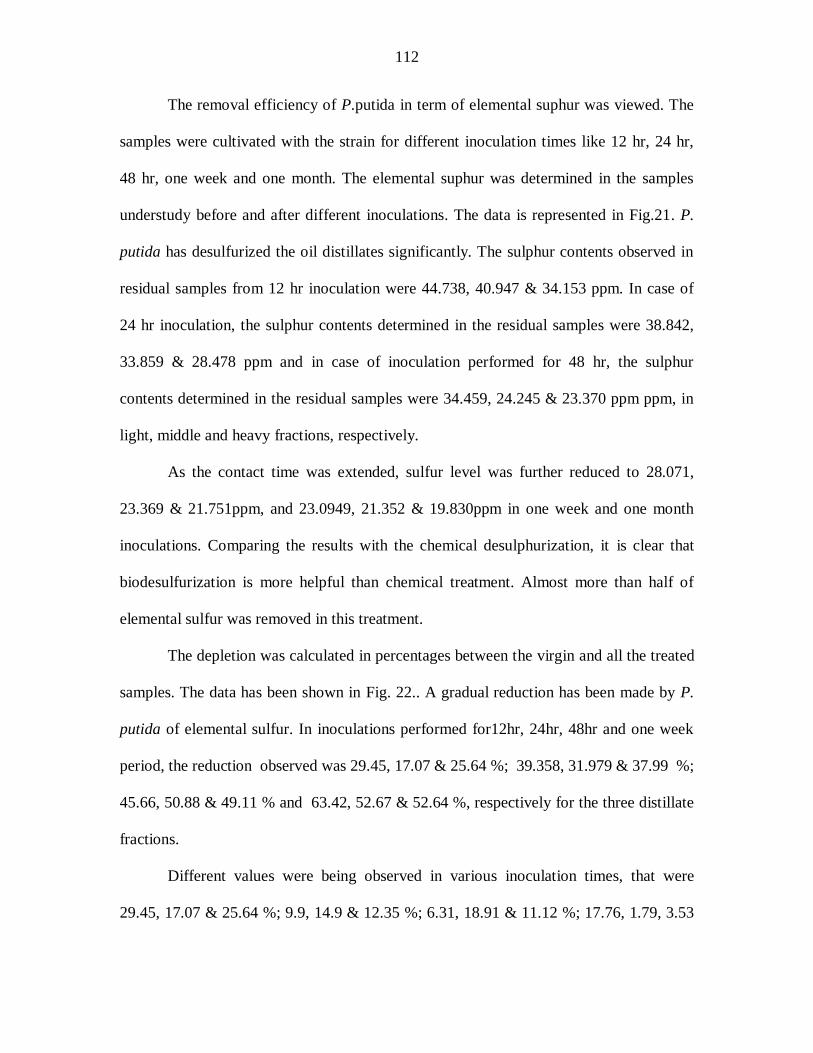
112
The removal efficiency of P.putida in term of elemental suphur was viewed. The
samples were cultivated with the strain for different inoculation times like 12 hr, 24 hr,
48 hr, one week and one month. The elemental suphur was determined in the samples
understudy before and after different inoculations. The data is represented in Fig.21. P.
putida has desulfurized the oil distillates significantly. The sulphur contents observed in
residual samples from 12 hr inoculation were 44.738, 40.947 & 34.153 ppm. In case of
24 hr inoculation, the sulphur contents determined in the residual samples were 38.842,
33.859 & 28.478 ppm and in case of inoculation performed for 48 hr, the sulphur
contents determined in the residual samples were 34.459, 24.245 & 23.370 ppm ppm, in
light, middle and heavy fractions, respectively.
As the contact time was extended, sulfur level was further reduced to 28.071,
23.369 & 21.751ppm, and 23.0949, 21.352 & 19.830ppm in one week and one month
inoculations. Comparing the results with the chemical desulphurization, it is clear that
biodesulfurization is more helpful than chemical treatment. Almost more than half of
elemental sulfur was removed in this treatment.
The depletion was calculated in percentages between the virgin and all the treated
samples. The data has been shown in Fig. 22.. A gradual reduction has been made by P.
putida of elemental sulfur. In inoculations performed for12hr, 24hr, 48hr and one week
period, the reduction observed was 29.45, 17.07 & 25.64 %; 39.358, 31.979 & 37.99 %;
45.66, 50.88 & 49.11 % and 63.42, 52.67 & 52.64 %, respectively for the three distillate
fractions.
Different values were being observed in various inoculation times, that were
29.45, 17.07 & 25.64 %; 9.9, 14.9 & 12.35 %; 6.31, 18.91 & 11.12 %; 17.76, 1.79, 3.53
113
% and 0.16, 4.08 & 3.96 %. % in virgin – 12hr, 12hr – 24 hr, 24hr – 48hr, 48hr – one
week and one week – month contact times respectively in light, meddle and heavy
fractions.
Maximum reduction has been made by one month inoculation. The depletion can
be seen as in the form of decline in the intensity of the corresponding bands in VU
spectrum profilies-4 to spectrum profiles-6 for all the three distillates.
Figure-21. Level of elemental sulfur (ppm) determined in P.putida treated distillate
fractions as a function of inoculation time.
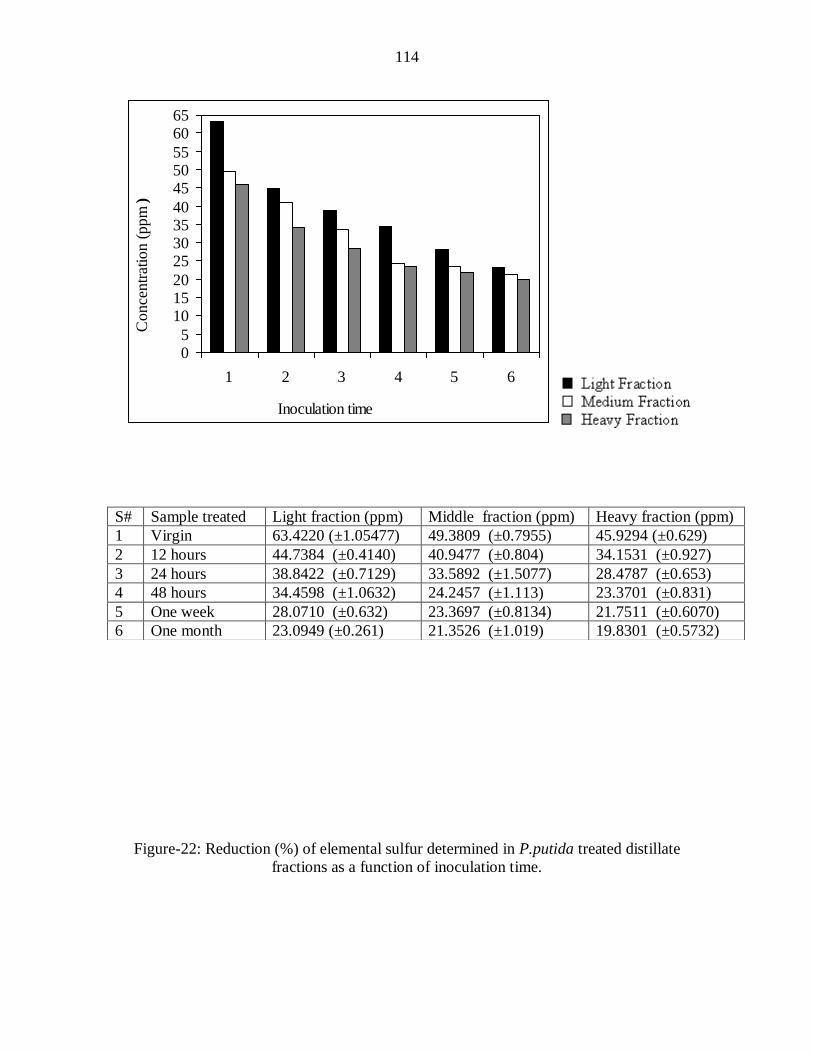
114
05
101520
25303540
455055
6065
1 2 3 4 5 6
Inoculation time
Conce
ntr
atio
n (
ppm
)
Figure-22: Reduction (%) of elemental sulfur determined in P.putida treated distillate
fractions as a function of inoculation time.
S# Sample treated Light fraction (ppm) Middle fraction (ppm) Heavy fraction (ppm)
1 Virgin 63.4220 (±1.05477) 49.3809 (±0.7955) 45.9294 (±0.629)
2 12 hours 44.7384 (±0.4140) 40.9477 (±0.804) 34.1531 (±0.927)
3 24 hours 38.8422 (±0.7129) 33.5892 (±1.5077) 28.4787 (±0.653)
4 48 hours 34.4598 (±1.0632) 24.2457 (±1.113) 23.3701 (±0.831)
5 One week 28.0710 (±0.632) 23.3697 (±0.8134) 21.7511 (±0.6070)
6 One month 23.0949 (±0.261) 21.3526 (±1.019) 19.8301 (±0.5732)
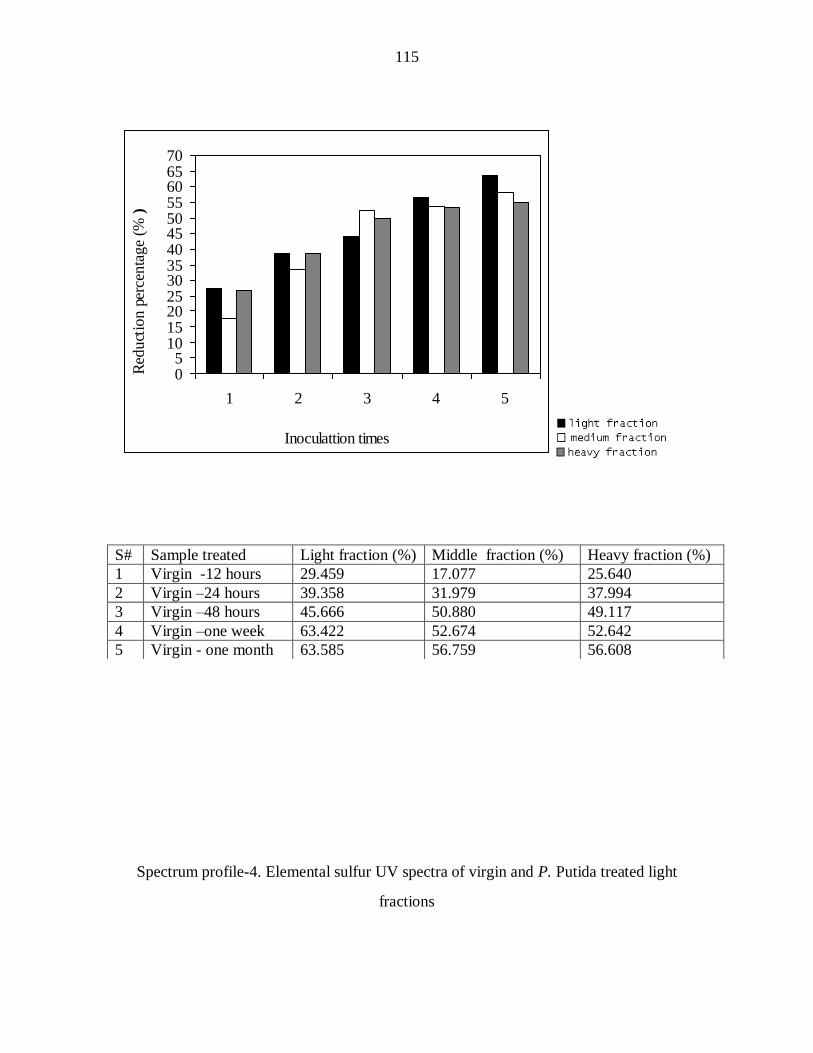
115
05
10152025303540455055606570
1 2 3 4 5
Inoculattion times
Red
uct
ion
perc
enta
ge
(% )
Spectrum profile-4. Elemental sulfur UV spectra of virgin and P. Putida treated light
fractions
S# Sample treated Light fraction (%) Middle fraction (%) Heavy fraction (%)
1 Virgin -12 hours 29.459 17.077 25.640
2 Virgin –24 hours 39.358 31.979 37.994
3 Virgin –48 hours 45.666 50.880 49.117
4 Virgin –one week 63.422 52.674 52.642
5 Virgin - one month 63.585 56.759 56.608
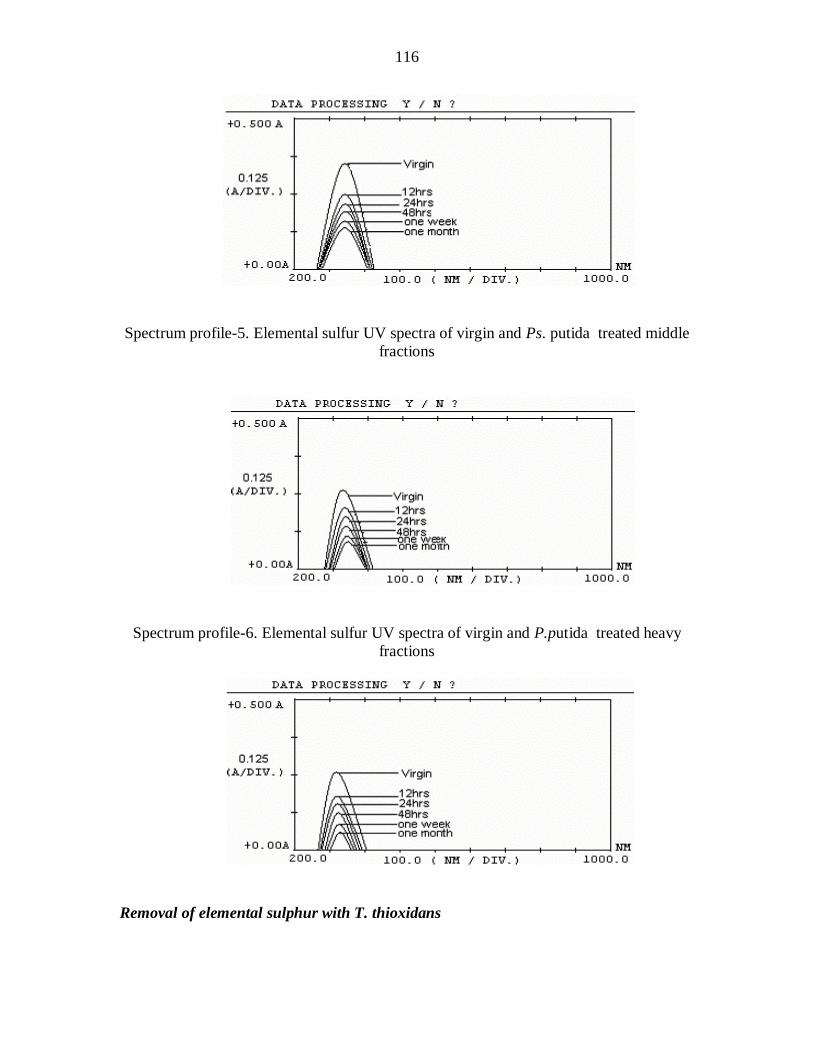
116
Spectrum profile-5. Elemental sulfur UV spectra of virgin and Ps. putida treated middle
fractions
Spectrum profile-6. Elemental sulfur UV spectra of virgin and P.putida treated heavy
fractions
Removal of elemental sulphur with T. thioxidans
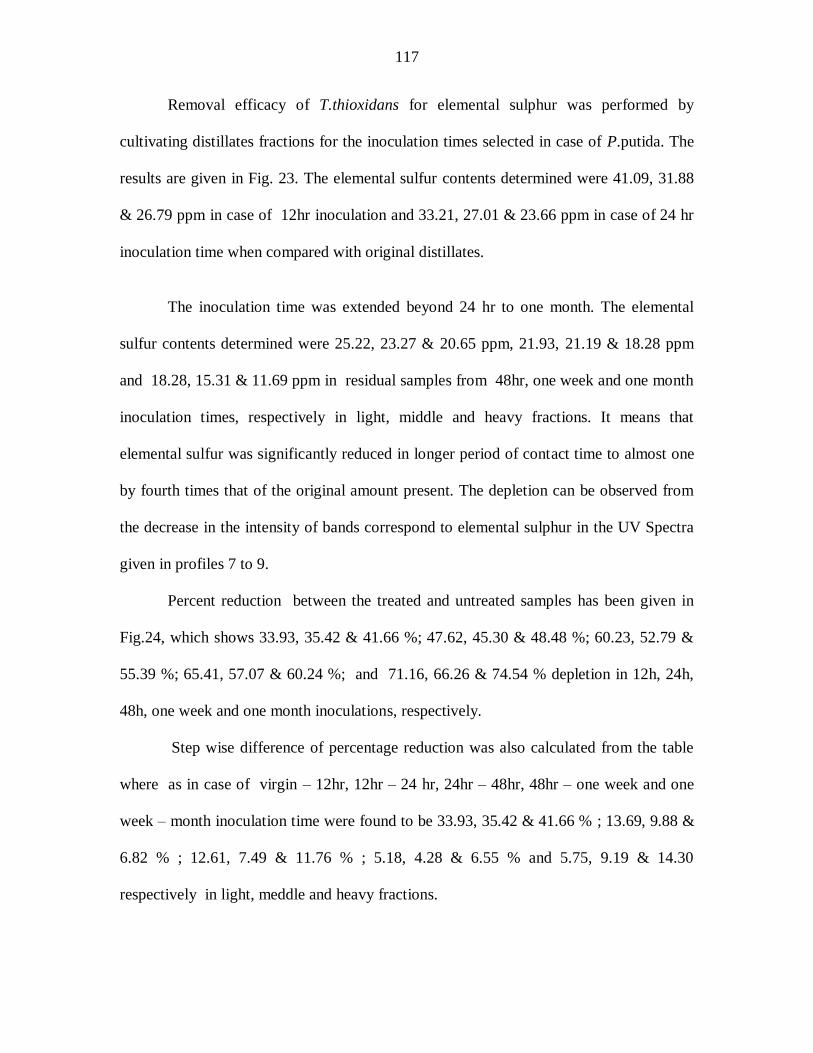
117
Removal efficacy of T.thioxidans for elemental sulphur was performed by
cultivating distillates fractions for the inoculation times selected in case of P.putida. The
results are given in Fig. 23. The elemental sulfur contents determined were 41.09, 31.88
& 26.79 ppm in case of 12hr inoculation and 33.21, 27.01 & 23.66 ppm in case of 24 hr
inoculation time when compared with original distillates.
The inoculation time was extended beyond 24 hr to one month. The elemental
sulfur contents determined were 25.22, 23.27 & 20.65 ppm, 21.93, 21.19 & 18.28 ppm
and 18.28, 15.31 & 11.69 ppm in residual samples from 48hr, one week and one month
inoculation times, respectively in light, middle and heavy fractions. It means that
elemental sulfur was significantly reduced in longer period of contact time to almost one
by fourth times that of the original amount present. The depletion can be observed from
the decrease in the intensity of bands correspond to elemental sulphur in the UV Spectra
given in profiles 7 to 9.
Percent reduction between the treated and untreated samples has been given in
Fig.24, which shows 33.93, 35.42 & 41.66 %; 47.62, 45.30 & 48.48 %; 60.23, 52.79 &
55.39 %; 65.41, 57.07 & 60.24 %; and 71.16, 66.26 & 74.54 % depletion in 12h, 24h,
48h, one week and one month inoculations, respectively.
Step wise difference of percentage reduction was also calculated from the table
where as in case of virgin – 12hr, 12hr – 24 hr, 24hr – 48hr, 48hr – one week and one
week – month inoculation time were found to be 33.93, 35.42 & 41.66 % ; 13.69, 9.88 &
6.82 % ; 12.61, 7.49 & 11.76 % ; 5.18, 4.28 & 6.55 % and 5.75, 9.19 & 14.30
respectively in light, meddle and heavy fractions.
118
Elemental sulfur reduction percentage has been found to be increased along with
increase in fermentation time, because T.Thiooxidans cells oxidizes elemental sulfur to
sulfite, with 1 mol of O2 consumption per mol of sulfur oxidized to sulfite (75).
(S + bacteria +O2 + H2O SO3-2)
Figure-23.Level of elemental sulfur (ppm) determined in T. thioxidans treated sample as
a function of inoculation time.
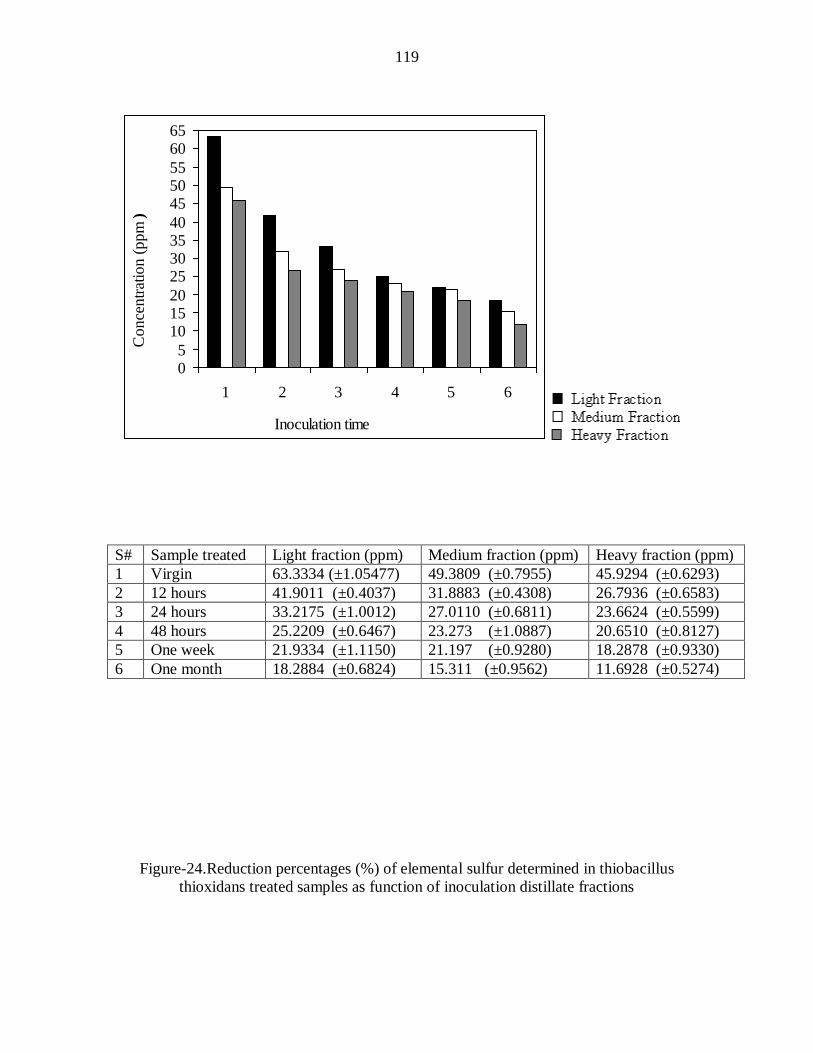
119
05
101520
25303540
455055
6065
1 2 3 4 5 6
Inoculation time
Conce
ntr
atio
n (
ppm
)
Figure-24.Reduction percentages (%) of elemental sulfur determined in thiobacillus
thioxidans treated samples as function of inoculation distillate fractions
S# Sample treated Light fraction (ppm) Medium fraction (ppm) Heavy fraction (ppm)
1 Virgin 63.3334 (±1.05477) 49.3809 (±0.7955) 45.9294 (±0.6293)
2 12 hours 41.9011 (±0.4037) 31.8883 (±0.4308) 26.7936 (±0.6583)
3 24 hours 33.2175 (±1.0012) 27.0110 (±0.6811) 23.6624 (±0.5599)
4 48 hours 25.2209 (±0.6467) 23.273 (±1.0887) 20.6510 (±0.8127)
5 One week 21.9334 (±1.1150) 21.197 (±0.9280) 18.2878 (±0.9330)
6 One month 18.2884 (±0.6824) 15.311 (±0.9562) 11.6928 (±0.5274)
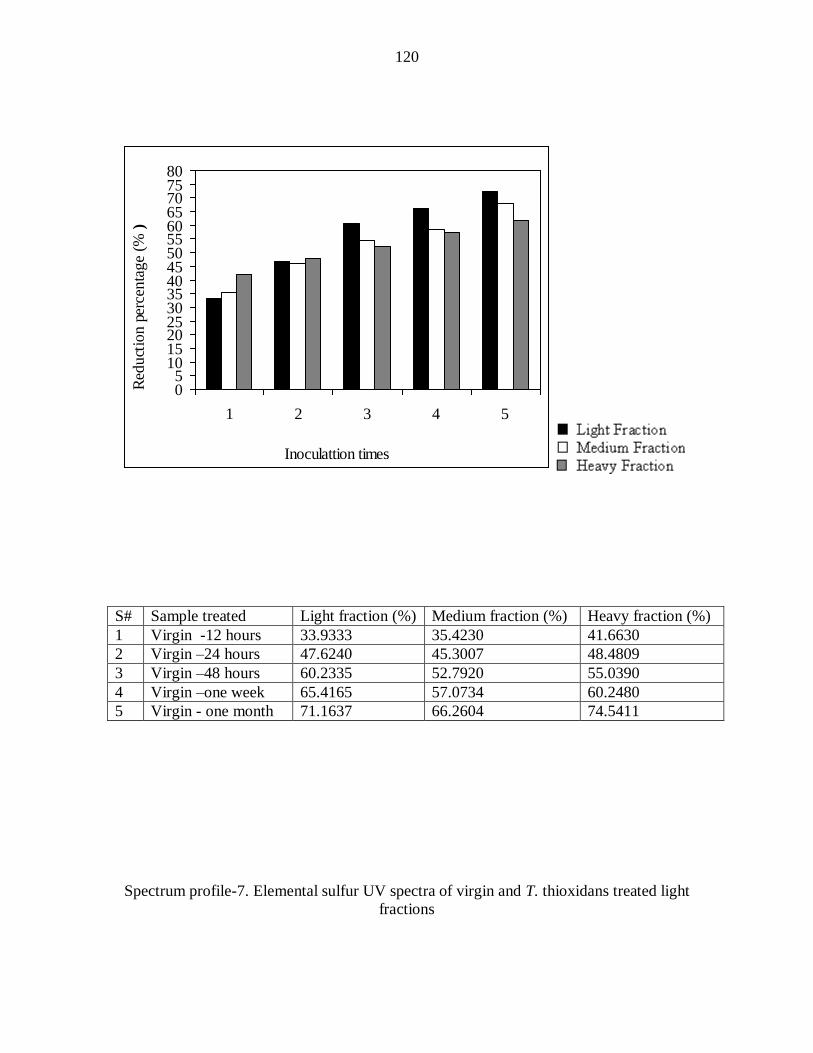
120
05
101520253035404550556065707580
1 2 3 4 5
Inoculattion times
Red
uct
ion
perc
enta
ge
(% )
Spectrum profile-7. Elemental sulfur UV spectra of virgin and T. thioxidans treated light
fractions
S# Sample treated Light fraction (%) Medium fraction (%) Heavy fraction (%)
1 Virgin -12 hours 33.9333 35.4230 41.6630
2 Virgin –24 hours 47.6240 45.3007 48.4809
3 Virgin –48 hours 60.2335 52.7920 55.0390
4 Virgin –one week 65.4165 57.0734 60.2480
5 Virgin - one month 71.1637 66.2604 74.5411
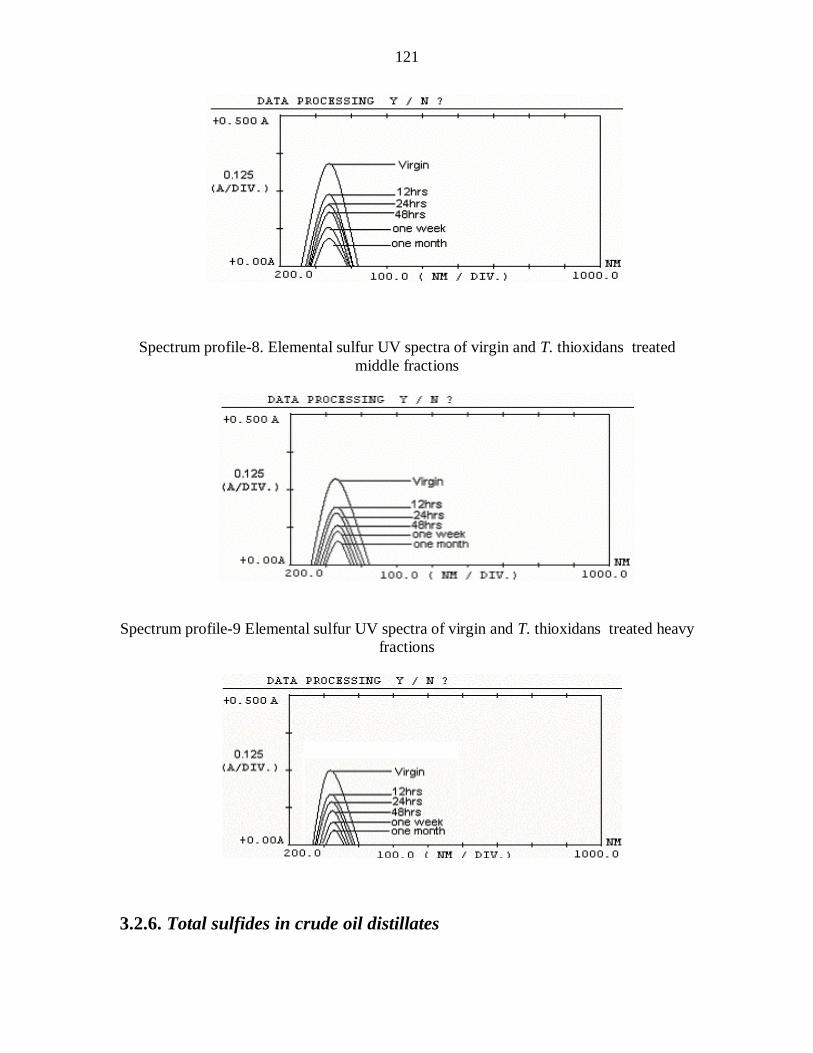
121
Spectrum profile-8. Elemental sulfur UV spectra of virgin and T. thioxidans treated
middle fractions
Spectrum profile-9 Elemental sulfur UV spectra of virgin and T. thioxidans treated heavy
fractions
3.2.6. Total sulfides in crude oil distillates
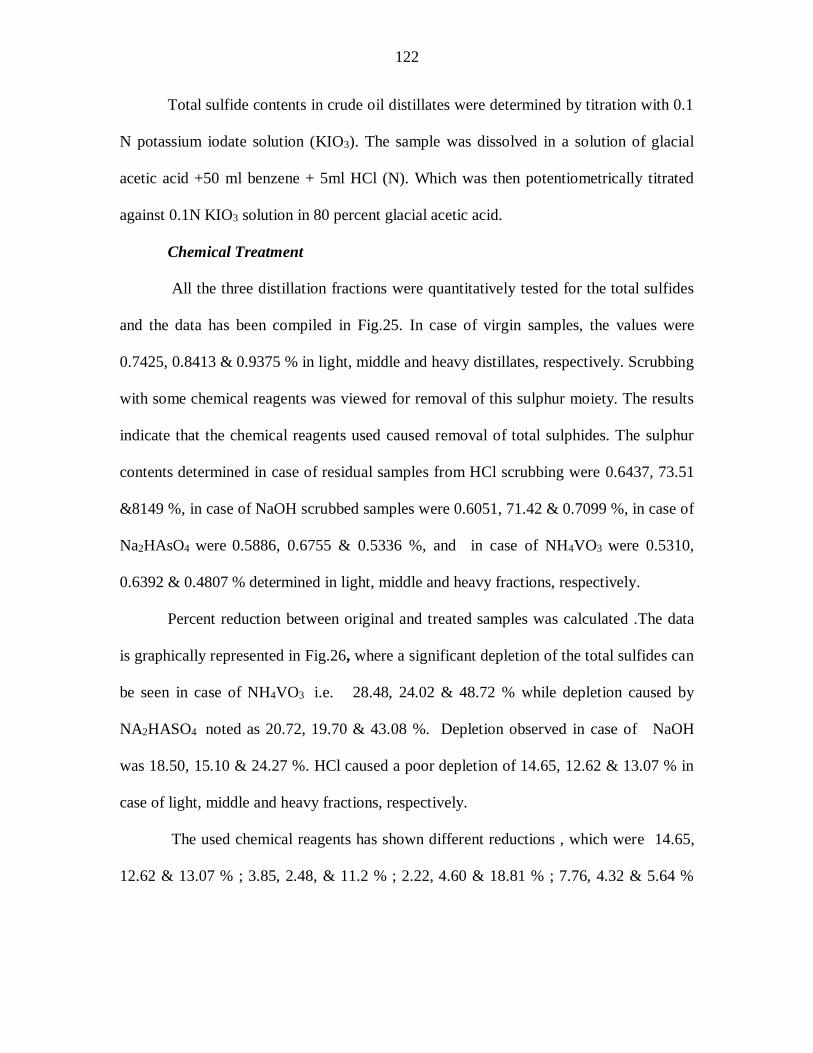
122
Total sulfide contents in crude oil distillates were determined by titration with 0.1
N potassium iodate solution (KIO3). The sample was dissolved in a solution of glacial
acetic acid +50 ml benzene + 5ml HCl (N). Which was then potentiometrically titrated
against 0.1N KIO3 solution in 80 percent glacial acetic acid.
Chemical Treatment
All the three distillation fractions were quantitatively tested for the total sulfides
and the data has been compiled in Fig.25. In case of virgin samples, the values were
0.7425, 0.8413 & 0.9375 % in light, middle and heavy distillates, respectively. Scrubbing
with some chemical reagents was viewed for removal of this sulphur moiety. The results
indicate that the chemical reagents used caused removal of total sulphides. The sulphur
contents determined in case of residual samples from HCl scrubbing were 0.6437, 73.51
&8149 %, in case of NaOH scrubbed samples were 0.6051, 71.42 & 0.7099 %, in case of
Na2HAsO4 were 0.5886, 0.6755 & 0.5336 %, and in case of NH4VO3 were 0.5310,
0.6392 & 0.4807 % determined in light, middle and heavy fractions, respectively.
Percent reduction between original and treated samples was calculated .The data
is graphically represented in Fig.26, where a significant depletion of the total sulfides can
be seen in case of NH4VO3 i.e. 28.48, 24.02 & 48.72 % while depletion caused by
NA2HASO4 noted as 20.72, 19.70 & 43.08 %. Depletion observed in case of NaOH
was 18.50, 15.10 & 24.27 %. HCl caused a poor depletion of 14.65, 12.62 & 13.07 % in
case of light, middle and heavy fractions, respectively.
The used chemical reagents has shown different reductions , which were 14.65,
12.62 & 13.07 % ; 3.85, 2.48, & 11.2 % ; 2.22, 4.60 & 18.81 % ; 7.76, 4.32 & 5.64 %

123
cases of virgin – HCL , HCL – NaOH, NaOH- Na2HAsO4 and Na2HAsO4- NH4VO3
in light , middle and heavy fractions.
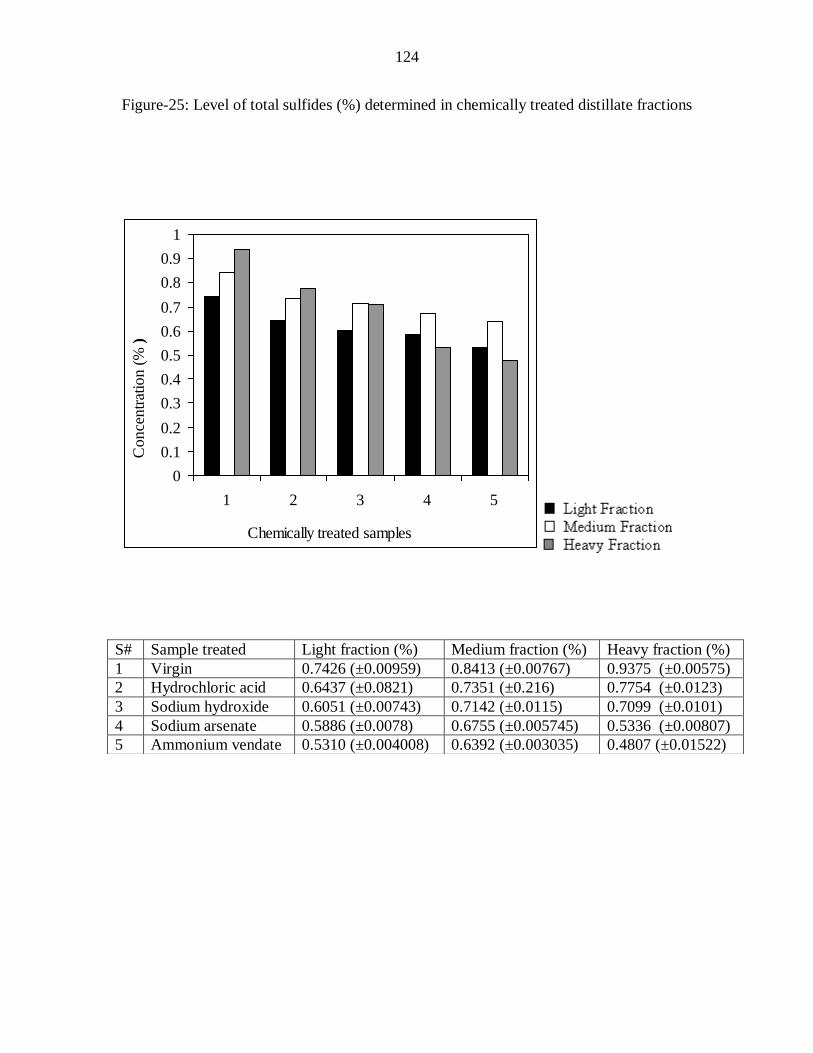
124
Figure-25: Level of total sulfides (%) determined in chemically treated distillate fractions
0
0.1
0.2
0.3
0.4
0.5
0.6
0.7
0.8
0.9
1
1 2 3 4 5
Chemically treated samples
Co
nce
ntr
atio
n (
% )
S# Sample treated Light fraction (%) Medium fraction (%) Heavy fraction (%)
1 Virgin 0.7426 (±0.00959) 0.8413 (±0.00767) 0.9375 (±0.00575)
2 Hydrochloric acid 0.6437 (±0.0821) 0.7351 (±0.216) 0.7754 (±0.0123)
3 Sodium hydroxide 0.6051 (±0.00743) 0.7142 (±0.0115) 0.7099 (±0.0101)
4 Sodium arsenate 0.5886 (±0.0078) 0.6755 (±0.005745) 0.5336 (±0.00807)
5 Ammonium vendate 0.5310 (±0.004008) 0.6392 (±0.003035) 0.4807 (±0.01522)
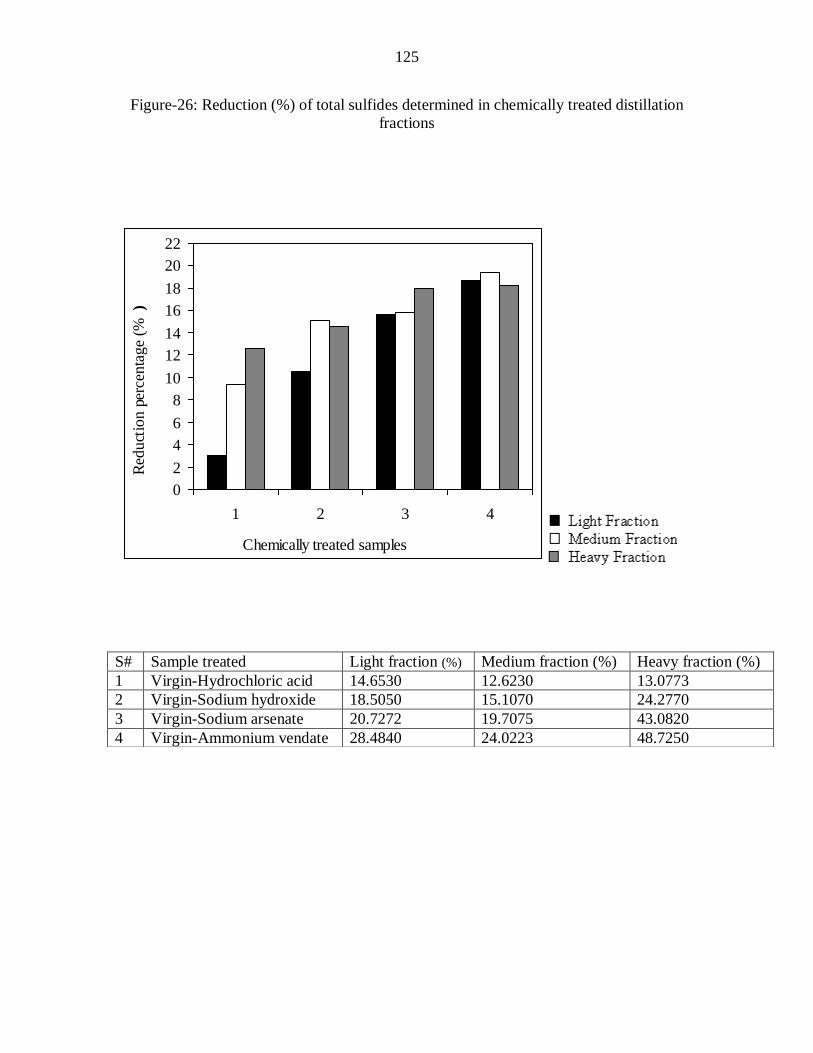
125
Figure-26: Reduction (%) of total sulfides determined in chemically treated distillation
fractions
0
2
4
6
8
10
12
14
16
18
20
22
1 2 3 4
Chemically treated samples
Red
uct
ion
perc
enta
ge
(%
)
S# Sample treated Light fraction (%) Medium fraction (%) Heavy fraction (%)
1 Virgin-Hydrochloric acid 14.6530 12.6230 13.0773
2 Virgin-Sodium hydroxide 18.5050 15.1070 24.2770
3 Virgin-Sodium arsenate 20.7272 19.7075 43.0820
4 Virgin-Ammonium vendate 28.4840 24.0223 48.7250
126
Biological Removal of Total Sulphides
Removal of total sulfides was also investigated by cultivating the fractions under
trial with two different strains.
Removal with P.putida
The crude oil distillates were inoculated with the strain for previously selected
times. The reduction in total sulphide noticed in each case is provided in Fig.27. The
sulphur contents determined in residual fractions from 12 hr inoculation time were
0.5078, 0.6135 & 0.4185 %. In case of 24hr inoculation time its contents were reduced to
0.4497, 0.5291 & 0.3584 %. Microorganism grow on oxidized sulfur (sulfate, sulfite) as
sulfur source and gets energy for its growth. Its growth rate increases in the presences of
more organic aromatic sulfurous compounds. The whole surface of the sulfurous
compounds are colonized by thick mycelium desulfurzing bacteria, there fore they
remove sulfur contents during incubation times in the oil middle. The inoculation time
was extended to 48 hr, one week and one month, where the total sulphides determined
were found to be 0.3988, 0.4359 & 0.3212 %; 0.3250, 0.3555 and 0.2836 % and 0.2647,
0.2684 & 0.2264 %, respectively in light, middle and heavy fractions.
The deference between the original and microbial treated samples is clear from
Fig.28, where a considerable depletion can be seen in case of 12hr contact time, which
was 31.60, 27.07 & 55.36 %. With the extension of inoculation time beyond 12hr,
reduction further increased, and a maximum reduction can be seen in case of one month
contact time i,e 64.35, 68.09 and 75.85 %, in light, middle and heavy fraction,
respectively.
127
Total sulfides has been checked from among the various inoculation time which
were found to be 31.60, 27.07 & 55.36 &% ; 7.83, 10.03 & 6.41 % ; 6.85, 11.08 & 3.96
%, 9.94, 9.54 & 4.01 % and 8.13, 10.37 & 6.11 % in the selected times from virgin –
12hr, 12hr – 24 hr, 24hr – 48hr, 48hr – one week and one week – month respectively in
light, meddle and heavy fractions.
The reason can be thought for this significance removal in case of the bacterial
strains is sulfides are consumed by microbial enzymes such as cytochrome oxidase, .
Bacteria producing these enzymes can assist this oxidation depicted as under:
H2S + O2 (cytochrome- oxidase) → S + H2O
Hence, the sulphides i,e in the form of H2Sor HS are oxidized and converted to
elemental sulphur which in turn is utilized by the organisms understudy for their rapid
growth and population. Bacteria mostly consume inorganic sulfur in the form of
elemental sulfur (S), hydrogen sulfides (H2S) for its growth and nourishment (76)
.
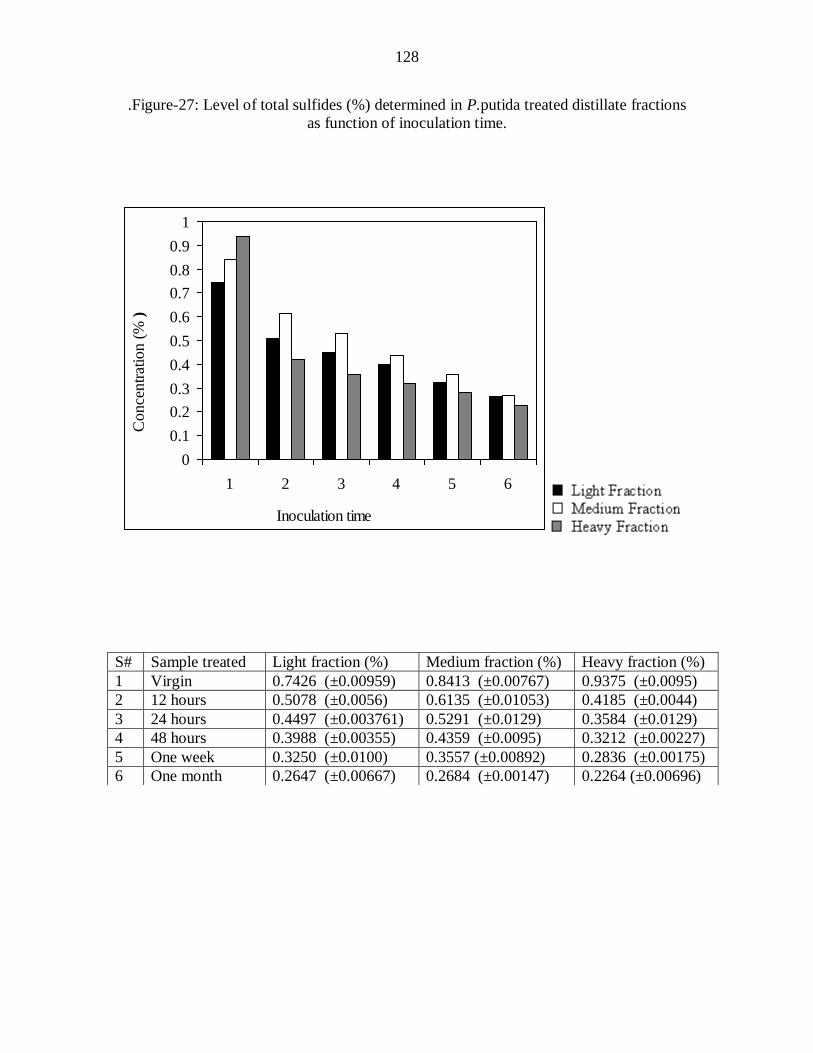
128
.Figure-27: Level of total sulfides (%) determined in P.putida treated distillate fractions
as function of inoculation time.
0
0.1
0.2
0.3
0.4
0.5
0.6
0.7
0.8
0.9
1
1 2 3 4 5 6
Inoculation time
Conce
ntr
atio
n (
% )
S# Sample treated Light fraction (%) Medium fraction (%) Heavy fraction (%)
1 Virgin 0.7426 (±0.00959) 0.8413 (±0.00767) 0.9375 (±0.0095)
2 12 hours 0.5078 (±0.0056) 0.6135 (±0.01053) 0.4185 (±0.0044)
3 24 hours 0.4497 (±0.003761) 0.5291 (±0.0129) 0.3584 (±0.0129)
4 48 hours 0.3988 (±0.00355) 0.4359 (±0.0095) 0.3212 (±0.00227)
5 One week 0.3250 (±0.0100) 0.3557 (±0.00892) 0.2836 (±0.00175)
6 One month 0.2647 (±0.00667) 0.2684 (±0.00147) 0.2264 (±0.00696)
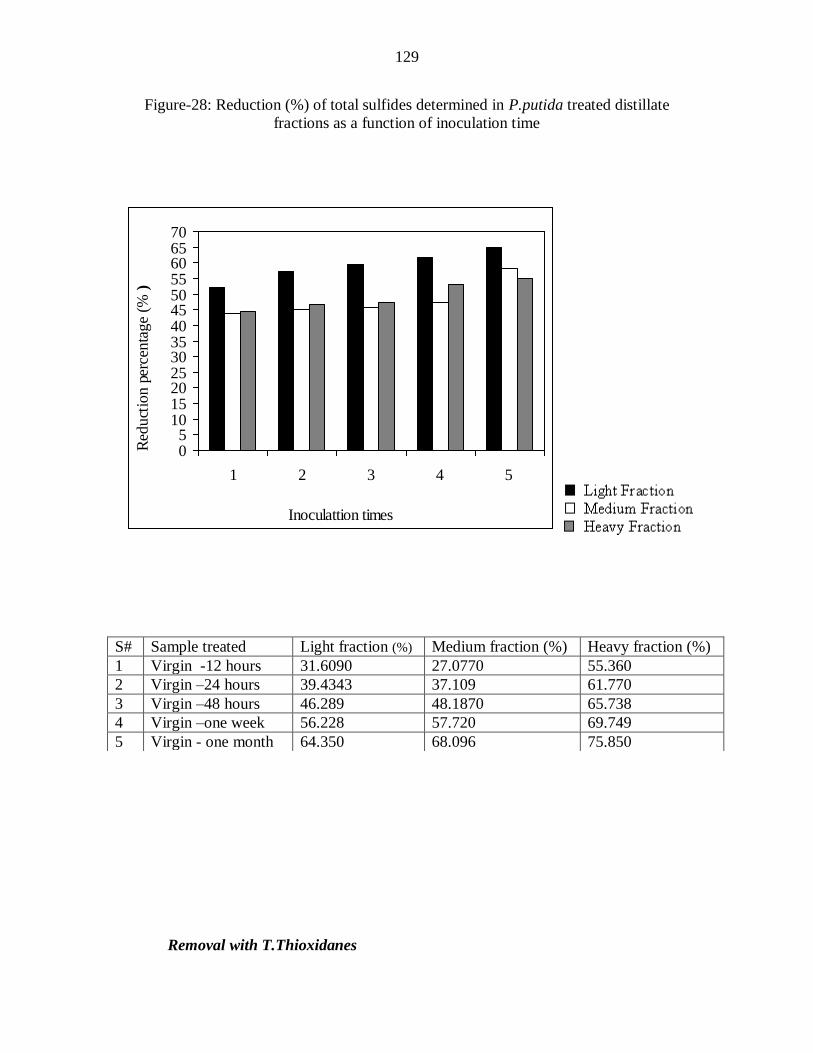
129
Figure-28: Reduction (%) of total sulfides determined in P.putida treated distillate
fractions as a function of inoculation time
05
10152025303540455055606570
1 2 3 4 5
Inoculattion times
Red
uct
ion
perc
enta
ge
(% )
Removal with T.Thioxidanes
S# Sample treated Light fraction (%) Medium fraction (%) Heavy fraction (%)
1 Virgin -12 hours 31.6090 27.0770 55.360
2 Virgin –24 hours 39.4343 37.109 61.770
3 Virgin –48 hours 46.289 48.1870 65.738
4 Virgin –one week 56.228 57.720 69.749
5 Virgin - one month 64.350 68.096 75.850
130
T. Thioxidans was also studied for desulphurization of this sulfur moiety by
cultivating the strain with the oil fractions understudy for different inoculation times. The
results have been summarized in Fig.29 .The inoculation was like wise performed for the
inoculation time selected fro 00 hr- one month. It is evident from the data compiled that
total sulphides could be removed by cultivating the oil fractions with strain understudy.
The contents of this sulphur moiety were determined in the residual samples from each
inoculation. In case of inoculation performed for 12 hr, the contents found were 0.4810,
0.5750 & 0.3904. Similarly, depletion was noticed when the same fractions were
inoculated for 24 hr. The contents determined in the residual samples were 0.4236,
0.5082 & 0.3106. The time was extended to 48 hr. the results obtained were 0.3704,
0.3926 & 0.2349. The inoculation time was further increased and the cultivation was
performed for time duration of one week and then one month. The sulphur contents
determined were…0.2862, 0.2336 & 0.2349 and 0.2348, 0.2331 & 0.1933.
Fig.30 represents the reduction percentages obtained in case of different
inoculation times versus the original fractions. From the data collected, it has been
concluded that T Thioxidans has shown better desulphurization results in case of light
fraction.
In the initial inoculation time of 12hr and 24hr, the percentage reduction been
made by T. thioxidans was 35.21, 31.65 & 58.35 %, and 42.64, 39.59 & 66.86 %.
Reduction was further enhanced up to 68.37, 72.29 & 79.38 % in case of one month
inoculation time.
131
Similarly the difference of the total sulfides among the variously inoculated times
was determined, and the data observed was found to be 35.21, 31.65 & 58.35 % ; 7.73,
7.94 & 8.51, % ; 7.17, 13.74 & 4.48 % ; 11.13, 18.9 & 3.24 % and 7.13, 0.06 & 4.44% in
cases of virgin – 12hr, 12hr – 24 hr, 24hr – 48hr, 48hr – one week and one week –
month respectively in light, meddle and heavy fractions.
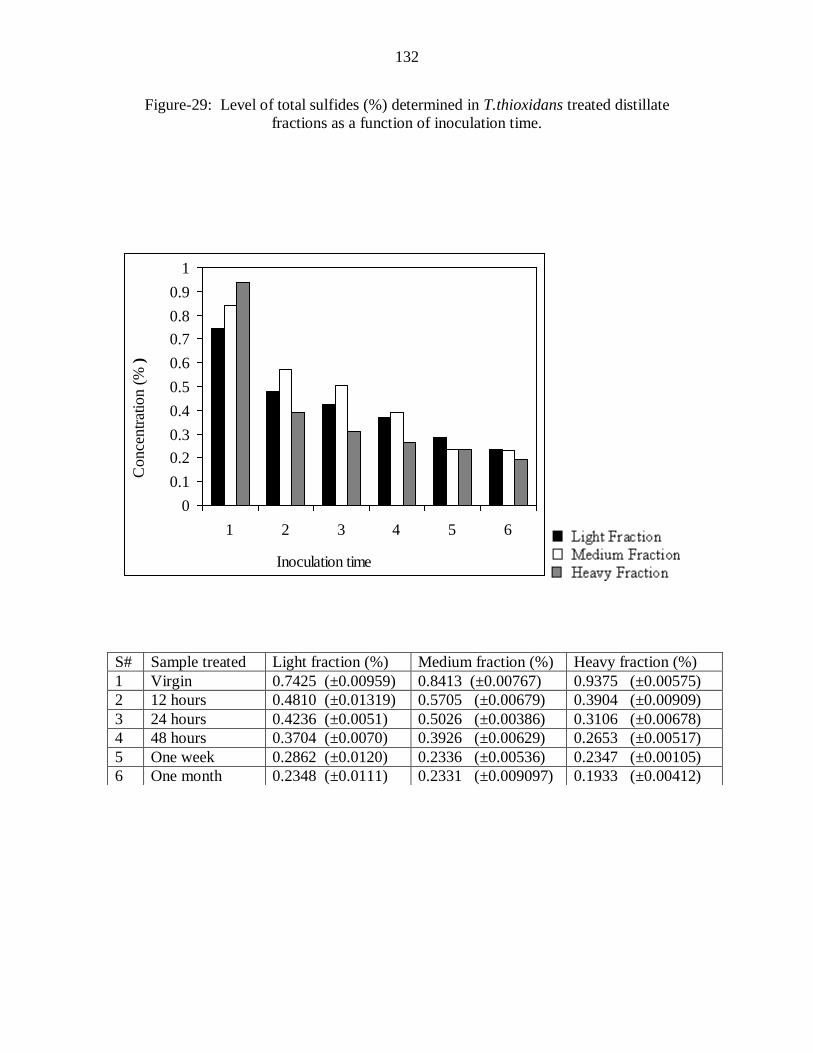
132
Figure-29: Level of total sulfides (%) determined in T.thioxidans treated distillate
fractions as a function of inoculation time.
0
0.1
0.2
0.3
0.4
0.5
0.6
0.7
0.8
0.9
1
1 2 3 4 5 6
Inoculation time
Conce
ntr
atio
n (
% )
S# Sample treated Light fraction (%) Medium fraction (%) Heavy fraction (%)
1 Virgin 0.7425 (±0.00959) 0.8413 (±0.00767) 0.9375 (±0.00575)
2 12 hours 0.4810 (±0.01319) 0.5705 (±0.00679) 0.3904 (±0.00909)
3 24 hours 0.4236 (±0.0051) 0.5026 (±0.00386) 0.3106 (±0.00678)
4 48 hours 0.3704 (±0.0070) 0.3926 (±0.00629) 0.2653 (±0.00517)
5 One week 0.2862 (±0.0120) 0.2336 (±0.00536) 0.2347 (±0.00105)
6 One month 0.2348 (±0.0111) 0.2331 (±0.009097) 0.1933 (±0.00412)
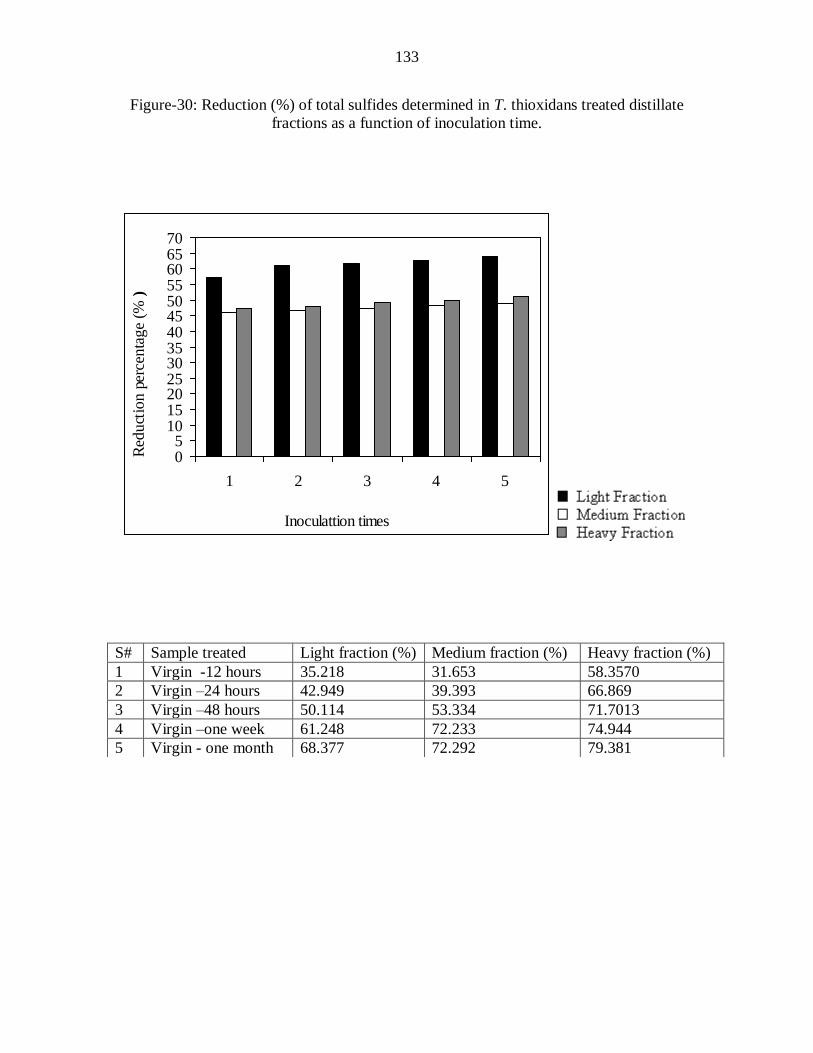
133
Figure-30: Reduction (%) of total sulfides determined in T. thioxidans treated distillate
fractions as a function of inoculation time.
05
10152025303540455055606570
1 2 3 4 5
Inoculattion times
Red
uct
ion
perc
enta
ge
(% )
S# Sample treated Light fraction (%) Medium fraction (%) Heavy fraction (%)
1 Virgin -12 hours 35.218 31.653 58.3570
2 Virgin –24 hours 42.949 39.393 66.869
3 Virgin –48 hours 50.114 53.334 71.7013
4 Virgin –one week 61.248 72.233 74.944
5 Virgin - one month 68.377 72.292 79.381
134
3.2.7 Removal of Aliphatic sulfides
Aliphatic sulphides were analyzed in the original as well as variously
desulphurized samples spectrophotometrically. This method is recommended for the
separation of aliphatic sulfides from the petroleum products containing other organic
sulfur compounds using Ultra violet spectrophotometer. Each sample was dissolved in
carbon tetrachloride solvent. Iodine solution was mixed with the sample solution to get
aliphatic sulfide iodine complex.
Chemical Removal
Quantitative investigation of the aliphatic sulfides determined in original samples
is represented in Fig.31. The contents of aliphatic sulphide determined in original light,
middle and heavy fractions were 245.3743, 20.2753 & 186.4110 ppm, respectively. All
crude oil distillates were then scrubbed with four chemical reagents. The aliphatic
sulphide determined in case light, middle and heavy fraction after being scrubbed with
hydrochloric acid, sodium hydroxide, sodium arsenate and ammonium vendate were
231.3860, 188.3218 & 165.1925ppm; 218.3920, 171.4315 & 151.3401ppm; 210.5214,
148.331 & 133.4916 ppm and 200.3708, 141.3674 & 125.4749 ppm respectively. It is
clear that ammonium vendate caused removal of the maximum amount of this sulfur
moiety. The removal efficiency of sodium arsenate is found to be inferior compared to
ammonium vendate. The removal efficiency of NaOH and HCl was found to be minimal
compared to sodium arsenate. The depletion can be observed from the decrease in the
intensity of the bands in UV spectra given as pofile-10 to 12.
Percent reduction data of the chemically treated sample versus the untreated
sample is given in Fig.32. It is clear that in case of HCl, the reduction was 5.70, 8.25 &
11.38 % and in case of NaOH treated samples; the reduction noted was 10.99, 16.48 &
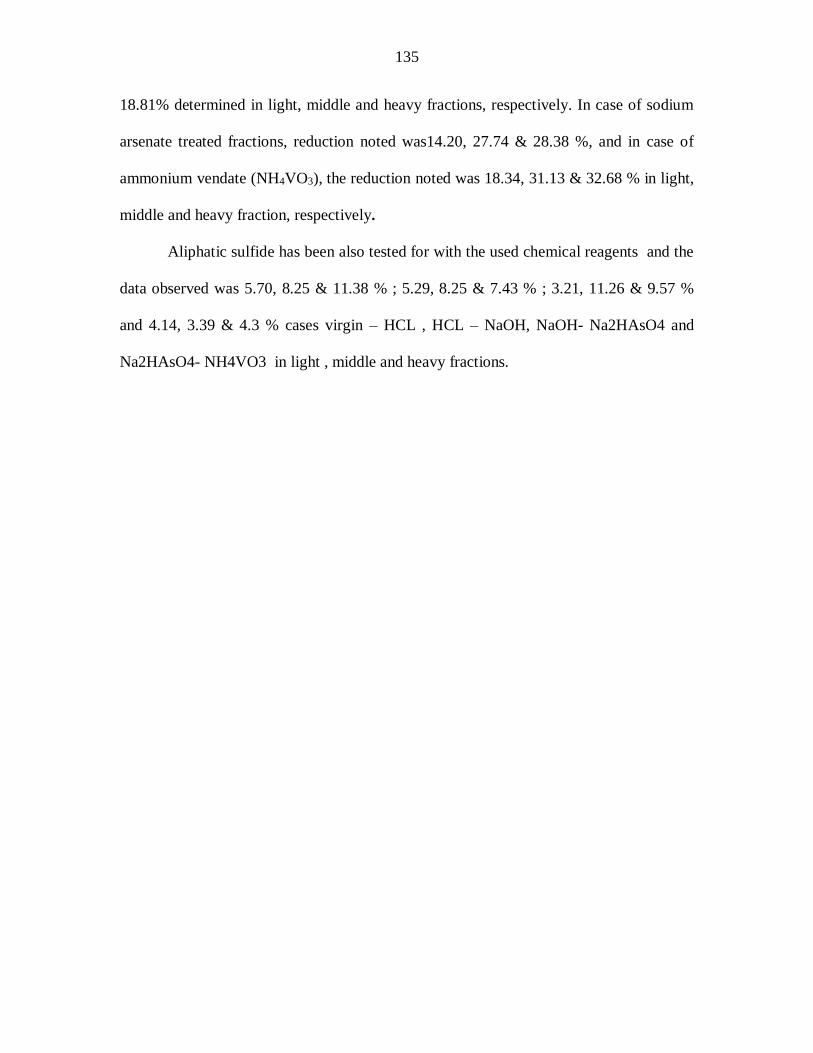
135
18.81% determined in light, middle and heavy fractions, respectively. In case of sodium
arsenate treated fractions, reduction noted was14.20, 27.74 & 28.38 %, and in case of
ammonium vendate (NH4VO3), the reduction noted was 18.34, 31.13 & 32.68 % in light,
middle and heavy fraction, respectively.
Aliphatic sulfide has been also tested for with the used chemical reagents and the
data observed was 5.70, 8.25 & 11.38 % ; 5.29, 8.25 & 7.43 % ; 3.21, 11.26 & 9.57 %
and 4.14, 3.39 & 4.3 % cases virgin – HCL , HCL – NaOH, NaOH- Na2HAsO4 and
Na2HAsO4- NH4VO3 in light , middle and heavy fractions.
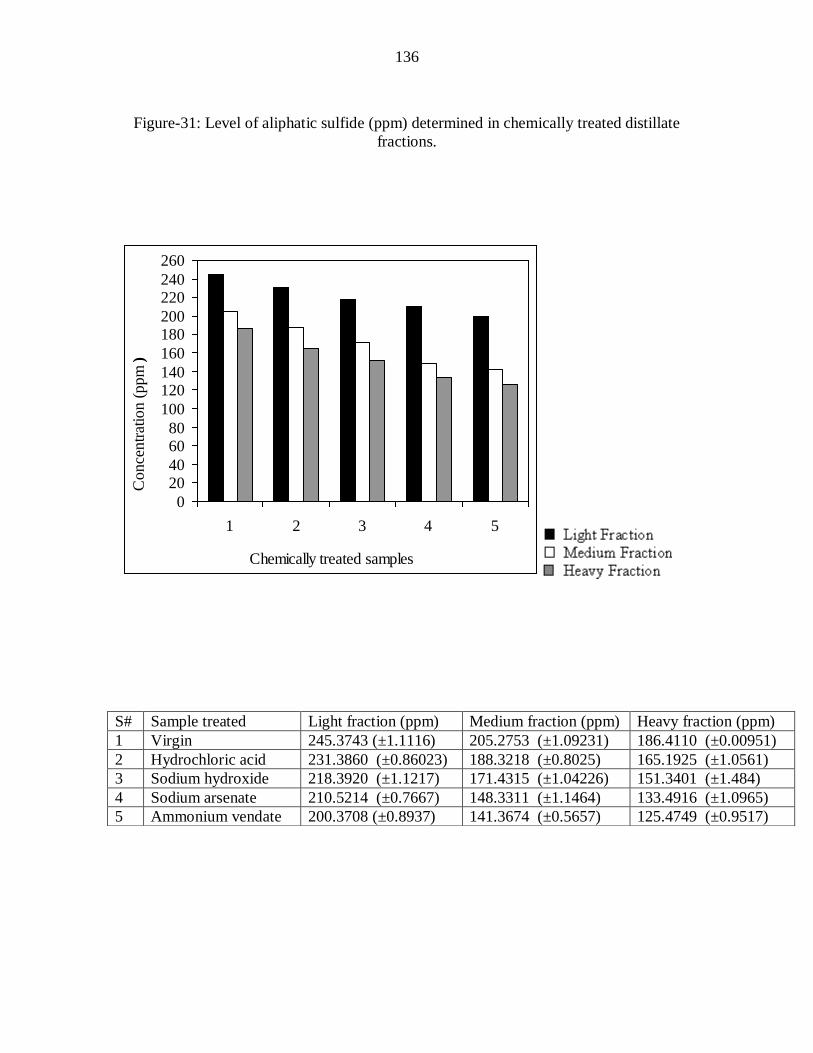
136
Figure-31: Level of aliphatic sulfide (ppm) determined in chemically treated distillate
fractions.
0
2040
6080
100
120140
160
180200
220240
260
1 2 3 4 5
Chemically treated samples
Co
nce
ntr
atio
n (
pp
m )
S# Sample treated Light fraction (ppm) Medium fraction (ppm) Heavy fraction (ppm)
1 Virgin 245.3743 (±1.1116) 205.2753 (±1.09231) 186.4110 (±0.00951)
2 Hydrochloric acid 231.3860 (±0.86023) 188.3218 (±0.8025) 165.1925 (±1.0561)
3 Sodium hydroxide 218.3920 (±1.1217) 171.4315 (±1.04226) 151.3401 (±1.484)
4 Sodium arsenate 210.5214 (±0.7667) 148.3311 (±1.1464) 133.4916 (±1.0965)
5 Ammonium vendate 200.3708 (±0.8937) 141.3674 (±0.5657) 125.4749 (±0.9517)
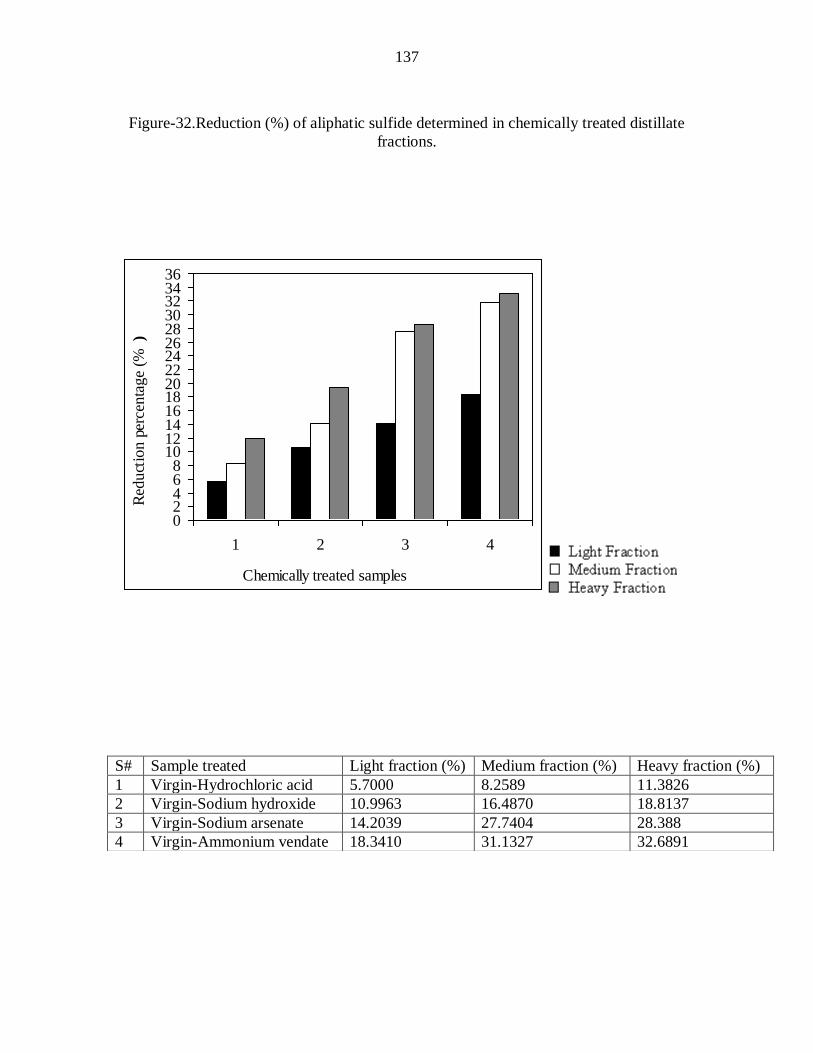
137
Figure-32.Reduction (%) of aliphatic sulfide determined in chemically treated distillate
fractions.
02468
1012141618202224262830323436
1 2 3 4
Chemically treated samples
Red
uct
ion
perc
enta
ge
(%
)
S# Sample treated Light fraction (%) Medium fraction (%) Heavy fraction (%)
1 Virgin-Hydrochloric acid 5.7000 8.2589 11.3826
2 Virgin-Sodium hydroxide 10.9963 16.4870 18.8137
3 Virgin-Sodium arsenate 14.2039 27.7404 28.388
4 Virgin-Ammonium vendate 18.3410 31.1327 32.6891
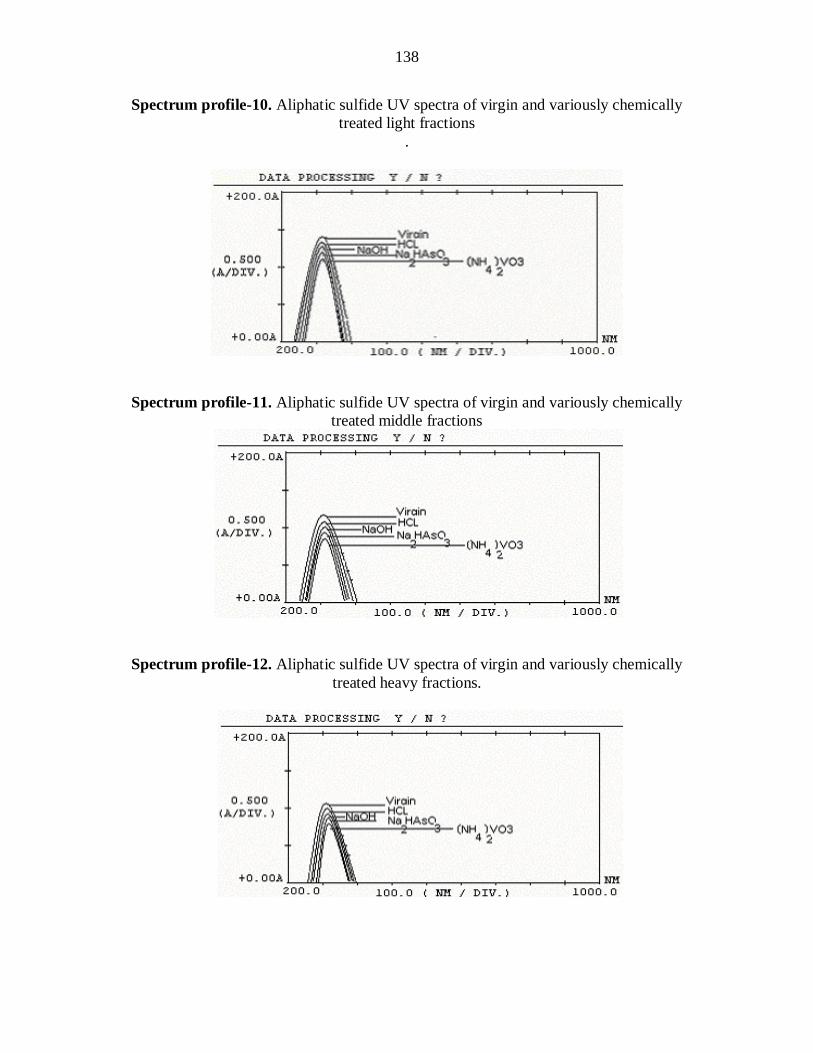
138
Spectrum profile-10. Aliphatic sulfide UV spectra of virgin and variously chemically
treated light fractions
.
Spectrum profile-11. Aliphatic sulfide UV spectra of virgin and variously chemically
treated middle fractions
Spectrum profile-12. Aliphatic sulfide UV spectra of virgin and variously chemically
treated heavy fractions.
139
Microbial removal of aliphatic Sulphides
Removal with P.putida
The samples were inoculated for the time duration selected in the aforementioned
attempts. The strain selected was P.putida. The results obtained are provided in Figs.33.
It appears from the data that a significant amount of sulfur (aliphatic sulfides) has
been disappeared in the bacterially cultivated samples Aliphatic sulfide contents were
determined in the residual samples from bacterial inoculations performed for time
duration of 12 hr, 24 hr, 48 hr, one week and one month, separately. The contents of this
sulphur moiety were 171.2667, 147.6732 & 143.3714 ppm and 154.3842, 136.2767 &
115.6020 ppm in the first two cases of 12 hr and 24 hr, respectively. Inoculation time was
again extended to 48 hr, one week and even up to one month, and the sulfur contents
determined were found to be 140.9232, 107.5309 nd 101.1414 ppm; 114.4612, 99.0088
& 77.4478 ppm and 95.3098, 82.4571 & 64.3758 ppm, in residual light, middle and
heavy fractions, respectively. Maximum depletion can be seen in case of one month.
Qualitative investigation has also been given in UV spectrum profiles (13-15). A
decrease in intensity of absorption bands can be seen when the time was extended fro 12
hr to one month.
Percent reduction of all inoculation times (from 12 hr to one month) has been
given in Fig.34. The values determined were 30.20, 28.06 & 23.08 ; 37.08, 33.61 &
37.98 ; 42.56, 47.61 & 45.74; 53.35, 51.76 & 58.45 and 61.15, 59.83 & 65.46 in case of
12 hr, 24 hr, 48 hr, one week and one month inoculation times, respectively which is also
clear from their UV spectra profiles 31-33.
140
In pseudomonas treated samples similarly the difference of the aliphatic sulfides
among the variously inoculated times has been tested, and the findings were 30.20, 28.06
& 23.08 % ; 6.88, 5.55 & 14.9 % ; 5.48, 14.00 & 7.76 % ; 10.76, 4.15 & 12.71 % and
7.83 ,8.07 & 7.01 % cases of virgin – 12hr, 12hr – 24 hr, 24hr – 48hr, 48hr – one week
and one week – month respectively in light, meddle and heavy fractions.
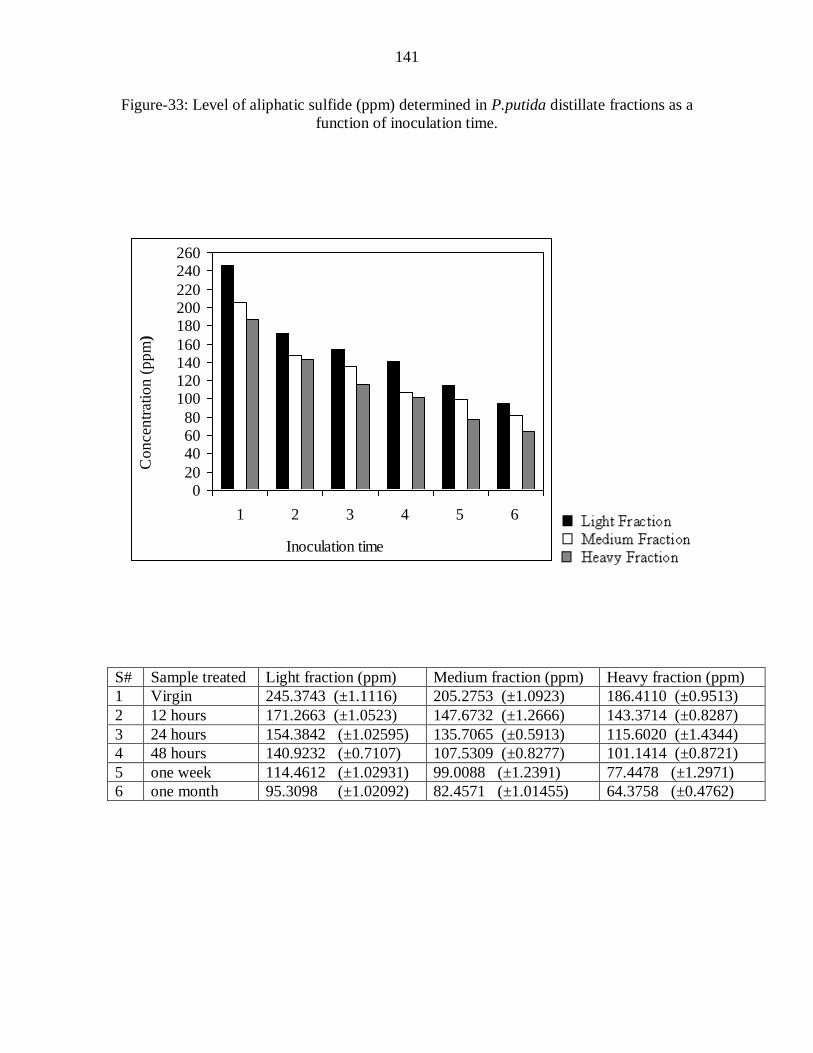
141
Figure-33: Level of aliphatic sulfide (ppm) determined in P.putida distillate fractions as a
function of inoculation time.
020
406080
100120140160
180200220
240260
1 2 3 4 5 6
Inoculation time
Co
nce
ntr
atio
n (
pp
m )
S# Sample treated Light fraction (ppm) Medium fraction (ppm) Heavy fraction (ppm)
1 Virgin 245.3743 (±1.1116) 205.2753 (±1.0923) 186.4110 (±0.9513)
2 12 hours 171.2663 (±1.0523) 147.6732 (±1.2666) 143.3714 (±0.8287)
3 24 hours 154.3842 (±1.02595) 135.7065 (±0.5913) 115.6020 (±1.4344)
4 48 hours 140.9232 (±0.7107) 107.5309 (±0.8277) 101.1414 (±0.8721)
5 one week 114.4612 (±1.02931) 99.0088 (±1.2391) 77.4478 (±1.2971)
6 one month 95.3098 (±1.02092) 82.4571 (±1.01455) 64.3758 (±0.4762)
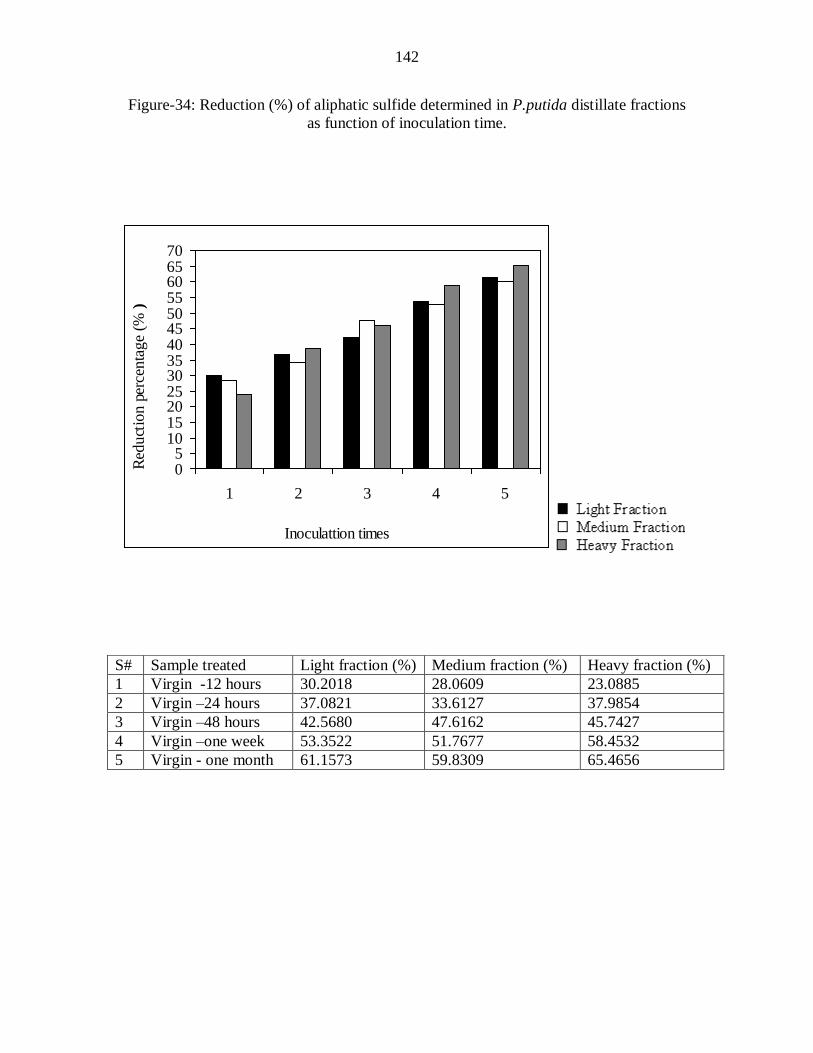
142
Figure-34: Reduction (%) of aliphatic sulfide determined in P.putida distillate fractions
as function of inoculation time.
05
10152025303540455055606570
1 2 3 4 5
Inoculattion times
Red
uct
ion
perc
enta
ge
(% )
S# Sample treated Light fraction (%) Medium fraction (%) Heavy fraction (%)
1 Virgin -12 hours 30.2018 28.0609 23.0885
2 Virgin –24 hours 37.0821 33.6127 37.9854
3 Virgin –48 hours 42.5680 47.6162 45.7427
4 Virgin –one week 53.3522 51.7677 58.4532
5 Virgin - one month 61.1573 59.8309 65.4656
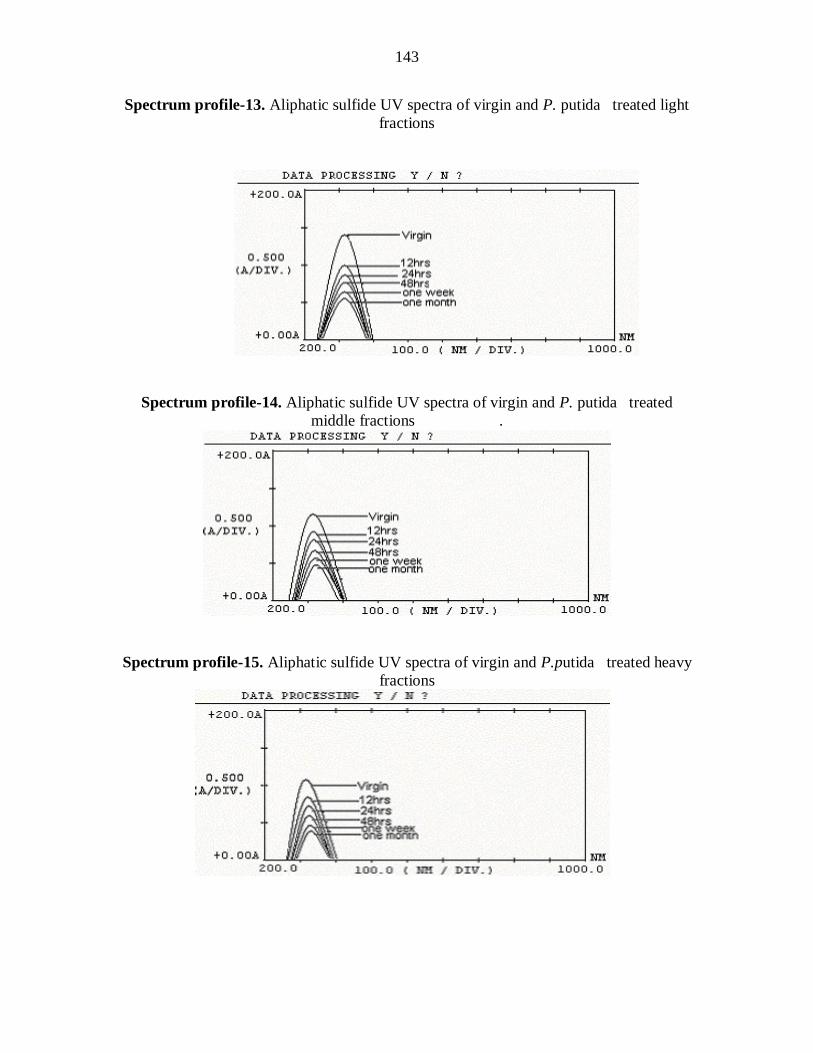
143
Spectrum profile-13. Aliphatic sulfide UV spectra of virgin and P. putida treated light
fractions
Spectrum profile-14. Aliphatic sulfide UV spectra of virgin and P. putida treated
middle fractions .
Spectrum profile-15. Aliphatic sulfide UV spectra of virgin and P.putida treated heavy
fractions
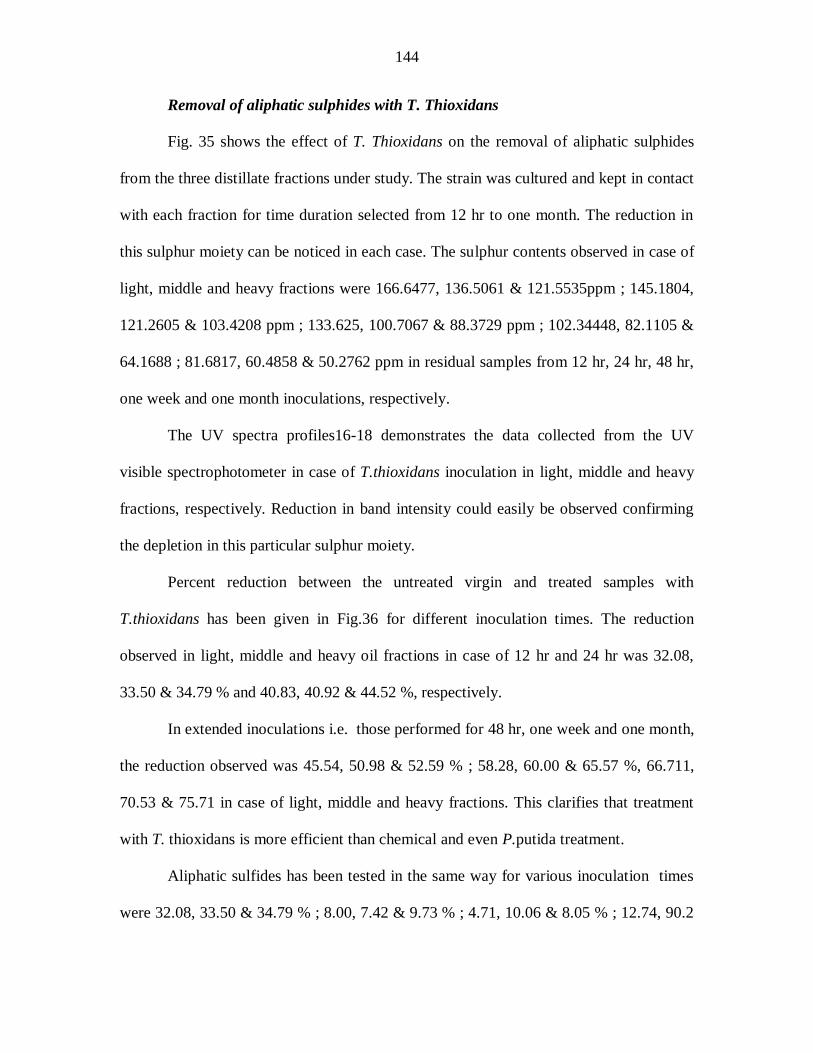
144
Removal of aliphatic sulphides with T. Thioxidans
Fig. 35 shows the effect of T. Thioxidans on the removal of aliphatic sulphides
from the three distillate fractions under study. The strain was cultured and kept in contact
with each fraction for time duration selected from 12 hr to one month. The reduction in
this sulphur moiety can be noticed in each case. The sulphur contents observed in case of
light, middle and heavy fractions were 166.6477, 136.5061 & 121.5535ppm ; 145.1804,
121.2605 & 103.4208 ppm ; 133.625, 100.7067 & 88.3729 ppm ; 102.34448, 82.1105 &
64.1688 ; 81.6817, 60.4858 & 50.2762 ppm in residual samples from 12 hr, 24 hr, 48 hr,
one week and one month inoculations, respectively.
The UV spectra profiles16-18 demonstrates the data collected from the UV
visible spectrophotometer in case of T.thioxidans inoculation in light, middle and heavy
fractions, respectively. Reduction in band intensity could easily be observed confirming
the depletion in this particular sulphur moiety.
Percent reduction between the untreated virgin and treated samples with
T.thioxidans has been given in Fig.36 for different inoculation times. The reduction
observed in light, middle and heavy oil fractions in case of 12 hr and 24 hr was 32.08,
33.50 & 34.79 % and 40.83, 40.92 & 44.52 %, respectively.
In extended inoculations i.e. those performed for 48 hr, one week and one month,
the reduction observed was 45.54, 50.98 & 52.59 % ; 58.28, 60.00 & 65.57 %, 66.711,
70.53 & 75.71 in case of light, middle and heavy fractions. This clarifies that treatment
with T. thioxidans is more efficient than chemical and even P.putida treatment.
Aliphatic sulfides has been tested in the same way for various inoculation times
were 32.08, 33.50 & 34.79 % ; 8.00, 7.42 & 9.73 % ; 4.71, 10.06 & 8.05 % ; 12.74, 90.2

145
& 12.98 % and 10.14 , 10.53 & 10.14 % in cases of virgin – 12hr, 12hr – 24 hr, 24hr –
48hr, 48hr – one week and one week – month respectively in light, meddle and heavy
fractions.
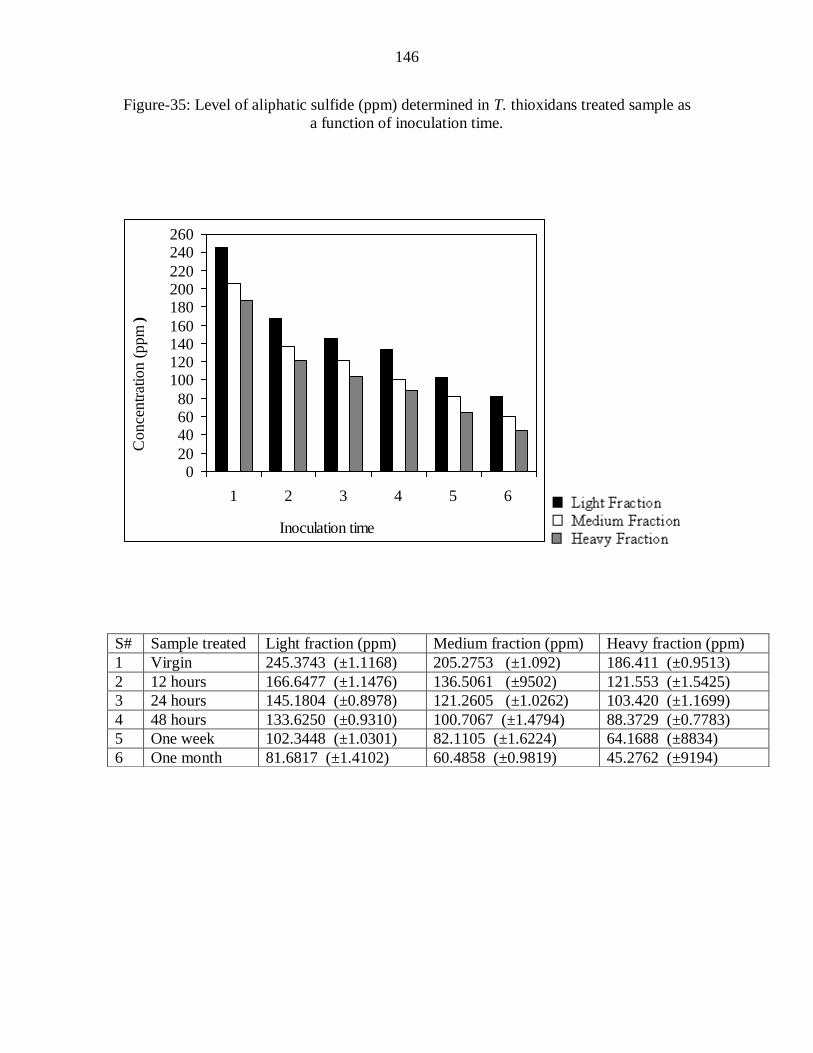
146
Figure-35: Level of aliphatic sulfide (ppm) determined in T. thioxidans treated sample as
a function of inoculation time.
020
406080
100120140160
180200220
240260
1 2 3 4 5 6
Inoculation time
Conce
ntr
atio
n (
ppm
)
S# Sample treated Light fraction (ppm) Medium fraction (ppm) Heavy fraction (ppm)
1 Virgin 245.3743 (±1.1168) 205.2753 (±1.092) 186.411 (±0.9513)
2 12 hours 166.6477 (±1.1476) 136.5061 (±9502) 121.553 (±1.5425)
3 24 hours 145.1804 (±0.8978) 121.2605 (±1.0262) 103.420 (±1.1699)
4 48 hours 133.6250 (±0.9310) 100.7067 (±1.4794) 88.3729 (±0.7783)
5 One week 102.3448 (±1.0301) 82.1105 (±1.6224) 64.1688 (±8834)
6 One month 81.6817 (±1.4102) 60.4858 (±0.9819) 45.2762 (±9194)
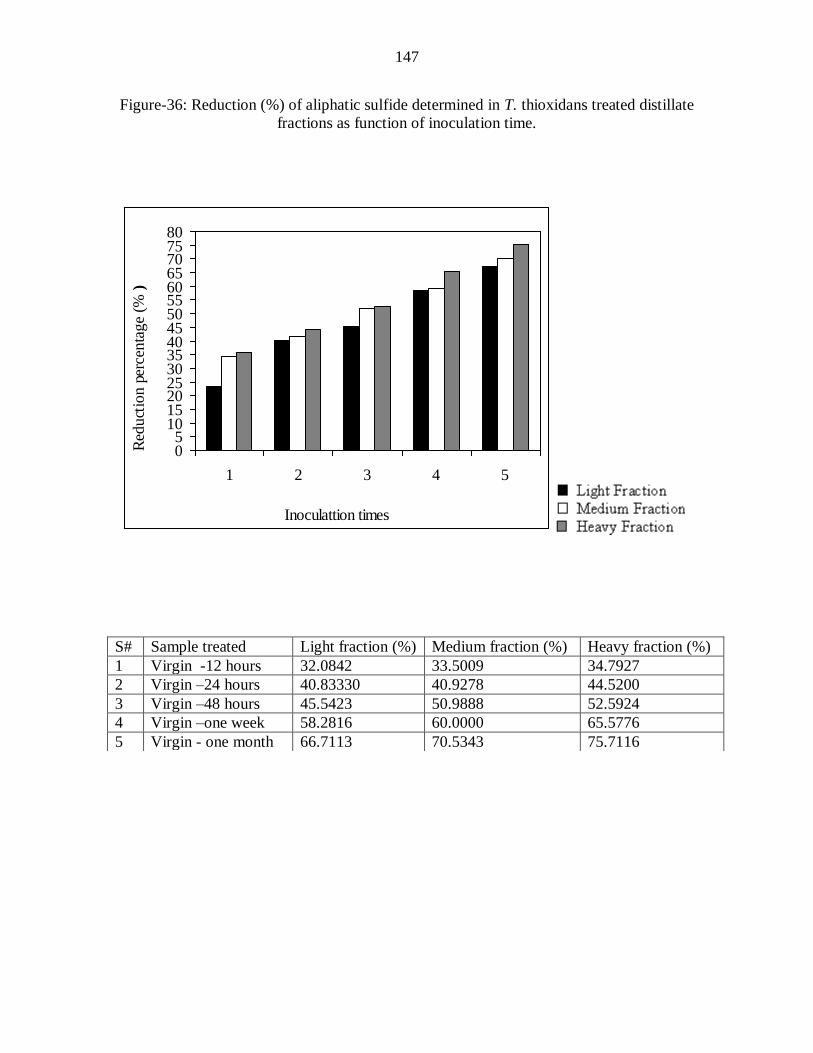
147
Figure-36: Reduction (%) of aliphatic sulfide determined in T. thioxidans treated distillate
fractions as function of inoculation time.
05
101520253035404550556065707580
1 2 3 4 5
Inoculattion times
Red
uct
ion
perc
enta
ge
(% )
S# Sample treated Light fraction (%) Medium fraction (%) Heavy fraction (%)
1 Virgin -12 hours 32.0842 33.5009 34.7927
2 Virgin –24 hours 40.83330 40.9278 44.5200
3 Virgin –48 hours 45.5423 50.9888 52.5924
4 Virgin –one week 58.2816 60.0000 65.5776
5 Virgin - one month 66.7113 70.5343 75.7116
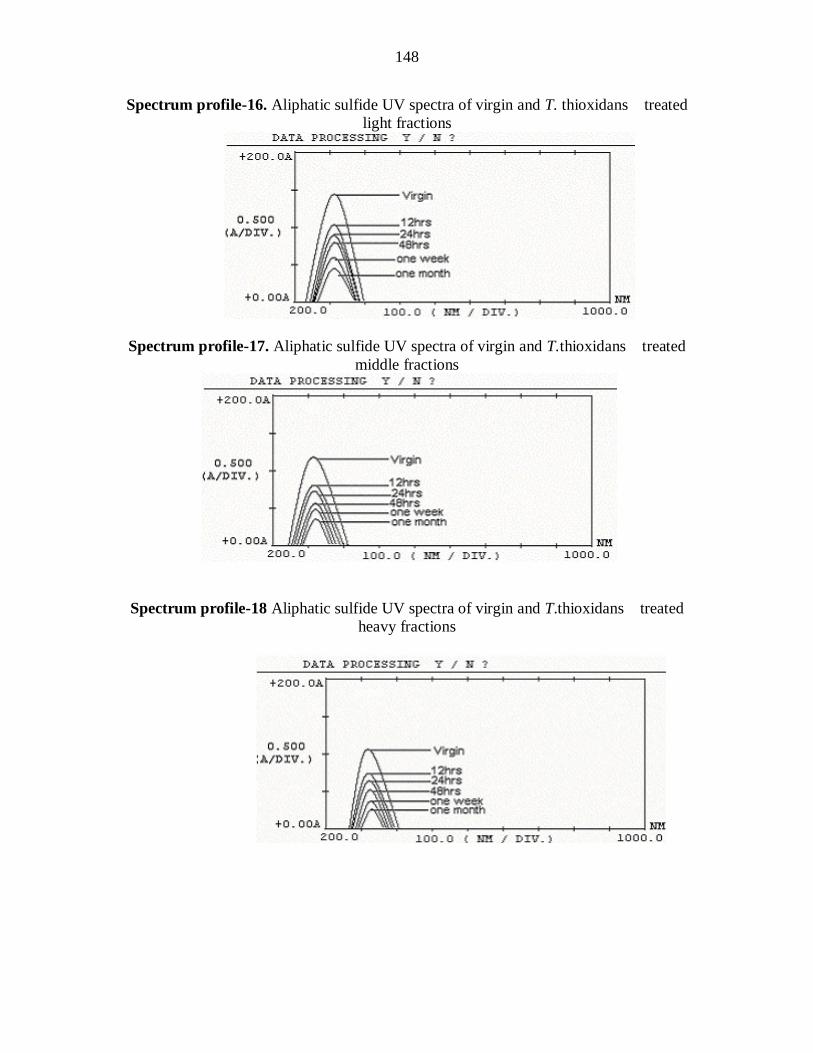
148
Spectrum profile-16. Aliphatic sulfide UV spectra of virgin and T. thioxidans treated
light fractions
Spectrum profile-17. Aliphatic sulfide UV spectra of virgin and T.thioxidans treated
middle fractions
Spectrum profile-18 Aliphatic sulfide UV spectra of virgin and T.thioxidans treated
heavy fractions
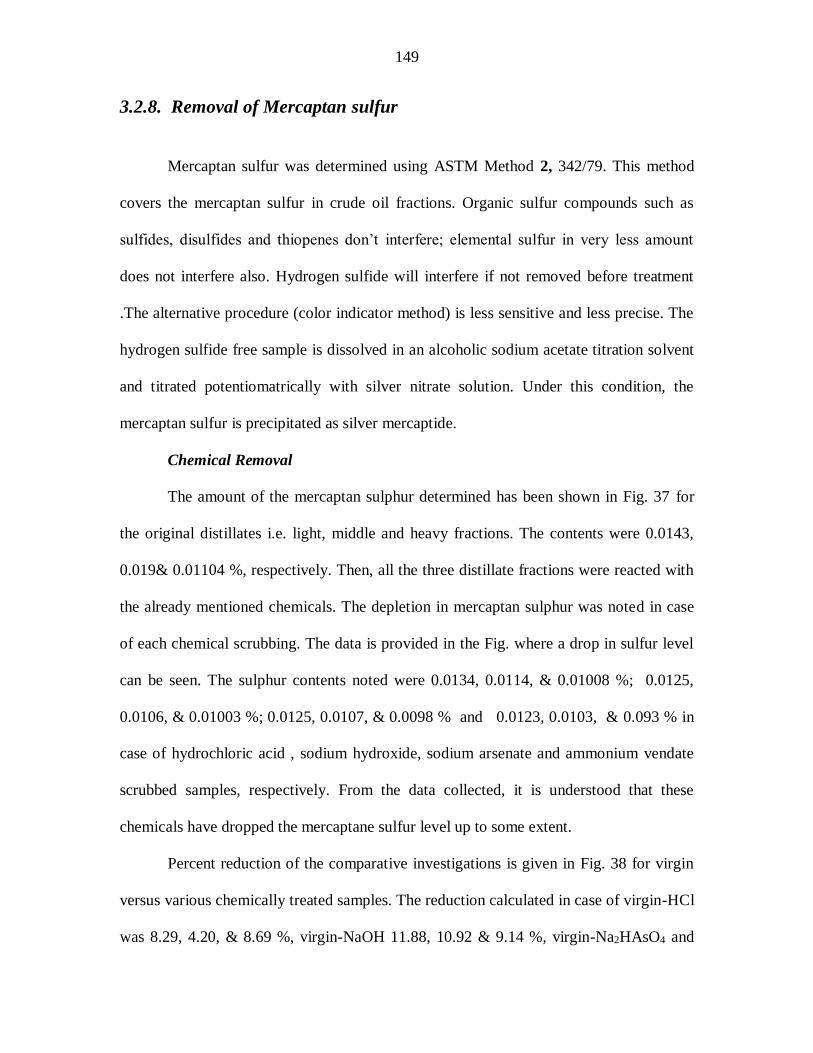
149
3.2.8. Removal of Mercaptan sulfur
Mercaptan sulfur was determined using ASTM Method 2, 342/79. This method
covers the mercaptan sulfur in crude oil fractions. Organic sulfur compounds such as
sulfides, disulfides and thiopenes don’t interfere; elemental sulfur in very less amount
does not interfere also. Hydrogen sulfide will interfere if not removed before treatment
.The alternative procedure (color indicator method) is less sensitive and less precise. The
hydrogen sulfide free sample is dissolved in an alcoholic sodium acetate titration solvent
and titrated potentiomatrically with silver nitrate solution. Under this condition, the
mercaptan sulfur is precipitated as silver mercaptide.
Chemical Removal
The amount of the mercaptan sulphur determined has been shown in Fig. 37 for
the original distillates i.e. light, middle and heavy fractions. The contents were 0.0143,
0.019& 0.01104 %, respectively. Then, all the three distillate fractions were reacted with
the already mentioned chemicals. The depletion in mercaptan sulphur was noted in case
of each chemical scrubbing. The data is provided in the Fig. where a drop in sulfur level
can be seen. The sulphur contents noted were 0.0134, 0.0114, & 0.01008 %; 0.0125,
0.0106, & 0.01003 %; 0.0125, 0.0107, & 0.0098 % and 0.0123, 0.0103, & 0.093 % in
case of hydrochloric acid , sodium hydroxide, sodium arsenate and ammonium vendate
scrubbed samples, respectively. From the data collected, it is understood that these
chemicals have dropped the mercaptane sulfur level up to some extent.
Percent reduction of the comparative investigations is given in Fig. 38 for virgin
versus various chemically treated samples. The reduction calculated in case of virgin-HCl
was 8.29, 4.20, & 8.69 %, virgin-NaOH 11.88, 10.92 & 9.14 %, virgin-Na2HAsO4 and

150
virgin-NH4VO3 were 12.58, 12.60 & 11.23 % and 13.98, 13.44 & 15.76 % respectively in
the three distillate fractions.
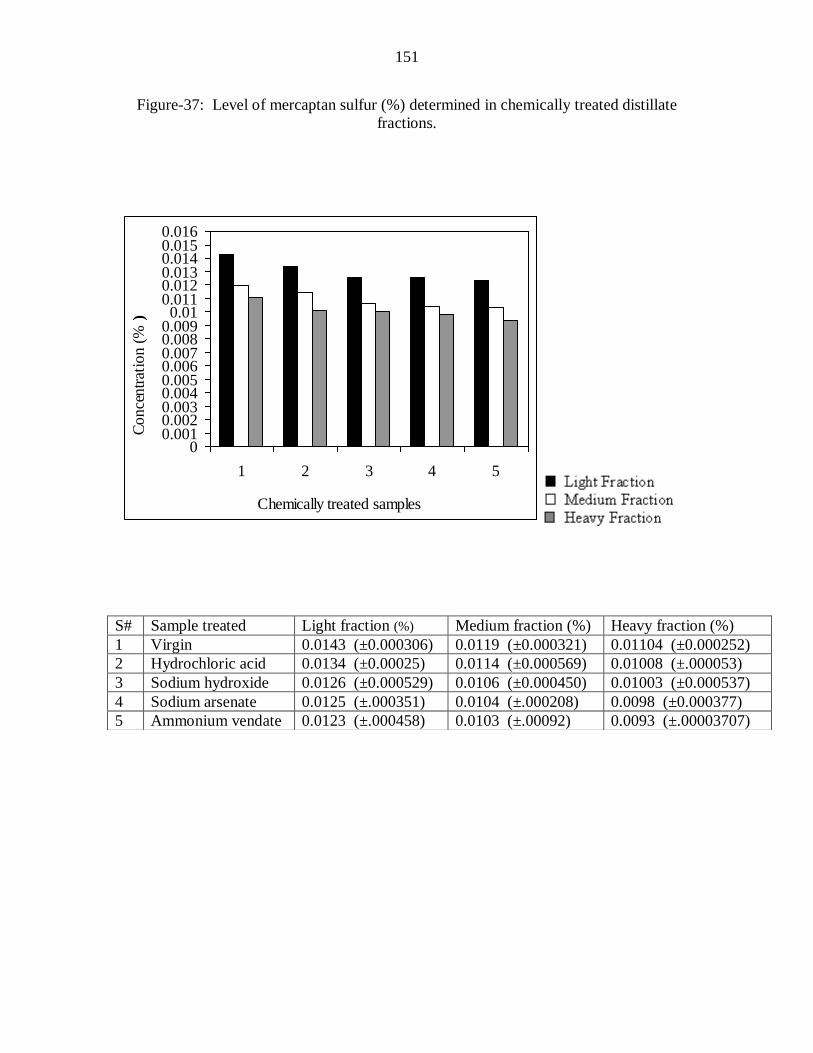
151
Figure-37: Level of mercaptan sulfur (%) determined in chemically treated distillate
fractions.
00.0010.0020.0030.0040.0050.0060.0070.0080.009
0.010.0110.0120.0130.0140.0150.016
1 2 3 4 5
Chemically treated samples
Co
nce
ntr
atio
n (%
)
S# Sample treated Light fraction (%) Medium fraction (%) Heavy fraction (%)
1 Virgin 0.0143 (±0.000306) 0.0119 (±0.000321) 0.01104 (±0.000252)
2 Hydrochloric acid 0.0134 (±0.00025) 0.0114 (±0.000569) 0.01008 (±.000053)
3 Sodium hydroxide 0.0126 (±0.000529) 0.0106 (±0.000450) 0.01003 (±0.000537)
4 Sodium arsenate 0.0125 (±.000351) 0.0104 (±.000208) 0.0098 (±0.000377)
5 Ammonium vendate 0.0123 (±.000458) 0.0103 (±.00092) 0.0093 (±.00003707)
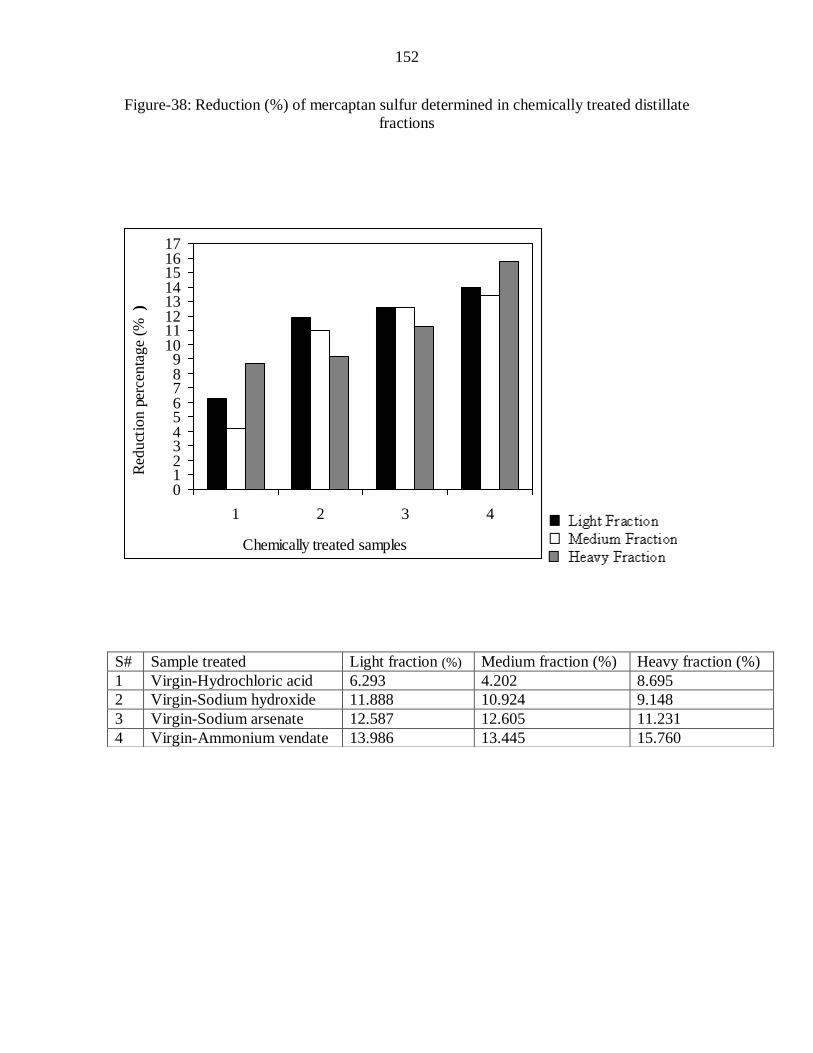
152
Figure-38: Reduction (%) of mercaptan sulfur determined in chemically treated distillate
fractions
0123456789
1011121314151617
1 2 3 4
Chemically treated samples
Red
uct
ion
perc
enta
ge
(%
)
S# Sample treated Light fraction (%) Medium fraction (%) Heavy fraction (%)
1 Virgin-Hydrochloric acid 6.293 4.202 8.695
2 Virgin-Sodium hydroxide 11.888 10.924 9.148
3 Virgin-Sodium arsenate 12.587 12.605 11.231
4 Virgin-Ammonium vendate 13.986 13.445 15.760
153
Biological removal of mercaptan sulphur
Removal with P.putida
The samples was interacted with P.putida in order to view the desulphurization
ability of this strain for removal of the sulphur moiety i, e.mercaptane sulphur. The data
is represented graphically in Fig.39, where enough amount of the mercaptan sulfur was
observed to be consumed by Ps.putida during its various inoculations, where sulfur
content can be used as source of energy for its growth and mobility.
The inoculations were performed for time duration of 12 hr, 24 hr, 48 hr,
one week and one month. Sulphur contents determined in residual samples from
inoculation performed for time duration of 12 hr were 0.0097, 0.0088 & 0.0082 %, in
case of light, middle and heavy fractions, respectively. The sulphur contents determined
in residual samples from inoculations performed for time duration of 24 hr, 48 hr, and
one week were 0.0091, 0.0087 & 0.0081 % ; 0.0088, 0.0085 & 0.0078 % ; 0.0085,
0.0084 & 0.0077 % . Similarly, the time was increased up to one month, where the
contents of mercaptan sulfur determined were 0.0083, 0.0083 & 0.0075 % in light,
middle and heavy fractions.
The percent reduction in each inoculation was calculated and given in Fig.40
where significant reduction has been observed in all the contact times, which was 31.74,
25.54 & 25.72 % in case of 12 hr .The reduction was found to be further increased in
longer fermentation times and reduction of 36.15, 26.89, & 26.639 % was observed in
case of 24 hr inoculation. A reduction of 38.46, 28.57, & 29.34 % was observed in case
of 48 hr and reduction of 40.55, 29.41, & 30.25 % in inoculation performed for one week.
154
The reduction has gone up to 41.95, 30.25 & 32.06 % in inoculation performed for one
month inoculation time in light, middle and heavy fractions, respectively.
Thiol or mercaptane sulfur has been traced in various fermentation times as 31.74,
25.54 & 25.72 % ; 4.41, 1.35 & 0.91 % ; 2.31, 1.68 & 2.71 % ; 2.09, 0.84 & 0.91 % and
1.4, 0.84 & 1.81 % in the form of virgin – 12hr, 12hr – 24 hr, 24hr – 48hr, 48hr – one
week and one week – month respectively in light, meddle and heavy fractions.
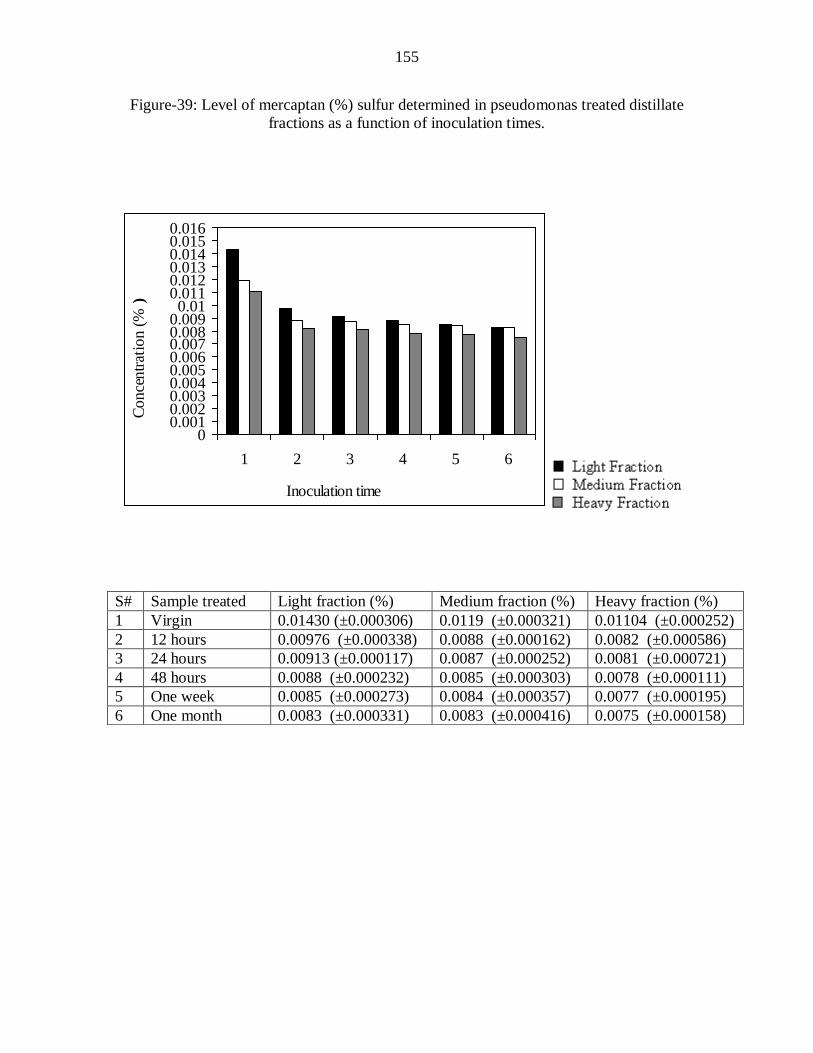
155
Figure-39: Level of mercaptan (%) sulfur determined in pseudomonas treated distillate
fractions as a function of inoculation times.
00.0010.0020.0030.0040.0050.0060.0070.0080.0090.01
0.0110.0120.0130.0140.0150.016
1 2 3 4 5 6
Inoculation time
Co
nce
ntr
atio
n (%
)
S# Sample treated Light fraction (%) Medium fraction (%) Heavy fraction (%)
1 Virgin 0.01430 (±0.000306) 0.0119 (±0.000321) 0.01104 (±0.000252)
2 12 hours 0.00976 (±0.000338) 0.0088 (±0.000162) 0.0082 (±0.000586)
3 24 hours 0.00913 (±0.000117) 0.0087 (±0.000252) 0.0081 (±0.000721)
4 48 hours 0.0088 (±0.000232) 0.0085 (±0.000303) 0.0078 (±0.000111)
5 One week 0.0085 (±0.000273) 0.0084 (±0.000357) 0.0077 (±0.000195)
6 One month 0.0083 (±0.000331) 0.0083 (±0.000416) 0.0075 (±0.000158)

156
Figure-40: Reduction percentage (%) of mercaptan sulfur determined in P.putida treated
distillate fractions as a function of inoculation time.
0369
121518212427303336394245
1 2 3 4 5
Inoculattion times
Red
uct
ion
perc
enta
ge
(% )
S# Sample treated Light fraction (%) Middle fraction (%) Heavy fraction (%)
1 Virgin -12 hours 31.748 25.546 25.724
2 Virgin –24 hours 36.153 26.890 26.630
3 Virgin –48 hours 38.461 28.571 29.348
4 Virgin –one week 40.559 29.411 30.254
5 Virgin - one month 41.958 30.252 32.065
157
Removal with T.Thioxidanes
Bacterial strain T. Thioxidans has also been tested for mercaptan sulfur removal,
where it has successfully removed enough sulfur contents, and reduced the level of
mercaptane sulfur. Sulphur contents determined in residual samples from inoculation
performed with the strain understudy for time duration of 12 and 24 hr contact time were
0.0092, 0.0083, & 0.0076 % and 0.0088, 0.0081, & 0.0075 %. The sulphur contents
determined in case of 48 hr inoculation were 0.0087, 0.0081, & 0.0069 % Mercaptane
sulfur was further decreased by keeping the strain in contact for one week and one month,
and the corresponding values of the mercaptan sulfur were 0.0085, 0.0079, & 0.0068 %
and 0.0083, 0.0078 & 0.0064 % in light, middle and heavy fractions, respectively
(Fig.41).
Percent reduction by T. thiobacillus is clearly shown in Fig.42, where during the
first 12 hr and 24 hr, reduction of 35.66, 30.08, & 30.52 %, and 38.53, 31.42, 31.70 %
was noticed. Reduction of 38.95, 32.68, & 36.86 %, 40.27, 33.52, & 37.40 % and 41.81,
34.53, & 40.02 % was observed in the inoculations performed for 48hr, one week and
one month.
Similarly in T.thiobacillus treated samples mercaptane sulfur has been
determined different contact which were found to be 35.66, 30.08 & 30.52 % ; 2.81, 1.34,
& 1.18 % ; 0.18, 1.26 & 5.34 % ; 1.32, 1.01 & 5.16 % and 1.54, 1.01 & 2.62 % in virgin
– 12hr, 12hr – 24 hr, 24hr – 48hr, 48hr – one week and one week – month respectively in
light, meddle and heavy fractions.
From the data given it is quite clear that T.thioxidans has significantly reduced
mercaptane sulfur than P.putida as well as chemical treatments used in this study.
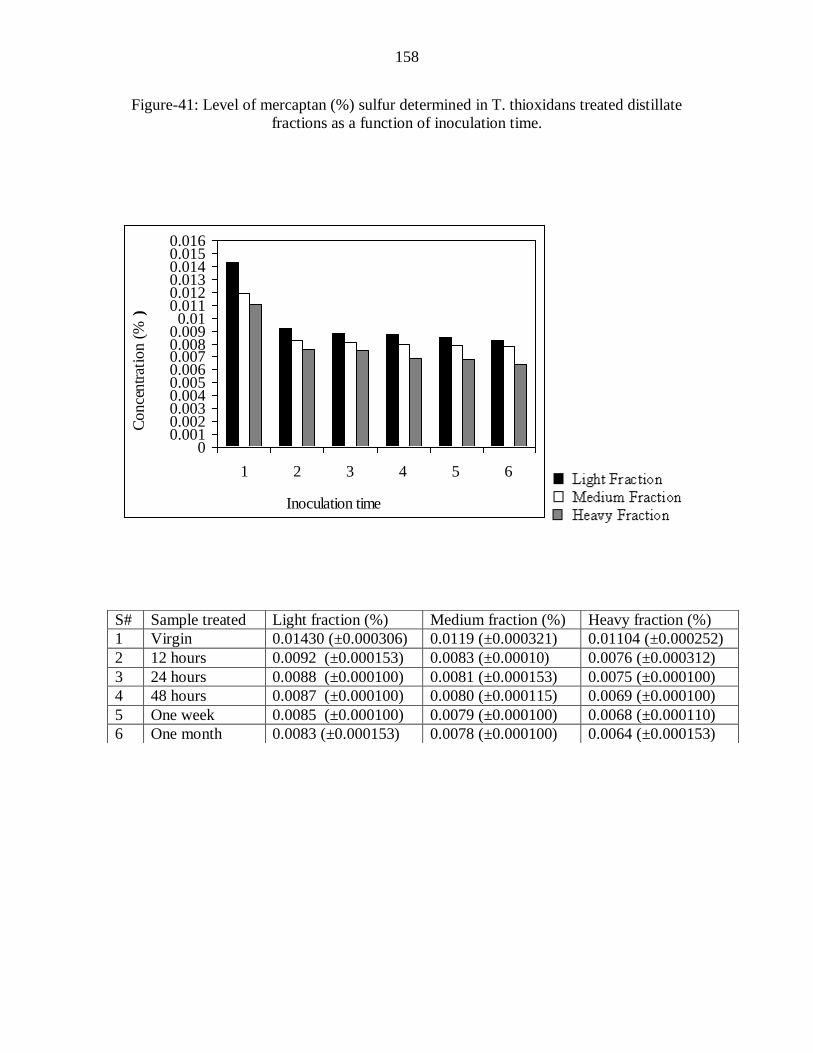
158
Figure-41: Level of mercaptan (%) sulfur determined in T. thioxidans treated distillate
fractions as a function of inoculation time.
00.0010.0020.0030.0040.0050.0060.0070.0080.0090.01
0.0110.0120.0130.0140.0150.016
1 2 3 4 5 6
Inoculation time
Co
nce
ntr
atio
n (%
)
S# Sample treated Light fraction (%) Medium fraction (%) Heavy fraction (%)
1 Virgin 0.01430 (±0.000306) 0.0119 (±0.000321) 0.01104 (±0.000252)
2 12 hours 0.0092 (±0.000153) 0.0083 (±0.00010) 0.0076 (±0.000312)
3 24 hours 0.0088 (±0.000100) 0.0081 (±0.000153) 0.0075 (±0.000100)
4 48 hours 0.0087 (±0.000100) 0.0080 (±0.000115) 0.0069 (±0.000100)
5 One week 0.0085 (±0.000100) 0.0079 (±0.000100) 0.0068 (±0.000110)
6 One month 0.0083 (±0.000153) 0.0078 (±0.000100) 0.0064 (±0.000153)
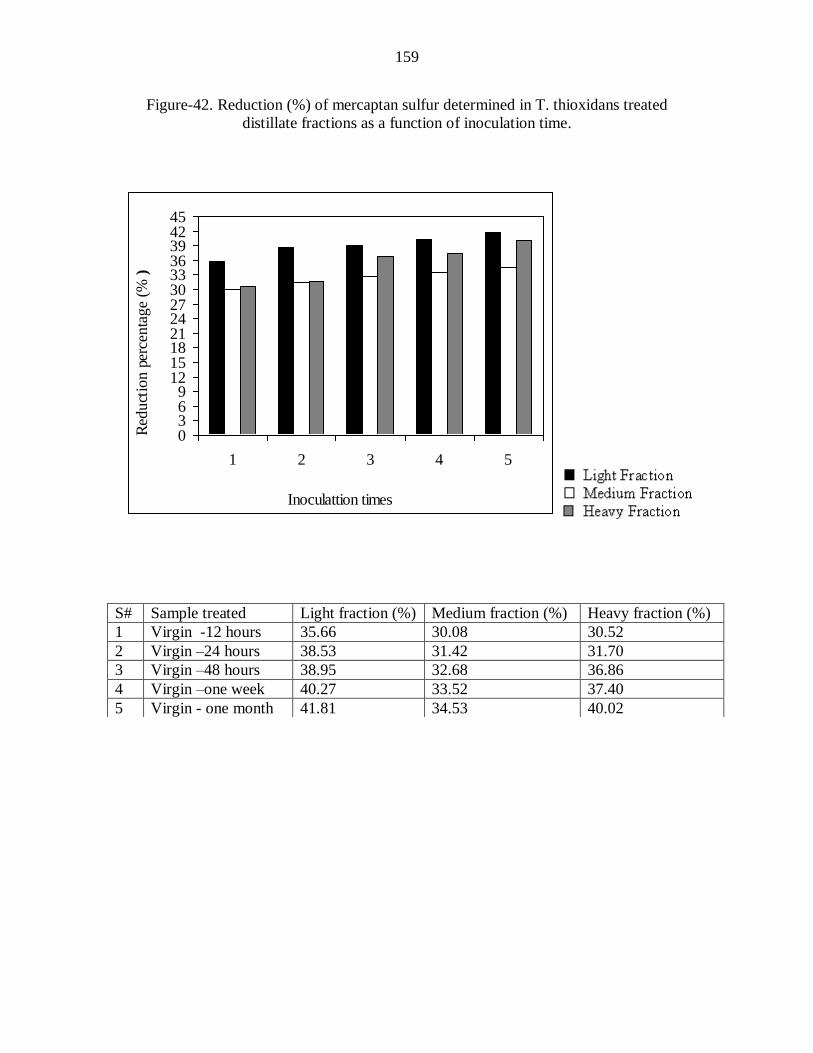
159
Figure-42. Reduction (%) of mercaptan sulfur determined in T. thioxidans treated
distillate fractions as a function of inoculation time.
0369
121518212427303336394245
1 2 3 4 5
Inoculattion times
Red
uct
ion
perc
enta
ge
(% )
S# Sample treated Light fraction (%) Medium fraction (%) Heavy fraction (%)
1 Virgin -12 hours 35.66 30.08 30.52
2 Virgin –24 hours 38.53 31.42 31.70
3 Virgin –48 hours 38.95 32.68 36.86
4 Virgin –one week 40.27 33.52 37.40
5 Virgin - one month 41.81 34.53 40.02
160
3.2.9. Removal of hydrogen sulfide
Hydrogen sulfide was determined in the original and variously inoculated
samples by volumetric method ( ASTM 1, 103/ 88). This method is intended for
the determination of hydrogen sulfide in crude oil and their distillation fractions.
The hydrogen sulfide present in the sample is converted to the cadmium sulfide by
reaction with cadmium sulfate solution. The sulfide precipitate is filtered off and is
acidified in the presence of measured volume of standard iodine solution, the
excess of which is then determined by titrating with standard sodium thiosulfate
solution. In this way, virgin fractions and the fractions, which were reacted with
the four chemicals were treated and the collected data of the analyzed hydrogen
sulfide is presented in Fig.43 for virgin and chemically treated samples. The
amount of hydrogen sulfide (H2S) found in virgin distillates were 0.0170, 0.0120
& 0.0090 % in light, middle and heavy fractions, respectively.
Chemical Removal
For chemical desulphurization, the fractions understudy was scrubbed with
the same set of chemicals used in the aforementioned sections. The values of
hydrogen sulphide determined in the residual samples from these treatments were
0.0164, 0.0155 & 0.0087 % ; 0.0157, 0.0112 & 0.0085 % ; 0.0142, 0.0106 &
0.0079 % and 0.0134, 0.0102 & 0.0071 % in case of HCl, NaOH, Na2HAsO4 and
NH4VO3 treatments, respectively (Fig.43). It can be seen from this data that H2S is
mainly present in the light distillate and less amount is present in heavy distillates.
161
The comparative investigation has been determined in the form of reduction
percentage for the said applied chemicals and the data collected has been shown in Fig.
44. A reduction of .352, 4.16 & 3.33 % ; 7.64, 6.66 & 5.55 % ; 16.47, 11.66 & 12.22 % ;
21.17, 15.00 & 21.11 % was observed in case of HCl, NaOH, Na2HAsO4 and NH4VO3
treatments, respectively. It is clear that almost maximum reduction has been taken place
with ammonium vendate than the rest ones.
Hydrogen sulfide was determined among the scrubbing chemicals leachents
which was 3.52,4.16 & 3.33 % ; 4.12, 2.5 & 2.22 % ; 8.83, 5.00 & 6.0 % ; 4.7, 3.34 &
8.89 % respectively in the samples of virgin – HCL , HCL – NaOH, NaOH- Na2HAsO4
and Na2HAsO4- NH4VO3 in light , middle and heavy fractions.
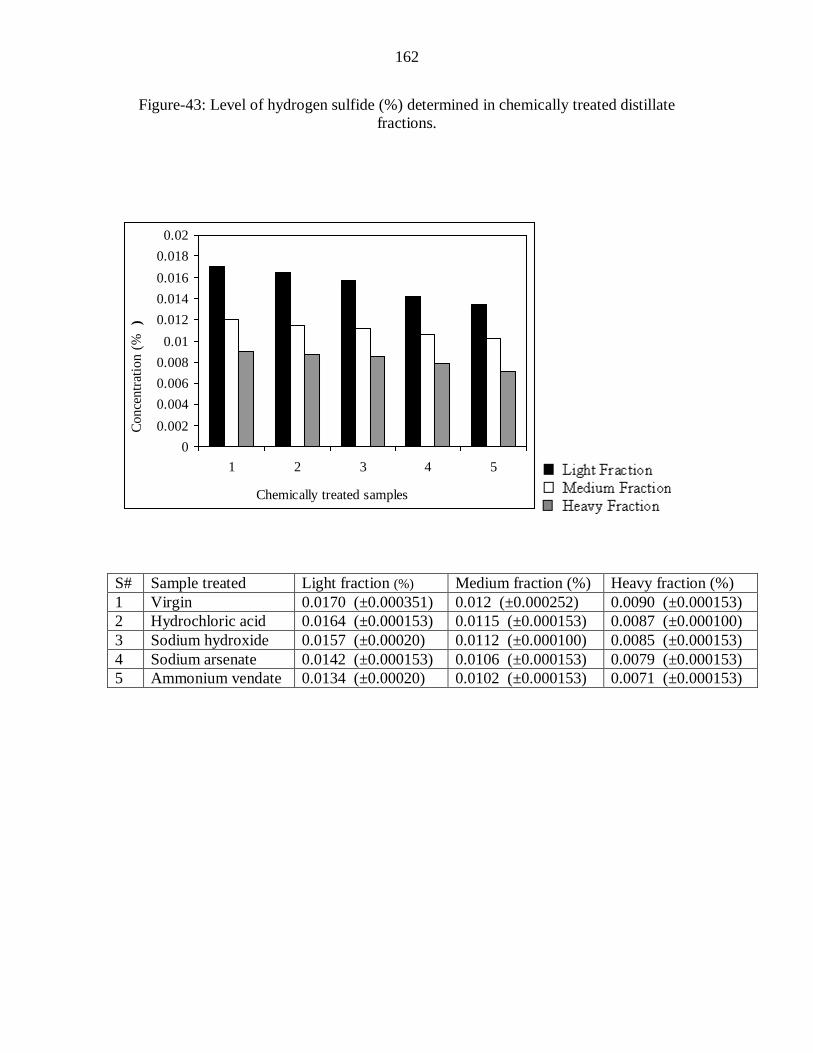
162
Figure-43: Level of hydrogen sulfide (%) determined in chemically treated distillate
fractions.
0
0.002
0.004
0.006
0.008
0.01
0.012
0.014
0.016
0.018
0.02
1 2 3 4 5
Chemically treated samples
Co
nce
ntr
atio
n (
%
)
S# Sample treated Light fraction (%) Medium fraction (%) Heavy fraction (%)
1 Virgin 0.0170 (±0.000351) 0.012 (±0.000252) 0.0090 (±0.000153)
2 Hydrochloric acid 0.0164 (±0.000153) 0.0115 (±0.000153) 0.0087 (±0.000100)
3 Sodium hydroxide 0.0157 (±0.00020) 0.0112 (±0.000100) 0.0085 (±0.000153)
4 Sodium arsenate 0.0142 (±0.000153) 0.0106 (±0.000153) 0.0079 (±0.000153)
5 Ammonium vendate 0.0134 (±0.00020) 0.0102 (±0.000153) 0.0071 (±0.000153)
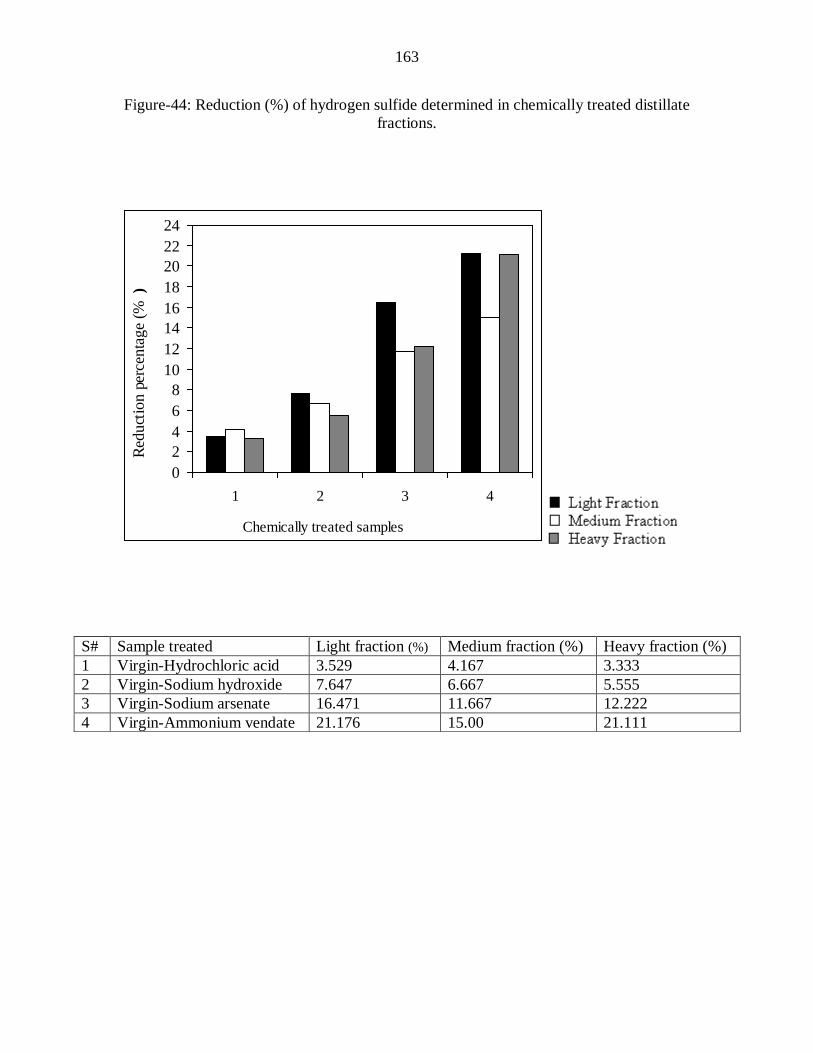
163
Figure-44: Reduction (%) of hydrogen sulfide determined in chemically treated distillate
fractions.
0
2
4
6
8
10
12
14
16
18
20
22
24
1 2 3 4
Chemically treated samples
Red
uct
ion
perc
enta
ge
(%
)
S# Sample treated Light fraction (%) Medium fraction (%) Heavy fraction (%)
1 Virgin-Hydrochloric acid 3.529 4.167 3.333
2 Virgin-Sodium hydroxide 7.647 6.667 5.555
3 Virgin-Sodium arsenate 16.471 11.667 12.222
4 Virgin-Ammonium vendate 21.176 15.00 21.111
164
Biological Removal
Removal with P.putida
Hydrogen sulfide has been removed biologically by treating the samples
understudy with Ps. putida for various inoculation times (12hr- one month).
Hydrogen sulfide contents were observed to be depleted in the light, middle and
heavy distillates of crude oil when these were inoculated with bacterial strain used.
Original sample was analyzed for the determination of hydrogen sulfide and its values
were found to be 0.0170, 0.012, & 0.0090 % in light, middle and heavy fractions
respectively. The original samples were then inoculated for time duration of 12 hr, the
H2S contents observed in the residual samples were 0.0104, 0.0081 & 0.0062 %. For
further removal of hydrogen sulfide, the inoculation time was extended beyond 12 hr
ranges from 24 hr up to one month (720 hr). Hydrogen sulphide contents determined in
the residual samples from these inoculations were found to be 0.0094, 0.0072 & 0.0057
% ; 0.0090, 0.0063 & 0.0048 % ; 0.0081, 0.0057 & 0.0046 %, 0.0072, 0.0049, & 0.0046
% in case of 24 hr, 48 hr, one week and a one month, respectively as shown in Fig.45.
This indicates that a marginal depletion has been occurred due to the interaction of the
applied microorganism with the oil samples under study in contact time beyond 12 hr.
The reason is that the strain gets immobilized after 12 hr.
Percent reduction made by P.putida during variously inoculated samples has also
been investigated, and all the findings are assembled in Fig.46. In case of 12 hr, 24 hr,
and 48 hr, these values are 38.82, 32.50 & 31.11 % ; 44.70, 40.00 & 36.66 % ; 47.05,
47.50 & 46.66 % respectively in light, middle and heavy fractions.
165
The time of fermentation was extended for one week and one month, which
increased the reduction percentage to 52.35, 52.50 & 61.66 and 57.64, 59.16 & 66.66 %
in light, middle and heavy fractions, respectively which shows a comparatively high
amount of H2S removal from all the distillate fractions compared to chemically treated
samples.
Among the mentioned inoculation times again hydrogen sulfide has been
determined which was found to be 038.82, 32.50 & 31.11 % ; 5.88, 7.50 & 5.55 % ; 2.35,
7.56 & 10.00 % ; 5.3, 5.00 & 15.00 % and 5.29, 6.60 & 5.00 % in pseudomonas treated
samples in different cases like virgin – 12hr, 12hr – 24 hr, 24hr – 48hr, 48hr – one week
and one week – month respectively in light, meddle and heavy fractions.
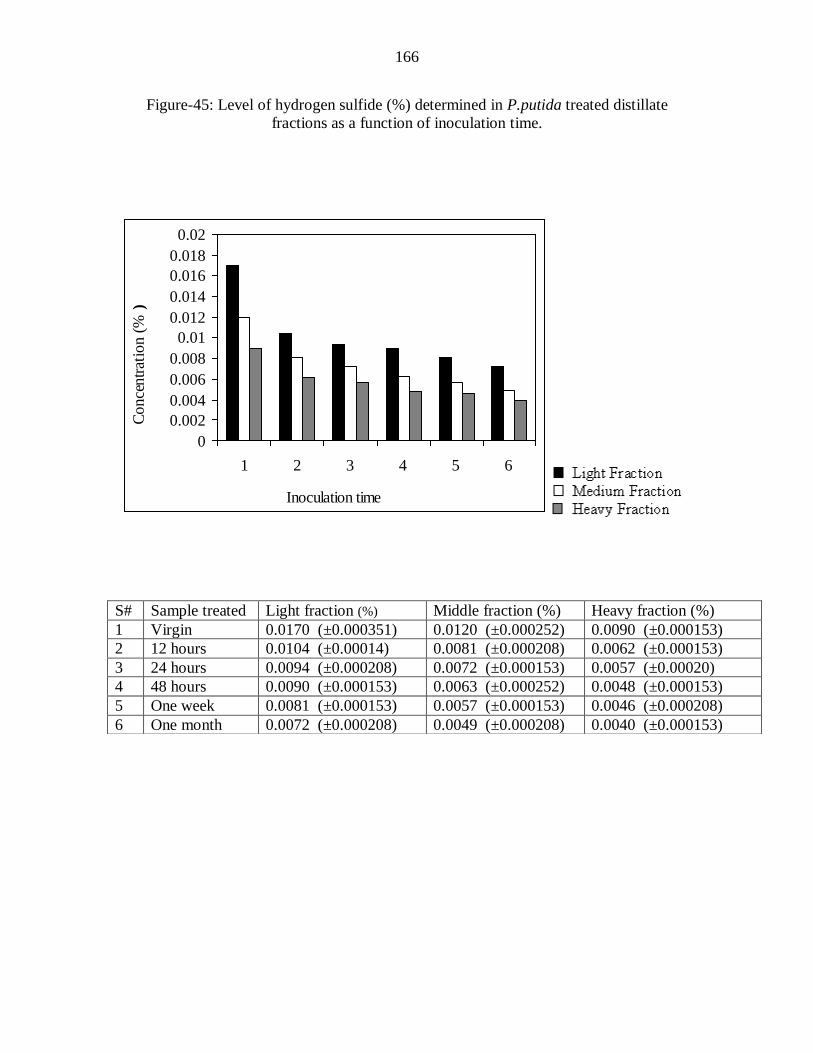
166
Figure-45: Level of hydrogen sulfide (%) determined in P.putida treated distillate
fractions as a function of inoculation time.
0
0.002
0.004
0.006
0.008
0.01
0.012
0.014
0.016
0.018
0.02
1 2 3 4 5 6
Inoculation time
Co
nce
ntr
atio
n (%
)
S# Sample treated Light fraction (%) Middle fraction (%) Heavy fraction (%)
1 Virgin 0.0170 (±0.000351) 0.0120 (±0.000252) 0.0090 (±0.000153)
2 12 hours 0.0104 (±0.00014) 0.0081 (±0.000208) 0.0062 (±0.000153)
3 24 hours 0.0094 (±0.000208) 0.0072 (±0.000153) 0.0057 (±0.00020)
4 48 hours 0.0090 (±0.000153) 0.0063 (±0.000252) 0.0048 (±0.000153)
5 One week 0.0081 (±0.000153) 0.0057 (±0.000153) 0.0046 (±0.000208)
6 One month 0.0072 (±0.000208) 0.0049 (±0.000208) 0.0040 (±0.000153)
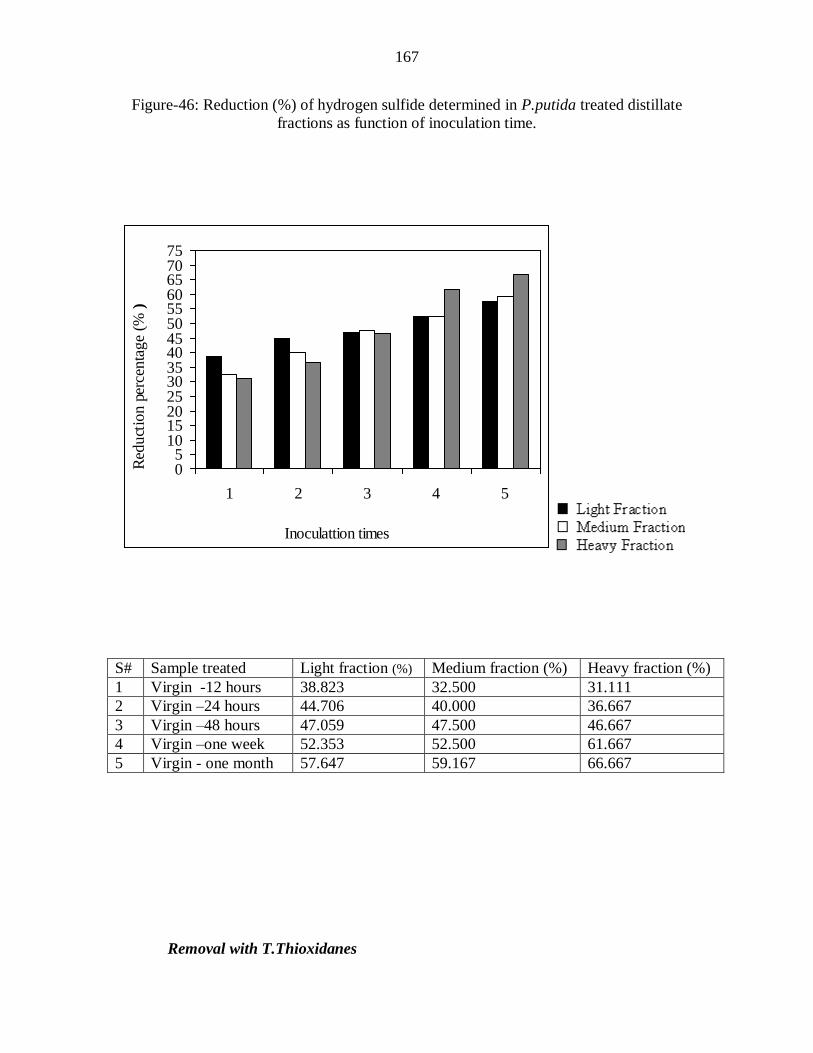
167
Figure-46: Reduction (%) of hydrogen sulfide determined in P.putida treated distillate
fractions as function of inoculation time.
05
1015202530354045505560657075
1 2 3 4 5
Inoculattion times
Red
uct
ion
perc
enta
ge
(% )
Removal with T.Thioxidanes
S# Sample treated Light fraction (%) Medium fraction (%) Heavy fraction (%)
1 Virgin -12 hours 38.823 32.500 31.111
2 Virgin –24 hours 44.706 40.000 36.667
3 Virgin –48 hours 47.059 47.500 46.667
4 Virgin –one week 52.353 52.500 61.667
5 Virgin - one month 57.647 59.167 66.667
168
Samples were inoculated with the second strain to view its capability for removal
of hydrogen sulphide. Inoculation was performed for the same inoculation times as
selected in case of P.putida. From the Fig. 47, it is observed that in case of residual
samples from 12hr, 24hr and 48hr inoculations, H2S contents were 0.0097, 0.0070,&
0.0055 %; 0.0090, 0.0060, & 0.0048 % and 0.0086, 0.0054, &0.0042%, in light, middle
and heavy fractions, respectively. Hydrogen sulphide is a dangerous gas causes cellular
respiration, which paralyses pulmonary system and ultimately the result is death. If the
concentration is (15-50ppm), causes the irritation of mucous membrane, headache,
dizziness and nausea. Concentration (200-300ppm) causes respiratory arrest leading to
coma and if the concentration is 700 ppm and a person exposes for 30 minutes the results
is death. Bacteria took H2S from the sample and converted to elemental sulphur, which
further oxidized to sulphates, with the help of CO2 and O2 according to the mechanism
described elsewhere (77). The values of H2S determined in the residual samples from one
week and one month inoculations were 0.0075, 0.0048, & 0.0039 % and 0.0063, 0.0041,
& 0.0030 % in light, middle and heavy factions, respectively which shows a good
enhancement in H2S removal compared to that of pseudomonas putida.
Reduction made by T. thioxidans in light, middle and heavy fractions is quite
clear from the Fig. 48. A reduction of 42.94, 41.66, & 38.88 %; 47.05, 50.0,& 46.60 %;
49.41, 55.00,& 53.33 % in case of 12 hr, 24 hr and 48 hr inoculation times,
respectively. Reduction percentage was further increased along with increasing the
inoculation time and was found to be 5.88, 60.00, & 56.60 %, and 62.94, 65.83, & 66.660
% in one week and one month inoculation times. This shows that as long as T. thioxidans
remains inside the samples, it oxidizes the hydrogen sulfides to elemental sulfur and
169
onward oxidizes to sulfate, which are hydrophilic compounds, which leaves the oil
middle.
Similarly hydrogen sulfide was tested in T.thiobacillus inoculated samples and the
determinations were compiled as 42.94, 41.66 & 38.88; 4.11, 8.34 & 7.78 % ; 2.3, 5.00 &
6.67 ; 6.47, 5.00 & 3.33 % ;and 7.06, 5.83 & 10.00% in virgin – 12hr, 12hr – 24 hr, 24hr
– 48hr, 48hr – one week and one week – month respectively in light, meddle and heavy
fractions.
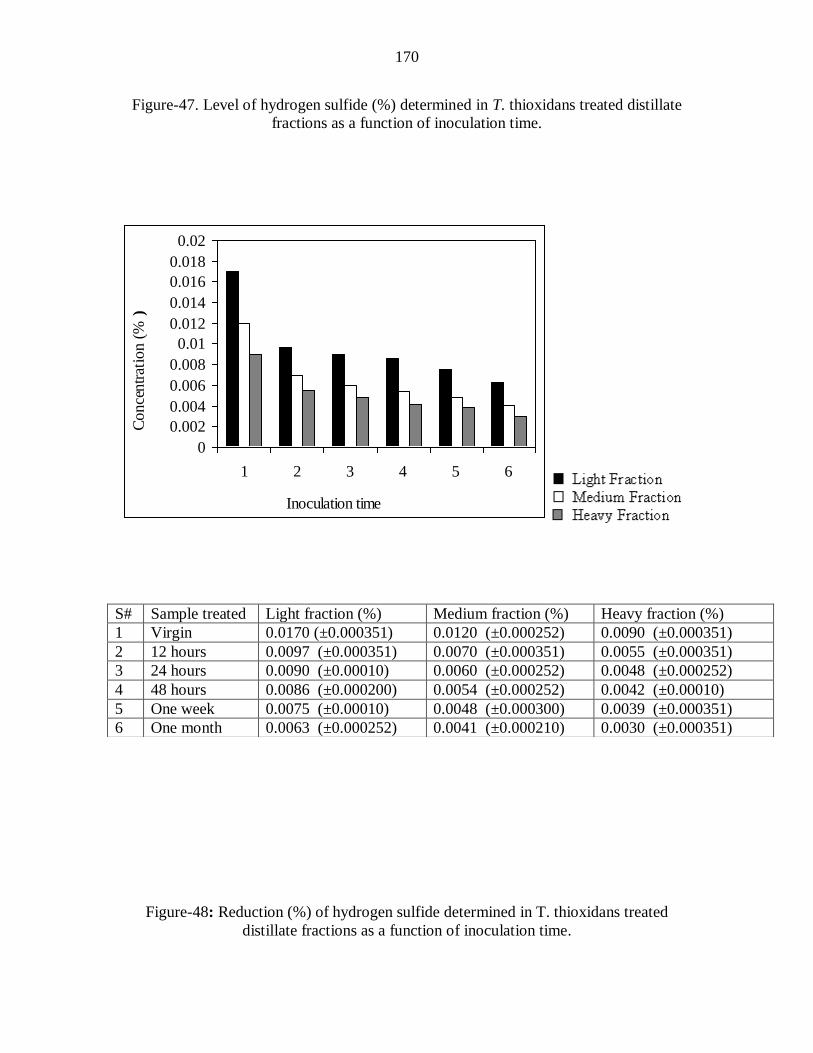
170
Figure-47. Level of hydrogen sulfide (%) determined in T. thioxidans treated distillate
fractions as a function of inoculation time.
0
0.002
0.004
0.006
0.008
0.01
0.012
0.014
0.016
0.018
0.02
1 2 3 4 5 6
Inoculation time
Co
nce
ntr
atio
n (%
)
Figure-48: Reduction (%) of hydrogen sulfide determined in T. thioxidans treated
distillate fractions as a function of inoculation time.
S# Sample treated Light fraction (%) Medium fraction (%) Heavy fraction (%)
1 Virgin 0.0170 (±0.000351) 0.0120 (±0.000252) 0.0090 (±0.000351)
2 12 hours 0.0097 (±0.000351) 0.0070 (±0.000351) 0.0055 (±0.000351)
3 24 hours 0.0090 (±0.00010) 0.0060 (±0.000252) 0.0048 (±0.000252)
4 48 hours 0.0086 (±0.000200) 0.0054 (±0.000252) 0.0042 (±0.00010)
5 One week 0.0075 (±0.00010) 0.0048 (±0.000300) 0.0039 (±0.000351)
6 One month 0.0063 (±0.000252) 0.0041 (±0.000210) 0.0030 (±0.000351)

171
05
1015202530354045505560657075
1 2 3 4 5
Inoculattion times
Red
ucti
on p
erce
ntag
e (%
)
S# Sample treated Light fraction (%) Middle fraction (%) Heavy fraction (%)
1 Virgin -12 hours 42.941 41.667 38.889
2 Virgin –24 hours 47.058 50.000 46.667
3 Virgin –48 hours 49.412 55.000 53.333
4 Virgin –one week 55.882 60.000 56.667
5 Virgin - one month 62.941 65.833 66.667
172
3.2.10. Removal of dibenzothiophene
Determination of dibenzothiophene was done Specrtrophotometrically
Thiophenic compounds include thiopenes, benzopthiophene (BT),
dibezothiophene (DBT), and benzonaphthothiophene (BNT). Each fraction was
subjected to GC-MS analysis by using both FPD and MS detectors (GC- FPD and GC-
MS, respectively for the isolation and identification of thiophenic compounds before and
after their treatment with chemicals and bacteria. Selective ion monitoring (SIM) mode
was applied during dibenzothiophene analyses, where the charge to mass ratio selected
value was (m/z 183) for dibenzothiophene ion (DBT +). All the three distillation fractions
were analyzed for DBT in virgin state. The sulphur contents determined were 290, 415,&
450 ppm in case of light, middle and heavy fractions, respectively.
Chemical Removal
Samples under trial were scrubbed with the chemicals already mentioned in the
previous sections for reduction of thiophenic sulfur compounds. The results obtained are
represented in Fig.49. Determination of this sulphur analogue was done in residual light,
middle and heavy oil fractions after being scrubbed with reagents under study. The
sulphur contents determined were 268, 382, & 410 ppm; 259, 370, & 396 ppm; 246, 355,
& 380 ppm and 230, 326, &350 ppm in hydrochloric acid (HCl), sodium hydroxide
(NaOH), sodium arsenate (Na2HAsO4) and ammonium vendate (NH4VO3) treated
samples, respectively. From the data collected, it is clear enough that ammonium vendate
has reduced the maximum amount of dibenzothiophene (DBT) i.e. from 290 to 230ppm,
415 to 326 ppm and 450 to 350ppm in light, middle and heavy fractions, respectively.
173
Percent reduction observed in each case is shown in Fig.50, which shows a
reduction of 7.95, 7.951, & 8.88 % was made by HCl in all the three samples
understudy. NaOH caused a reduction of 10.689, 10.843, & 12.00 %.Similarly, reduction
of 15.172, 14.45, & 15.55 % was made by Na2HAsO4, where as a reduction of 20.68,
21.44, & 22.22% was made by NH4VO3 in light, middle and heavy fractions,
respectively.
Dibenzothiophene compound was investigated among the chemical reagents used
were 7.58, 7.95 & 8.88 % ; 3.11, 2.89 & 3.12 % ; 4.48, 4.33 & 3.55 % and 5.52, 5.51 &
6.67 % respectively in the samples of virgin – HCL , HCL – NaOH, NaOH- Na2HAsO4
and Na2HAsO4- NH4VO3 in light , middle and heavy fractions.
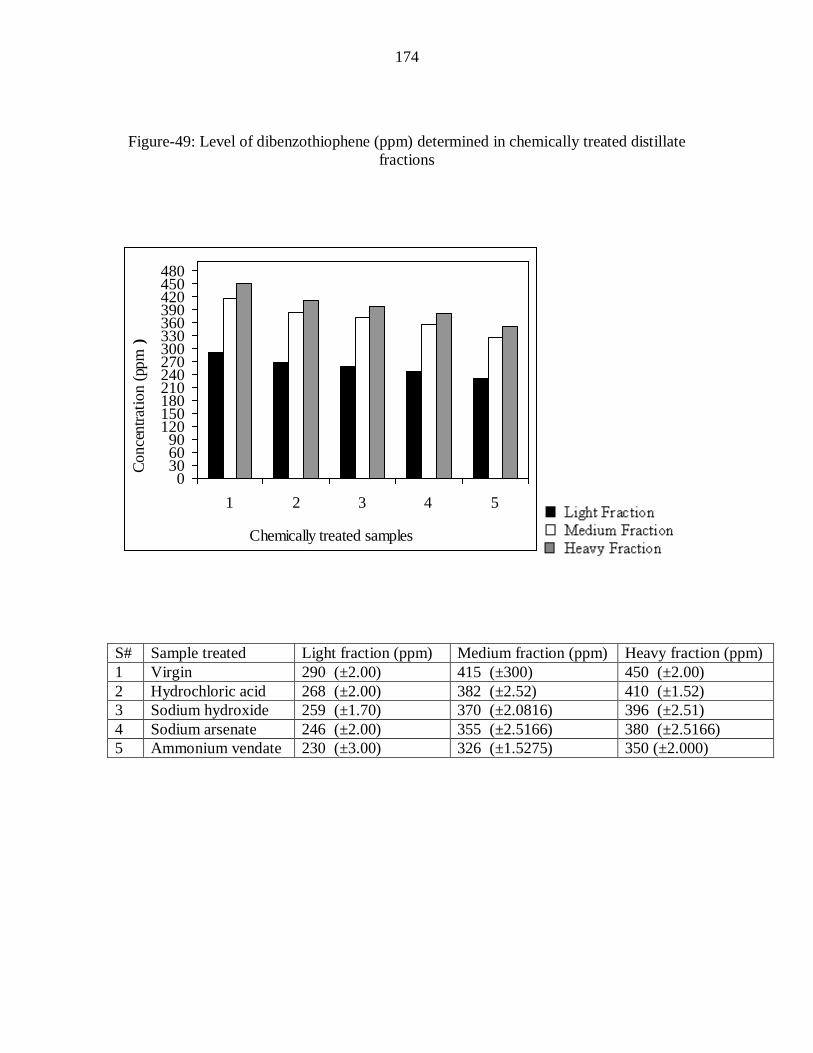
174
Figure-49: Level of dibenzothiophene (ppm) determined in chemically treated distillate
fractions
0306090
120150180210240270300330360390420450480
1 2 3 4 5
Chemically treated samples
Co
nce
ntr
atio
n (p
pm
)
S# Sample treated Light fraction (ppm) Medium fraction (ppm) Heavy fraction (ppm)
1 Virgin 290 (±2.00) 415 (±300) 450 (±2.00)
2 Hydrochloric acid 268 (±2.00) 382 (±2.52) 410 (±1.52)
3 Sodium hydroxide 259 (±1.70) 370 (±2.0816) 396 (±2.51)
4 Sodium arsenate 246 (±2.00) 355 (±2.5166) 380 (±2.5166)
5 Ammonium vendate 230 (±3.00) 326 (±1.5275) 350 (±2.000)
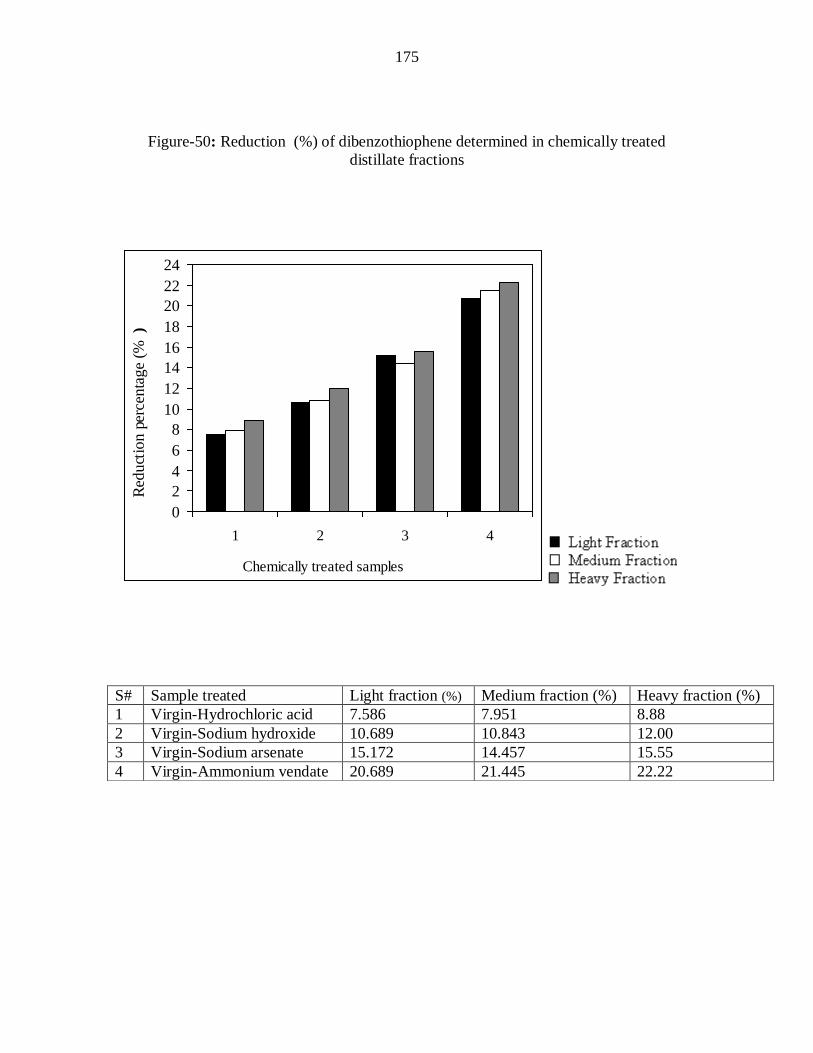
175
Figure-50: Reduction (%) of dibenzothiophene determined in chemically treated
distillate fractions
0
2
4
6
8
10
12
14
16
18
20
22
24
1 2 3 4
Chemically treated samples
Red
uct
ion
perc
enta
ge
(%
)
S# Sample treated Light fraction (%) Medium fraction (%) Heavy fraction (%)
1 Virgin-Hydrochloric acid 7.586 7.951 8.88
2 Virgin-Sodium hydroxide 10.689 10.843 12.00
3 Virgin-Sodium arsenate 15.172 14.457 15.55
4 Virgin-Ammonium vendate 20.689 21.445 22.22
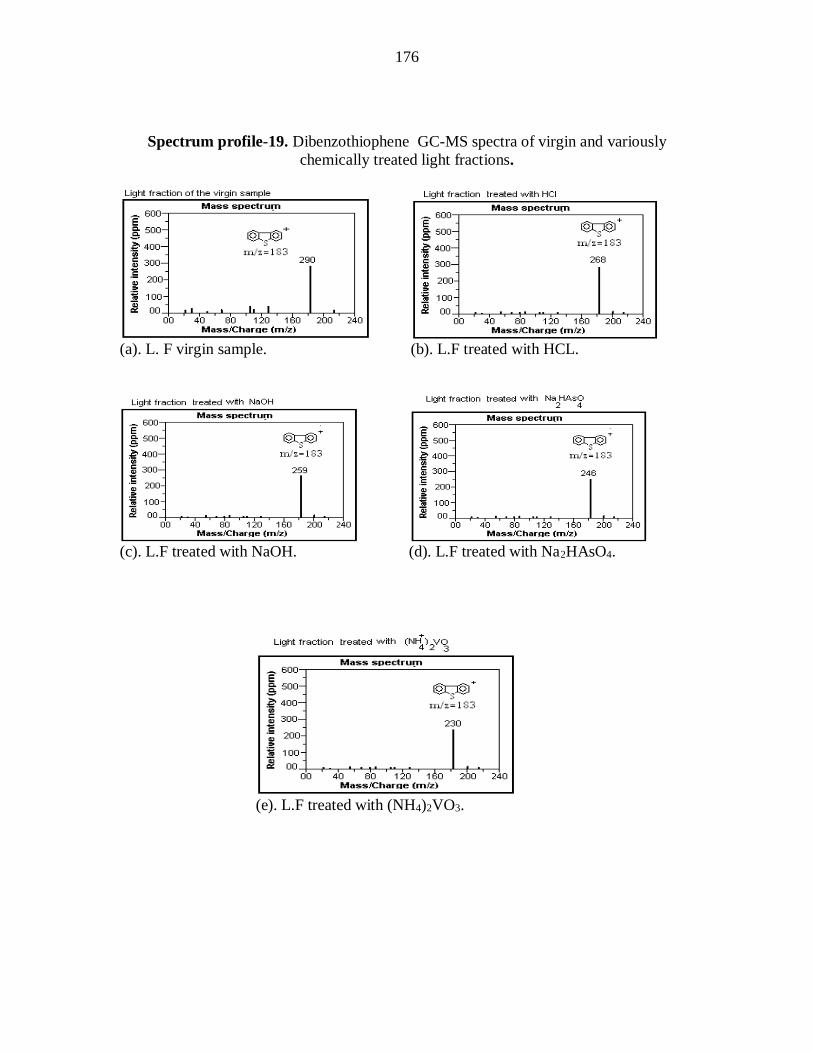
176
Spectrum profile-19. Dibenzothiophene GC-MS spectra of virgin and variously
chemically treated light fractions.
(a). L. F virgin sample. (b). L.F treated with HCL.
(c). L.F treated with NaOH. (d). L.F treated with Na2HAsO4.
(e). L.F treated with (NH4)2VO3.
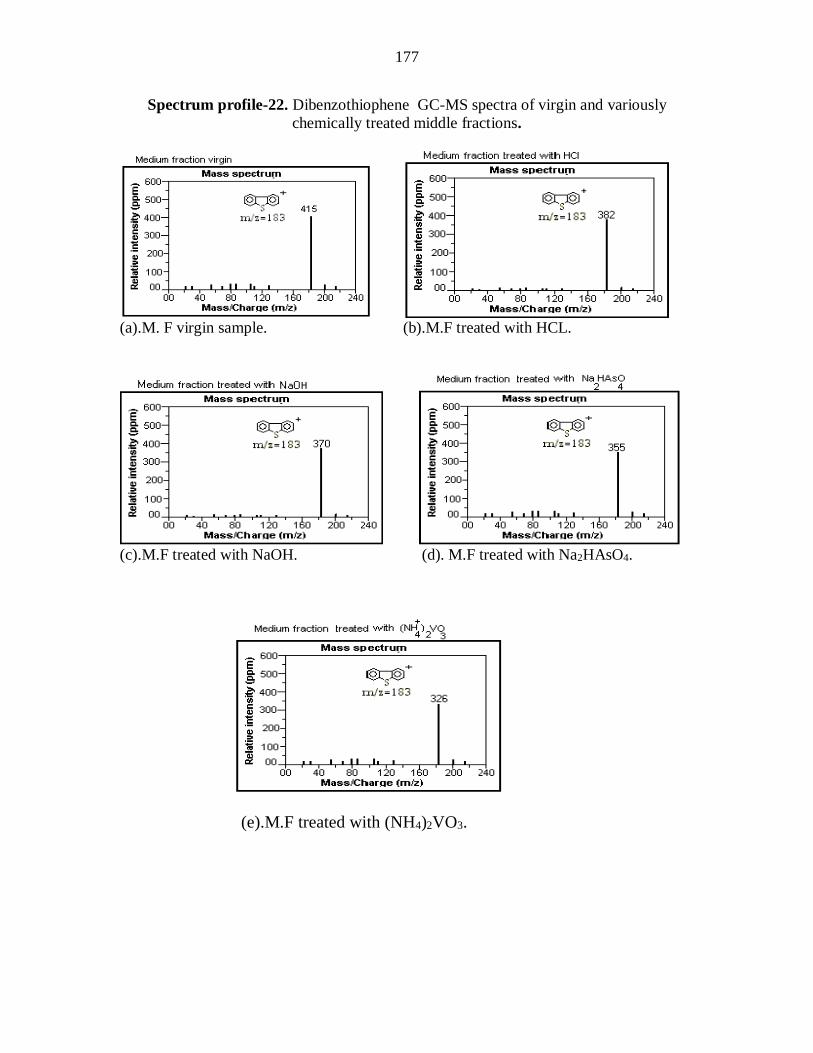
177
Spectrum profile-22. Dibenzothiophene GC-MS spectra of virgin and variously
chemically treated middle fractions.
(a).M. F virgin sample. (b).M.F treated with HCL.
(c).M.F treated with NaOH. (d). M.F treated with Na2HAsO4.
(e).M.F treated with (NH4)2VO3.
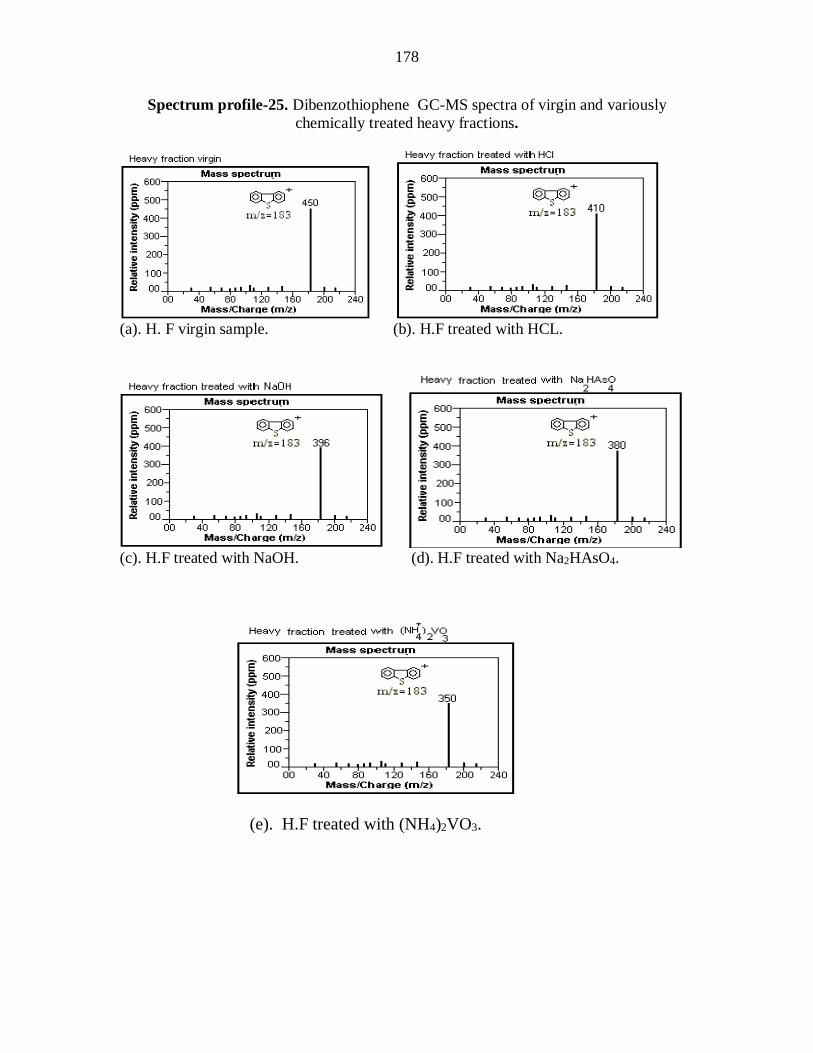
178
Spectrum profile-25. Dibenzothiophene GC-MS spectra of virgin and variously
chemically treated heavy fractions.
(a). H. F virgin sample. (b). H.F treated with HCL.
(c). H.F treated with NaOH. (d). H.F treated with Na2HAsO4.
(e). H.F treated with (NH4)2VO3.
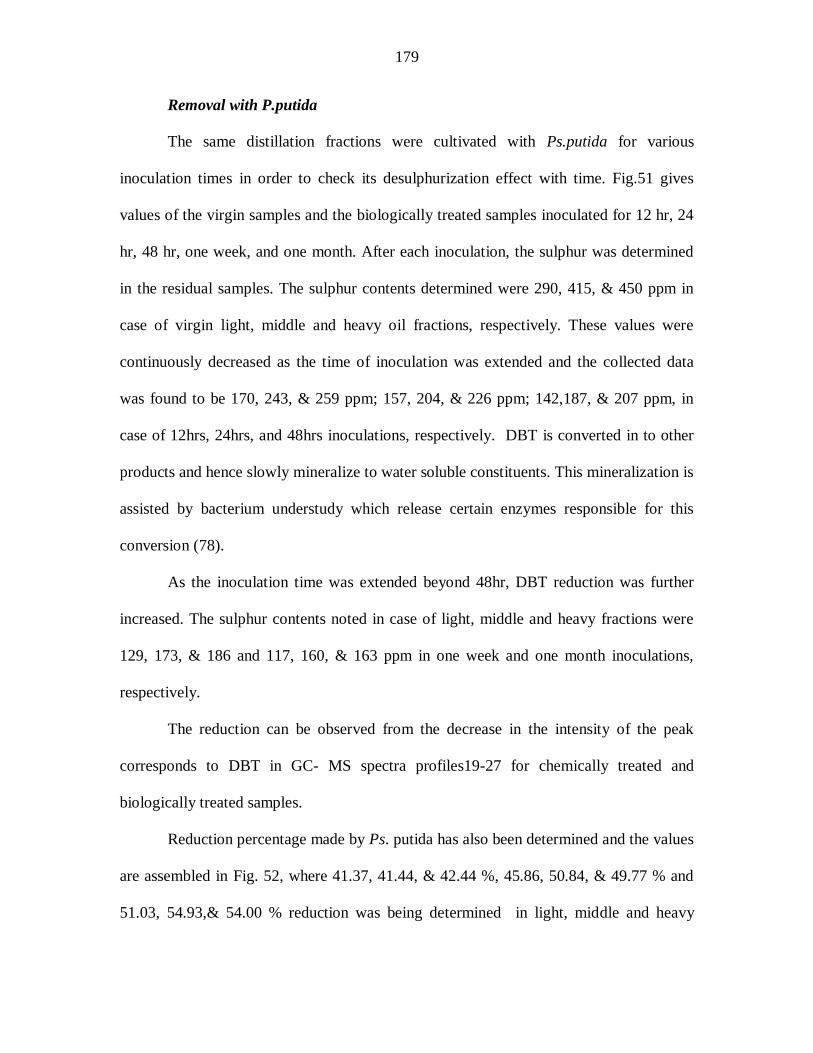
179
Removal with P.putida
The same distillation fractions were cultivated with Ps.putida for various
inoculation times in order to check its desulphurization effect with time. Fig.51 gives
values of the virgin samples and the biologically treated samples inoculated for 12 hr, 24
hr, 48 hr, one week, and one month. After each inoculation, the sulphur was determined
in the residual samples. The sulphur contents determined were 290, 415, & 450 ppm in
case of virgin light, middle and heavy oil fractions, respectively. These values were
continuously decreased as the time of inoculation was extended and the collected data
was found to be 170, 243, & 259 ppm; 157, 204, & 226 ppm; 142,187, & 207 ppm, in
case of 12hrs, 24hrs, and 48hrs inoculations, respectively. DBT is converted in to other
products and hence slowly mineralize to water soluble constituents. This mineralization is
assisted by bacterium understudy which release certain enzymes responsible for this
conversion (78).
As the inoculation time was extended beyond 48hr, DBT reduction was further
increased. The sulphur contents noted in case of light, middle and heavy fractions were
129, 173, & 186 and 117, 160, & 163 ppm in one week and one month inoculations,
respectively.
The reduction can be observed from the decrease in the intensity of the peak
corresponds to DBT in GC- MS spectra profiles19-27 for chemically treated and
biologically treated samples.
Reduction percentage made by Ps. putida has also been determined and the values
are assembled in Fig. 52, where 41.37, 41.44, & 42.44 %, 45.86, 50.84, & 49.77 % and
51.03, 54.93,& 54.00 % reduction was being determined in light, middle and heavy
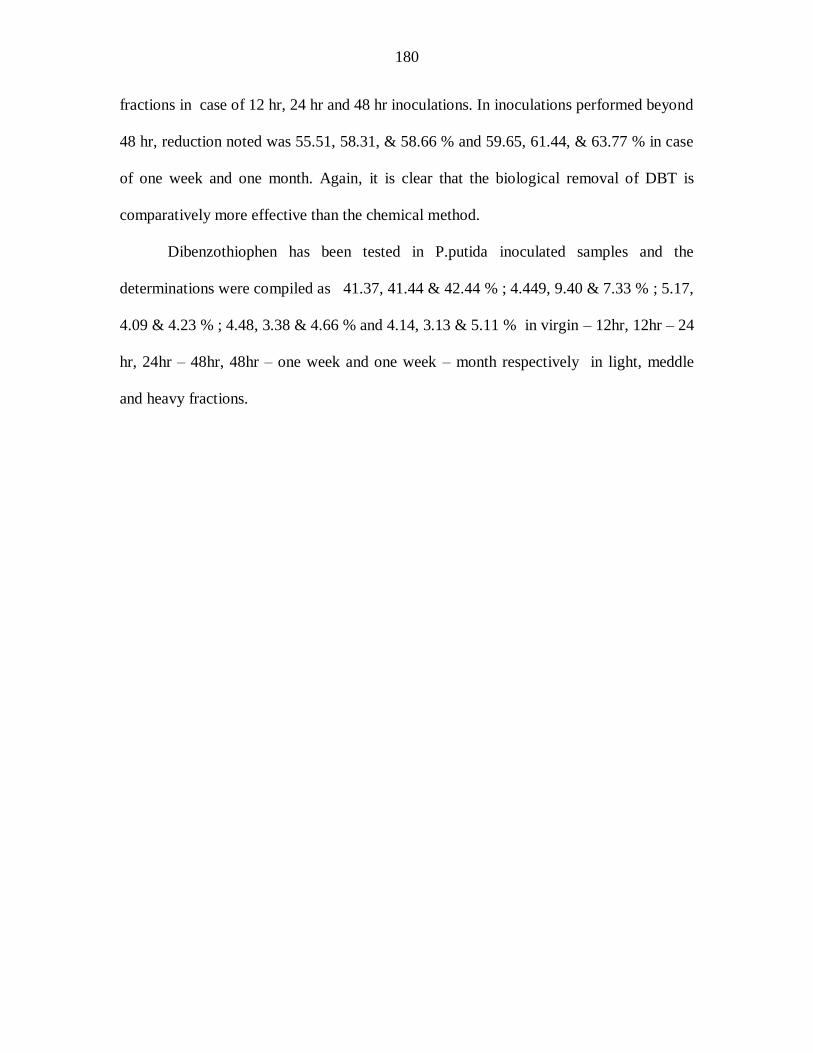
180
fractions in case of 12 hr, 24 hr and 48 hr inoculations. In inoculations performed beyond
48 hr, reduction noted was 55.51, 58.31, & 58.66 % and 59.65, 61.44, & 63.77 % in case
of one week and one month. Again, it is clear that the biological removal of DBT is
comparatively more effective than the chemical method.
Dibenzothiophen has been tested in P.putida inoculated samples and the
determinations were compiled as 41.37, 41.44 & 42.44 % ; 4.449, 9.40 & 7.33 % ; 5.17,
4.09 & 4.23 % ; 4.48, 3.38 & 4.66 % and 4.14, 3.13 & 5.11 % in virgin – 12hr, 12hr – 24
hr, 24hr – 48hr, 48hr – one week and one week – month respectively in light, meddle
and heavy fractions.
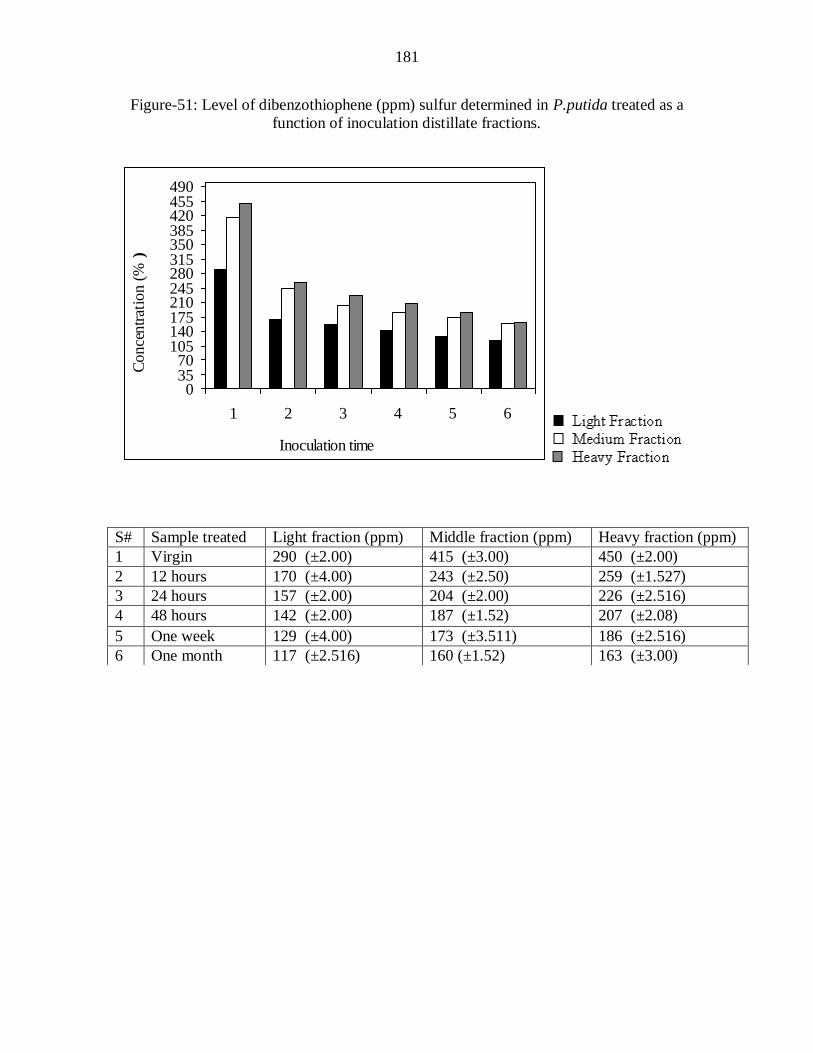
181
Figure-51: Level of dibenzothiophene (ppm) sulfur determined in P.putida treated as a
function of inoculation distillate fractions.
03570
105140175210245280315350385420455490
1 2 3 4 5 6
Inoculation time
Conce
ntr
atio
n (%
)
S# Sample treated Light fraction (ppm) Middle fraction (ppm) Heavy fraction (ppm)
1 Virgin 290 (±2.00) 415 (±3.00) 450 (±2.00)
2 12 hours 170 (±4.00) 243 (±2.50) 259 (±1.527)
3 24 hours 157 (±2.00) 204 (±2.00) 226 (±2.516)
4 48 hours 142 (±2.00) 187 (±1.52) 207 (±2.08)
5 One week 129 (±4.00) 173 (±3.511) 186 (±2.516)
6 One month 117 (±2.516) 160 (±1.52) 163 (±3.00)
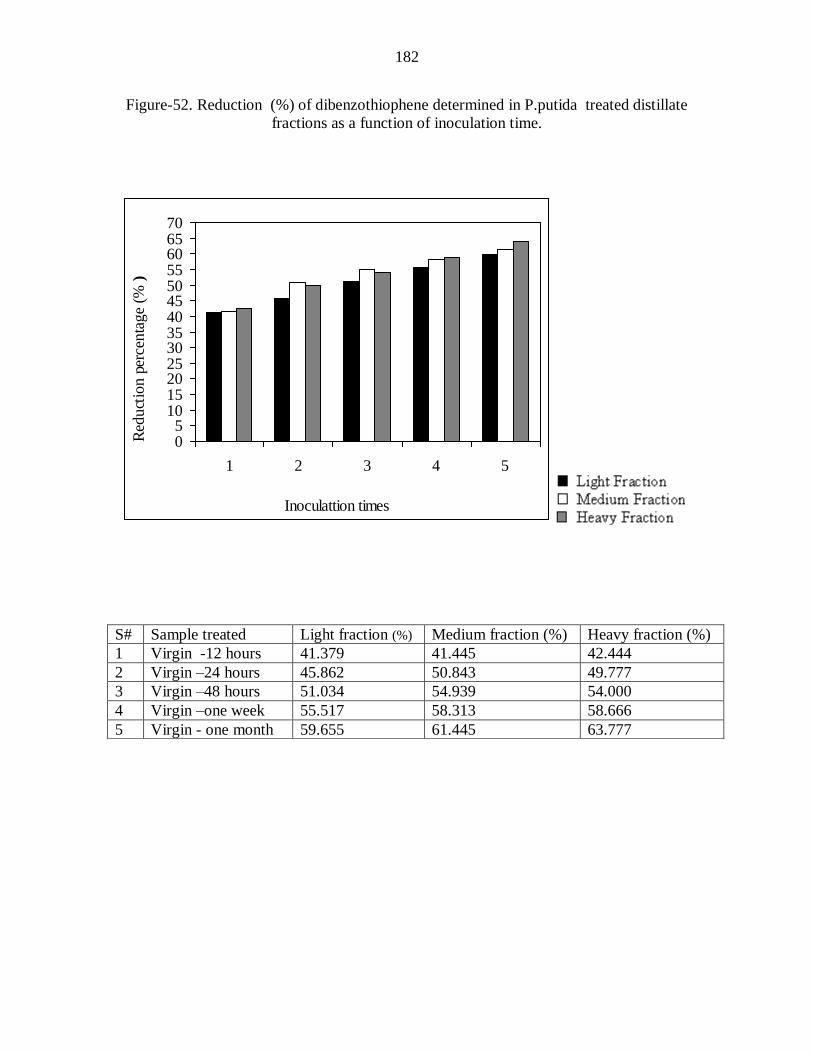
182
Figure-52. Reduction (%) of dibenzothiophene determined in P.putida treated distillate
fractions as a function of inoculation time.
05
10152025303540455055606570
1 2 3 4 5
Inoculattion times
Red
uct
ion
perc
enta
ge
(% )
S# Sample treated Light fraction (%) Medium fraction (%) Heavy fraction (%)
1 Virgin -12 hours 41.379 41.445 42.444
2 Virgin –24 hours 45.862 50.843 49.777
3 Virgin –48 hours 51.034 54.939 54.000
4 Virgin –one week 55.517 58.313 58.666
5 Virgin - one month 59.655 61.445 63.777
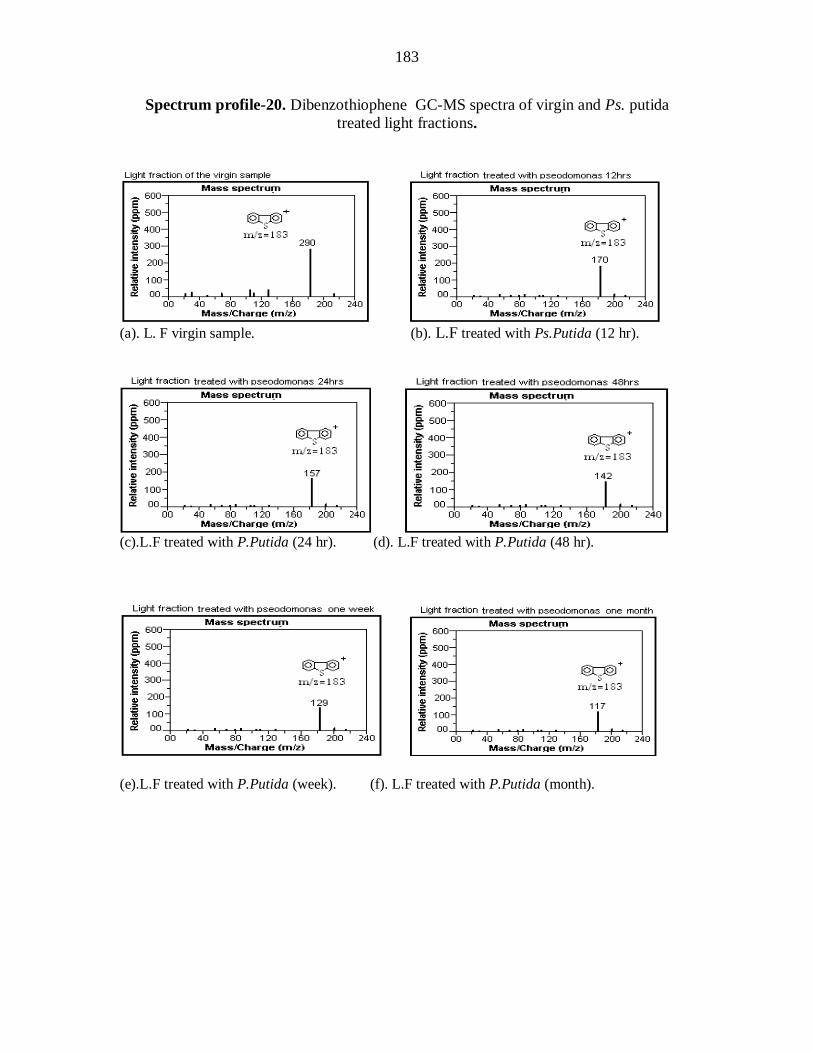
183
Spectrum profile-20. Dibenzothiophene GC-MS spectra of virgin and Ps. putida
treated light fractions.
(a). L. F virgin sample. (b). L.F treated with Ps.Putida (12 hr).
(c).L.F treated with P.Putida (24 hr). (d). L.F treated with P.Putida (48 hr).
(e).L.F treated with P.Putida (week). (f). L.F treated with P.Putida (month).
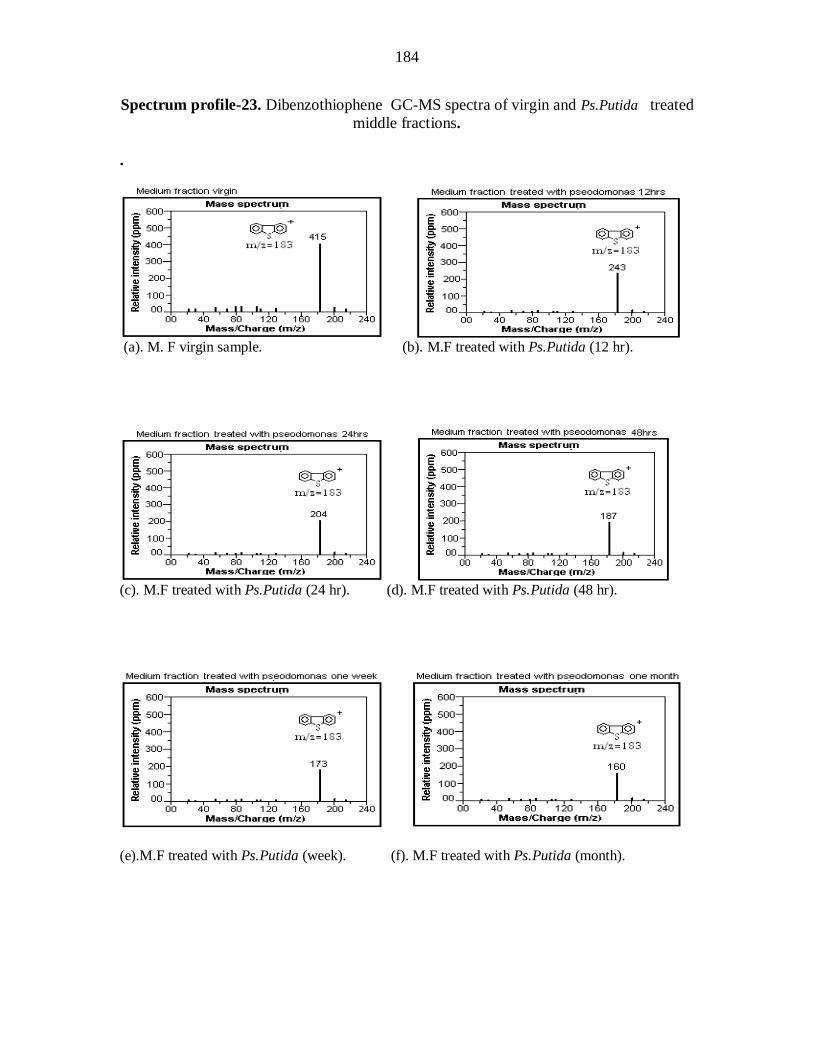
184
Spectrum profile-23. Dibenzothiophene GC-MS spectra of virgin and Ps.Putida treated
middle fractions.
.
(a). M. F virgin sample. (b). M.F treated with Ps.Putida (12 hr).
(c). M.F treated with Ps.Putida (24 hr). (d). M.F treated with Ps.Putida (48 hr).
(e).M.F treated with Ps.Putida (week). (f). M.F treated with Ps.Putida (month).
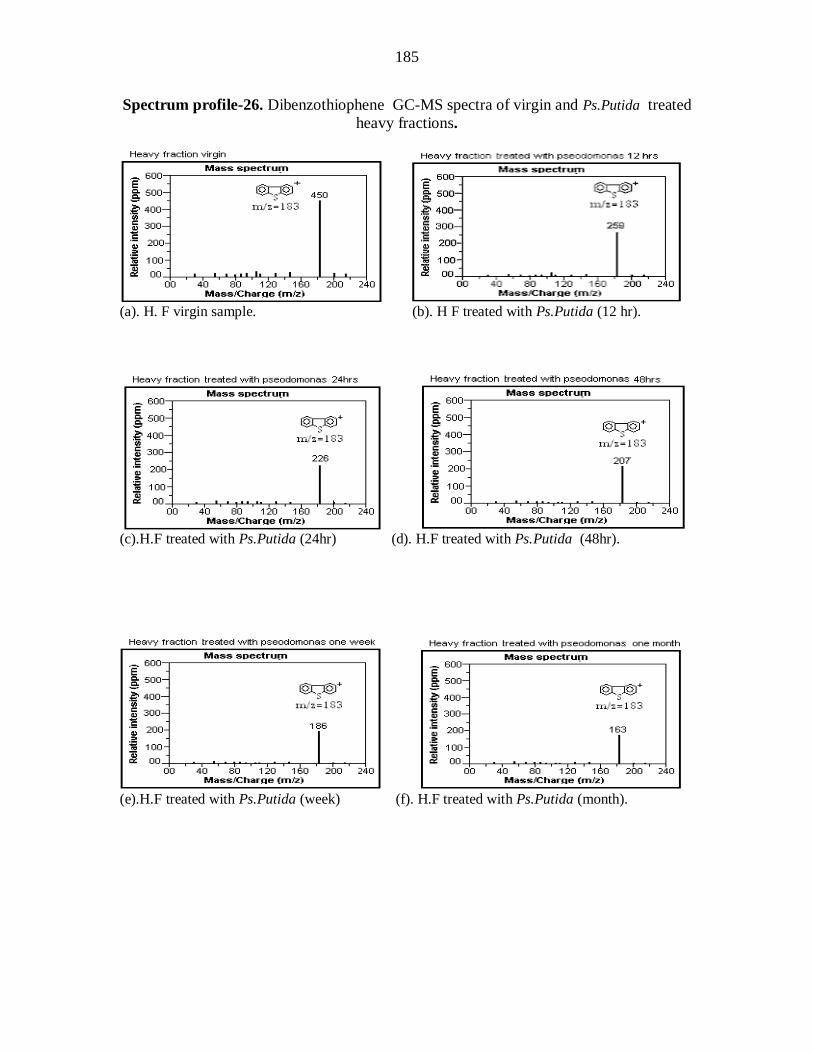
185
Spectrum profile-26. Dibenzothiophene GC-MS spectra of virgin and Ps.Putida treated
heavy fractions.
(a). H. F virgin sample. (b). H F treated with Ps.Putida (12 hr).
(c).H.F treated with Ps.Putida (24hr) (d). H.F treated with Ps.Putida (48hr).
(e).H.F treated with Ps.Putida (week) (f). H.F treated with Ps.Putida (month).
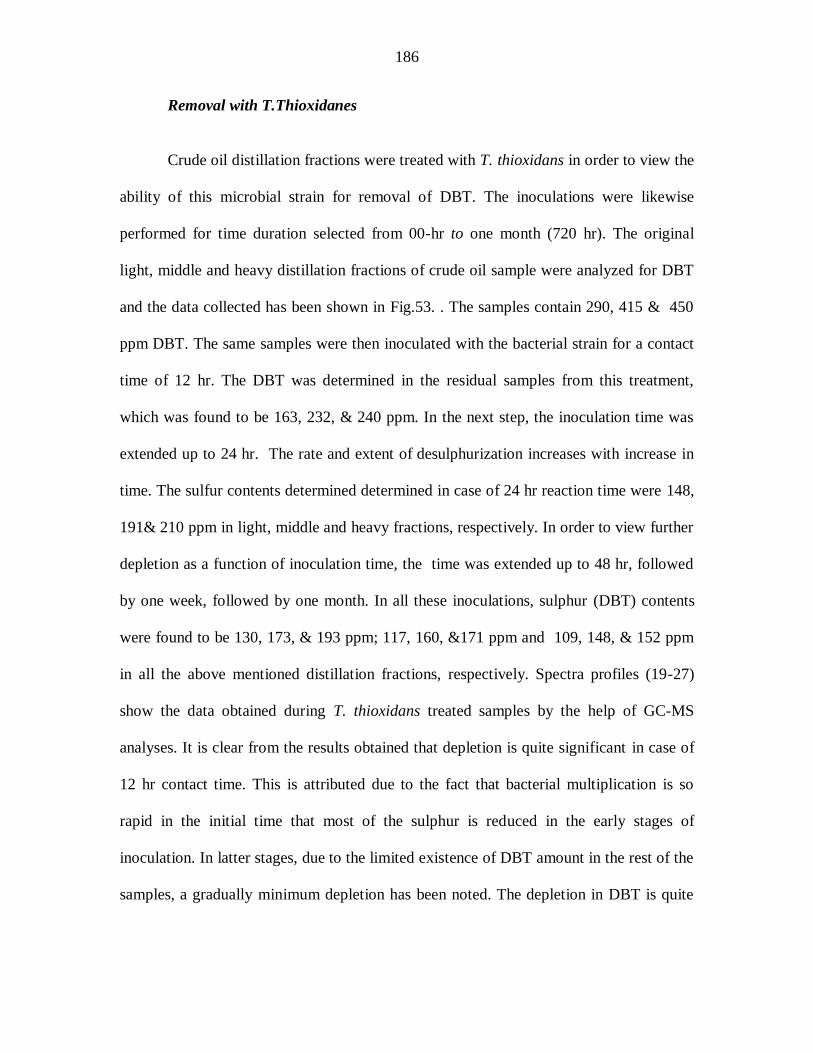
186
Removal with T.Thioxidanes
Crude oil distillation fractions were treated with T. thioxidans in order to view the
ability of this microbial strain for removal of DBT. The inoculations were likewise
performed for time duration selected from 00-hr to one month (720 hr). The original
light, middle and heavy distillation fractions of crude oil sample were analyzed for DBT
and the data collected has been shown in Fig.53. . The samples contain 290, 415 & 450
ppm DBT. The same samples were then inoculated with the bacterial strain for a contact
time of 12 hr. The DBT was determined in the residual samples from this treatment,
which was found to be 163, 232, & 240 ppm. In the next step, the inoculation time was
extended up to 24 hr. The rate and extent of desulphurization increases with increase in
time. The sulfur contents determined determined in case of 24 hr reaction time were 148,
191& 210 ppm in light, middle and heavy fractions, respectively. In order to view further
depletion as a function of inoculation time, the time was extended up to 48 hr, followed
by one week, followed by one month. In all these inoculations, sulphur (DBT) contents
were found to be 130, 173, & 193 ppm; 117, 160, &171 ppm and 109, 148, & 152 ppm
in all the above mentioned distillation fractions, respectively. Spectra profiles (19-27)
show the data obtained during T. thioxidans treated samples by the help of GC-MS
analyses. It is clear from the results obtained that depletion is quite significant in case of
12 hr contact time. This is attributed due to the fact that bacterial multiplication is so
rapid in the initial time that most of the sulphur is reduced in the early stages of
inoculation. In latter stages, due to the limited existence of DBT amount in the rest of the
samples, a gradually minimum depletion has been noted. The depletion in DBT is quite
187
significant compared to bacterium, Gordona sp. strain CYKS1, which reported to
transform DBT at a rate of 0.15 µmol gDCW-1 min-1 [79].
The sulfur depletion data and the percent depletion in each case have been
assembled in Fig.54. It is clear from the data that 43.73, 48.96 & 55.17 % DBT reduction
has been made in first three inoculations.
The reduction observed for 24 and to 48 hr was 43.73, 44.09, & 46.66)%; 48.69,
53.97, & 53.33 % and 55.17, 58.31,& 57.11 % in light, middle and heavy fractions,
respectively. This reduction is quite significant when compared with the previous studies
[80]. Reduction of 59.65, 61.44, & 62.00 % and 62.41, 64.33, & 66.22 % was observed in
case of one week and one-month time. Again, it is clear that most of the DBT removal
occurs in the initial stage.
In case of T.thiobacillus dibenzothiophen was found to be in variously inoculated
samples where the data was noted as 43.73, 44.09 & 46.66 % ; 4.96, 9.88, 10.67 % ; 6.48,
4.34 & 3.78 % ; 4.48 , 3.13 & 4.89 % and 2.76, 2.89 & 4.22 % in virgin – 12hr, 12hr –
24 hr, 24hr – 48hr, 48hr – one week and one week – month respectively in light, meddle
and heavy fraction
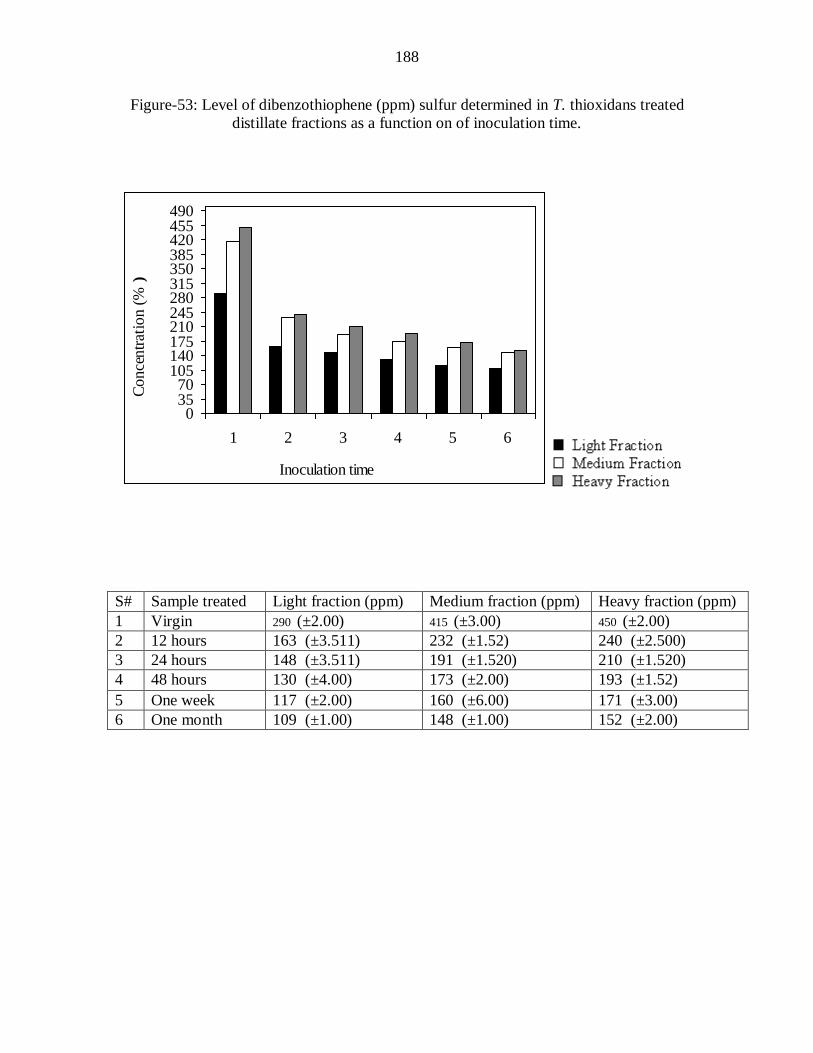
188
Figure-53: Level of dibenzothiophene (ppm) sulfur determined in T. thioxidans treated
distillate fractions as a function on of inoculation time.
03570
105140175210245280315350385420455490
1 2 3 4 5 6
Inoculation time
Conce
ntr
atio
n (%
)
S# Sample treated Light fraction (ppm) Medium fraction (ppm) Heavy fraction (ppm)
1 Virgin 290 (±2.00) 415 (±3.00) 450 (±2.00)
2 12 hours 163 (±3.511) 232 (±1.52) 240 (±2.500)
3 24 hours 148 (±3.511) 191 (±1.520) 210 (±1.520)
4 48 hours 130 (±4.00) 173 (±2.00) 193 (±1.52)
5 One week 117 (±2.00) 160 (±6.00) 171 (±3.00)
6 One month 109 (±1.00) 148 (±1.00) 152 (±2.00)
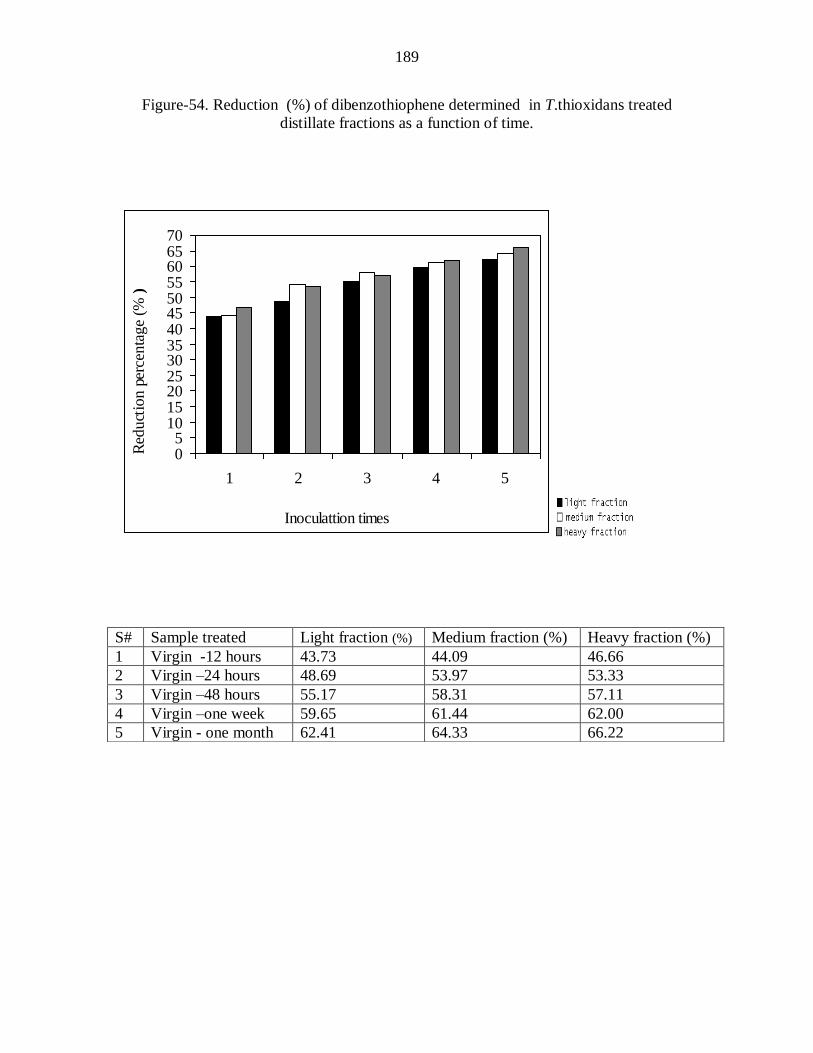
189
Figure-54. Reduction (%) of dibenzothiophene determined in T.thioxidans treated
distillate fractions as a function of time.
05
10152025303540455055606570
1 2 3 4 5
Inoculattion times
Red
uct
ion
perc
enta
ge
(% )
S# Sample treated Light fraction (%) Medium fraction (%) Heavy fraction (%)
1 Virgin -12 hours 43.73 44.09 46.66
2 Virgin –24 hours 48.69 53.97 53.33
3 Virgin –48 hours 55.17 58.31 57.11
4 Virgin –one week 59.65 61.44 62.00
5 Virgin - one month 62.41 64.33 66.22
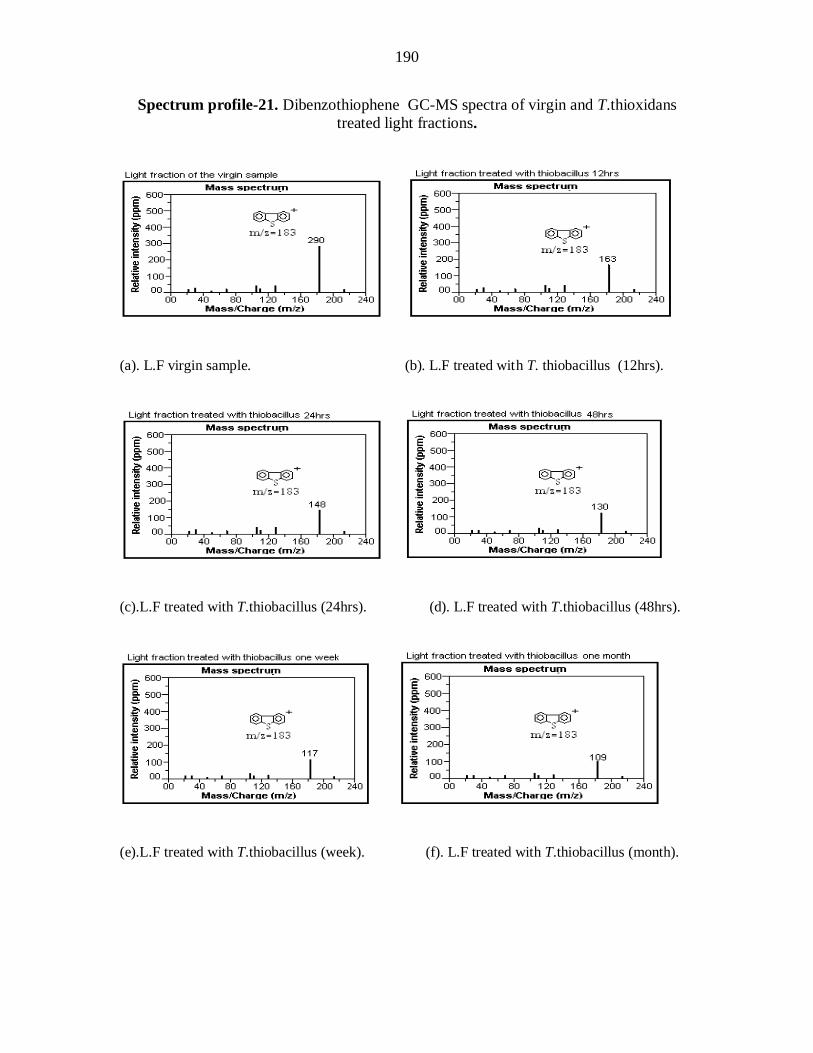
190
Spectrum profile-21. Dibenzothiophene GC-MS spectra of virgin and T.thioxidans
treated light fractions.
(a). L.F virgin sample. (b). L.F treated with T. thiobacillus (12hrs).
(c).L.F treated with T.thiobacillus (24hrs). (d). L.F treated with T.thiobacillus (48hrs).
(e).L.F treated with T.thiobacillus (week). (f). L.F treated with T.thiobacillus (month).
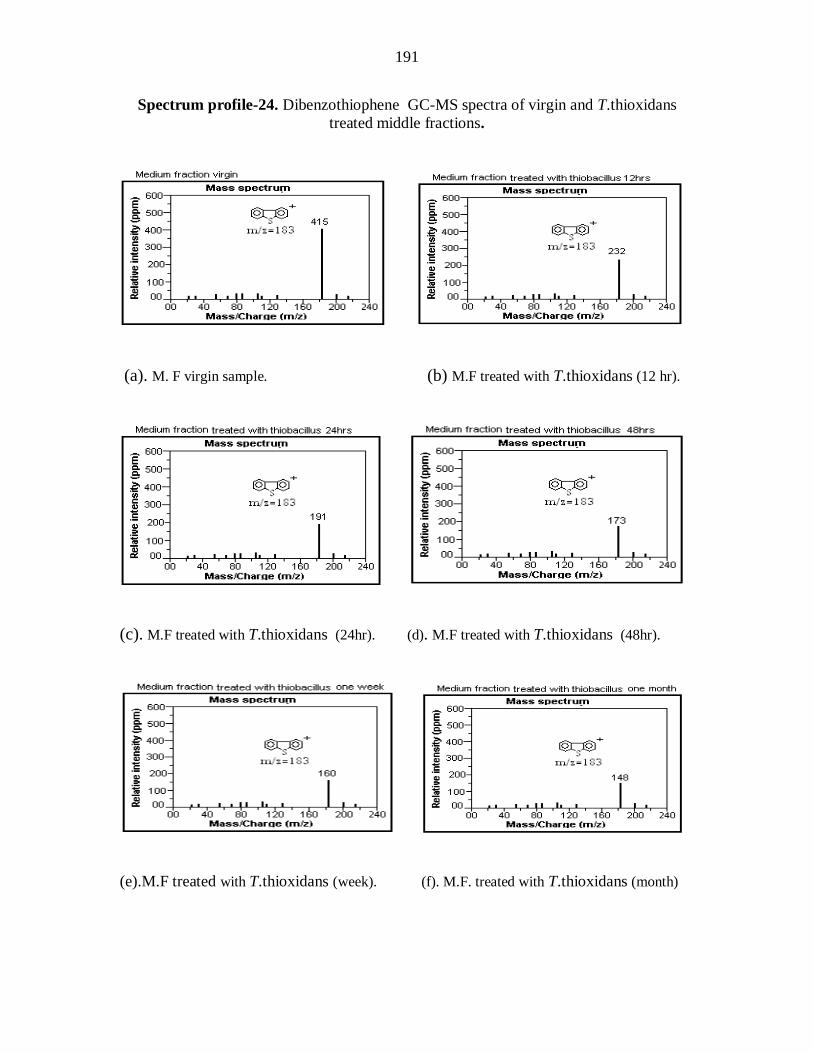
191
Spectrum profile-24. Dibenzothiophene GC-MS spectra of virgin and T.thioxidans
treated middle fractions.
(a). M. F virgin sample. (b) M.F treated with T.thioxidans (12 hr).
(c). M.F treated with T.thioxidans (24hr). (d). M.F treated with T.thioxidans (48hr).
(e).M.F treated with T.thioxidans (week). (f). M.F. treated with T.thioxidans (month)
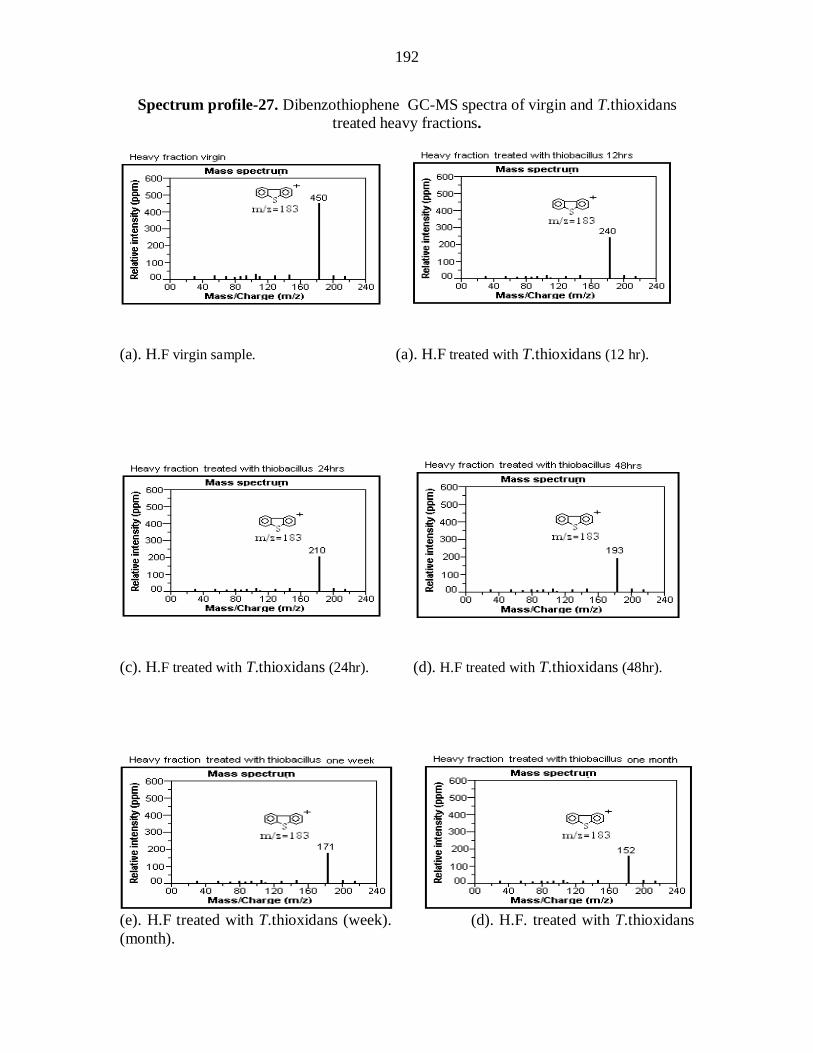
192
Spectrum profile-27. Dibenzothiophene GC-MS spectra of virgin and T.thioxidans
treated heavy fractions.
(a). H.F virgin sample. (a). H.F treated with T.thioxidans (12 hr).
(c). H.F treated with T.thioxidans (24hr). (d). H.F treated with T.thioxidans (48hr).
(e). H.F treated with T.thioxidans (week). (d). H.F. treated with T.thioxidans
(month).
193
3.2.9. Removal of benzothiophene
Determination of benzothiophene was done Specrtrophotometrically
Chemical Removal
Aromatic sulfurous compounds cause series problems to the refinery and as well
as to the environment because of SOx emission, when crude oil combustions occurs in the
refineries. Due to the presence of benzene ring, these compounds are carcinogenic in
nature and having an unpleasant smell. An attempt was made to remove this sulphur
apologue chemically as well as biologically. Oil distillation fractions were analyzed for
benzothiophene first in case of original light, middle and heavy fractions. These values
are given in Fig.55, which were 334, 440 & 570 ppm The same fractions were exposed to
four different chemical reagents for the purpose of chemical desulphurization, and the
residual samples from each chemical treatment were again tested with GC-MS for
benzothiophene, where the BTH contents observed were 302, 403, & 522 ppm; 290, 384,
& 511p pm; 278, 363, & 499 ppm, and 254, 342, & 480 ppm in case of hydrochloric
acid (HCl), sodium hydroxide(NaOH), sodium arsenate (Na2HAsO4) and vanadium
vendate (NH4VO3) treatments, respectively .The depletion can also be observed in GC-
MS spectra profiles 28-36.
Percent reduction has also been determined between the chemically treated and
virgin sample fractions; the complete data has been given in Fig.56. The reduction
observed in light, middle and heavy fractions was 9.58, 8.40, & 8.42 %; 13.17, 12.72,
&10.35%; 16.76, 17.50, & 12.45 % and 23.95, 22.27, & 15.78 % in case of HCl, NaOH,
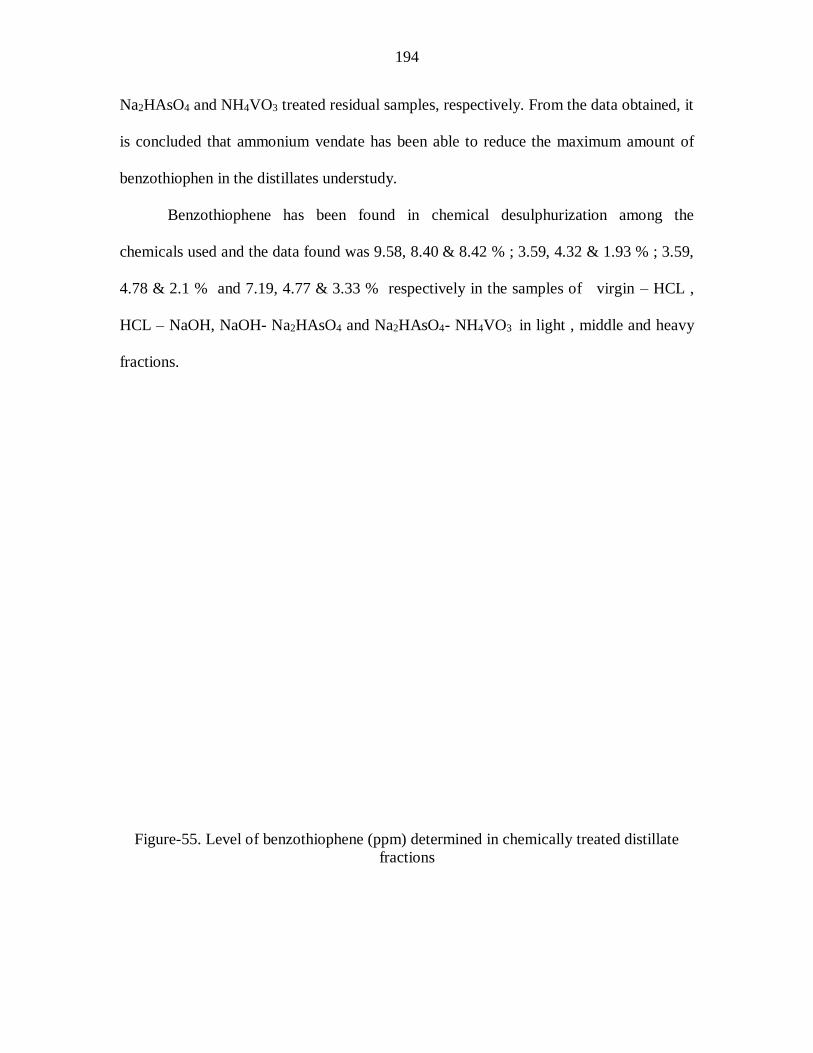
194
Na2HAsO4 and NH4VO3 treated residual samples, respectively. From the data obtained, it
is concluded that ammonium vendate has been able to reduce the maximum amount of
benzothiophen in the distillates understudy.
Benzothiophene has been found in chemical desulphurization among the
chemicals used and the data found was 9.58, 8.40 & 8.42 % ; 3.59, 4.32 & 1.93 % ; 3.59,
4.78 & 2.1 % and 7.19, 4.77 & 3.33 % respectively in the samples of virgin – HCL ,
HCL – NaOH, NaOH- Na2HAsO4 and Na2HAsO4- NH4VO3 in light , middle and heavy
fractions.
Figure-55. Level of benzothiophene (ppm) determined in chemically treated distillate
fractions
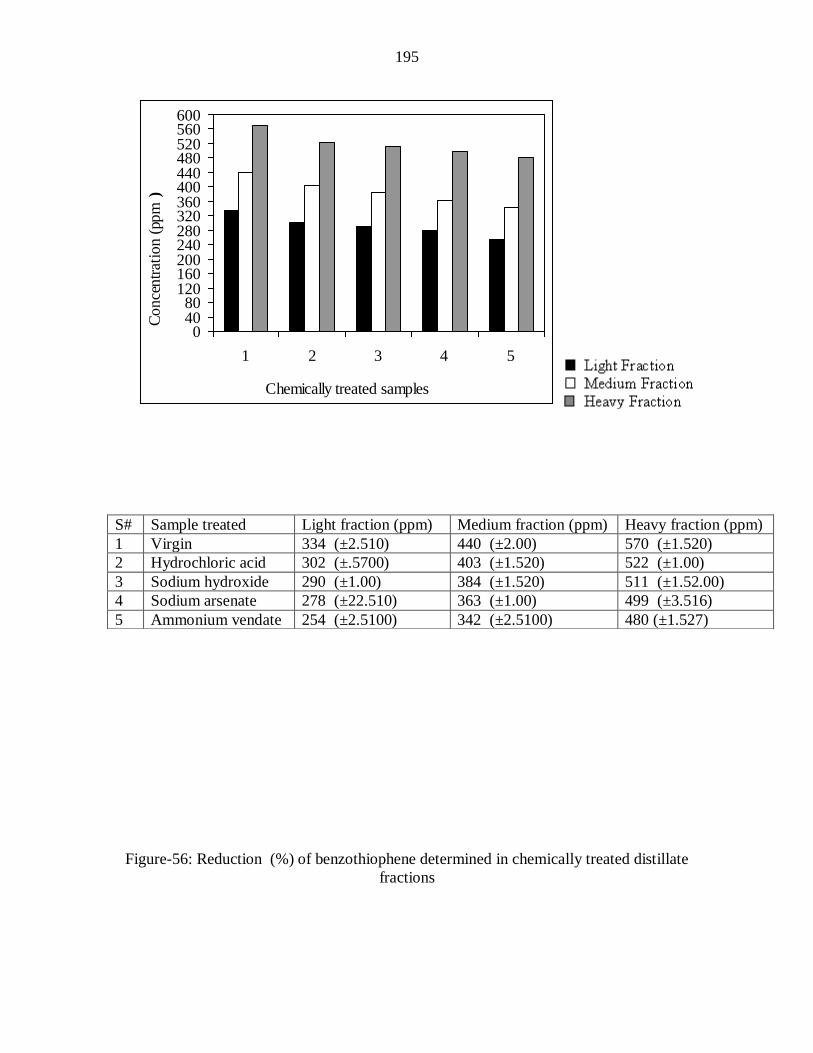
195
04080
120160200240280320360400440480520560600
1 2 3 4 5
Chemically treated samples
Co
nce
ntr
atio
n (p
pm
)
Figure-56: Reduction (%) of benzothiophene determined in chemically treated distillate
fractions
S# Sample treated Light fraction (ppm) Medium fraction (ppm) Heavy fraction (ppm)
1 Virgin 334 (±2.510) 440 (±2.00) 570 (±1.520)
2 Hydrochloric acid 302 (±.5700) 403 (±1.520) 522 (±1.00)
3 Sodium hydroxide 290 (±1.00) 384 (±1.520) 511 (±1.52.00)
4 Sodium arsenate 278 (±22.510) 363 (±1.00) 499 (±3.516)
5 Ammonium vendate 254 (±2.5100) 342 (±2.5100) 480 (±1.527)
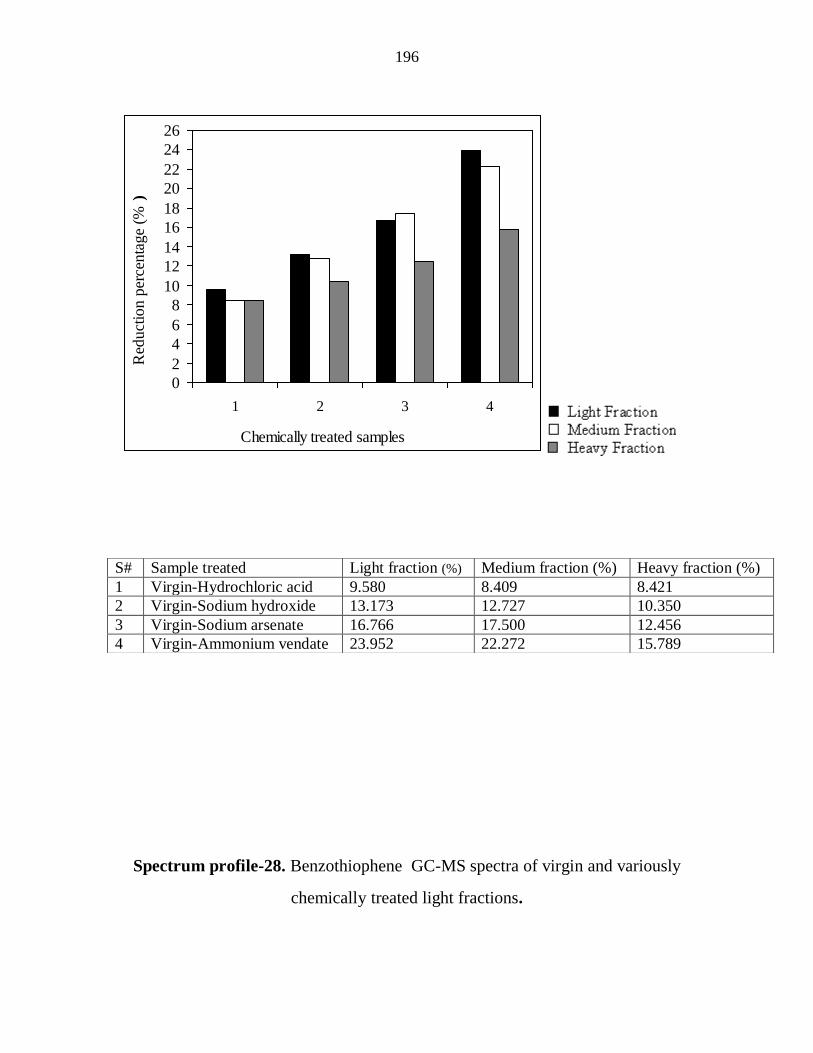
196
0
2
4
6
8
10
12
14
16
18
20
22
24
26
1 2 3 4
Chemically treated samples
Red
uct
ion
per
cen
tag
e (%
)
Spectrum profile-28. Benzothiophene GC-MS spectra of virgin and variously
chemically treated light fractions.
S# Sample treated Light fraction (%) Medium fraction (%) Heavy fraction (%)
1 Virgin-Hydrochloric acid 9.580 8.409 8.421
2 Virgin-Sodium hydroxide 13.173 12.727 10.350
3 Virgin-Sodium arsenate 16.766 17.500 12.456
4 Virgin-Ammonium vendate 23.952 22.272 15.789
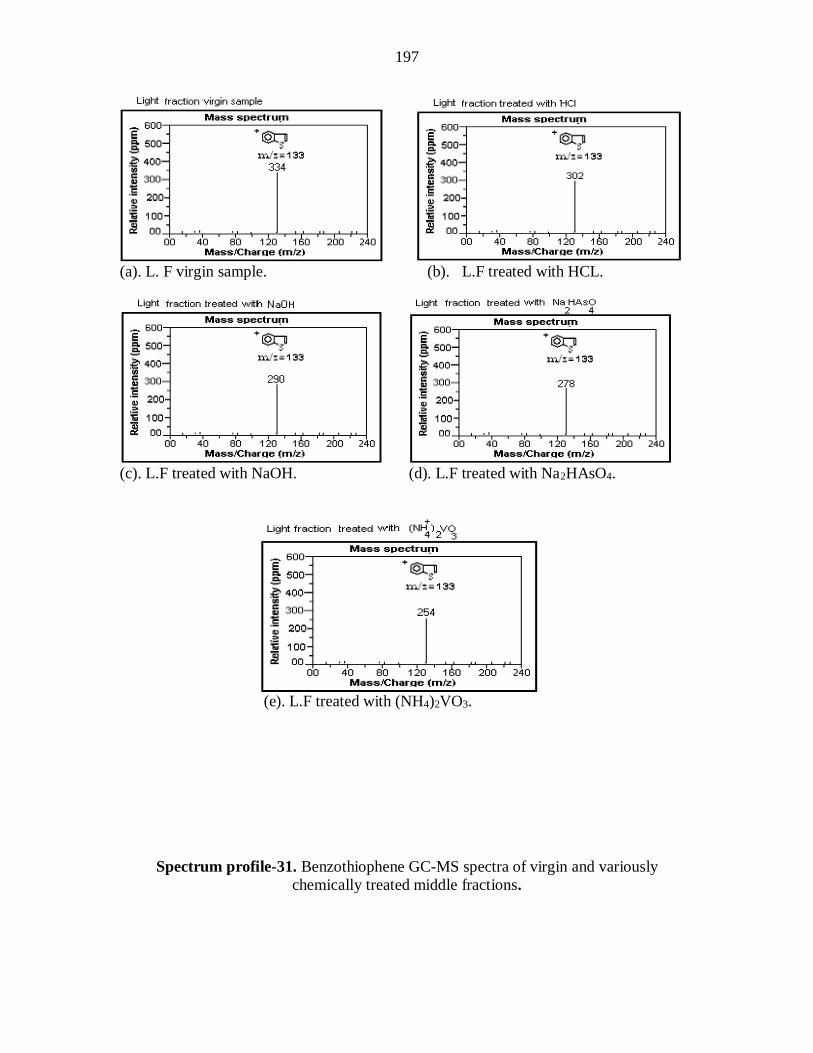
197
(a). L. F virgin sample. (b). L.F treated with HCL.
(c). L.F treated with NaOH. (d). L.F treated with Na2HAsO4.
(e). L.F treated with (NH4)2VO3.
Spectrum profile-31. Benzothiophene GC-MS spectra of virgin and variously
chemically treated middle fractions.
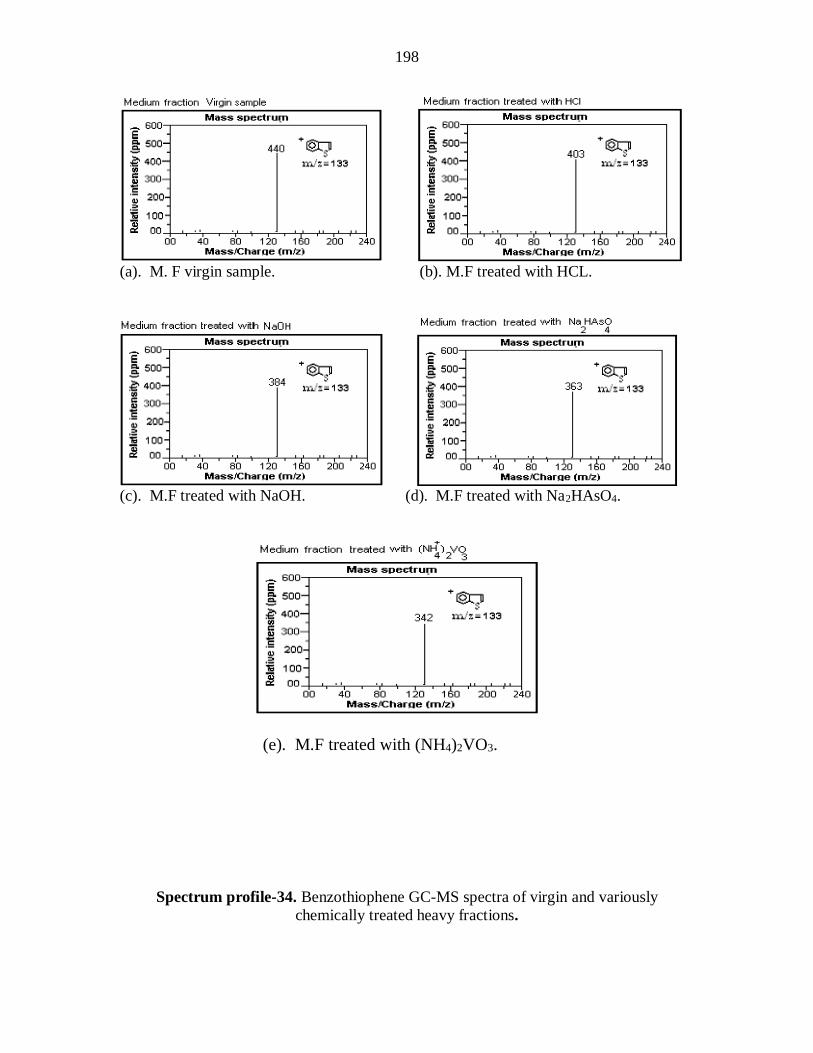
198
(a). M. F virgin sample. (b). M.F treated with HCL.
(c). M.F treated with NaOH. (d). M.F treated with Na2HAsO4.
(e). M.F treated with (NH4)2VO3.
Spectrum profile-34. Benzothiophene GC-MS spectra of virgin and variously
chemically treated heavy fractions.
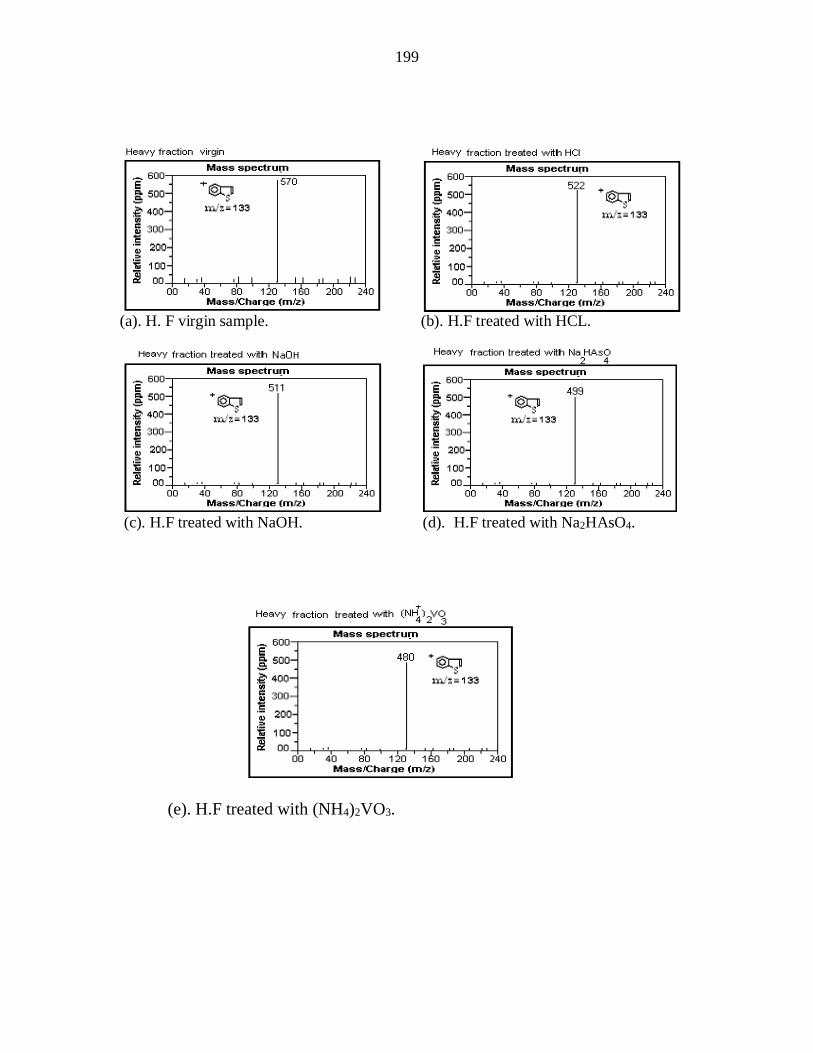
199
(a). H. F virgin sample. (b). H.F treated with HCL.
(c). H.F treated with NaOH. (d). H.F treated with Na2HAsO4.
(e). H.F treated with (NH4)2VO3.
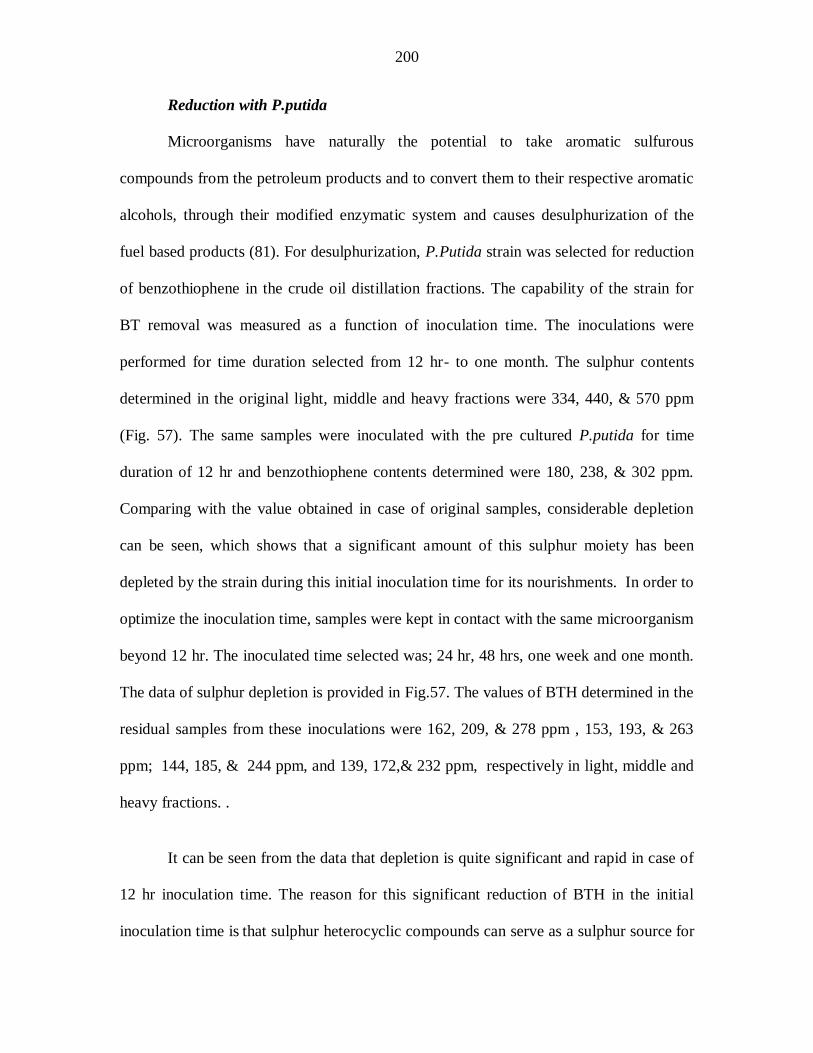
200
Reduction with P.putida
Microorganisms have naturally the potential to take aromatic sulfurous
compounds from the petroleum products and to convert them to their respective aromatic
alcohols, through their modified enzymatic system and causes desulphurization of the
fuel based products (81). For desulphurization, P.Putida strain was selected for reduction
of benzothiophene in the crude oil distillation fractions. The capability of the strain for
BT removal was measured as a function of inoculation time. The inoculations were
performed for time duration selected from 12 hr- to one month. The sulphur contents
determined in the original light, middle and heavy fractions were 334, 440, & 570 ppm
(Fig. 57). The same samples were inoculated with the pre cultured P.putida for time
duration of 12 hr and benzothiophene contents determined were 180, 238, & 302 ppm.
Comparing with the value obtained in case of original samples, considerable depletion
can be seen, which shows that a significant amount of this sulphur moiety has been
depleted by the strain during this initial inoculation time for its nourishments. In order to
optimize the inoculation time, samples were kept in contact with the same microorganism
beyond 12 hr. The inoculated time selected was; 24 hr, 48 hrs, one week and one month.
The data of sulphur depletion is provided in Fig.57. The values of BTH determined in the
residual samples from these inoculations were 162, 209, & 278 ppm , 153, 193, & 263
ppm; 144, 185, & 244 ppm, and 139, 172,& 232 ppm, respectively in light, middle and
heavy fractions. .
It can be seen from the data that depletion is quite significant and rapid in case of
12 hr inoculation time. The reason for this significant reduction of BTH in the initial
inoculation time is that sulphur heterocyclic compounds can serve as a sulphur source for
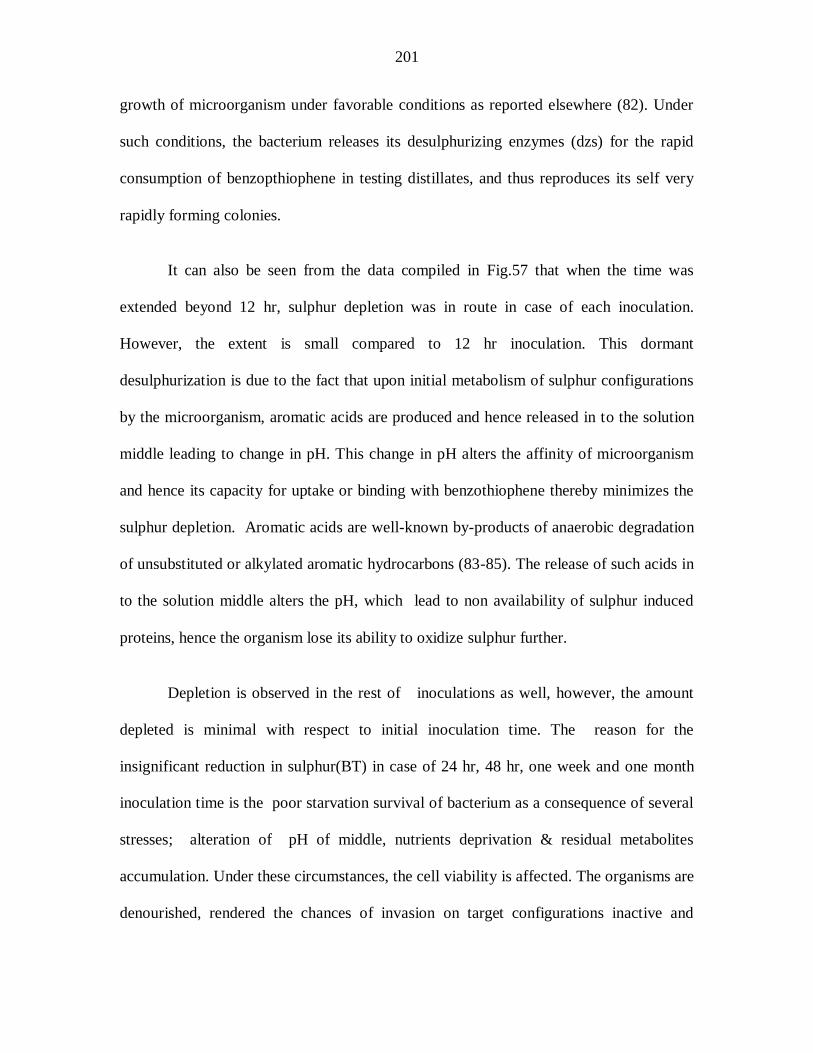
201
growth of microorganism under favorable conditions as reported elsewhere (82). Under
such conditions, the bacterium releases its desulphurizing enzymes (dzs) for the rapid
consumption of benzopthiophene in testing distillates, and thus reproduces its self very
rapidly forming colonies.
It can also be seen from the data compiled in Fig.57 that when the time was
extended beyond 12 hr, sulphur depletion was in route in case of each inoculation.
However, the extent is small compared to 12 hr inoculation. This dormant
desulphurization is due to the fact that upon initial metabolism of sulphur configurations
by the microorganism, aromatic acids are produced and hence released in to the solution
middle leading to change in pH. This change in pH alters the affinity of microorganism
and hence its capacity for uptake or binding with benzothiophene thereby minimizes the
sulphur depletion. Aromatic acids are well-known by-products of anaerobic degradation
of unsubstituted or alkylated aromatic hydrocarbons (83-85). The release of such acids in
to the solution middle alters the pH, which lead to non availability of sulphur induced
proteins, hence the organism lose its ability to oxidize sulphur further.
Depletion is observed in the rest of inoculations as well, however, the amount
depleted is minimal with respect to initial inoculation time. The reason for the
insignificant reduction in sulphur(BT) in case of 24 hr, 48 hr, one week and one month
inoculation time is the poor starvation survival of bacterium as a consequence of several
stresses; alteration of pH of middle, nutrients deprivation & residual metabolites
accumulation. Under these circumstances, the cell viability is affected. The organisms are
denourished, rendered the chances of invasion on target configurations inactive and
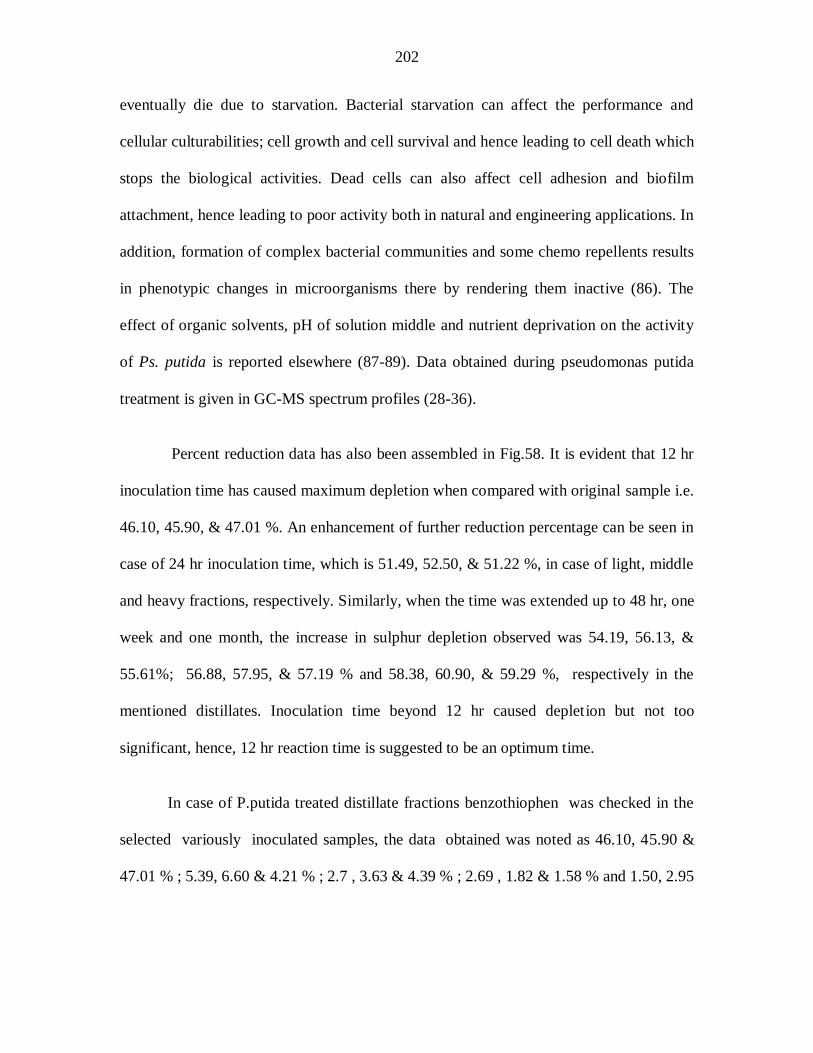
202
eventually die due to starvation. Bacterial starvation can affect the performance and
cellular culturabilities; cell growth and cell survival and hence leading to cell death which
stops the biological activities. Dead cells can also affect cell adhesion and biofilm
attachment, hence leading to poor activity both in natural and engineering applications. In
addition, formation of complex bacterial communities and some chemo repellents results
in phenotypic changes in microorganisms there by rendering them inactive (86). The
effect of organic solvents, pH of solution middle and nutrient deprivation on the activity
of Ps. putida is reported elsewhere (87-89). Data obtained during pseudomonas putida
treatment is given in GC-MS spectrum profiles (28-36).
Percent reduction data has also been assembled in Fig.58. It is evident that 12 hr
inoculation time has caused maximum depletion when compared with original sample i.e.
46.10, 45.90, & 47.01 %. An enhancement of further reduction percentage can be seen in
case of 24 hr inoculation time, which is 51.49, 52.50, & 51.22 %, in case of light, middle
and heavy fractions, respectively. Similarly, when the time was extended up to 48 hr, one
week and one month, the increase in sulphur depletion observed was 54.19, 56.13, &
55.61%; 56.88, 57.95, & 57.19 % and 58.38, 60.90, & 59.29 %, respectively in the
mentioned distillates. Inoculation time beyond 12 hr caused depletion but not too
significant, hence, 12 hr reaction time is suggested to be an optimum time.
In case of P.putida treated distillate fractions benzothiophen was checked in the
selected variously inoculated samples, the data obtained was noted as 46.10, 45.90 &
47.01 % ; 5.39, 6.60 & 4.21 % ; 2.7 , 3.63 & 4.39 % ; 2.69 , 1.82 & 1.58 % and 1.50, 2.95
203
& 2.1 % in virgin – 12hr, 12hr – 24 hr, 24hr – 48hr, 48hr – one week and one week –
month respectively in light, meddle and heavy fractions.
The depletion obtained in our study is quite significant compared to the
previously reported microbial desulphurization particularly for middle and heavy oil
fractions (90-91).
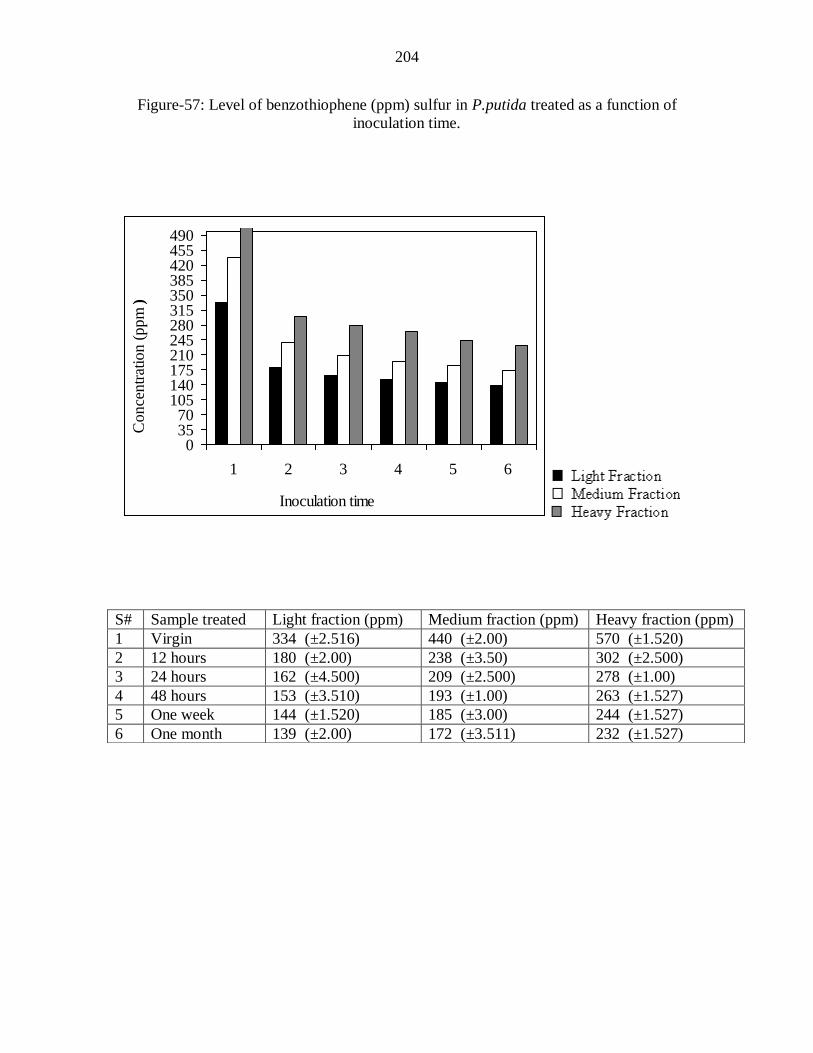
204
Figure-57: Level of benzothiophene (ppm) sulfur in P.putida treated as a function of
inoculation time.
03570
105140175210245280315350385420455490
1 2 3 4 5 6
Inoculation time
Co
nce
ntr
atio
n (
pp
m )
S# Sample treated Light fraction (ppm) Medium fraction (ppm) Heavy fraction (ppm)
1 Virgin 334 (±2.516) 440 (±2.00) 570 (±1.520)
2 12 hours 180 (±2.00) 238 (±3.50) 302 (±2.500)
3 24 hours 162 (±4.500) 209 (±2.500) 278 (±1.00)
4 48 hours 153 (±3.510) 193 (±1.00) 263 (±1.527)
5 One week 144 (±1.520) 185 (±3.00) 244 (±1.527)
6 One month 139 (±2.00) 172 (±3.511) 232 (±1.527)

205
Figure-58. Reduction (%) of benzothiophene determined in P.putida treated distillate
fractions as a function of inoculation.
05
101520253035404550556065
1 2 3 4 5
Inoculattion times
Red
uct
ion p
erce
nta
ge
(% )
S# Sample treated Light fraction (%) Medium fraction (%) Heavy fraction (%)
1 Virgin -12 hours 46.10 45.90 47.01
2 Virgin –24 hours 51.49 52.50 51.22
3 Virgin –48 hours 54.19 56.13 55.61
4 Virgin –one week 56.88 57.95 57.19
5 Virgin – one month 58.38 60.90 59.29
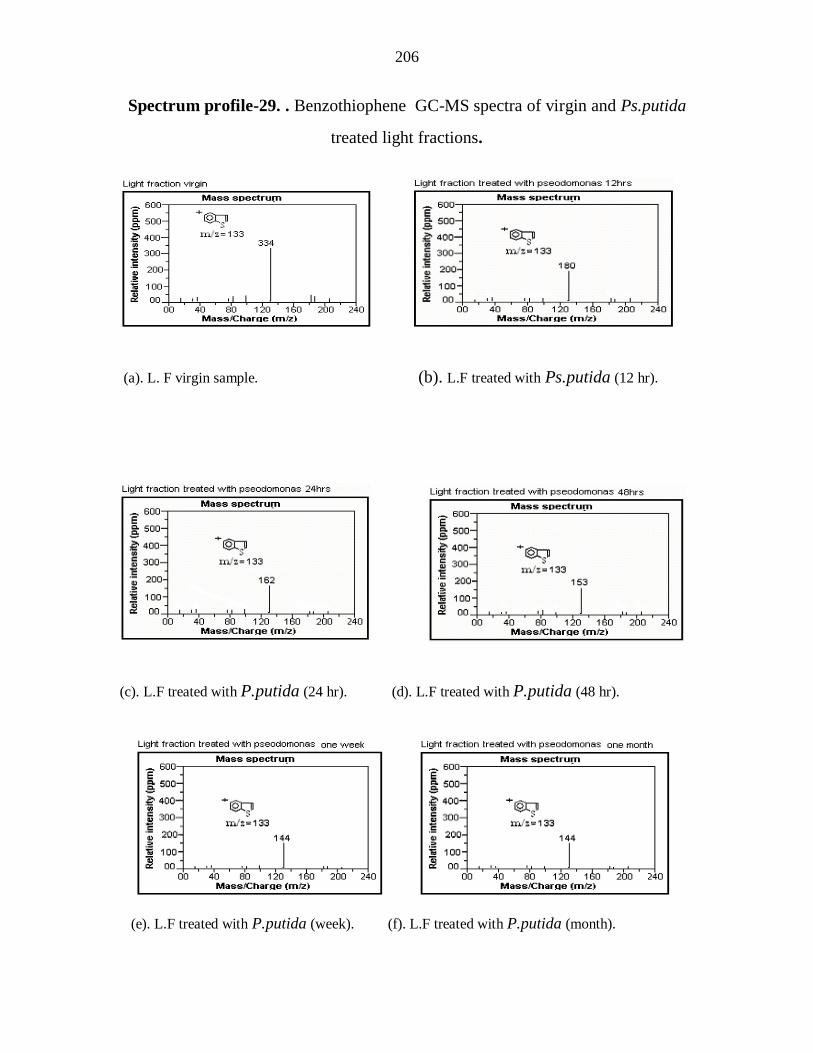
206
Spectrum profile-29. . Benzothiophene GC-MS spectra of virgin and Ps.putida
treated light fractions.
(a). L. F virgin sample. (b). L.F treated with Ps.putida (12 hr).
(c). L.F treated with P.putida (24 hr). (d). L.F treated with P.putida (48 hr).
(e). L.F treated with P.putida (week). (f). L.F treated with P.putida (month).
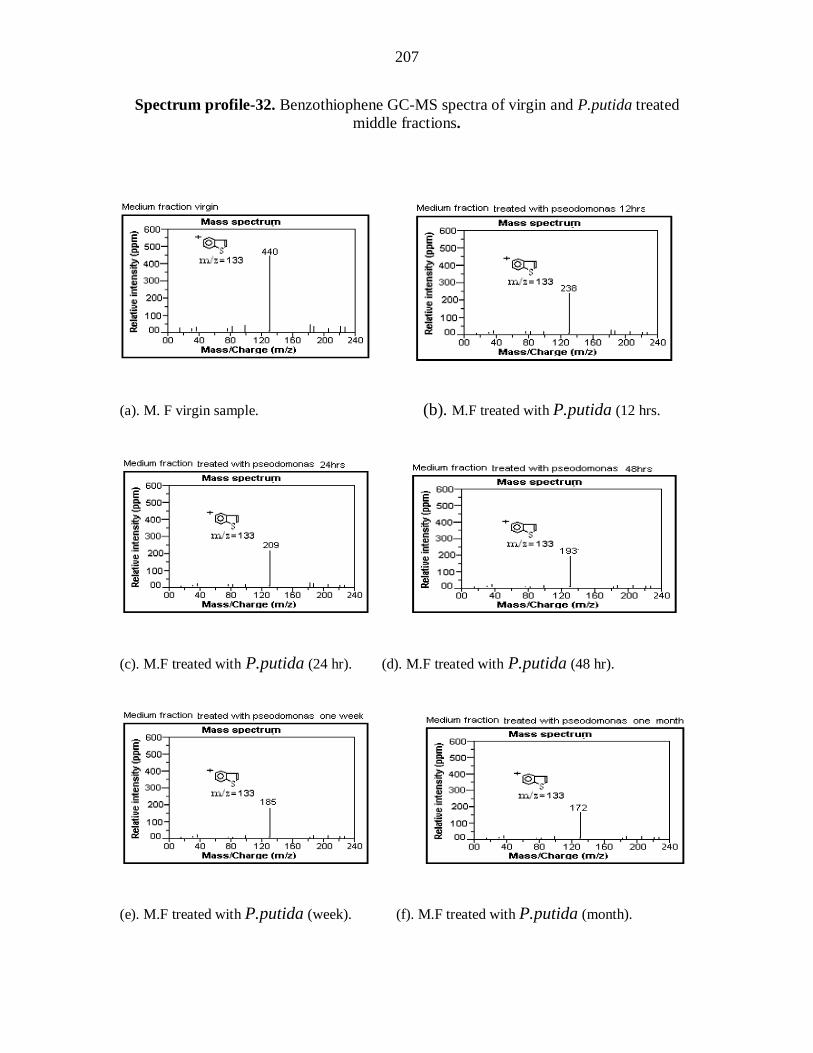
207
Spectrum profile-32. Benzothiophene GC-MS spectra of virgin and P.putida treated
middle fractions.
(a). M. F virgin sample. (b). M.F treated with P.putida (12 hrs.
(c). M.F treated with P.putida (24 hr). (d). M.F treated with P.putida (48 hr).
(e). M.F treated with P.putida (week). (f). M.F treated with P.putida (month).
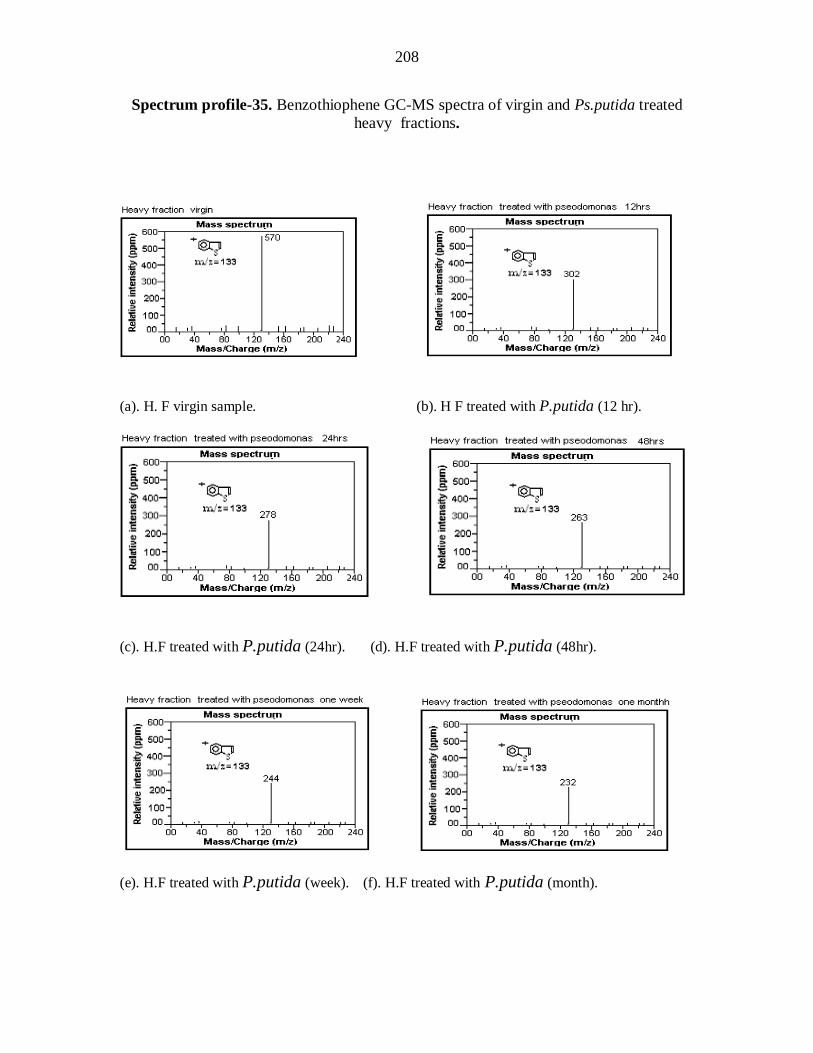
208
Spectrum profile-35. Benzothiophene GC-MS spectra of virgin and Ps.putida treated
heavy fractions.
(a). H. F virgin sample. (b). H F treated with P.putida (12 hr).
(c). H.F treated with P.putida (24hr). (d). H.F treated with P.putida (48hr).
(e). H.F treated with P.putida (week). (f). H.F treated with P.putida (month).
209
Removal with T.Thioxidanes
T.Thioxidans strain was inoculated for various contact time as mentioned earlier
(12hr- one month) in crude oil distillates. Benzothiophene (BTH) determined with GC-
MS. From the data obtained, it is clear that this bacterium has removed more sulfur than
Ps.putida during the same inoculations, which is quite clear from the Fig. 59. It is
observed that in case of original fractions, benzothiophene contents were 334, 440, & 570
ppm, in light, middle and heavy fractions, respectively. In the microbially treated
samples, BTH contents determined in light, middle, and heavy fractions were 173, 229, &
293ppm; 156, 201, & 267 ppm and 142, 180, & 250 ppm in case of 12hr, 24hr and
48hr, respectively. As the inoculation time increases, T.thioxidans converts sulfur
contents to sulfates and sulfuric acid, where the pH continuously decreased, and an acidic
middle created. As the inoculation time was further extended even up to one month
benzothiophene level was decreased to 134, 175, & 230 ppm and 123, 164, & 219 ppm in
case of one week and one month inoculations. The reduction in sulphur can be seen in
GC-MS spectra profiles 28-36.
Fig. 60 represents the percent reduction achieved in each inoculation. The
reduction has been clearly shown between the virgin and T. Thiobacillus treated samples
for various times (12hr-one month). A significant reduction has been made during all
inoculations. The reduction observed in light, middle, and heavy fractions were 48.20,
47.95, & 48.59 %; 53.29, 54.31, & 53.15 %; 57.48, 59.09, & 56.14 %; 59.88, 60.22, &
59.64 % and 63.17, 62.72, & 61.57 %, respectively in case of 12 hr, 24 hr, 48 hr, one
week and one month inoculations. From the data, it can be concluded that T.thioxidans
210
likes aromatic sulfurous compounds, and consume them as their nutrients to increase
their reproduction.
T.thiobacillus treated samples were studied for benzothiophen form contact time
to time and the values collected were 48.20, 47.95 & 48.59 % ; 5.09, 6.36 & 4.56 % ;
4.19 , 4.78 & 2.99 % ; 2.40, 1.13 & 3.50 % and 3.29, 2.50 & 1.93 % in the cases of
virgin – 12hr, 12hr – 24 hr, 24hr – 48hr, 48hr – one week and one week – month
respectively in light, meddle and heavy fractions.
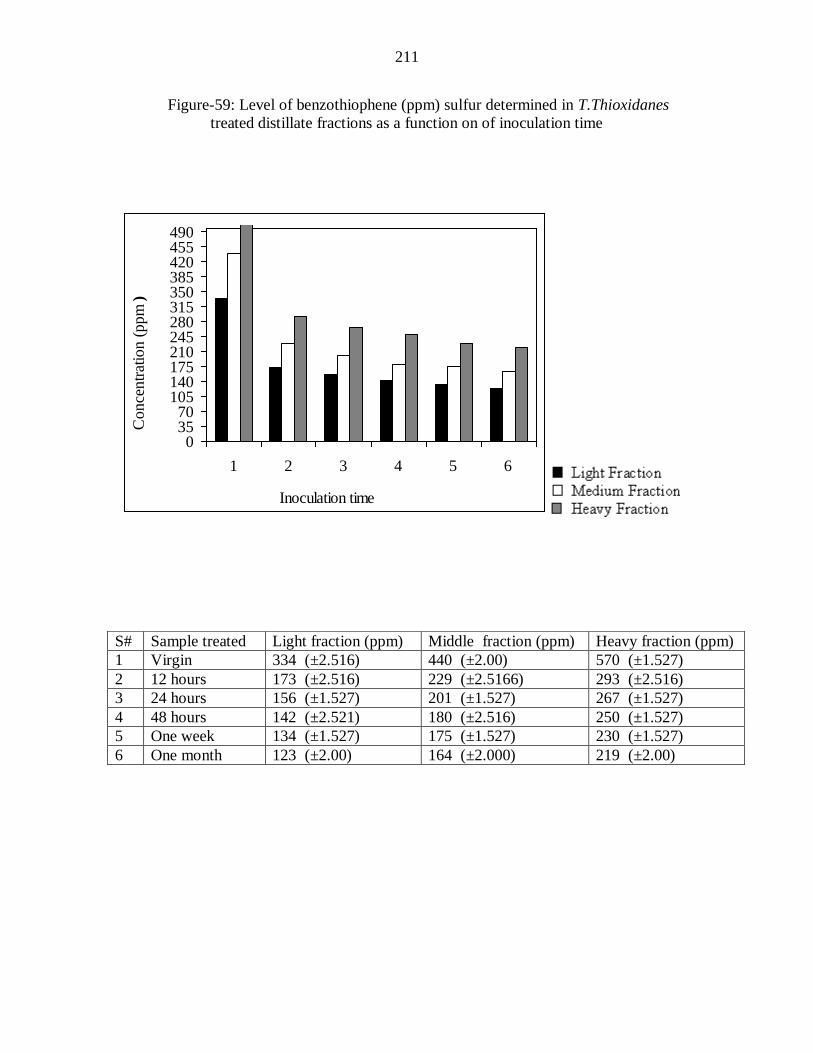
211
Figure-59: Level of benzothiophene (ppm) sulfur determined in T.Thioxidanes
treated distillate fractions as a function on of inoculation time
03570
105140175210245280315350385420455490
1 2 3 4 5 6
Inoculation time
Co
nce
ntr
atio
n (
pp
m )
S# Sample treated Light fraction (ppm) Middle fraction (ppm) Heavy fraction (ppm)
1 Virgin 334 (±2.516) 440 (±2.00) 570 (±1.527)
2 12 hours 173 (±2.516) 229 (±2.5166) 293 (±2.516)
3 24 hours 156 (±1.527) 201 (±1.527) 267 (±1.527)
4 48 hours 142 (±2.521) 180 (±2.516) 250 (±1.527)
5 One week 134 (±1.527) 175 (±1.527) 230 (±1.527)
6 One month 123 (±2.00) 164 (±2.000) 219 (±2.00)
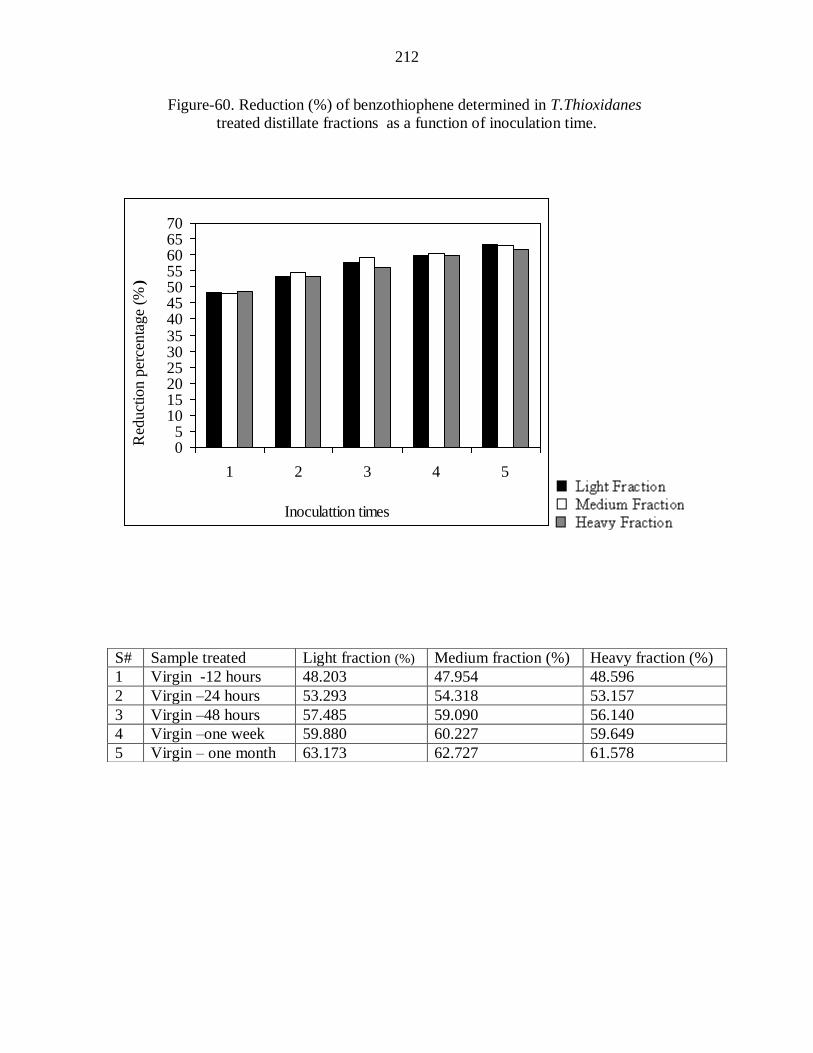
212
Figure-60. Reduction (%) of benzothiophene determined in T.Thioxidanes
treated distillate fractions as a function of inoculation time.
05
10152025303540455055606570
1 2 3 4 5
Inoculattion times
Red
uct
ion
per
cen
tag
e (%
)
S# Sample treated Light fraction (%) Medium fraction (%) Heavy fraction (%)
1 Virgin -12 hours 48.203 47.954 48.596
2 Virgin –24 hours 53.293 54.318 53.157
3 Virgin –48 hours 57.485 59.090 56.140
4 Virgin –one week 59.880 60.227 59.649
5 Virgin – one month 63.173 62.727 61.578
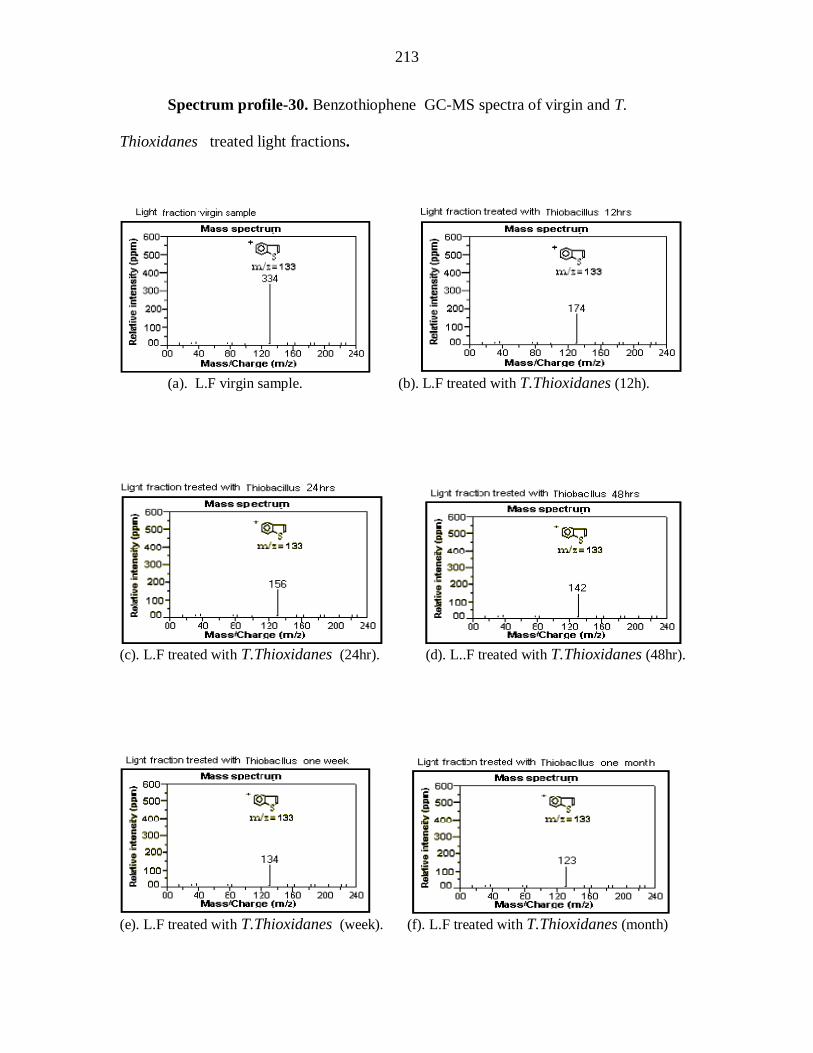
213
Spectrum profile-30. Benzothiophene GC-MS spectra of virgin and T.
Thioxidanes treated light fractions.
(a). L.F virgin sample. (b). L.F treated with T.Thioxidanes (12h).
(c). L.F treated with T.Thioxidanes (24hr). (d). L..F treated with T.Thioxidanes (48hr).
(e). L.F treated with T.Thioxidanes (week). (f). L.F treated with T.Thioxidanes (month)
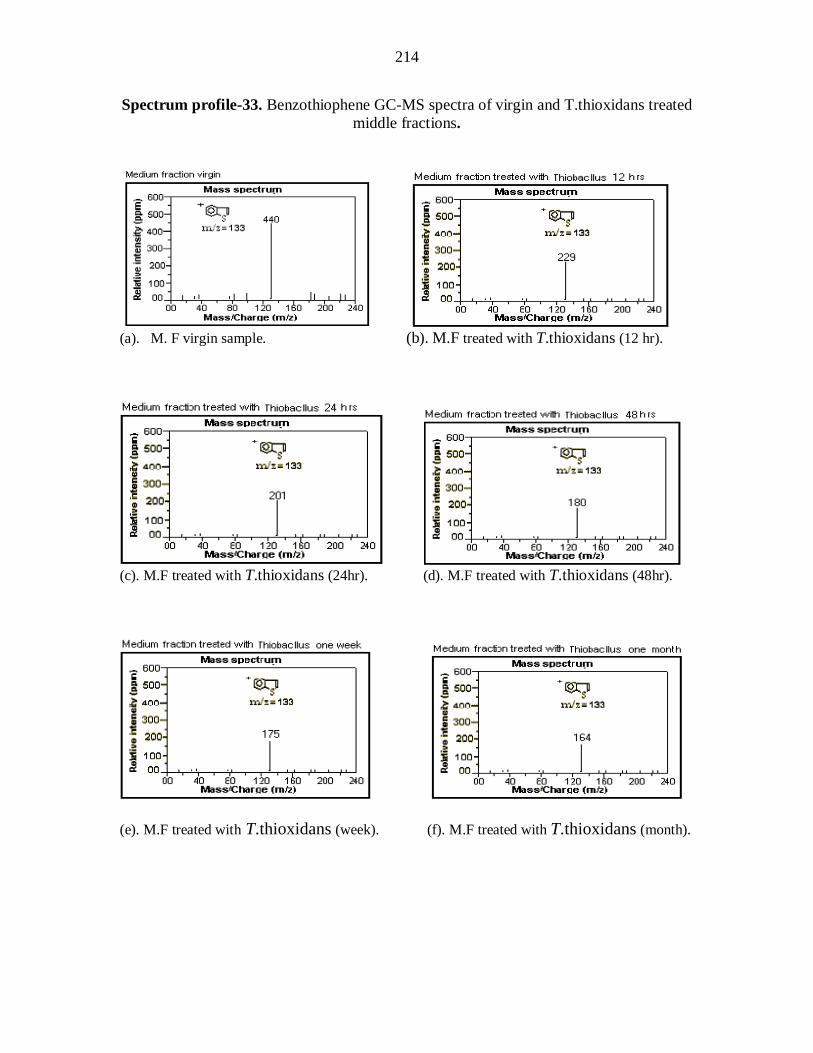
214
Spectrum profile-33. Benzothiophene GC-MS spectra of virgin and T.thioxidans treated
middle fractions.
(a). M. F virgin sample. (b). M.F treated with T.thioxidans (12 hr).
(c). M.F treated with T.thioxidans (24hr). (d). M.F treated with T.thioxidans (48hr).
(e). M.F treated with T.thioxidans (week). (f). M.F treated with T.thioxidans (month).
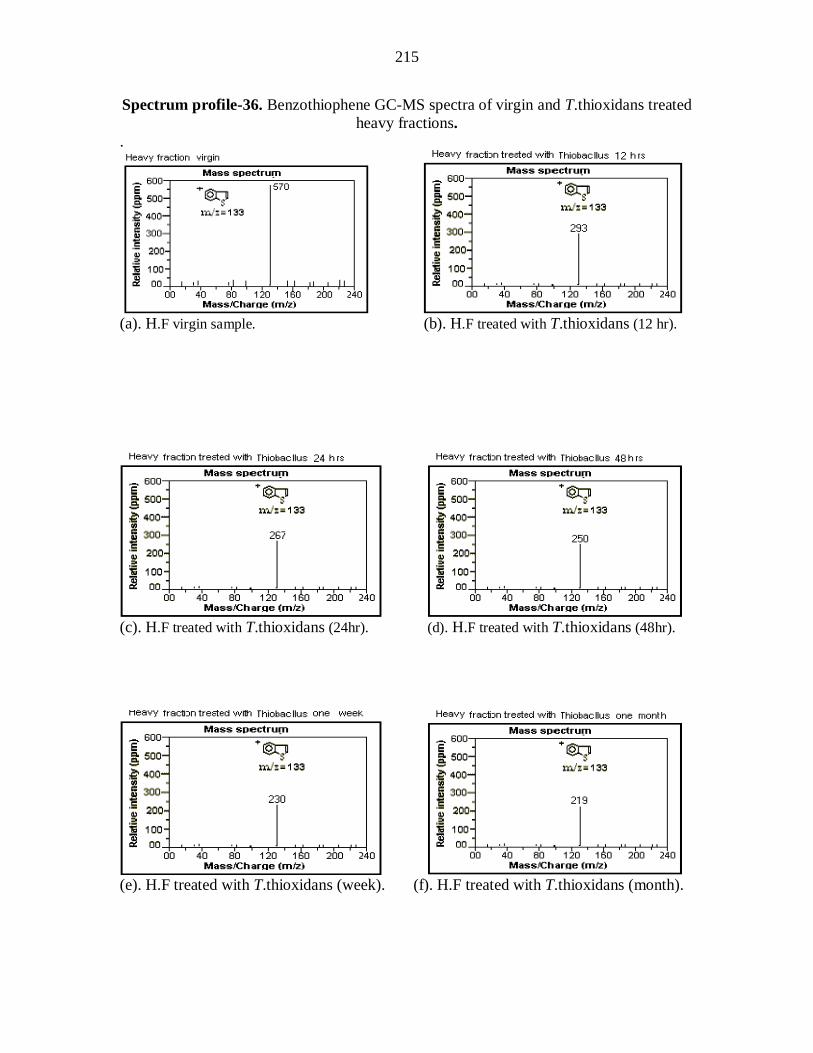
215
Spectrum profile-36. Benzothiophene GC-MS spectra of virgin and T.thioxidans treated
heavy fractions.
.
(a). H.F virgin sample. (b). H.F treated with T.thioxidans (12 hr).
(c). H.F treated with T.thioxidans (24hr). (d). H.F treated with T.thioxidans (48hr).
(e). H.F treated with T.thioxidans (week). (f). H.F treated with T.thioxidans (month).
216
CONCLUSIONS
Two desulphurization avenues (chemical and biological) were studied and the results
have been compared. The following conclusions were drawn:
In chemical desulphurization, the effect of four chemicals was investigated. On
the bases of desulphurization ability, ammonium vendate (NH4VO3) was found to
be the best amongst the chemicals used, which has caused a significant reduction
of all analogues of sulfur followed by sodium arsenate (Na2HAsO4), followed by
sodium hydroxide (NaOH) , followed by hydrochloric acid (HCl).
In biological desulphurization, two of the bacterial strains were cultured in coal
mine water and were cultivated with the distillates under study varying the time.
From the data collected, it is concluded that T. Thioxidans has been found to be an
excellent desulphurization strain, which has depleted a significant amount of
sulfurous compounds. Pseudomonas putida, which also caused removal of
enough sulfurous compounds from the crude oil distillate fractions but was found
to be inferior compared to T,Thioxidanes.
The effect of inoculation time was also investigated. It is inferred from the results
that sulphur (each moiety) was enroute all the way with the extension in time
from 00 hr till one month. However, maximum depletion was recorded in case of
12 hr inoculation time. The reduction observed when the time was extended from
12 hr-24hr, 24 hr-48 hr, 48 hr-one week, and one week to one month was not so
much appreciable Hence, 12 hr is suggested to be an optimum time for cost
effective desusulphurization
217
REFERENCES
1. Paul Frank, Schemidth, Fuel oil manual, 1, 112-113 (1985).
2. Prikey, Mike Am.Chem.Soc. Div.Pet.Chem. 45, (4) 701-702 (2000).
3. ASTM, annual book of ASTM standard, ASTM Philadelphia, 5.01-5.04,
(1989).
4. N .B.Korchangina, Vassoyevith, Geol.Re, 12, 1276 (1969).
5. Hydrocarbon processing 57 (9), 178-184 (1978).
6. B. P., Welte, Tissot, D. H “petroleum formation and occurrence” Springer
Verlag New York (1968)
7. W. L. Nelson, “petroleum refinery processing” Mc Graw-Hill, New York, 910
(1958).
8. D. T., Chowdry, Rao Khthing, . Gangadharan,s Meas Sci. Technol., 2 (7),
610 (1991).
9. J.S. Reid, T.A. Gearhart, E.A. Flocchini, Cahill, Nucl. Geophys. 6 (4) 513-
516. (1992).
10. I. L. Bartle, Davies, K.D . Williams, Anal. Chem. 60, 204-209 (1988).
11. J.B. McKinley, Reinhold, New Yark, Catalysis, 5, 405 (1957).
12. R.A. Filinn and J.Mckinley , U.S Patent, 2, 880, 171 9 (1959).
13. S.C. Schuman and H. Shalit, Catal Rev., 4 (2), 245 (1970).
14. G.C .A. Schauit and B.C. Gates, Aich, 19 (30) 417 (1973).
15. W. F. Bland and R.L. Davison, petroleum processing Handbook, McGraw-
Hill, New Yark, 3, (1967).
218
16. W.L.Nelson, “petroleum refinery processing” McGraw-Hill, New York, 10,
(1969).
17. G.F.Ondish, J.A. Frayer, and .J.D.McKinney, Hydrocarbon processing, 55
(7), 105, (1976).
18. I. M. Campbell, Chemtech, 23(10), 43-46 (993).
19. J. G. Speigh, The desulfurization of heavy oil and residua. Marcel Dekker,
New Yark, N.Y. (1989).
20. D.C.Bressler, J. A. Norman, and P. M. Fedorak.. Biodegradation. 8,
297(1998)
21. A. Ishihara, Kabe, and H. Tajima.. Hydrodesulfurization of sulfur-containing
polyaromatic compounds in light oil. Ind. Eng. Chem. Res. 31, 1577-1580
(1992).
22. F.J.Hartdegen, J. M. Coburn, and R. L. Roberts. The microbial desulfurization
of petroleum. Chem. Eng. Prog., 80, 63-67 (1984).
23. C. T Hou, and A. I. Laskin.. Microbial conversion of dibenzothiophene. Dev.
Ind. Microbiol. 17,351-362. 1976
24. K.Kodama, S. Nakatani, K. Umehara, K. Shimizu, Y. Minoda, and K.
Yamada. 1970. Microbial conversion of petrosulfur compounds. III. Isolation
and identification of products from dibenzothiophene. Agric. Biol. Chem.
34,1320-1324.
25. K. Kodama, K. Umehara, K. Shimizu, S. Nakatani, Y. Minoda, and K.
Yamada. Identification of microbial products from debinzothiophene and its
proposed oxidation pathway. Agric. Biol. Chem., 37, 45-50 (1973)
219
26. K. A. Malik,. and D. Claus. Microbial degradation of dibenzothiophene,
abstr. In H. Dellweg (ed.), Abstracts of the Fifth International Fermentation
Symposium. Berlin, Germany, 23, 421 (1976).
27. T. Halbert, A.Anderson, G. Markley, Proc. World Petr. Congr., 15, (1997).
28. M. K. Lee, J. D. Senius, M. J Grossman, Appl. Environ. Microbiol., 61, 4362-
4366 (1995).
29. J. J. Kilbane, Trends Biotechnol. 7(4), 97-101 (1989).
30. M. E. Gallardo, A. Ferrandez, V. De Lorenzo, J. L.Garcia, E. J. Diaz,
Bacteriol., 612, 7156-7160 (1997).
31. K. A. Gray, O. S Pogrebinsky, G. T. Mrachko,, Nature Biotechnol., 14 (12),
1705-1709 (1996).
32. C. S. Piddington, B. R. Kovacevich, Rambosek, J. Appl. Environ. Microbiol.
61(2), 468-475 (1995).
33. S. A. Denome, E. S.Olson, K. D. Young, Appl. Environ. Microbiol. 59 (9),
2837-2843 (1993).
34. C. H. Monticello, Xi, L. Squires, D. J. Childs, J. D. Biochem. Biophys. Res.
Commun. 230, 73-75 (1997).
35. M. Z. Squires Li, C. H.; Monticello, D. J. Childs, J. D. J., Bacteriol., 178 (22),
6409-6418 (1996).
36. F. Zannikos, E. Lois, S. Stournas,., Fuel Process. Technol. 42, 35-45. (1995).
37. T.Ohshiro, Y. Kanbayashi, Y. Hine, Y. Izumi,. Biosci. Biotechnol. Biochem.,
59 (7), 1349-1351(1995).
38. D.J. Monticello, hydrocarbon process. 73 (2), 39-40, 42, 44-45 (1994).
220
39. D.J. Monticello, proc. World petro .conger. 15 (1997).
40. I .P standard method for Analysis and testing of Petroleum and related
products, volume 1, 24/ 84 (1987).
41. F. Widdel, and F. Bak. The prokaryotes, 4, 3352 (1992)
42. D. Cline. Limnol. Oceanogr. 14, 454(1969)
43. M. J. Grossman, M. K. Lee, R. C. Prince, V. Minak-Bernero, G. N. George,
and I. J. Pickering. Appl. Environ. Microbiol. 67,1949-1952 (2001).
44. Honda, H., H. Sugiyama, I. Saito, and T. Kobayashi. J. Ferment. Bioeng. 85,
334-338 (1998).
45. I .P standard method for Analysis and testing of Petroleum and related
products, volume 1, 160/87 (1987).
46. I .P standard method for Analysis and testing of Petroleum and related
products, volume 1, 71/87 (1987).
47. I .P standard method for Analysis and testing of Petroleum and related
products, volume 1, 2/78 (1987).
48. I .P standard method for Analysis and testing of Petroleum and related
products, volume 1, 15/67 (1987).
49. I .P standard method for Analysis and testing of Petroleum and related
products, volume 1, 34/87 (1987).
50. I .P standard method for Analysis and testing of Petroleum and related
products, volume 1, 4/81 (1987).
51. I .P standard method for Analysis and testing of Petroleum and related
products, volume 1, 13/82 (1987).
221
52. I .P standard method for Analysis and testing of Petroleum and related
products, volume 1, 242/83 (1987).
53. I .P standard method for Analysis and testing of Petroleum and related
products, volume ASTM D 1226 -IP 107 (1987).
54. I .P standard method for Analysis and testing of Petroleum and related
products, volume 1, 61/84 (1987).
55. V.Harry, Drushel, and Miller, F. James, Anal. Chem. 27, 495, (1955).
56. H.S. Rohatgi and I.B. Gualatai, Agarwal, journal of the institute of petroleum
59, 133-138 (1973).
57. V. Harry, Drushel, and Miller, , Anal. Chem. 27, 495, (1955).
58. I .P standard method for Analysis and testing of Petroleum and related
products, volume 2, 342/79 (1985).
59. I .P standard method for Analysis and testing of Petroleum and related
products, volume 1, 103/88 (1987).
222
60. T. Hirata, Ohshiro, , and Y. Izumi. Desulfurization of dibenzothiophene
derivatives by whole cells of Rhodococcus erythropolis H-2. FEMS.,
Microbiol. Lett. 142, 65-70. (1996).
61. H. T. Thompson, C J. Coleman, H J.; Hopkins, R L. Bulletin. 659, (1972).
62. R. Quintero, Bornge, Biotechnological processes for the refining of
petroleum. Fuel Processing Technol. 81,155-169 (2003).
63. M. V. Landau, M.Herskowitz, D. Givoni, S.Laichter, D. Yitzhaki, Fuel. 75
(7), 858-866 (1996).
64. Fei Tao, Bo Yu, Ping Xu, and Cui Qing Ma J. Applied and Environmental
Microbiology 72,( 7) . 4604-4609 (2006).
65. Lee, M. K., J. D. Senius, and M. J. Grossman. J. Appl. Environ. Microbiol. 61, 4362-
4366 (1995)
66. Sylvia A. Denome, Edwin S. Olson and Kevin D. Young J. Appl Environ Microbiol.
59(9): 2837-2843 (1993)
67. Buck, J. W., and J. H. Andrews. J. Appl. Environ. Microbiol. 65, 465-471. (1999).
68. Wang, P., and S. Krawiec. J. Arch. Microbiol. 161 , 266-271 (1994).
69. D.Yitzhaki, M. V Landau, D. Berger, M. Herskowitz,. deep desulfurization of heavy
atmospheric gas oil with Co-Mo-Al catalysts, effect of sulfur adsorption", Appl.
Catal. A, 122(2), 99-110 (1995).
70. G Voordouw, SM Armstrong, MF Reimer, B Fouts, AJ Telang, Y Shen and D
Gevertz . J.Appl. Environ. Microbiol. 62 (5), 1623-1629.
223
71. ME Gallardo, A. Ferrandez, V De Lorenzo, JL Garcia and E Diaz J. Bacteriol., 179
(22) 7156-7160 (1997).
72. R. M .Borichewski, J. Bacteriol. 93 (2):597-599 (1967).
73. D.Berger, M.V.Landau, M.Herskowitz, Z.Boger, "Deep hydrodesulfurization of
atmospheric gas oil. Effects of operating conditions and modeling by artificial neural
network techniques", Fuel, 75(7), 907-911. (1996).
74. M. V. Landau, D.Berger , M. Herskowitz, J. Catal., 159 (1), 236-45 (1996).
75. Metin Gürü, Meltem Cubuk , Sukru Dursun , Ayhan Demirbas j. Energy Sources, Part A:
Recovery, Utilization, and Environmental Effects., 28, 559 – 565 (2006).
76. M. Kertesz and C. Wietek j. Applied Microbiology and Biotechnology 57, 460-466
(2001).
77. I .Hoff Rebecca, Z., 1993, marine pollution bulletin, 29, 476-481.
78. Fedorak, M. F., and D. Grbic-Galic. Aerobic microbial cometabolism of
benzothiophene and 3-methylbenzothiophene. Appl. Environ. Microbiol. 57, 932-940
(1991).
79. Sung-Keun Rhee, Je Hwan Chang, Yong Keun Chang, and Ho Nam Chang J. Appl
Environ Microbiol 64 (6), 2327-2331 (1998)
80. Lei, B., and S. C. Tu.. Gene overexpression, purification, and identification of a
desulfurization enzyme from RhodococcusRhodococcus sp. strain IGTS8 as a
sulfide/sulfoxide monooxygenase. J. Bacteriol. 178, 5699-5705 (1996)
81. Gallagher, J. R., E. S. Olson, and D. C. Stanley.. Microbial desulfurization of
dibenzothiophene: a sulfur-specific pathway. J. FEMS Microbiol. Lett. 107, 31-36
(1993)
224
82. Tanaka, Y., T. Matsui, J. Konishi, and K. Maruhashi. Biodesulfurization of
benzothiophene and dibenzothiophene by a newly isolated RhodococcusRhodococcus
strain. J.Appl. Microbiol. Biotechnol. 59, 325-328 (2002.)
83. Cozarelli, I. M., R. P. Eganhouse, and M. J. Baedecker. Transformation of
monoaromatic hydrocarbons to organic acids in anoxic groundwater environments.
J.Environ. Geol. 16, 135-141 (1990).
84. Heider, J., A. M. Spormann, H. R. Beller, and F. Widdel. J.Anaerobic bacterial
metabolism of hydrocarbons. FEMS Microbiol. Rev. 22, 459-473 (1999).
85. Zhang, X., and L. Y. Young.. Carboxylation as an initial reaction in the anaerobic
metabolism of naphthalene and phenanthrene by sulfidogenic consortia. J.Appl.
Environ. Microbiol. 63, 4759-476 (1997)
86. Meckenstock, R. U., E. Annweiler, W. Michaelis, H. H. Richnow, and B. Schink..
Anaerobic naphthalene degradation by a sulfate-reducing enrichment culture.j. Appl.
Environ. Microbiol.; 66:2743-2747 (2000).
87. GuoBin Shan, JianMin Xing, HuaiYing Zhang,and HuiZhou Liu J. Applied and
Environmental Microbiology 71 (8) 4497-4502 ( 2005).
88. Antje Kahnert, Paul Vermeij, Claudia Wietek, Peter James,Thomas Leisinger, and
Michael A. Kertesz Journal of Bacteriology 182 ( 10) 2869-2878 ( 2000).
89. Grimberg, S. J., W. T. Stringfellow, and M. D. Aitken. 1996. Quantifying the
biodegradation of phenanthrene by Pseudomonas stutzeri P16 in the presence of
nonionic surfactant. Appl. Environ. Microbiol. 62:2387-2392 (1996).