Embed Size (px)
Citation preview

i
Acknowledgements
I would like to thank my family foremost, my mother Sherry Mcghee, for
supporting me and giving me the skills that have allowed me to excel in work and life.
My wife Erin is a never-ending source of comfort and strength that backs me up
whenever I need it, even if I don’t know it. I can’t describe the joy and love she gives me
every single day. A special thanks to my children, Molly, Belle, and Noah for their
patience while I attended school and worked second shift full time. Now that I have
completed my degree, Daddy can get back to the really important things like coloring and
playing games. To all the people who have helped me learn my craft, thank –you.
Final thanks go to Professor John Nyland, his experience and support has been
invaluable and this Senior Design project would not have been complete without him. He
not only served as my advisor but also encouraged and challenged me throughout my
academic program. He and the other faculty members patiently guided me through the
Senior Design process, never accepting less than my best efforts. I thank them all.
ii
Table of Contents
Section Page
Acknowledgements i
Table of Contents ii
List of Figures iv
Abstract vi
1. Statement of the Problem 1
2. Definition of the Need 3
2.1 User Profile 5
2.1.1 Network Engineers 6
2.1.2 Network Management Group 6
3. Deliverables 7
4. Design and Development 8
4.1 Timeline 8
4.1.1 Senior Design I Accomplishments 8
4.1.2 Senior Design II Accomplishments 9
4.1.3 Senior Design III Accomplishments 9
5. Proof of Design 10
5.1 Model creation using OPNET 10
5.2 Core Network Design 13
5.3 RBG Routing Protocol Analysis 17
5.4 Edge Model Design 33
5.4.1 Enabling OPSF on the Remote Routers 38
iii
5.4.2 Configuring the Core Routers 39
5.4.3 Validating the OSPF Design 40
5.5 RIP or OSPF 45
5.6 Store Network IP Re-Design 48
6. Testing Procedures 50
7. Conclusions and Recommendations 53
7.1 Conclusions 53
7.2 Recommendations 54
Appendix A. 56
Appendix B. 58
Appendix C. 60
References 70
iv
List of Figures
Figure Number Page
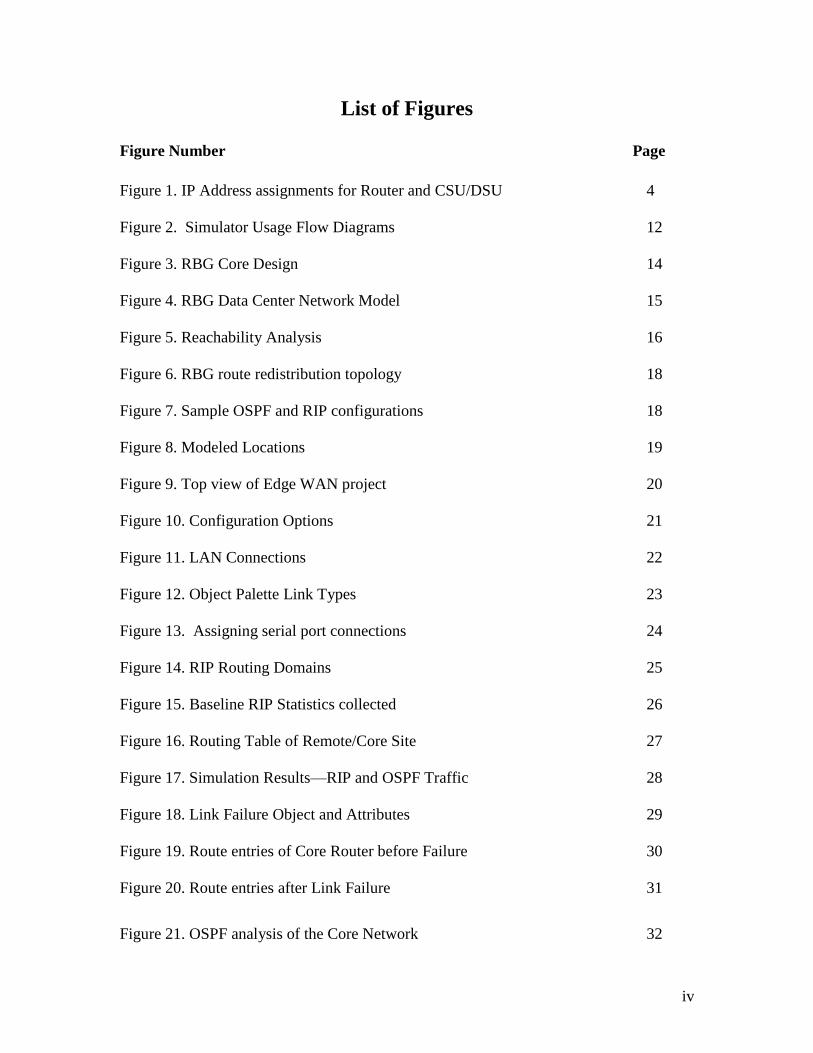
Figure 1. IP Address assignments for Router and CSU/DSU 4
Figure 2. Simulator Usage Flow Diagrams 12
Figure 3. RBG Core Design 14
Figure 4. RBG Data Center Network Model 15
Figure 5. Reachability Analysis 16
Figure 6. RBG route redistribution topology 18
Figure 7. Sample OSPF and RIP configurations 18
Figure 8. Modeled Locations 19
Figure 9. Top view of Edge WAN project 20
Figure 10. Configuration Options 21
Figure 11. LAN Connections 22
Figure 12. Object Palette Link Types 23
Figure 13. Assigning serial port connections 24
Figure 14. RIP Routing Domains 25
Figure 15. Baseline RIP Statistics collected 26
Figure 16. Routing Table of Remote/Core Site 27
Figure 17. Simulation Results—RIP and OSPF Traffic 28
Figure 18. Link Failure Object and Attributes 29
Figure 19. Route entries of Core Router before Failure 30
Figure 20. Route entries after Link Failure 31
Figure 21. OSPF analysis of the Core Network 32
v
Figure 22. OSPF Area Design 37
Figure 23. Sample OSPF Configuration 39
Figure 24. RBG Core OSPF Area Design 40
Figure 25. IP Convergence Data 42
Figure 26. OSPF Convergence Data 43
Figure 27. OSPF Process Data 44
Figure 28. OSPF Traffic Data 44
Figure 29. OSPF Process Data for Remote Site 25 45
Figure 30. IP address assignments for Atlanta Division 49
Figure 31. Access-List Configuration Comparisons 51
Figure 32. Simulation Log 52
vi
Abstract
Virtual modeling of enterprise networks has become increasingly crucial for
maintaining the supportability of any size network. Due to business growth combined
with the complexity of today’s technology Really Big Grocery (RBG) has had to confront
significant challenges in effective management of its networks and applications. This
project discusses how OPENT IT GURU was used to create network models and analyze
the supporting network infrastructure that is used to successfully operate their business.
OPNET IT Guru provides a Virtual Network Environment that models the behavior of
the entire network, including routers, switches, protocols, and individual applications.
OPNET IT Guru was used to model part of the RBG operational network environment to
analyze the topology, devices, configurations, and traffic flows to better understand the
remote site networks and core infrastructure. The models created were also used to test a
new Open Shortest Path First (OSPF) edge routing protocol design, simulate, and validate
the impact of the design and reachability across the network. Routing analysis was done
to study routing domains. Device configurations were analyzed for inconsistencies and
the models generated were used to investigate what-if scenarios.
1
Modeling the Enterprise Network
1. Statement of the Problem
The Real Big Grocery Company (RBG) is one of the largest retailers in the world,
founded in 1883 in Columbus, Ohio where its headquarters remain today. RBG currently
operates 2,515 stores under more than a dozen banners in 32 states. RBG also operates 41
food-processing plants, 431 fine jewelry stores, and numerous other facilities throughout
the nation. RBG needs the ability to perform network analysis of their core network
infrastructure and remote sites to detect and determine network inefficiencies and
reachability across the network. RBG also wants to analyze link utilization, and test
infrastructure changes prior to deployment/validation via modeling the effectiveness of
the designs. In addition, RBG wants to use modeling tools to demonstrate impact of
planned network changes and events with potential impact on the health of the network,
thus allowing proactive up-front mitigation and avoidance of identified issues. RBG also
requires a way to better document configurations of the network infrastructure. The
readdressing of the store network must be completed to prevent future Internet
communication problems. RBG needs to migrate to a private IP address range that it has
defined in the 10.0.0.0/8 address space.
RBG’s store network environment currently uses the 30.0.0.0/8 IP address range.
This IP address range is currently not being routed over the Internet. However, due to the
growth of the Internet and the escalating demand for public IP addresses, it is possible
that this address space will be released for public use and assigned to other organizations.
2
The impact to the RBG Internet communications could be significant. If these locations
are not readdressed, RBG will experience problems with Internet communications when
the affected addresses are publicly deployed. The problems could begin as the inability to
communicate with a few outside companies and quickly escalate to full Internet outages
that last several days. The interruption of these services could seriously interfere with the
functioning of key Internet applications. Problems will also create overwhelming support
and administration cost. The current store network environment is sub-netted to only
allow for 254 hosts per store location. RBG plans to implement future projects that will
demand more IP addresses/networks at each site. If the addresses are deployed before
this project is complete, an opportunity will be missed to prevent possible problems.
RBG’s current network infrastructure has grown over the last five years making it
very complex. Administration and support for the 6,000 routes alone is a full time job for
a network engineer (9). Business growth and a demand for more accurate planning and
engineering as well as proactive service level management have been problematic for
RBG. RBG currently lacks the ability to fully test network changes before they are
placed into the production environment. RBG relies on the knowledge and skills of the
RBG network engineers and ―white-boarding‖ techniques to determine potential issues
with a network change (9). This approach has caused network downtime due to
unexpected problems, which has resulted in costly outages. RBG’s network team has also
faced challenges in dealing with reachability across the network. The company currently
has remote locations that are connected by point-to-point links that are running RIPv2 as
the routing protocol. RBG needs to migrate to OSPF at these edge devices to decrease
3
convergence times and move away from the RIPv2 routing protocol. The network team
needs the ability to analyze the network to increase performance and maintain
supportability.
In order for RBG to remain competitive and remain one of the largest retailers in the
world, a stable and reliable network infrastructure is crucial. The continued growth of the
business will depend on the ability to leverage current technology to increase services
that RBG can provide to their customers. Due to the high availability demand on various
network sections, RBG must develop ways to test network configuration changes,
improve network performance across all sections of the enterprise and maintain the
supportability of the enterprise network to avoid costly outages.
2. Definition of the Need
A new IP address scheme for the store network environment using a private IP
address space must be completed to prevent future Internet outages. This design will
include all 2,515 store locations. Each store location will have four class c subnets. The
private IP address space of 10.145.0.0-10.239.0.0(9) was used. The private 10.0.0.0(4)
address space is currently deployed throughout the enterprise network and will provide
uniformity. Each store location consists of a Nortel Advanced Remote Node (ARN)
router and a Visual Networks Channel Service Unit/Data Service Unit (CSU/DSU).
Verizon assigns IP addresses on both ends of the Provider Edge (PE) and Customer Edge
(CE) access links (2); therefore I will be assigning addresses to the LAN segment at each
location. I will subnet out the private IP address space to allow for four unique network
4
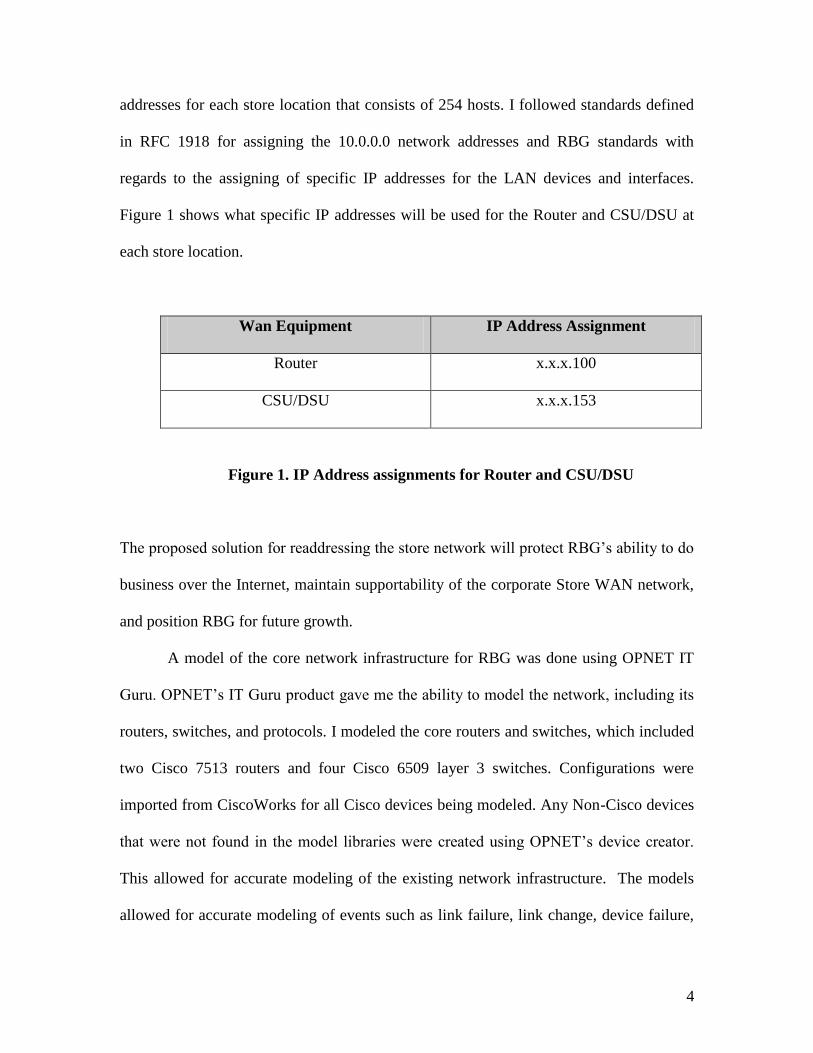
addresses for each store location that consists of 254 hosts. I followed standards defined
in RFC 1918 for assigning the 10.0.0.0 network addresses and RBG standards with
regards to the assigning of specific IP addresses for the LAN devices and interfaces.
Figure 1 shows what specific IP addresses will be used for the Router and CSU/DSU at
each store location.
Wan Equipment IP Address Assignment
Router x.x.x.100
CSU/DSU x.x.x.153
Figure 1. IP Address assignments for Router and CSU/DSU
The proposed solution for readdressing the store network will protect RBG’s ability to do
business over the Internet, maintain supportability of the corporate Store WAN network,
and position RBG for future growth.
A model of the core network infrastructure for RBG was done using OPNET IT
Guru. OPNET’s IT Guru product gave me the ability to model the network, including its
routers, switches, and protocols. I modeled the core routers and switches, which included
two Cisco 7513 routers and four Cisco 6509 layer 3 switches. Configurations were
imported from CiscoWorks for all Cisco devices being modeled. Any Non-Cisco devices
that were not found in the model libraries were created using OPNET’s device creator.
This allowed for accurate modeling of the existing network infrastructure. The models
allowed for accurate modeling of events such as link failure, link change, device failure,
5
and route changes. The network model of the core allowed for analysis of the routing
topology of the RBG network (6). I analyzed how RBG uses Routing Information
Protocol (RIPv2), Open Shortest Path First (OSPF), and Border Gateway Protocol (BGP).
Analysis of the core router and core switch configurations were completed to locate any
configuration discrepancies and provide documentation. I created and ran simulations
that showed how the routing protocols operated on individual network nodes and the
enterprise network as a whole. The simulations showed network convergence activity,
convergence duration, traffic received, and traffic sent for BGP (3), RIPv2 (5), and OSPF
(7). They also showed route table information for route addictions, route deletions and
total number of route updates during failure scenarios to understand the impact of these
situations during failures. The models allowed RBG to predict the behavior of topology
changes, and fully test and understand network changes (10).
The models created will assist network engineers and management to better plan,
engineer, and meet service level agreements that will help drive the success of the
business. RBG technicians and management will be able to better visualize and
understand the network infrastructure and its complexity.
2.1 User Profile
There are three user profiles for the Network Design and Analysis of the RBG
network. The models created will require a high level of knowledge of the core network
infrastructure to use and understand. Two main groups will have access to the models,
6
network engineers and network management users. Use of the software is restricted by
the licensing agreement, currently only one user can access the software at a time.
2.1.1 Network Engineers
The network engineers will work very closely with the creation of the models
within OPNET. They will use the software to create test environments virtually and use
the models to analyze the network. These models will help in three key areas:
Diagnosing the network- Debug configurations of network devices, audit the
network, and monitor and replicate route traffic flows to help manage the
network.
Validate changes- provide them the ability to test configuration changes before
implementation, fine tune protocols within the network, and assist with new
network designs.
Plan for future growth- Plan upgrades for traffic growth, help with designing
resilient networks, and optimize the deployment of new technologies.
2.1.2 Network Management Group
The network management group will also be tasked with the ability to create network
models that will help with managing the network. This group will also be in charge of the
server that the OPNET software runs on. In addition they are in charge of CiscoWorks.
CiscoWorks was used to import configurations from Cisco devices. This group will
provide the network engineers with these configurations files. This group will also help
with validating changes within the network. They will use the models to insure that
changes in the network will be reflected within the management software that the
Network Operations Center (NOC) will use to monitor the network on a day-to-day basis.
7
They will also be involved in planning for future growth of the network. They will work
closely with management and network engineers.
3. Deliverables
To provide an analysis of the RBG network that will look at the network routing
design, device configurations and model creation of a virtual network to allow for
simulations to aide in better understanding and maintaining the supportability of the
enterprise network. Detailed diagrams and models will be created to analyze aspects of
the RBG network. The analysis and design of the network will consist of the following
deliverables:
Modeling of the Core network for RBG
(a) Cisco Routers
(b) Cisco Switches
(c) Routing protocols (BGP, OSPF, RIP)
(d) Links between the devices
Analysis of current routing protocols
(a) BGP
(b) OSPF
(c) RIP
Analysis of Core router and switch configurations
(a) Cisco 7513
(b) Cisco 6509 Layer 3 switches
(c) Access list configurations
New OSPF design for office locations
(a) OSPF design to migrate from RIPv2 for Non-Verizon WAN links
(b) Comparison study of RIPv2 versus OSPF
8
IP address redesign for Store network
(a) Using private 10 network
(b) Four class c subnets per store
4. Design and Development
The next sections describe the project’s timeline and what was accomplished
during each Senior Design section. A detailed budget and timelines can be found in
Appendix B.
4.1 Timeline
The project involved several challenges, learning opportunities, and
accomplishments. Below are the achievements of the Senior Design Sequence.
4.1.1 Senior Design I Accomplishments
During Senior Design I the following was accomplished:
Interviewed RBG network engineer
Analyzed RBG network design
Researched the use of OPNET IT Guru within RBG
Increased knowledge of OPNET IT Guru
Began the development process
Developed proposal and oral presentation
During research and information gathering I spent hours analyzing the RBG
network design. I found that a only few people used OPNET and their level of knowledge
was similar to mine. None of the network engineers had any working knowledge but
9
agreed that it was a tool that could be utilized more. During this time I worked with the
Data Communications manager Ron Parker to gain access to the OPNET server.
4.1.2 Senior Design II Accomplishments
During Senior Design II I accomplished the following:
Created core network models
Analyzed core routing protocols
Began development of remote sites models
Completed readdressing of store network
Prepared Design Freeze documentation and oral presentations
Creation of the models proved to be time consuming and tedious. Configuration
files that imported from CiscoWorks had to be verified to insure each device had the
correct configuration. Simulations were run to allow for the study of the routing domains
and reachability analysis across the network. Remote site locations were also modeled.
All configuration files were verified against the production network.
4.1.3 Senior Design III Accomplishments
During Senior Design III we accomplished the following:
Completed modeling of core and remote sites
Creation of OSPF design for remote sites
Analysis of OSPF design
Tested all models
10
Completed documentation for final project
Presented at Tech Expo
Presented final project
The creation of the OPSF design was both challenging and rewarding. I was able
to take a conceptual design completed on paper and turn it into a model in OPNET and
then analyze the design and test the impact of the design on the core network.
5. Proof of Design
The next sections show in detail how the deliverables of the project were fulfilled
and what challenges I encountered.
5.1 Model creation using OPNET
OPNET IT Guru is a virtual environment for modeling, analyzing and performance
prediction of IT infrastructures, including applications, servers and network technologies.
I used OPNET IT Guru version 11.0A PL3 (Build 3029) for modeling the RBG network.
I created projects, which included multiple scenarios to test various aspects of the
network. The models allowed for analysis of the routing topology and provided a
powerful design tool. The scenarios show how and when routing tables are updated and if
routing is working correctly across sections of the network. This analysis will help with
making design changes to the core network to increase performance. Design changes can
be made to study the impact of those changes before placed into the production
environment. Testing the configuration changes will give the network engineers an
11
improved way to analyze the network and make design changes. To simulate the network
performance I followed these steps:
1. Create a project. A project is a set of scenarios with a common target.
2. Create a scenario. A scenario is used to study a specific feature of the technology
studied. If many scenarios are needed the first one will be used as a starting point
for the next. Creating a scenario involves choosing the scenario dimensions and
background, naming the scenario, deploying the network elements, creating
profiles and application demands, ect.
3. Choose statistics to study. Parameters must be set for the simulation to calculate.
Some of the available statistics that can be calculated are link throughput
(packets/sec), access delay into a web page, and routing table updates (per Sec).
4. Execute the simulation, or duplicate the scenario. To duplicate the scenario means
creating a new scenario starting from another scenario. This process can be
repeated as many times as necessary.
5. Run the simulation. All the scenarios have to be simulated at the end (similar to
compiling a program). OPNET will do a performance prediction with all the
information about the scenarios, the traffic demands, the statistics chosen, ect.
6. Examine the results. Results analysis is done with graphics, statistics and the
simulation log created from execution of the simulation.
7. Examine What-If scenarios. OPNET is designed for network analysis and designs.
If simulation results are unexpected, the models can be changed until the desired
12
results are reached. Analysis can be done in order to test how the model behaves
if some conditions were changed.
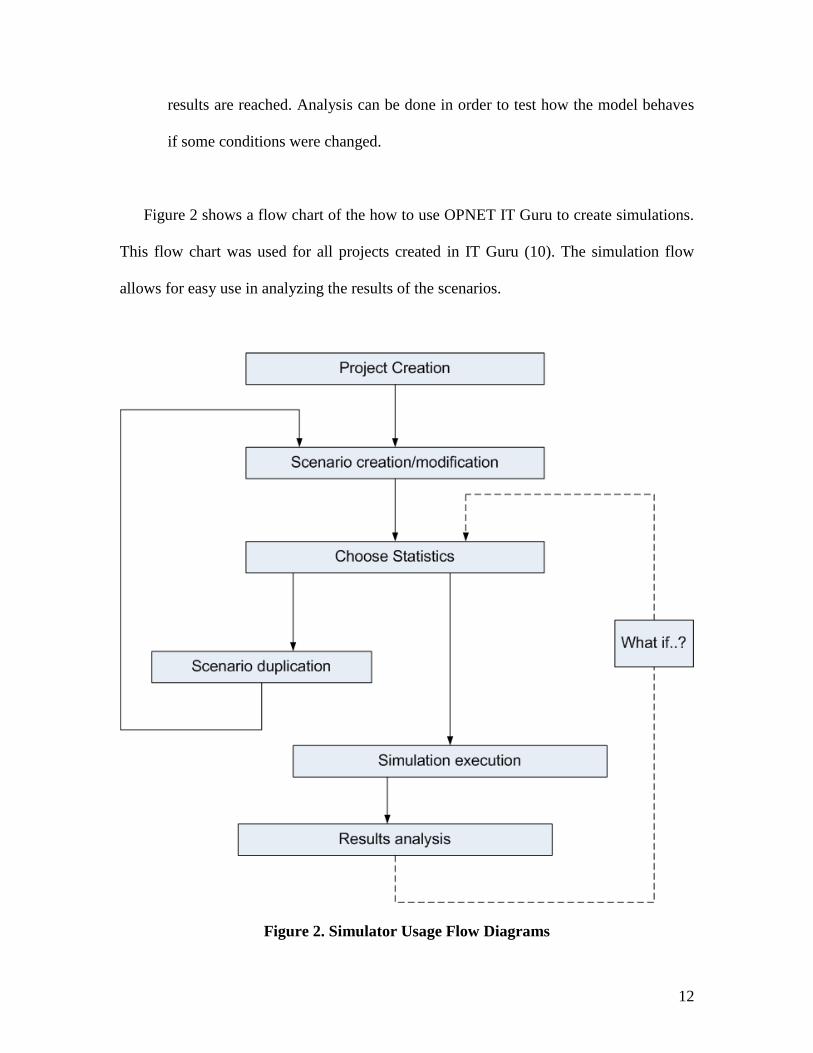
Figure 2 shows a flow chart of the how to use OPNET IT Guru to create simulations.
This flow chart was used for all projects created in IT Guru (10). The simulation flow
allows for easy use in analyzing the results of the scenarios.
Figure 2. Simulator Usage Flow Diagrams
13
5.2 Core Network Design
The current RBG core network infrastructure consists of two Cisco 7513* and two
Cisco 6509* layer 3 switches. The Cisco 7513 routers connect the RBG network into the
Verizon network through two ATM/OC-3 connections (8). Multiple store and non-store
locations connect into the RBG network through the OC-3 connections. BGP is used to
exchange routing updates between RBG and Verizon. The non-Verizon sites connect
through point-to-point links. RBG currently uses Sprint, Broadwing, and Time Warner
services for the point-to-point links. RIPv2 is used to exchange routing information for
these sites. These sites are connected to the Cisco 7513 through T1 and fractional T1
connections and connected to the serial interfaces on the Cisco 7513. The internal core
uses route redistribution to allow all routes to be known to the core devices in the
network. The Cisco 7513 uses the routes that it learns via BGP and RIP and redistributes
those routes into OSPF, which it exchanges with the core Cisco 6509 switches. Multiple
layer 2 switches connect to the Cisco 6509 and are further segmented by the use of
Virtual Local Area Networks (VLAN’s). The store network is configured as multiple
VLANs and has a different OSPF process. The Store VLAN uses OSPF 30 and the Core
switches use OSPF 2540. The core network was modeled to analyze the design and
configurations of the core devices. Figure 3 on the next page shows the RBG Core
Network Design.
* See Appendix A for information about the Cisco 7513 and Cisco 6509 series.
14
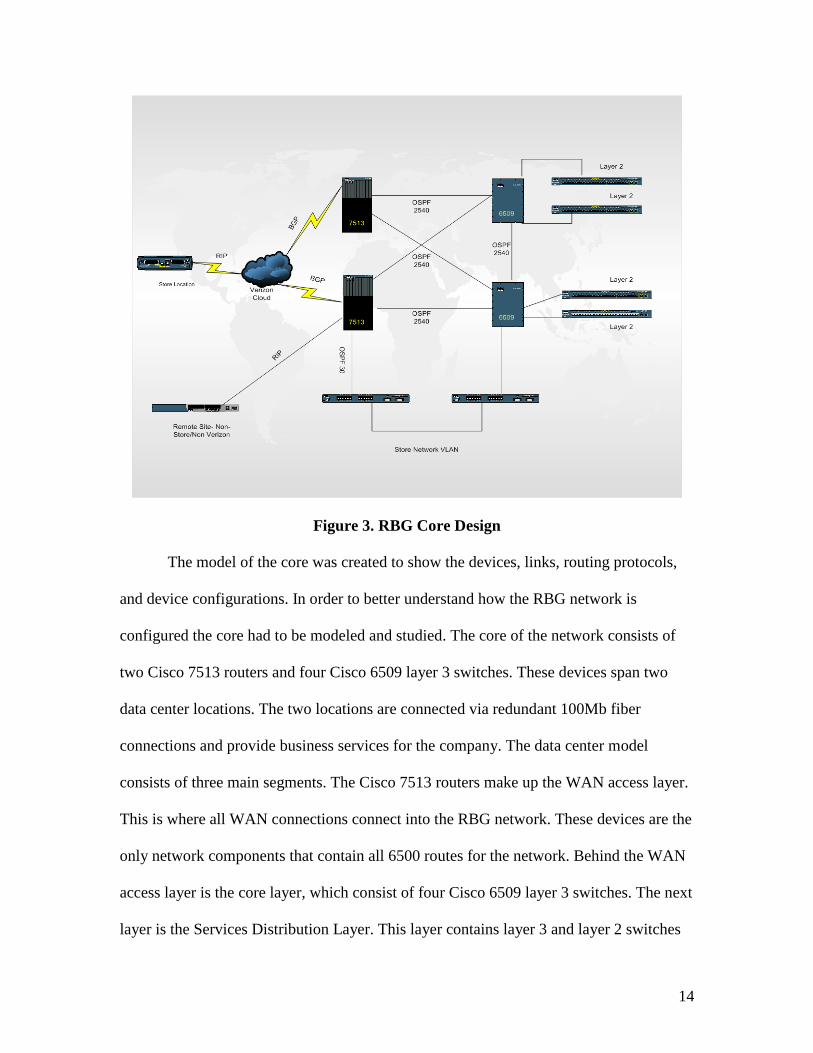
Figure 3. RBG Core Design
The model of the core was created to show the devices, links, routing protocols,
and device configurations. In order to better understand how the RBG network is
configured the core had to be modeled and studied. The core of the network consists of
two Cisco 7513 routers and four Cisco 6509 layer 3 switches. These devices span two
data center locations. The two locations are connected via redundant 100Mb fiber
connections and provide business services for the company. The data center model
consists of three main segments. The Cisco 7513 routers make up the WAN access layer.
This is where all WAN connections connect into the RBG network. These devices are the
only network components that contain all 6500 routes for the network. Behind the WAN
access layer is the core layer, which consist of four Cisco 6509 layer 3 switches. The next
layer is the Services Distribution Layer. This layer contains layer 3 and layer 2 switches
15
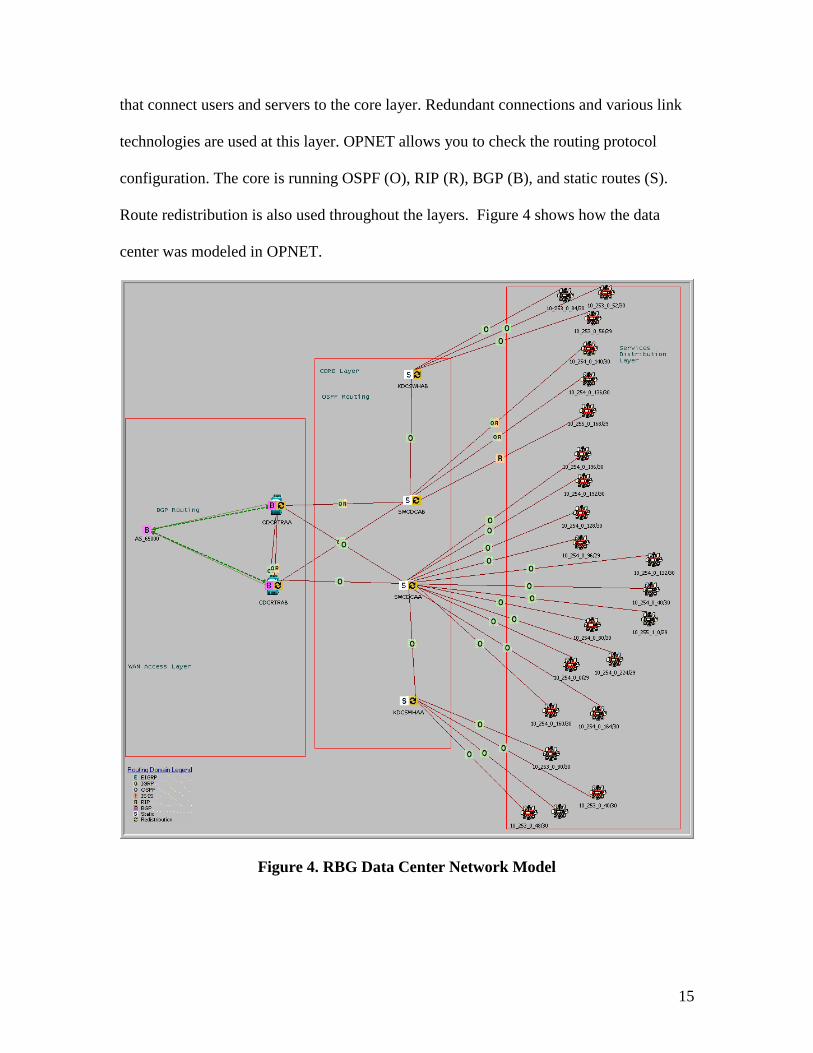
that connect users and servers to the core layer. Redundant connections and various link
technologies are used at this layer. OPNET allows you to check the routing protocol
configuration. The core is running OSPF (O), RIP (R), BGP (B), and static routes (S).
Route redistribution is also used throughout the layers. Figure 4 shows how the data
center was modeled in OPNET.
Figure 4. RBG Data Center Network Model
16
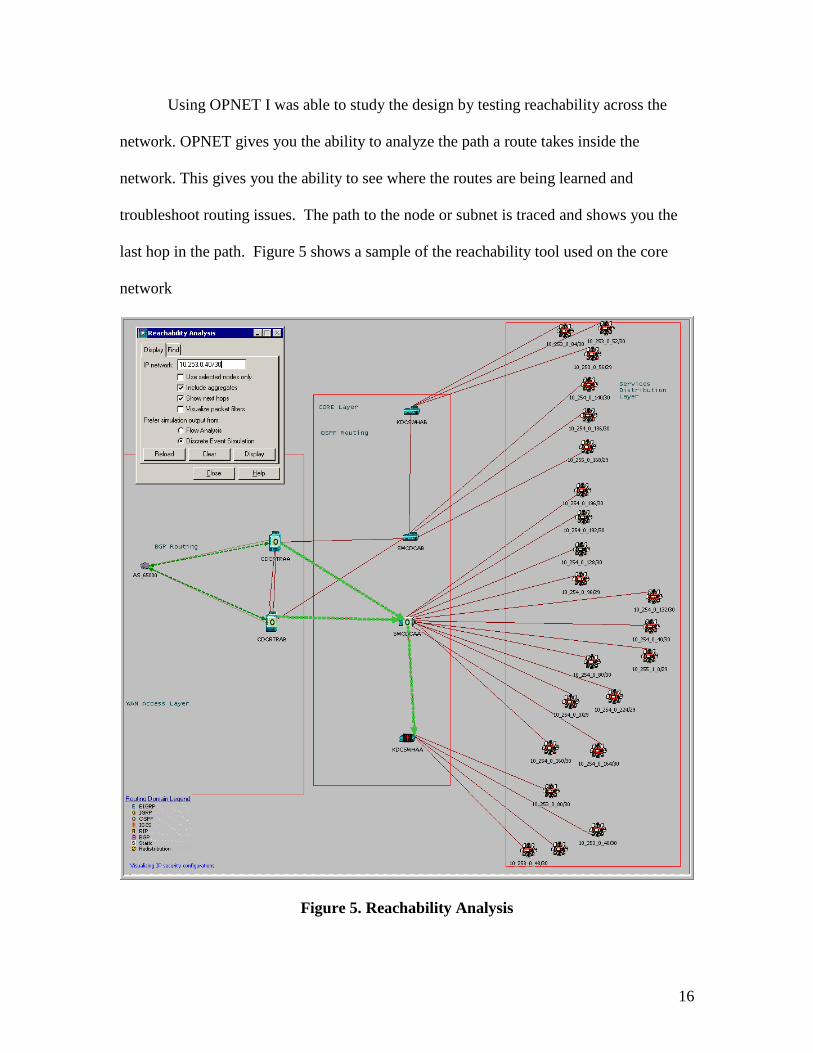
Using OPNET I was able to study the design by testing reachability across the
network. OPNET gives you the ability to analyze the path a route takes inside the
network. This gives you the ability to see where the routes are being learned and
troubleshoot routing issues. The path to the node or subnet is traced and shows you the
last hop in the path. Figure 5 shows a sample of the reachability tool used on the core
network
Figure 5. Reachability Analysis
17
5.3 RBG Routing Protocol Analysis
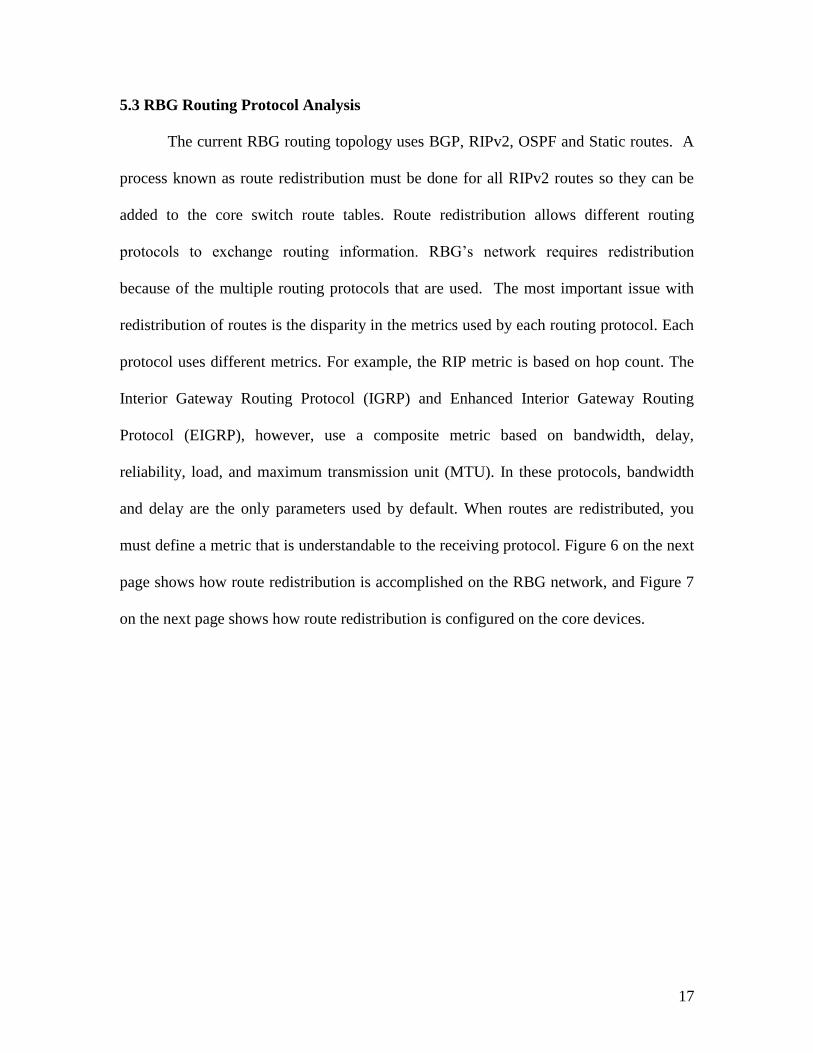
The current RBG routing topology uses BGP, RIPv2, OSPF and Static routes. A
process known as route redistribution must be done for all RIPv2 routes so they can be
added to the core switch route tables. Route redistribution allows different routing
protocols to exchange routing information. RBG’s network requires redistribution
because of the multiple routing protocols that are used. The most important issue with
redistribution of routes is the disparity in the metrics used by each routing protocol. Each
protocol uses different metrics. For example, the RIP metric is based on hop count. The
Interior Gateway Routing Protocol (IGRP) and Enhanced Interior Gateway Routing
Protocol (EIGRP), however, use a composite metric based on bandwidth, delay,
reliability, load, and maximum transmission unit (MTU). In these protocols, bandwidth
and delay are the only parameters used by default. When routes are redistributed, you
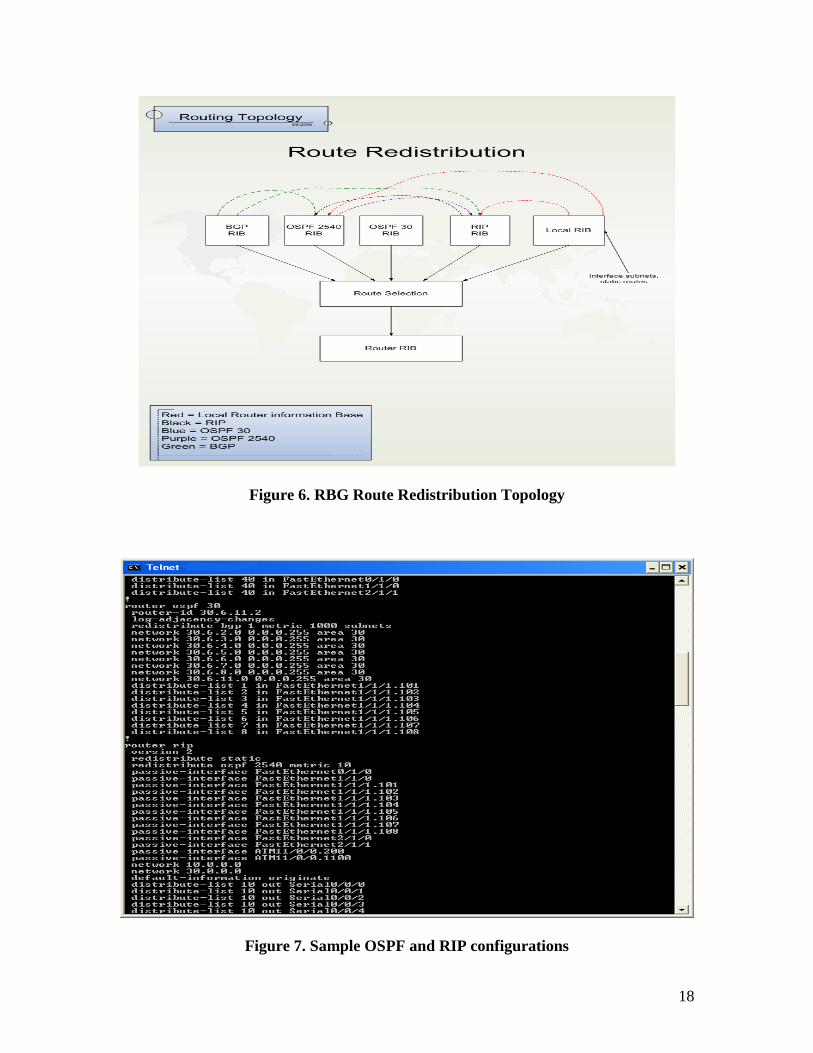
must define a metric that is understandable to the receiving protocol. Figure 6 on the next
page shows how route redistribution is accomplished on the RBG network, and Figure 7
on the next page shows how route redistribution is configured on the core devices.
18
Figure 6. RBG Route Redistribution Topology
Figure 7. Sample OSPF and RIP configurations
19
The RIP configurations on the core routers redistribute static and OSPF 2540 routes. The
RIP configuration also shows the use of passive-interface mode on specific interfaces and
the use of a distribute-list on the serial interfaces. The distribute-list is an access-list
applied to incoming or outgoing RIP and OSPF route updates. A passive-interface does
not participate in route updates.
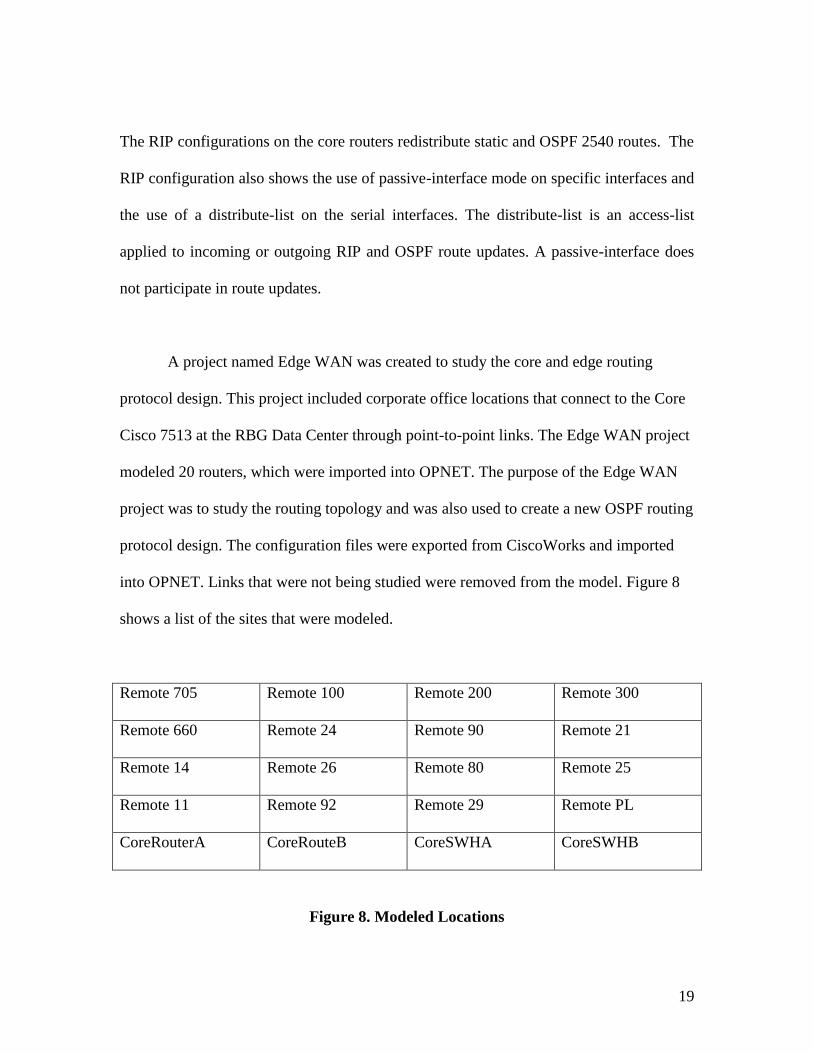
A project named Edge WAN was created to study the core and edge routing
protocol design. This project included corporate office locations that connect to the Core
Cisco 7513 at the RBG Data Center through point-to-point links. The Edge WAN project
modeled 20 routers, which were imported into OPNET. The purpose of the Edge WAN
project was to study the routing topology and was also used to create a new OSPF routing
protocol design. The configuration files were exported from CiscoWorks and imported
into OPNET. Links that were not being studied were removed from the model. Figure 8
shows a list of the sites that were modeled.
Remote 705 Remote 100 Remote 200 Remote 300
Remote 660 Remote 24 Remote 90 Remote 21
Remote 14 Remote 26 Remote 80 Remote 25
Remote 11 Remote 92 Remote 29 Remote PL
CoreRouterA CoreRouteB CoreSWHA CoreSWHB
Figure 8. Modeled Locations
20
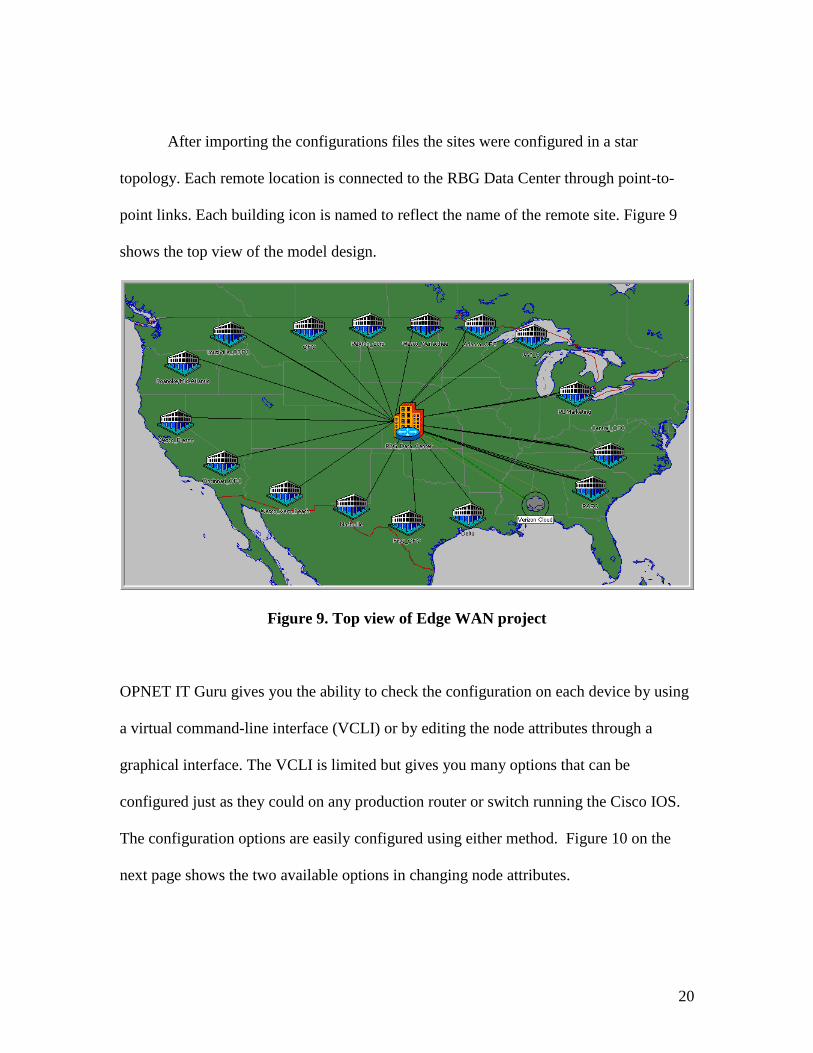
After importing the configurations files the sites were configured in a star
topology. Each remote location is connected to the RBG Data Center through point-to-
point links. Each building icon is named to reflect the name of the remote site. Figure 9
shows the top view of the model design.
Figure 9. Top view of Edge WAN project
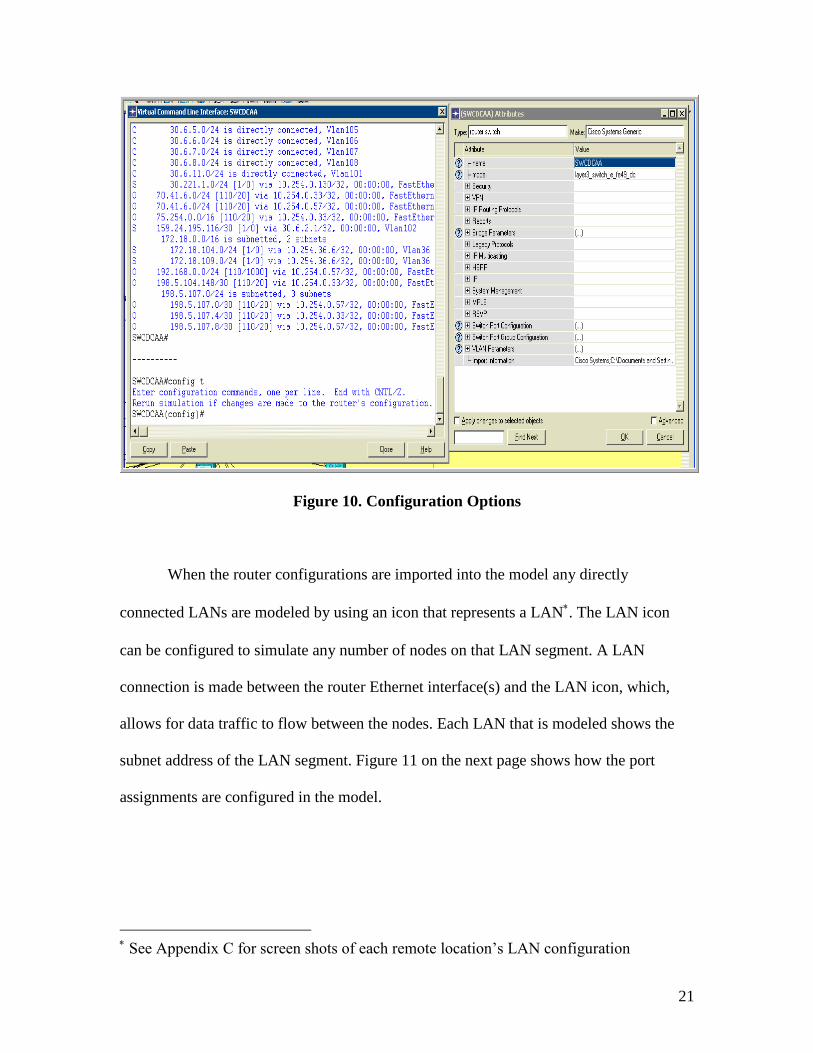
OPNET IT Guru gives you the ability to check the configuration on each device by using
a virtual command-line interface (VCLI) or by editing the node attributes through a
graphical interface. The VCLI is limited but gives you many options that can be
configured just as they could on any production router or switch running the Cisco IOS.
The configuration options are easily configured using either method. Figure 10 on the
next page shows the two available options in changing node attributes.
21
Figure 10. Configuration Options
When the router configurations are imported into the model any directly
connected LANs are modeled by using an icon that represents a LAN. The LAN icon
can be configured to simulate any number of nodes on that LAN segment. A LAN
connection is made between the router Ethernet interface(s) and the LAN icon, which,
allows for data traffic to flow between the nodes. Each LAN that is modeled shows the
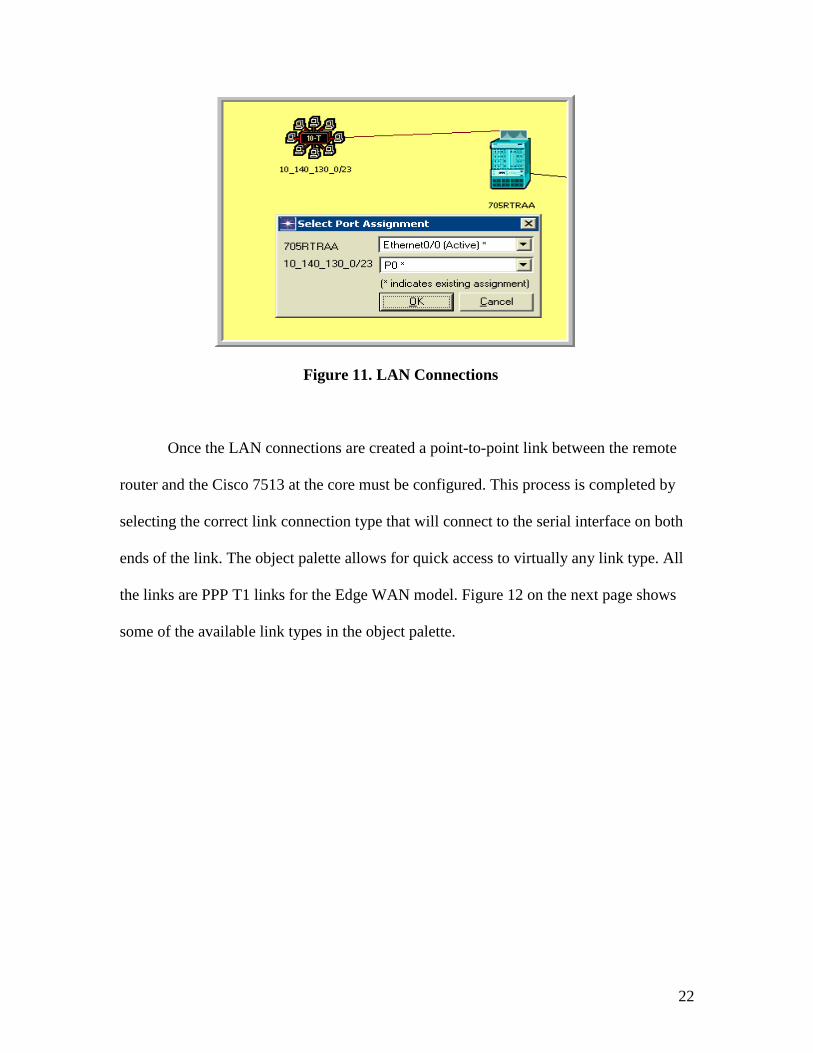
subnet address of the LAN segment. Figure 11 on the next page shows how the port
assignments are configured in the model.
See Appendix C for screen shots of each remote location’s LAN configuration
22
Figure 11. LAN Connections
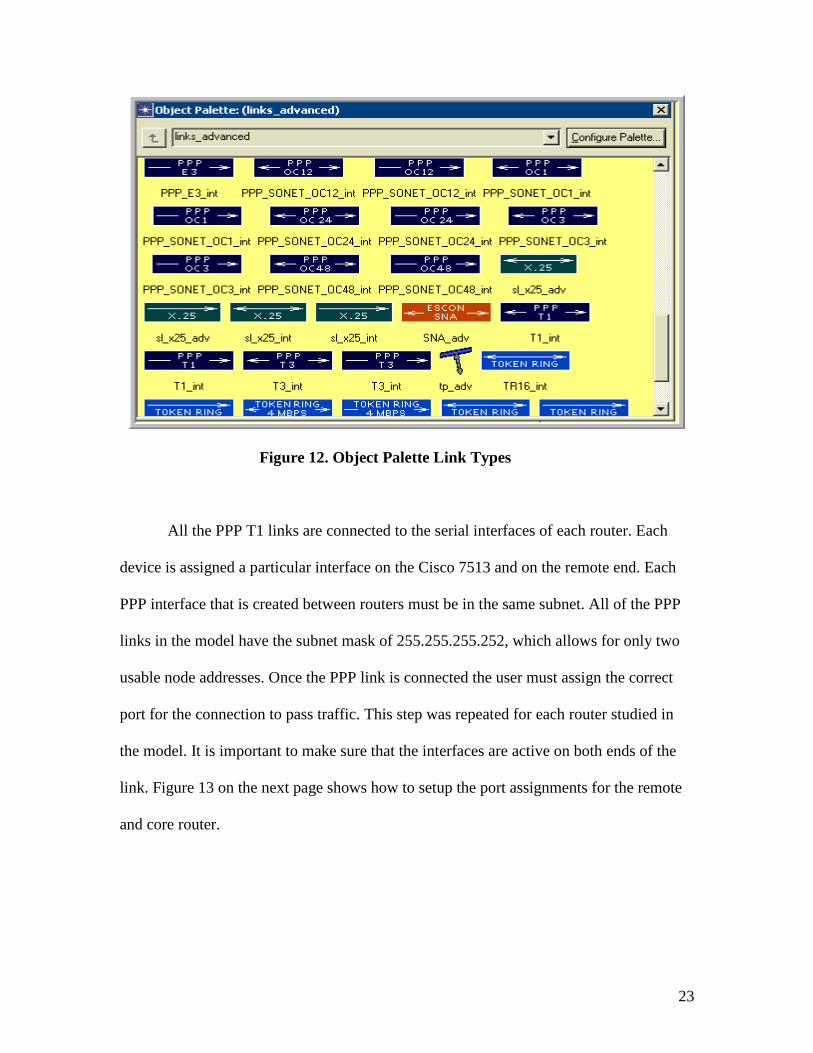
Once the LAN connections are created a point-to-point link between the remote
router and the Cisco 7513 at the core must be configured. This process is completed by
selecting the correct link connection type that will connect to the serial interface on both
ends of the link. The object palette allows for quick access to virtually any link type. All
the links are PPP T1 links for the Edge WAN model. Figure 12 on the next page shows
some of the available link types in the object palette.
23
Figure 12. Object Palette Link Types
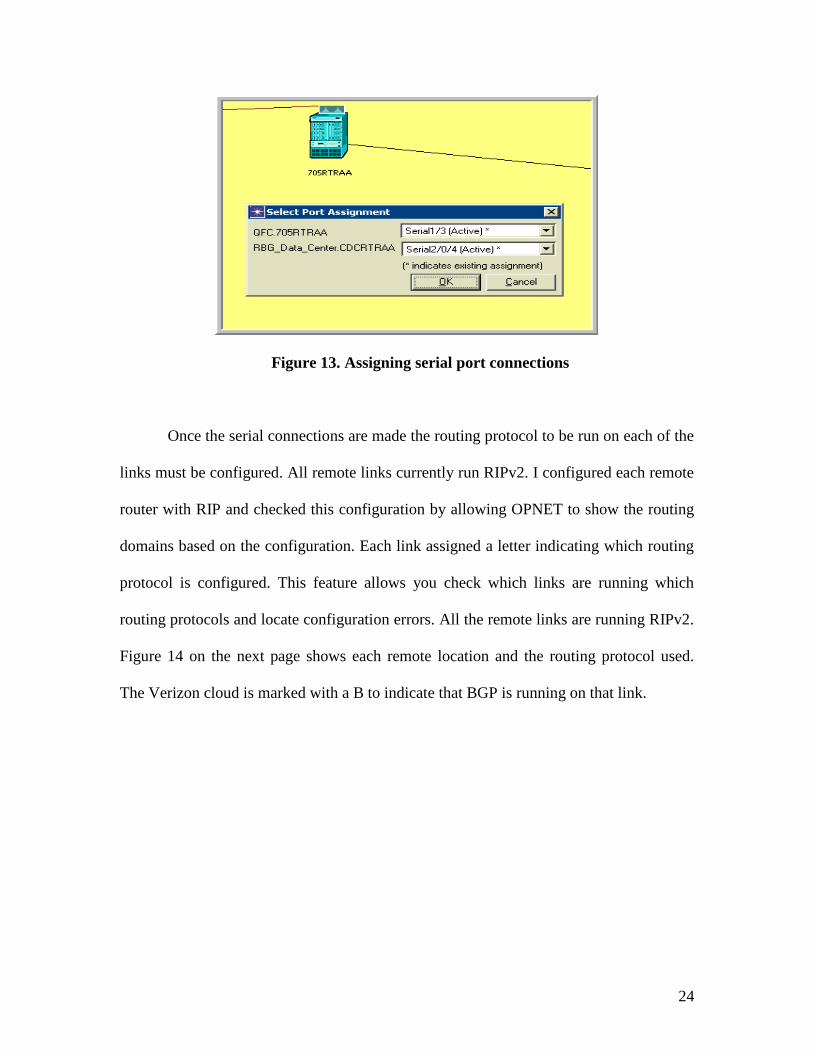
All the PPP T1 links are connected to the serial interfaces of each router. Each
device is assigned a particular interface on the Cisco 7513 and on the remote end. Each
PPP interface that is created between routers must be in the same subnet. All of the PPP
links in the model have the subnet mask of 255.255.255.252, which allows for only two
usable node addresses. Once the PPP link is connected the user must assign the correct
port for the connection to pass traffic. This step was repeated for each router studied in
the model. It is important to make sure that the interfaces are active on both ends of the
link. Figure 13 on the next page shows how to setup the port assignments for the remote
and core router.
24
Figure 13. Assigning serial port connections
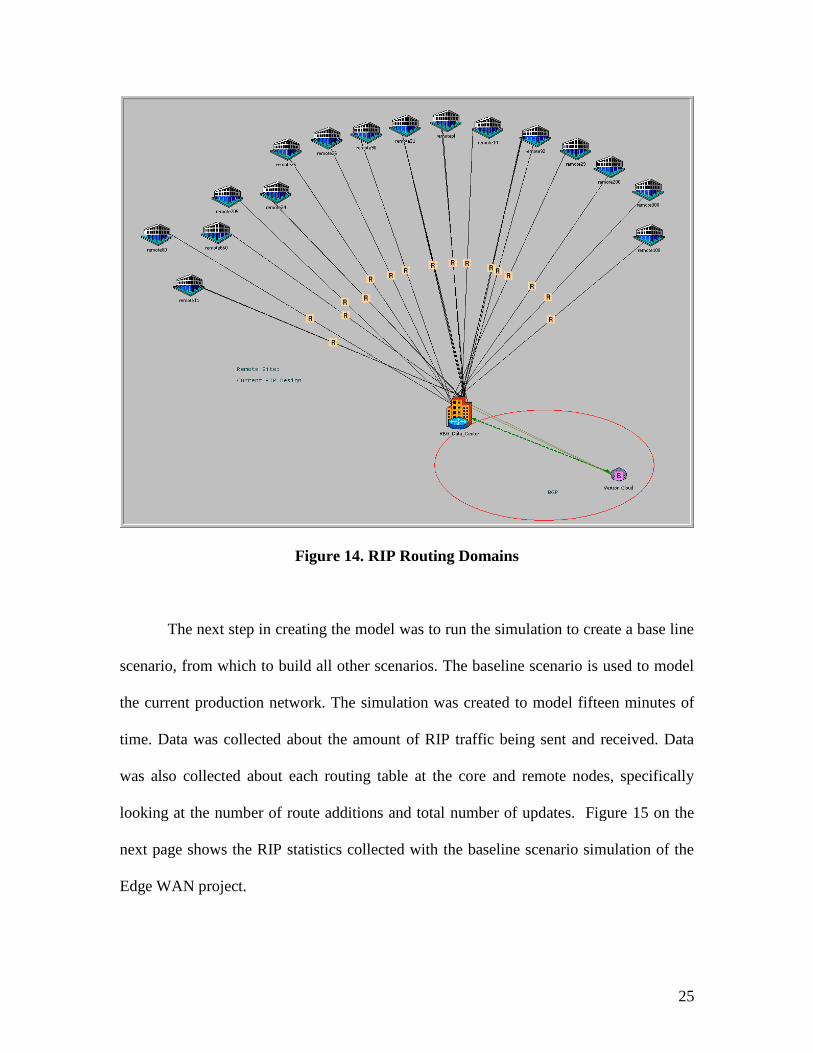
Once the serial connections are made the routing protocol to be run on each of the
links must be configured. All remote links currently run RIPv2. I configured each remote
router with RIP and checked this configuration by allowing OPNET to show the routing
domains based on the configuration. Each link assigned a letter indicating which routing
protocol is configured. This feature allows you check which links are running which
routing protocols and locate configuration errors. All the remote links are running RIPv2.
Figure 14 on the next page shows each remote location and the routing protocol used.
The Verizon cloud is marked with a B to indicate that BGP is running on that link.
25
Figure 14. RIP Routing Domains
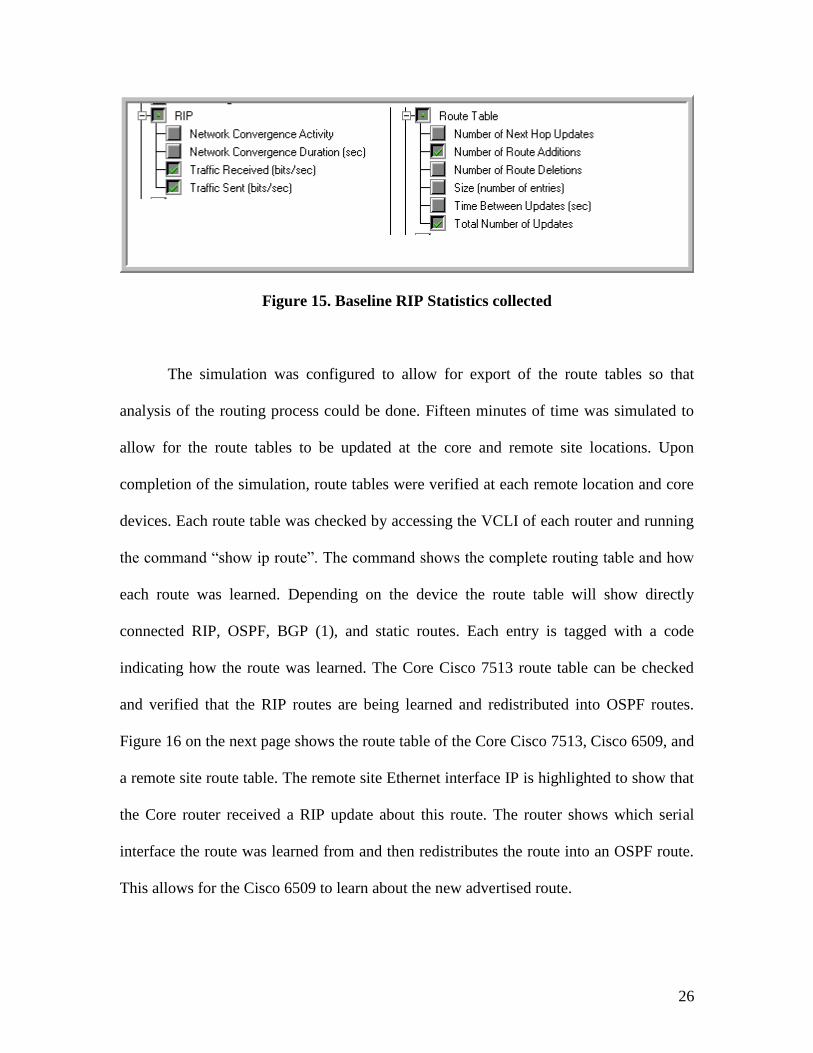
The next step in creating the model was to run the simulation to create a base line
scenario, from which to build all other scenarios. The baseline scenario is used to model
the current production network. The simulation was created to model fifteen minutes of
time. Data was collected about the amount of RIP traffic being sent and received. Data
was also collected about each routing table at the core and remote nodes, specifically
looking at the number of route additions and total number of updates. Figure 15 on the
next page shows the RIP statistics collected with the baseline scenario simulation of the
Edge WAN project.
26
Figure 15. Baseline RIP Statistics collected
The simulation was configured to allow for export of the route tables so that
analysis of the routing process could be done. Fifteen minutes of time was simulated to
allow for the route tables to be updated at the core and remote site locations. Upon
completion of the simulation, route tables were verified at each remote location and core
devices. Each route table was checked by accessing the VCLI of each router and running
the command ―show ip route‖. The command shows the complete routing table and how
each route was learned. Depending on the device the route table will show directly
connected RIP, OSPF, BGP (1), and static routes. Each entry is tagged with a code
indicating how the route was learned. The Core Cisco 7513 route table can be checked
and verified that the RIP routes are being learned and redistributed into OSPF routes.
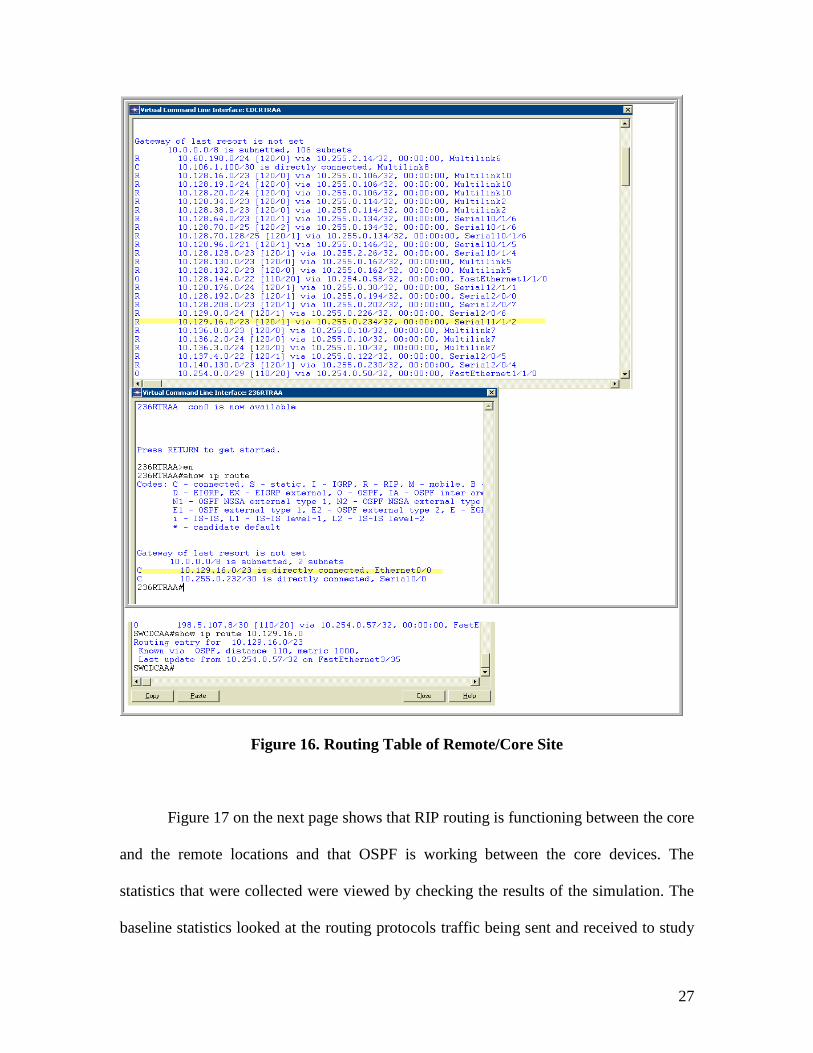
Figure 16 on the next page shows the route table of the Core Cisco 7513, Cisco 6509, and
a remote site route table. The remote site Ethernet interface IP is highlighted to show that
the Core router received a RIP update about this route. The router shows which serial
interface the route was learned from and then redistributes the route into an OSPF route.
This allows for the Cisco 6509 to learn about the new advertised route.
27
Figure 16. Routing Table of Remote/Core Site
Figure 17 on the next page shows that RIP routing is functioning between the core
and the remote locations and that OSPF is working between the core devices. The
statistics that were collected were viewed by checking the results of the simulation. The
baseline statistics looked at the routing protocols traffic being sent and received to study
28
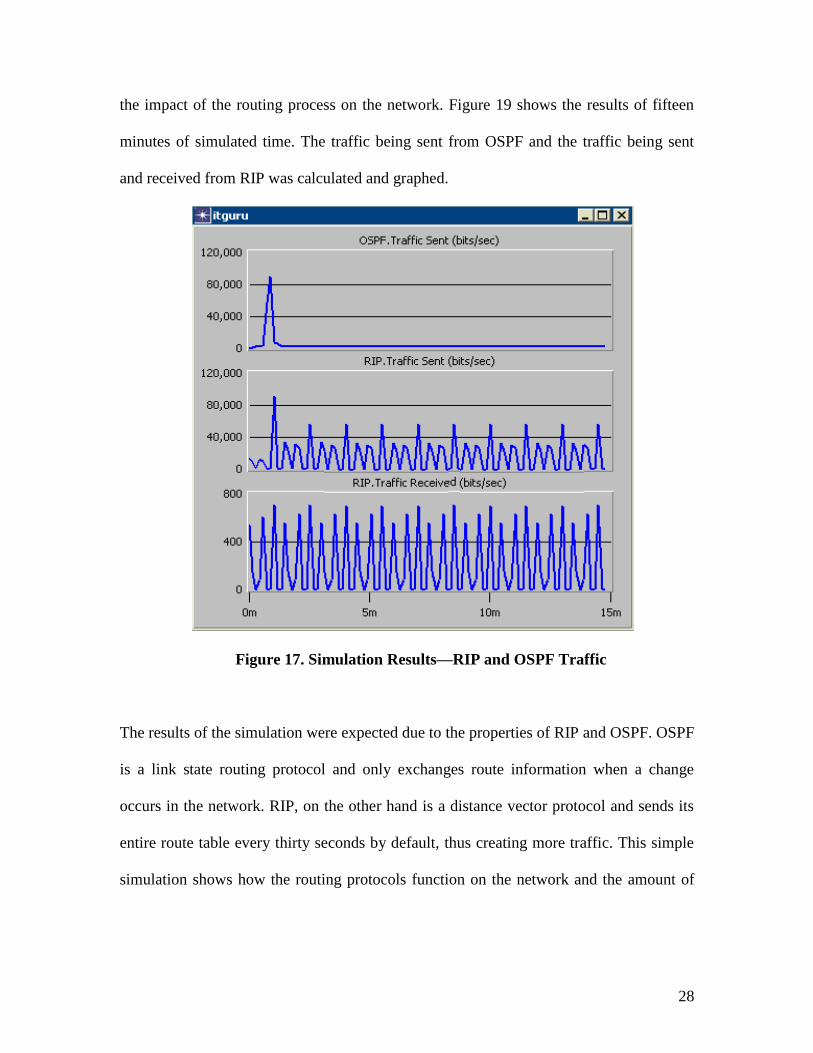
the impact of the routing process on the network. Figure 19 shows the results of fifteen
minutes of simulated time. The traffic being sent from OSPF and the traffic being sent
and received from RIP was calculated and graphed.
Figure 17. Simulation Results—RIP and OSPF Traffic
The results of the simulation were expected due to the properties of RIP and OSPF. OSPF
is a link state routing protocol and only exchanges route information when a change
occurs in the network. RIP, on the other hand is a distance vector protocol and sends its
entire route table every thirty seconds by default, thus creating more traffic. This simple
simulation shows how the routing protocols function on the network and the amount of
29
traffic generated by both. These results can be compared with results from other scenarios
to verify the reachability and consequences of any network routing changes.
Once the baseline scenario was fine tuned and configured to accurately model the
production network, link failure analysis was run to test the network after a link or node
failure (11). These failure tests provide a better understanding of the network topology
and how the routing protocols are affected by single or multiple link failures. These tests
also allow for what-if scenarios to analyze situations that could affect the performance of
the network. I choose to test failures on individual links and nodes to analyze the route
changes in the network. I duplicated the baseline scenario and named the new scenario
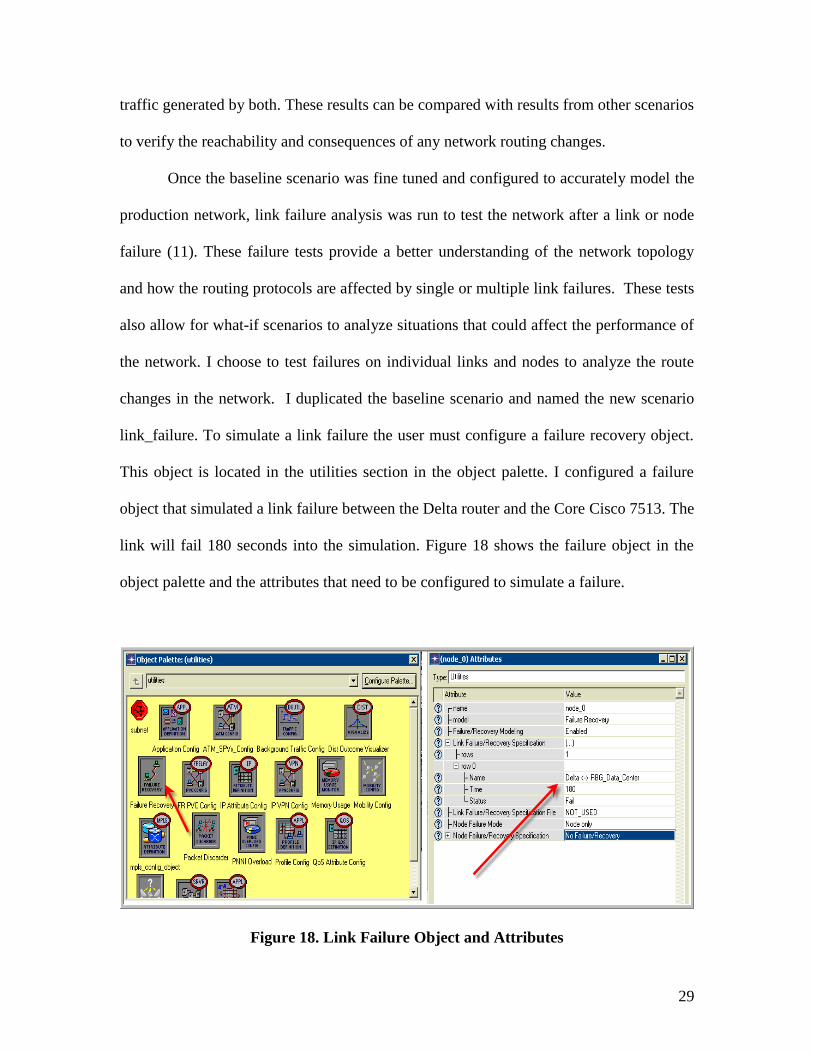
link_failure. To simulate a link failure the user must configure a failure recovery object.
This object is located in the utilities section in the object palette. I configured a failure
object that simulated a link failure between the Delta router and the Core Cisco 7513. The
link will fail 180 seconds into the simulation. Figure 18 shows the failure object in the
object palette and the attributes that need to be configured to simulate a failure.
Figure 18. Link Failure Object and Attributes
30
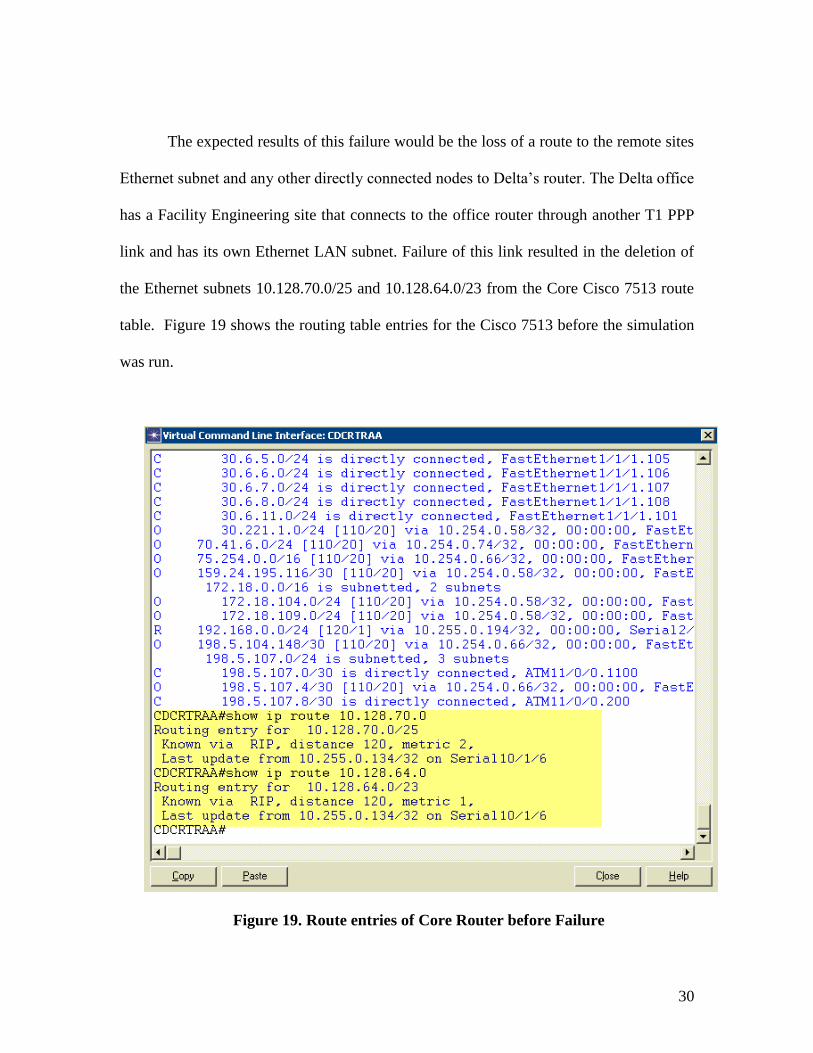
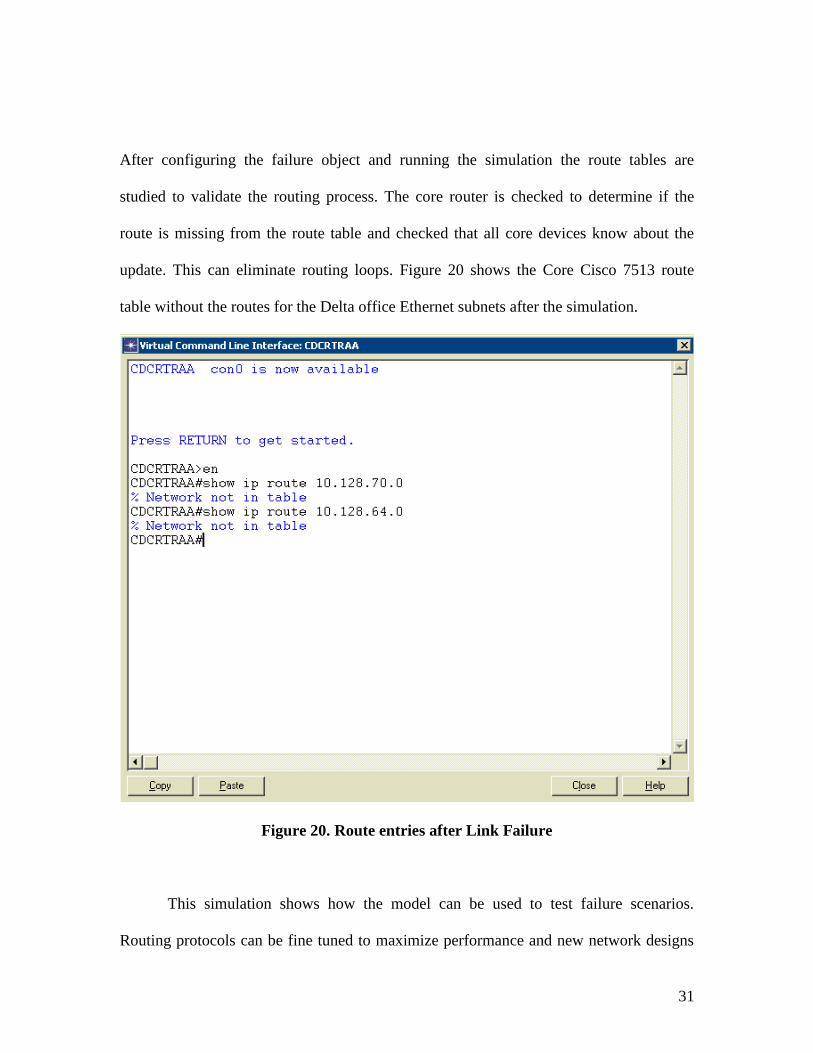
The expected results of this failure would be the loss of a route to the remote sites
Ethernet subnet and any other directly connected nodes to Delta’s router. The Delta office
has a Facility Engineering site that connects to the office router through another T1 PPP
link and has its own Ethernet LAN subnet. Failure of this link resulted in the deletion of
the Ethernet subnets 10.128.70.0/25 and 10.128.64.0/23 from the Core Cisco 7513 route
table. Figure 19 shows the routing table entries for the Cisco 7513 before the simulation
was run.
Figure 19. Route entries of Core Router before Failure
31
After configuring the failure object and running the simulation the route tables are
studied to validate the routing process. The core router is checked to determine if the
route is missing from the route table and checked that all core devices know about the
update. This can eliminate routing loops. Figure 20 shows the Core Cisco 7513 route
table without the routes for the Delta office Ethernet subnets after the simulation.
Figure 20. Route entries after Link Failure
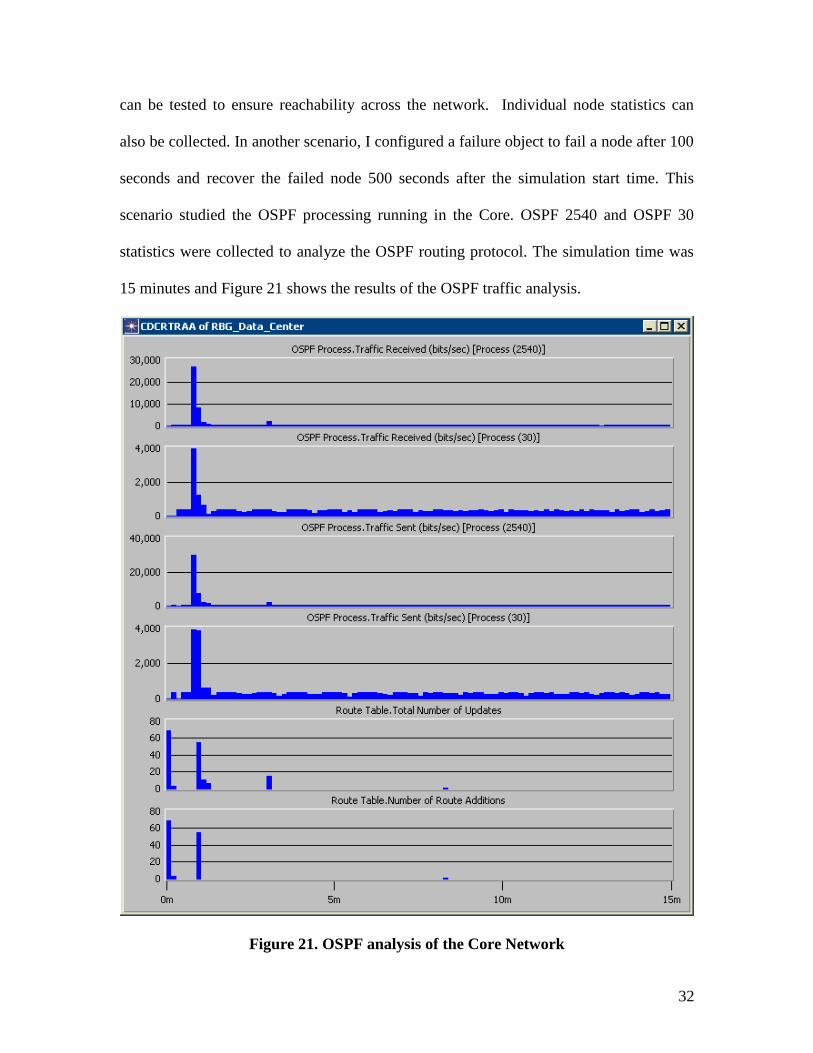
This simulation shows how the model can be used to test failure scenarios.
Routing protocols can be fine tuned to maximize performance and new network designs
32
can be tested to ensure reachability across the network. Individual node statistics can
also be collected. In another scenario, I configured a failure object to fail a node after 100
seconds and recover the failed node 500 seconds after the simulation start time. This
scenario studied the OSPF processing running in the Core. OSPF 2540 and OSPF 30
statistics were collected to analyze the OSPF routing protocol. The simulation time was
15 minutes and Figure 21 shows the results of the OSPF traffic analysis.
Figure 21. OSPF analysis of the Core Network
33
The generated graphs allow for the study of the amount of traffic OSPF generates and
how it affects the network. You can also see that the route table had an update and an
addition at the eight minute mark showing were the link recovered and advertised the
route and the Core devices inserted them into their route tables thus restoring reachability
to the down site. This type of analysis can be useful in testing disaster recover (DR)
abilities as well as the ability of the network to handle link failures. The analysis also
allows for the building of redundant networks.
Due to the complex network and routing configurations of the RBG network it is
difficult to get the big picture of reachability across the network. The inability to reach a
particular network is a common problem that network engineers face. The models created
in OPNET allow sections of the network to be studied and analyzed for incorrect routing
policies. The models give network engineers a tool that will solve issues related to
routing like:
Visualize routing domains
Examine routing tables on routers
Locate routing protocol configuration errors
Analyze network-wide reachability
Analyze convergence times
5.4 Edge Model Design
The current edge routing protocol used by RBG at the edge remote sites is RIPv2.
Due to the rapid growth and expansion of today’s networks RIP has been pushed to its
34
limits. RIP has the limitation of hop count and slow convergence, which are essential in
today’s large networks. OSPF addresses most of the issues associated with RIP:
With OSPF, there is no limitation on the hop count
The intelligent use of Variable Length Subnet Mask (VLSM) is very useful in IP
address allocation.
OSPF uses IP multicast to send link-state updates. This ensures less processing on
routers that are not listening to OSPF packets. Also, updates are only sent in case
routing changes occur instead of periodically. This ensures a better use of
bandwidth.
OSPF has better convergence than RIP. This is because routing changes are
propagated instantaneously and not periodically.
OSPF allows for better load balancing.
OSPF allows for a logical definition of networks where routers can be divided
into areas. This will limit the explosion of link state updates over the whole
network. This also provides a mechanism for aggregating routes and cutting down
on the unnecessary propagation of subnet information.
OSPF is a link-state protocol. We could think of a link as being an interface on the
router. The state of the link is a description of that interface and of its relationship to its
neighboring routers. A description of the interface would include, for example, the IP
address of the interface, the mask, the type of network it is connected to, the routers
connected to that network and so on. The collection of all these link-states would form a
link-state database.
35
OSPF uses a link-state algorithm in order to build and calculate the shortest path to all
known destinations. The algorithm by itself is quite complicated. The following is a very
high level, simplified way of looking at the various steps of the algorithm:
1. Upon initialization or due to any change in routing information, a router will
generate a link-state advertisement. This advertisement will represent the
collection of all link-states on that router.
2. All routers will exchange link-states by means of flooding. Each router that
receives a link-state update should store a copy in its link-state database and
then propagate the update to other routers.
3. After the database of each router is completed, the router will calculate a
Shortest Path Tree to all destinations. The router uses the Dijkstra algorithm to
calculate the shortest path tree. The destinations, the associated cost and the
next hop to reach those destinations will form the IP routing table.
4. In case no changes in the OSPF network occur, such as cost of a link or a
network being added or deleted, OSPF should be very quiet. Any changes that
occur are communicated via link-state packets, and the Dijkstra algorithm is
recalculated to find the shortest path.
OSPF is the current internal routing protocol used in the core infrastructure of
RBG. RBG has faced challenges due to the inefficiencies of the RIP protocol and has
decided to convert the remote edge locations to OSPF. RIP converges slower than OSPF.
In RBG’s network convergence gets to be in the order of minutes. RIP routers will go
through a period of hold-down and garbage collection and will slowly time-out
36
information that has not been received recently. This is inappropriate in RBG’s large
environment and has caused routing inconsistencies. Moving to a new OSPF edge design
will allow for faster convergence and help maintain the supportability of the remote site
networks. In order to compare the current RIP design with the new OSPF design the
Edge_WAN scenario was duplicated and the configuration was modified to reflect the
new OSPF configuration. Based on the current OSPF area design in the core it was
determined that the remote sites locations would be placed into individual areas. OSPF
has special restrictions when multiple areas are involved. If more than one area is
configured, one of these areas has to be area 0. This is called the backbone. The core
6509 switches at the data center are in area 0. I moved the Cisco 7500 routers into Area 0
so that each remote site area would touch area 0. When designing networks it is good
practice to start with area 0 and then expand into other areas later on. The backbone has
to be at the center of all other areas, i.e. all areas have to be physically connected to the
backbone. The reasoning behind this is that OSPF expects all areas to inject routing
information into the backbone and in turn the backbone will disseminate that information
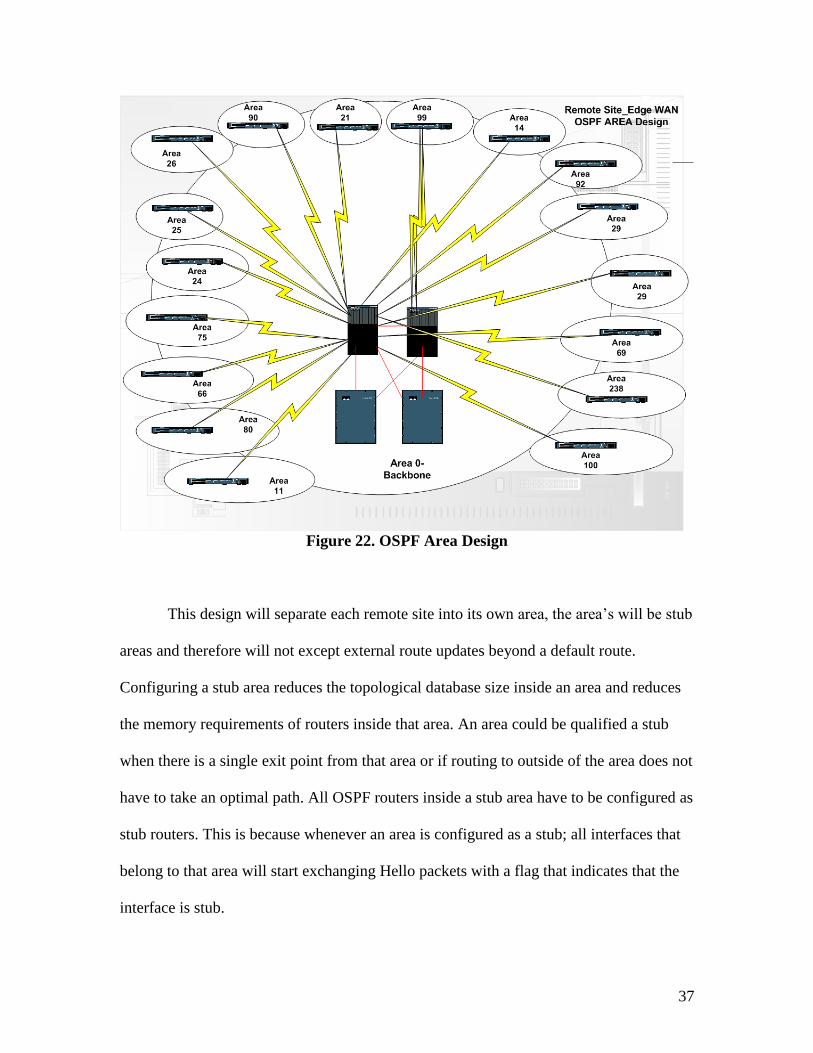
into other areas. Figure 22 on the next page shows a high level overview of the OSPF
area design. Each remote site location’s router configuration had to be modified for the
OSPF protocol change.
37
Figure 22. OSPF Area Design
This design will separate each remote site into its own area, the area’s will be stub
areas and therefore will not except external route updates beyond a default route.
Configuring a stub area reduces the topological database size inside an area and reduces
the memory requirements of routers inside that area. An area could be qualified a stub
when there is a single exit point from that area or if routing to outside of the area does not
have to take an optimal path. All OSPF routers inside a stub area have to be configured as
stub routers. This is because whenever an area is configured as a stub; all interfaces that
belong to that area will start exchanging Hello packets with a flag that indicates that the
interface is stub.
38
5.4.1 Enabling OPSF on the Remote Routers
Enabling OSPF on the router involves the following two steps in configuration
mode:
1. Enabling an OSPF process using the router ospf <process-id> command.
2. Assigning areas to the interfaces using the network <network or IP
address> <mask> <area-id> command.
The OSPF process-id is a numeric value local to the router. It does not have to match
process-ids on other routers. For each of the remote sites the OSPF process-id will be 1
and the area will be 1. Each remote site will advertise a different network. The network
command is a way of assigning an interface to a certain area. The mask is used as a
shortcut and it helps putting a list of interfaces in the same area with one line
configuration line. The mask contains wild card bits where 0 is a match and 1 is a "do not
care" bit, e.g. 0.0.255.255 indicates a match in the first two bytes of the network number.
The area-id is the area number we want the interface to be in. The area-id can be an
integer between 0 and 4294967295 or can take a form similar to an IP address A.B.C.D.
Each remote site was configured to be part of area 0.0.0.1. Each OSPF process was also
given a distribute-list so that only the external route injected into the route table would be
the default route of 0.0.0.0/0. The distribute-list will allow the 0.0.0.0/0 network but deny
any other updates from coming in. This helps keep the route tables small and manageable
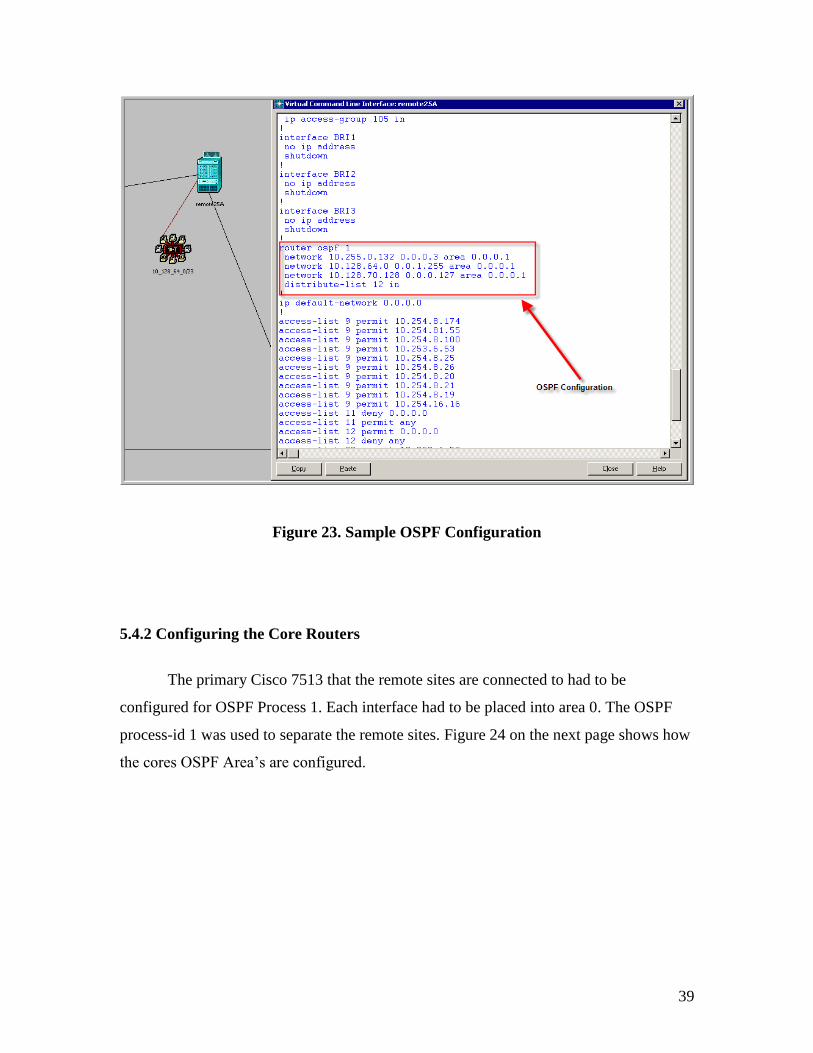
at the remote site locations. Figure 23 on the next page shows a sample configuration of a
remote site router’s OSPF code.
39
Figure 23. Sample OSPF Configuration
5.4.2 Configuring the Core Routers
The primary Cisco 7513 that the remote sites are connected to had to be
configured for OSPF Process 1. Each interface had to be placed into area 0. The OSPF
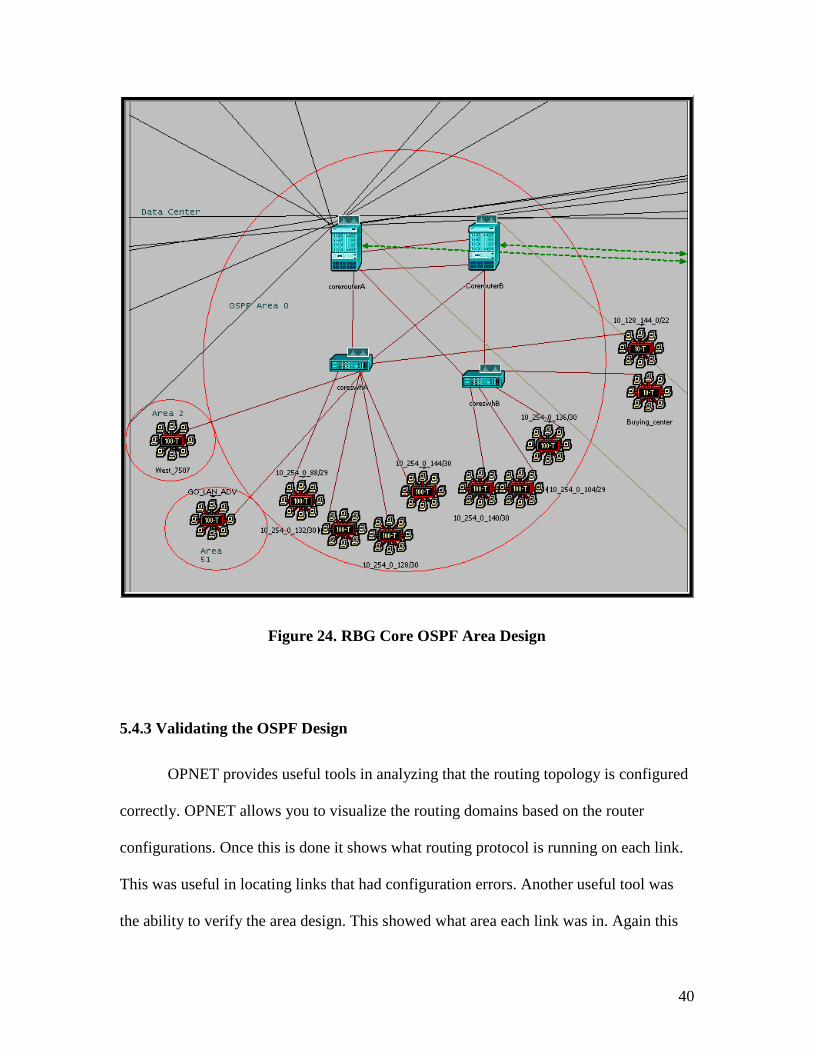
process-id 1 was used to separate the remote sites. Figure 24 on the next page shows how
the cores OSPF Area’s are configured.
40
Figure 24. RBG Core OSPF Area Design
5.4.3 Validating the OSPF Design
OPNET provides useful tools in analyzing that the routing topology is configured
correctly. OPNET allows you to visualize the routing domains based on the router
configurations. Once this is done it shows what routing protocol is running on each link.
This was useful in locating links that had configuration errors. Another useful tool was
the ability to verify the area design. This showed what area each link was in. Again this
41
provides a way to validate the OPSF area configuration and locate issues quickly. After
the configuration is validated a simulation was run to check that the routing updates and
router tables would be updated properly. The simulation covered 10 minutes of real time.
This gives the network time to converge and all route tables are updated. After
completion of the simulation the route tables were studied and reachability analysis was
conducted. I checked that the core received an OPSF update for each of the remote site
Ethernet networks. I also verified that the routes were coming from the correct serial
interface. This is important to make sure that an incorrect network is not being advertised
from an unexpected location. Next the core switches were verified that an OSPF update
was received that each remote site was accessible from the core switches. The route was
analyzed to verify how each network was known and the path taken studied. OPENT also
gives you the ability to measure statistics about the routing design. The three main
categories for analysis are: Global Stats, Node Stats, and Link Stats. The global statistics
that were analyzed included IP network convergence activity and duration, OSPF
convergence activity, duration and traffic sent. These calculations are for all nodes that
are running IP traffic. The node statistics represent individual router and switch traffic.
The OSPF traffic sent and received, OSPF process traffic sent and received, and route
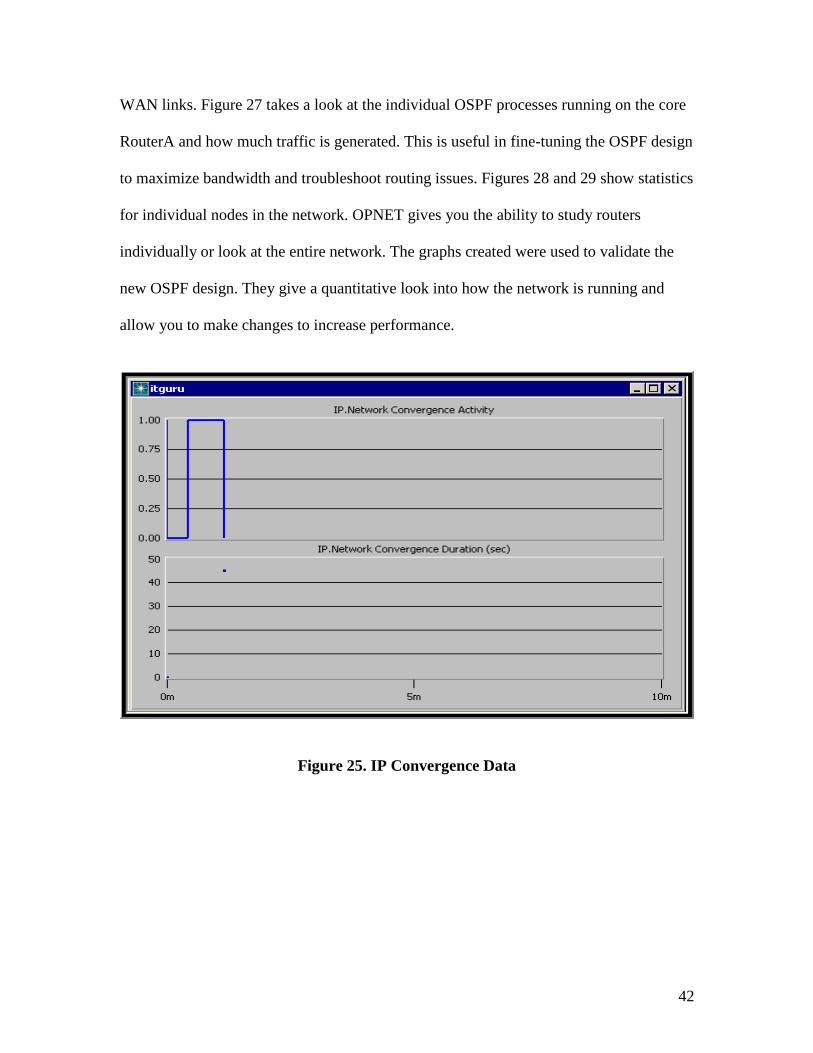
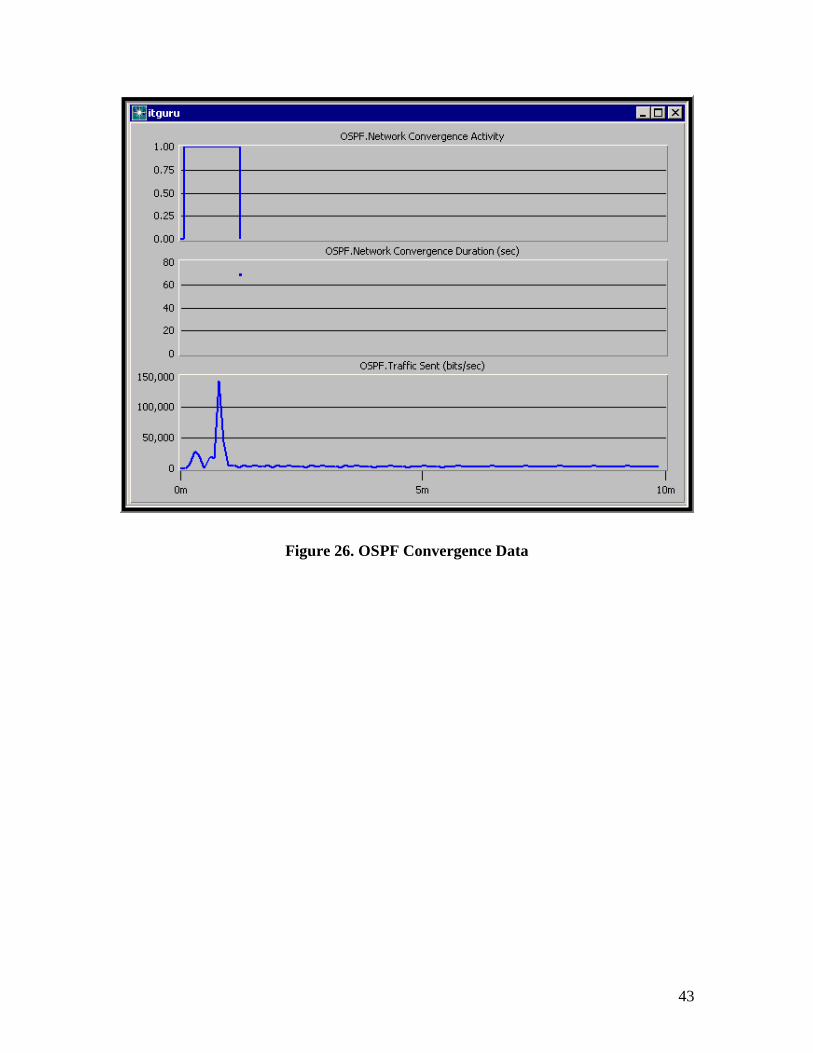
table size and total number of updates were studied. Figures 25-29 on the next page are
the results from the simulation run on the new OSPF design. Figure 25 represents the
convergence activity and duration for the entire network. OSPF allows for the network to
convergence quickly on the topology. Figure 26 shows convergence activity, duration
and traffic sent for OSPF only. Again the convergence time is quick and the amount of
traffic is sent only during the beginning of the simulation saving bandwidth over the
42
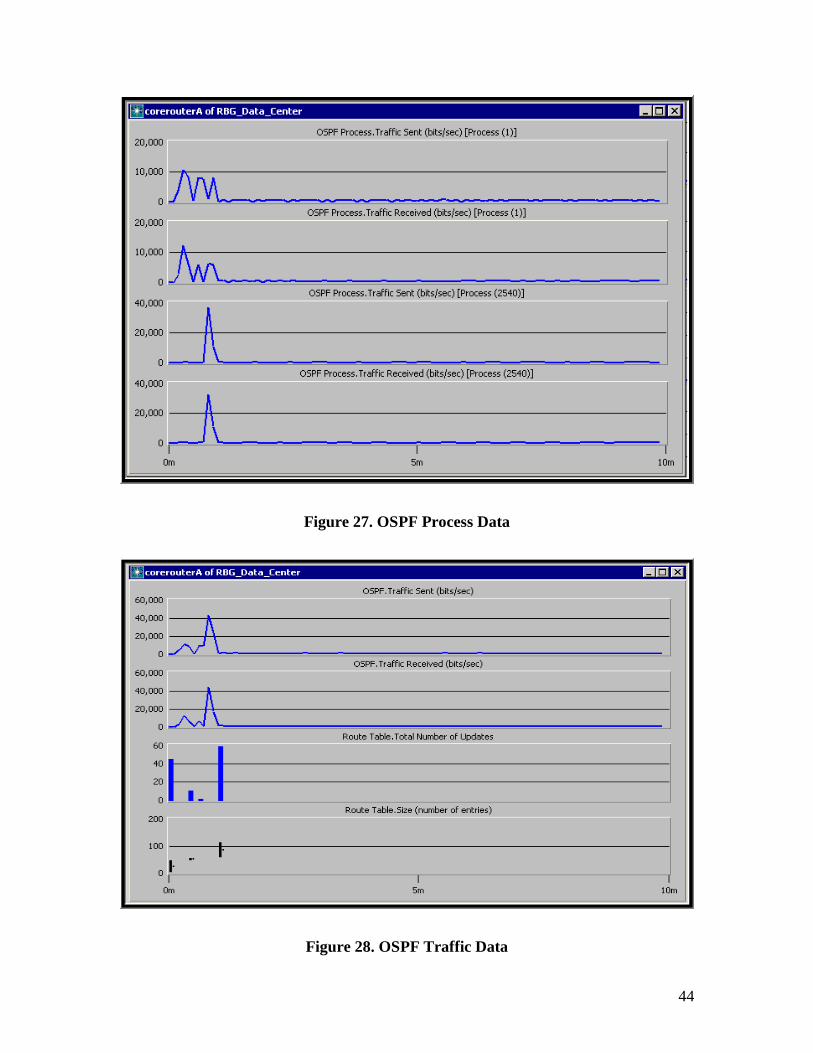
WAN links. Figure 27 takes a look at the individual OSPF processes running on the core
RouterA and how much traffic is generated. This is useful in fine-tuning the OSPF design
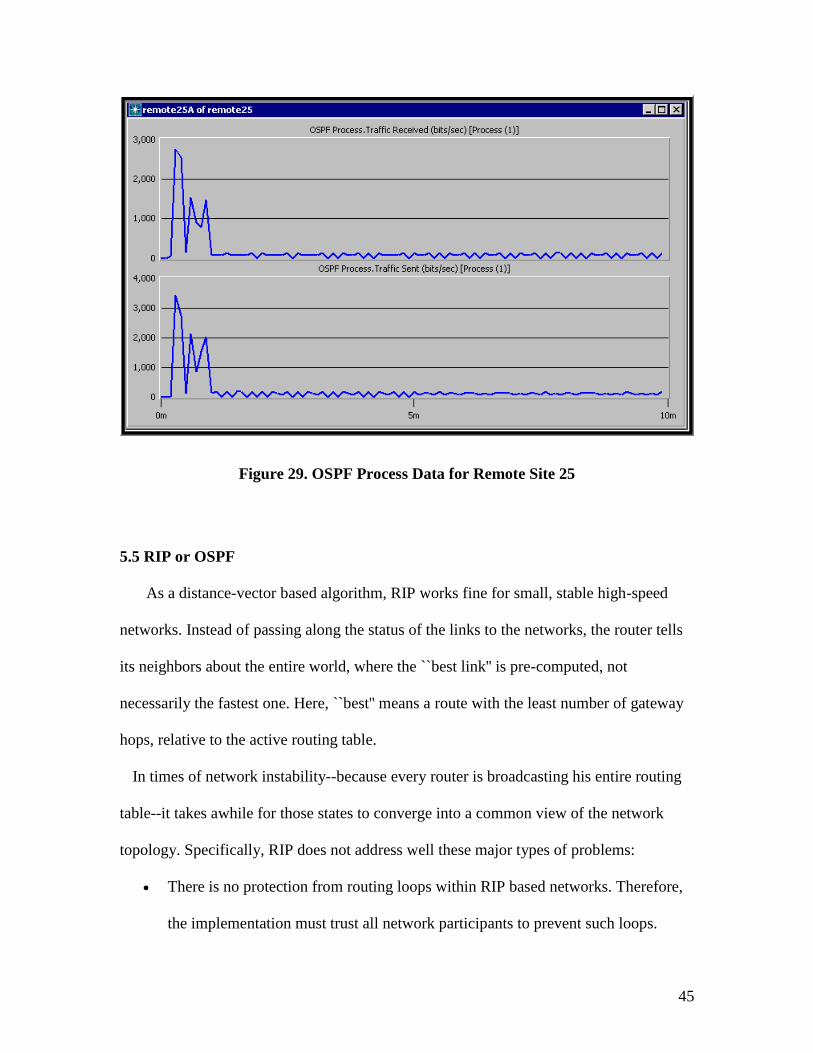
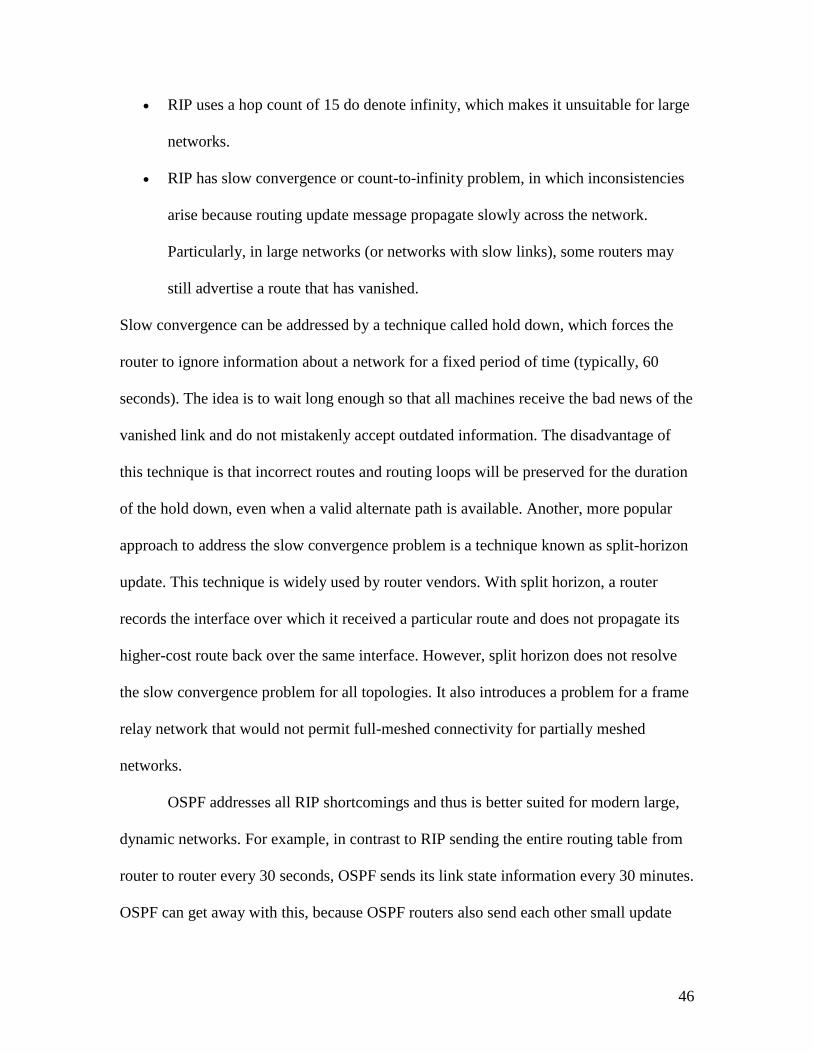
to maximize bandwidth and troubleshoot routing issues. Figures 28 and 29 show statistics
for individual nodes in the network. OPNET gives you the ability to study routers
individually or look at the entire network. The graphs created were used to validate the
new OSPF design. They give a quantitative look into how the network is running and
allow you to make changes to increase performance.
Figure 25. IP Convergence Data
43
Figure 26. OSPF Convergence Data
44
Figure 27. OSPF Process Data
Figure 28. OSPF Traffic Data
45
Figure 29. OSPF Process Data for Remote Site 25
5.5 RIP or OSPF
As a distance-vector based algorithm, RIP works fine for small, stable high-speed
networks. Instead of passing along the status of the links to the networks, the router tells
its neighbors about the entire world, where the ``best link'' is pre-computed, not
necessarily the fastest one. Here, ``best'' means a route with the least number of gateway
hops, relative to the active routing table.
In times of network instability--because every router is broadcasting his entire routing
table--it takes awhile for those states to converge into a common view of the network
topology. Specifically, RIP does not address well these major types of problems:
There is no protection from routing loops within RIP based networks. Therefore,
the implementation must trust all network participants to prevent such loops.
46
RIP uses a hop count of 15 do denote infinity, which makes it unsuitable for large
networks.
RIP has slow convergence or count-to-infinity problem, in which inconsistencies
arise because routing update message propagate slowly across the network.
Particularly, in large networks (or networks with slow links), some routers may
still advertise a route that has vanished.
Slow convergence can be addressed by a technique called hold down, which forces the
router to ignore information about a network for a fixed period of time (typically, 60
seconds). The idea is to wait long enough so that all machines receive the bad news of the
vanished link and do not mistakenly accept outdated information. The disadvantage of
this technique is that incorrect routes and routing loops will be preserved for the duration
of the hold down, even when a valid alternate path is available. Another, more popular
approach to address the slow convergence problem is a technique known as split-horizon
update. This technique is widely used by router vendors. With split horizon, a router
records the interface over which it received a particular route and does not propagate its
higher-cost route back over the same interface. However, split horizon does not resolve
the slow convergence problem for all topologies. It also introduces a problem for a frame
relay network that would not permit full-meshed connectivity for partially meshed
networks.
OSPF addresses all RIP shortcomings and thus is better suited for modern large,
dynamic networks. For example, in contrast to RIP sending the entire routing table from
router to router every 30 seconds, OSPF sends its link state information every 30 minutes.
OSPF can get away with this, because OSPF routers also send each other small update
47
messages (typically less than 75 bytes), whenever they detect a change in the network
(for instance, a failure or a new link). When routers exchange updates that reflect changes
in the network, they ``"converge'' on a new representation of the topology quickly and
accurately. In very large OSPF networks, topology convergence can be delayed, while
routers exchange link-state messages, update databases, and recalculate routes.
This delay in network convergence is the natural effect of very large topologies, and it
will occur with any router protocol. Fortunately, OSPF was designed and implemented in
a much better way than RIP to address this issue by what's known as the OSPF area.
OSPF areas are simply logical subdivisions of an OSPF network. The RBG enterprise
was divided into areas that correspond to buildings. An enterprise can have a practically
unlimited number of areas. OSPF routers within one area do not exchange topology
updates with the routers in the other areas. When a LAN or WAN link is added to one
area, topology updates flow only to routers within that area. This reduces the number of
updates that flow through the network and the size of the topology databases in each
router.
In many places, RIP is still used in the RBG network. The store network has not
been upgraded to OSPF. OSPF addresses all the deficiencies of RIP, without affecting
connectivity to RIP based networks. Fast growing networks must be designed properly if
the capabilities of OSPF are to be fully exploited. Because of its ability to handle variable
networking masks, OSPF also helps to reduce waste of today's precious IP addresses.
Moving to OSPF at the edge will provide a more consistent enterprise-wide IP address
assignment policy that lends itself to the creation of OSPF areas and address
summarization. OPNET IT Guru can assist with correct design and router tuning to allow
48
networks to scale to very large topologies, while maintaining high levels of availability
and performance. OPNET has also shown that moving to OSPF is the correct move for
the RBG network based on the route analysis, convergence times and the limitations of
the RIP protocol. This move will also eliminate RIP from the core network and maintain
the supportability of the network. By modeling the design and simulating real time you
can discover problems and fine-tune the design before implementation.
5.6 Store Network IP Re-Design
The store network is currently using the unused IP address range of 30.0.0.0/8.
This IP address range is currently not being routed over the Internet. However, due to the
growth of the Internet and the escalating demand for public IP addresses, it is possible
that this address space will be released for public use and assigned to other organizations.
The impact to the RBG Internet communications could be significant. If these locations
are not readdressed, RBG will experience problems with Internet communications when
the affected addresses are publicly deployed. The problems could begin as the inability to
communicate with a few outside companies and quickly escalate to full Internet outages
that last several days. The interruption of these services could seriously interfere with the
functioning of key Internet applications. Problems will also create overwhelming support
and administration cost. In order to eliminate these potential problems with Internet
services, a new IP address scheme was created take advantage of the private IP address
range in the 10.0.0.0/8. RBG currently uses this private IP address scheme in other areas
of the network and has assigned a range in the private 10 subnet to be used for the store
network. The network will be divided into four subnets per store using the 10.145.0.0-
49
10.239.0.0 ranges. Using a class C subnet will allow for over 16,000 subnets with 254
hosts/subnet. This number of subnets is more than enough to support the 2514 store sites
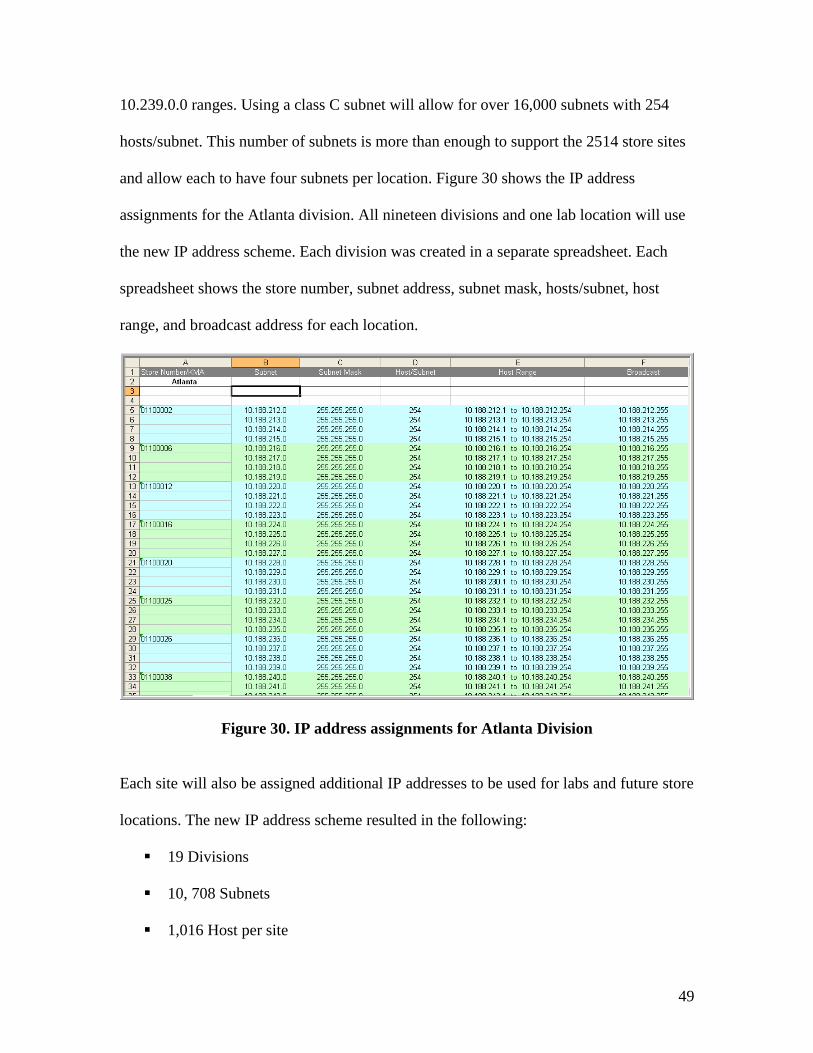
and allow each to have four subnets per location. Figure 30 shows the IP address
assignments for the Atlanta division. All nineteen divisions and one lab location will use
the new IP address scheme. Each division was created in a separate spreadsheet. Each
spreadsheet shows the store number, subnet address, subnet mask, hosts/subnet, host
range, and broadcast address for each location.
Figure 30. IP address assignments for Atlanta Division
Each site will also be assigned additional IP addresses to be used for labs and future store
locations. The new IP address scheme resulted in the following:
19 Divisions
10, 708 Subnets
1,016 Host per site
50
Due to various other projects that are ongoing, there is no current timeframe for
implementation of this new IP address scheme. Once the approval has been given to
proceed with this project, a piloting phase will begin. The pilot phase will consist of a
few stores from each division being converted to the new IP address scheme and studied
for any problems that occur from the change. These changes to the IP address scheme
will involve core DNS changes, remote site DNS changes, applications will need to be
verified for connectivity, and firewall changes. Many other business units will be
involved to validate the IP address change is successful at those pilot locations. Once all
issues are worked out with the test sites, a rollout schedule will be created to move all
stores to the new IP address scheme.
6. Testing Procedures
The accuracy of the models was the most crucial process in creating useful
scenarios to gather results for analysis of the network. Testing became a larger part of the
entire process of building the model. The production network was studied before any
modeling started. Data about which routers were going to be used were collected and
CiscoWorks was checked to make sure that the configuration file was available. After
each import of a Cisco configuration file, that router was studied for any changes in the
production network. Once the router was imported into the model the VCLI was used to
run the command ―show run,‖ which shows the running configuration of the router. This
same step was performed on the live production network. Each router configuration file
was compared to the live production network to ensure that the imported configuration
51
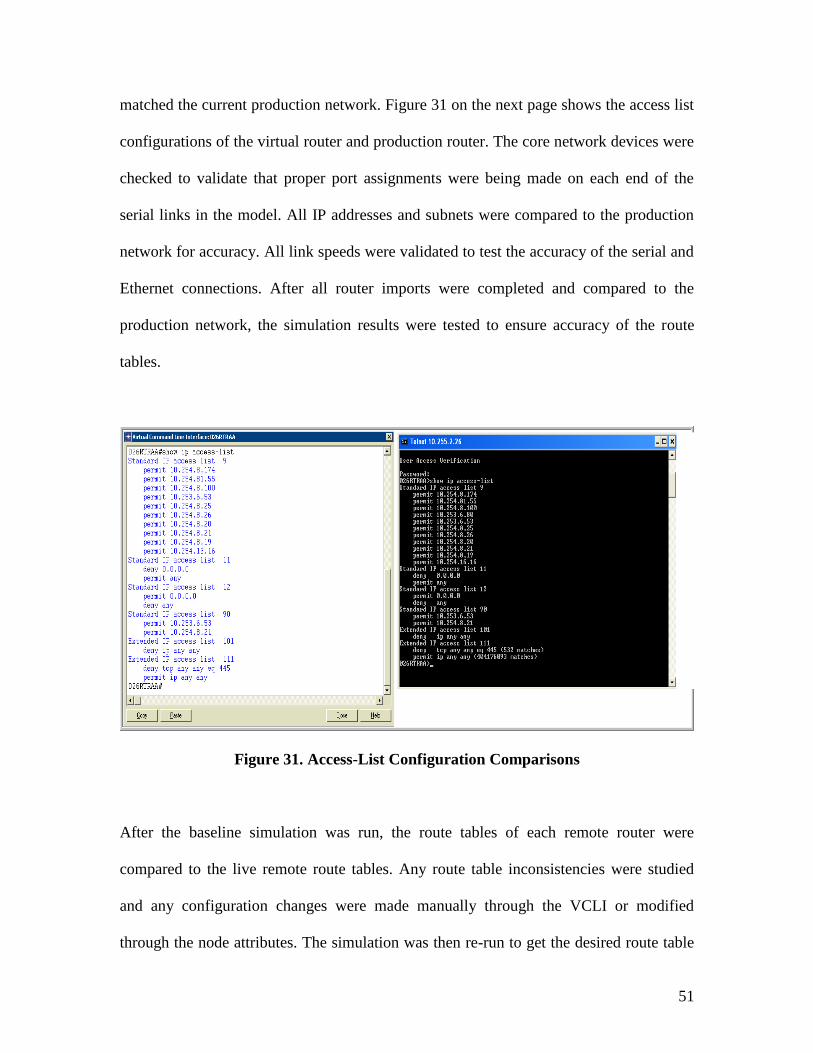
matched the current production network. Figure 31 on the next page shows the access list
configurations of the virtual router and production router. The core network devices were
checked to validate that proper port assignments were being made on each end of the
serial links in the model. All IP addresses and subnets were compared to the production
network for accuracy. All link speeds were validated to test the accuracy of the serial and
Ethernet connections. After all router imports were completed and compared to the
production network, the simulation results were tested to ensure accuracy of the route
tables.
Figure 31. Access-List Configuration Comparisons
After the baseline simulation was run, the route tables of each remote router were
compared to the live remote route tables. Any route table inconsistencies were studied
and any configuration changes were made manually through the VCLI or modified
through the node attributes. The simulation was then re-run to get the desired route table
52
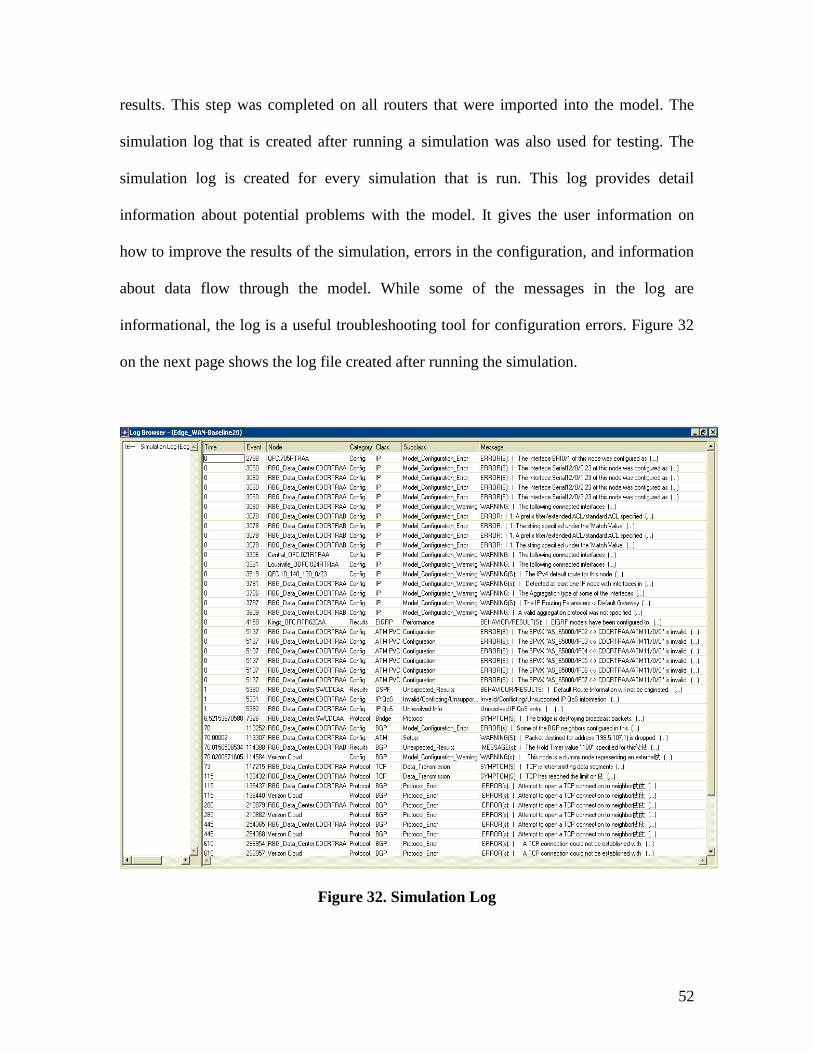
results. This step was completed on all routers that were imported into the model. The
simulation log that is created after running a simulation was also used for testing. The
simulation log is created for every simulation that is run. This log provides detail
information about potential problems with the model. It gives the user information on
how to improve the results of the simulation, errors in the configuration, and information
about data flow through the model. While some of the messages in the log are
informational, the log is a useful troubleshooting tool for configuration errors. Figure 32
on the next page shows the log file created after running the simulation.
Figure 32. Simulation Log
53
This type of testing was completed for each device that is imported into the model. Route
tables, router configurations, and interface information was compared and validated
against the live production network to ensure accuracy of the network model. OPNET
Guru also allows for web reports to be generated to study configurations and locate
problems.
Testing for the OSPF models consisted of meetings with a network engineer to
verify the configuration. These meetings were useful in fine-tuning the protocols. The
network engineer also made suggestions on the use of filters that help suppress route
updates that were not needed at the remote edge locations. Simulating network
processing over ten minutes tested the OSPF design. The route tables were analyzed,
OSPF redistribution information was studied and reachability analysis was completed to
make sure that the design worked as planned.
7. Conclusions and Recommendations
7.1 Conclusions
The key to network modeling is the ability to closely match the generated network
model map to the real network topology. OPNET allowed me to accurately model events
such as link failure, link change, device failure, route changes and anything else I could
throw at it. It let me implement changes on the fly. I could change factors such as Open
Shortest Path First (OSPF) link costs, and OSPF timers, and immediately see the impact
on the network. IT Guru took every configuration change I threw at it, and it accurately
predicted the behavior of routing protocol and topology changes. There seemed to be
nothing too complex or tricky for IT Guru. Changes in the models did require accuracy
54
on my part. If I misconfigured a particular setting IT Guru would not work correctly just
as it would not work in a real-world network. This feature was very impressive. The
models that I created were based on imported configuration files from the production
network; however there are multiple ways to handle the IT Guru configurations. For
example, it can use the optional VNE server, import text files from CiscoWorks or create
network objects manually. It also can query an HP OpenView server, which lets it build a
model of the production network that is automatic and up-to-date. The product is very
flexible and scalable, providing many customization features. The user interface offers
several options and templates that let users drag and drop several kinds of network
topologies. This creates a product that is sophisticated, powerful and complex. At times, I
found myself overwhelmed by its rich features and complexity.
7.2 Recommendations
IT Guru is extremely powerful and feature-rich tool. Users are expected to
possess both a thorough knowledge of networking and the product itself, giving it a high
learning curve. Network engineers looking for a sophisticated package that can model
almost any enterprise network would find IT Guru to their liking. IT Guru will help the
RBG network better manage and operate their network infrastructure. IT Guru will allow
efficient use of IT budgets by providing quantitative answers to performance questions,
IT Guru provides structured, repeatable diagnostic and validation functions that
accelerate problem resolution, thereby alleviating pressure on IT staff, IT Guru optimizes
application response times by pinpointing application bottlenecks and supporting smooth
55
application deployments, and using IT Guru, IT managers can simulate failures and
overload conditions, and increase visibility required to minimize these risks. OPNET also
offers some very useful modules that RBG could benefit from. Flow Analysis and
NetDoctor would provide RBG with a more complete tool that could analyze and
diagnose network issues. Although these modules are at an additional cost for RBG they
would enhance the current product. If RBG is going to implement and use OPNET they
will have to designate an individual to take on the responsibility of the product. Model
creation and maintaining the current models will require a high level of networking
knowledge. This individual will work with other business units to locate areas that the
product can be used. RBG should also work with OPNET to explore the possibilities of
finding a way to import their current network topology with the network management
tools they currently use. Formal training should also be considered for the network
management group and network engineers. IT Guru could also be used has a teaching
tool for network operations staff to help understand the network infrastructure and how it
is configured.
56
Appendix A.
Cisco Information
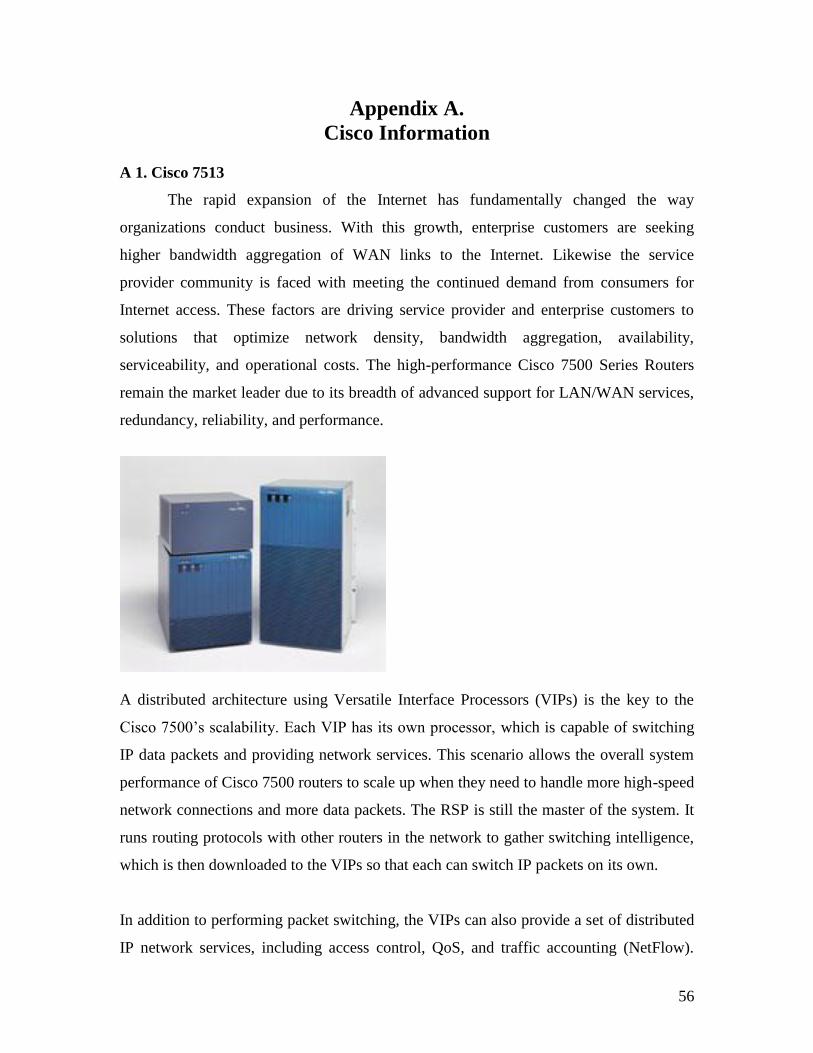
A 1. Cisco 7513
The rapid expansion of the Internet has fundamentally changed the way
organizations conduct business. With this growth, enterprise customers are seeking
higher bandwidth aggregation of WAN links to the Internet. Likewise the service
provider community is faced with meeting the continued demand from consumers for
Internet access. These factors are driving service provider and enterprise customers to
solutions that optimize network density, bandwidth aggregation, availability,
serviceability, and operational costs. The high-performance Cisco 7500 Series Routers
remain the market leader due to its breadth of advanced support for LAN/WAN services,
redundancy, reliability, and performance.
A distributed architecture using Versatile Interface Processors (VIPs) is the key to the
Cisco 7500’s scalability. Each VIP has its own processor, which is capable of switching
IP data packets and providing network services. This scenario allows the overall system
performance of Cisco 7500 routers to scale up when they need to handle more high-speed
network connections and more data packets. The RSP is still the master of the system. It
runs routing protocols with other routers in the network to gather switching intelligence,
which is then downloaded to the VIPs so that each can switch IP packets on its own.
In addition to performing packet switching, the VIPs can also provide a set of distributed
IP network services, including access control, QoS, and traffic accounting (NetFlow).
57
With the VIPs off-loading these IP switching and service functions from the RSP, the
RSP can devote all its CPU cycles to handle other essential tasks. VIP distributed
switching is the way to scale up system performance, and should be enabled where
possible, to significantly reduce CPU utilization on the RSP.
Since its launch, the Cisco 7500 Series router has seen huge improvements in
performance and its ability to scale. Alongside a widened number of interfaces (port
adapters) for both LAN and WAN connectivity, the latest high end RSP8 CPU, and VIP4
module mean that the platform continues to deliver market-leading performance.
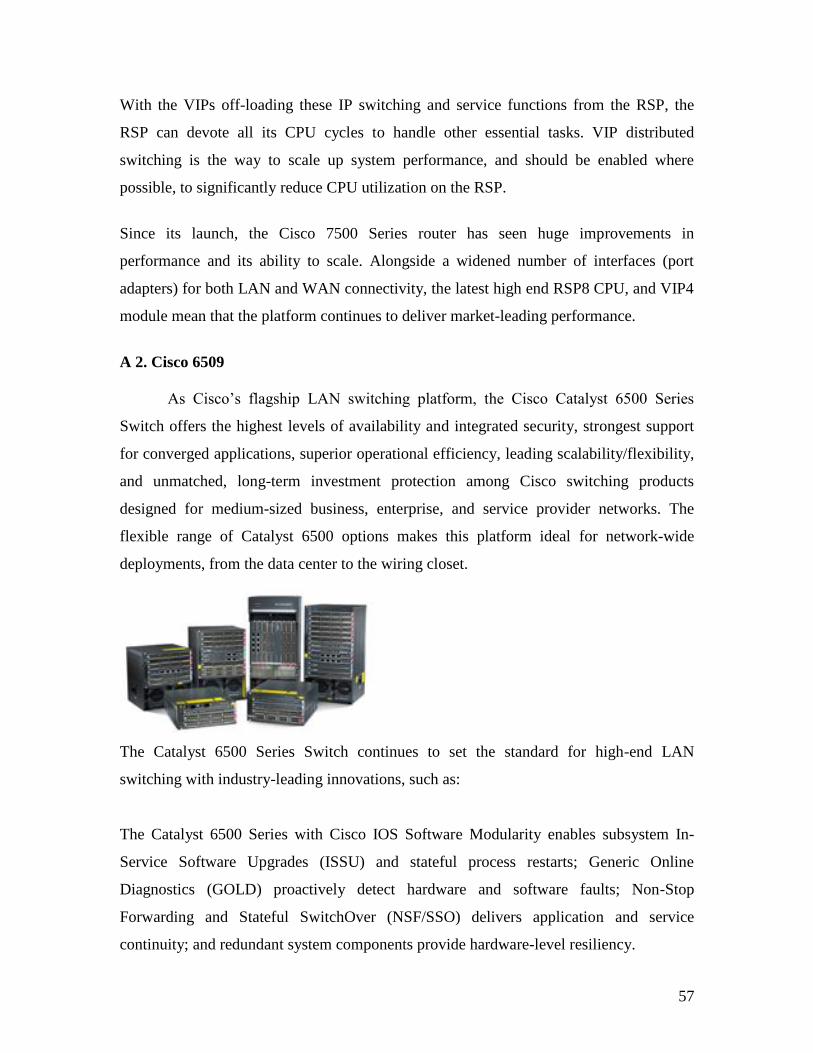
A 2. Cisco 6509
As Cisco’s flagship LAN switching platform, the Cisco Catalyst 6500 Series
Switch offers the highest levels of availability and integrated security, strongest support
for converged applications, superior operational efficiency, leading scalability/flexibility,
and unmatched, long-term investment protection among Cisco switching products
designed for medium-sized business, enterprise, and service provider networks. The
flexible range of Catalyst 6500 options makes this platform ideal for network-wide
deployments, from the data center to the wiring closet.
The Catalyst 6500 Series Switch continues to set the standard for high-end LAN
switching with industry-leading innovations, such as:
The Catalyst 6500 Series with Cisco IOS Software Modularity enables subsystem In-
Service Software Upgrades (ISSU) and stateful process restarts; Generic Online
Diagnostics (GOLD) proactively detect hardware and software faults; Non-Stop
Forwarding and Stateful SwitchOver (NSF/SSO) delivers application and service
continuity; and redundant system components provide hardware-level resiliency.
58
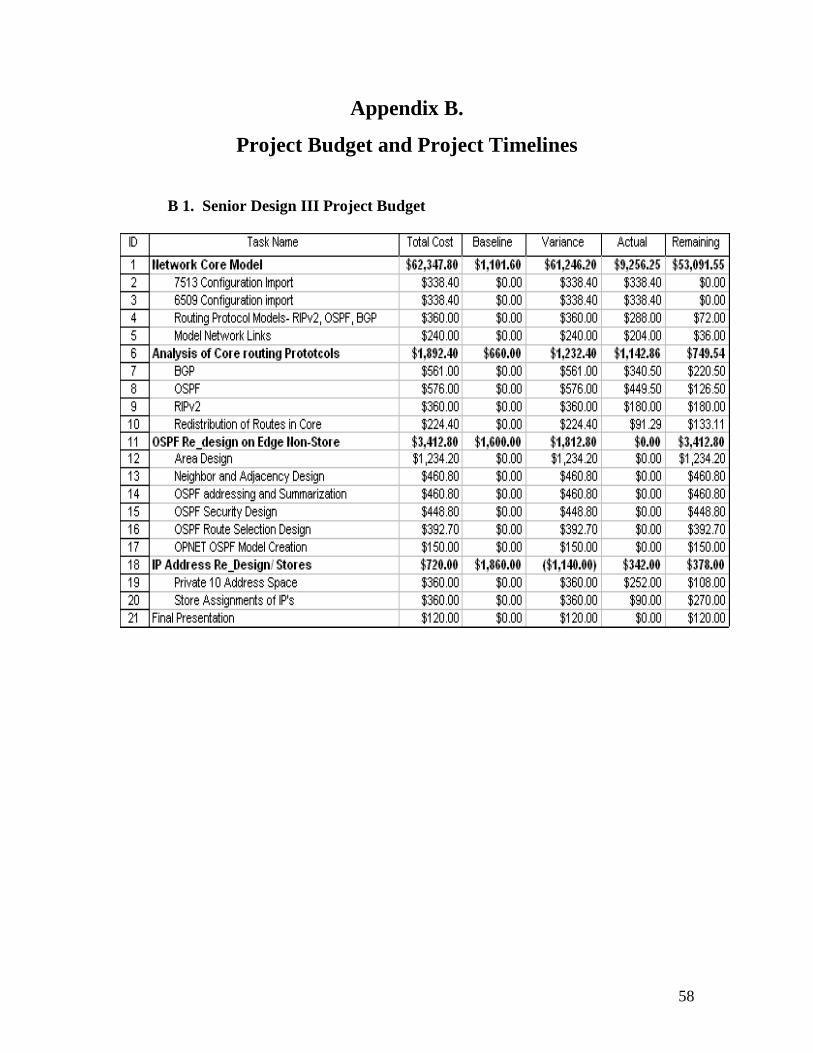
Appendix B.
Project Budget and Project Timelines
B 1. Senior Design III Project Budget
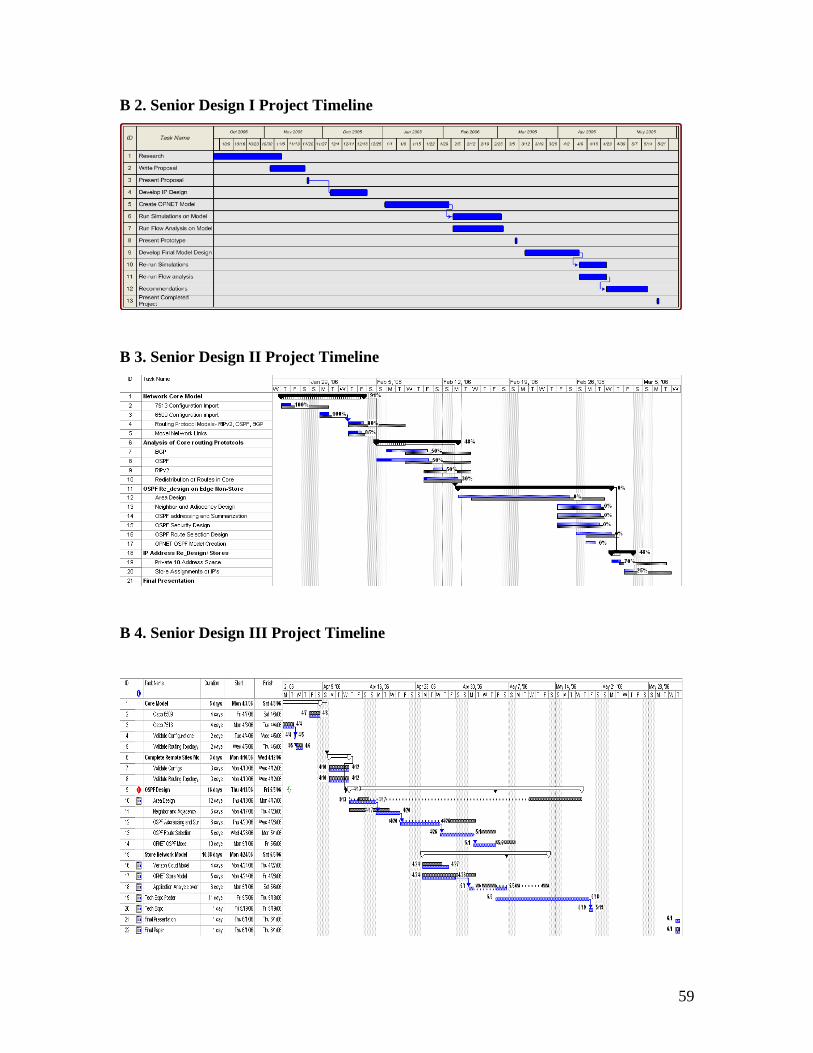
59
B 2. Senior Design I Project Timeline
B 3. Senior Design II Project Timeline
B 4. Senior Design III Project Timeline
60
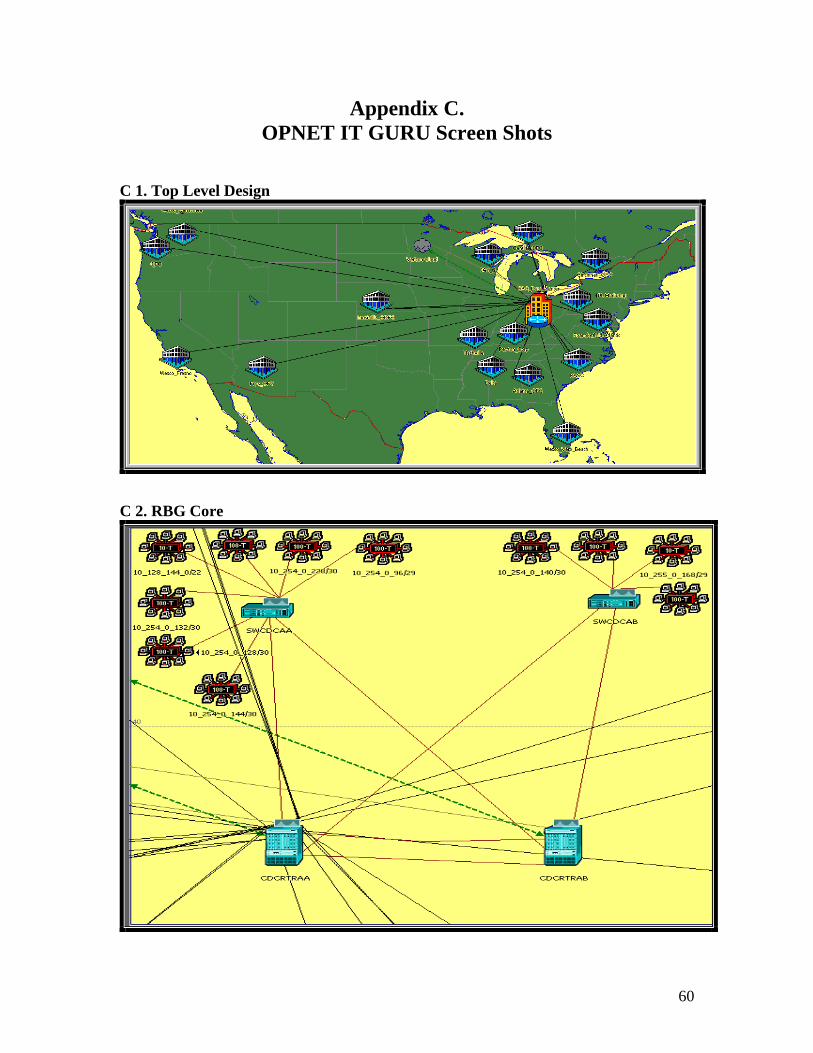
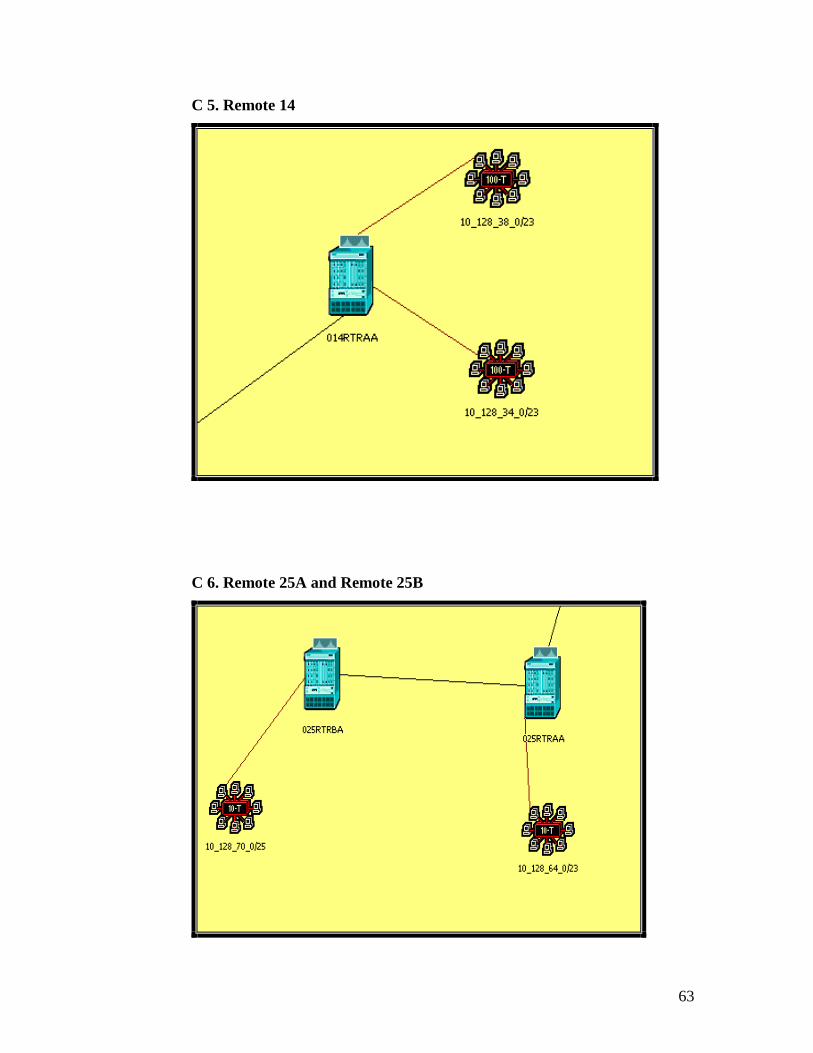
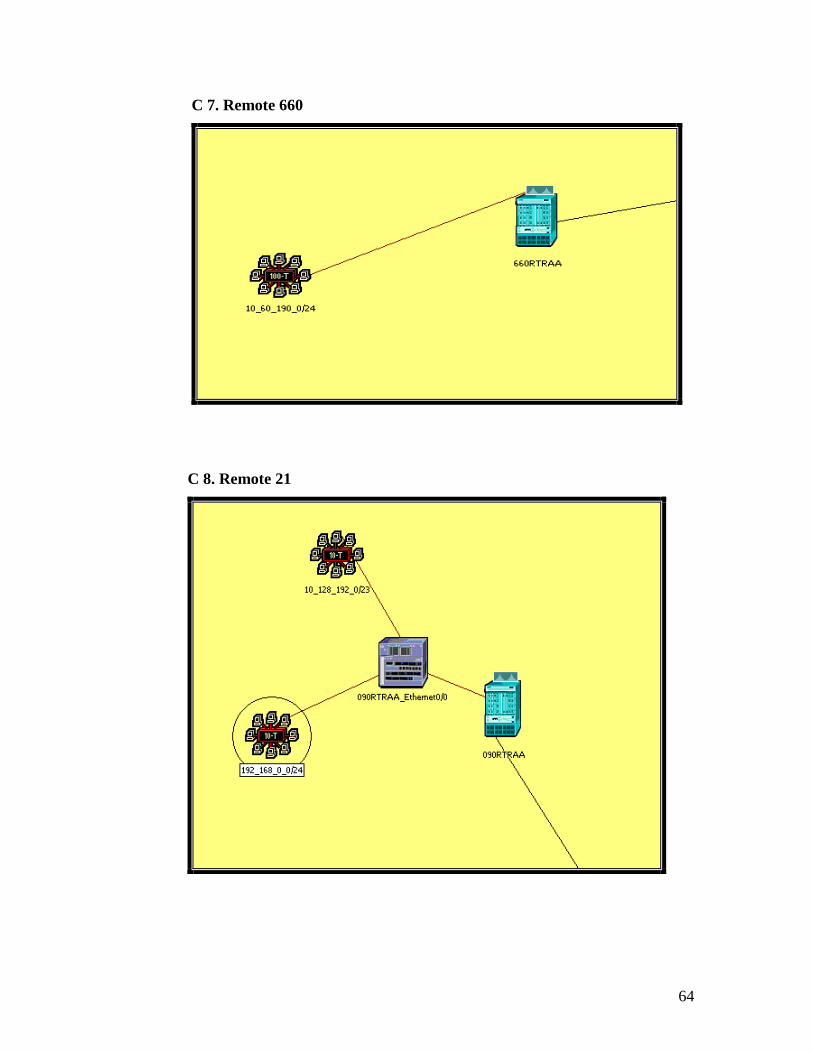
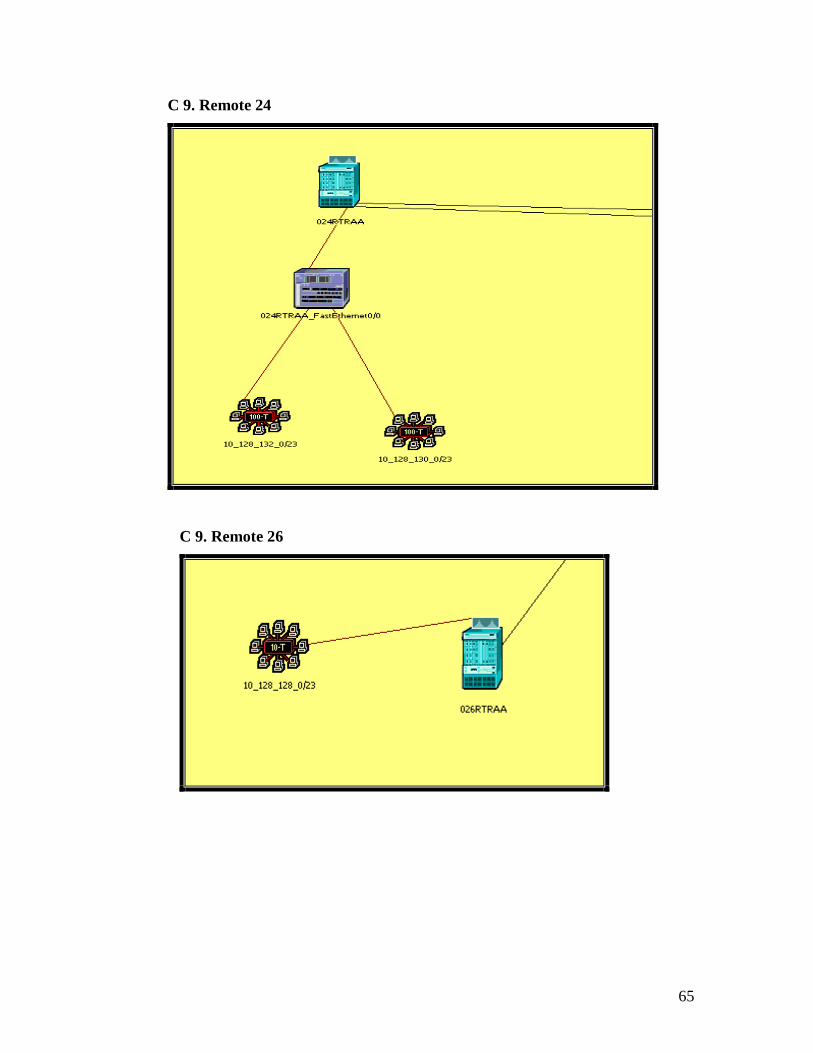
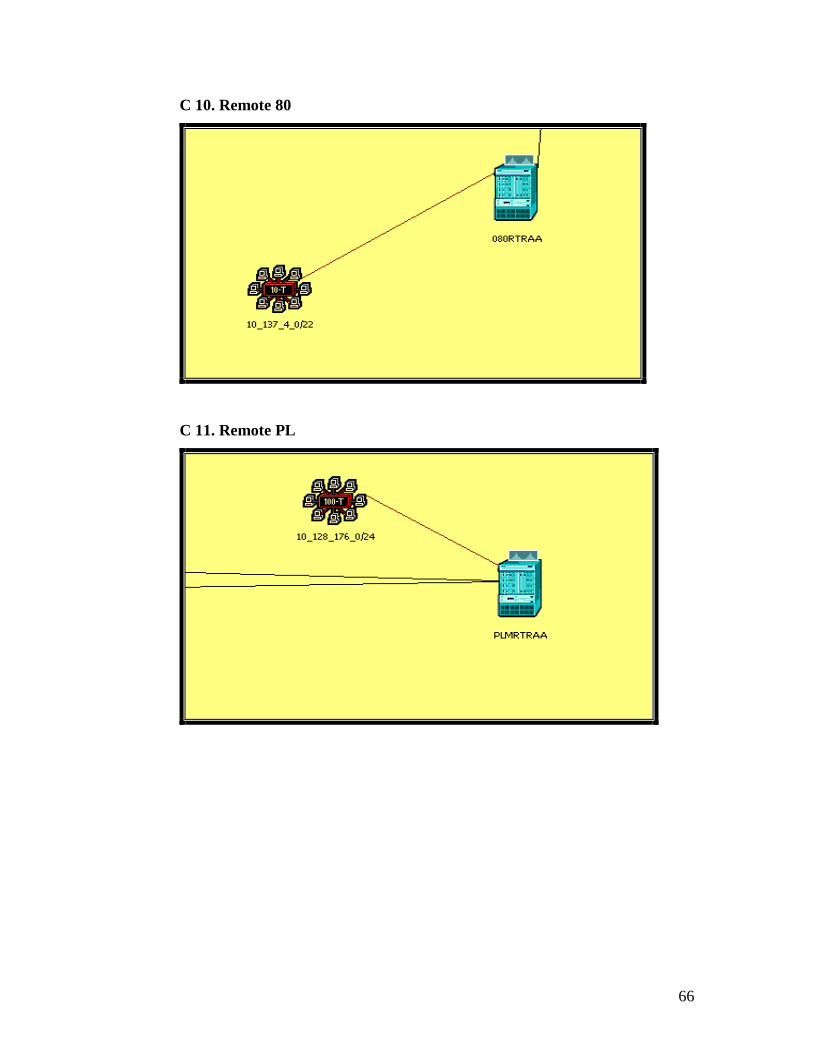
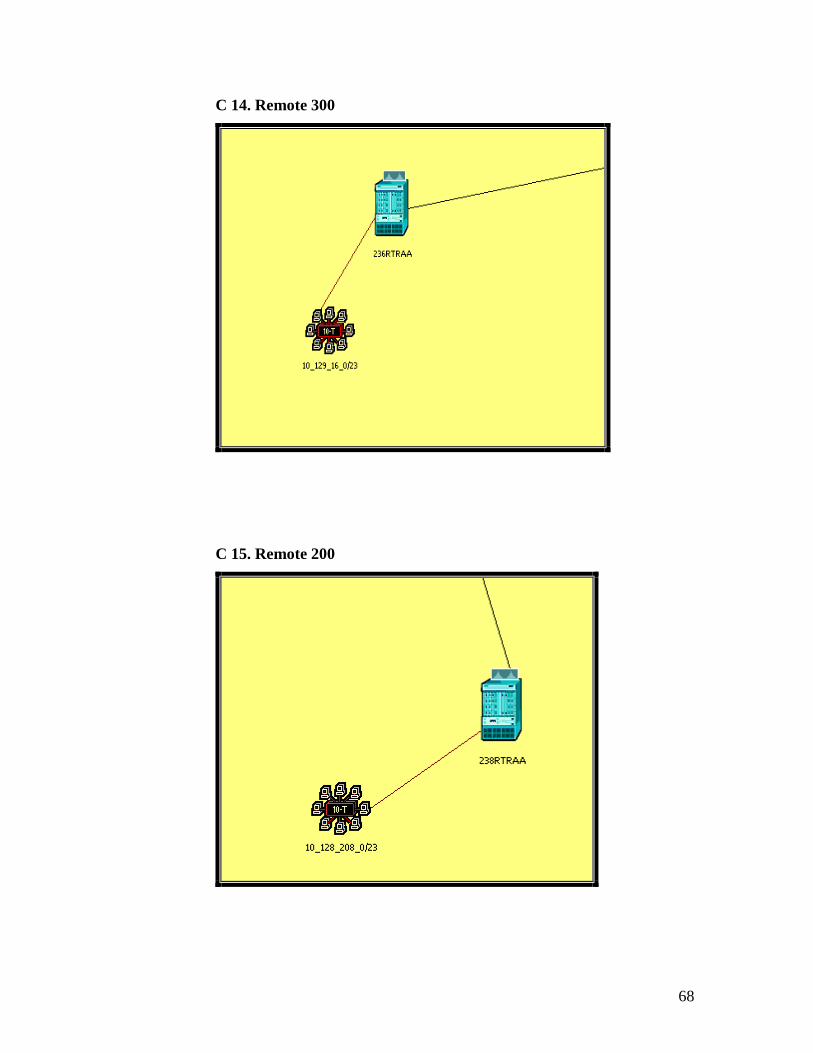
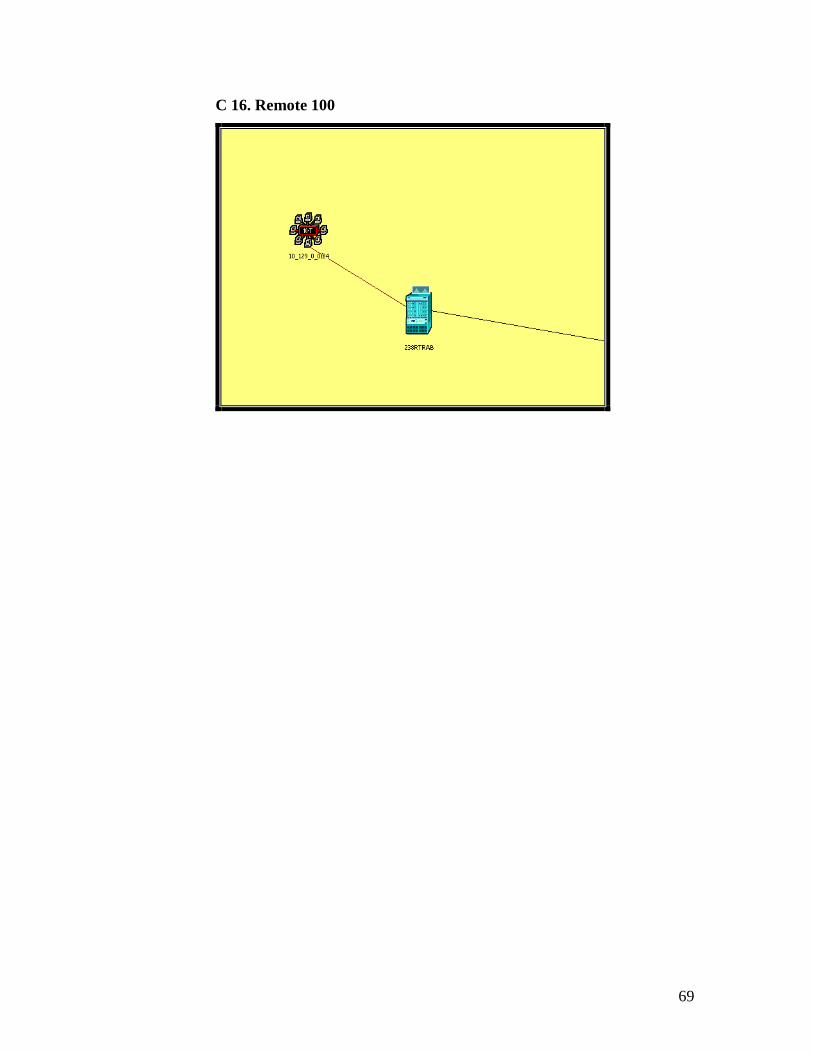
Appendix C.
OPNET IT GURU Screen Shots
C 1. Top Level Design
C 2. RBG Core
61
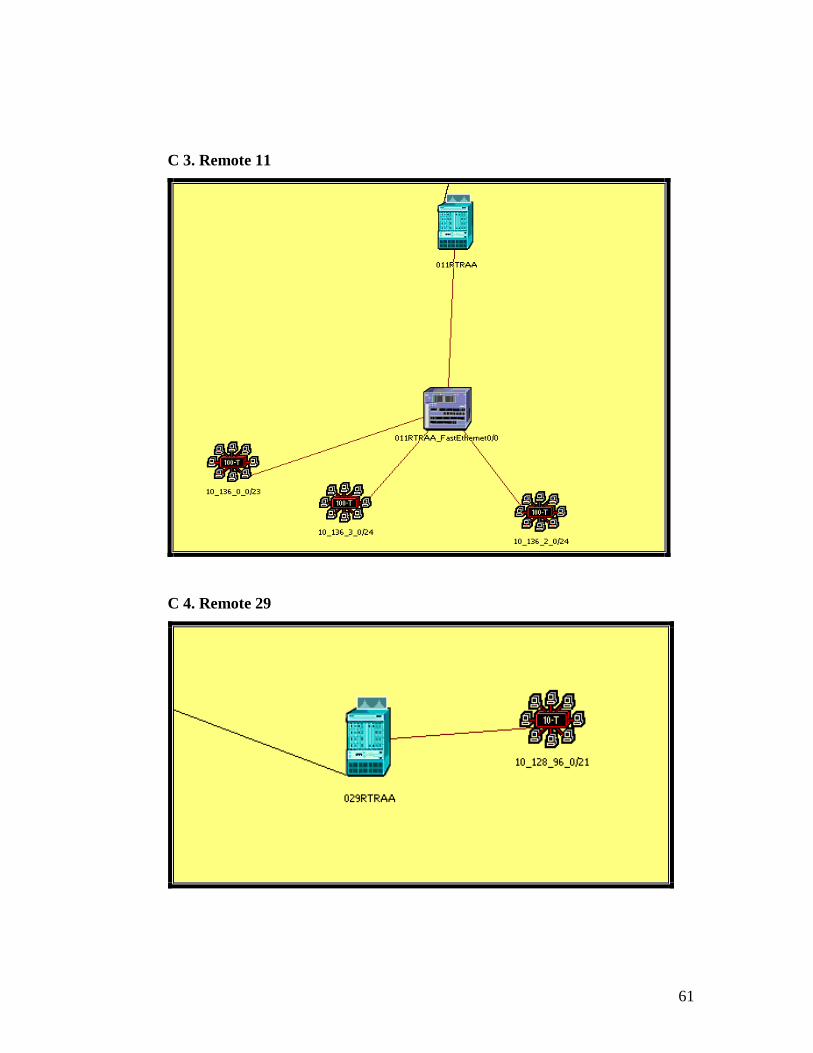
C 3. Remote 11
C 4. Remote 29
62
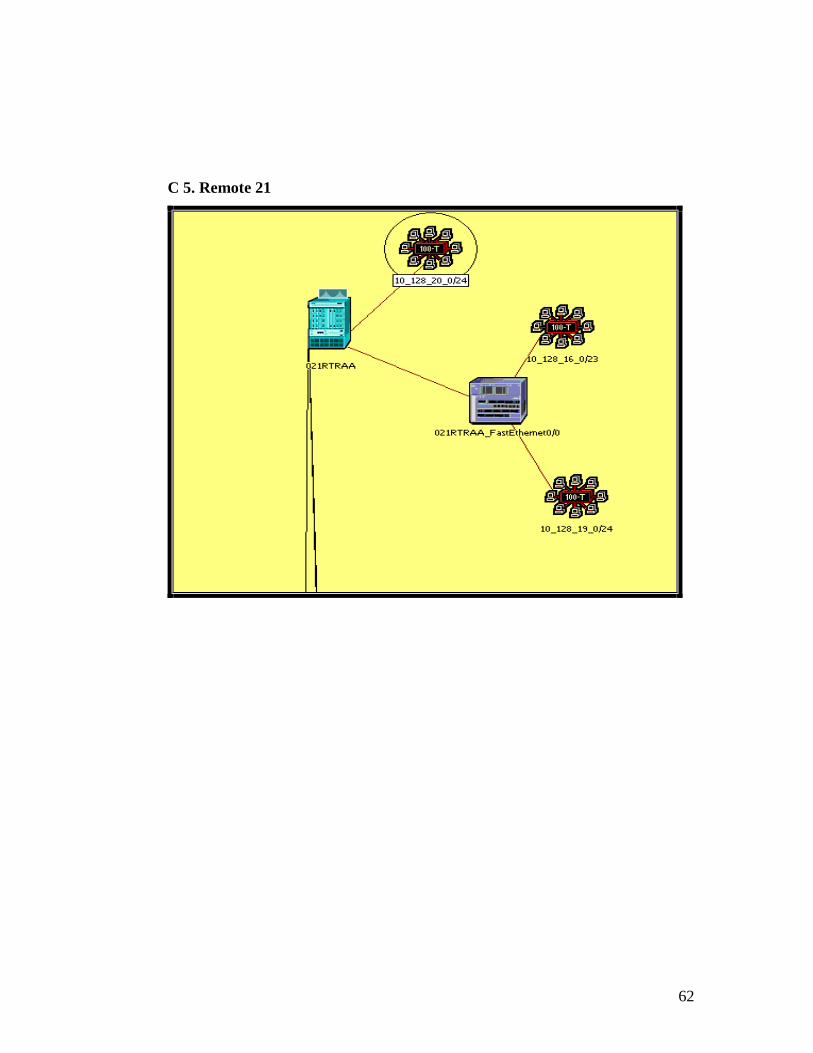
C 5. Remote 21
63
C 5. Remote 14
C 6. Remote 25A and Remote 25B
64
C 7. Remote 660
C 8. Remote 21
65
C 9. Remote 24
C 9. Remote 26
66
C 10. Remote 80
C 11. Remote PL
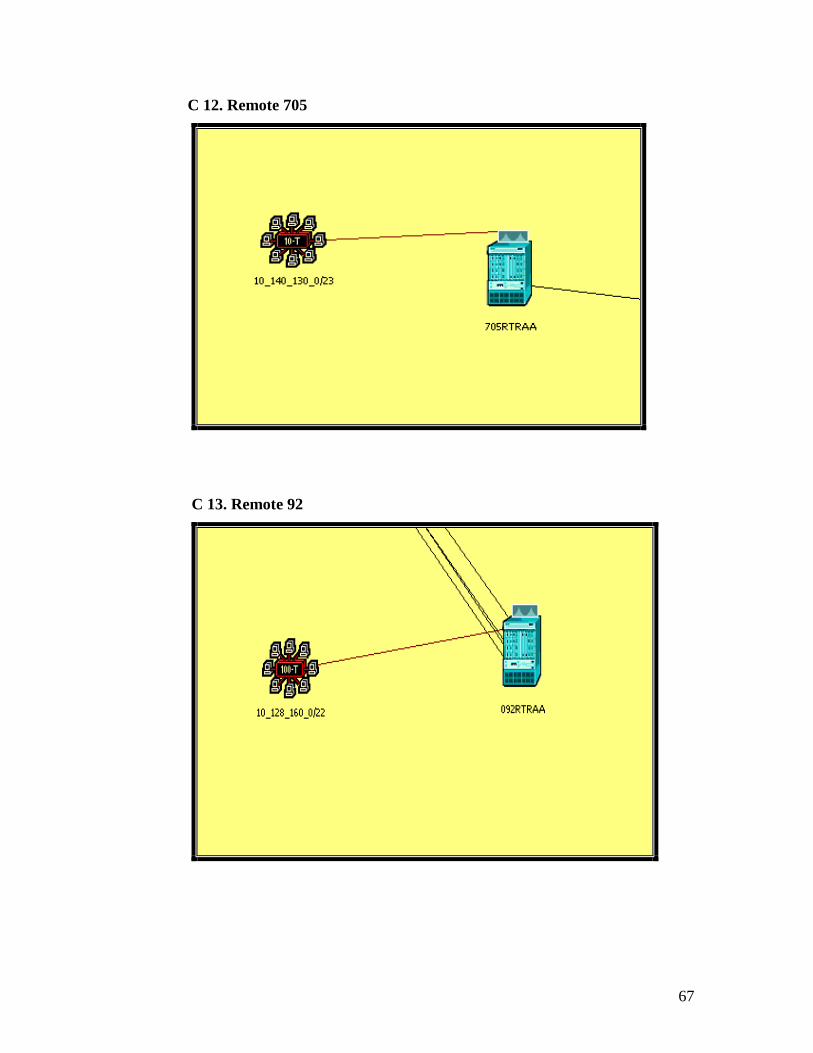
67
C 12. Remote 705
C 13. Remote 92
68
C 14. Remote 300
C 15. Remote 200
69
C 16. Remote 100
70
References
1. Beijnum van, Iljitsch. BGP Building Reliable Networks with the Border Gateway Protocol. California: O’Reilly, 2002.
2. Black, Uyless. Frame Relay Networks. New York: McGraw-Hill, 1998.
3. Cisco Systems. “BGP Case Studies”. Http://www.cisco.com/warp/public/459/bgp-toc.html. March 28, 2005.
4. Graham, Buck. TCP/IP addressing: designing and optimizing your IP addressing scheme. Boston: AP Professional, 1997.
5. Malkin, G., “RIP Version 2”, Request for Comments (Standard) 2453, Internet Engineering Task Force, Nov. 1998.
6. Maltz, David, Xie, Geoffrey, Zhan, Jibin, Zhang, “Routing Design in Operation Networks: A Look from the Inside”, Technical Report, Carnegie Mellon University, 2004.
7. Moy, J., “OSPF Version 2”, Request for Comments (Draft Standard) 2328, Internet Engineering Task Force, Apr. 1998.
8. Perros, Harry. An Introduction to ATM networks. New York: Wiley, 2002.
9. Tackett, Tom. Senior Technical Specialist, Data Communications, Kroger Company. Personal interview. February 14, 2006.
10. OPNET. “OPNET Products”. Http://www.opnet.com/opnet-products.html. November 4, 2005.
11. Wang, Xin, Yu, C., Schulzrinne, Henning. “IP Multicast Fault Recovery in PIM over OSPF”, Technical Report, Department of Computer Science, Columbia University, 2004.