Embed Size (px)
Citation preview
1

2
Acknowledgements The Delta Ponds Service Learning Program Team would like to thank the following individuals and organizations for their help in various components of the project: Lauri Mullen, Trevor Taylor and Lorna Baldwin – City of Eugene Bill Castillo and Erik Moberly – Oregon Department of Fish and Wildlife Steve Mital – University of Oregon, Service Learning Program Alissa Manske, Mark Neff and Ted Toadvine – University of Oregon, Environmental Studies Seth Ayotte, Michael Cleaver, Mai Thien Le, Andrew Munson, Dhelia Tucker and Alec Zimmerman – University of Oregon Turtle Monitoring Students Dave Vazquez and John Medenbach – Community Volunteers Alyssa Buhl, Savannah Crawford, Rudy Dietz, Kelsea Feola, Jennifer Jacobs, Deanna McKinney, Jerica Miller, Gregg Shetterly, Kate Skelton, Jody Trendler – Service Learning Program/Americorps Volunteers Mieko Aoki, Tom Bettman, Olivia Duren, Hal Hushbeck, Susan Primak, Doug Quirk, Jennifer Rice, Kathy Schmidt, Brent Stone – City of Eugene, Stream Team Volunteers Americorps Program Eugene District U.S. Bureau of Land Management

3
Table of Contents
1.0 Executive Summary …………………………………………………………………6 2.0 Introduction ………………………………………………………………………….7
2.1 SITE DESCRIPTION ............................................................................................................................ 7 2.2 SITE HISTORY ..................................................................................................................................... 8 2.3 RESTORATION PLAN......................................................................................................................... 8 2.4 SERVICE LEARNING PROGRAM MONITORING PROJECT OVERVIEW............................. 9
2.4.1 PROJECT GOALS .............................................................................................................................. 10 2.4.2 PROJECT DESCRIPTION .................................................................................................................... 10 2.4.3 PROJECT PARTNERS ......................................................................................................................... 10
3.0 Fish Monitoring …………………………………………………………………….11
3.1 INTRODUCTION ................................................................................................................................ 11 KEY SPECIES ............................................................................................................................................ 11
Chinook Salmon (Oncorhynchus tshawytscha)................................................................................... 11 Cutthroat Trout (Oncorhynchus clarki) .............................................................................................. 13 Rainbow Trout/Steelhead (Oncorhynchus mykiss) ............................................................................. 15
ADDITIONAL NATIVE SPECIES OF INTEREST ............................................................................................. 16 Oregon Chub (Oregonichthys crameri) .............................................................................................. 16 Northern Pikeminnow (Ptychocheilus oregonensis) ........................................................................... 16 Dace/Speckled Dace (Rhinichthys osculus) ........................................................................................ 16 Other Noteworthy Native Species ....................................................................................................... 17
NON-NATIVE SPECIES OF INTEREST .......................................................................................................... 17 Smallmouth Bass (Micropterus dolomieui)......................................................................................... 17 Largemouth Bass (Micropterus salmoides) ........................................................................................ 18 Channel Catfish (Ictaluruss punctatus) .............................................................................................. 18 Other Noteworthy Non-native Species ................................................................................................ 18
3.2 DELTA PONDS OUTFLOW MONITORING.................................................................................. 18 3.2.1 MONITORING DESCRIPTION ............................................................................................................. 19 3.2.2 DATA SUMMARY ............................................................................................................................. 20 3.2.3 DISCUSSION OF RESULTS ................................................................................................................. 20
3.3 SEINING SURVEY.............................................................................................................................. 21 3.3.1 MONITORING DESCRIPTION ............................................................................................................. 21 3.3.2 DATA SUMMARY ............................................................................................................................. 22 3.3.3 DISCUSSION OF RESULTS ................................................................................................................. 22
3.4 FISH DERBY........................................................................................................................................ 23 3.4.1 ACTIVITY DESCRIPTION................................................................................................................... 23 3.4.2 DATA SUMMARY ............................................................................................................................. 23 3.4.3 DISCUSSION OF RESULTS ................................................................................................................. 23
3.5 RECOMMENDATIONS FOR FUTURE MONITORING .............................................................. 24 FISH TRAP ................................................................................................................................................ 24 FISH SEINING............................................................................................................................................ 24 FISH DERBY- ANGLER SURVEY: ............................................................................................................... 24
4
4.0 Turtle Monitoring…………………………………………………………………..25 4.1 INTRODUCTION ................................................................................................................................ 25
KEY SPECIES ............................................................................................................................................ 25 Western Pond Turtle (Clemmys Marmorata)...................................................................................... 25
OTHER SPECIES OF INTEREST ................................................................................................................... 27 Red-Eared Slider (Trachemys scripta elegans) .................................................................................. 27
OVERVIEW OF MONITORING METHODS.................................................................................................... 28 4.2 TURTLE HATCHLING SURVEY..................................................................................................... 28
4.2.1 SURVEY DESCRIPTION ..................................................................................................................... 29 4.2.2 RESULTS .......................................................................................................................................... 29 4.2.3 DISCUSSION ..................................................................................................................................... 29
4.3 TURTLE TRAPPING AND VISUAL SURVEY............................................................................... 29 4.3.1 MONITORING DESCRIPTION ............................................................................................................. 30 4.3.2 DATA SUMMARY ............................................................................................................................. 31 4.3.3 DISCUSSION OF RESULTS ................................................................................................................. 33
4.4 NON-NATIVE TURTLE REMOVAL ............................................................................................... 34 4.4.1 REMOVAL DESCRIPTION .................................................................................................................. 34 4.4.2 REMOVAL RESULTS ......................................................................................................................... 34 4.4.3 DISCUSSION OF RESULTS ................................................................................................................. 34
4.5 RECOMMENDATIONS FOR FUTURE MONITORING .............................................................. 34 5.0 Amphibian Monitoring……………………………………………………………..35
5.1 INTRODUCTION ................................................................................................................................ 36 KEY SPECIES ............................................................................................................................................ 36
Rough Skinned Newt (Taricha granulosa) .......................................................................................... 36 Northwestern Salamander (Ambystoma gracile) ................................................................................ 38 Red-Legged Frog (Rana aurora) ........................................................................................................ 39 Pacific Chorus frog (Hyla regilla)...................................................................................................... 40 Bullfrog (Rana catesbeiana) ............................................................................................................... 41
OVERVIEW OF MONITORING METHODS.................................................................................................... 42 5.2 SALAMANDER SURVEY .................................................................................................................. 43
5.2.1 SURVEY DESCRIPTION ..................................................................................................................... 43 5.2.2 SURVEY RESULTS ............................................................................................................................ 45 5.2.3 DISCUSSION OF RESULTS ................................................................................................................. 45
5.3 RED-LEGGED FROG SURVEY ....................................................................................................... 46 5.3.1 SURVEY DESCRIPTION ..................................................................................................................... 46 5.3.2 SURVEY RESULTS ............................................................................................................................ 47 5.3.3 DISCUSSION OF RESULTS ................................................................................................................. 47
5.4 PACIFIC CHORUS FROG AND BULLFROG VOCALIZATION SURVEY .............................. 48 5.4.1 SURVEY DESCRIPTION ..................................................................................................................... 48 5.4.2 SURVEY RESULTS ............................................................................................................................ 49 5.4.3 DISCUSSION OF RESULTS ................................................................................................................. 50
5.5 RECOMMENDATIONS FOR FUTURE MONITORING .............................................................. 51 SALAMANDER SURVEY............................................................................................................................. 52 FROG VOCALIZATION SURVEYS ............................................................................................................... 52
5
6.0 Vegetation Monitoring……………………………………………………………..53 6.1 INTRODUCTION ................................................................................................................................ 53
VEGETATION COMMUNITIES .................................................................................................................... 53 Upland Community ............................................................................................................................. 53 Riparian Community........................................................................................................................... 54 Wetland Transition Community .......................................................................................................... 55 Emergent Wetland Community ........................................................................................................... 56
OTHER SPECIES OF INTEREST ................................................................................................................... 57 Armenian Blackberry (Rubus armenicus) ........................................................................................... 57
OTHER NOTEWORTHY SPECIES................................................................................................................. 58 English Ivy (Hedera helix) .................................................................................................................. 58 Scotch Broom (Cytisus scoparius) ...................................................................................................... 58 Snowberry (Symphoricarpos albus).................................................................................................... 59 Willamette Daisy (Erigeron decumbens) ............................................................................................ 59
OVERVIEW OF MONITORING METHODS.................................................................................................... 59 6.2 VEGETATION COMMUNITY ANALYSIS..................................................................................... 60
6.2.1 ANALYSIS AND METHODS DESCRIPTION.......................................................................................... 60 6.2.2 VEGETATION COMMUNITY DISTRIBUTION....................................................................................... 61 6.2.3 VEGETATION AREA ......................................................................................................................... 67
6.3 RECOMMENDATIONS FOR FUTURE MONITORING .............................................................. 67
7.0 Outreach and Education …………………………………………………………..69 7.1 INTRODUCTION ................................................................................................................................ 69 7.2 STREAM TEAM COLLABORATION ............................................................................................. 69
7.2.1 COLLABORATION EFFORTS .............................................................................................................. 70 7.2.2 VOLUNTEER TRAINING AND PARTICIPATION DATA ......................................................................... 71
7.3 EDUCATION AND OUTREACH ...................................................................................................... 71
8.0 Conclusion ………………………………………………………………………….73
REFERENCES ........................................................................................................................................... 74
APPENDIX 1: FISH TRAP DATA........................................................................................................... 77 APPENDIX 2: FISH SEINING DATA..................................................................................................... 85 APPENDIX 3: TURTLE TRAPPING DATA.......................................................................................... 87 APPENDIX 4: TURTLE DATA ANALYSIS .......................................................................................... 88 APPENDIX 5: SALAMANDER SURVEY DATA .................................................................................. 90 APPENDIX 6: RED-LEGGED FROG SURVEY DATA ...................................................................... 91 APPENDIX 7: BULLFROG VOCALIZATION SURVEY DATA....................................................... 92 APPENDIX 8: PACIFIC CHORUS FROG SURVEY DATA............................................................... 94 APPENDIX 9: EDUCATIONAL POSTERS .......................................................................................... 96
6
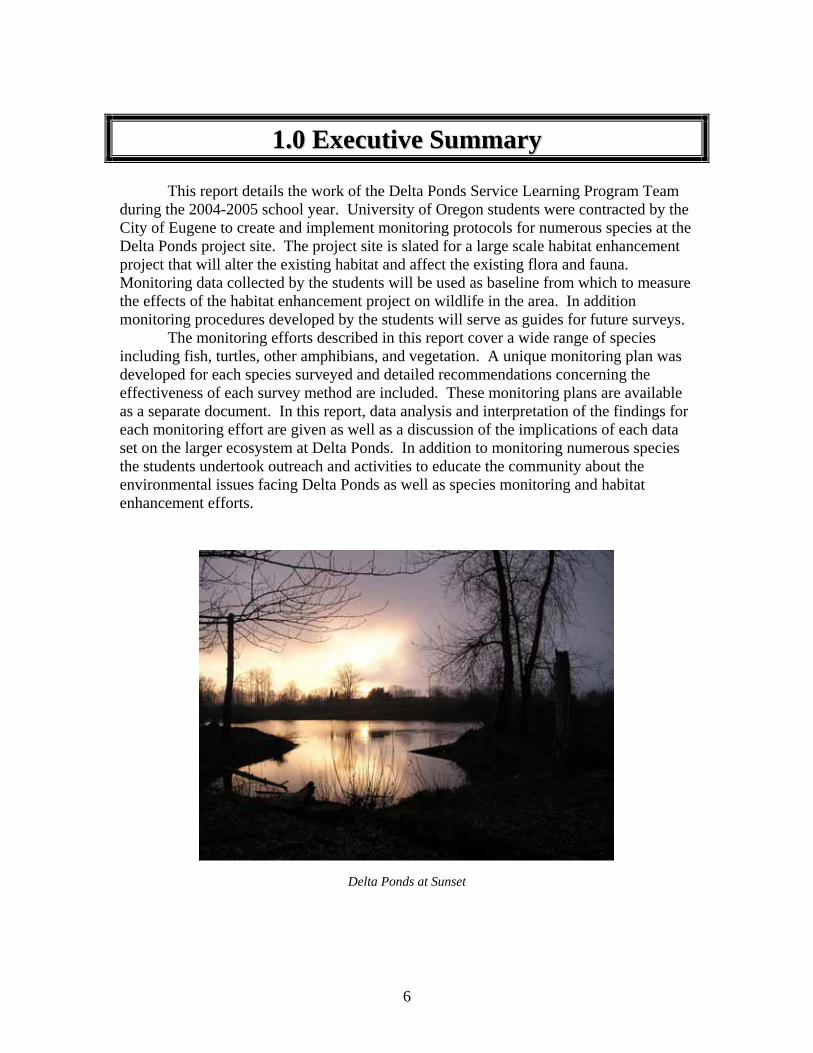
11..00 EExxeeccuuttiivvee SSuummmmaarryy This report details the work of the Delta Ponds Service Learning Program Team during the 2004-2005 school year. University of Oregon students were contracted by the City of Eugene to create and implement monitoring protocols for numerous species at the Delta Ponds project site. The project site is slated for a large scale habitat enhancement project that will alter the existing habitat and affect the existing flora and fauna. Monitoring data collected by the students will be used as baseline from which to measure the effects of the habitat enhancement project on wildlife in the area. In addition monitoring procedures developed by the students will serve as guides for future surveys. The monitoring efforts described in this report cover a wide range of species including fish, turtles, other amphibians, and vegetation. A unique monitoring plan was developed for each species surveyed and detailed recommendations concerning the effectiveness of each survey method are included. These monitoring plans are available as a separate document. In this report, data analysis and interpretation of the findings for each monitoring effort are given as well as a discussion of the implications of each data set on the larger ecosystem at Delta Ponds. In addition to monitoring numerous species the students undertook outreach and activities to educate the community about the environmental issues facing Delta Ponds as well as species monitoring and habitat enhancement efforts.
Delta Ponds at Sunset
7
22..00 IInnttrroodduuccttiioonn
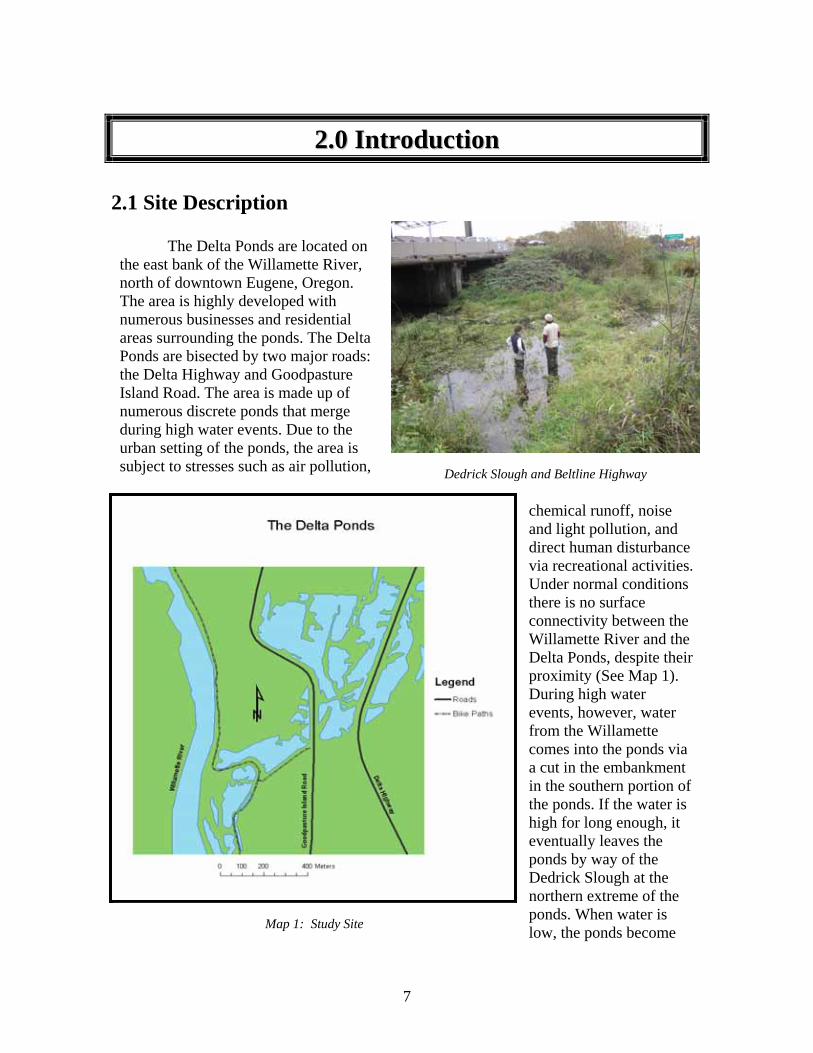
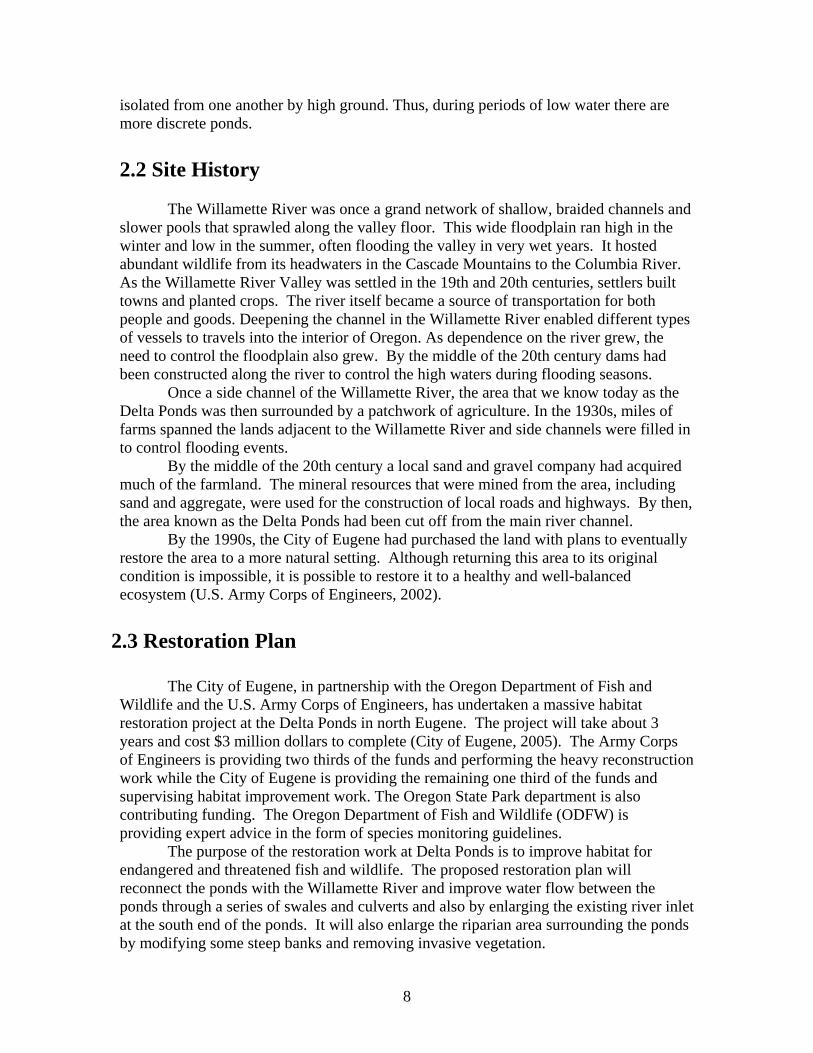
The Delta Ponds are located on the east bank of the Willamette River, north of downtown Eugene, Oregon. The area is highly developed with numerous businesses and residential areas surrounding the ponds. The Delta Ponds are bisected by two major roads: the Delta Highway and Goodpasture Island Road. The area is made up of numerous discrete ponds that merge during high water events. Due to the urban setting of the ponds, the area is subject to stresses such as air pollution,
chemical runoff, noise and light pollution, and direct human disturbance via recreational activities. Under normal conditions there is no surface connectivity between the Willamette River and the Delta Ponds, despite their proximity (See Map 1). During high water events, however, water from the Willamette comes into the ponds via a cut in the embankment in the southern portion of the ponds. If the water is high for long enough, it eventually leaves the ponds by way of the Dedrick Slough at the northern extreme of the ponds. When water is low, the ponds become
2.1 Site Description
Dedrick Slough and Beltline Highway
Map 1: Study Site
8
isolated from one another by high ground. Thus, during periods of low water there are more discrete ponds. 2.2 Site History The Willamette River was once a grand network of shallow, braided channels and slower pools that sprawled along the valley floor. This wide floodplain ran high in the winter and low in the summer, often flooding the valley in very wet years. It hosted abundant wildlife from its headwaters in the Cascade Mountains to the Columbia River. As the Willamette River Valley was settled in the 19th and 20th centuries, settlers built towns and planted crops. The river itself became a source of transportation for both people and goods. Deepening the channel in the Willamette River enabled different types of vessels to travels into the interior of Oregon. As dependence on the river grew, the need to control the floodplain also grew. By the middle of the 20th century dams had been constructed along the river to control the high waters during flooding seasons. Once a side channel of the Willamette River, the area that we know today as the Delta Ponds was then surrounded by a patchwork of agriculture. In the 1930s, miles of farms spanned the lands adjacent to the Willamette River and side channels were filled in to control flooding events. By the middle of the 20th century a local sand and gravel company had acquired much of the farmland. The mineral resources that were mined from the area, including sand and aggregate, were used for the construction of local roads and highways. By then, the area known as the Delta Ponds had been cut off from the main river channel. By the 1990s, the City of Eugene had purchased the land with plans to eventually restore the area to a more natural setting. Although returning this area to its original condition is impossible, it is possible to restore it to a healthy and well-balanced ecosystem (U.S. Army Corps of Engineers, 2002).
The City of Eugene, in partnership with the Oregon Department of Fish and Wildlife and the U.S. Army Corps of Engineers, has undertaken a massive habitat restoration project at the Delta Ponds in north Eugene. The project will take about 3 years and cost $3 million dollars to complete (City of Eugene, 2005). The Army Corps of Engineers is providing two thirds of the funds and performing the heavy reconstruction work while the City of Eugene is providing the remaining one third of the funds and supervising habitat improvement work. The Oregon State Park department is also contributing funding. The Oregon Department of Fish and Wildlife (ODFW) is providing expert advice in the form of species monitoring guidelines. The purpose of the restoration work at Delta Ponds is to improve habitat for endangered and threatened fish and wildlife. The proposed restoration plan will reconnect the ponds with the Willamette River and improve water flow between the ponds through a series of swales and culverts and also by enlarging the existing river inlet at the south end of the ponds. It will also enlarge the riparian area surrounding the ponds by modifying some steep banks and removing invasive vegetation.
2.3 Restoration Plan
9
Reconnecting the ponds to the Willamette River will improve water quality in the ponds as well as create a side channel, similar to the historic flow of the Willamette,
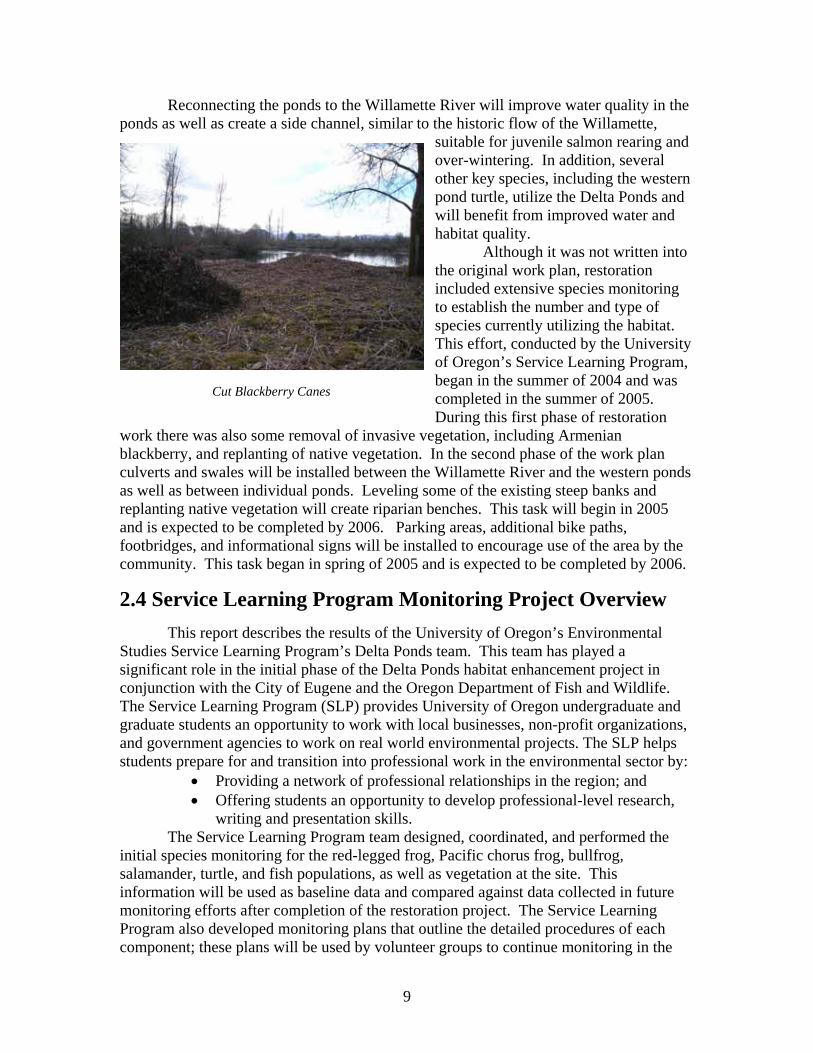
suitable for juvenile salmon rearing and over-wintering. In addition, several other key species, including the western pond turtle, utilize the Delta Ponds and will benefit from improved water and habitat quality. Although it was not written into the original work plan, restoration included extensive species monitoring to establish the number and type of species currently utilizing the habitat. This effort, conducted by the University of Oregon’s Service Learning Program, began in the summer of 2004 and was completed in the summer of 2005. During this first phase of restoration
work there was also some removal of invasive vegetation, including Armenian blackberry, and replanting of native vegetation. In the second phase of the work plan culverts and swales will be installed between the Willamette River and the western ponds as well as between individual ponds. Leveling some of the existing steep banks and replanting native vegetation will create riparian benches. This task will begin in 2005 and is expected to be completed by 2006. Parking areas, additional bike paths, footbridges, and informational signs will be installed to encourage use of the area by the community. This task began in spring of 2005 and is expected to be completed by 2006.
This report describes the results of the University of Oregon’s Environmental Studies Service Learning Program’s Delta Ponds team. This team has played a significant role in the initial phase of the Delta Ponds habitat enhancement project in conjunction with the City of Eugene and the Oregon Department of Fish and Wildlife. The Service Learning Program (SLP) provides University of Oregon undergraduate and graduate students an opportunity to work with local businesses, non-profit organizations, and government agencies to work on real world environmental projects. The SLP helps students prepare for and transition into professional work in the environmental sector by:
• Providing a network of professional relationships in the region; and • Offering students an opportunity to develop professional-level research,
writing and presentation skills. The Service Learning Program team designed, coordinated, and performed the initial species monitoring for the red-legged frog, Pacific chorus frog, bullfrog, salamander, turtle, and fish populations, as well as vegetation at the site. This information will be used as baseline data and compared against data collected in future monitoring efforts after completion of the restoration project. The Service Learning Program also developed monitoring plans that outline the detailed procedures of each component; these plans will be used by volunteer groups to continue monitoring in the
2.4 Service Learning Program Monitoring Project Overview
Cut Blackberry Canes

10
future. 2.4.1 Project Goals
The goals of this project included giving university students a chance to work in tandem with professional organizations on a pertinent environmental issue. The project also specifically aimed:
• To determine the presence and abundance of flora and fauna at the Delta Ponds;
• To create monitoring protocols for each species surveyed; and • To make recommendations regarding the use of monitoring protocols.
2.4.2 Project Description
The project included six different species population surveys of fish; red-legged, Pacific chorus and bull frogs; salamanders and newts; red eared sliders and western pond turtles; and vegetation at the Delta Ponds. Each survey required a different procedure designed according to the specific ecology of the species being monitored. The fish survey included the use of a fish trap located in the slough at the north end of the ponds and fish seining to determine the types of fish that reside in the ponds. The team held a fish derby to gather information about the adult resident fish population. To assess the red-legged frog population, the team performed an observation survey to determine the presence of the species’ egg masses. This was done using a canoe to observe the vegetation of all ponds where egg masses may be located. Vocalization surveys were used to monitor both the Pacific chorus frog and bullfrog populations. During these surveys, volunteers monitored the calls from male frogs during the breeding season. The salamander survey was performed using the placement of artificial cover objects around the ponds to provide consistent measurable areas of habitat. The team monitored the vegetation of the ponds using both aerial photography and ground proofing. The information gathered was compiled using GIS to create a map of the vegetation classes at the ponds. The turtle population survey was the most extensive of the project; traps were placed around the ponds to catch and mark turtles, and a visual survey was used to determine the number of turtles in the ponds.
2.4.3 Project Partners
This project involved the collaboration of multiple partners. Each provided assistance and support in multiple ways. As the contract client, the City of Eugene provided logistical support and generally oversaw the monitoring project. Stream Team, the City’s volunteer group, provided considerable volunteer assistance. The University of Oregon’s Environmental Studies program also provided a source of field-workers by providing credit opportunities for participating students. The Oregon Department of Fish and Wildlife provided expertise for the planning and implementation of the surveys as well as materials for many of the procedures. The Army Corps of Engineers is providing the majority of the financial support for the overall restoration project.
11
33..00 FFiisshh MMoonniittoorriinngg
The restoration project at the Delta Ponds largely focuses on improving habitat for key indigenous fish species. One of the main objectives of the restoration project is to improve access and habitat for native fish populations, while at the same time reducing or eliminating non-native fish species. In preparation for these restoration endeavors, extensive monitoring took place. The goals of the fish monitoring efforts included the following:
• Determine whether or not salmonids are using the Delta Ponds along migratory paths
• Assess any transient or migratory fish using the Dedrick Slough as a travel route • Assess locations throughout the Delta Ponds where fish species are present • Determine types of resident fish species and locations of populations throughout
the ponds The monitoring efforts of the fish populations in the Delta Ponds were grouped into two categories of fish: native or indigenous species and the invasive or introduced species. Below, each key species is described in further depth. Key Species
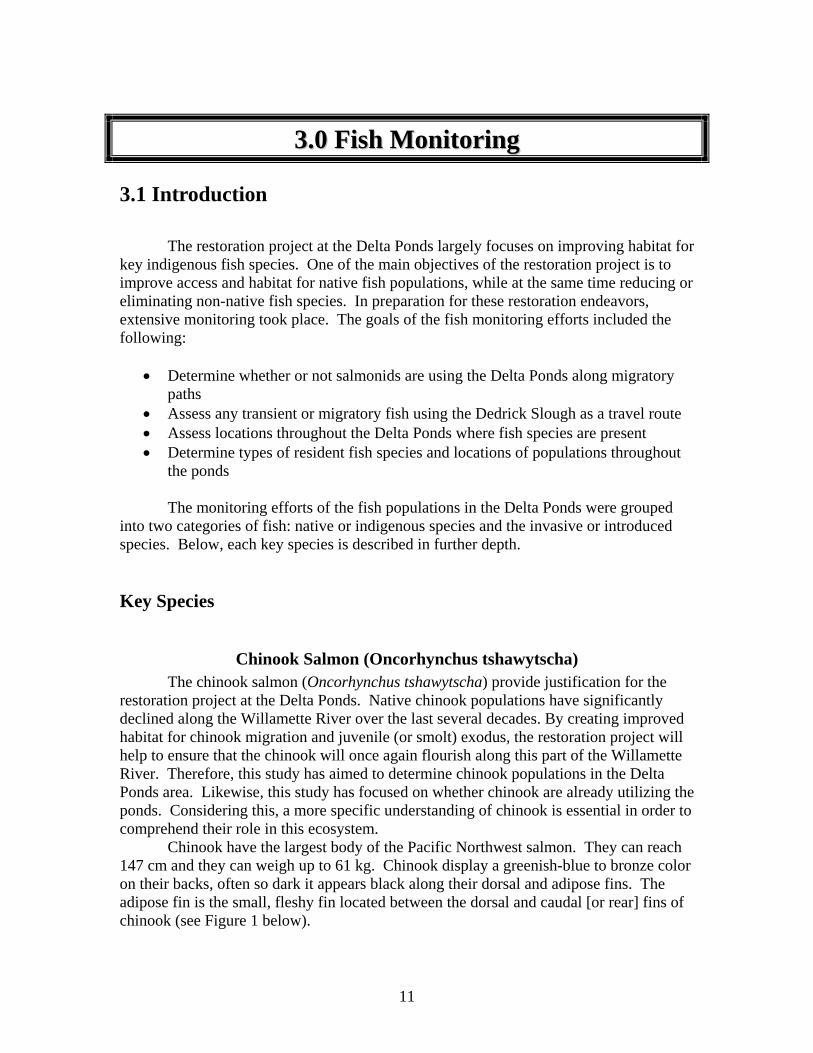
Chinook Salmon (Oncorhynchus tshawytscha) The chinook salmon (Oncorhynchus tshawytscha) provide justification for the restoration project at the Delta Ponds. Native chinook populations have significantly declined along the Willamette River over the last several decades. By creating improved habitat for chinook migration and juvenile (or smolt) exodus, the restoration project will help to ensure that the chinook will once again flourish along this part of the Willamette River. Therefore, this study has aimed to determine chinook populations in the Delta Ponds area. Likewise, this study has focused on whether chinook are already utilizing the ponds. Considering this, a more specific understanding of chinook is essential in order to comprehend their role in this ecosystem. Chinook have the largest body of the Pacific Northwest salmon. They can reach 147 cm and they can weigh up to 61 kg. Chinook display a greenish-blue to bronze color on their backs, often so dark it appears black along their dorsal and adipose fins. The adipose fin is the small, fleshy fin located between the dorsal and caudal [or rear] fins of chinook (see Figure 1 below).
3.1 Introduction

12
Although the most likely size of salmon to be found in the Delta Ponds are those in a juvenile stage of life, it is important to note their physical changes throughout their lifecycles. Chinook bodies tend to grow much darker at the time of spawning. They have large, irregular spots on their sides, back, and tail (Steelquist, 1996). As juvenile salmon, chinook appear thin and pale
in color compared to their mature counterparts. They have bar-flanked sides that eventually contract into smaller irregular spots as they grow (Bell, 30). ‘Bar-flanked’ indicates conspicuous, dark bar-like marks on the chinook’s side resembling railroad ties. Once in the ocean’s salt water, chinook develop a very bright, silvery color. This brightness begins to fade as they return to freshwater and their ancestral watershed (Bell, 39). Finally, during the last stages of the chinooks’ life, after they have spawned, they turn very dark in color and begin to deteriorate (Bell, 1996). Soon after, they perish. The habitat needs of chinook change depending upon the stages of their lifecycle and their migration. Chinook spawn in deep, fast-moving water with large, cobble sized gravel (Steelquist, 1996). Once the newly hatched fish known as ‘fry’ emerge, they voraciously feed, first on the remains of their yolk sac and later on insects and plankton in the now slower waters of their home stream. Eventually, as they mature to smolt, chinook instinctively begin to migrate. The urge to journey from fresh water to saltwater overcomes them and they soon begin their seaward migration en masse. Chinook migration often occurs during the evening; thus, there are times during the day when the chinook will seek slower moving waters for shelter and rest (Bell, 1996). The Delta Ponds might offer such shelter for migrating smolt during their seaward journey. Likewise, this same shelter is available to upstream migrating adult chinook as they make their way back to their waters of origin. Additionally, the biota at the Delta Ponds is sufficient for providing plentiful sustenance for transient chinook. The ponds host a variety of items that chinook might eat,
Juvenile Chinook Source: Oregon Department of Fish and Wildlife
Figure 1: Chinook Diagram

13
including insects, assorted plankton, and other fish. Once habitat improvement plans have been implemented, the Delta Ponds may offer key salmon migration routes along the Willamette watercourse. They also play a significant nutrient transferring role in the local ecosystems. Juvenile salmon consume macroinvertebrates and other nutrient-rich organisms in slow moving areas, like the Delta Ponds. As the salmon age and move to the ocean, they transport those nutrients with them and accumulate more nutrients from ocean prey. When they return to the Willamette River tributaries to spawn, they die and pass their accumulated nutrients to animals that scavenge the salmon carcasses. There are pressures currently present at the Delta Ponds that could negatively impact salmon migration. For example, invasive species such as bullfrogs and bass gobble up juvenile fish populations. Likewise, ducks and other waterfowl seek out juvenile fish hiding in gravel beds and consume them in large quantities. Still, chinook compete with such species all along the Willamette River as they migrate to and from spawning grounds in higher, cooler headwaters. Chinook do require much colder water for spawning than the Delta Ponds can provide. Therefore, Delta Ponds are not quality spawning grounds for chinook because they are too tepid. Warm temperatures can alter the incubation period of chinook embryos, including survival rates and length of incubation (Bell, 1996). The warm temperatures of the Delta Ponds during the summer months would also reduce the survival rate of embryonic chinook.
Cutthroat Trout (Oncorhynchus clarki) Another relevant species key to the restoration project of the Delta Ponds is the cutthroat trout (Oncorhynchus clarki). Most recognizable groups of cutthroat have undergone marked decline over the last 100 years (Behnke, 1992). These declines are primarily due to habitat destruction. It is therefore necessary to develop and maintain habitat suitable to foster populations of cutthroat. By assessing the current population of
cutthroat residing in the Delta Ponds, and by improving the habitat of the ponds, cutthroat may once again flourish along this part of the Willamette River. As with the chinook, if cutthroat trout are present and are
utilizing the Delta Ponds area, it is essential that great efforts are made in order to ensure their population grows. Still, in order to establish whether or not cutthroat are present, their populations must be assessed in the ponds. Cutthroat trout have the greatest North American distribution of all Western trout species. “Even though this trout is often referred to as the most abundant, it is important to recognize that the term ‘abundance’ is relative to the geographic region of the cutthroat
Coastal Cutthroat Trout Source: Oregon Department of Fish and Wildlife

14
and its specific strain (Behnke, 1992).” It is important to distinguish between the westslope (or inland) cutthroat and the coastal cutthroat (note that the cutthroat of the Willamette River is of the coastal variety and is the least common of the two). Westslope cutthroat have a silvery to brassy under color like many of their trout cousins. The outline of their spots, however, is irregular and their spots are prolific along their tail and sides, often extending to their head (Behnke, 1992). The same is true of the irregularity of the spots on the coastal cutthroat—its coloration is similar to the rainbow trout in that its bright sides often display a pinkish pearlescent streak that runs the length of its body. With the coastal cutthroat, the silvery deposits in the skin can often mask the spots (Behnke, 1992). In adults, the upper jaw extends beyond the eye. The caudal fin is forked and an adipose fin is present (see Figure 2). The most striking characteristic of the cutthroat may be its namesake feature: a bright red slash on each side of the throat. Fish comprising the fall migration range in size from approximately 250 to 450 mm, with a maximum size of approximately 550 mm and weigh approximately 2 kg, though some exceptional fish may reach 3 kg (Behnke, 1992). The habitat needs of the cutthroat depend on specific characteristics, for instance, whether or not the cutthroat is a sea-run coastal cutthroat, coastal subspecies cutthroat, or inland cutthroat. Sea-run coastal cutthroat migrate to the ocean in the late spring or early summer. Most fish migrate annually beginning at age 2 or 3 years, although some may not ever go into the sea. The majority of the seaward population prefers the slower moving waters of estuaries to the open waters of oceans. They therefore remain close to the coast, returning upriver after only a few months. Their typical spawning season is late winter to early spring, and varies geographically. Coastal cutthroat are ravenous predators. In fact, research has shown that cutthroat trout are the most highly predaceous species of trout (Behnke, 1992). Therefore, they require a large population of other fish (including trout) upon which to feed. This large prey population, in turn, requires a healthy ecosystem in which to thrive. Coastal cutthroat use small tributaries and side channels of slower moving water for spawning and nurseries (Trotter, 1987). The Delta Ponds hosts a variety of other species of fish upon which cutthroat may feed. Additionally, the Delta Ponds offers excellent shelter for migrating cutthroat during their seaward journey. Because cutthroat make several migrations within their lifetime, this same shelter is available to migrating adult cutthroat as they travel upstream and return downstream. Likewise, the slower waters of the Delta Ponds could act as a side
Figure 2: Cutthroat Trout Diagram
15
channel of sorts for the possibility of cutthroat spawning. The same threats that exist for the chinook also exist for the cutthroat at the Delta Ponds. Invasive species like bullfrogs and other fish consume juvenile cutthroat populations and encroach on migratory and spawning habitat. Likewise, predatory birds and waterfowl may seek out and feast upon juvenile cutthroat. Additionally, the ponds are often too warm to permit a late winter to early spawn without the proper inflow of cooler water from the main river.
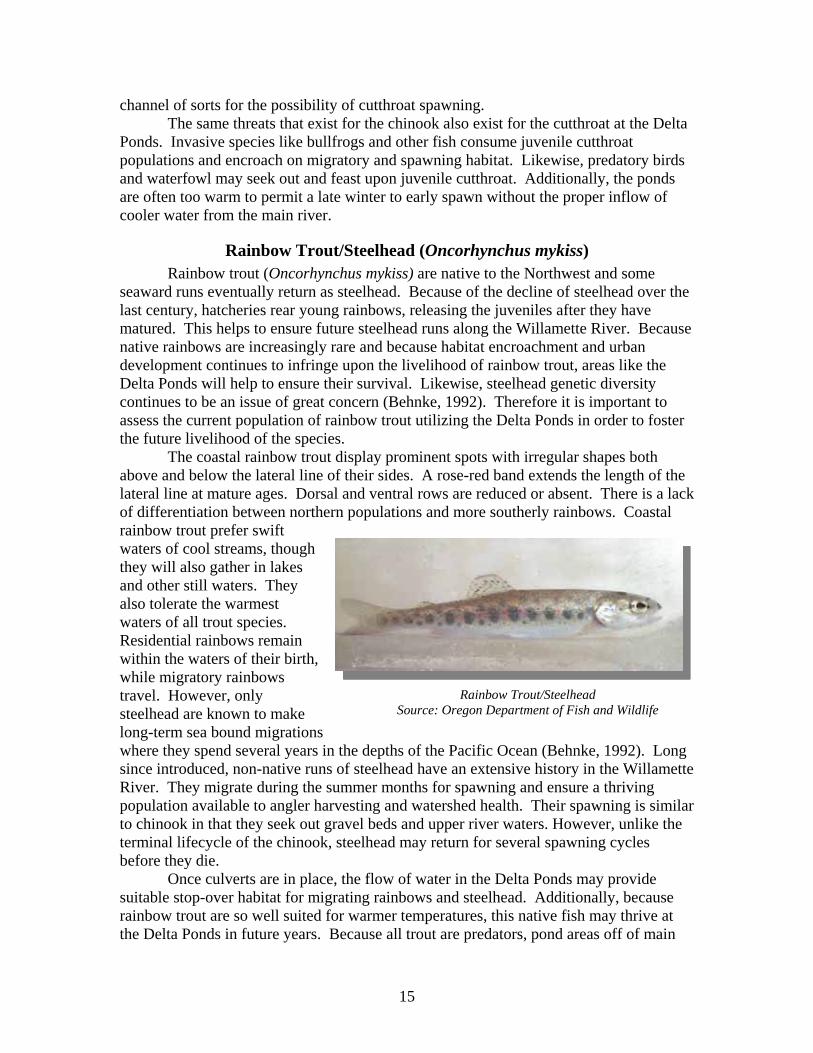
Rainbow Trout/Steelhead (Oncorhynchus mykiss) Rainbow trout (Oncorhynchus mykiss) are native to the Northwest and some seaward runs eventually return as steelhead. Because of the decline of steelhead over the last century, hatcheries rear young rainbows, releasing the juveniles after they have matured. This helps to ensure future steelhead runs along the Willamette River. Because native rainbows are increasingly rare and because habitat encroachment and urban development continues to infringe upon the livelihood of rainbow trout, areas like the Delta Ponds will help to ensure their survival. Likewise, steelhead genetic diversity continues to be an issue of great concern (Behnke, 1992). Therefore it is important to assess the current population of rainbow trout utilizing the Delta Ponds in order to foster the future livelihood of the species. The coastal rainbow trout display prominent spots with irregular shapes both above and below the lateral line of their sides. A rose-red band extends the length of the lateral line at mature ages. Dorsal and ventral rows are reduced or absent. There is a lack of differentiation between northern populations and more southerly rainbows. Coastal rainbow trout prefer swift waters of cool streams, though they will also gather in lakes and other still waters. They also tolerate the warmest waters of all trout species. Residential rainbows remain within the waters of their birth, while migratory rainbows travel. However, only steelhead are known to make long-term sea bound migrations where they spend several years in the depths of the Pacific Ocean (Behnke, 1992). Long since introduced, non-native runs of steelhead have an extensive history in the Willamette River. They migrate during the summer months for spawning and ensure a thriving population available to angler harvesting and watershed health. Their spawning is similar to chinook in that they seek out gravel beds and upper river waters. However, unlike the terminal lifecycle of the chinook, steelhead may return for several spawning cycles before they die. Once culverts are in place, the flow of water in the Delta Ponds may provide suitable stop-over habitat for migrating rainbows and steelhead. Additionally, because rainbow trout are so well suited for warmer temperatures, this native fish may thrive at the Delta Ponds in future years. Because all trout are predators, pond areas off of main
Rainbow Trout/Steelhead Source: Oregon Department of Fish and Wildlife
16
stream channels may provide adequate places for nourishment and shelter. The threats for juvenile residential rainbow trout are the same as with other species of trout and salmonids. Their fry and smolt are predated upon by invasive and native species alike. Additional threats to rainbow and steelhead populations exist in their direct interactions with their hatchery relatives, the largest threat may be introgression with stocked non-native rainbow trout and non-native summer steelhead (ODFW4). ‘Introgression’ refers to the diluting of purely native genes with those of hatchery relatives which are much less diverse. Additional Native Species of Interest
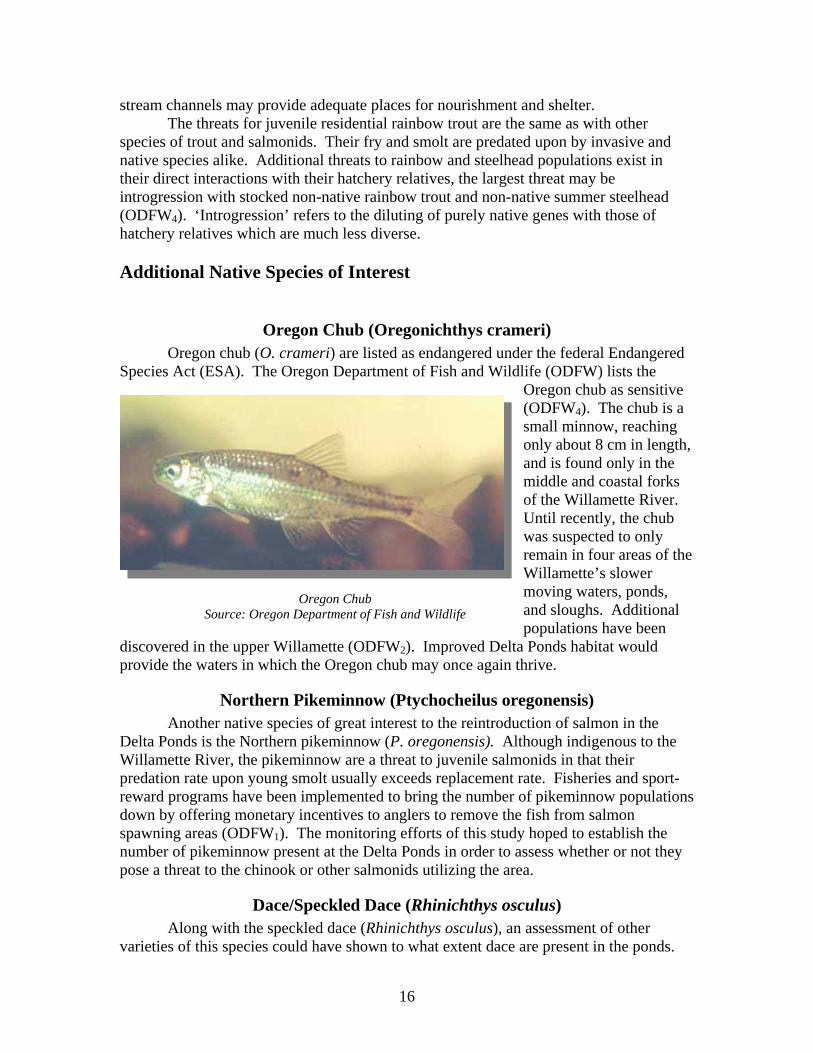
Oregon Chub (Oregonichthys crameri) Oregon chub (O. crameri) are listed as endangered under the federal Endangered Species Act (ESA). The Oregon Department of Fish and Wildlife (ODFW) lists the
Oregon chub as sensitive (ODFW4). The chub is a small minnow, reaching only about 8 cm in length, and is found only in the middle and coastal forks of the Willamette River. Until recently, the chub was suspected to only remain in four areas of the Willamette’s slower moving waters, ponds, and sloughs. Additional populations have been
discovered in the upper Willamette (ODFW2). Improved Delta Ponds habitat would provide the waters in which the Oregon chub may once again thrive.
Northern Pikeminnow (Ptychocheilus oregonensis) Another native species of great interest to the reintroduction of salmon in the Delta Ponds is the Northern pikeminnow (P. oregonensis). Although indigenous to the Willamette River, the pikeminnow are a threat to juvenile salmonids in that their predation rate upon young smolt usually exceeds replacement rate. Fisheries and sport-reward programs have been implemented to bring the number of pikeminnow populations down by offering monetary incentives to anglers to remove the fish from salmon spawning areas (ODFW1). The monitoring efforts of this study hoped to establish the number of pikeminnow present at the Delta Ponds in order to assess whether or not they pose a threat to the chinook or other salmonids utilizing the area.
Dace/Speckled Dace (Rhinichthys osculus) Along with the speckled dace (Rhinichthys osculus), an assessment of other varieties of this species could have shown to what extent dace are present in the ponds.
Oregon Chub Source: Oregon Department of Fish and Wildlife

17
For future monitoring efforts, establishing such populations will be key to the restoration of trout in the area as an abundant food source. Other noteworthy varieties of dace include the leopard dace (Rhinichthys falcatus) and the longnose dace (Rhinichthys cataracta). Speckled dace grow several inches in length. They are usually found along the edges of the rivers in shallow water and slower moving areas. Speckled dace are very common in the lower reaches of the McKenzie River but are also found in upper waters and in the Willamette watershed. Dace provide a good source of food for large trout (ODFW3). It is therefore important to establish an accurate number of dace at the Delta Ponds in order to assess whether or not a bountiful food source exists for the trout in the area.
Other Noteworthy Native Species Among the other native species investigated in our monitoring efforts but not included in depth in this report, the redside shiner (Richardsonius balteatus) is significant because it is prolific and thus offers a potential food source for various species of trout. Schools of up to several hundred fish can be found in small ponds and eddies. Redside shiners reach about 13 cm in length. They typically spawn in the spring (ODFW3). Additionally, the three-spined stickleback (Gasterosteus aculeatus) are most common in sloughs and backwaters. They only reach about 6 cm in length but they also provide food for larger predatory fish species (ODFW3). The chiselmouth (Acrocheilus alutaceus) is significant to note as a common Northwestern pond species, though it is not know whether the chiselmouth is present at the Delta Ponds. Non-native Species of Interest
Smallmouth Bass (Micropterus dolomieui) Smallmouth bass (Micropterus dolomieui) are native to the eastern and central states of North America and have been introduced to the west and to the Willamette River. They are both prolific and predaceous, tending to thrive in slower moving waters where warmer pools are present. Spawning occurs in the spring as cooler waters from higher elevation make its way downstream. The optimum temperature for egg deposition of this species is 16.1-18.3˚ C (UC Berkeley, 2004). The understanding of this temperature is key because it may be possible to curb embryonic survival rates by altering the temperatures at the Delta Ponds through the manipulation of inflow from the main channel of the Willamette.
Smallmouth Bass Source: Oregon Department of Fish and Wildlife

18
Largemouth Bass (Micropterus salmoides) Similar to the smallmouth bass, largemouth bass (Micropterus salmoides) are an invasive, warm water species and are highly predaceous, consuming anything that will fit into their gaping mouths. This includes turtles, frogs, and fish. As with the other predatory species listed above, it is essential to assess the population of largemouth bass at the Delta Ponds in order to ensure the livelihood of the salmon and trout in the area.
Channel Catfish (Ictaluruss punctatus) Channel catfish (Ictaluruss punctatus) are unique among the introduced fishes of Oregon and are easily distinguished from other fish by the smooth scaleless bodies. They have silver colored bodies and a deeply forked tail. Their head and chin are conspicuous by the unique fleshy barbells or whiskers. Channel catfish prefer to deposit eggs in undercut banks, hollow logs, and overhanging rocks (ODFW4). Channel catfish are bottom dwellers and bottom feeders, scavenging on primary producers at lower trophic levels but they have also been known to take juvenile fish. Channel catfish pose a threat to the juvenile salmonids through predation.
Other Noteworthy Non-native Species Overcrowding of warm water, non-native fish in the Delta Ponds warrants careful population assessment of each species. True sunfish, as in bluegill (Lepomis macrochirus), pumpkinseed (Lepomis gibbosus), and warmouth (Lepomis gulosus) are present in the Delta Ponds. They average 20 cm in length, though some can reach 30 cm. They nest in sand or gravel in shallow, slow water, and are highly prolific, often producing upwards of 27,000 eggs (ODFW4). All sunfish are highly adaptive and can be insatiable predators. Additionally, both white crappie (Pomoxis annularis) and black crappie (Pomoxis nigro-annularis) are also present in the Delta Ponds. Crappie are larger than the sunfish and therefore require a much larger diet. They are found in schools and nest in colonies and can produce up to 100,000 eggs. They are also voracious predators, consuming smaller fish and insects (ODFW4). The Walleye (Stizostedion vitreum) is a member of the perch family. It is not known whether the walleye is present at the Delta Ponds.
Assessment of the current fish population at the Delta Ponds has been critical in gaining a better understanding of how key species of fish can effectively be sustained or reintroduced. Several methods were employed in this monitoring: seining, fish trap surveys, and a fish derby. For the monitoring efforts of 2005, fish trap monitoring was slightly more inclusive than the seining efforts or the fish derby. Still, it should be noted that the fish trap outflow monitoring was limited to one location at the Delta Ponds, whereas the seining and fish derby were conducted at several locations. The monitoring of the trap included extensive information gathered over a longer period of time than the other methods (See Map 2).
3.2 Delta Ponds Outflow Monitoring

19
3.2.1 Monitoring Description
The trap is a two-way device designed to catch fish as they migrate through the Dedrick Slough in either direction. Volunteers checked the trap daily, collected information on all species found within the trap, and released the fish back into the slough in the direction they were originally traveling. The information was recorded on a
Map 2: Fish Trap
20
data collection sheet and later compiled onto a spreadsheet. 3.2.2 Data Summary
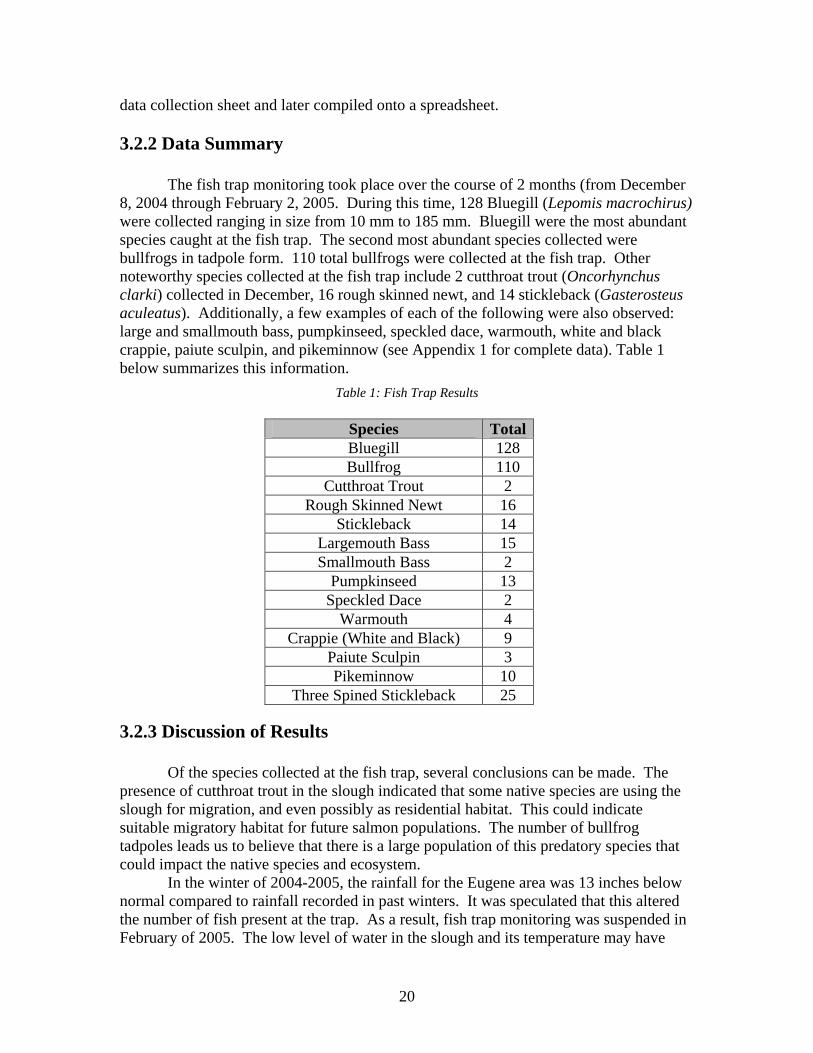
The fish trap monitoring took place over the course of 2 months (from December 8, 2004 through February 2, 2005. During this time, 128 Bluegill (Lepomis macrochirus) were collected ranging in size from 10 mm to 185 mm. Bluegill were the most abundant species caught at the fish trap. The second most abundant species collected were bullfrogs in tadpole form. 110 total bullfrogs were collected at the fish trap. Other noteworthy species collected at the fish trap include 2 cutthroat trout (Oncorhynchus clarki) collected in December, 16 rough skinned newt, and 14 stickleback (Gasterosteus aculeatus). Additionally, a few examples of each of the following were also observed: large and smallmouth bass, pumpkinseed, speckled dace, warmouth, white and black crappie, paiute sculpin, and pikeminnow (see Appendix 1 for complete data). Table 1 below summarizes this information.
Table 1: Fish Trap Results
3.2.3 Discussion of Results
Of the species collected at the fish trap, several conclusions can be made. The presence of cutthroat trout in the slough indicated that some native species are using the slough for migration, and even possibly as residential habitat. This could indicate suitable migratory habitat for future salmon populations. The number of bullfrog tadpoles leads us to believe that there is a large population of this predatory species that could impact the native species and ecosystem. In the winter of 2004-2005, the rainfall for the Eugene area was 13 inches below normal compared to rainfall recorded in past winters. It was speculated that this altered the number of fish present at the trap. As a result, fish trap monitoring was suspended in February of 2005. The low level of water in the slough and its temperature may have
Species TotalBluegill 128 Bullfrog 110
Cutthroat Trout 2 Rough Skinned Newt 16
Stickleback 14 Largemouth Bass 15 Smallmouth Bass 2
Pumpkinseed 13 Speckled Dace 2
Warmouth 4 Crappie (White and Black) 9
Paiute Sculpin 3 Pikeminnow 10
Three Spined Stickleback 25

21
contributed to a low level of activity for fish species throughout the ponds. It is important to note this when considering the results of the outflow monitoring. For future dry years, consider increasing the frequency of other monitoring methods such as seining or angler surveys to compensate for early closures of the fish trap. Volunteers may also want to consider hoop traps in the slough, because they can be operable in lower water levels than the fish trap.
Service Learning Program Students Checking the Fish Trap
Seining entailed using large nets to dredge regions of the pond collecting everything within its mesh. At this point, the catch was counted, cataloged, and recorded before it is released back into the ponds. Because this only happened in a few locations at a time, there were limits to this type of population sampling. For instance, temperatures may vary throughout the ponds and some species may favor other locations. If a certain species does not show up in a seining sample, this does not necessarily indicate their complete absence in the Delta Ponds. 3.3.1 Monitoring Description
Seining at the Delta Ponds consisted of dragging a large (75 ft.) net across two different areas of the ponds. The seine was spread out from shore out across the ponds via boat then semi-circled back to shore. Weights along the bottom of the seine enabled it to sink to the bottom of the ponds. Floats kept the top of the seine perched along the
3.3 Seining Survey

22
water’s surface. Between the floats and the weights the seine was dragged along a large portion of the mid-water of the ponds collecting any specimen that got in front of the net portion of the seine as it was dragged to the shore. Once gathered at the shore, the specimens within the net were collected and recorded. 3.3.2 Data Summary
Seining took place in the spring of 2005 on April 30, 2005. Fish biologist Erik Moberly of the Oregon Department of Fish and Wildlife conducted the seining efforts with the help of 6 volunteers. The seining occurred at the ponds, just north of Goodpasture Island Road. Three seines were conducted within one location. Of the three seines, a total of 11 fish collected. All of these were bluegill (Lepomis macrochirus) and they ranged in size from 39 mm to 125 mm. 6 of the 11 bluegill collected were collected in the second seine. Appendix 2 includes detailed seining results and Table 2 below summarizes this information.
3.3.3 Discussion of Results
An increase of aquatic vegetation in winter of 2005 may have altered fish seines conducted during the spring yielding low results. Also, because 6 of the 11 bluegill collected were collected in the second seine, it is important to note that this was the only seine conducted where the floats did not sink or the net did not become twisted. The results of this seine are fairly inconclusive because time and weather conditions did not allow for periodic seining over a longer period of time. The results here are not conclusive because other species, besides bluegill, have been found throughout the ponds. Therefore, it can be deduced that other seines are needed in order to draw accurate conclusions about the fish populations.
Pulling out the Seine
Table 2: Fish Seining Results
23
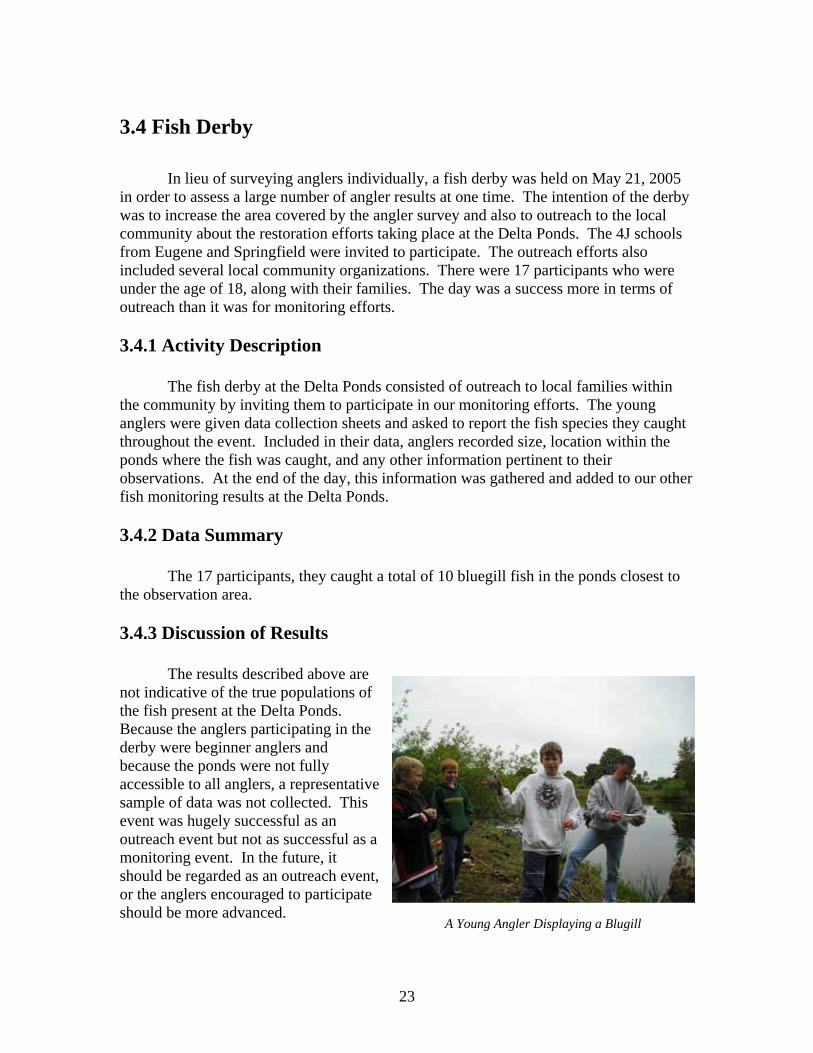
In lieu of surveying anglers individually, a fish derby was held on May 21, 2005 in order to assess a large number of angler results at one time. The intention of the derby was to increase the area covered by the angler survey and also to outreach to the local community about the restoration efforts taking place at the Delta Ponds. The 4J schools from Eugene and Springfield were invited to participate. The outreach efforts also included several local community organizations. There were 17 participants who were under the age of 18, along with their families. The day was a success more in terms of outreach than it was for monitoring efforts. 3.4.1 Activity Description
The fish derby at the Delta Ponds consisted of outreach to local families within the community by inviting them to participate in our monitoring efforts. The young anglers were given data collection sheets and asked to report the fish species they caught throughout the event. Included in their data, anglers recorded size, location within the ponds where the fish was caught, and any other information pertinent to their observations. At the end of the day, this information was gathered and added to our other fish monitoring results at the Delta Ponds. 3.4.2 Data Summary
The 17 participants, they caught a total of 10 bluegill fish in the ponds closest to the observation area. 3.4.3 Discussion of Results
The results described above are not indicative of the true populations of the fish present at the Delta Ponds. Because the anglers participating in the derby were beginner anglers and because the ponds were not fully accessible to all anglers, a representative sample of data was not collected. This event was hugely successful as an outreach event but not as successful as a monitoring event. In the future, it should be regarded as an outreach event, or the anglers encouraged to participate should be more advanced.
3.4 Fish Derby
A Young Angler Displaying a Blugill
24
Though the monitoring efforts in 2004-2005 went well overall, they can be improved in future monitoring years. The following recommendations should be considered when undertaking similar monitoring efforts at the Delta Ponds. Fish Trap
• Coordinate volunteers early and schedule them well in advance. • In the event that no fish are found during a daily visit, still have volunteers
complete the data collection sheet. • In the event that several fish are found (100+), have the volunteers record the
sizes of a random sample and note only the quantity of the others. • Compile data into spreadsheets monthly to minimize data entry errors and time. • Remove data collection sheets weekly for review and to avoid losing information. • Lock the lockbox to a stationary object (a tree or post). • During low flow (dry) years, consider increasing frequencies of other monitoring
efforts, like seining and angler surveys. Also consider smaller hoop traps. Fish Seining
• Coordinate volunteers and create a schedule early. • Scout locations ahead of time – at least one day in advance. • Look for areas free of aquatic vegetation. • Seine during times when aquatic vegetation is least prolific – early spring/late fall. • In the event that no fish are found during a seine still complete the data collection
sheet and note that no fish were found. • In the event that several fish are found (100+), have the volunteers record the sizes
of a random sample and note only the quantity of the others. • Compile data into spread sheets as soon as seining session is completed. • Seining should be done in relatively high frequency (every month when
conditions are favorable) to ensure a complete data set.
Fish Derby- Angler Survey:
• Coordinate volunteers and create a schedule early. • Encourage anglers to fish in all ponds to assess a wide range of locations. • Make data sheets available to anglers to take home with them that can be used at
another time. Include postage so that they can return their findings. • Host fish derby during a time when lots of anglers can be present (holiday-free
weekend). • Outreach fish derby at least one month in advance.
3.5 Recommendations for Future Monitoring
25
44..00 TTuurrttllee MMoonniittoorriinngg
The Delta Ponds area is one of a handful of locations in the Willamette Valley with a population of western pond turtles. Though there have historically been abundant populations of western pond turtles in the area, they have recently shown a startling drop in numbers (Holland, 1994). Much of this decline can be attributed to anthropogenic causes. Fortunately, the decline of the western pond turtle has been identified. With the identification and protection of habitat and the control of invasive species, current populations can be stabilized and potentially increased.
The goals of this monitoring project were: • To estimate the populations of western pond turtles and red eared sliders
in the Delta Ponds; and • To create monitoring plans that will facilitate future monitoring at the
Delta Ponds.
Key Species
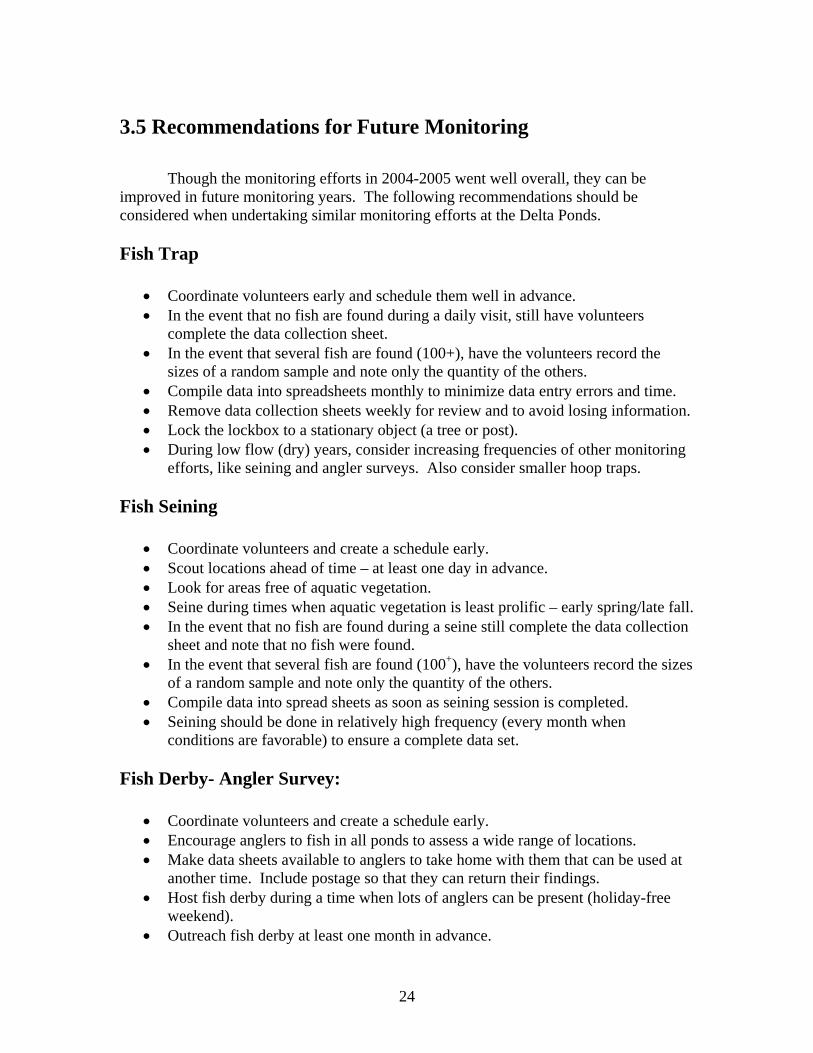
Western Pond Turtle (Clemmys Marmorata) The habitat of the western pond turtle has historically extended from British Columbia, down the Oregon coast, along the entire length of the California coast, and in to northern Mexico, with small subpopulations in Washington and the Willamette Valley of Oregon; see Map 3 for distribution (Todd, 1998). Due largely to the recent expansion of human development into turtle habitat, there has been a steep decline in western pond turtle populations. Both reptiles and amphibians tend to be delicate creatures, sensitive to changes in their environment, and slow to adapt (Lovich, 2002). The western pond turtle is struggling for survival as a species due to compounding issues of pollution, encroachment of development, and the introduction of novel invasive species. Some estimates claim that the western pond turtle has seen a decline of 96% in the Willamette Valley, to a current population of some 1,500 individuals (Holland, 1994). Some of these remaining individuals occupy the Delta Ponds. The western pond turtle is listed as a federal species of concern and a sensitive species in Oregon, and is one of only two turtle species indigenous to Oregon. Given the status of the western pond
4.1 Introduction
Map 3: Historic Range of Western Pond Turtles

26
turtle, it is important that efforts be made to protect remaining habitat. The western pond turtle grows to be around 200 millimeters in length, and has a dark brown coloration on the top, or carapace, of its shell. The chest plate, or plastron, is yellow in color. Males tend to be lighter in color, have a flatter shell, and have a concave plastron. Western pond turtles are opportunistic feeders. They will eat flowers, young plant shoots, insects, and small crustaceans, as well as carrion. Western pond turtles have been known to eat young ducklings, though it is not known if they were dead upon consumption. Males and juveniles tend to prefer a carnivorous diet, while females are more omnivorous (Holland 1994). Female western pond turtles lay their eggs in June or July in sandy, loose soils, with sparse vegetation. Nests are often located on south-facing slopes to maximize exposure to the sun during the incubation period. Females excavate nests with the hind legs after urinating on the nest site to give the soil a muddy texture. After depositing up to thirteen eggs, the female seals the nest with a mud plug, also fashioned with the hind legs. Nesting is one of the three occasions when these turtles leave the safety of their aquatic habitat, the others being occasional overland migration to other bodies of water
and over wintering. It is thought that turtles travel an average of 50 meters overland to find a nesting site (Holland, 1994). The eggs hatch in the fall, but the young turtles over winter in the nest, and do not leave until the warmer weather of the following spring arrives. During this time, the nest is susceptible to predation from a variety on animals including raccoons, dogs, and skunks. Once the young turtles emerge from the nest, they make their way toward the water where they seek refuge under vegetation in shallow areas along the shore. Western pond turtles utilize a variety of habitats throughout their range. The two main types of aquatic environments in which they are found are riverine and still water habitats. The presence of basking sites is a key factor in both types of aquatic habitat. In fact, basking sites are thought to be a limiting factor in turtle habitat. Like all reptiles, the western pond turtle is not able to
automatically thermoregulate, and therefore spends much of its time basking in the sun to keep its temperature at a suitable level. Rocks, logs, sandbanks, and emergent vegetation are all potential basking sites for the western pond turtle. Without these features, turtles cannot utilize an aquatic habitat (Todd, 1998). Appropriate nesting sites are also a key attribute for turtle habitat. Features of good nesting sites include sandy, loose soils with limited vegetative cover and a south-facing
University of Oregon Student with Western Pond Turtle

27
aspect. Turtles also need submerged and emergent vegetation for hiding places. The Delta Ponds provide suitable still water habitat, with potential access to the
main channel of the Willamette River. Turtles are often observed basking on logs in the summer months, and several nesting sites have been located along the shoreline. Unfortunately, there is significant development around the ponds including a mall, several main roads, apartment complexes, and business offices. These produce a disturbance to wildlife at the ponds through pollution, noise, and physical barriers. Numerous invasive species pose a threat to the western pond turtle at the Delta Ponds. In fact, predation by invasive species may be a key factor in the decline of western pond turtle populations. Bullfrogs prey on young turtles and thereby sharply reduce the numbers that reach adulthood. Armenian blackberry, which occupied much of the shoreline at the ponds until its recent removal, creates an obstacle for nesting females who are unable to penetrate its roots. Large and small mouth bass also pose a predatory threat to young turtles. Other Species of Interest
Red-Eared Slider (Trachemys scripta elegans) The red eared slider is a non-native aquatic turtle species that is common at the Delta Ponds. They are considered the most common reptile pet, and are often released by owners who no longer want them. They can grow to be a foot long and are characterized by yellow markings on their shell and bright red horizontal stripes behind each eye. Their presence at the ponds is important because they compete with the western pond turtle for food and basking sites (Pendergrass 2002). Red Eared Sliders prefer still water habitats, especially those with muddy bottoms. Cold temperatures are a limiting factor for their habitat usage. It is unclear what the effects of this competition are on the western pond turtle, but the native species undoubtedly has several disadvantages. Both species are opportunistic feeders, and both rely heavily on basking sites for thermoregulation, but the red eared slider grows to be much larger than the western pond turtle, giving it the advantage in confrontation. Female sliders lay larger clutches, and lay more often than female pond turtles, making them generally more prolific. Finally, sliders engage in “stacking” at their basking sites, a behavior that allows numerous turtles to utilize one site, though less effectively. Western pond turtles do not engage in this behavior and therefore need more basking sites per turtle.
Service Learning Program Team Member with Aggressive Red Eared Slider

28
Disease transmission occurs between red eared sliders and western pond turtles, and has been known to devastate native turtle populations (Pendergrass, 2002). Upper respiratory disease, or URD, is a common and very deadly disease observed in both species. It affects the lungs of the turtle and has an epidemic effect. This disease is highly contagious, and can wipe out entire populations of western pond turtles.
Overview of Monitoring Methods
In order to gain a better understanding of the population western pond turtles at the Delta Ponds, we set up a monitoring plan using several traps at key locations around the ponds. These aquatic traps were baited with dead fish, and checked daily for three weeks in the spring. The weight, length, and sex of each turtle was recorded, and each turtle was given a white mark on its back for future identification. At the end of the trapping period, a visual survey was conducted, using the shell markers, to determine the ratio of turtles that had been caught in the traps.
We know that the western pond turtle has experienced sharp population declines in the Willamette Valley and throughout its natural habitat. One of the issues facing western pond turtles is failure to recruit young into the breeding population. The imbalance in the age structure poses a serious threat to the longevity of the western pond turtle populations currently utilizing Delta Ponds. Several important factors have been implicated in causing this trend, all of which are largely anthropogenic and can be mitigated
4.2 Turtle Hatchling Survey
Map 4: Turtle Hatchling Survey

29
. 4.2.1 Survey Description
The purpose of this survey was to estimate how many, if any, newly hatched western pond turtles survived through their first year, in an effort to estimate recruitment of young western pond turtle in the population at the Delta Ponds. The survey consisted of visual observations in the shallow ponds near a popular nesting site (See Map 4). Young western pond turtles prefer shallow water areas with ample vegetation for refuge. 4.2.2 Results
No young western pond turtles were observed during the survey. This survey, however, was not conclusive about the presence or absence of young western pond turtles. 4.2.3 Discussion
Though no young western pond turtles were observed during this survey, we cannot conclude that there has been no recruitment in the western pond turtle population. Failure to observe young turtles can be accounted for by the limited area surveyed, the qualitative nature of the survey, the ability of western pond turtles to camouflage themselves, and their extremely elusive nature. Failure to recruit young is a serious problem in many populations of western pond turtles. Young turtles are subject to predation by many animals, including some invasive species such as the bullfrog and the largemouth bass. Nests are often predated by domestic dogs and raccoons. Turtles over a certain size are much less likely to be predated by these species. Adult turtles have almost no predators in the Delta Ponds. The river otter is probably the only animal that could successfully catch and kill a western pond turtle. It is unknown how many young turtles are lost before they reach this critical size. Recruitment of young turtles is vital to the success of the population of western pond turtles at the Delta Ponds. Obviously, turtles that are now adults will not be reproducing indefinitely. It is thought that once the current generation of western pond turtles has died off, there will be no turtles to replace them. This lack of recruitment is due to loss of adequate nesting sites due to development and predation of young turtles by invasive species.
The information collected in the study will be useful for several reasons. Few similar studies have been conducted at the Delta Ponds, and little previous data exists. Therefore, the current population levels at the ponds were entirely unknown. It was informative to gain an idea of the number of western pond turtles that utilize the habitat of the ponds, and to compare this information with studies done at other locations. This gave us insight into whether or not the turtles have reached the carrying capacity of the
4.3 Turtle Trapping and Visual Survey
30
ponds, and identified which factors, if any, are preventing them from reaching their potential for population growth. The data collected in this study also gave the City of Eugene a baseline from which to gauge the success of their restoration efforts. Future studies will reveal the relative success of the restoration to improve western pond turtle habitat at the ponds. 4.3.1 Monitoring Description
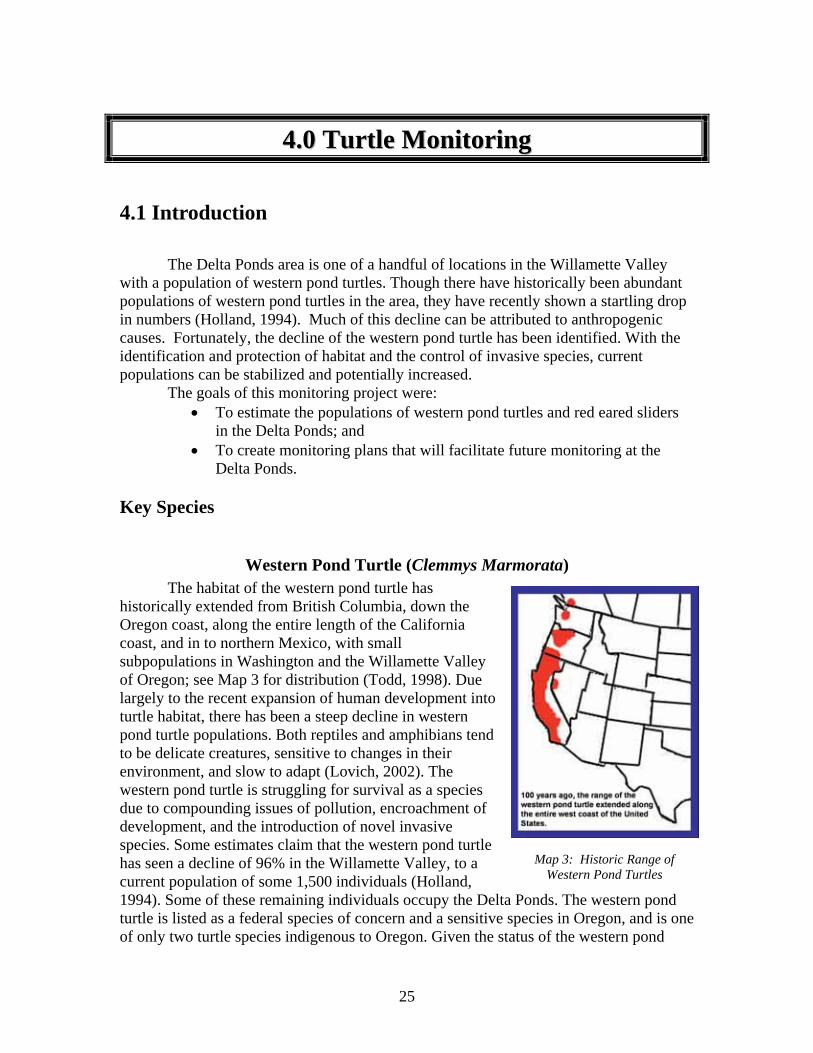
Monitoring of the western pond turtle was conducted through a combination of trapping and visual surveys. Trapping was conducted over a three-week period. Sixteen traps were installed at the ponds on April 23rd, 2005. Of the traps installed, seven were constructed of mesh netting, eight were constructed of metal caging, and one was constructed of black plastic mesh. The traps were baited with dead juvenile trout from a hatchery. Each trap was checked daily and re-baited as necessary. The traps were located in eight different ponds, with the intention of surveying the largest area possible (see Map 5). Each western pond turtle that was captured was weighed, measured for length, sexed, and marked. The marks were made on the carapace with white nail polish. Each turtle received four dots, each the size of a nickel, on each aspect of its carapace. These marks were used in the visual survey. Each red eared slider captured was weighed and measured for length. As per request of the City of Eugene and Oregon Department of Fish and Wildlife volunteers could choose to remove captured sliders from the ponds for euthanization. This choice was left to the discretion of the volunteers checking the trap each day. Those sliders that were not euthanized were marked with a three inch white circle on the top of the carapace and released. The purpose of the trapping was to catch and mark as many western pond turtles as possible. For this reason, traps were not located at random, but rather near basking structures that were likely to be frequented by turtles. For the visual portion of the survey, volunteers with binoculars surveyed the ponds for basking turtles. When western pond turtles were spotted basking, volunteers recorded the total number of turtles and the number that were marked with white paint. This survey was repeated three times. On the third survey, however, a complete observation of the ponds was not possible due to hot weather. Data from this survey was only complete for the ponds on the west side of Goodpasture Island Road. Using the ratio of marked and unmarked turtles observed during the visual survey, and the total number of individuals captured during the trapping, we were able to estimate the population of western pond turtles at the Delta Ponds.
University of Oregon Student Checking Metal Cage Turtle
Trap

31
4.3.2 Data Summary
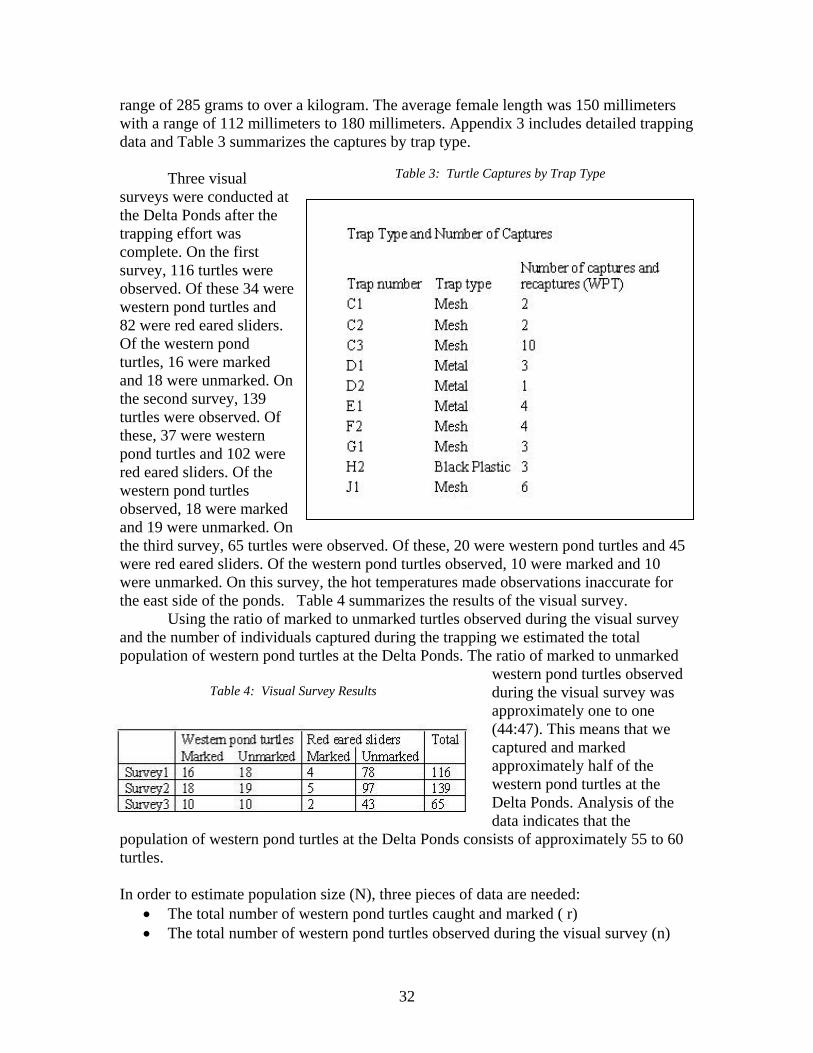
Over the three-week trapping period, we recorded 67 trappings at the Delta ponds. Of these, 21 were recaptures. Therefore, we captured 46 individuals. Of these 46 individuals 19 were red eared sliders and 27 were western pond turtles. Of the red eared sliders captured 7 were removed for euthanization. Of the western pond turtles captured, 10 were female, and 17 were male. The average male weight was 700 grams with a range of 270 grams to 940 grams. The average male length was 167 millimeters with a range of 145 millimeters to 195 millimeters. The average female weight was 618 grams with a
Map 5: Turtle Trap Locations
32
range of 285 grams to over a kilogram. The average female length was 150 millimeters with a range of 112 millimeters to 180 millimeters. Appendix 3 includes detailed trapping data and Table 3 summarizes the captures by trap type. Three visual surveys were conducted at the Delta Ponds after the trapping effort was complete. On the first survey, 116 turtles were observed. Of these 34 were western pond turtles and 82 were red eared sliders. Of the western pond turtles, 16 were marked and 18 were unmarked. On the second survey, 139 turtles were observed. Of these, 37 were western pond turtles and 102 were red eared sliders. Of the western pond turtles observed, 18 were marked and 19 were unmarked. On the third survey, 65 turtles were observed. Of these, 20 were western pond turtles and 45 were red eared sliders. Of the western pond turtles observed, 10 were marked and 10 were unmarked. On this survey, the hot temperatures made observations inaccurate for the east side of the ponds. Table 4 summarizes the results of the visual survey. Using the ratio of marked to unmarked turtles observed during the visual survey and the number of individuals captured during the trapping we estimated the total population of western pond turtles at the Delta Ponds. The ratio of marked to unmarked
western pond turtles observed during the visual survey was approximately one to one (44:47). This means that we captured and marked approximately half of the western pond turtles at the Delta Ponds. Analysis of the data indicates that the
population of western pond turtles at the Delta Ponds consists of approximately 55 to 60 turtles. In order to estimate population size (N), three pieces of data are needed:
• The total number of western pond turtles caught and marked ( r) • The total number of western pond turtles observed during the visual survey (n)
Table 3: Turtle Captures by Trap Type
Table 4: Visual Survey Results

33
• The total number of western pond turtles observed during the visual survey that were marked (m)
To find N N= (r*n)/m
r = 27 n =91 m =44
N= (27*91)/44= 56 western pond turtles
Using the same method, we estimated the population of red eared sliders in the Delta Ponds to be roughly 330 turtles. This estimate is less accurate due to a more imbalanced ratio of turtles captured to turtles observed (19:229). However, it does give us some idea of the population of sliders in the ponds. Ponds E and D are estimated to have 12 western pond turtles, pond C, 21 turtles, pond F, 2 turtles, pond J, 5 turtles, pond L, 7 turtles, and ponds G and H, 19 turtles. The population estimate by pond is slightly different for the estimate of the entire area due to the fact that western pond turtles apparently travel between ponds, and thus alter the estimate. See Table 5 for a summary of these results and Appendix 4 for detailed data analysis. 4.3.3 Discussion of Results
It is difficult to say whether or not the western pond turtle has reached its population maximum in the Delta Ponds. More than likely it has not, and the population would grow if invasive predator species such as the bullfrog were not a threat. Also, the population of western pond turtles would probably be larger if there were less competition from red eared sliders for food, basking structures, and nesting sites. Certainly, recruitment of young is a significant problem for this population of western pond turtles, and will continue to be for some time into the future. The length data of the western pond turtles indicated that few small, younger turtles reside in the ponds. The trapping at the Delta Ponds was largely a success, despite several setbacks. We caught a significant percentage of the western pond turtle population, which means that our population estimate will be more accurate. We encountered several problems during the course of the survey and learned many valuable lessons along the way. The most notable issue that we encountered was the preferential differences of the turtles for
Table 5: Western Pond Turtle Populations
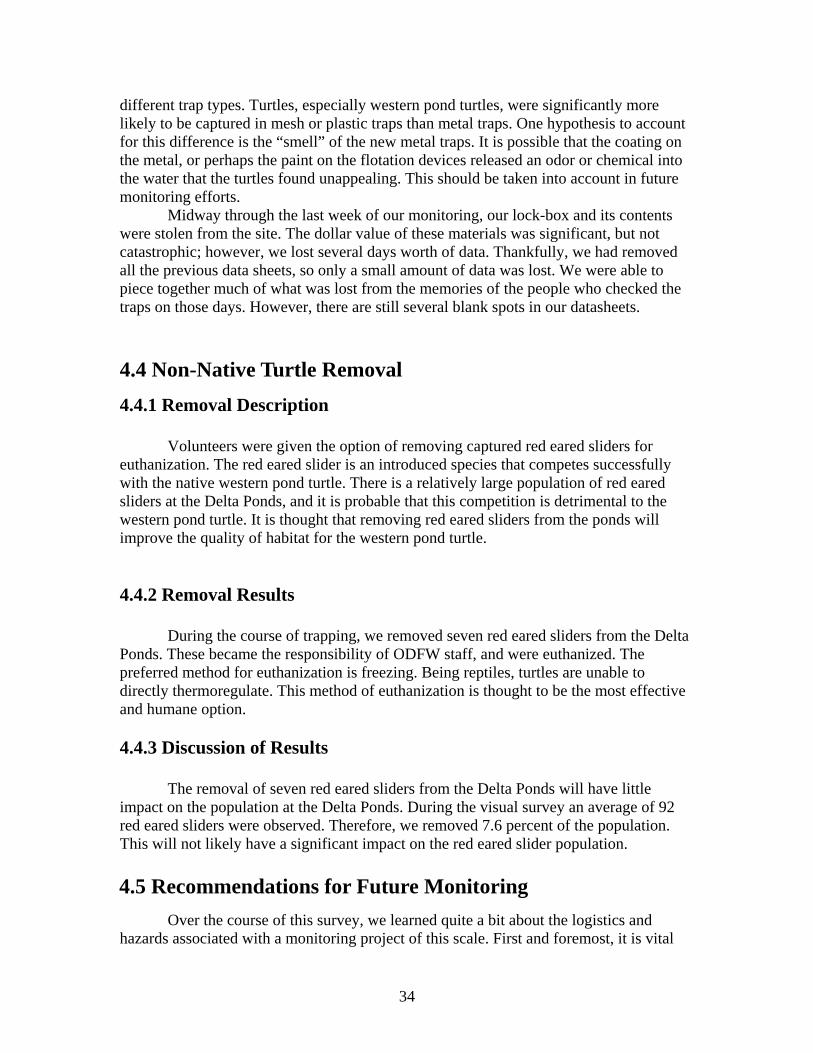
34
different trap types. Turtles, especially western pond turtles, were significantly more likely to be captured in mesh or plastic traps than metal traps. One hypothesis to account for this difference is the “smell” of the new metal traps. It is possible that the coating on the metal, or perhaps the paint on the flotation devices released an odor or chemical into the water that the turtles found unappealing. This should be taken into account in future monitoring efforts. Midway through the last week of our monitoring, our lock-box and its contents were stolen from the site. The dollar value of these materials was significant, but not catastrophic; however, we lost several days worth of data. Thankfully, we had removed all the previous data sheets, so only a small amount of data was lost. We were able to piece together much of what was lost from the memories of the people who checked the traps on those days. However, there are still several blank spots in our datasheets.
4.4.1 Removal Description
Volunteers were given the option of removing captured red eared sliders for euthanization. The red eared slider is an introduced species that competes successfully with the native western pond turtle. There is a relatively large population of red eared sliders at the Delta Ponds, and it is probable that this competition is detrimental to the western pond turtle. It is thought that removing red eared sliders from the ponds will improve the quality of habitat for the western pond turtle.
4.4.2 Removal Results
During the course of trapping, we removed seven red eared sliders from the Delta Ponds. These became the responsibility of ODFW staff, and were euthanized. The preferred method for euthanization is freezing. Being reptiles, turtles are unable to directly thermoregulate. This method of euthanization is thought to be the most effective and humane option. 4.4.3 Discussion of Results
The removal of seven red eared sliders from the Delta Ponds will have little impact on the population at the Delta Ponds. During the visual survey an average of 92 red eared sliders were observed. Therefore, we removed 7.6 percent of the population. This will not likely have a significant impact on the red eared slider population.
Over the course of this survey, we learned quite a bit about the logistics and hazards associated with a monitoring project of this scale. First and foremost, it is vital
4.4 Non-Native Turtle Removal
4.5 Recommendations for Future Monitoring
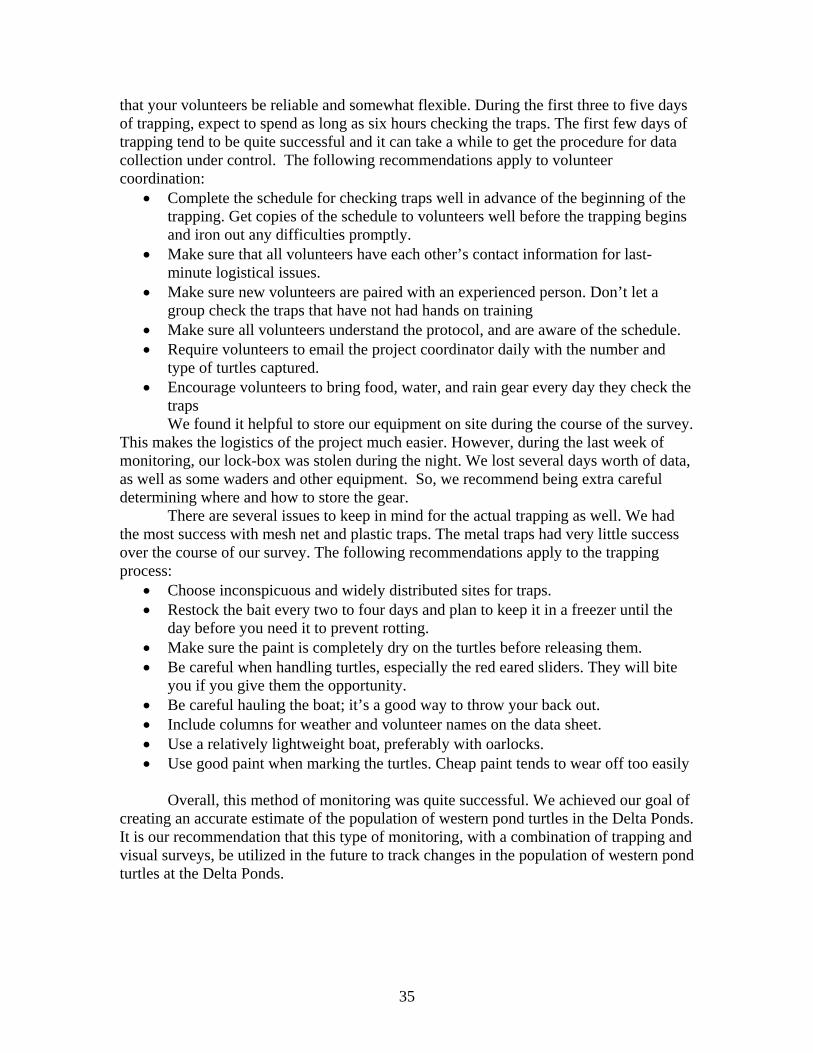
35
that your volunteers be reliable and somewhat flexible. During the first three to five days of trapping, expect to spend as long as six hours checking the traps. The first few days of trapping tend to be quite successful and it can take a while to get the procedure for data collection under control. The following recommendations apply to volunteer coordination:
• Complete the schedule for checking traps well in advance of the beginning of the trapping. Get copies of the schedule to volunteers well before the trapping begins and iron out any difficulties promptly.
• Make sure that all volunteers have each other’s contact information for last-minute logistical issues.
• Make sure new volunteers are paired with an experienced person. Don’t let a group check the traps that have not had hands on training
• Make sure all volunteers understand the protocol, and are aware of the schedule. • Require volunteers to email the project coordinator daily with the number and
type of turtles captured. • Encourage volunteers to bring food, water, and rain gear every day they check the
traps We found it helpful to store our equipment on site during the course of the survey. This makes the logistics of the project much easier. However, during the last week of monitoring, our lock-box was stolen during the night. We lost several days worth of data, as well as some waders and other equipment. So, we recommend being extra careful determining where and how to store the gear. There are several issues to keep in mind for the actual trapping as well. We had the most success with mesh net and plastic traps. The metal traps had very little success over the course of our survey. The following recommendations apply to the trapping process:
• Choose inconspicuous and widely distributed sites for traps. • Restock the bait every two to four days and plan to keep it in a freezer until the
day before you need it to prevent rotting. • Make sure the paint is completely dry on the turtles before releasing them. • Be careful when handling turtles, especially the red eared sliders. They will bite
you if you give them the opportunity. • Be careful hauling the boat; it’s a good way to throw your back out. • Include columns for weather and volunteer names on the data sheet. • Use a relatively lightweight boat, preferably with oarlocks. • Use good paint when marking the turtles. Cheap paint tends to wear off too easily
Overall, this method of monitoring was quite successful. We achieved our goal of creating an accurate estimate of the population of western pond turtles in the Delta Ponds. It is our recommendation that this type of monitoring, with a combination of trapping and visual surveys, be utilized in the future to track changes in the population of western pond turtles at the Delta Ponds.

36
55..00 OOtthheerr AAmmpphhiibbiiaann MMoonniittoorriinngg
The Delta Ponds are provide a critical habitat for many species of amphibians. In this study we focused our surveys on the rough skinned newt (Taricha granulosa), the northwestern salamander (Ambystoma gracile), the red-legged frog (Rana aurora), and the Pacific chorus frog (Hyla regilla). The monitoring surveys we performed required specific techniques for each species and provided information on the size and health of each population. The goals of these surveys were to:
• Assess the presence and abundance of the species listed; • Identify key areas of habitat being utilized by each species; and • Develop protocols and procedures detailing each task.
Key Species
Rough Skinned Newt (Taricha granulosa) The rough-skinned newt is native to the Pacific Northwest. It is very common in the area and seen in a range of environments. Its needs are more general than other salamander species, and therefore it is able to survive and flourish in relatively diverse habitats. This species is important to the area due to its widespread abundance and familiarity. It faces the threat of increased development infringing upon its habitat. This study will provide the baseline information on the population at Delta Ponds to be compared with the findings from future monitoring efforts during and after restoration efforts. It is important to track its abundance because, being a generalist, this species is often an indicator for the health of the system in which it is found.
The rough-skinned newt’s distinct appearance makes it easily recognizable. It ranges from light to dark brown with bright orange to yellow coloration on its ventral, or bottom, side. It is a fairly large species, ranging from five to seven inches as an adult. Its skin is very granular and not slimy to the touch. The grainy appearance is caused by thousands of toxin glands under the skin. These glands secrete toxins at all times, especially when the individual is bothered, and serve as its first line of defense against predation. A large individual contains enough toxins to kill two and a half adult humans if ingested. This does not typically occur, however effects will be felt if rough-skinned newts come into contact with sensitive skin such as the mouth and tongue.
5.1 Introduction
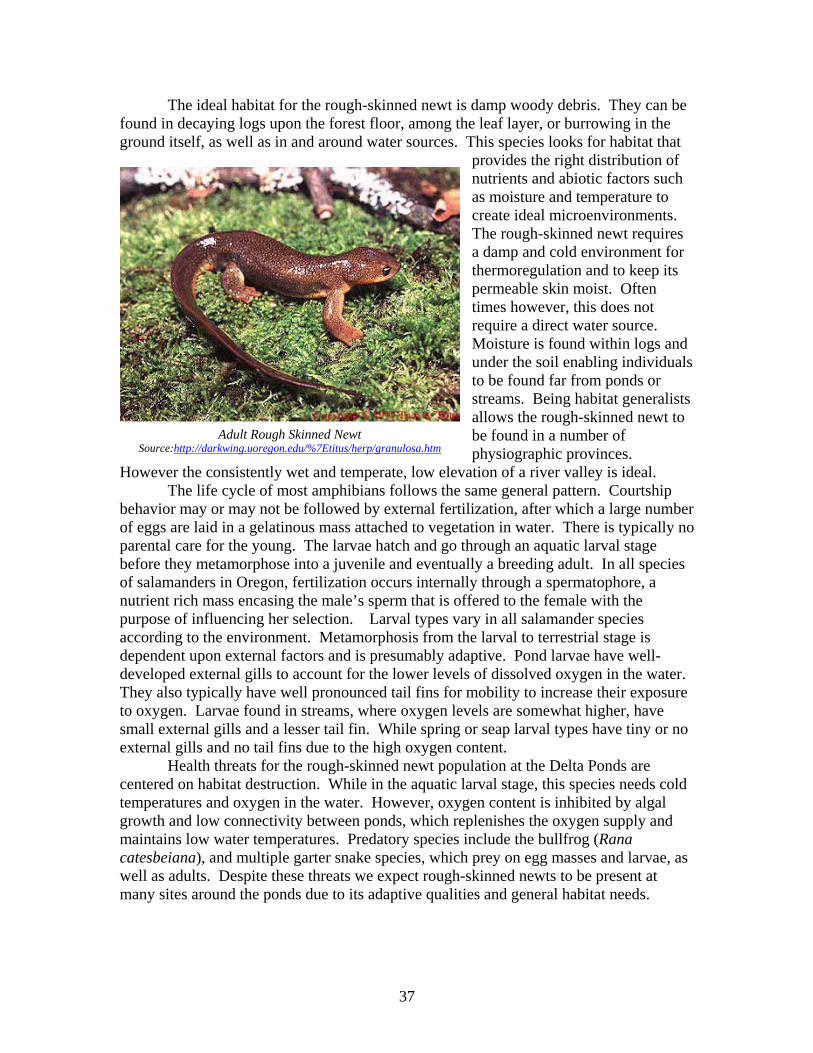
37
The ideal habitat for the rough-skinned newt is damp woody debris. They can be found in decaying logs upon the forest floor, among the leaf layer, or burrowing in the ground itself, as well as in and around water sources. This species looks for habitat that
provides the right distribution of nutrients and abiotic factors such as moisture and temperature to create ideal microenvironments. The rough-skinned newt requires a damp and cold environment for thermoregulation and to keep its permeable skin moist. Often times however, this does not require a direct water source. Moisture is found within logs and under the soil enabling individuals to be found far from ponds or streams. Being habitat generalists allows the rough-skinned newt to be found in a number of physiographic provinces.
However the consistently wet and temperate, low elevation of a river valley is ideal. The life cycle of most amphibians follows the same general pattern. Courtship
behavior may or may not be followed by external fertilization, after which a large number of eggs are laid in a gelatinous mass attached to vegetation in water. There is typically no parental care for the young. The larvae hatch and go through an aquatic larval stage before they metamorphose into a juvenile and eventually a breeding adult. In all species of salamanders in Oregon, fertilization occurs internally through a spermatophore, a nutrient rich mass encasing the male’s sperm that is offered to the female with the purpose of influencing her selection. Larval types vary in all salamander species according to the environment. Metamorphosis from the larval to terrestrial stage is dependent upon external factors and is presumably adaptive. Pond larvae have well-developed external gills to account for the lower levels of dissolved oxygen in the water. They also typically have well pronounced tail fins for mobility to increase their exposure to oxygen. Larvae found in streams, where oxygen levels are somewhat higher, have small external gills and a lesser tail fin. While spring or seap larval types have tiny or no external gills and no tail fins due to the high oxygen content. Health threats for the rough-skinned newt population at the Delta Ponds are centered on habitat destruction. While in the aquatic larval stage, this species needs cold temperatures and oxygen in the water. However, oxygen content is inhibited by algal growth and low connectivity between ponds, which replenishes the oxygen supply and maintains low water temperatures. Predatory species include the bullfrog (Rana catesbeiana), and multiple garter snake species, which prey on egg masses and larvae, as well as adults. Despite these threats we expect rough-skinned newts to be present at many sites around the ponds due to its adaptive qualities and general habitat needs.
Adult Rough Skinned Newt Source:http://darkwing.uoregon.edu/%7Etitus/herp/granulosa.htm

38
Northwestern Salamander (Ambystoma gracile) The northwestern salamander is native to the Pacific Northwest, ranging from Southeastern Alaska to Northern California. However, its distribution does not reach east of the Cascade Mountains. As a native amphibian this species is important in gauging the effects of development and global warming in the region. Amphibians are often the first animals to bear the effects of human population growth and development, as their health is dependent upon the health of their habitat. The data collected in this study will be important to measure the progression of these trends. The northwestern salamander is large is size, reaching up to 22 cm in length. They are very dark in color, from brown or gray to black dorsally and lighter brown on its ventral side (Romansic). The presence of conspicuous glands along the ridge of its tail and at the rear of its head is a characteristic that makes this species distinct among other salamanders. The concentrations of granular glands make up the tail ridge, while large paratoid glands sit just behind the eyes on its head. Another specialized characteristic of the species is a large head with small eyes. It sometimes has noticeable white or yellowish spots on its body, although this is usually designated as a separate subspecies, A. gracile decorticatum, the British Columbia Salamander, found north of the dividing line at 51 degrees latitude. It is common for this species to forgo metamorphosis and instead mature as aquatic larvae, called neotenic adults. They may reach up to 26 cm and are lighter in color, brown to olive green, with mottled yellow and black (Romansic). These neotenic adults are strictly aquatic and retain gills; the adult males have hypertrophied hind limbs and feet, are less spotted, and have an enlarged glandular ridge on the tail (Romansic). Neotenic adults are found at a higher frequency at higher elevations (common in all species of salamanders), to accommodate harsher conditions and a shorter breeding season. During the breeding season both terrestrial and neotenic adult males become much darker than females (Romansic). Northwestern salamander larvae are characteristic of pond type larvae, having large elongated gills, long toes, and an enlarged tail fin. When hatched they average around 8 mm in length. Habitat requirements for the Northwestern salamander are similar to the rough skinned newt- very moist grasslands and forests. Adults are mostly fossorial, adapted for digging and burrowing, and typically only found at the surface during fall rains and spring migrations to their aquatic breeding sites (Romansic). However, like the rough skinned newt, the northwestern salamander is often found under logs and forest debris. This species of salamander is very defensive when threatened. Its glands located on the
Adult Northwestern Salamander Source: William Flaxington, Field Observations of Calif.
Amphibians and Reptiles

39
head, back, and tail will secrete a white sticky toxin as it assumes a head butting posture with its tail elevated in order to apply the toxin to the attacker. This is only common in terrestrial adults, as larvae and neotenic adults flee from predators. Northwestern salamanders breed in permanent or semi-permanent waters, ranging from ponds to lakes, or side pools of streams. Breeding takes place in the spring after an elaborate courtship ritual. At the culmination of courtship the female may accept or reject a spermatophore from the male. Fertilization occurs internally upon acceptance. Embryo development time varies according to water temperature; this can range from two to nine weeks (Romansic). Metamorphosis does not occur for another 12 to 14 months. At high elevations, larvae don’t transform until their third year (Romansic). The status of the northwestern salamander is unknown. There are no declines apparent in Canada (Romansic). Multiple studies have found there to be less species abundance in young forests, as opposed to old-growth stands, however the results are unclear. It is generally accepted that clear-cutting has a negative effect on population, as it renders habitat unsuitable for salamanders. It is also speculated that the effects of global warming and increased aridity will reduce breeding habitat and lead to decreased survival (Romansic).
Red-Legged Frog (Rana aurora) The red-legged frog is also native to the Pacific Northwest, ranging from southwestern British Columbia to northern California in coastal areas west of the Cascades Mountains. They are a medium sized frog with smooth brown to reddish skin marked with black “freckles” (Red). Male frogs can reach up to 7 cm while females, the larger of the two, can reach up to 10 cm in length. Red-legged frogs usually have a dark “mask” running across their eyes and the sides of their head, as well as a light upper jaw stripe that runs back to the shoulder (Red). The distinctive reddish coloration of the ventral legs and belly is what gives this species its name. The orientation of its eyes sets this species apart from another native species, the Columbia or Oregon spotted frog. Red-legged frog eyes are gold and oriented to the sides, while spotted frog eyes are oriented upward (Red). Also, the red coloration in Red-legged frogs appears translucent while spotted frogs coloration is more opaque (Red). The two species only overlap in their distribution in British Columbia, so usually their identification can be determined by their location. In both regions of its habitat, however, this species is on the decline. Conservation efforts are very important as its abundance continues to decrease and habitats are in a critical state of need. Red-legged frogs are found in cool coastal or temperate forests and wetlands. They require very moist environments with plentiful shade. They breed in shallow ponds and streams that are well shaded (Red). Adults, however, will stray far from water if conditions are damp. They will often seek shelter under logs or debris to stay moist. The mating season for red-legged frogs is early spring – as early as January or February in coastal areas where the season is wetter earlier (Red). Like most other male species, red-legged frog males vocalize to females during the breeding season. Unlike others, however, they do so underwater. It is a very low-pitched sound, often described as a stuttering noise (Red). Reproduction takes place externally through a courtship ritual called amplexus, which mimics copulation but only influences the female to release her eggs. The male fertilizes the eggs by releasing a sperm-filled fluid. The female lays her
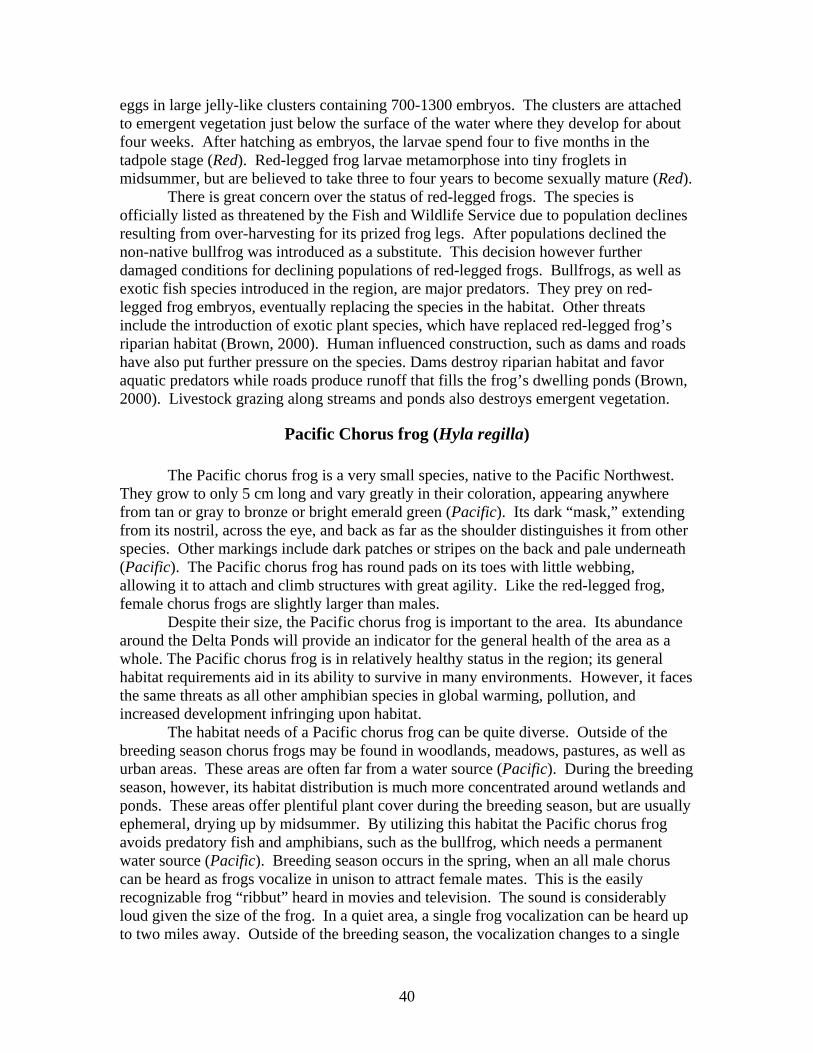
40
eggs in large jelly-like clusters containing 700-1300 embryos. The clusters are attached to emergent vegetation just below the surface of the water where they develop for about four weeks. After hatching as embryos, the larvae spend four to five months in the tadpole stage (Red). Red-legged frog larvae metamorphose into tiny froglets in midsummer, but are believed to take three to four years to become sexually mature (Red). There is great concern over the status of red-legged frogs. The species is officially listed as threatened by the Fish and Wildlife Service due to population declines resulting from over-harvesting for its prized frog legs. After populations declined the non-native bullfrog was introduced as a substitute. This decision however further damaged conditions for declining populations of red-legged frogs. Bullfrogs, as well as exotic fish species introduced in the region, are major predators. They prey on red-legged frog embryos, eventually replacing the species in the habitat. Other threats include the introduction of exotic plant species, which have replaced red-legged frog’s riparian habitat (Brown, 2000). Human influenced construction, such as dams and roads have also put further pressure on the species. Dams destroy riparian habitat and favor aquatic predators while roads produce runoff that fills the frog’s dwelling ponds (Brown, 2000). Livestock grazing along streams and ponds also destroys emergent vegetation.
Pacific Chorus frog (Hyla regilla) The Pacific chorus frog is a very small species, native to the Pacific Northwest. They grow to only 5 cm long and vary greatly in their coloration, appearing anywhere from tan or gray to bronze or bright emerald green (Pacific). Its dark “mask,” extending from its nostril, across the eye, and back as far as the shoulder distinguishes it from other species. Other markings include dark patches or stripes on the back and pale underneath (Pacific). The Pacific chorus frog has round pads on its toes with little webbing, allowing it to attach and climb structures with great agility. Like the red-legged frog, female chorus frogs are slightly larger than males. Despite their size, the Pacific chorus frog is important to the area. Its abundance around the Delta Ponds will provide an indicator for the general health of the area as a whole. The Pacific chorus frog is in relatively healthy status in the region; its general habitat requirements aid in its ability to survive in many environments. However, it faces the same threats as all other amphibian species in global warming, pollution, and increased development infringing upon habitat. The habitat needs of a Pacific chorus frog can be quite diverse. Outside of the breeding season chorus frogs may be found in woodlands, meadows, pastures, as well as urban areas. These areas are often far from a water source (Pacific). During the breeding season, however, its habitat distribution is much more concentrated around wetlands and ponds. These areas offer plentiful plant cover during the breeding season, but are usually ephemeral, drying up by midsummer. By utilizing this habitat the Pacific chorus frog avoids predatory fish and amphibians, such as the bullfrog, which needs a permanent water source (Pacific). Breeding season occurs in the spring, when an all male chorus can be heard as frogs vocalize in unison to attract female mates. This is the easily recognizable frog “ribbut” heard in movies and television. The sound is considerably loud given the size of the frog. In a quiet area, a single frog vocalization can be heard up to two miles away. Outside of the breeding season, the vocalization changes to a single
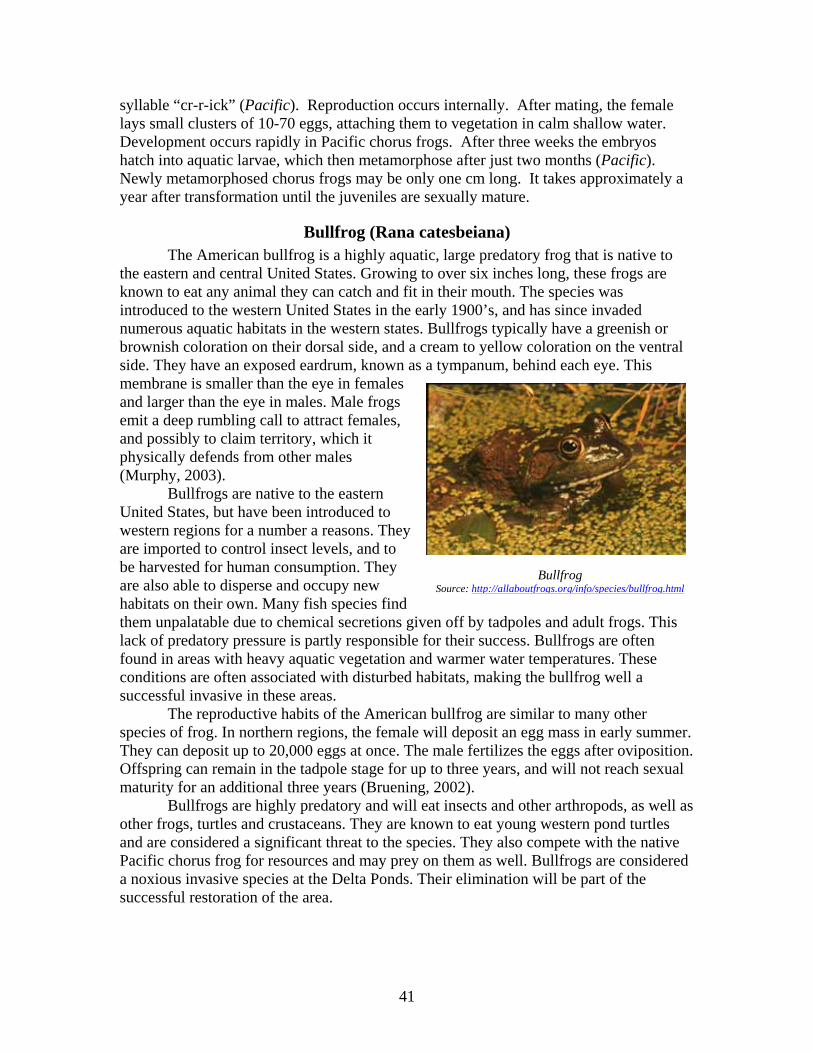
41
syllable “cr-r-ick” (Pacific). Reproduction occurs internally. After mating, the female lays small clusters of 10-70 eggs, attaching them to vegetation in calm shallow water. Development occurs rapidly in Pacific chorus frogs. After three weeks the embryos hatch into aquatic larvae, which then metamorphose after just two months (Pacific). Newly metamorphosed chorus frogs may be only one cm long. It takes approximately a year after transformation until the juveniles are sexually mature.
Bullfrog (Rana catesbeiana) The American bullfrog is a highly aquatic, large predatory frog that is native to
the eastern and central United States. Growing to over six inches long, these frogs are known to eat any animal they can catch and fit in their mouth. The species was introduced to the western United States in the early 1900’s, and has since invaded numerous aquatic habitats in the western states. Bullfrogs typically have a greenish or brownish coloration on their dorsal side, and a cream to yellow coloration on the ventral side. They have an exposed eardrum, known as a tympanum, behind each eye. This membrane is smaller than the eye in females and larger than the eye in males. Male frogs emit a deep rumbling call to attract females, and possibly to claim territory, which it physically defends from other males (Murphy, 2003).
Bullfrogs are native to the eastern United States, but have been introduced to western regions for a number a reasons. They are imported to control insect levels, and to be harvested for human consumption. They are also able to disperse and occupy new habitats on their own. Many fish species find them unpalatable due to chemical secretions given off by tadpoles and adult frogs. This lack of predatory pressure is partly responsible for their success. Bullfrogs are often found in areas with heavy aquatic vegetation and warmer water temperatures. These conditions are often associated with disturbed habitats, making the bullfrog well a successful invasive in these areas.
The reproductive habits of the American bullfrog are similar to many other species of frog. In northern regions, the female will deposit an egg mass in early summer. They can deposit up to 20,000 eggs at once. The male fertilizes the eggs after oviposition. Offspring can remain in the tadpole stage for up to three years, and will not reach sexual maturity for an additional three years (Bruening, 2002).
Bullfrogs are highly predatory and will eat insects and other arthropods, as well as other frogs, turtles and crustaceans. They are known to eat young western pond turtles and are considered a significant threat to the species. They also compete with the native Pacific chorus frog for resources and may prey on them as well. Bullfrogs are considered a noxious invasive species at the Delta Ponds. Their elimination will be part of the successful restoration of the area.
Bullfrog Source: http://allaboutfrogs.org/info/species/bullfrog.html

42
Overview of Monitoring Methods
The data collected in this study is the first step in the multi-year process of restoration. It will provide a baseline for future monitoring efforts at the Delta Ponds. Future volunteers can use the monitoring techniques we have developed to survey after the restoration work has occurred in order to determine if it has positively or negatively effected the amphibian population at Delta Ponds. The task of monitoring salamanders at the Delta Ponds involved a sampling technique using artificial cover objects (ACOs). In our study we used plywood pieces placed at designated sites around the ponds in order to create ideal habitat locations for salamanders to inhabit. The presence and abundance of salamanders at these sites provided an estimate of the size of the overall population. The use of plywood is not required for this task. Any material that can create a microenvironment under it will suffice. A number of materials can be used for this purpose. However, the pieces must be placed in advance of monitoring in order to allow decay to occur and a microenvironment to form; this typically takes two to three weeks. The sites were then checked periodically for the presence and abundance of salamanders at each. Data information including species and abundance, as well as each individual’s length, an indicator of health and age distribution, are collected and recorded. Other important data to record is the presence of other species, such as rodents, snakes, or other amphibians and the conditions at each site.
The monitoring of frog species at the ponds is performed using multiple methods of observation. Frogs offer surveying challenges due to their nature. Small, slimy, reclusive animals are difficult to catch and handle. Our survey methods for red-legged frog do not require the handling of the individuals themselves. Instead, we monitor the presence of its egg masses throughout the ponds in order to get an estimate of the species population. This enables us to avoid the troublesome task of catching a representative sample of this sometimes rare and reclusive species. The egg masses can be seen attached to vegetation at the surface of the ponds. They must be distinguished from other amphibian egg masses, such as salamanders and bullfrogs that may be present. Using boats to search the banks of the ponds the location of each egg mass and its condition is recorded. This way, the same egg masses can be checked each time and its progress through development monitored. Predation may be evident or the eggs may hatch which
Salamander Study Artificial Cover Object (ACO)

43
gives us an indication of other species that may be present and the age distribution of the next generation. The findings are recorded onto a map, which shows the spatial distribution of the population at the ponds and gives an indication of the quality and abundance of habitat present. Monitoring of our other key frog species, the Pacific chorus frog, was performed using vocalization surveys. This was the most difficult species to locate and catch at the site. In order to avoid this problem, we observed the frog’s vocalization activity to obtain an estimation of the species population. Each species of frog has a distinct call, which allowed us to monitor its presence. Pacific chorus frogs were heard throughout the ponds. In order to standardize the monitoring process, a listening route was established around the ponds and listening posts were designated where vocalizations could be heard. The presence and abundance of frog calls was then recorded at each site. It was important to record all vocalizations heard as they may have represented other species. Listeners were prepared and familiarized with the call from Pacific chorus frogs prior to observing in order to accurately identify the species. Although only the males in the population make vocalizations, this method provided an estimate of its overall size.
The data collected in this study is the first step in the multi-year process of restoration. It will provide a baseline for future monitoring efforts at the Delta Ponds. From our work the City of Eugene will have a thorough understanding of the health, abundance, and locations of salamander species at the ponds and their prime areas of habitat. They can then refine the restoration work that is to occur after our data is collected according to our findings, concentrating efforts in certain areas, and avoided construction in areas designated as critical habitat. 5.2.1 Survey Description
The salamander survey provided data on the species present at the Delta Ponds and their distribution. From the data gathered, areas of prime habitat where salamanders are concentrated were identified. This information provided guidance as to which areas are important to preserve throughout restoration and avoid in future construction. This task involved the placement of artificial cover objects (ACOs) around the ponds in order to provide artificial terrestrial habitat to be utilized by the salamanders at the ponds. The ACOs were then checked periodically for the presence and abundance of two specific species – the rough-skinned newt, and the northwestern salamander. The ACOs were placed around the ponds three weeks prior to monitoring in locations chosen for their variety of conditions. The sites provided a diverse set of environments, which also helped determine what conditions salamanders prefer at the ponds. The sites spanned the majority of the ponds area, as shown in Map 6. The ACOs were placed three weeks in advance of monitoring in order to allow decomposition to occur, as salamanders require very moist terrestrial habitat, often under decomposed debris. Data collection was performed by lifting the ACOs and briefly capturing the
5.2 Salamander Survey

44
Map 6: Salamander Survey Areas
species present. After data was recorded, the species were released to the area from which they came.
45
5.2.2 Survey Results
The first observation of the survey sites took place March 4th and was attended by Haley Harguth, Rhonda Zimlich, and Mona Jones. No salamanders were found at any of the twelve sites around the ponds. Conditions were extremely dry, and decomposition had yet to occur under the ACO’s, with the exception of a few sites. The second monitoring took place on March 11th, attended by Haley Harguth, Rhonda Zimlich, and Stream Team volunteer, Brandi Ferguson. Conditions had not changed from the previous week and again, no salamanders were found. Sites 1-5 were not checked due to time constraints and the consistency of our findings at the other sites. Due to unfavorable conditions, monitoring was delayed until further rain was received in the area. On April 4th, the sites were checked again for salamanders. Haley Harguth and Stream Team volunteers, Tom Bettman, Hal Hushbeck, and Jennifer Rice attended the event. All twelve sites were monitored, but again no salamanders were found. However, conditions did appear to have become more conducive to salamander habitat in some areas due to recent rain. After the third attempt at monitoring without any observations of salamanders it was decided to cancel any further scheduling of monitoring until conditions make a noticeable improvement. Students from Spencer’s Butte Middle School checked the sites a final time May 26th during their field trip to the site for the Middle School Day of Caring. No salamanders were found and sites 8 and 11 had floated away in recent high-water events. 5.2.3 Discussion of Results
Our results for this task were significantly affected by the abnormally warm and dry weather this winter. The data gathered may not be a representative sample of the species inhabiting the Delta Ponds as planned. Any comparison of future data may not be accurate due to the abnormal season. However this season may only be an inclination as to the future weather patterns for the area. Either way, the data is skewed and must be considered as such in future analysis. It is suspected that salamanders do inhabit the Delta Ponds. The site provides good amphibian habitat in most areas. Salamander larvae are highly adaptable to their environmental conditions. The lack of fast moving, highly oxygenated water is not a large deterrent. The dry conditions however may have significantly decreased the abundance and availability of habitat, making survival more difficult. The ACOs should continually be monitored throughout the year and following years to determine if the results from this survey are indeed an anomaly, or an actual representation of degrading amphibian habitat at the ponds.
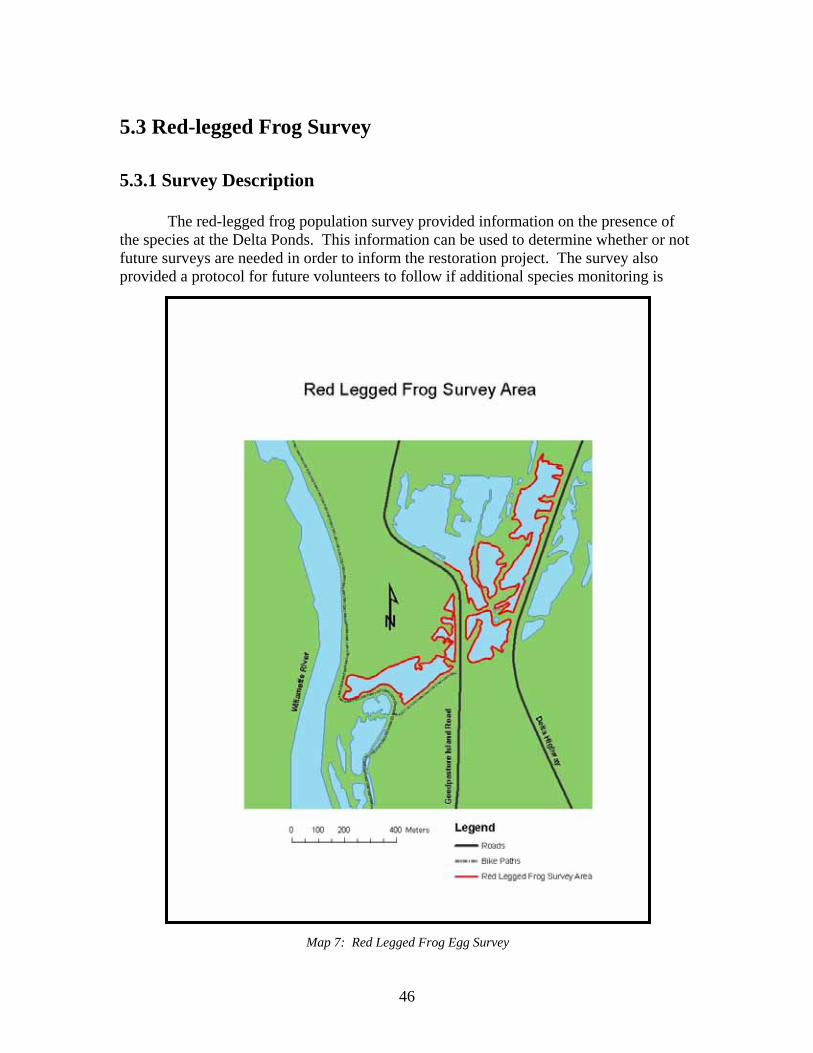
46
5.3.1 Survey Description
The red-legged frog population survey provided information on the presence of the species at the Delta Ponds. This information can be used to determine whether or not future surveys are needed in order to inform the restoration project. The survey also provided a protocol for future volunteers to follow if additional species monitoring is
5.3 Red-legged Frog Survey
Map 7: Red Legged Frog Egg Survey

47
deemed necessary. This task involved surveying emergent vegetation around the ponds. We found this to be performed best using a canoe, as it allowed the greatest mobility and access. The areas observed, indicated on Map 7, represented areas with a high quantity of vegetation. Not shown on the map is the segment of the Dedrick Slough that was also monitored. 5.3.2 Survey Results
The first monitoring took place on February 12, 2005. Conditions were rainy and cold. Haley Harguth, Rhonda Zimlich, and Kate Darby attended the monitoring. No egg masses were found throughout the ponds. Our second monitoring took place on February 19, 2005. This time the task consisted of wading through a northern section of the Dedrick slough. Due to the results from the previous date and no significant change in conditions, we decided to only check the area of the slough that hadn’t been checked prior. The weather was overcast but dry. Haley Harguth, Mona Jones, and Kate Darby attended the monitoring. We began at the fish trap site and worked our way south
through the slough, observing both banks. The area observed was a representative sample of the slough area that was not included in the canoe monitoring. Again, no egg masses were found. Monitoring was canceled on February 26, 2005 in response to earlier results. This was decided in order to provide time for the possibility of changing conditions and allow further opportunity for the species to lay their eggs. Monitoring resumed on March 5, 2005. The canoe was again used to spot check specific areas designated as prime habitat. Conditions were good,
partly sunny and warm. Dan Davis and Haley Harguth attended the monitoring. Ponds G, H, and L were observed, as well as two small seasonal ponds north of Pond G, which were monitoring on foot. No egg masses were found. 5.3.3 Discussion of Results
The data collected was consistent throughout the monitoring efforts, suggesting there are no red-legged frogs present at the Delta Ponds. It is unknown if this species was historically present at the site and if so, at what point it was possibly eradicated, or from what causes. The numerous anthropogenic factors that went into the ponds creation and its current state probably have a role in the red-legged frog’s assumed absence. Despite
Team Members Searching for Egg Masses

48
not finding any egg masses, the data from this survey will still have future implications on the restoration plan. The results may open up resources to be allocated to other areas of the project and lessen the focus on preserving critical habitat for this threatened species.
5.4.1 Survey Description
The frog vocalization surveys provided data on two frog species present at the Delta Ponds. The data was gathered separately for each species to allow easy identification and locate the distribution and abundance of each. The vocalization surveys consisted of locating sites around the ponds (see Map 8) where volunteers then listened at night for the call of the species being monitored. A specified amount of time
5.4 Pacific Chorus frog and Bullfrog Vocalization Survey
Map 8: Frog Vocalization Listening Stations

49
was determined for all sites in order to standardize the results. This was usually 10 minutes, although on a few occasions it was changed to 5 minutes due to volunteer shortages. The task itself is simple, only requiring volunteers to write down what they heard. The sites were located all over the ponds in order to provide a widespread data set, taking in account that frog vocalizations can be heard at a distance. 5.4.2 Survey Results
The results from the Pacific chorus frog vocalization survey indicate the change in
Map 9: Pacific Chorus Frog Vocalization Results
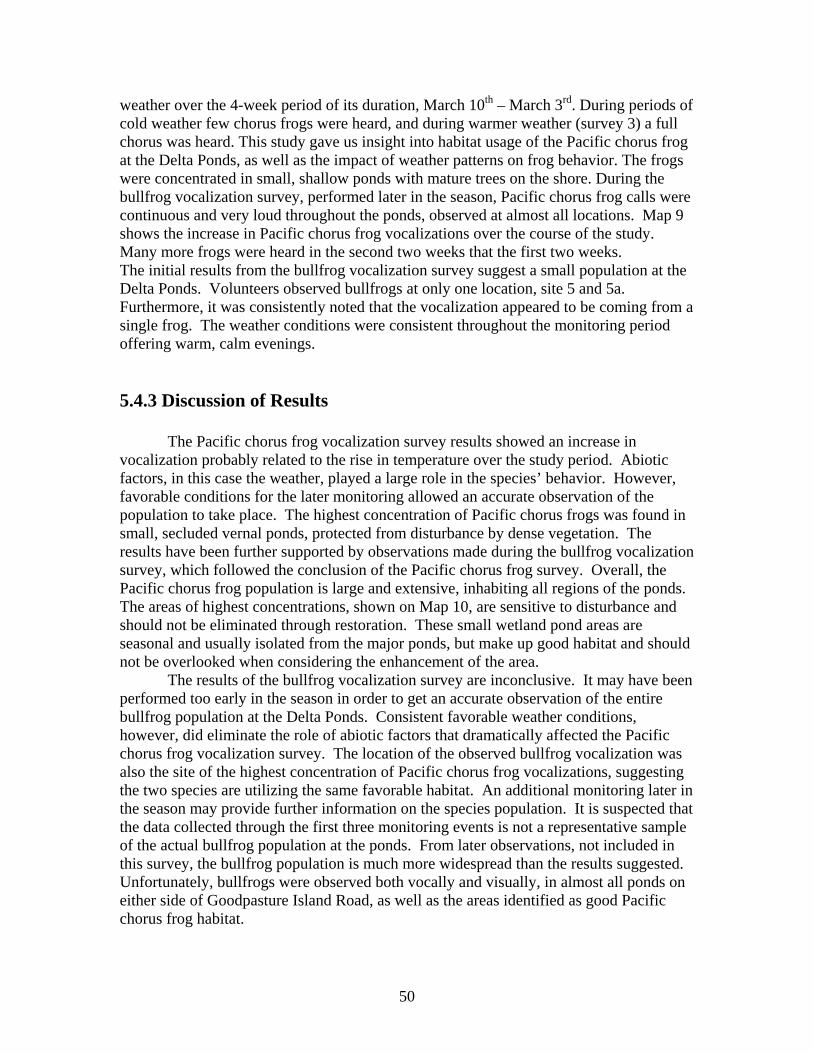
50
weather over the 4-week period of its duration, March 10th – March 3rd. During periods of cold weather few chorus frogs were heard, and during warmer weather (survey 3) a full chorus was heard. This study gave us insight into habitat usage of the Pacific chorus frog at the Delta Ponds, as well as the impact of weather patterns on frog behavior. The frogs were concentrated in small, shallow ponds with mature trees on the shore. During the bullfrog vocalization survey, performed later in the season, Pacific chorus frog calls were continuous and very loud throughout the ponds, observed at almost all locations. Map 9 shows the increase in Pacific chorus frog vocalizations over the course of the study. Many more frogs were heard in the second two weeks that the first two weeks. The initial results from the bullfrog vocalization survey suggest a small population at the Delta Ponds. Volunteers observed bullfrogs at only one location, site 5 and 5a. Furthermore, it was consistently noted that the vocalization appeared to be coming from a single frog. The weather conditions were consistent throughout the monitoring period offering warm, calm evenings. 5.4.3 Discussion of Results
The Pacific chorus frog vocalization survey results showed an increase in vocalization probably related to the rise in temperature over the study period. Abiotic factors, in this case the weather, played a large role in the species’ behavior. However, favorable conditions for the later monitoring allowed an accurate observation of the population to take place. The highest concentration of Pacific chorus frogs was found in small, secluded vernal ponds, protected from disturbance by dense vegetation. The results have been further supported by observations made during the bullfrog vocalization survey, which followed the conclusion of the Pacific chorus frog survey. Overall, the Pacific chorus frog population is large and extensive, inhabiting all regions of the ponds. The areas of highest concentrations, shown on Map 10, are sensitive to disturbance and should not be eliminated through restoration. These small wetland pond areas are seasonal and usually isolated from the major ponds, but make up good habitat and should not be overlooked when considering the enhancement of the area. The results of the bullfrog vocalization survey are inconclusive. It may have been performed too early in the season in order to get an accurate observation of the entire bullfrog population at the Delta Ponds. Consistent favorable weather conditions, however, did eliminate the role of abiotic factors that dramatically affected the Pacific chorus frog vocalization survey. The location of the observed bullfrog vocalization was also the site of the highest concentration of Pacific chorus frog vocalizations, suggesting the two species are utilizing the same favorable habitat. An additional monitoring later in the season may provide further information on the species population. It is suspected that the data collected through the first three monitoring events is not a representative sample of the actual bullfrog population at the ponds. From later observations, not included in this survey, the bullfrog population is much more widespread than the results suggested. Unfortunately, bullfrogs were observed both vocally and visually, in almost all ponds on either side of Goodpasture Island Road, as well as the areas identified as good Pacific chorus frog habitat.
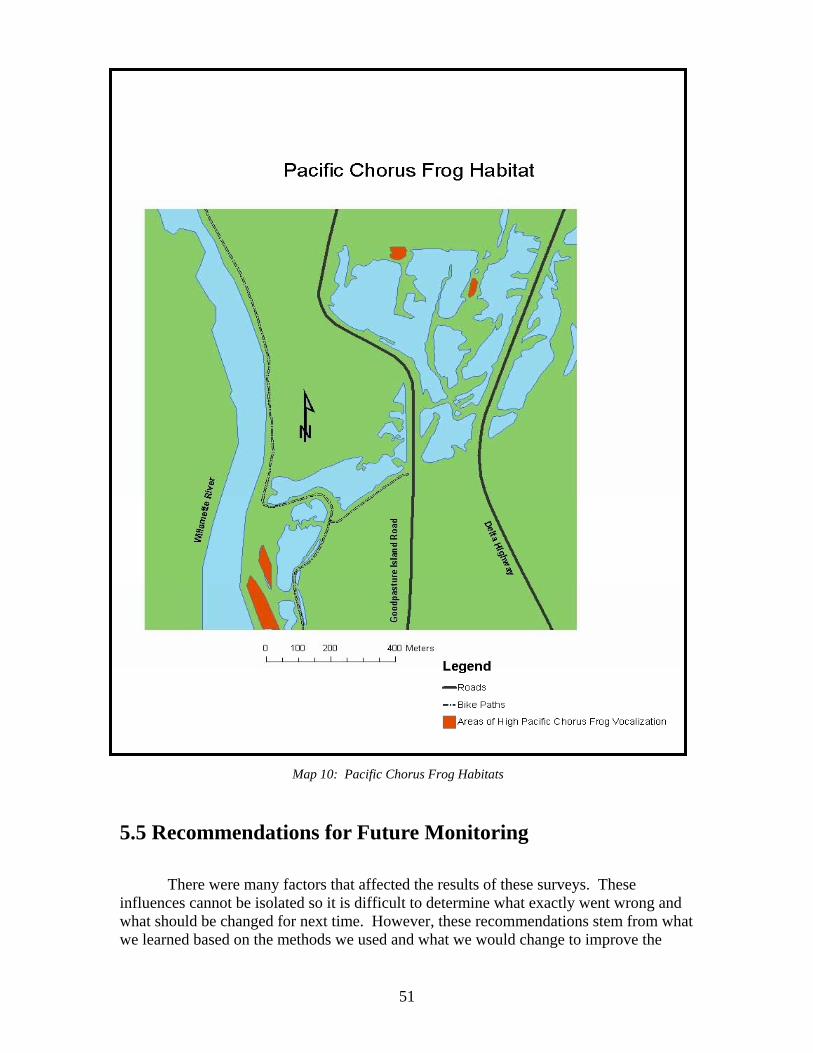
51
There were many factors that affected the results of these surveys. These influences cannot be isolated so it is difficult to determine what exactly went wrong and what should be changed for next time. However, these recommendations stem from what we learned based on the methods we used and what we would change to improve the
5.5 Recommendations for Future Monitoring
Map 10: Pacific Chorus Frog Habitats
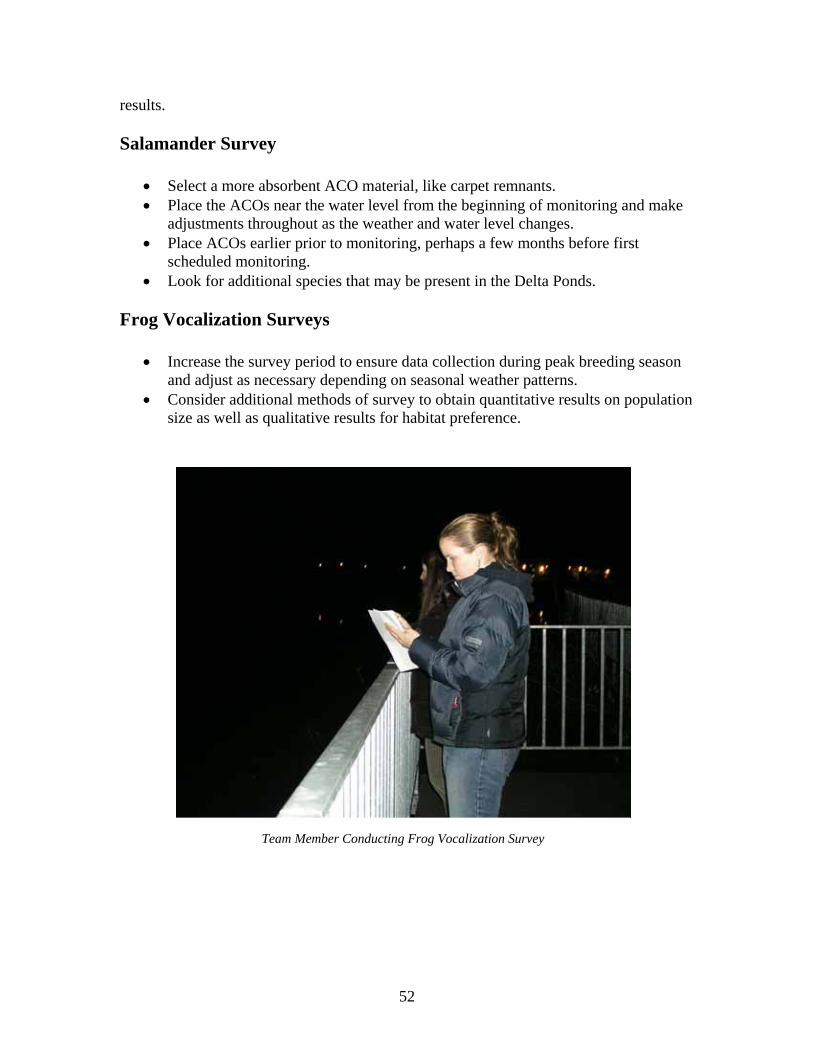
52
results. Salamander Survey
• Select a more absorbent ACO material, like carpet remnants. • Place the ACOs near the water level from the beginning of monitoring and make
adjustments throughout as the weather and water level changes. • Place ACOs earlier prior to monitoring, perhaps a few months before first
scheduled monitoring. • Look for additional species that may be present in the Delta Ponds.
Frog Vocalization Surveys
• Increase the survey period to ensure data collection during peak breeding season and adjust as necessary depending on seasonal weather patterns.
• Consider additional methods of survey to obtain quantitative results on population size as well as qualitative results for habitat preference.
Team Member Conducting Frog Vocalization Survey

53
66..00 VVeeggeettaattiioonn MMoonniittoorriinngg
The ecology of the Delta Ponds area ranges from wooded upland to pond wetlands and is composed of several distinct vegetation communities. In this report vegetation communities will be described using a dominant key species or several coexisting key species to represent each community. The team selected four vegetation communities represented by the over-story trees present in the plant community. The history of disturbance to the Delta Ponds ecosystem has created ideal habitat for non-native invasive vegetation, which composes a large percentage of the surveyed area. In addition to the four vegetation communities, this report includes Armenian blackberries in the vegetation maps and gives detailed information on the most prevalent invasive species. Data from the initial survey and mapping project will provide a baseline for all future surveys. The detailed analysis and mapping of dominant vegetation zones in the Delta Ponds area prior to restoration activities will give future monitors the ability to see plant succession patterns, the effectiveness of eradication regimens and the success of replanted native flora. The goals of this portion of the project were:
• To determine the vegetation communities present at Delta Ponds; • To analyze the distribution of native and non-native vegetation; and • To create a survey protocol for future volunteers.
Vegetation Communities
The key species listed here represent the vegetation communities used to construct a vegetation habitat map of the Delta Ponds area. Each community occupies a specific niche of the habitat. Community descriptions will include a description key species chosen to represent the plant association and a description of how the species functions in the larger ecosystem at Delta Ponds. One particularly pervasive non-native species, Armenian blackberry, was included in the vegetation habitat map of Delta Ponds area and is included in this report with other species of interest.
Upland Community Big leaf maple (Acer macrophyllum) dominates the upland community, which can also include white oak (Quercus garryana), Oregon ash (Fraxinus latifolia), and occasionally white alder and madrone. The big leaf maple is native to the Willamette Valley and provides both food and cover for a variety of mammals. Persistent samaras and numerous seedlings provide food for birds and burrowing mammals. Wide horizontal branches provide excellent habitat for epiphytic vegetation. The wide leaf
6.1 Introduction

54
canopy also provides shade for aquatic ecosystems, which helps to maintain the appropriate water temperature for fish and other aquatic species (Uchytil, 1989). The big leaf maple grows up to 35 meters in height. The young bark is smooth and green while the older bark is grayish, ridged and usually covered with moss and epiphytic ferns. Leaves are 5-30 cm in width, opposite, and five lobed in the characteristic shape of maple leaves. Flowers are 3 mm across and green, they occur in long hanging clusters. Maple fruit are double winged samaras that range from 3-6 cm and are semi-persistent in the winter. Maples rely predominantly on seed dispersal and germination for regeneration (Pojar, 1994 and Uchytil, 1989). Big leaf maples are hardy and have few habitat requirements. They can tolerate a wide variety in soil textures and are extremely tolerant of floods but retain water well during droughts. Maples are somewhat shade intolerant and consequently seedlings may be shaded out densely growing invasive species (Uchytil, 1989 and Strong, 2004). Oregon ash is native to the Willamette Valley and provides food and cover for a variety of animal species. Wood ducks and mice forage for the samaras. The ash also provides habitat for nesting birds by forming trunk cavities. Furthermore it contributes to tall canopy cover, which helps maintains the low water temperatures that fish and other aquatic animals need (Griffith, 1991). The Oregon ash grows up to 25 meters in height and its bark becomes fissured with age. Leaves are opposite, pinnately compound with 5-7 13 cm oblong leaflets. Male and female flowers appear on different trees. Both flowers are inconspicuous at 3 mm long and occur in clusters. Fruit are single winged samara and range from 3-5 cm in length. Oregon ash flowers in late spring and fruits in early- to mid- fall (Pojar, 1994). The Oregon ash prefers well-drained soils rich in nitrogen and calcium. It needs adequate year round moisture and can withstand occasional floods. All ashes are somewhat sensitive to sulfur dioxide, acid pollution, drought and fungal infections (Griffith, 1991).
Riparian Community Black cottonwood (Populus balsamifera ssp. trichocarpa) and red alder (Alnus rubra) dominate the riparian community, which can also include Oregon ash. Black cottonwood is native to the Willamette Valley and requires open riparian habitat. Black cottonwood trees are one of the tallest deciduous trees in the upland riparian ecosystem and provide a significant shade canopy for under-story vegetation as well as the surrounding aquatic environment. In order to maintain the cool water temperatures that fish and other aquatic species need to reproduce and survive it is important to have a thriving community of tall canopy trees around the Delta Ponds. Black cottonwood trees can reach up to 50 meters in height and are often found clumped together in small groves. At maturity the bark of the black cottonwood is dark gray and marked with deep vertical grooves. Leaves are 5-15 cm long, alternate, thick, usually shiny and range from oval to heart shaped. Male and female flowers are both catkins but are found on different trees (Pojar, 1994). Black cottonwoods require ample moisture and nutrient supply. Thus they are particularly dependant healthy aquatic systems. They often form dense stands along rivers or on floodplains (Pojar, 1994). Black cottonwood seedlings require partial to full sunlight, which is prohibited by dense thickets of invasive shrubs. Over-shading by
55
invasive species is particularly a problem with black cottonwoods because they have short life span therefore without adequate reseeding a black cottonwood forest can thin out rapidly (Strong, 2004). Furthermore black cottonwood prefer to set their seed in soil that has been disturbed by a flood event and are thus threatened by habitat alterations that limit flooding events. (Steinberg, 2001) Red alder are native to the Willamette Valley, they are included in the riparian community with black cottonwoods but prefer the lower ranges of the riparian community. Red alder trees are important to the Delta Ponds ecosystem for a number of reasons. Alders are colonizing trees that quickly move into disturbed soils by seed and sprout propagation. Once established dense fibrous root systems serve to hold soil together and limit erosion damage in sensitive areas. Furthermore the root systems of alders provide habitat for the nitrogen fixing bacteria actinomycetes. A mature stand of alders can contribute 320 kg/ha of nitrogen per year. By changing the soil chemistry alders create habitat that is well suited for native species of grass, sedge, and ferns (Pojar, 1994). Mature alders grow to heights of 25-35 meters often several trees grow out of one root location. Their bark is thin, gray and generally smooth although it often appears scaly due to extensive lichen colonies. Leaves are 5-10 cm long, oblong-ovate shaped with wavy margins that come to a sharp terminal tip. Alder trees have female and male catkins on the same tree. The female catkin is only 1-2 cm long and turns woody at maturity. Male catkins are 5-10 cm long, reddish-yellow and appear before the leaves. Alders leaf out in March and fruit in late September, their leaves stay green throughout this period (Forest Service, 2005). Alders prefer moist soil and are often found along stream banks or on floodplains but can also appear on bare disturbed soil often indicating an ample groundwater supply (Pojar, 1994). Alder seedlings are threatened by invasive species similarly to black cottonwood seedlings. They too require at least partial sunlight to grow and are short lived as mature trees. Invasive species such as Armenian blackberry and English ivy can easily prevent reseeding of alders (Strong, 2004).
Wetland Transition Community Willows (Salix spp.) dominate the wetland transition community. Several different species of willow coexist in the Delta Ponds area but for the purpose of this report we will treat them as one group. Willows can live in rocky alluvial soil and often serve to stabilize river and steam banks during floods. They also provide food and habitat for many species of animals. Beaver rely heavily on the Pacific willow for winter fuel and several species of willow provide year round shelter for non-game birds (Uchytil, 1989). Willows range from 50 cm to 12 m in height and have small, erect and spreading branches. Willows are deciduous and have alternating leaves that range from 4-15 cm and from elliptical to linear. Leaf margins often appear smooth but can be finely toothed. Male and female flowers appear in catkins. Female catkins are generally larger and can range from 6-12 cm while the male catkins range from 2-7 cm in length. Depending on the subspecies male and female catkins may appear on different plants (Pojar, 1994 and Hitcock, 1973).

56
Willows can rapidly colonize bare soil and grow in relatively rocky and sandy soils but require an ample water supply. They can withstand floods and are often found on low-lying floodplains (Uchytil,1989). In the Delta Ponds area willows often dominate the shoreline of low islands and some peninsulas but have given way to blackberries on most of the contiguous shore. Blackberries out compete willows by both shading out seedlings and by more prodigious seed production and aggressive seed dispersal (Strong, 2004).
Emergent Wetland Community The characteristic vegetation of the emergent wetland community primarily consists of sedges and rushes (City of Eugene, 2005). The common terms sedge and rush refer to numerous genera and species, for the purpose of this report they will all be referred to as emergent vegetation. In addition to sedges and rushes the emergent vegetation community at Delta Ponds also includes the invasive yellow flag iris (Iris pseudacorus). Emergent vegetation represents a unique habitat in the Delta Ponds ecosystem. This habitat exists only on gradually sloping banks, which are between the high and low water mark. Shallow water with emergent vegetation provides critical habitat for native amphibians to breed, develop and over-winter (Watson, 2003). Destruction or alteration of shallow and ephemeral ponds with emergent vegetation has been linked to the decline of native amphibians in the Willamette Valley (Adams, 2002). Sedges and rushes resemble grasses with long, narrow leaves and small, scale-like bracts surrounding inconspicuous flowers. Both sedges and rushes reproduce through seed and rhizome. Sedges range from 2 cm to 1.5 m in height and have separate male and female flowers. Both the male and female flowers appears like spikes and can range in location from directly adjacent to occurring on separate plants. A distinguishing feature of sedges is their triangular stem. Rushes range from 5 to 130 cm in height and their flowers appear more cluster-like than sedges. Rushes are distinguished from sedges by their 3-chambered capsule and round stem (Pojar 1994). All species included in the emergent vegetation community require hydric soils, which are saturated long enough during the growing period to create anaerobic conditions. Gradually sloping banks help to create large swaths of hydric soil and are thus a good habitat for emergent vegetation (Pojar, 1994). Emergent vegetation at Delta
Yellow Flag Iris

57
Ponds is more densely concentrated in the ponds west of Goodpasture Island Road where the ponds are shallower and/or the banks of the ponds are very gradual. The yellow flag iris is an aggressive invasive that is present in dense patches in the western most ponds at the Delta Ponds site. It reproduces both through seed and rhizome and can create monotypic thickets that out-compete native vegetation. Leaves are erect and sword-like and reach 3-4 feet in height. Flowers are yellow and showy with three petals and three petal-like sepals. Because the yellow flag iris can adapt to a wide variety of habitats it poses a threat to native emergent vegetation. Aside from high levels of nitrogen the yellow flag iris has few habitat requirements. It is anoxia tolerant, can tolerate high soil pH, and has been shown to continue growth after three months without water (Ramey, 2001). Other Species of Interest
Armenian Blackberry (Rubus armenicus) The fifth vegetation type used for the Delta Ponds vegetation habitat map is the Armenian blackberry. Armenian blackberry is an aggressive invasive that thrives in disturbed soil. Its extremely dense growth habits compete fiercely with native shrubs and other flora often choking out less aggressive species. The history of disturbance at the Delta Ponds created ideal habitat for this invasive and it has been targeted for aggressive removal. Armenian blackberries are vines with thick sharp spines that grow up to 3 meters in height. Vines are sprawling and recurve to the ground where they grow for up to 10 meters in length. Blackberry vines are biennial producing flowers and fruit on lateral shoots during the second year. Leaves are ovate with serrate margins and are trifoliate on the flowering branches while 5-foliate on vegetative shoots. Blackberry flowers are 2-3 cm and occur in clusters. The flowers are perfect, five-petaled and range from white to rose colored. Edible black aggregate fruit appear in early to late September (Pojar, 1994). Armenian blackberries are extremely invasive and have few habitat requirements. They typically grow in disturbed areas but can thrive in soils with a wide range in texture and pH. Although blackberries can withstand flooding they do not require excessive moisture. Blackberries can regenerate in a number of different ways making them difficult to eradicate without long-term efforts. They are capable of vegetative
Blackberry Removal Area

58
regeneration through perennial rootstocks and by rooting from creeping stems. Germination from seed is also prolific because of the large seed yield and the palatability of the fruit (Tirmenstein, 1989). Removal of Armenian blackberries at Delta Ponds has already begun but will require careful attention over several years to ensure complete removal. This species is extremely resilient and can reproduce from canes as well as root crowns left after initial removal efforts, Other Noteworthy Species
English Ivy (Hedera helix) English ivy is an aggressive invasive vine that grows both on the ground as well trees and other structures. The English ivy vine secretes a glue-like substance that adheres to whatever it comes in contact with. Its thick canopy of leaves effectively blocks out the sunlight below it making it a significant problem for seedlings, small plants and the photosynthesizing parts of trees and shrubs that have been colonized by it. Three lobed leaves are thick, waxy and range from 6-9 cm in width. Leaves in full sun appear un-lobed. Flowers appear in fall and are inconspicuous greenish-white, umbrella shaped clusters. Black fleshy fruit matures in spring. Older ivy vines can reach up to one foot in diameter. English ivy has taken hold in some of the black cottonwood groves at Delta Ponds. Removal of ivy on the ground has already taken place, however, some vines have grown up the trees to heights of 40 feet, which makes their removal very difficult. It will be important to watch for seedlings on the ground under these remaining sites (Swearingen, 2000).
Scotch Broom (Cytisus scoparius) Scotch Broom is an invasive non-native that rapidly colonizes disturbed areas. This attribute as well as its regeneration capabilities makes it a significant problem to habitat enhancement at Delta Ponds. Scotch broom is an erect deciduous shrub that grows up to 3 meters in height. It has alternate inconspicuous leaflets that grow to 3 cm in length and range from ovate to elliptical on shape. The flowers are yellow, 2 cm in length, showy and appear in the leaf axils. They are typical, in shape, of the pea family. Scotch broom fruit is a flattened black pod ranging from 3-5 cm also typical of the pea family in shape. Scotch broom prodigiously produces robust seeds as soon as a plant is two years old. A single plant can produce up to 12,000 seeds in one season. Furthermore the seeds can survive for up to 30 years in the soil depending on conditions (Pojar, 1994 and Schoenig, 2004). Scotch broom has few habitat requirements and is able to colonize severely disturbed ground very quickly. It is unpalatable to foraging fauna and thus has few natural restrictions. It often forms dense homogeneous stands and shades out native flora. Several small stands already exist in the Delta Ponds area and it will be important create a long-term management strategy to avoid further spread of this invasive (Schoenig, 2004).

59
Snowberry (Symphoricarpos albus) Common snowberry is a deciduous shrub; native to the Willamette Valley that provides food and cover for small birds and mammals in the Delta Ponds area. It is also a soil stabilizer and helps to reduce erosion damage in upper riparian benches (McWilliams, 2000). Common snowberry is an erect densely branching shrub that grows from 1-2 meters in height. Leaves are 2-5 cm long, opposite, and range from elliptical to oval. The leaf margin may be smooth or wavy and blunt-toothed. Flowers appear in terminal clusters and are perfect, 5-7 cm long, white or pinkish, and bell shaped. The snowberry fruit is a cluster of 6-15 mm white drupes that persists through the winter. Leaves appear on the snowberry beginning in mid-spring, flowers appear in June and fruit appears in August. The primary method of reproduction in the snowberry is through rhizomes and seed germination is not common (Pojar, 1994 and McWilliams, 2000). The snowberry can tolerate mild variation in soil pH and nutrient poor soils. However it prefers open areas with well-drained soils and is most commonly found on riparian benches above the high water line. Snowberry is considered mid- to late-succession species that often coexists with alder in disturbed site. It will be included in the second vegetation zone for the purposes of this report (McWilliams, 2000).
Willamette Daisy (Erigeron decumbens) The Willamette daisy was listed as an endangered species in January 2000. It is endemic to the Willamette valley and has strict habitat requirements. Currently the Willamette daisy is known to grow on 18 different sites and to have been extirpated from 19 other sites. It is not known to exist in the Delta Ponds area but its discovery there would warrant a new level of protection for the area (ODFW, 2002) The Willamette daisy is a perennial herb that grows from 15-62 cm in height. Basal leaves are less than 2 cm in width and can reach 5-18 cm in length. The flowering stem produces 2-5 daisy-like flowers. Flowers have yellow discs with 25-50 rays ranging from pink to light blue. Plants usually flower in early to mid-summer (ODFW, 2002) Willamette daisies require ample moisture and light; they do not tolerate partial shading by tree cover well. Woody tree cover in the Willamette Valley was excluded from the bottomland prairies by seasonal fire regimes, thus creating suitable habitat for the Willamette daisy. The encroachment by a woody over story that followed European settlement in the Willamette valley led to a decline in the endemic daisy population. Portions of the Delta Ponds area may be suitable habitat for the Willamette daisy once removal of invasive and/or exotic species has been completed (ODFW, 2002). Overview of Monitoring Methods
The initial survey conducted in 2005 relied on aerial photo analysis and ground surveys. The photos were used to create five vegetation zones based on the dominant species. Vegetation zones were mapped onto an existing map of the Delta Ponds area using ArcMap, a Geographic Information Systems (GIS) software. Future monitoring methods are unknown at this time and may vary from species to species.
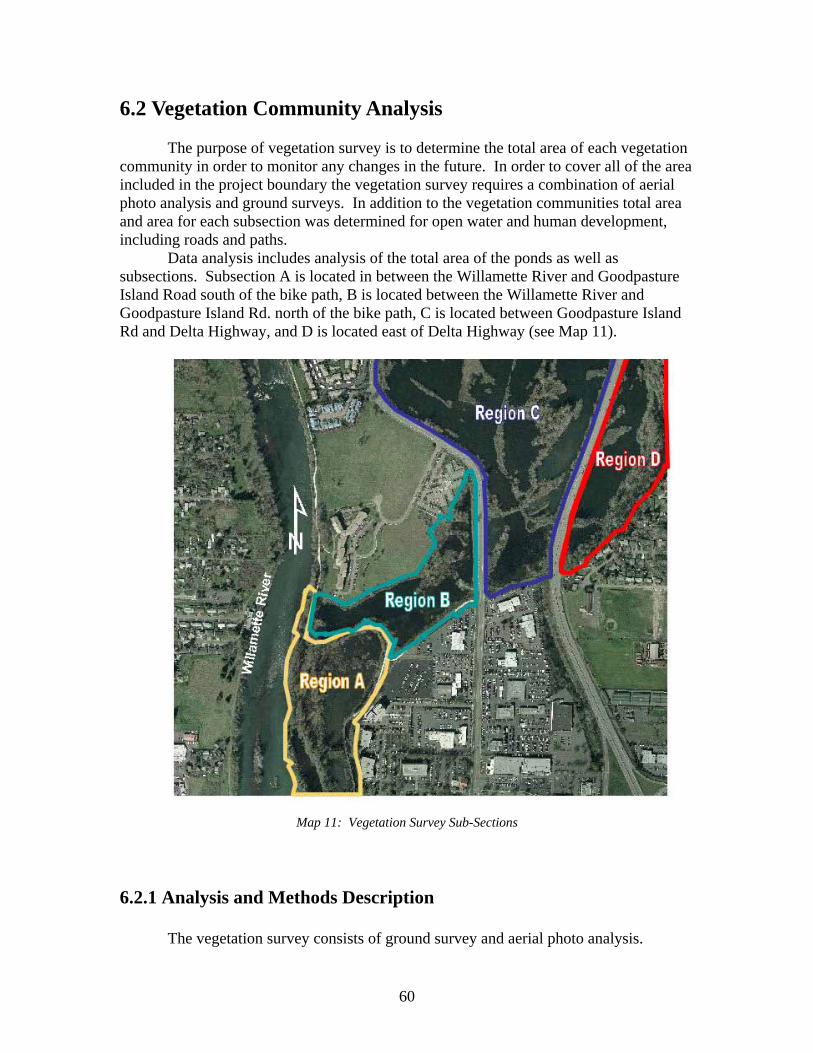
60
6.2 Vegetation Community Analysis The purpose of vegetation survey is to determine the total area of each vegetation community in order to monitor any changes in the future. In order to cover all of the area included in the project boundary the vegetation survey requires a combination of aerial photo analysis and ground surveys. In addition to the vegetation communities total area and area for each subsection was determined for open water and human development, including roads and paths. Data analysis includes analysis of the total area of the ponds as well as subsections. Subsection A is located in between the Willamette River and Goodpasture Island Road south of the bike path, B is located between the Willamette River and Goodpasture Island Rd. north of the bike path, C is located between Goodpasture Island Rd and Delta Highway, and D is located east of Delta Highway (see Map 11).
6.2.1 Analysis and Methods Description
The vegetation survey consists of ground survey and aerial photo analysis.
Map 11: Vegetation Survey Sub-Sections

61
Initially we determined sections of the pond to be included in the ground survey based on accessibility. Data sheets are prepared by over-laying a 45 by 45 foot grid on the aerial photo in ArcMap, a Geographic Information System (GIS) software package. Enlarged (1:2500) sections of the prepared aerial photos were printed for use in the ground survey. Vegetation communities are recorded by outlining around the entire perimeter of the vegetation in a different color for each community. Data analysis is completed on GIS ArcMap software. An individual map layer is created for each vegetation community and over-layed onto the aerial photo. Data is transferred from the data sheets to the GIS layer by hand in the form of polygons for each vegetation group. To simplify the data analysis, if an area contains several vegetation communities, each 45 by 45 foot square can be reduced to a single vegetation community based on the most pervasive species. After the vegetation communities have been mapped onto the aerial photo the area for each community can be determined by an polygon area equation contained in the GIS software. First the area is determined for each vegetation community within the total project boundaries then the area can be determined for each vegetation community in subsections of the ponds. The area is used as a baseline to document any changes over time. 6.2.2 Vegetation Community Distribution
The following maps represent the distribution of the four vegetation communities described in this report as well as the invasive species Armenian blackberries. Data tables are given below to summarize the information displayed in these maps. However, the maps themselves are useful in that they show the exact location of specific communities.

62
Map 12: Upland Community
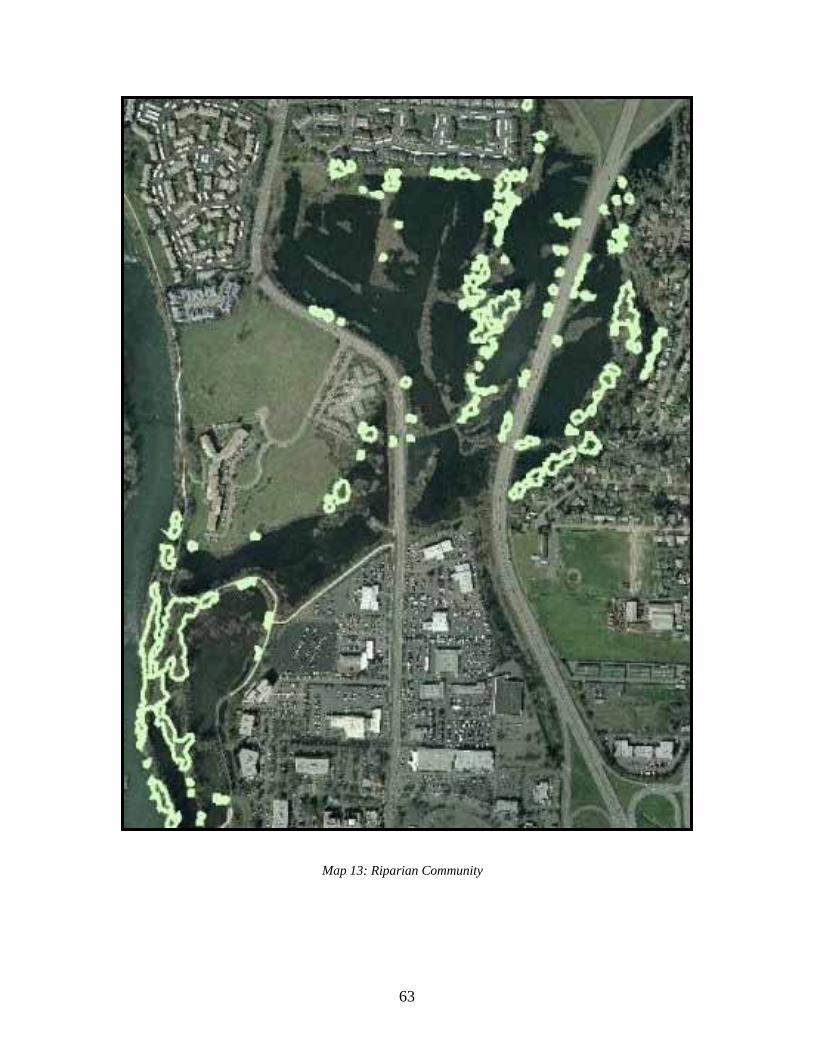
63
Map 13: Riparian Community
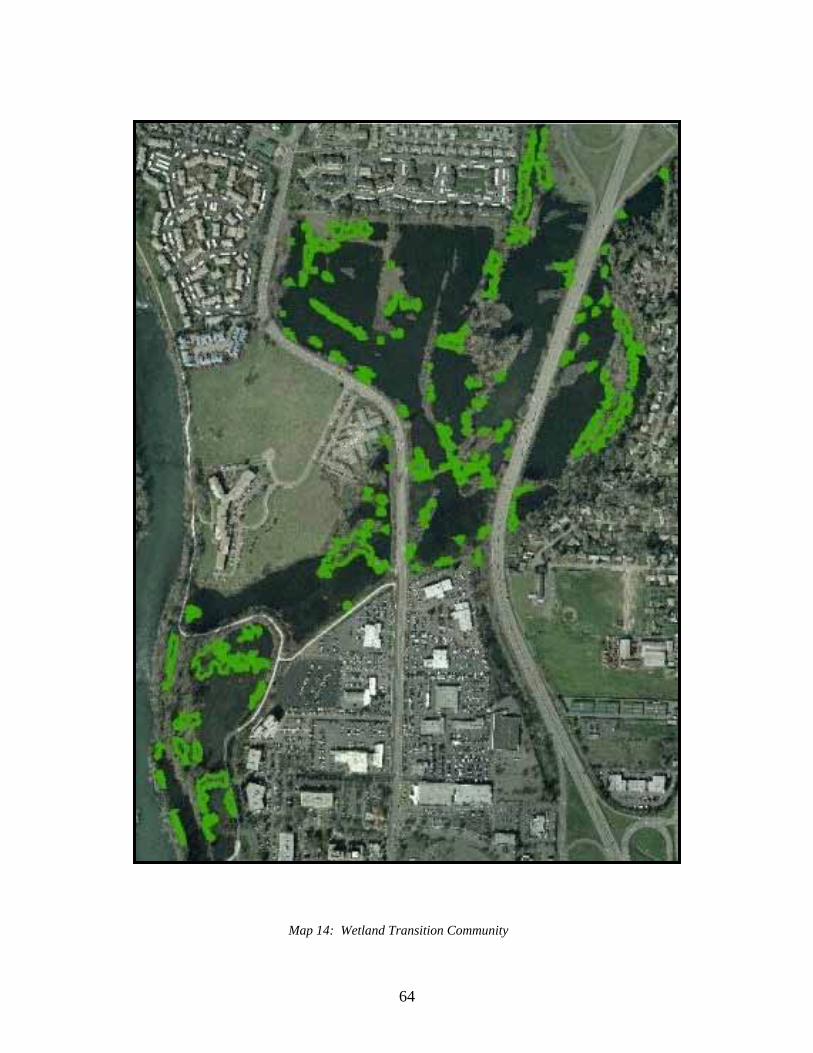
64
Map 14: Wetland Transition Community

65
Map 15: Emergent Vegetation Community
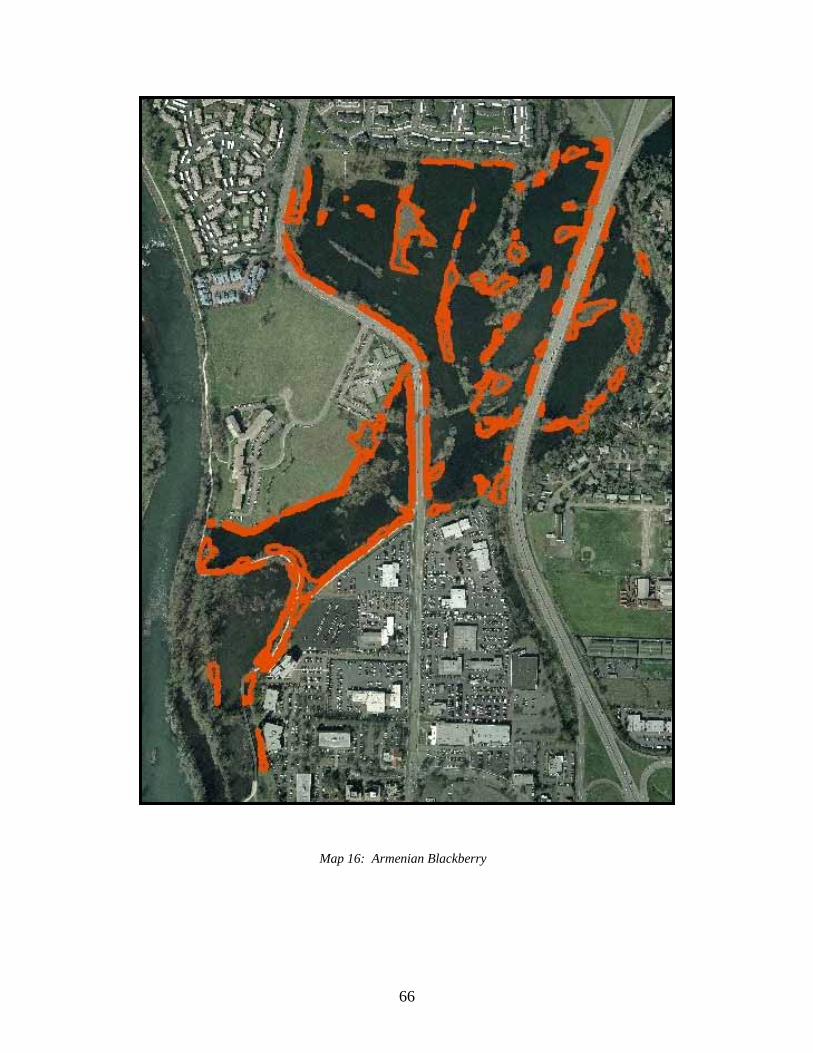
66
Map 16: Armenian Blackberry

67
6.2.3 Vegetation Area
The total area for all of the vegetation communities surveyed was 586,831 ft.2. There was an additional 22,211 ft2 of developed area consisting of the paved bikepath, several established gravel paths and the radio tower. There was also 911,073 ft.2 of open water within the project boundary, excluding Dedrick slough. Results for the area of each vegetation community are displayed in Table 6 below. The total area of each community is given followed by the percentage of total project area, excluding open water, that the community occupies. Total area for each community with in subsections of the pond is given as well as the percentage of that community that is contained within the subsection. The restoration plan will significantly impact the vegetation at Delta Ponds by reducing the area covered by invasive species and increasing the area covered by native species. As the data shows blackberries and the riparian community cover the largest area at Delta Ponds. Removal of blackberries has already begun but will need continued attention of or several successive years to completely eradicate this invasive. Blackberries are extremely resilient and can reproduce from canes as well as root crowns. On many steep banks that are currently covered by blackberries gently sloping benches will be created to increase the riparian zone. In addition 25,000 native trees will be planted on newly cleared areas increasing both the riparian and upland communities.
Table 6: Vegetation Distribution
Vegetation Distribution at Delta Ponds Vegetation
Community
Total
Area
(ft^2)
% of
Total
Project
Area
Area
A%
Area A
(ft^2)
Area B
%
Area B
(ft^2)
Area C
%
Area C
(ft^2)
Area D
%
Area D
(ft^2)
Upland 53,737 9 17 9,180 8 4,062 58 31161 17 9,334
Riparian 183,455 30 39 71,266 4 75,13 37 67,352 20 37,323
Wetland
Transition
115,259 19 30 34,708 14 16,093 40 46,522 16 17,936
Emergent 54,469 9 32 17,267. 11 5,892 54 29,318 4 1,992
Blackberry 179,911 30 8 14,524 26 46,995 53 94,367 13 24,026
Open Water 911,073 N/A 10 92,228 14 124,980 63 575,413 14 127,743
The methods described above were suitable for general vegetation monitoring but could be modified to produce more valuable results. Relying on aerial photo analysis limits the survey to over-story species and does not allow for a complete investigation of the interaction between trees, shrubs and herbaceous species within a plant community. After the initial restoration period, including clearing invasive and replanting native vegetation, annual surveys may not yield informative results as plant growth is slow.
6.3 Recommendations for Future Monitoring
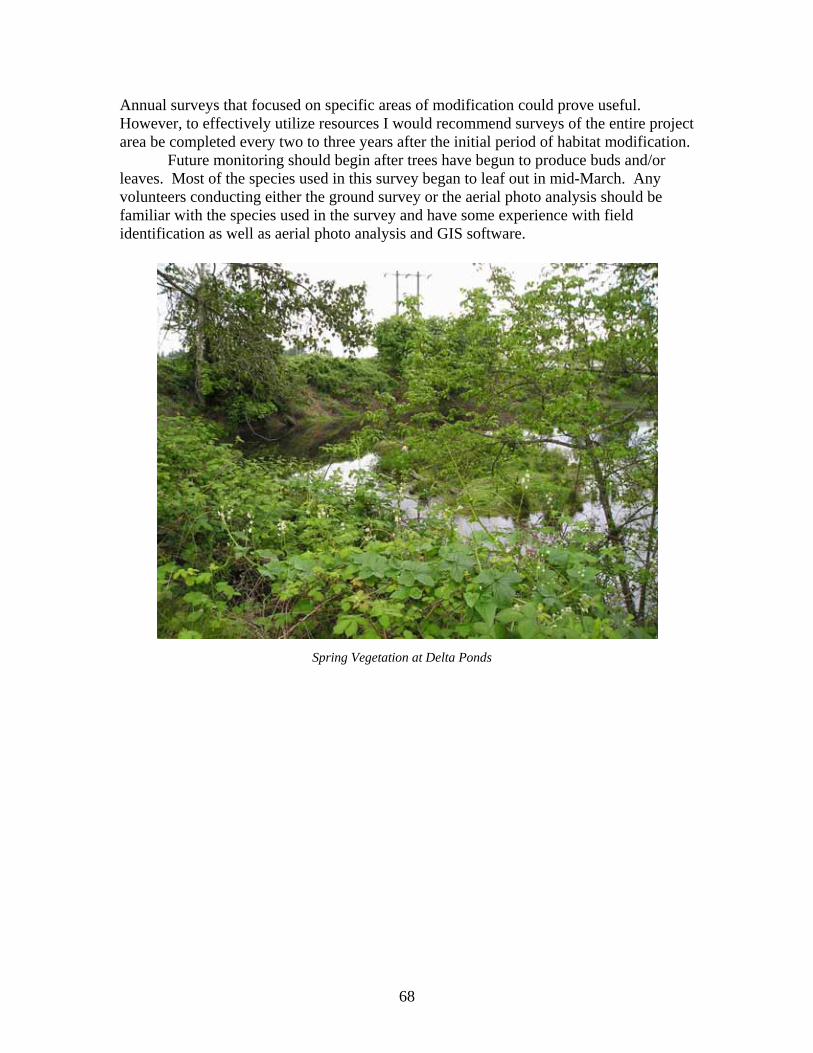
68
Annual surveys that focused on specific areas of modification could prove useful. However, to effectively utilize resources I would recommend surveys of the entire project area be completed every two to three years after the initial period of habitat modification. Future monitoring should begin after trees have begun to produce buds and/or leaves. Most of the species used in this survey began to leaf out in mid-March. Any volunteers conducting either the ground survey or the aerial photo analysis should be familiar with the species used in the survey and have some experience with field identification as well as aerial photo analysis and GIS software.
Spring Vegetation at Delta Ponds
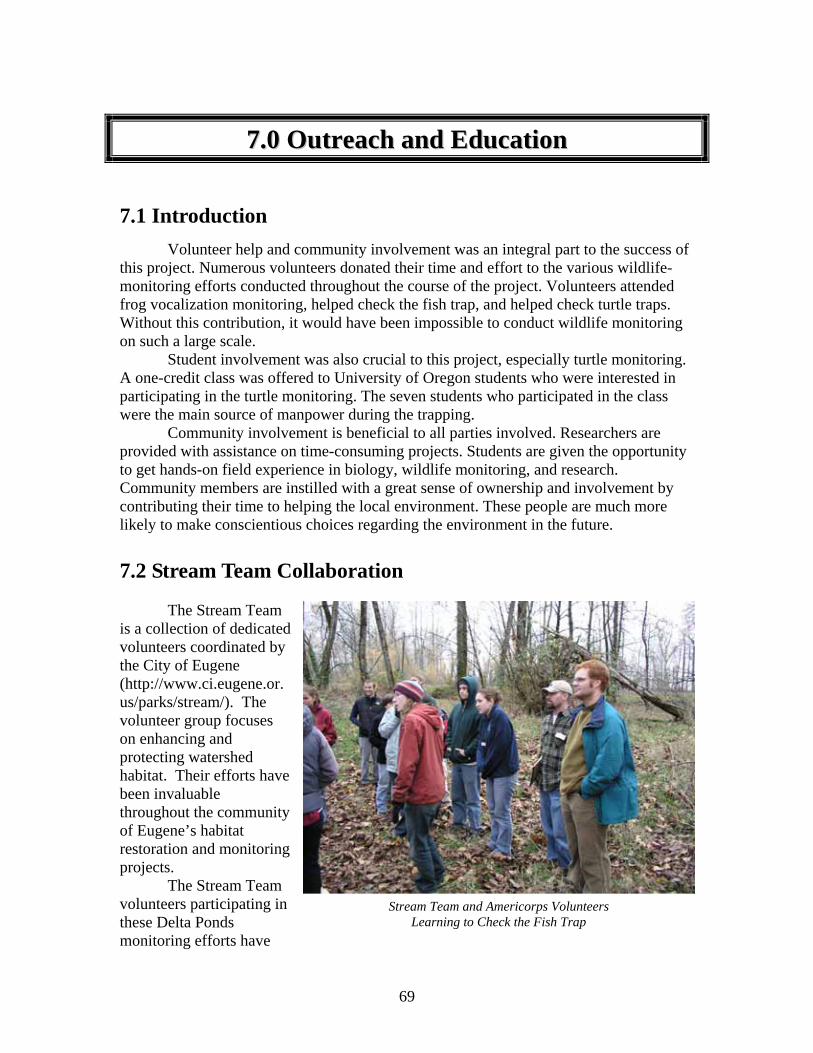
69
77..00 OOuuttrreeaacchh aanndd EEdduuccaattiioonn
Volunteer help and community involvement was an integral part to the success of this project. Numerous volunteers donated their time and effort to the various wildlife-monitoring efforts conducted throughout the course of the project. Volunteers attended frog vocalization monitoring, helped check the fish trap, and helped check turtle traps. Without this contribution, it would have been impossible to conduct wildlife monitoring on such a large scale. Student involvement was also crucial to this project, especially turtle monitoring. A one-credit class was offered to University of Oregon students who were interested in participating in the turtle monitoring. The seven students who participated in the class were the main source of manpower during the trapping. Community involvement is beneficial to all parties involved. Researchers are provided with assistance on time-consuming projects. Students are given the opportunity to get hands-on field experience in biology, wildlife monitoring, and research. Community members are instilled with a great sense of ownership and involvement by contributing their time to helping the local environment. These people are much more likely to make conscientious choices regarding the environment in the future. 7.2 Stream Team Collaboration The Stream Team is a collection of dedicated volunteers coordinated by the City of Eugene (http://www.ci.eugene.or.us/parks/stream/). The volunteer group focuses on enhancing and protecting watershed habitat. Their efforts have been invaluable throughout the community of Eugene’s habitat restoration and monitoring projects. The Stream Team volunteers participating in these Delta Ponds monitoring efforts have
7.1 Introduction
Stream Team and Americorps Volunteers Learning to Check the Fish Trap

70
been invaluable throughout this study. They have brought labor and extensive skills that have enabled great advances in our monitoring endeavors. Stream Team volunteers have participated in many aspects of this project, including amphibian monitoring, fish trap specimen collection, turtle population assessments, and vegetation surveys. Working in concert with the Stream Team volunteers has not only greatly benefited these monitoring efforts, it has also offered a springboard for continued observations—it is most likely our dedicated Stream Team volunteers that will keep these monitoring efforts going for years to come. 7.2.1 Collaboration Efforts
Collaboration with the Stream Team volunteers has made these monitoring efforts hugely successful. By working with the Stream Team Coordinator, Lorna Baldwin, the SLP team has been able to schedule and utilize the Stream Team’s vast labor force. Stream Team volunteers were scheduled for a variety of tasks with a wide range of availability. Working in conjunction with the Stream Team volunteers enabled the students of the SLP to share their experience with these monitoring efforts and also to gain the experience of the Stream Team volunteers from their past watershed and riparian volunteer experiences. Each Stream Team was asked to sign a waiver in order to participate in these monitoring plans (see Figure 3). The waiver acted as a way to account for the hours spent participating by each Stream Team volunteer as well as a waiver of liability.
Figure 3: Stream Team Release
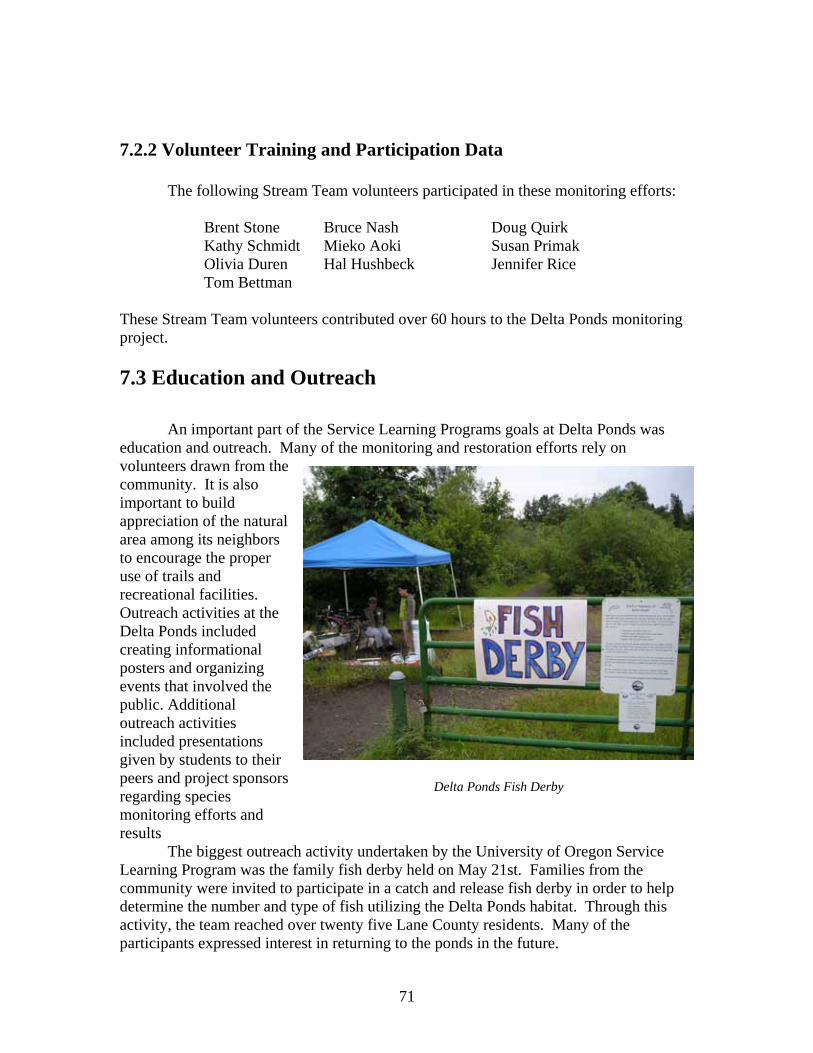
71
7.2.2 Volunteer Training and Participation Data
The following Stream Team volunteers participated in these monitoring efforts:
Brent Stone Bruce Nash Doug Quirk Kathy Schmidt Mieko Aoki Susan Primak Olivia Duren Hal Hushbeck Jennifer Rice Tom Bettman
These Stream Team volunteers contributed over 60 hours to the Delta Ponds monitoring project.
An important part of the Service Learning Programs goals at Delta Ponds was education and outreach. Many of the monitoring and restoration efforts rely on volunteers drawn from the community. It is also important to build appreciation of the natural area among its neighbors to encourage the proper use of trails and recreational facilities. Outreach activities at the Delta Ponds included creating informational posters and organizing events that involved the public. Additional outreach activities included presentations given by students to their peers and project sponsors regarding species monitoring efforts and results The biggest outreach activity undertaken by the University of Oregon Service Learning Program was the family fish derby held on May 21st. Families from the community were invited to participate in a catch and release fish derby in order to help determine the number and type of fish utilizing the Delta Ponds habitat. Through this activity, the team reached over twenty five Lane County residents. Many of the participants expressed interest in returning to the ponds in the future.
7.3 Education and Outreach
Delta Ponds Fish Derby

72
In addition to the fish derby the Delta Ponds SLP team hosted a Middle School Day of Caring volunteer event for middle school students interested in habitat restoration. Ten middle school students spent a full day with SLP students and participated in nesting site preparation for western pond turtles, salamander surveys, visual surveys of western pond turtle and invasive vegetation removal. The students also learned about the monitoring and restoration efforts at the Delta Ponds. The SLP team also created four posters describing Delta Ponds history, chinook salmon, western ponds turtles and invasive species. These posters were displayed at the fish derby and project presentations and are available in Appendix 9. Throughout the project, the SLP Delta Ponds was fortunate to have many opportunities to conduct informal outreach to community members at the ponds. On several occasions anglers and people using the bike path for recreation noticed our activities at the pond and were interested in learning more about the project. Several passersby learned about the western pond turtle monitoring and their native, sensitive species status. Anglers were also informed about the type of fish utilizing the pond. On one occasion a gentleman observed the vegetation survey and took away information about volunteering with the Eugene Stream Team. Another angler helped check the turtle traps one day and asked for volunteer contact information. The team’s efforts at the Delta Ponds also generated some publicity. The Eugene Register Guard featured a story detailing the red-legged frog monitoring effort. In addition Eugene’s local television station KVAL featured the Stream Team’s native vegetation replanting efforts and the turtle monitoring effort. Local station KMTR also aired a story on the team’s turtle monitoring efforts. Finally, the team conducted more formal outreach in the form of two final project presentations. The first 20 minute presentation was given to SLP students, project managers and clients on June 7th at the University of Oregon. The second 45 minute presentation was given to City of Eugene Parks and Open Spaces employees on June 9th at their city office.
Middle School Day of Caring

73
CCoonncclluussiioonn The monitoring plans created and the data gathered in this project represent a significant step toward enhancing the Delta Ponds for native vegetation and wildlife. It is clear that, despite decades of disturbance to the Delta Ponds area and the high density of development surrounding it; these ponds offer habitat to numerous native species. Only through an accurate inventory of the species that currently exist at the ponds that we can hope to rebuild the area to foster the propagation of a healthy ecosystem for the future. The information gathered in this project is important for the rest of the Delta Ponds habitat enhancement project. Our goals in the project were to determine the presence, abundance and distribution of a variety of species as well at to create viable monitoring protocols for future use. This report details the achievement of these goals and will serve as a baseline for all future monitoring at the project site.
74
Adams, Michael J., Christopher A. Pearl, R. Bruce Bury. “Wetlands Management for Amphibians in the Willamette Valley” USGS Forest and Rangeland Ecosystem Science Center. 12 Dec. 2002. <http://www.fresc.usgs.gov/products/fs/fs-2004-3039.pdf> Behnke, Robert. Native Trout of Western North America. American Fisheries Society; Bethesda, Maryland: 1992 Bell, Gordon. Pacific Salmon: from Egg to Exit. Hancock House Publishers; Blain, Washington: 1996 Brown, S. "Rana aurora" Animal Diversity Web. 2000. Feb. 15 2005 <http://animaldiversity.ummz.umich.edu/site/accounts/information/Rana_aurora.html.> Bruening, S. 2002. "Rana catesbeiana" (On-line), Animal Diversity Web. Feb. 02, 2005 <http://animaldiversity.ummz.umich.edu/site/accounts/information/Rana_catesbeiana> City of Eugene Parks and Open Space. Delta Ponds Restoration and Recreation Project. Jun. 03,
2005. < http://www.ci.eugene.or.us/PARKS/planning/DELT_proj.htm> City of Eugene Parks and Open Spaces. Emergent Wetland. 14 Feb.2005. <http://www.ci.eugene.or.us/parks/wetlands/seeds.pdf> Griffith, Randy Scott. Fraxinus Americana U.S. Department of Agriculture, Forest Service. 1991. 2 Feb. 2005 <http://www.fs.fed.us/database/feis/> Hitchcock C. Leo, Arthur Cronquist, eds. Flora of the Pacific Northwest. Seattle: University of Washington Press, 1973. Holland, Dan C. The western pond turtle: habitat and history: final report U.S. Department of Energy, Bonneville Power Administration, Environment, Fish, and Wildlife. 1994 Lovich, Jeff. Meyer, Kathie. „The western pond turtle (Clemmys marmorata) in the Mojave River, California, USA: highly adapted survivor or tenuous relict?” Journal of Zoology.
Vol. 256.4 (2002) 537-545. McWilliams, Jack. Symphoricarpos albus. U.S. Department of Agriculture, Forest Service. 2000. 2 Feb. 2005. <http://www.fs.fed.us/database/feis/> Murphy, Martin. “Introduced Species Summary Project: North American Bullfrog (Rana Castesbeiana).” Feb. 17 2003. <http://www.columbia.edu/itc/cerc/danoff- burg/invasion_bio/inv_spp_summ/Rana_catesbeiana.htm>
References

75
Oregon Department of Fish and Wildlife. Willamette Daisy. Mar. 2002. 11 Feb. 2005 <http://oregonfwo.fws.gov/EndSpp/FactsPlants/WillametteDaisy.htm> Pacific Chorus frog. 8 Feb. 2005. <http://wlapwww.gov.bc.ca/wld/frogwatch/whoswho/factshts/pactree.htm> Pendergrass, Mara. “Introduced Species Summary Project: Red Eared Slider (Trachemys scripta elegans).” Dec. 9 2002. <http://www.columbia.edu/itc/cerc/danoff- burg/invasion_bio/inv_spp_summ/Red-eared%20Slider%20Turtle.html> Pojar, Jim, Andy MacKinnon. Plants of the Pacific Northwest Coast: Washington, Oregon, British Columbia & Alaska. Vancouver: Lone Pine Publishing, 1994. Ramey, Victor. Non-native Invasive Aquatic Plants in the United States. Jul. 2001. <htpp://aquat1.ifas.ufl.edu/seagrant/iripse2.html> Red Legged Frog. 8 Feb. 2005 <http://wlapwww.gov.bc.ca/wld/frogwatch/whoswho/factshts/redleg.htm> Romansic, John. Ambystoma gracile. Ed. Duncan Parks and Meredith J. Mahoney. 8 Feb. 2005.
http://elib.cs.berkeley.edu/cgi-bin/amphib_query?where-genus=Ambystoma&where-species=gracile.>
Schoenig, Steve. Cytisus Scoparius. Encycloweedia California State Department of Food and Agriculture. 9 Mar. 2004. 2 Feb. 2005 <http://www.cdfa.ca.gov/phpps/ipc/weedinfo/winfo_list-synonyms.htm> State of Oregon Department of Fish and Wildlife (ODFW1). “Evaluation of the Northern Pikeminnow Management Program.” Feb. 15, 2005 http://www.dfw.state.or.us/ODFWhtml/InfoCntrFish/InterFish/criwebpage/pikeminn.htm State of Oregon Department of Fish and Wildlife (ODFW2). “Oregon Chub.” February 15, 2005 < http://www.dfw.state.or.us/ODFWhtml/springfield/Orchub.html> State of Oregon Department of Fish and Wildlife (ODFW3). “Fish of the McKenzie River. February 16, 2005 < http://www.dfw.state.or.us/ODFWhtml/ springfield/McKFish.html> State of Oregon Department of Fish and Wildlife (ODFW4). “Oregon’s Warm Water Game Fish.” February 16, 2005 <http://www.dfw.state.or.us/ODFWhtml/ springfield/warmwater.html> Steelquist, Robert. Adopt-A-Stream Foundation Field Guide to the Pacific Salmon. Sasquatch; Seattle, WA: 1996 Steinberg, Peter D. Populus Balsimifera ssp. Trichocarpa. U.S. Department of Agriculture, Forest Service. 2001. 18 May 2005 <http://www.fs.fed.us/database/feis/> Strong, Leah. Landowner Guides to Streamside Living. Snohomish County Surface Water
76
Management. 29 Nov. 2004. 11 Feb. 2005 <http://www.co.snohomish.wa.us/publicwk/swm/StreamsideLandowners/FAQs/Invasive%20Weeds%20FAQ.htm>
Swearingen, Jil M., Sandra Deidrich. “English Ivy” National Park Service. 4 Dec. 2000. 2 Feb. 2005 < http://www.nps.gov/plants/alien/fact/hehe1.htm> Todd, Laura L. (Laura Lynn) The Ecology and Habitat Use of the Northwestern Pond Turtle (Clemmys marmorata marmorata) in a lake in southwestern Oregon [microform]/
[Portland, Or.] : Portland State University; [Washington, D.C. : U.S. Fish and Wildlife Service, 1998]
Trotter, Patrick. Cutthroat, Native Trout to the West. Colorado Associated University Press; Boulder, Colorado: 1987 Tirmenstein, D. “ Rubus discolor”. U.S. Department of Agriculture, Forest Service. 1989. 2 Feb. 2005 <http://www.fs.fed.us/database/feis/> Uchytil, Ronald J. “Salix lasiandra” U.S. Department of Agriculture, Forest Service. 1989. 2 Feb. 2005 <http://www.fs.fed.us/database/feis/> University of California, Berkeley (UC Berkeley). “Smallmouth Bass - Micropterus dolomieui (Lacepede)” 2004. Feb. 17, 2005. <http://elib.cs.berkeley.edu/kopec/tr9/html/sp-smallmouth-bass.html> U.S. Army Corps of Engineers, Portland District. “Eugene Delta Ponds Section 206 Restoration Project.” September 2002. Watson, James W., Kelly R. McAllister, D. John Pierce. “Home Ranges, Movement and Habitat Selection of the Oregon Spotted Frog (Rana pretiosa)” Journal of Herpetology. 37.2 (2003): 292-300.
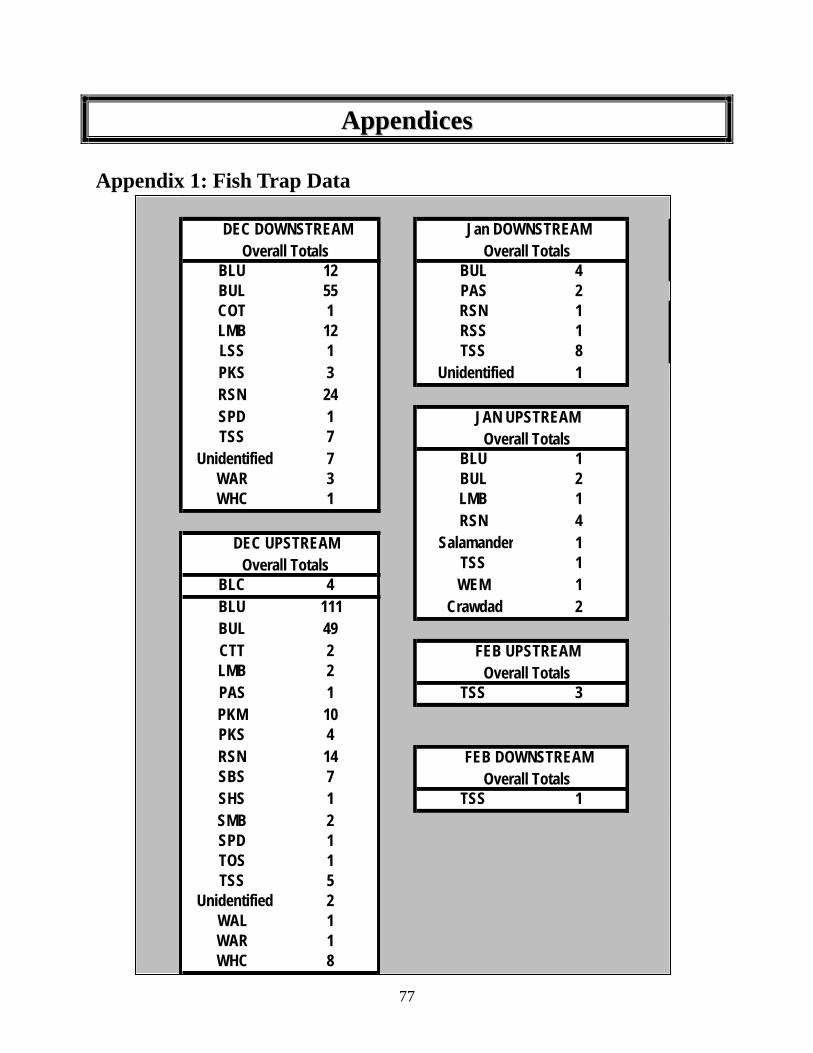
77
AAppppeennddiicceess
Appendix 1: Fish Trap Data
BLU 12 BUL 4BUL 55 PAS 2COT 1 RSN 1LMB 12 RSS 1LSS 1 TSS 8PKS 3 Unidentified 1RSN 24SPD 1TSS 7
Unidentified 7 BLU 1WAR 3 BUL 2WHC 1 LMB 1
RSN 4Salamander 1
TSS 1BLC 4 WEM 1BLU 111 Crawdad 2BUL 49CTT 2LMB 2PAS 1 TSS 3PKM 10PKS 4RSN 14SBS 7SHS 1 TSS 1SMB 2SPD 1TOS 1TSS 5
Unidentified 2WAL 1WAR 1WHC 8
DEC DOWNSTREAMOverall Totals
DEC UPSTREAMOverall Totals
Jan DOWNSTREAMOverall Totals
JAN UPSTREAMOverall Totals
FEB DOWNSTREAMOverall Totals
FEB UPSTREAMOverall Totals

78
Date Species # Caught Length (mm) Comments12/11/04 BLU 1 1412/13/04 BLU 1 12512/10/05 BLU 1 18512/15/04 BLU 1 12412/10/05 BLU 1 110 Picture 1016 & 101812/15/04 BLU 1 10512/12/04 BLU 1 1112/10/05 BLU 1 13712/10/05 BLU 1 13212/10/05 BLU 1 9112/12/04 BLU 1 1012/13/04 BLU 1 123
Total 1212/11/04 BUL 1 712/11/04 BUL 1 812/11/04 BUL 1 7.512/14/04 BUL 3 No Measurement12/15/04 BUL 812/26/04 BUL 1 No Measurement12/17/04 BUL 3 No Measurement12/21/04 BUL 1 No Measurement12/11/04 BUL 1 912/27/04 BUL 1 No Measurement12/10/05 BUL 1 98 Pic 102512/13/04 BUL 1 8512/13/04 BUL 1 9112/18/04 BUL 612/19/04 BUL 10 No Measurement12/20/04 BUL 412/22/04 BUL 4 No Measurement12/24/04 BUL 4 No Measurement12/28/04 BUL 2 No Measurement12/30/04 BUL 1 No Measurement
Total 5512/10/05 COT 1 129 Pics 1027 & 1026
Total 112/18/04 LMB 1 10012/19/04 LMB 1 812/18/04 LMB 1 7512/12/04 LMB 1 712/12/04 LMB 1 6.512/12/04 LMB 1 1012/10/05 LMB 1 76 Pic 102312/10/05 LMB 1 6212/12/04 LMB 1 912/12/04 LMB 1 912/18/04 LMB 1 80
DOWNSTREAM MIGRATION TRAP
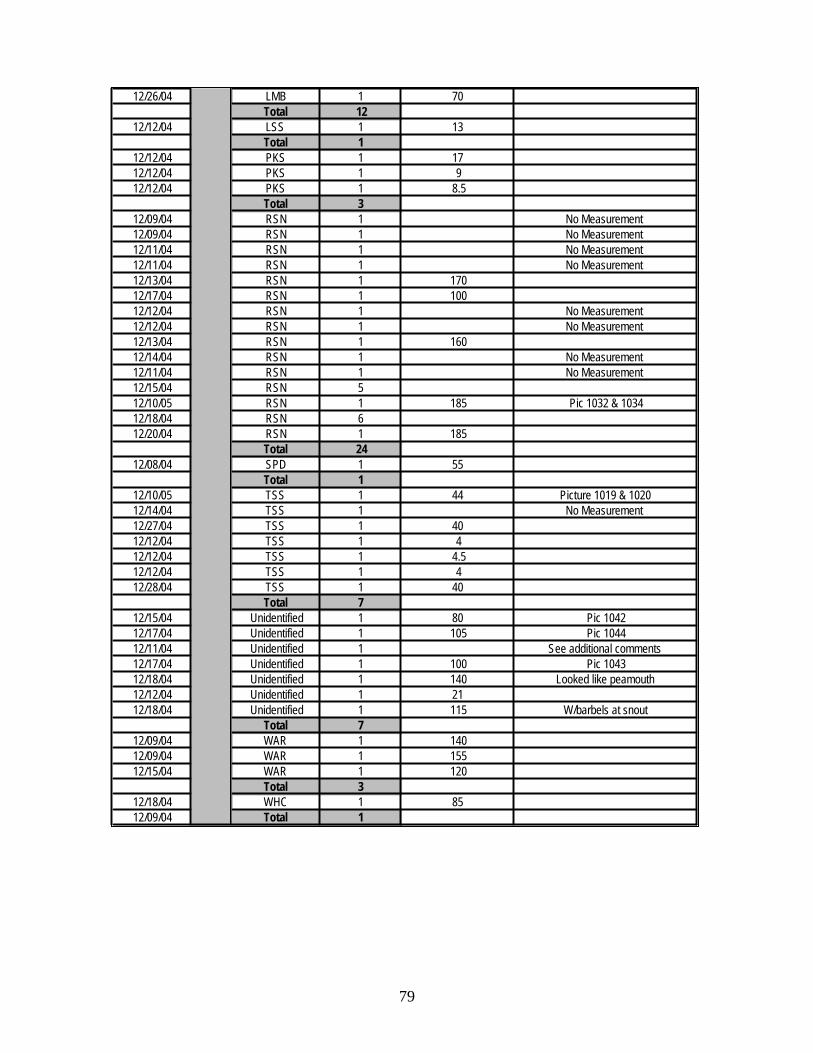
79
12/26/04 LMB 1 70Total 12
12/12/04 LSS 1 13Total 1
12/12/04 PKS 1 1712/12/04 PKS 1 912/12/04 PKS 1 8.5
Total 312/09/04 RSN 1 No Measurement12/09/04 RSN 1 No Measurement12/11/04 RSN 1 No Measurement12/11/04 RSN 1 No Measurement12/13/04 RSN 1 17012/17/04 RSN 1 10012/12/04 RSN 1 No Measurement12/12/04 RSN 1 No Measurement12/13/04 RSN 1 16012/14/04 RSN 1 No Measurement12/11/04 RSN 1 No Measurement12/15/04 RSN 512/10/05 RSN 1 185 Pic 1032 & 103412/18/04 RSN 612/20/04 RSN 1 185
Total 2412/08/04 SPD 1 55
Total 112/10/05 TSS 1 44 Picture 1019 & 102012/14/04 TSS 1 No Measurement12/27/04 TSS 1 4012/12/04 TSS 1 412/12/04 TSS 1 4.512/12/04 TSS 1 412/28/04 TSS 1 40
Total 712/15/04 Unidentified 1 80 Pic 104212/17/04 Unidentified 1 105 Pic 104412/11/04 Unidentified 1 See additional comments12/17/04 Unidentified 1 100 Pic 104312/18/04 Unidentified 1 140 Looked like peamouth12/12/04 Unidentified 1 2112/18/04 Unidentified 1 115 W/barbels at snout
Total 712/09/04 WAR 1 14012/09/04 WAR 1 15512/15/04 WAR 1 120
Total 312/18/04 WHC 1 8512/09/04 Total 1
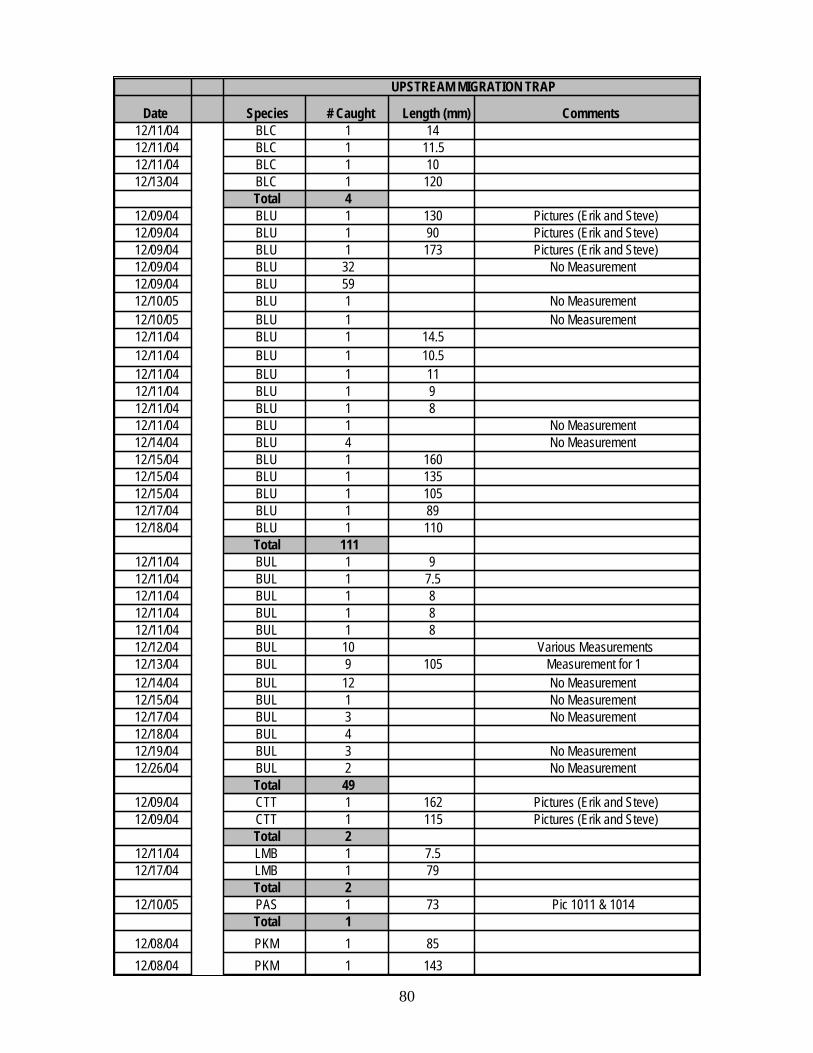
80
Date Species # Caught Length (mm) Comments12/11/04 BLC 1 1412/11/04 BLC 1 11.512/11/04 BLC 1 1012/13/04 BLC 1 120
Total 412/09/04 BLU 1 130 Pictures (Erik and Steve)12/09/04 BLU 1 90 Pictures (Erik and Steve)12/09/04 BLU 1 173 Pictures (Erik and Steve)12/09/04 BLU 32 No Measurement12/09/04 BLU 5912/10/05 BLU 1 No Measurement12/10/05 BLU 1 No Measurement12/11/04 BLU 1 14.512/11/04 BLU 1 10.512/11/04 BLU 1 1112/11/04 BLU 1 912/11/04 BLU 1 812/11/04 BLU 1 No Measurement12/14/04 BLU 4 No Measurement12/15/04 BLU 1 16012/15/04 BLU 1 13512/15/04 BLU 1 10512/17/04 BLU 1 8912/18/04 BLU 1 110
Total 11112/11/04 BUL 1 912/11/04 BUL 1 7.512/11/04 BUL 1 812/11/04 BUL 1 812/11/04 BUL 1 812/12/04 BUL 10 Various Measurements12/13/04 BUL 9 105 Measurement for 112/14/04 BUL 12 No Measurement12/15/04 BUL 1 No Measurement12/17/04 BUL 3 No Measurement12/18/04 BUL 412/19/04 BUL 3 No Measurement12/26/04 BUL 2 No Measurement
Total 4912/09/04 CTT 1 162 Pictures (Erik and Steve)12/09/04 CTT 1 115 Pictures (Erik and Steve)
Total 212/11/04 LMB 1 7.512/17/04 LMB 1 79
Total 212/10/05 PAS 1 73 Pic 1011 & 1014
Total 112/08/04 PKM 1 8512/08/04 PKM 1 143
UPSTREAM MIGRATION TRAP

81
12/08/04 PKM 1 14012/08/04 PKM 1 9812/08/04 PKM 1 9012/08/04 PKM 1 10012/08/04 PKM 1 10412/09/04 PKM 3 No Measurement
Total 1012/09/04 PKS 4 No Measurement
Total 412/09/04 RSN 3 No Measurement12/12/04 RSN 1 No Measurement12/12/04 RSN 1 No Measurement12/13/04 RSN 1 16012/14/04 RSN 2 No Measurement12/17/04 RSN 1 17112/18/04 RSN 412/21/04 RSN 1 165
Total 1412/09/04 SBS 7 LBS or SBS, no red eyes
Total 712/11/04 SHS 1 14
Total 112/11/04 SMB 1 1512/15/04 SMB 1 85
Total 212/08/04 SPD 1 44
Total 112/09/04 TOS 1 No Measurement
Total 112/09/04 TSS 1 No Measurement12/11/04 TSS 1 4.512/15/04 TSS 1 4012/27/04 TSS 1 4512/27/04 TSS 1 45
Total 512/12/04 Unidentified 1 9 Note said "100-1000-38"12/18/04 Unidentified 1 190 Looked like peamouth with chisel mouth
Total 212/15/04 WAL 1 105
Total 112/09/04 WAR 1 No Measurement
Total 112/09/04 WHC 1 26 No Measurement12/11/04 WHC 1 7.512/11/04 WHC 1 712/12/04 WHC 1 1112/12/04 WHC 1 1012/12/04 WHC 1 1112/12/04 WHC 1 912/12/04 WHC 1 912/10/05 Total 8

82
Date Species # Caught Length (mm) Comments01/10/05 BLU 1 90
Total 101/07/05 BUL 1 No Measurement01/17/05 BUL 1
Total 201/04/05 LMB 1 40
Total 101/19/05 RSN 1 13001/20/05 RSN 101/31/05 RSN 2 Mating
Total 401/26/05 Salamander 1 190 Dark brown, flat tail
Total 101/10/05 TSS 1 4501/12/05 TSS 1 3501/13/05 TSS 1 4001/21/05 TSS 1 5501/25/05 TSS 1 4501/25/05 TSS 1 4001/30/05 TSS 1 50 Pregnant
Total 701/13/05 WEM 1 25
Total 101/05/04 Crawdad 1 100 Crawdad01/05/04 Crawdad 1 130 Crawdad
Total 2
UPSTREAM MIGRATION TRAP
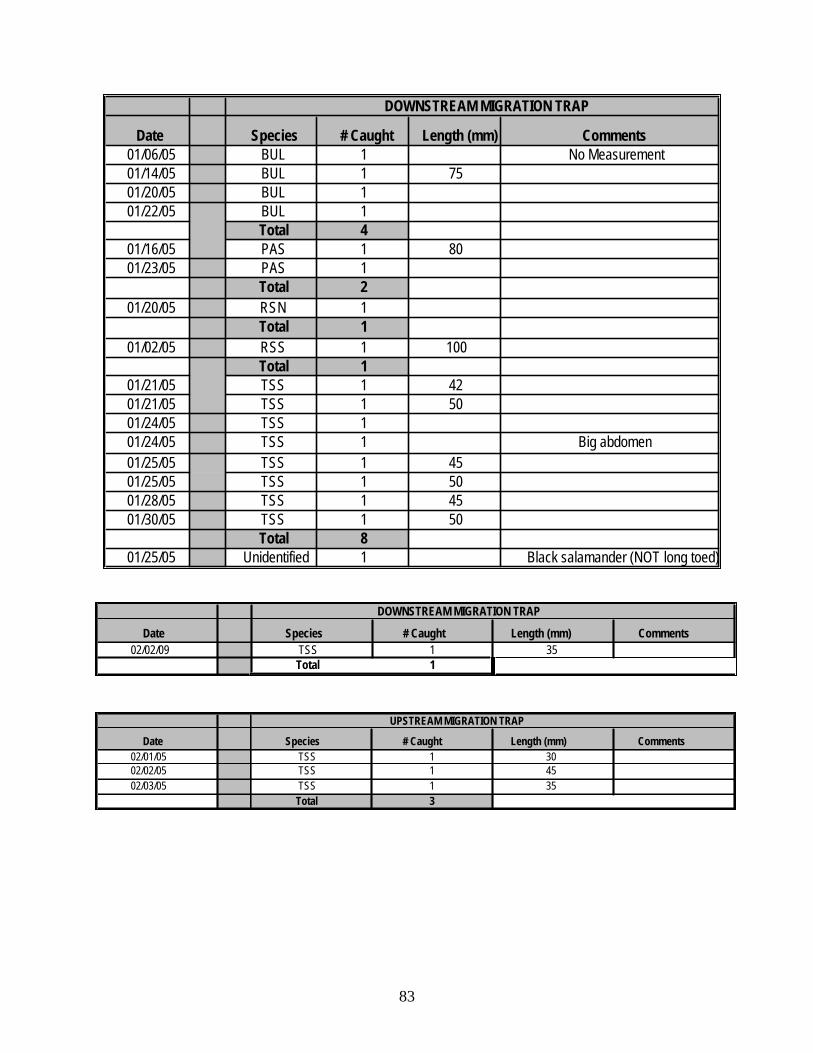
83
Date Species # Caught Length (mm) Comments01/06/05 BUL 1 No Measurement01/14/05 BUL 1 7501/20/05 BUL 101/22/05 BUL 1
Total 401/16/05 PAS 1 8001/23/05 PAS 1
Total 201/20/05 RSN 1
Total 101/02/05 RSS 1 100
Total 101/21/05 TSS 1 4201/21/05 TSS 1 5001/24/05 TSS 101/24/05 TSS 1 Big abdomen01/25/05 TSS 1 4501/25/05 TSS 1 5001/28/05 TSS 1 4501/30/05 TSS 1 50
Total 801/25/05 Unidentified 1 Black salamander (NOT long toed)
DOWNSTREAM MIGRATION TRAP
Date Species # Caught Length (mm) Comments02/02/09 TSS 1 35
Total 1
DOWNSTREAM MIGRATION TRAP
Date Species # Caught Length (mm) Comments02/01/05 TSS 1 3002/02/05 TSS 1 4502/03/05 TSS 1 35
Total 3
UPSTREAM MIGRATION TRAP
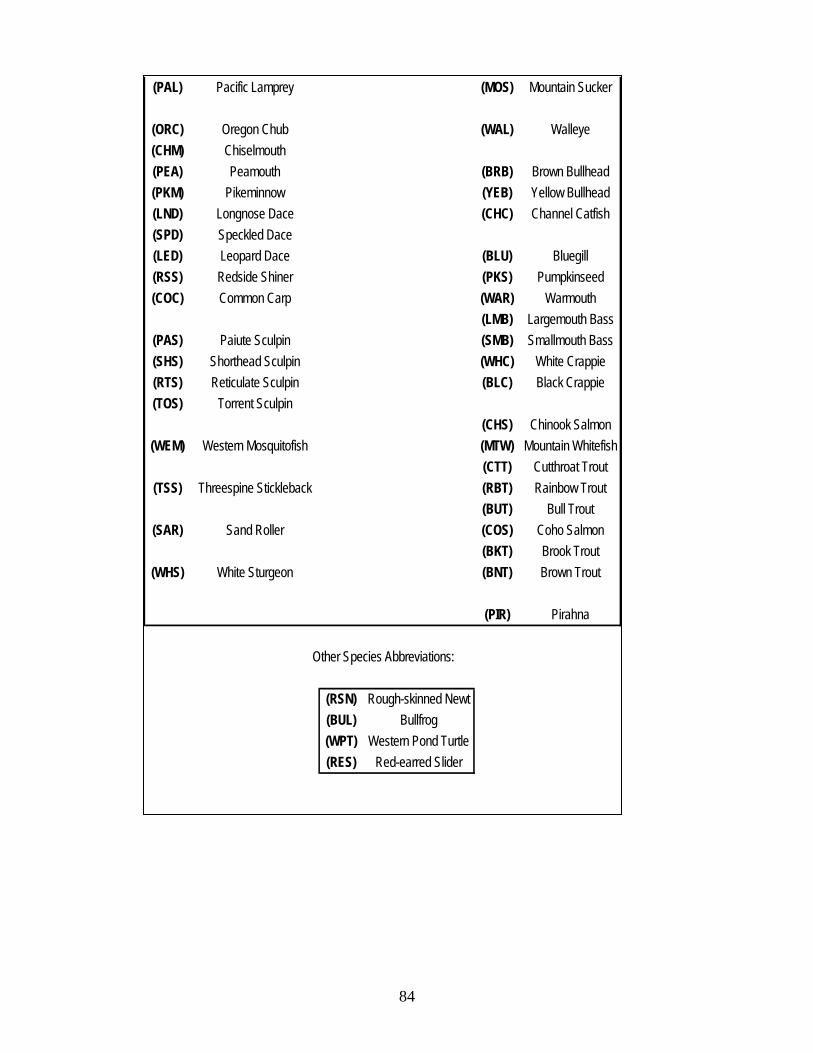
84
(PAL) Pacific Lamprey (MOS) Mountain Sucker
(ORC) Oregon Chub (WAL) Walleye(CHM) Chiselmouth(PEA) Peamouth (BRB) Brown Bullhead(PKM) Pikeminnow (YEB) Yellow Bullhead(LND) Longnose Dace (CHC) Channel Catfish(SPD) Speckled Dace(LED) Leopard Dace (BLU) Bluegill(RSS) Redside Shiner (PKS) Pumpkinseed(COC) Common Carp (WAR) Warmouth
(LMB) Largemouth Bass(PAS) Paiute Sculpin (SMB) Smallmouth Bass(SHS) Shorthead Sculpin (WHC) White Crappie(RTS) Reticulate Sculpin (BLC) Black Crappie(TOS) Torrent Sculpin
(CHS) Chinook Salmon(WEM) Western Mosquitofish (MTW) Mountain Whitefish
(CTT) Cutthroat Trout(TSS) Threespine Stickleback (RBT) Rainbow Trout
(BUT) Bull Trout(SAR) Sand Roller (COS) Coho Salmon
(BKT) Brook Trout(WHS) White Sturgeon (BNT) Brown Trout
(PIR) Pirahna
(RSN) Rough-skinned Newt(BUL) Bullfrog(WPT) Western Pond Turtle(RES) Red-earred Slider
Other Species Abbreviations:

85
Date Weather Seine Pull# Species # Caught Length (mm) Crew Comments
04/30/05 P. Cloudy 1 BLU 1 125
Savannah, Jennifer, Mandy, Rhonda, John, Dave, Erik
Seine was twisted, Lots of Vegetation
04/30/05 P. Cloudy 1 BLU 1 55
Savannah, Jennifer, Mandy, Rhonda, John, Dave, Erik
Seine was twisted, Lots of Vegetation
04/30/05 P. Cloudy 1 BLU 1 46
Savannah, Jennifer, Mandy, Rhonda, John, Dave, Erik
Seine was twisted, Lots of Vegetation
04/30/05 P. Cloudy 2 BLU 1 56
Savannah, Jennifer, Mandy, Rhonda, John, Dave, Erik
04/30/05 P. Cloudy 2 BLU 1 45
Savannah, Jennifer, Mandy, Rhonda, John, Dave, Erik
04/30/05 P. Cloudy 2 BLU 1 39
Savannah, Jennifer, Mandy, Rhonda, John, Dave, Erik
Bluegill was injured in pull
04/30/05 P. Cloudy 2 BLU 1 53
Savannah, Jennifer, Mandy, Rhonda, John, Dave, Erik
04/30/05 P. Cloudy 2 BLU 1 66
Savannah, Jennifer, Mandy, Rhonda, John, Dave, Erik
04/30/05 P. Cloudy 2 BLU 1 60
Savannah, Jennifer, Mandy, Rhonda, John, Dave, Erik
04/30/05 P. Cloudy 3 BLU 1 69
Savannah, Jennifer, Mandy,
Seine pulled in fast and floats sank, Lots
Appendix 2: Fish Seining Data

86
Rhonda, John, Dave, Erik
of Vegetation
04/30/05 P. Cloudy 3 BLU 1 62
Savannah, Jennifer, Mandy, Rhonda, John, Dave, Erik
Seine pulled in fast and floats sank, Lots of Vegetation

87
Appendix 3: Turtle Trapping Data
Date Species Sex Length (mm) Weight (g) Trap Location Recapture Comments
24-Apr WPT F 140.75 685 C224-Apr WPT F 160 850 C324-Apr WPT M 160 660 C324-Apr WPT F 175 >1kg C324-Apr WPT M 160 605 J125-Apr WPT M 170 680 C325-Apr WPT F 129 320 C325-Apr WPT F 162 620 F225-Apr RES 235 >1kg G125-Apr WPT M 180 270 H225-Apr WPT 160 710 H225-Apr RES 230 >1kg H225-Apr RES 220 >1kg J126-Apr WPT M 158 690 C326-Apr WPT M 175 920 G126-Apr RES 130 240 L126-Apr RES 120 320 L127-Apr WPT F 180 840 C327-Apr WPT M 180 860 G1 missing right rear foot27-Apr RES 230 >1kg H227-Apr RES 220 >1kg J1 euthanized27-Apr RES 250 >1kg J1 euthanized28-Apr WPT M 165 750 H228-Apr RES 225 >1kg H228-Apr RES 200 >1kg H228-Apr RES 220 >1kg H229-Apr WPT M 165 680 D129-Apr RES 230 >1kg D229-Apr WPT M 165 720 J1 yes29-Apr RES 210 >1kg J1 yes29-Apr WPT M 180 71029-Apr RES 245 >1kg H2 euthanized30-Apr RES 260 >1kg D130-Apr WPT M 195 940 F21-May RES 155 525 D11-May RES 240 >1kg L11-May RES 195 >1kg L12-May WPT F 112 285 D12-May RES 172 405 D22-May WPT M 160 750 C32-May RES 240 >1kg E1 yes2-May WPT M 157 700 J1 yes3-May WPT M 175 710 C23-May WPT M 175 910 F2 yes4-May WPT M 170 660 C3 yes4-May WPT F 128 360 C34-May WPT M 160 700 C1 yes4-May RES 225 >1kg L15-May RES 245 >1kg yes5-May WPT M 170 680 J1 yes5-May WPT M 160 560 J16-May RES E1 yes euthanized7-May WPT F 162 610 G18-May WPT M 180 660 D2 yes8-May WPT M 168 680 C1 yes8-May WPT M 160 610 F2 yes

88
Visual Survey Summary
WPT RES Total Marked Unmarked Marked Unmarked
Survey1 16 18 4 78 116
Survey2 18 19 5 97 139
Survey3 10 10 2 43 65 44 47 218
Survey 1 Pond Marked Unmarked Totals E/D 4 6 10 C 6 5 11 F 0 0 0 J 2 2 4 L 2 0 2 G/H 2 5 7 totals 16 18 34
Survey 2 Pond Marked Unmarked Totals E/D 4 6 10 C 7 6 13 F 0 0 0 J 2 1 3 L 3 1 4 G/H 2 5 7 totals 18 19 37
Survey 3 Pond Marked Unmarked Totals E/D 4 4 8 C 4 4 8 F 0 0 0 J 1 0 1 L 0 1 1 G/H 1 1 2 totals 10 10 20
Appendix 4: Turtle Data Analysis

89
Total Marked
Total Unmarked
Turtles Observed
E/D 12 16 28 C 17 15 32 F 0 0 0 J 5 3 8 L 5 2 7 G/H 5 11 16 44 91
Pond E/D Turtles Marked 5 Turtles Observed 28
Turtles Observed with marks 12
Predicted Turtles in Pond 12 Pond C Turtles Marked 11 Turtles Observed 32
Turtles Observed with marks 17
Predicted Turtles in Pond 21 Pond F Turtles Marked 2 Turtles Observed 0
Turtles Observed with marks 0
Predicted Turtles in Pond - Pond J Turtles Marked 3 Turtles Observed 8
Turtles Observed with marks 5
Predicted Turtles in Pond 5 Pond L Turtles Marked 0 Turtles Observed 7
Turtles Observed with marks 5
Predicted Turtles in Pond 0 Pond G/H Turtles Marked 6 Turtles Observed 16
Turtles Observed with marks 5
Predicted Turtles in Pond 19
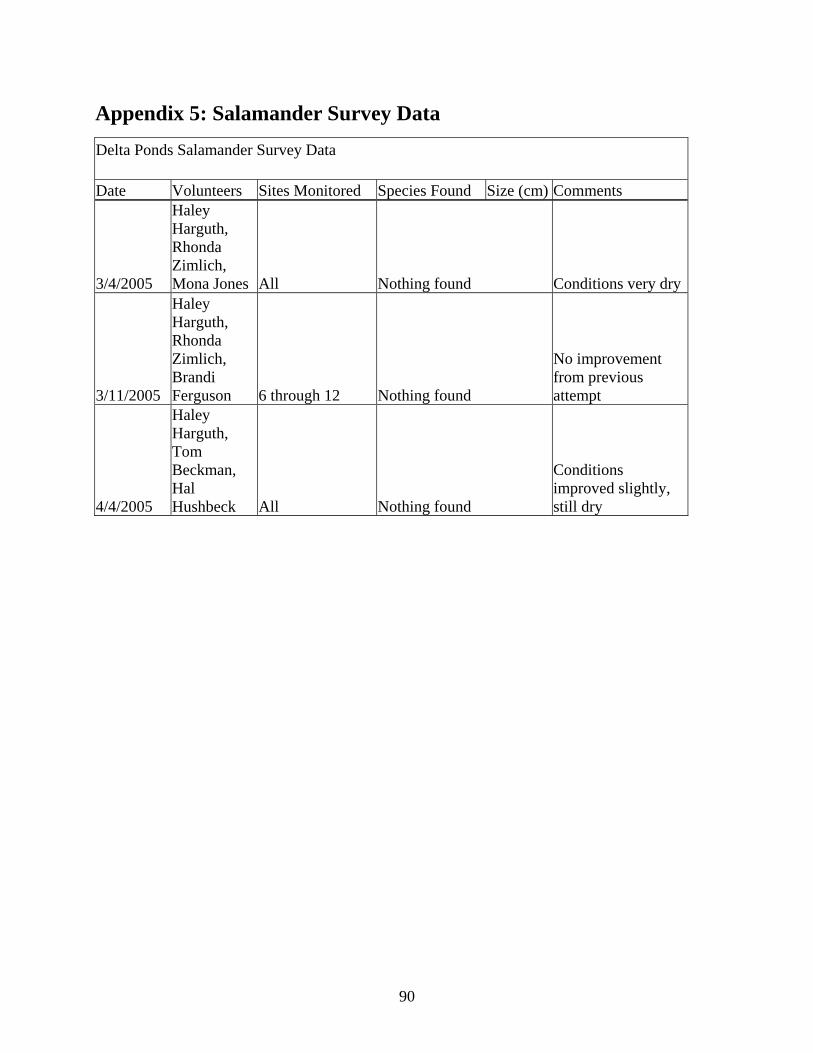
90
Delta Ponds Salamander Survey Data Date Volunteers Sites Monitored Species Found Size (cm) Comments
3/4/2005
Haley Harguth, Rhonda Zimlich, Mona Jones All Nothing found Conditions very dry
3/11/2005
Haley Harguth, Rhonda Zimlich, Brandi Ferguson 6 through 12 Nothing found
No improvement from previous attempt
4/4/2005
Haley Harguth, Tom Beckman, Hal Hushbeck All Nothing found
Conditions improved slightly, still dry
Appendix 5: Salamander Survey Data

91
Red Legged Frog Egg Mass Survey Data
Date Volunteers Location Egg Masses
2/12/2005
Haley Harguth Rhonda Zimlich Kate Darby Pond area Nothing found
2/19/2005
Haley Harguth Mona Jones Kate Darby
Northern section of Deidrick slough Nothing found
3/5/2005 Haley Harguth Dan Davis Selected regions of pond area Nothing found
Appendix 6: Red-Legged Frog Survey Data

92
Bullfrog Vocalization Survey Results Date of Survey
Site 4/6/2005 4/13/2005 4/20/2005 Start Time: 9:04 PM Start Time: Start Time: 8:46 PM Stop Time: 9:09 PM Stop Time: Stop Time: 8:56 PM
1
Observations: chorus frogs continuous and very loud to the W, NW and N
Observations: Observations: lots of chorus frogs to SW and NW
Start Time: 9:11 PM Start Time: Start Time: 8:57 PM Stop Time: 9:16 PM Stop Time: Stop Time: 9:07 PM
1a
Observations: chorus frogs continuous and very loud to the SW, W, NW and N
Observations: Observations: lots of chorus frogs to SW and NW
Start Time: 8:42 PM Start Time: 8:52 PM Start Time: Stop Time: 8:47 PM Stop Time: 8:57 PM Stop Time:
2
Observations: chorus frogs continuous and very loud to the SW and N
Observations: chorus frogs continuous to the WSW, SW, and S
Observations: chorus frogs continuous to the W, SW, and S
Start Time: 8:51 PM Start Time: 8:42 PM Start Time: Stop Time: 8:56 PM Stop Time: 8:47 PM Stop Time:
2a
Observations: chorus frogs continuous and loud to SW and N
Observations: chorus frogs continuous to the WSW, and W
Observations: chorus frogs continuous to the NW, W, SW, and W
Start Time: 9:18 PM Start Time: Start Time: 9:17 PM Stop Time: 9:24 PM Stop Time: Stop Time: 9:22 PM
3
Observations: intermittent chorus frogs
Observations: Observations: lots of traffic noise, distant chorus frogs to W, N
Start Time: 9:08 PM Start Time: Start Time: 9:07 PM Stop Time: 9:13 PM Stop Time: Stop Time: 9:13 PM
3a
Observations: lots of traffic noise, nutria in water
Observations: Observations: lots of highway noise, fish in water, distant chorus frogs to N
Start Time: 8:58 PM Start Time: Start Time: 8:55 PM 4 Stop Time: 9:03 PM Stop Time: Stop Time: 9:01 PM
Appendix 7: Bullfrog Vocalization Survey Data

93
Observations: warm, lots of chorus frogs to NW
Observations: Observations: chorus frogs continuous to SW, W, NW, beaver in water to E
Start Time: 8:49 PM Start Time: Start Time: 8:46 PM Stop Time: 8:54 PM Stop Time: Stop Time: 8:51 PM
4a
Observations: lots of chorus frogs to SW
Observations: Observations: lots of chorus frogs to NW, W, SW, S, SE
Start Time: Start Time: 9:15 PM Start Time: 9:02 PM Stop Time: Stop Time: 9:20 PM Stop Time: 9:12 PM
5
Observations: Observations: bullfrog to NW chorus frogs to W, NW, and SE
Observations: bullfrog to NW, lots of chorus frogs to W, NW
Start Time: Start Time: 9:04 PM Start Time: 8:46 PM Stop Time: Stop Time: 9:09 PM Stop Time: 8:56 PM
5a
Observations: Observations: Bullfrog to NE chorus frogs to SW, NE, and E
Observations: bullfrog to E, lots of chorus frogs to NE, E, SE
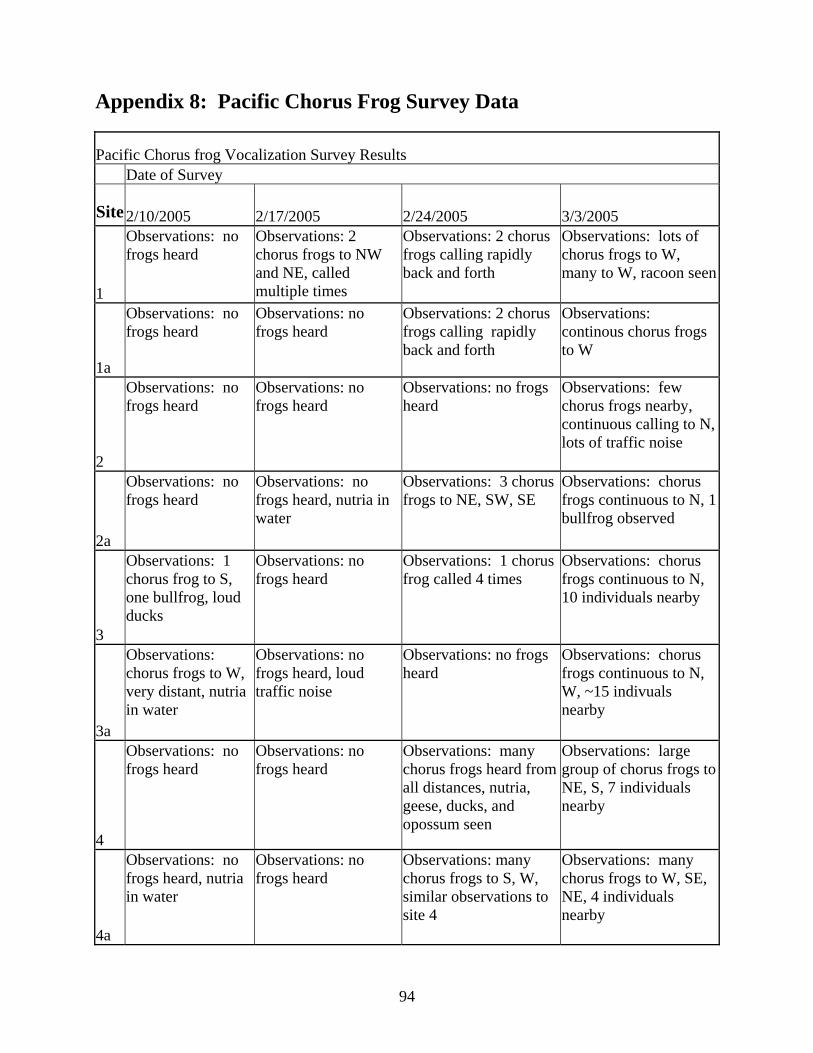
94
Pacific Chorus frog Vocalization Survey Results Date of Survey
Site 2/10/2005 2/17/2005 2/24/2005 3/3/2005
1
Observations: no frogs heard
Observations: 2 chorus frogs to NW and NE, called multiple times
Observations: 2 chorus frogs calling rapidly back and forth
Observations: lots of chorus frogs to W, many to W, racoon seen
1a
Observations: no frogs heard
Observations: no frogs heard
Observations: 2 chorus frogs calling rapidly back and forth
Observations: continous chorus frogs to W
2
Observations: no frogs heard
Observations: no frogs heard
Observations: no frogs heard
Observations: few chorus frogs nearby, continuous calling to N, lots of traffic noise
2a
Observations: no frogs heard
Observations: no frogs heard, nutria in water
Observations: 3 chorus frogs to NE, SW, SE
Observations: chorus frogs continuous to N, 1 bullfrog observed
3
Observations: 1 chorus frog to S, one bullfrog, loud ducks
Observations: no frogs heard
Observations: 1 chorus frog called 4 times
Observations: chorus frogs continuous to N, 10 individuals nearby
3a
Observations: chorus frogs to W, very distant, nutria in water
Observations: no frogs heard, loud traffic noise
Observations: no frogs heard
Observations: chorus frogs continuous to N, W, ~15 indivuals nearby
4
Observations: no frogs heard
Observations: no frogs heard
Observations: many chorus frogs heard from all distances, nutria, geese, ducks, and opossum seen
Observations: large group of chorus frogs to NE, S, 7 individuals nearby
4a
Observations: no frogs heard, nutria in water
Observations: no frogs heard
Observations: many chorus frogs to S, W, similar observations to site 4
Observations: many chorus frogs to W, SE, NE, 4 individuals nearby
Appendix 8: Pacific Chorus Frog Survey Data

95
5
Observations: loud traffic noise, no frogs heard
Observations: no frogs heard
Observations: chorus frogs continuous to N, S, SW
Observations: many chorus frogs to W, NW, individuals heard at distance to E
5a
Observations: loud traffic noise, no frogs heard
Observations: no frogs heard
Observations: lots of chorus frogs to E, individuals to N, S, W
Observations: many chorus frogs to E, several closer to S
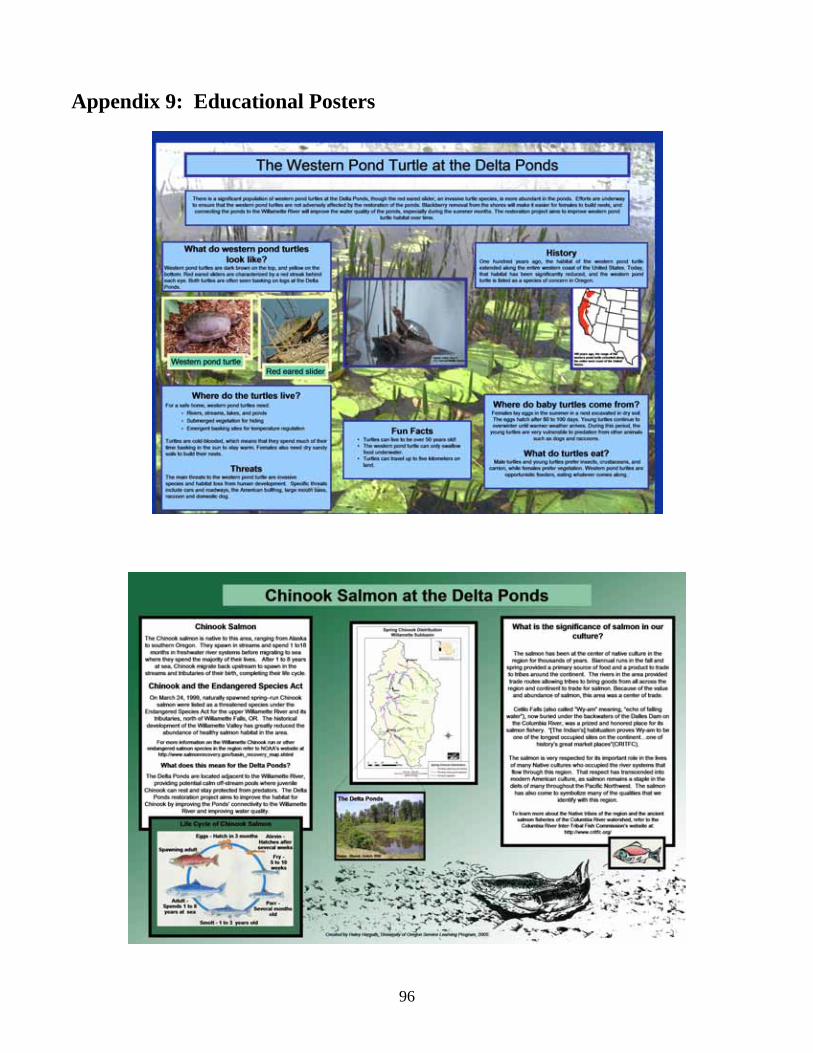
96
Appendix 9: Educational Posters
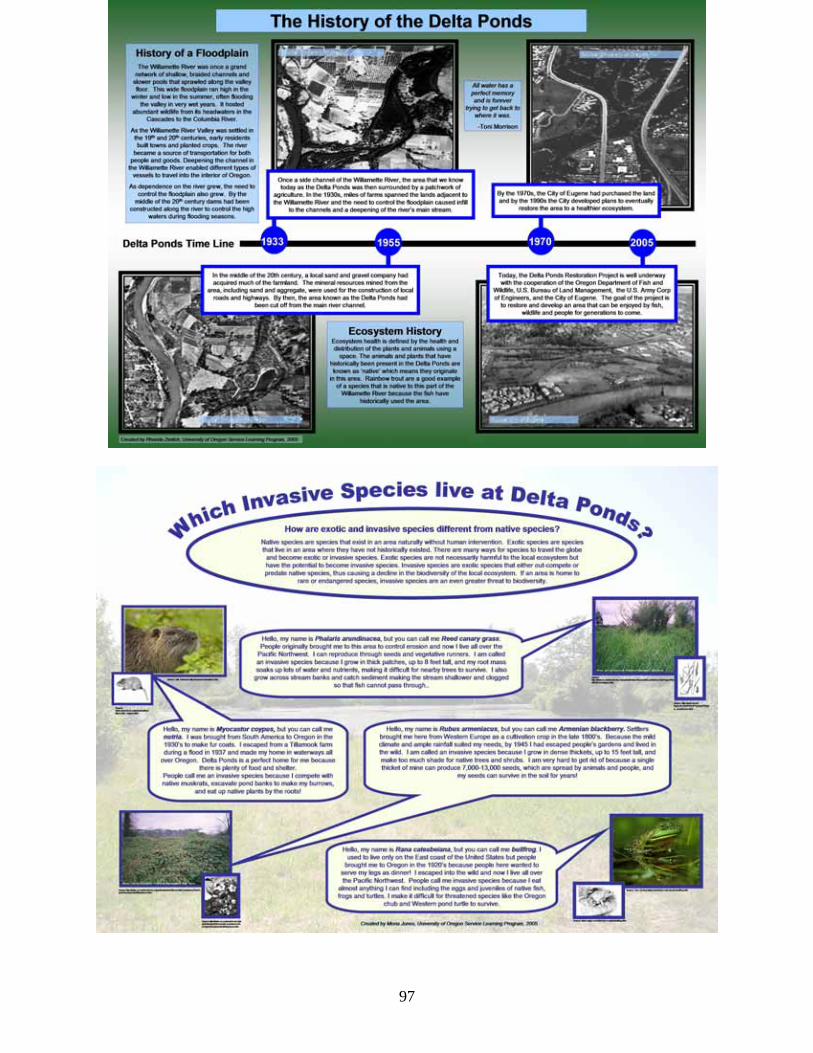
97