Embed Size (px)
Citation preview

1
COMPREHENSIVE DEVELOPMENT OF HIGH PERFORMANCE SOLID OXIDE FUEL CELLS FOR INTERMEDIATE AND LOW TEMPERATURE APPLICATIONS
By
KANG TAEK LEE
A DISSERTATION PRESENTED TO THE GRADUATE SCHOOL OF THE UNIVERSITY OF FLORIDA IN PARTIAL FULFILLMENT
OF THE REQUIREMENTS FOR THE DEGREE OF DOCTOR OF PHILOSOPHY
UNIVERSITY OF FLORIDA
2010

2
© 2010 Kang Taek Lee

3
To my mom and wife

4
ACKNOWLEDGMENTS
First of all, I glorify God (and Jesus Christ), who is my savior, for this dissertation.
During last four year journey, I could not complete anything without His guidance and
protection. I strongly wish that this dissertation and all my works in the future would be a
confession of my faith in Him. For this dissertation, I wrote six experimental notes. On
the first pages for all these notes, it is written that ‘Do not be deceived. God cannot be
mocked. A man reaps what he sows.’ (Galatians 6:7). Relying on these words, I always
did try to do my best for all works. Moreover, I should say that this work would not have
been possible were it not for the support of many people.
I would like to thank my advisor, Prof. Eric D. Wachsman, for his support and
guidance. His encouragement helped me to reach a higher level of success and expand
my potential. I also would like to thank Prof. Juan C. Nino, Prof. Simon Phillpot, Prof.
Wolfgang Sigmund, Prof. Mark Orazem and Prof. Valentin Craciun for their advice,
guidance and constructive comments.
I also thank Dr. Heesung Yoon who taught me most of the processes of SOFC
fabrication. I also wish to acknowledge other former and current group members; Dr.
Keith Duncan, Dr. Takkeun Oh, Dr. Sean Bishop, Dr. Dongjo Oh, Byung-Wook Lee, Eric
Armstrong, Dr. Bryan Black Burn, Eric Macam and other members for providing me with
an excellent research environment and helpful comments. I would especially like to
thank Dr. Dohwon Jung, Dr. Matthew Camaratta, Dr. Jin Soo Ahn and Nick Vito for their
sincere friendship and co-working partnership.
I truly want to give my thanks to Kwanjeong Educational Foundation for
unconditional financial support during my entire doctoral research with a very honorable
scholarship.

5
It was also truly helpful and enjoyable for me to share the time with all my Timothy
group friends at the Korean Baptist Church of Gainesville. All worship services and
activities were great encouragement and support for me.
I would like to thank my family members. Most of all, I want to thank my wife’s
parents, Dae Heun Kang and Jung Suk Kim for entrusting their precious and only
daughter to me and welcoming me into their family. I am also thoroughly grateful to my
father, Sam Soo Lee who is a great supporter of mine and who prayed for me through
this process. I also strongly pray to God for restoring his health. At this moment, I
strongly thank and miss my brother, Kang Yong Lee who is my mentor and supporter
with his endless trust and encouragement. I’d like to also mention his wife, Ji Eun Kim
and their precious daughter for their support.
Finally, I dedicate this dissertation to my mom and wife. My mother, Yang Soon
Kim has dedicated herself to me for over 30 years. She always trusted and encouraged
me in any circumstance. My beautiful and lovely wife, Yoo Jin Kang moved to here,
leaving her family and friends to be with me. She was by my side during my struggles
with endless patience and love. I love you so much! Thank you.

6
TABLE OF CONTENTS
ACKNOWLEDGMENTS .................................................................................................. 4
page
LIST OF TABLES ............................................................................................................ 9
LIST OF FIGURES ........................................................................................................ 10
LIST OF ABBREVIATIONS ........................................................................................... 14
ABSTRACT ................................................................................................................... 16
CHAPTER
1 INTRODUCTION .................................................................................................... 19
2 BACKGROUND ...................................................................................................... 23
2.1 Basic Principle of SOFC Operation ................................................................... 23
2.2 Actual SOFCs Operation .................................................................................. 24
2.2.1 Open-circuit Potential (OCP) and Transference Number (ti) ................... 25
2.2.2 Irreversible Losses .................................................................................. 27
2.2.2.1 Activation polarization losses ......................................................... 27
2.2.2.2 Leakage current polarization losses ............................................... 28
2.2.2.3 Ohmic polarization ......................................................................... 29
2.2.2.4 Concentration polarization ............................................................. 29
2.3. Materials and Design ....................................................................................... 30
2.3.1 Stabilized Zirconia Electrolytes ................................................................ 30
2.3.2 Aliovalent Cations-Doped Ceria Electrolytes ........................................... 31
2.3.3 Stabilized Bismuth Oxide Electrolytes ..................................................... 32
2.3.4 Bilayered Electrolyte Concept for High Performance IT-SOFCs ............. 34
2.3.4.1 Ceria / Zirconia bilayer electrolyte .................................................. 34
2.3.4.2 Ceria / Bismuth oxide bilayer electrolyte ........................................ 35
3 INTERGRATING NANO- AND MICRO- STRUCTURED ANODE FUNCTIONAL LAYERS FOR IMPROVED IT-SOFC PERFORMANCE ......................................... 44
3.1 Introduction ....................................................................................................... 44
3.2 Experimental ..................................................................................................... 47
3.3 Result and Discussion ...................................................................................... 49
3.4 Conclusions ...................................................................................................... 54
4 EFFECT OF NI-GDC AFL COMPOSITION ON PERFORMANCE OF IT-SOFCS . 62
4.1 Introduction ....................................................................................................... 62
4.2 Experimental ..................................................................................................... 64

7
4.2.1 Cell Fabrication ....................................................................................... 64
4.2.3 Characterization ...................................................................................... 65
4.3 Results and Discussion ..................................................................................... 66
4.3.1 Microstructural Analysis ........................................................................... 66
4.3.2 Effect of AFL Composition on Power Density .......................................... 67
4.3.2.1 I-V characteristics at 650 °C ........................................................... 67
4.3.2.2 Temperature dependence .............................................................. 70
4.3.2.3 Long term stability .......................................................................... 71
4.3.2.4 Effect of AFL composition on ASR ................................................. 71
4.4 Conclusions ...................................................................................................... 72
5 COMPREHENSIVE QUANTIFICATION OF NIO-GDC ANODE FUNCTIONAL LAYER MICROSTRUCTURE BY THREE-DIMENSIONAL RECONSTRUCTION USING FIB/SEM ..................................................................................................... 84
5.1 Introduction ....................................................................................................... 84
5.2 Experimental ..................................................................................................... 85
5.3 Results and Discussion ..................................................................................... 87
5.4 Conclusions ...................................................................................................... 93
6 HIGH PERFORMANCE IT-SOFC WITH CERIA/BISMUTH OXIDE BILAYERED ELECTROLYTES FABRICATED BY A SIMPLE COLLOIDAL ROUTE USING NANO-SIZED ESB POWDER .............................................................................. 107
6.1 Introduction ..................................................................................................... 107
6.2 Experimental Procedure ................................................................................. 110
6.2.1 ESB Powder Fabrication ....................................................................... 110
6.2.2 Fuel Cell Fabrication .............................................................................. 111
6.2.3 Characterization .................................................................................... 112
6.3 Result and Discussion .................................................................................... 113
6.3.1 Powder Characterization ....................................................................... 113
6.3.2 Effect of Sintering Temperature on ESB/GDC Bilayered Electrolyte ..... 114
6.3.3 Microstructure of a Full Button Cell with ESB/GDC Bilayered Electrolyte ................................................................................................... 117
6.3.4 Performance of a Button Cell with ESB/GDC Bilayered Electrolyte ...... 118
6.4 Conclusions .................................................................................................... 121
7 HIGH PERFORMANCE LSM-BASED CATHODE BOOSTED BY STABILIZED BISMUTH OXIDE FOR LOW TO INTERMEDIATE TEMPERATURE SOFCS ..... 131
7.1 Introduction ..................................................................................................... 131
7.2 Experimental ................................................................................................... 133
7.2.1 Sample Fabrication ................................................................................ 133
7.2.2 Characterization .................................................................................... 135
7.3 Result and Discussion .................................................................................... 136
7.3.1 Impedance Spectroscopy for Symmetric Cells ...................................... 136
7.3.2 I-V Characterization for Button Cells ..................................................... 140

8
7.4 Conclusions .................................................................................................... 144
8 CONCLUSIONS ................................................................................................... 158
APPENDIX
A DEPENDENCE OF OCP ON GDC ELECTROLYTE THICKNESS ....................... 162
B LONG TERM STABILITY FOR A SOFC WITH NI-GDC AFL ............................... 168
C EXPERIMENTAL SETUP ..................................................................................... 173
LIST OF REFERENCES ............................................................................................. 175
BIOGRAPHICAL SKETCH .......................................................................................... 182

9
LIST OF TABLES
Table
page
2-1 Calculated Po2 and Nernst voltage at open-circuit condition (T=500~700oC) ..... 43
2-2 Conductivity Data for Stabilized ZrO2 Doped with Rare-Earth Oxides ................ 43
3-1 Detailed OCP, MPD and ASR values of the fuel cell samples with N+C-AFL, C-AFL, no AFL at 600oC. .................................................................................... 61
4-1 Detailed ASR values of the testing cells with various NiO contents in AFL ........ 83
5-1 3D reconstruction dimension and total volume fractions of Ni, GDC and pore phase and solid volume fractions of Ni and GDC ............................................. 106
5-2 Summary of quantification of microstructural features of AFL with various compositions ..................................................................................................... 106
6-1 Calcination condition and crystallite size of ESB powders synthesis by co-precipitation and solid state route. .................................................................... 130
6-2 Comparison of specification and electrochemical performance of the studied cells. ................................................................................................................. 130
7-1 Detailed total, ohmic, and electrode ASR values for Cell-1 and Cell-2 at 650 oC ..................................................................................................................... 157
A-1 Summary of sample description and OCP result .............................................. 167

10
LIST OF FIGURES
Figure
page
2-1 Schematic diagram of reactions in SOFCs based on oxygen-ion conductors .... 37
2-2 SOFC current-voltage behavior indicating relative polarization losses ............... 38
2-3 Variation of ionic conductivity of stabilized ZrO2 with dopant concentration (T=807oC) ........................................................................................................... 39
2-4 Conductivities of selected electrolyte materials .................................................. 40
2-5 ESB conductivity versus Po2 in purified argon atmosphere ............................... 41
2-6 Conceptual representation of a bilayer electrolyte showing the effect of relative thickness on interfacial oxygen partial pressure (Po2 ) ........................... 41
2-7 Bulk electrolyte ASR at 500 oC as a function of relative (t = LESB/LSDC) and total thickness for bilayers .................................................................................. 42
3-1 Schematic illustration of the proposed N+C-AFL structure on anode-supported SOFC and effect of N+C-AFL on expending TPB length. Yellow triangles represent TPBs in conventional AFL (C-AFL) and red triangles. ......... 55
3-2 SEM micrographs of the anode surface after deposition and pre-sintering (a, c, e) and after full sintering followed by simulated testing atmospheric conditions (b, d, f) for samples with no AFL (a, b), C-AFL (c, d) . ....................... 56
3-3 Comparison of I-V characteristics for the fuel cell samples with N+C AFL, C-AFL, and no AFL at 600 °C. (a) I-V plots at the temperature ranging from 650 to 500 oC for N+C-AFL (b), C-AFL (c), and no AFL (d). ..................................... 57
3-4 Electrochemical impedance spectra of the testing samples with N+C AFL, C-AFL and no AFL at various temperature; 650 °C (a), 600 °C (b), 550 °C (c), and 500 °C (d). ................................................................................................... 59
3-5 MPD (a) and ASR plots (b) for the different samples tested between 500 and 650 °C. ............................................................................................................... 60
4-1 Backscattered images showing a cross-sectional view of anode-supported SOFCs with different NiO content in the anode functional layers; no AFL(a), 40wt% (b), 50wt%(c), 60wt%(d), 65wt%(e), and 80wt%(f) NiO. ......................... 74
4-2 Magnified microstructures of the anode or AFLs with different NiO content no AFL(a), 40wt% (b), 50wt%(c), 60wt%(d), 65wt%(e), and 80wt%(f) NiO. Backscattering mode provides better contrast to distinguish Ni (dark gray). ...... 75

11
4-3 I-V plots of fuel cells with various AFL compositions at 650oC; 40(), 50(), 60(), 65() and 80()wt% of NiO in AFL, and no AFL(). The gas condition was 90sccm of air and 3% of wet hydrogen on the anode . ................ 76
4-4 Open circuit potential of the fuel cells with various NiO contents in NiO-GDC AFL. Solid line (red) shows linear fit of the measured data (square) .................. 77
4-5 MPD (Red square) and total ASRIV estimated from IV curves (blue star) are plotted with NiO contents in AFL. The open symbols represent no AFL cell. ..... 78
4-6 Maximum power densities of fuel cells with various AFL compositions at the temperature range from 450 to 650 °C. Open symbols represent MPD of no AFL cell at each temperature. ............................................................................. 79
4-7 Long term stability test of fuel cell with 60wt% of NiO in the AFL and the no AFL cell for 200 hrs at 650 °C. Potentiostatic tests were conducted with an applied voltage of 0.379 V for the NiO 60wt% AFL cell and 0.380 V . ................ 80
4-8 Impedance spectra with various AFL compositions (a), and total, electrode, and ohmic ASRs of fuel cells with different NiO content (b) calculated from impedance spectra (a). Open symbols represent no AFL results. ...................... 81
4-9 MPD plots with electrode ASR shows a linear relationship . Red line is linear fitting of the measured data (black dots). ............................................................ 82
5-1 Schematic diagram of FIB/SEM dual beam system with sample (a) and 3D reconstruction process (b) .................................................................................. 95
5-2 3D reconstruction of Ni-GDC anode (a), and AFLs with initial composition of 50 (b), 60 (c), 65 (d), and 80 (e)wt% NiO nearby at anode(or AFL)/electrolyte interface. ............................................................................................................. 96
5-3 Individually reconstructed phases from the 3D reconstruction of AFL with 65 wt% NiO ; GDC (a), Ni (b), Pore (c), and combination of Ni and Pore phases ... 97
5-4 Phase gradient of reconstructed samples with no AFL (a), 50 (b), 60 (c), 65 (d), and 80 (e)wt% NiO in Ni-GDC AFL .............................................................. 98
5-5 Volume fraction of Ni, GDC and pore phase in total volume (a), and volume fraction of Ni and GDC in solid volume of AFLs with various compositions. Open symbols represent theoretical values. ..................................................... 101
5-6 Effective particle diameters of Ni (rectangular), GDC (circle), and pore (triangle) phase of AFLs with various compositions .......................................... 102

12
5-7 Schematic diagram of TPB length calculation from 3D reconstruction. A rectangular parallelepiped represents a voxel in a 3D reconstruction and each one is labeled as one of phases; Ni, GDC, or Pore phase.. ..................... 103
5-8 Plot of quantified surface area and TPB density of AFL with various NiO contents. Dotted lines are only for guide purpose. ............................................ 104
5-9 (a) TPB density and electrode ASR with various AFL compositions (Dotted lines are only for guide purpose.) (b) plot of 1 over electrode ASR with TPB density. A red line represents linear fit for the plot showing inverse. ................ 105
6-1 XRD diffraction pattern of ESB powders synthesized by coprecipitation route (red line) and solid state route (black line) (a). The magnified XRD diffraction pattern of the (111) peak is shown at the 2Θ range from 27 to 29o (b). ............ 123
6-2 SEM of ESB powders synthesized by wet-chemical co-precipitation method (a) and solid-state route (b). ............................................................................. 124
6-3 Evolution of ESB layers on GDC electrolyte at various sintering temperatures using ss-ESB (a,c,e,g) and cp-ESB (b,d,f,h). It is noted that the magnification of images for ESB electrolyte using cp-ESB powder is higher. ........................ 125
6-4 Cross-sectional view of GDC electrolyte under ss-ESB layer after sintering at 900 oC, which is the magnified image from Fig. 5-3g. In backscattering mode, ESB (white), GDC (light gray), and NiO (dark gray) phases are well. ............... 126
6-5 Cross-sectional SEM image of a full button cell with ESB/GDC bilayered electrolyte. EDX line scan was conducted along the straight base line (yellow) and the intensity of each elements are presented as red (Bi) ............. 126
6-6 SEM image of cross-sectional view of a single GDC electrolyte cell (a) and ESB/GDC bilayered cell (b). Surface views of GDC electrolyte (c) and ESB electrolyte (d) are shown. ................................................................................. 127
6-7 IV-Characteristics (a) and impedance spectra (b) of ESB/GDC bilayer (red square) and GDC single layer (blue triangle) cell ............................................. 129
7-1 XRD pattern of LSM, ESB, and LSM+ESB (50:50wt%) powers before and after annealing at 900 oC 50 hrs ....................................................................... 145
7-2 SEM images of LSM-ESB cathode on GDC electrolyte (a) and ESB electrolyte (b). The insets are backscattered images. ...................................... 146
7-3 Impedance spectra of the LSM-ESB cathode on ESB and GDC pellets at the temperature ranges from 500 to 700 oC ........................................................... 147
7-4 Electrode ASRs of LSM-ESB cathode on GDC (blue circles) and ESB (red squares) electrolytes, and ASR reduction rate (black stars). ............................ 148

13
7-5 Comparison of the electrode polarization resistance of LSM-bismuth oxide cathodes at IT ranges. LBSM is short for La0.74Bi0.10Sr0.16MnO3-δ. .................... 149
7-6 Long term stability test of LSM-ESB cathode on ESB electrolyte at 700 oC for 100 hours. ........................................................................................................ 150
7-7 SEM images of cross-sectional views for cell-1(a) and cell-2(b), and surface views for cell-1 (c) and cell-2 (d) ....................................................................... 151
7-8 I-V characteristics (a) and impedance spectroscopy (b) of cell-1 and cell-2 at 650 oC............................................................................................................... 153
7-9 I-V characteristics at various temperature for cell-1 (a) and cell-2 (b) .............. 154
7-10 Maximum power density improvement (black stars) of cell-2 (red squares) at various temperatures compared to cell-1 (blue circles) .................................... 155
7-11 Comparison of maximum power density of SOFCs using LSM-bismuth oxide composite cathodes at IT ranges. ..................................................................... 156
A-1 Microstructures of Ni-GDC anode/GDC electrolyte/LSCF cathode SOFCs with various electrolyte thicknesses. ................................................................. 164
A-2 Experimental OCP values from electrochemical test at 500, 600, and 650 oC as a function of GDC electrolyte thickness ....................................................... 165
A-3 Fit of the OCP model (eq. A-1) to experimental data for OCP as a function of electrolyte thickness. ........................................................................................ 166
B-1 Long term stability test of a SOFC with 60wt% NiO in Ni-GDC AFL. The potentiostatic test was conducted at 650 oC for 600 hours under an applied voltage of 0.379 V. ............................................................................................ 170
B-2 Comparison of I-V plots of the testing sample between before long term test and after long term test for 600 hours at 650oC(a), 600oC(b), 550oC(c), 500oC(d). .......................................................................................................... 171
C-1 Schematic SOFC testing setup – a button cell testing setup configuration and I-V and EIS testing equipment .......................................................................... 173
C-2 Illustration of symmetric cell configuration for EIS test (top) and EIS testing setup (bottom) .................................................................................................. 174

14
LIST OF ABBREVIATIONS
AFL Anode functional layer
ASR Area specific resistance
BET Brunauer-Emmett-Teller method
BRO Bismuth ruthenate
BSCF Barium strontium cobalt ferrite
DBP Di-butyl phthalate
EDX Energy dispersive X-ray analysis
EIS Electrochemical impedance spectroscopy
ESB Erbium stabilized bismuth oxide
FIB Focused ion beam
FWHM Full width at half maximum
GDC Gadolina doped ceria
IT Intermediate temperature
LMIS Liquid metal-organic ion source
LSCF Lanthanum strontium cobalt ferrite
LSM Lanthanum strontium manganite
MIEC Mixed ionic-electronic conductor
MPD Maximum power density
OCP Open circuit potential
PLD Pulsed laser deposition
PVB Polyvinyl butyral
ROI Region of interest
ScSZ Scandia stabilized zirconia
SDC Samaria doped ceria

15
SEM Scanning electron microscope
SOFC Solid oxide fuel cell
TLD Through-lens-detector
XRD X-ray diffraction
YSB Yttrium stabilized bismuth oxide
YSZ Yttrium stabilized zirconia

16
Abstract of Dissertation Presented to the Graduate School of the University of Florida in Partial Fulfillment of the Requirements for the Degree of Doctor of Philosophy
COMPREHENSIVE DEVELOPMENT OF HIGH PERFORMANCE SOLID OXIDE FUEL
CELLS FOR INTERMEDIATE AND LOW TEMPERATURE APPLICATIONS
By
Kang Taek Lee
August 2010
Chair: Eric. D. Wachsman Major: Materials Science and Engineering
In order to develop high performance solid oxide fuel cells (SOFCs) operating at
low to intermediate temperatures, the three main SOFC components--the anode,
electrolyte, and cathode--were comprehensively studied.
In order to lower anodic polarization losses in anode-supported SOFCs, a novel
composite anode functional layer (AFL) having bimodal (nano/micro) structure was
developed. Application of this AFL involved a simple process where a precursor solution
was coated onto a conventional submicron sized colloidally-deposited Ni-GDC AFL.
Cells prepared in this manner yielded maximum power densities (MPD) of 1.29, 1.16,
0.7 and 0.38 W/cm2 at 650, 600, 550 and 500 oC, respectively. Electrochemical
impedance results showed a striking decrease in both ohmic and non-ohmic area
specific resistances (ASRs) for these cells compared to those with either no AFL, or a
conventional AFL.
In addition, the effect composition of the conventional submironsized AFL on
performance was examined. The highest MPD (1.15 W/cm2 at 650 °C) was achieved at
a composition of 60wt% NiO. This composition had the best performance over the
intermediate temperature range (450 to 650 °C). For the potentio-static test, the cell

17
exhibited stable performance over 200 hrs of operation at 1.1 W/cm2. It was also
revealed that electrode ASR has an inverse linear relationship with maximum power
density at 650oC.
To better understand the effect of AFL composition, microstructural features of
AFLs having various Ni-GDC compositions were quantified by a 3 dimensional (3D)
reconstruction technique using a FIB/SEM dual beam system. Of the compositions
tested, the highest triple phase boundary (TPB) density was achieved at 60wt% NiO,
which corresponds to a 1:1 volume ratio of Ni to GDC phase. The quantified TPB
density showed an inverse proportionality to electrode ASR.
Using a wet chemical co-precipitation method, nano-sized ESB particles were
successfully synthesized at temperatures as low as ~ 500 oC. Due to the high
sinterability of this powder, a dense erbia stabilized bismuth oxide (ESB) layer was
successfully formed on a gadolinia doped ceria (GDC) electrolyte by a simple colloidal
coating method. A systematic study on the sintering behavior of ESB was conducted to
determine the optimum sintering conditions for these materials. I-V measurement a cell
using this bilayered electrolyte sytem showed a high power density ( ~ 1.5 W/cm2) at
650 oC due to an enhancement in OCP and a significant reduction in ASR when
compared to a GDC single cell.
The performance of conventional (La0.80Sr0.20)MnO3-δ (LSM) cathodes were
dramatically improved at the IT range by combining it with a highly conductive ESB
phase. The electrode ASR measured from a symmetric cell consisting of LSM-ESB
electrodes on an ESB electrolyte was only 0.08 Ω-cm2 at 700oC which is ~60% lower
than that of LSM-ESB on GDC electrolytes (0.19 Ω-cm2). This exemplifies the

18
synergetic effect the ESB phase has both in the cathode bulk and at the
electrolyte/electrode interface. The MPDs of the anode-supported SOFCs with LSM-
ESB cathodes on ESB/GDC bilayered electrolytes were ~836 mW/cm2 at 650 oC, which
is the highest value reported for SOFCs using LSM-bismuth oxide composite cathodes.

19
CHAPTER 1 INTRODUCTION
A fuel cell is an energy conversion device which directly produces electrical energy
from the chemical energy contained in various fuels by electrochemical reactions. In
1838, the basic principle of the fuel cell was written in one of the scientific magazines of
the time by German chemist, Christian Friedrich Schönbein. One month later, Sir
William Grove reported the first functional fuel cell in 1839. He used a dilute sulfuric acid
solution as an electrolyte at room temperature, which produced water and electricity[1].
However the history of SOFCs began much later, in 1899, with the discovery of the
solid-oxide electrolyte by Nernst and followed with the first SOFC invented by Baur and
Peris in 1937 [2].
Since that time, and especially in the last several decades, tremendous effort and
progress has been made to commercialize SOFCs. For instance, Siemens-
Westinghouse has successfully developed and operated a 100 kW system for over
20,000 h without significant deterioration in performance [3]. Recently the Solid State
Energy Conversion Alliance (SECA), the fuel cell program under United States
Department of energy (DOE), announced their road map, including the development of
a prototype SOFC stack with megawatt capability and fuel-flexiblity by 2015 [4].
One of the biggest challenges to SOFC commercialization is to reduce the
operation temperature while maintaining high power densities. At intermediate
temperatures (IT, 500~700 oC), the system cost can be significantly reduced by allowing
the use of cheap stainless steel for the bipolar plates and the balance-of-plant, as well
as the use of high temperature gaskets rather than rigid glass-based seals, which can
also enhance mechanical stability and life time [5].

20
Conventional SOFCs with yttria stabilized zirconia (YSZ) electrolytes operate at
high temperatures (over ~1000oC) due to its thermally activated ionic conduction, and
thus have unacceptable system cost and slow start-up times [4-7]. Two main strategies
have been studied to reduce ohmic losses in the electrolyte at reduced temperatures.
First is the thin electrolyte approach--the electrolyte resistance is inversely
proportional to the electrolyte thickness [8]. To accommodate thin electrolyte films,
anode supported cells has been developed [5, 9]. In this configuration however, anodic
polarization can limit performance due to the relatively high anode thickness. It is
believed that most fuel oxidation reactions take place at near the anode/electrolyte
interface, indicating that most anodic losses occur in this region [10]. Therefore,
engineering of the interfacial region has received much attention as a way to reduce
losses at the anode [11-14].
The other approach is to use materials with enhanced ionic conductivity. For
example, erbia stabilized bismuth oxide (ESB) and gadolinia doped ceria (GDC) have
one to two orders of magnitude higher ionic conductivity in the IT range than YSZ [15].
However, these two materials have disadvantages, including thermodynamic instability
at the low Po2 conditions experienced at the anode side of fuel cell systems [3, 16, 17].
To overcome these limitations, a bismuth oxide/ceria bilayer electrolyte concept has
been proposed [18]. In order to produce high power densities in the low to intermediate
temperature range, one can combine the bilayer electrolyte concept with a thin film
approach. Using this concept with a thin and dense ESB (~ 4 μm) and GDC (~ 10 μm)
bilayered electrolyte, the author and colleagues recently demonstrated a cell having an
exceptionally high power density of ~ 2 W/cm2 at 650oC [19, 20]. In that study, the

21
dense ESB layer was deposited by pulsed laser deposition (PLD), which is not a viable
technique for mass production. Therefore, a more simple and cost-effective fabrication
process is necessary.
The focus of this dissertation is the development of SOFCs producing high power
densities in the IT range and prepared with practical and cost-effective fabrication
processes. Each component of the SOFC-- the anode, electrolyte, and cathode--was
investigated to reduce its major polarization losses. In order to control anodic
polarization losses, a novel AFL was developed at the anode/electrolyte interface by
integrating nano- and micron- particle structures. For further improvement of the Ni-
GDC AFL, the effect of composition was carried out. Microstructural features of the
AFLs were quantified using a state-of-the-art 3D reconstruction technique by a FIB/SEM
dual beam system. From this work, the understanding of the relationship between
electrochemical performance and microstructures was enhanced.
In order to improve electrolyte performance, the ESB/GDC bilayered electrolyte
system was investigated. Cost-effective fabrication of dense ESB electrolytes was
achieved by a simple colloidal deposition technique. In order to accomplish this, nano-
sized ESB particles with high sinterability were synthesized by a wet chemical co-
precipitation method. The reproducibility of the high performance exhibited by these
bilayered electrolyte cells was carefully demonstrated.
In addition, an (La0.8Sr0.2)0.9MnO3-δ (LSM)-ESB composite cathode was studied as
an alternative cathode for low to intermediate temperatures. The use of conventional
LSM cathodes has been limited to high temperature SOFCs due to its low ionic
conduction at reduced temperatures [21]. In this work LSM was mixed with the fast ion

22
conductor, ESB. The performance of the LSM-ESB cathode was investigated in the IT
range. This work demonstrated that, coupled to an ESB electrolyte, the performance of
LSM-ESB was stable and significantly better than that of the same cathode on
conventional GDC or YSZ electrolytes below 650 oC.

23
CHAPTER 2 BACKGROUND
2.1 Basic Principle of SOFC Operation
In principle, overall SOFC reaction is expressed as a simple reaction formula;
OHHO 22221
→+ (2-1)
In order to complete this reaction in the actual fuel cell operation, the reaction is
divided into two half cell reactions [2, 3, 9]. Fig. 2-1 shows a schematic diagram of a
general SOFC structure and half cell reactions at anode and cathode side [22]. In the
cathode side, oxygen which generally comes from air is reduced to O2- with electrons
provided from outside fuel cell which written as;
−− →+ 22 2
21 OeO (2-2)
For this half reaction, a cathode conducts adsorption of oxygen molecules and
dissociation of adsorbed oxygen. This is followed by formation of oxygen ion by electron
transfer and charge transfer (O2- and electron) at the triple phase boundaries (TPBs)
between gas, ionic, and electronic conducting phases. Therefore, a cathode should be a
high catalysis to dissociate molecules and have high ionic and electronic conduction
with good compatibility to the electrolyte as well. Related work with high catalytic
cathode for IT-SOFC has be done at ch. 7 in this dissertation
Transferred Oxygen ions move to anode via electrolyte, for which high ionic
conductivity of the electrolyte is necessary. A driving force of the ion migration is the
Nernst potential due to PO2 difference between cathode and anode. Therefore, the
electrolyte should be a ‘good barrier’ between the air side and the fuel side to maintain
the low PO2 at the anode, which can be achieved by highly dense electrolyte. Highly

24
dense electrolyte with a special design for high stability and conductivity was
researched at ch. 6.
At the anode, the fuel is oxidized with the migrated oxygen ions.
−− +→+ eOHOH 222
2 (2-3)
−− +→+ eCOOCO 222 (2-4)
−−+ ++++→++ enOHnnCOOnHC nn )26()1()13( 22
222 (2-5)
Each equation presents the oxidation reaction for different fuels; eq. (2-3) for H2 , eq. (2-
4) for CO, and eq. (2-5) for hydrocarbon fuel. In this case, the catalytic properties of
anode is important, which takes place at TPBs. Therefore, concentration and spatial
distribution of TPB can be a key factor to improve anode performance for SOFCs. In
this dissertation, control and mechanism of TPB extension in anode nearby the anode
and electrolyte interface was intensively studied (ch. 3 ~5).
2.2 Actual SOFCs Operation
In actual SOFCs operation condition, the performance of SOFCs is commonly
measured by voltage out as a function of applied current density. Fig. 2-2 shows a
representative voltage-current plot of SOFC [4]. As mentioned above, the Nernst
potential by Po2 difference between anode and cathode produces a driving force to
operate SOFCs. However, this ideal voltage can not be maintained under applied
current due to various irreversible polarization mechanisms. The actual operational cell
voltage (E) as a function of current density can be written as;
concohmactOCPEE ηηη −−−= (2-6)

25
where EOCP is open circuit potential including leakage current and ηact, ηohm and
ηconc represent the activation, ohmic, and concentration polarization, respectively.
Detailed polarization mechanisms are explained in following sub-sections.
2.2.1 Open-circuit Potential (OCP) and Transference Number (ti)
The voltage is generated across a cell by various gas mixtures with two different
oxygen partial pressures (Po2). The open-circuit potential for the oxygen potential
gradient cells is given by the well-known Nernst equation in a cell [3],
"'ln
4 2
2
PoPo
FRTE ⋅−= (2-7)
where Po2’’ and Po2’ are the equilibrium partial pressure of oxygen at the two sides of
the cell, R is the ideal gas constant, F is Faraday’s constant and T is the absolute
temperature. The reaction for oxygen is,
−− →+ 22 24)( OegO (2-8)
If one knows the oxygen partial pressure of the reference electrode (Po2’’) and
measures the OCP at a given temperature, the equilibrium value of oxygen pressure at
the working electrode may be determined from eq. (2-7). Generally, low oxygen
pressure can be easily obtained under CO/CO2 or H2/H2O mixture [23]. However,
previous results showed that in CO/CO2 gas mixtures, the equilibrium was not readily
attained, while H2/H2O gas mixtures showed equilibration for low Po2. In this study,
H2/H2O gas mixtures were used to maintain low oxygen partial pressure on the anode
side. The hydrogen was bubbled with 3% of H2O through a membrane submersed in
water. The condition of a controlled oxygen partial pressure can be obtained via
thermodynamic relations at equilibrium. At high temperature, H2 and H2O gases react
with traces of oxygen as following.

26
OHOgH 222 21)( →+ (2-9)
And the Gibbs free energy is
21
22
2ln)(OH
OHo
PP
PRTTGG +∆=∆ (2-10)
where 0G∆ (T) is the standard Gibbs free energy of the reaction, R is ideal gas
constant, and T is temperature. From the thermodynamic data [23],
)()(7.44)(000,242)( KTKmolJ
molJTGo ×−+−=∆ (2-11)
At equilibrium, 0=∆G ,
21
22
2ln)(OH
OHo
PP
PRTTG −=∆ (2-12)
22
))(exp(2
2
2
∆
=
RTTG
PP
Po
H
OHO (2-13)
Therefore, with the reference oxygen potential, temperature, and H2/H2O partial
pressures, the controlled oxygen partial pressure can be calculated. For example, the
experimental condition can be maintained with reference oxygen partial pressure of
0.21 atm on the cathode side (1 atm air) and 3% of H2O with H2 on the anode side.
Based on these experimental conditions, the theoretical Nernst voltage was calculated
by eq. (2-7) to (2-13) over the temperature range of 500 to 700 oC in 50 oC increments
as shown in Table 2-1.
The transference number (or transport number), ti, is defined as the fraction of the
total conductivity due to each charged species;

27
total
iit σ
σ= (2-14)
The ionic transference number, ti, is equal to 1 for a purely ionic conductor, such as
YSZ. Approaching unity of ti means that there is no significant electron or hole
conduction. Any electronic conductivity causes an internal short circuit in the electrolyte
of a fuel cell. The ratio between the measured and the theoretical OCP or Nernst
voltage is transference number (ti);
altheorectic
measuredi OCP
OCPt = (2-15)
The transference number will be evaluated from the experimentally measured
OCP values with the theoretical values in Table 2-1.
2.2.2 Irreversible Losses
2.2.2.1 Activation polarization losses
At low current density condition, the slow reaction kinetics at the cathode and the
anode can cause the activation polarization. In other words, the excessive energy to
overcome a energy barrier for electrode reaction such as the oxygen reduction and
hydrogen oxidation produces the voltage drop which is increased with the current
density drawn.
The phenomena can be formulated by the Butler-Volmer equation [24];
−−
=
RTnF
RTnF
ii aactacaactaaa
,,,,,0 expexp
ηαηα (2-16)
−−
=
RTnF
RTnF
ii cactcccactcac
,,,,,0 expexp
ηαηα (2-17)

28
where i0,a, i0,c are the exchange current densities of the anode and cathode,
respectively, αa,a and αc,a are the anodic (i>0) and cathodic (i<0) charge transfer
coefficients of the anode, and αa,c and αc,c are the anodic and cathodic charge transfer
coefficients of the cathode. The charge transfer coefficients depend on the
electrocatalytic reaction mechanism and usually ~0.5 is used for SOFCs . It is noted that
as shown above, the Butler-Volmer equation should be applied for each electrode
separately. This non linear Butler-Volmer equation can be simplified as;
≅
iii
nFRT
cact0
,0 lnα
η (2-18)
In this case, this equation only considers on forward direction reaction, that is,
reduction at the cathode side and oxidation at the anode side. Surprisingly, this
simplified form was already predicted in empirical equation by Tafel in 1905 [25], which
is written as;
=
iiaact0lnlogη (2-19)
where a is a called the Tafel slope.
2.2.2.2 Leakage current polarization losses
In principle, voltage measurement of SOFC under open circuit condition (OCP)
should show the theoretical Nernst voltage at the testing temperature. However, the
actual measurement of OCP usually has some deviation from the theoretical voltage.
Even YSZ known as purely ionic conductor still sometimes shows some OCP deviation,
which might be comes from gas leaks across the electrolyte itself or poor seal. For
mixed ionic and electronic conductors (MIECs), such as dope-ceria, the partial
electronic conduction causes OCP drop from theoretical one. For example, the

29
theoretical OCP at 650 oC is ~1.14V but the reported OCPs of the GDC electrolyte cells
are 0.7 ~ 0.8V [7]. As explained above, the ratio of measured OCP to theoretical one is
expressed as transference number, ti.
2.2.2.3 Ohmic polarization
The ohmic polarization is the losses due to total electrical resistances from
electrodes, electrolyte and lead wires. This polarization loss simply follows Ohm’s law
(V=IR). Therefore, ohmic polarization which is function of current can be expressed by
)( contacteelectrolytelectrodeohm RRRI ++=η (2-20)
where Relectrode, Relectrolyte, and Rcontact are resistances from electrode (both cathode and
anode), electrolyte, and electrode-electrolyte contact, respectively, and I is current
density. For SOFC structure, it has been generally accepted that most of the ohmic
resistance comes from electrolyte due to much slow conduction process of ion migration
rather than that of electrons. In this case, comparison of resistance between electrolytes
is difficult due to its thickness dependence. Moreover, performance of SOFC is
measured as a function of current density (i) not current (I). Therefore, ohmic
polarization of electrochemical devices is generally expressed by;
tottottotohm ASRiRAiRI ⋅=⋅⋅=⋅=η (2-21)
where ASRtot is total area specific resistance.
2.2.2.4 Concentration polarization
Concentration polarization is generally observed at high current density regime of
I-V curves due to restriction to the transport of the fuel gas molecules to the anodic
reaction site. At high current density, excess water byproduct can block the reaction
sites. Therefore significant deactivation of reaction sites can be occurred. The

30
concentration polarization can be alleviated by higher gas pressure to drive out excess
water from the reaction sites, reduction of anode thickness to shorten the distance to
electrolyte, or higher porosity formation with same reason.
2.3. Materials and Design
2.3.1 Stabilized Zirconia Electrolytes
For high temperature SOFCs, stabilized zirconia, such as yittria-stabilized zironia
(YSZ) has been most widely used as an electrolyte due to its high stability, reasonable
ionic conductivity at high temperature (> ~900 oC), and relatively inexpensive cost [6].
Although pure zirconia (ZrO2) is also chemically stable in both oxidizing and reducing
conditions, it has not been chosen as a solid electrolyte due to its poor ionic
conductivity. In addition to low conduction, pure ZrO2 shows phase transition from
monoclinic to tetragonal and from tetragonal to cubic fluorite at 1170 and 2370 oC,
respectively, accompanying unacceptable volume change (3 ~ 5%) in the fabrication
temperature ranges [26]. However, it has been known that some aliovalent cations,
such as cations of Ca, Y, Mg and Sc, can stabilize the ZrO2 phase as cubic fluorite
structure from room temperature to high temperature [27]. Moreover, this aliovalent
cation doping in ZrO2 produces higher vacancy concentration, leading higher ionic
conduction at the wider Po2 ranges. This aliovalent dopant effect on vacancy
concentration can be explained by Kroger-Vink notation in which the negative charge
produced by substituting a dopant is indicated by prime or a superscript dot if it is
positive. The amount of charge is indicated by the number or prime or dot. For neutrality
after substituting, it is marked as the superscript ‘x’. For example, the incorporation
reaction between trivalent dopant and ZrO2 can be written as [3];

31
••++→ VOMOM xoZr
ZrO3'2
2
32 (2-22)
where the M is trivalent dopant and V is vacancy, indicating that two M dopants
produce one oxygen vacancy. Various tri- and divalent dopants has been studied to
make the stabilize ZrO2 with high ionic conduction. It was shown that there is certain
dopant concentration to give maximum conductivity. For yttria stabilized zirconia (YSZ),
as Y dopant concentration increases, the conductivity is increased upto 8 mol%, while
over 8 mol% it shows degradation [28]. As shown in Fig. 2-3 Most of the stabilized
zirconia shows similar trend [2]. It is explained that at higher dopant concentration,
defect ordering or vacancy clustering occurs leading the reduction of total number of
active vacancy [29]. Among the dopants, Y is most widely used due to cost and stability,
while highest conductivity has been reported for Sc dopant (Table 2-2) [29]. The ionic
conductivity of YSZ is strongly depends on the concentration and mobility of ions, which
is known to a thermally activated process. Therefore, conductivity of YSZ suffers
significant conductivity reduction at low temperature, which limits it operational
temperature ~1000 oC.
2.3.2 Aliovalent Cations-Doped Ceria Electrolytes
Recently, aliovalent cations-doped ceria (CeO2) has been given much attention as
a potential solid electrolyte because of its higher ionic conductivity over a range of high
to intermediate temperature. The ionic conductivity of ceria is considerably increased by
aliovalent cation doping which increases the oxygen vacancy concentration in ceria [30,
31]. The magnitude of electrical conductivity and the stability under reducing conditions
for ceria-based oxides depend greatly on the kind and quantity of doping elements.
Alkaline earth oxides(e.g. CaO and SrO) and rare earth oxides(e.g. Gd2O3 and Sm2O3)

32
are highly soluble in the ceria sublattice. Among these, Sm and Gd-doped ceria shows
the highest electrical conductivity in ceria based oxides with 10~20% of dopant
concentration [31]. It is considered because of the similar ionic radii of Sm+3 and Gd+3 to
that of Ce+4. Since Steele calmed the ionic conductivity of Gd0.1Ce0.9O1.95(10GDC) is the
highest among various Gd and Sm dopant concentrations at a temperature range of
500~700oC, 10GDC has been paid attention as one of the most suitable candidates for
IT-SOFCs electrolyte [7]. Moreover, as shown in Fig. 2-4 the ionic conductivity of
doped-ceria is approximately one to two order of magnitude greater than that of
stabilized zirconia, which is most widely used electrolyte material up to present [3]. It is
considered because Ce4+ (0.87 Å) ion has larger ionic radius that Zr4+ (0.72 Å) causing
easier oxygen ion migration through a more open structure. However, one big drawback
of ceria-based electrolyte makes us hesitate to select it as a best electrolyte material for
IT-SOFCs despite of its high ionic conductivity. When ceria-based oxides are reduced
at low oxygen partial pressures (<10-14 atm), Ce4+ transfers into Ce3+ leading significant
n-type electronic conduction with a P(O2)-1/4 dependence [7]. This phenomenon reduces
the ionic transference number (ti) and the open circuit potential (OCP), thereby making
ceria less efficient for application as an IT-SOFCs. To increase the electrolyte domain
and to preserve the ionic conductivity of the doped ceria by any means is important.
2.3.3 Stabilized Bismuth Oxide Electrolytes
Various polymorphism in bismuth oxide based materials have been identified with
α, β, γ and δ phases [32]. Even though the cubic δ phase at high temperature (> 729
oC) shows an excellent ionic conductivity, attributed to the presence of such a large
concentration of oxygen vacancies, it is unstable and transforms into a monoclinic
phase with below 729 oC resulting in a discontinuous decrease in conductivity [33].

33
However, when a solid solution of bismuth oxide is formed with erbia(Er2O3) or several
other rare-earth oxides, bismuth oxide is known to remain stable in the cubic phase.
20% erbia stabilized oxide (ESB) has the excellent conductivity among the stabilized-
bismuth oxides. The greater conductivity of stabilized-bismuth oxide electrolytes has
tremendous potential for lower operating temperature, thus considerably growing the
number of applications for SOFCs [34].Despite the high conductivity of stabilized
bismuth oxide electrolytes, they have not been used in solid electrochemical devices
such as SOFCs due to their thermodynamic instability. Takahashi et al. indicated that
the critical PO2 value below which stabilized bismuth oxide would decompose is the
equilibrium oxygen pressure of a Bi/Bi2O3 mixture [16]. The decomposition process may
be simplified as:
)(23)(2 232 gOsBiOBi += (2-23)
The open-circuit potential from galvanic cells with an air cathode and metal/metal
oxide anode were stable in oxygen partial pressures above 10-13.1 atm at 600oC. This
result showed that there was no contribution of electronic conduction to the total
conductivity above the equilibrium oxygen potential of Bi/Bi2O3 mixture. Therefore, they
concluded that the minimum oxygen partial pressure at 600oC is 10-13.1atm. On the
other hand, Wang and other researches reported the ionic conductivity of Bi2O3 could
be measured without critical decomposition of Bi/Bi2O3 under an H2/H2O atmosphere
[35, 36]. Wachsman et al. reported that the measured conductivity of ESB was
independent of Po2 over the range 1 to 10-22 atm under O2/Ar atmosphere as shown in
Fig. 2-5 while ESB was decomposed at low Po2(10-21atm) with H2, which was also
confirmed by XRD [37]. It was considered that the stability of ESB in the Ar/O2

34
atmosphere is probably due to slow heterogeneous kinetics in the absence of an active
reducing agent, such as H2. From these results, it can considered that bismuth oxide
based electrolytes may be kinetically stable in the absence of contact with an active
reducing agent. Therefore, in order to use bismuth oxide as an IT-SOFC electrolyte,
exposure to the reducing environment of the fuel gases must be prevented due to
decomposition of the bismuth oxide.
2.3.4 Bilayered Electrolyte Concept for High Performance IT-SOFCs
2.3.4.1 Ceria / Zirconia bilayer electrolyte
Bilayered electrolytes have been proposed as an alternative of overcoming the
decomposition by the thermodynamic instability of highly conductive oxides. Yahiro et
al. demonstrated that a thin and dense layer of YSZ on the fuel side of ceria avoided the
effect of reduction of electrolytes by blocking the electronic conduction and
consequently increased the OCP and power density [38]. Alternatively, some
researchers have suggested placing the YSZ layer, which has a low electronic
conductivity, on the air (i.e., oxidizing) side of the SOFC where its function is only to
block electronic flux (thereby increasing the efficiency of the SOFC) [23]. Of the two
approaches the latter has been the most successful. However, in both cases the YSZ
layer could not be made thin enough for the total ionic conductance of the bilayer to be
high enough for efficient power generation at low temperatures. Generally, a YSZ/SDC
or SDC/YSZ bilayer electrolyte has no intrinsic advantage over just a thin YSZ
electrolyte itself, other than providing a non-porous substrate for YSZ deposition, due to
the relatively low conductivity of YSZ [18].

35
2.3.4.2 Ceria / Bismuth oxide bilayer electrolyte
Wachsman et al. proposed a bilayer electrolyte consisting of a layer of erbia-
stabilizaed bismuth oxide (ESB) on the oxidizing side and a layer of SDC or GDC on the
reducing side[9]. In this arrangement, the ceria layer would protect the bismuth oxide
layer from decomposing by shielding it from very low Po2 and the ESB layer would
serve to block electronic flux. They demonstrated concepts of bilayered electrolytes by
using a system, which consists of SDC (Ce0.8Sm0.2O1.5) on the reducing side and ESB
(Bi0.8Er0.2O1.5) on the oxidizing side [39]. As shown in Fig. 2-6, it was considered that the
gas phase on either side is fixed by the gradient of oxygen partial pressure and the
relative electronic conductivity relies on the local oxygen activity. In this bilayer
structure, the SDC layer prevents the ESB layer from decomposing at very low Po2.
That is, in bilayered bismuth/ceria electrolytes, thermodynamics stability of the bismuth
oxide electrolytes can be elevated and ceria can be act as both an electrolyte and
anode depending on local oxygen partial pressure. As a result, higher OCP can be
obtainable in the bilayered bismuth/ceria electrolytes, since transference number of
bismuth oxide electrolyte is unity [18]. Based on the gradient oxygen partial pressure
and vacancy transport theory, modeling results showed that the interfacial oxygen
partial pressure can be mainly determined by the relative thickness ratio between two
oxide electrolyte layers[24]. These results implies that the relative thickness ratio is the
key parameter to the electrochemical performance of bilayer electrolytes, since the PO2
at the ESB/SDC interface can be controlled by the thickness ratio of SDC and ESB
layers. Recently Park et al. reported study result on SDC/ESB bilayer electrolyte [39,
40]. In this paper, they successfully deposited thin ESB layers with pulsed laser
deposition (PLD) technique and a dip coating method on 1.7mm thick SDC pellet and

36
showed that there is no interfacial phase formation. Such a formation can lower the total
electrolyte conductivity and cause the ESB layer to be ineffective in blocking electron
flow from ceria electrolyte causing higher open-circuit potential. Although the studied
relative thickness ratio(LESB/LSDC) of the bismuth/ceria bilayer electrolytes was up to 10-2
level, it was expected that the higher relative thickness ratio can obtain higher electron
open circuit potential without loss of high ionic conductivity on electrolyte. Leng et al.
also demonstrated the bilayer concept through YDB (yittria-doped bismuth)/ GDC
electrolyte system [41]. Their results showed not only higher open-circuit potential but
also lowering electrode polarization effect due to the bismuth oxide interlayer. In this
study they used relatively higher thickness ratio of 0.3, which implies the possibility of
thermodynamic stability of thin film bilayer electrolyte even in higher ratio. However,
only one thickness ratio was used and the cathode (Pt) was different from previous
studies (Au). The thickness ratio effect cannot be directly compared with other results.
Recently, modeling of the transport in ESB/SDC bilayer electrolytes has shown that the
thickness of the bismuth oxide layer can be increased relative to the ceria layer, due to
the increase in the electrolytic domain with decreasing operation temperature [42]. As
shown in Fig. 2-7, it has been expected that, at higher the ESB/SDC electrolyte
thickness ratio, the total electrolyte resistance can be dominantly influenced by higher
conductivity bismuth oxide layer, from which we can expect a significantly lower ASR
(area specific resistance) as well as very high OCP.

37
Figure 2-1. Schematic diagram of reactions in SOFCs based on oxygen-ion conductors
[22]

38
Figure 2-2. SOFC current-voltage behavior indicating relative polarization losses [4]

39
Figure 2-3. Variation of ionic conductivity of stabilized ZrO2 with dopant concentration
(T=807oC) [2]

40
Figure 2-4. Conductivities of selected electrolyte materials [3]

41
Figure 2-5. ESB conductivity versus Po2 in purified argon atmosphere [37]
Figure 2-6. Conceptual representation of a bilayer electrolyte showing the effect of
relative thickness on interfacial oxygen partial pressure (Po2 ) [39]

42
0.04
0.06
0.08
0.1
0.12
0.001 0.01 0.1 1 10 100 1000
Thickness Ratio (LESB/LSDC)
AS
R ( Ω
cm2 )
Thicker ESB
Thicker SDC
T=500˚CTotal thickness=10μm
Figure 2-7. Bulk electrolyte ASR at 500 oC as a function of relative (t = LESB/LSDC)
and total thickness for bilayers

43
Table 2-1. Calculated Po2 and Nernst voltage at open-circuit condition (T=500~700oC) Temperature (oC)
0G∆ (T) (J/mol)
Po2 (atm)
Nernst Voltage; OCPtheoretical (V)
Experimental Conditions
700 -198507 4.641x10⁻²⁵ 1.1415
2
2
H
OH
PP
=0.0309 Po2,ref=0.21 atm
650 -200742 1.816 x10⁻²⁶ 1.1473 600 -202977 4.900 x10⁻²⁸ 1.1531 550 -205212 8.526 x10⁻³⁰ 1.1588 500 -207447 8.784 x10⁻³² 1.1646
Table 2-2. Conductivity Data for Stabilized ZrO2 Doped with Rare-Earth Oxides [43]
Dopant Composition Conductivity (1000oC) Activation eneragy (M2O3) (mol% M2O3) (X 10-2 Ω-1cm-1) (kJ/mol)
Y2O3 8 10 96 Nd2O3 15 1.4 104 Sm2O3 10 5.8 92 Yb2O3 10 11 82 Sc2O3 10 25 62

44
CHAPTER 3 INTERGRATING NANO- AND MICRO- STRUCTURED ANODE FUNCTIONAL
LAYERS FOR IMPROVED IT-SOFC PERFORMANCE
3.1 Introduction
The commercialization of solid oxide fuel cells (SOFCs) as highly efficient, low
pollution power sources can be realized by lowering operational temperatures [3]. As
Steele claimed, in the lower temperature operation regime (< ~ 700 oC), the system cost
can be significantly reduced with the use of cheap stainless steel for the bipolar plates
and the balance of the plant, combined with the use of high temperature gaskets rather
than rigid glass-based seals. The lower operation temperature can also enhance the
SOFC’s mechanical stability and life time [5]. However, critical points to achieve this
goal are to alleviate the significantly increased ohmic and activation polarizations at
reduced temperatures due to their thermally activated nature [9, 44].
An anode-supported designs for low (~ 500 oC) to intermediate (~ 600 oC)
temperature SOFCs have recently received much attention since they can
accommodate very thin electrolytes (< ~ 10 μm), thereby eliminating a large fraction of
the cell’s ohmic resistance [5]. Until now, many anode-supported SOFCs with state-of-
the-art thin, highly conductive electrolytes, and highly electrocatalytic cathodes have
been shown to obtain high power density at intermediate temperatures (IT). For
example, Shao and Haile reported a high performance of ~ 1.01 W/cm2 at 600 oC with a
barium doped perovskite cathode (Ba0.5Sr0.5-Co0.8Fe0.2O3-δ, BSCF) accompanied with
thin doped ceria-electrolyte [45]. Recent study also demonstrated a nickel and gadolinia
doped ceria (Ce0.9Gd0.1O1.95, GDC) composite anode-supported SOFC with ~10 μm
thick of bismuth/ceria bilayered electrolyte coupled to a bismuth-ruthenate cathode that
achieved a high maximum power density (MPD) of ~ 1.95 W/cm2 at 650 oC [20]. In the

45
anode-supported design, however, anodic polarization at the interface between
electrolyte and anode can dominate due to its relatively high volume fraction compared
to the electrolyte and cathode.
Generally the SOFC anode provides the conducting phase for charge transfer as
well as reaction sites for the electrochemical oxidation of the fuel [2]. For example with
hydrogen as the fuel, the following reaction occurs
−− +→+ eOHOH 222
2 (3-1)
For low temperature SOFC application, Ni-GDC cermet anode has been widely
used due to high electrocatalytic effect of Ni both for the direct oxidation of hydrogen
and for steam reforming of methane [46]. The GDC in the cermet anode, which high
ionic conductivity at low temperature, extends the reaction zone and compatibility with
GDC electrolyte in addition to preventing Ni sintering. Moreover, it has been reported
that doped ceria showed high resistance to carbon deposition in hydrocarbon fuel [47].
In this composite structure, to achieve higher anode performance, the anode
microstructures should be carefully controlled. Recent research by Suzuki et al. showed
that high MPD of ~ 1.1 and 0.5 W/cm2 at 600 and 550 oC with a anode-supported
microtubular fuel cell using ~3 μm thick Sc-doped zirconia (ScSZ) and a GDC interlayer
as electrolyte [48]. In this study, they demonstrated that IT-SOFC performance greatly
depends on anode microstructural factors. For example, porosity and size of Ni particles
in anode influenced concentration polarization and amount of triple phase boundary
(TPB) which is believed as anodic reaction sites between the gas phase, ionic and
electronic conduction phases. Moreover, it is generally accepted that most of the fuel
oxidation reaction, such as eq.(3-1), take place in a limited zone inside ~ 10 μm

46
thickness of anode adjacent to the anode/electrolyte interface [10]. For this reason,
interfacial anode functional layers (AFLs) have been explored to increase the TPB
length. To date many studies have successfully demonstrated that graded AFL
interlayers with submicron sized NiO particles at the anode/electrolyte interface can
effectively extend active TPB site reducing anodic polarization and give higher
mechanical and chemical stability [11, 49]. Most of these AFLs were fabricated by
conventional colloidal slurry deposition.
In the previous work author and co-workers introduced a new method for
fabricating AFLs by dispersing a GDC precursor at the interface between the anode and
the electrolyte [14]. The resulting nano-sized particles formed a smooth interfacial
region between the anode and electrolyte by filling in pores and crevices and also
extending TPBs. This resulted in an improvement in electrolyte deposition quality as
well as higher electrochemical performance.
Based on this study, the author developed a novel AFL which combines a
conventional particle size (~ < 1μm) AFL applied by colloidal deposition and a nano-
sized Ni-GDC applied by a precursor solution coating. Due to the nature of the
precursor solution, the nano-scale Ni-GDC can penetrate into the AFL and be well
distributed. As shown in Fig. 3-1 we expect two major benefits from this bimodally
integrated AFL concept. First, the TPB length of the AFL can be significantly higher than
that of the conventional AFL because very fine Ni-GDC particles surround the
submicron-size Ni-GDC AFL particles. Secondly, precursor solutions form very fine
particles which fill submicron-sized pores at the interfacial region and thereby increase
the actual 2-dimensional contact area with the electrolyte (2-phase boundaries) so that

47
it is in closer agreement with the nominal measured contact area, thus reducing the
interfacial ohmic resistance. In addition to higher electrochemical performance, this
novel AFL is very attractive for mass production of IT-SOFCs because all materials are
commercially available (NiO and GDC powder, and metal cation nitrates) and this
simple process is readily applicable to most anode-supported fuel cell designs with
precise control.
In this chapter, the cost-effective and high performance novel AFL for IT-SOFCs is
described. To investigate the effect of the novel AFL on SOFC performance, three cells
all from the same anode tape were compared. These include no AFL, conventional AFL
(referred to as C-AFL), and one sprayed precursor onto the conventional AFL to form a
nano/micro composite AFL (referred to as N+C-AFL). Thin GDC electrolyte and
La0.6Sr0.4C0.2F0.8O3-δ (LSCF)-GDC composite cathodes were used for the balance of the
button cells. The microstructural evolution was analyzed and the electrochemical
performance of the SOFC with this novel AFL were measured and characterized.
3.2 Experimental
The NiO-GDC anode support was fabricated by tape-casting using a 65:35 (wt%)
mixture of NiO (micron-scale, Alfa Aesar) and GDC (Rhodia) powders. Based on the
ethanol solvent, an appropriate binder system was prepared with Solsperse, di-n-butyl
phthalate (DBP) and poly-vinyl butyral (PVB), with mixing ratio of 5.9 : 44.1 : 49.9 wt%,
as the dispersant, plasticizer, and binder respectively. For a homogeneous slurry with
proper viscosity and strength before and after tape casting, the binder system was
mixed with the powder mixture and ball-milled for 24 hrs. After a de-airing step to avoid
cracks or defects caused by air bubbles during the tape-casting process, a Procast tape
casting system (DHI, Inc) produced a NiO-GDC anode tape from the slurry. To make a

48
button type fuel cell, the dried tape was punched out into a circular shape with a 32 mm
diameter and pre-sintered at 900 °C for 2 hrs.
Fabrication of the N+C-AFL on anode substrate involved two steps. First, a NiO-
GDC colloidal slurry containing submicron size NiO (JT Baker) and GDC (Rhodia)
(65:35wt%) mixed with the proper binder system was deposited on one side of anode
support by spin coating. The binder system consisted of Solsperse, di-n-butyl phthalate
(DBP) and poly-vinyl buteral (PVB), with mixing ratio of 52.2 : 28.2 : 19.6 wt% as the
dispersant, plasticizer, and binder respectively. In this work, the C-AFL thickness was
maintained by coating the support two times at 1500 rpm for 15 s. Subsequent heat
treatment at 400 oC was carried out for the removal of the binder system. Next, the Ni-
GDC nitrate precursor was coated onto the first AFL. A 1 M solution of Ni-GDC
precursor having the same mole ratio of each element as the anode substrate was
synthesized by dissolving Ni(NO3)2∙6H2O, Gd(NO3)3∙6H2O and Ce(NO3)3∙6H2O in ethyl
alcohol using ultra-sonication for 30 min. The precursor solution was transferred to a
spray gun (Excell), sprayed onto the C-AFL surface and pre-sintered at 900 oC for 1 hr.
Thin and even GDC electrolytes were deposited by spin coating with a GDC
colloidal slurry. For the GDC colloidal slurry, the Rhodia GDC powder was ball milled for
48 hrs with a binder system based on an ethanol solution. As a binder system, for 10 g
of GDC powder, 0.5g of Solsperse (dispersant), 0.3g of PVB (binder) and 0.2g of DBP
(plasticizer) were used with 70cc of ethanol. The spin coating was conducted at 1500
rpm for 15s for each deposition. After drying at room temperature for 10 hrs the
anode/N+C-AFL/electrolyte multilayer structure was sintered at 1450 oC for 4 hrs using
a 3 oC /minute ramp rate in air.

49
A La0.6Sr0.4Co0.2Fe0.8O3-δ (LSCF) - GDC composite cathode was prepared and
applied on the GDC electrolyte surface. Cathode inks were synthesized by mixing LSCF
(Praxair) and GDC (Rhodia) at 50:50wt%. For a solvent, Alpha-terpiniol and ethanol
were used. DBP and PVB were used as the plastisizer and binder, respectively. After
mixing and grinding the cathode ink for 1 hour, the ink was brush-painted onto the GDC
electrolyte evenly. The first layer of cathode ink was dried in an oven for 1 hour at 120
°C, and a second layer of the same cathode ink was brush painted onto the first layer.
The active cathode area was ~0.4 cm2. The cathode was fired at 1100 °C for 1 hour. Ag
mesh and Pt wire were bonded onto both electrode surfaces using Pt paste for current
collecting and then fired at 900 °C for 1 hour.
The AFL microstructures on Ni-GDC anode supports were observed using
scanning electron microscope (SEM, JEOL 6400 / 6335F). For electrochemical
performance, fuel cell samples were loaded in sealed fuel cell testing apparatuses.
Current-voltage (I-V) characteristics were conducted by a Solartron 1287 using 30 sccm
of dry air on the cathode side and 30 sccm of humidified (3 vol% H2O) hydrogen on the
anode side. In addition to the I-V measurement, 2-point electrochemical impedance
analysis was carried out under open circuit condition using a Par-stat 2273 (Princeton
Applied Research) with a frequency range of 100 KHz to 100 mHz.
3.3 Result and Discussion
Fig. 3-2 shows the microstructures of the anode substrate surfaces after
application of the different AFL types and the evolution of these microstructures after
various heat treatments. The AFL surfaces were compared after deposition and
presintering at 900 oC (Fig. 3-2-a, c, e) in order to inspect and compare the initial
morphological state of N+C-AFL deposition on the anode. As seen in Fig. 3-2-a, the

50
substrate with no AFL has numerous micron-sized pores. Such a microstructure can
cause poor mechanical contact between the anode and electrolyte and lead to micro-
cracking during high temperature operation [11]. In contrast, the microstructure of the
N+C-AFL-covered surface (Fig. 3-2-e) exhibits little if any micron-sized porosity and the
surface particles are fine and well distributed. The surface coated with C-AFL still
exhibits a degree of micron size porosity (Fig. 3-2-c).
Next, we sought to observe the microstructure of the N+C-AFL coating after
testing. However, due to the presence of the electrolyte on the surface, it is difficult to
observe the reduced anode surface after electrochemical testing. Therefore, in order to
simulate the effect of testing, the three anode samples were sintered at 1450 oC with no
electrolyte coating and were reduced at 650 oC under simulated operational gas flow
conditions for 10 hrs. Fig. 3-2-b shows again that the bare anode forms big pores on the
interfacial surface, compounded by the reduction of large NiO particles into Ni metal.
The conventional C-AFL exhibits a much finer particulate microstructure (Fig. 3-2-d).
The characteristic microstructure of the N+C-AFL is presented in Fig. 3-2-f. Compared
with Fig. 3-2-d, the very fine Ni and GDC particles (marked as dotted circles) appear to
be better distributed between pores of the submicron size Ni-GDC AFL network
structure, indicating likelihood for extended TPB lengths and 2-phase contact area with
the electrolyte. Fig. 3-2-g exhibits a characteristic N+C-AFL structure magnified from Fig.
3-2-f. In this figure it is clearly shown that a nanosized particle is necking with submicron
or micron sized AFL particles, which corresponds well with the schematic diagram of
N+C-AFL in Fig. 3-1-b. Fig. 3-2-h shows the cross-sectional view of actual anode/N+C-

51
AFL/electrolyte multilayered structure after cell testing, indicating the very fine AFL
structure is well constructed with dense electrolyte and porous anode.
Fig. 3-3 shows the I-V characteristics and power densities for the three different
types of samples at the temperature ranges from 500 to 650 oC. In Fig. 3-3-a, I-V plots
of 3 cells were compared at 600 oC and the detailed values are tabulated in Table 3-1.
The C-AFL sample exhibited a maximum power density (MPD) of 681 mW/cm2, an
increase of 127% compared to the sample which used no AFL, which measured only
300mW/cm2. In addition, the open circuit potential (OCP) of increased from 0.82 V for
the cell without an AFL to 0.86 V for the cell using the conventional AFL. This supports
the theory that particle size graded anode functional layers may improve the quality of
GDC electrolyte deposition by partial filling the interfacial porosity [14]. Although the
OCP of the Ni-GDC AFL sample was about 0.04 V higher than the sample with no AFL,
as shown I-V plot in Fig. 3-3-a, the major contribution to the improvement in
electrochemical performance comes from its lower area specific resistance (ASR).
For the novel N+C-AFL cell, the MPD reached 1160 mW/cm2—a 287% increase
compared to sample with no AFL and 70% higher than that of sample using a C-AFL,
while its OCP (0.85 V) was comparable to that of the C-AFL sample (0.86 V). Again,
the highly improved performance is caused by the further reduction of the polarization
losses. This result indicate that the precursor solution penetrated into the graded anode
functional layer (Ni-GDC AFL) and formed nano-particles with proper percolation and
distribution of both GDC and Ni particles, thus increasing active TPB length effectively
at the interface between anode and GDC electrolyte.

52
To further investigate the effect of the N+C-AFL on performance enhancement,
electrochemical impedance testing was conducted under open circuit condition on each
sample at the same temperature range as used for I-V measurement (Fig. 3-4).
Comparison of the nyquist plots of the three samples at 600 oC are shown in Fig. 3-4-b.
The total, ohmic, and electrode ASR values at 600 oC were extracted and are given in
Table 3-1. As expected from the I-V curves, the total ASR value of the N+C-AFL sample
(0.206 Ω-cm2) was much less than that of the C-AFL sample (0.387 Ω-cm2) and the
sample with no AFL (0.607 Ω-cm2), showing and ASR reduction of 47% and 66%
respectively, which came largely from reduced electrode polarization drops. The
electrode ASR of the N+C-AFL sample was reduced by 52% and 70%, respectively,
compared to C-AFL and AFL-less samples, suggesting again that the use of the N+C-
AFL did have a positive effect on extending TBP lengths. In addition, it should be noted
that the ohmic ASR (0.070 Ω-cm2) of the N+C-AFL cell was also reduced by 31% and
53%, respectively, compared with C-AFL and no AFL cells. Based on previously
reported ionic conductivity of GDC, ohmic ASR of ~10 μm thick GDC electrolyte is 0.054
Ω-cm2, which is close to that of N+C AFL, while the ohmic ASRs of no AFL (0.149 Ω-
cm2) and C-AFL (0.102 Ω-cm2) cell shows much higher values. As reported by Koide et.
al, these additional IR resistance can be caused by higher interfacial contact resistance
between anode and electrolyte [50]. Therefore, this ohmic ASR drop of the novel AFL
cell indicates that the N+C-AFL effectively improved the interfacial wetting and
expended the active contact area of two phase (electrolyte and anode) boundaries at
the GDC electrolyte/Ni-GDC anode interface, causing the lower resistance to the flow of

53
oxygen ions through the electrolyte to anode, as well as a two-phase boundary area
that more closely matches the nominal active area used in power density calculations.
This ASR analysis implies two additional points with respect to anode-supported
SOFCs. First, the anodic polarization in this SOFC design is a very large portion of the
total electrode polarization, since modifying the anode alone using N+C-AFL reduced
electrode ASR by 70%. Second, the fact that only ~ 5 μm of N+C-AFL lowered the total
ASR by 66% shows that most of this anodic polarization occurs near the
electrolyte/anode interfacial region (~ μm of depth) which can be mitigated by the use of
a proper anode functional layer at the interface.
Fig. 3-5 summarizes MPD obtained from I-V plots shown in Fig. 3-3 and total ASR
values given in Fig. 4 of SOFCs with N+C-AFL, C-AFL, and no AFL at temperatures
ranging from 650 oC down to 500 oC. The MPD of the N+C-AFL cell reached 1296, 697,
and 380 mW/cm2 at 650, 550, and 500 oC (Fig. 3-5-a). Thus, the improvement in
performance becomes even greater at lower temperatures—the power density of the
N+C-AFL cell compared to that of the cell with no AFL increased by 107% (625 to 1296
mW/cm2) at 650 oC and by 407% (75 to 380 mW/cm2) at 500 oC. The same trend is
observed for the total ASR values as shown in Fig. 3-5-b. The total ASRs of the N+C-
AFL were 0.091, 0.497 and 0.654 Ω-cm2 at 650, 550 and 500 oC, respectively, showing
total ASR reduction of 67.2 and 80.2% at 650 and 500 oC. This implies that at the low
end of the IT range (below 650 oC), the ability of the N+C-AFL to reduce the ASR and
improve MPD was confirmed and the improvements were significant. On the other hand,
for all samples, the portion of electrode ASR in total ASR is getting greater as
decreasing temperature (Fig. 3-4). Even N+C-AFL showed electrode ASR fraction

54
increase in total ASR from 54.8% at 650 oC to 75.8% at 500 oC. We believe this is
because the sluggish oxygen reduction reaction occurred at the conventional perovskite
cathode due to high activation energy at the lower temperature. Coupled with recently
reported highly catalytic cathodes, even higher performance of this SOFC is expected at
low temperature.
3.4 Conclusions
In conclusion, bimodally integrated nano-/micron- composite AFL was developed
by simple spray coating a precursor solution into conventional submicron sized Ni-GDC
in a functional layer. This combined structure produced a novel N+C-AFL.
Microstructural analysis revealed that very fine Ni and GDC particles were
homogeneously distributed into the conventional AFL and formed network structures in
3D, leading to a significant increase in TBP length. A SOFC using this novel AFL
exhibited a MPD of 1.16 W/cm2 at 600oC. Due to its characteristic structure, N+C-AFL
reduced both electrode and ohmic ASR. Compared with the performance of a SOFC
without AFL, the cell using the N+C-AFL showed a 287% increase in power density as
well as a 66% reduction in total ASR. This effect was observed throughout the IT range
tested, indicating the N+C-AFL is an excellent structure for use in high performance IT-
SOFCs.

55
Submiro-sized NiO particles
Micro-sized NiO particles
GDC particles
Nano-sized Ni-cations in solution
step1
step2
Ni-GDC precursor solution
GDC electrolyte
N+C AFL
Ni-GDC anode
NiGDC
Ni GDC
Figure 3-1. Schematic illustration of the proposed N+C-AFL structure on anode-
supported SOFC and effect of N+C-AFL on expending TPB length. Yellow triangles represent TPBs in conventional AFL (C-AFL) and red triangles represent TPBs by N+C-AFL.

56
(a) (b)
(d)(c)
(e) (f)
5μm5μm
5μm5μm
5μm5μm
1μm1μm
1μm1μm
1μm1μm
100nm100nm
(g) (h)
5μm
Electrolyte
N+C-AFL
Anode
Figure 3-2. SEM micrographs of the anode surface after deposition and pre-sintering (a, c, e) and after full sintering followed by simulated testing atmospheric conditions (b, d, f) for samples with no AFL (a, b), C-AFL (c, d) and N+C-AFL (e, f). Highly magnified image shows the characteristic N+C-AFL structure (g). The cross sectional image presents actual multilayered fuel cell with N+C-AFL(h).

57
0 1 2 3 40.0
0.2
0.4
0.6
0.8
1.0
Current Density (A/cm2)
Pote
ntia
l (V)
0.0
0.2
0.4
0.6
0.8
1.0
1.2
Power Density (W/cm
2)
600oCN+C-AFL
C-AFL
no AFL
(a)
0 1 2 3 40.0
0.2
0.4
0.6
0.8
1.0
Current Density (A/cm2)
Pote
ntia
l (V)
0.0
0.2
0.4
0.6
0.8
1.0
1.2
1.4
Power Density (W/cm
2)
N+C-AFL 650oC
600oC
550oC
500oC
(b)
Figure 3-3. Comparison of I-V characteristics for the fuel cell samples with N+C AFL, C-AFL, and no AFL at 600 °C. (a) I-V plots at the temperature ranging from 650 to 500 oC for N+C-AFL (b), C-AFL (c), and no AFL (d).

58
0 1 2 3 40.0
0.2
0.4
0.6
0.8
1.0
Current Density (A/cm2)
Pote
ntia
l (V)
0.0
0.2
0.4
0.6
0.8
1.0
1.2
1.4
Power Density (W/cm
2)
C-AFL
650oC
600oC
550oC
500oC
(d)
0 1 2 30.0
0.2
0.4
0.6
0.8
1.0
Current Density (A/cm2)
Pote
ntia
l (V)
0.0
0.2
0.4
0.6
0.8
1.0
1.2
1.4
Power Density (W/cm
2)
no AFL
650oC
600oC
550oC500oC
(c)
Figure 3-3. Continued

59
0.00 0.05 0.10 0.15 0.20 0.25 0.300.00
0.05
0.10
-Z'' (
Ω cm
2 )
0.0 0.1 0.2 0.3 0.4 0.5 0.60.0
0.1
0.2
-Z'' (
Ω cm
2 )
0.0 0.2 0.4 0.6 0.8 1.0 1.2 1.40.0
0.2
0.4
-Z
'' (Ω
cm2 )
0.0 0.5 1.0 1.5 2.0 2.5 3.0 3.50.0
0.5
1.0
Z' (Ω cm2)
-Z'' (
Ω cm
2 )
650oC
600oC
550oC
500oC
N+C-AFL C-AFL no AFL(a)
(b)
(c)
(d)
Figure 3-4. Electrochemical impedance spectra of the testing samples with N+C AFL, C-AFL and no AFL at various temperature; 650 °C (a), 600 °C (b), 550 °C (c), and 500 °C (d).

60
500 550 600 6500.0
0.2
0.4
0.6
0.8
1.0
1.2
1.4
Max
imum
Pow
er D
ensit
y (W
/cm
2 )
Temperature (oC)
N+C-AFL C-AFL no AFL
(a)
500 550 600 6500.0
0.5
1.0
1.5
2.0
2.5
3.0
3.5
4.0
N+C-AFL C-AFL no AFL
Area
Spe
cific
Resis
tanc
e (Ω
cm2 )
Temperature (oC)
(b)
Figure 3-5. MPD (a) and ASR plots (b) for the different samples tested between 500 and 650 °C.

61
Table 3-1. Detailed OCP, MPD and ASR values of the fuel cell samples with N+C-AFL, C-AFL, no AFL at 600oC.
Cell Type OCP MPD Total ASR Ohmic ASR Electrode ASR unit V mW/cm2 Ωcm2 Ωcm2 Ωcm2
no AFL 0.82 300 0.607 0.149 0.458 C-AFL 0.86 682 0.387 0.102 0.285
N+C-AFL 0.85 1156 0.206 0.070 0.136

62
CHAPTER 4 EFFECT OF NI-GDC AFL COMPOSITION ON PERFORMANCE OF IT-SOFCS
4.1 Introduction
Wider commercialization of solid oxide fuel cells (SOFCs) can be achieved by
lowering the operation temperature [5]. Critical points to achieve this goal are to
alleviate the significantly increased ohmic and activation polarizations at reduced
temperatures due to their thermally activated nature [5, 7, 44]. Anode-supported
designs for solid oxide fuel cells operating at intermediate temperatures (IT, 500 ~ 650
°C) are widely used due to their ability to utilize a very thin electrolyte (below ~10 μm),
eliminating a large fraction of the ohmic polarization loss [51, 52]. Currently, state of the
art thin electrolytes and highly electrocatalytic cathodes are applied on anode-supported
cells, showing high performance at IT ranges. For example, we reported that anode
supported SOFCs using a Ni/ Ce0.9Gd0.1O1.95 (GDC) composite anode, bismuth
oxide/GDC bilayered electrolyte and bismuth/ruthenate composite cathode achieved an
exceptionally high maximum power density (MPD) of ~ 2 W/cm2 at 650 °C [20]. In the
anode-supported design, however, anodic polarization at the interface can dominate
due to its relatively high fraction of volume compared to the electrolyte and cathode.
Generally, the anode-support is fabricated using submicron-sized NiO particles with
pore-former to increase porosity in the anode [11, 53]. Even though sufficient porosity is
readily achieved, the large sized pores at the electrolyte interface cause a large
interfacial anodic loss and low mechanical strength due to the poor quality of electrolyte
deposition [11]. To overcome these problems, interfacial anode functional layers have
been developed. Up to this date, many researchers have reported that thin anode
functional layers (<10 μm) using fine particles without pore-former effectively reduce

63
activation polarization by increasing triple phase boundary (TPB) density, strengthening
mechanical properties and lowering ohmic losses by improving the quality of electrolyte
deposition due to significantly reducing interfacial porosity [11, 53-56].
For the last several years, we have concentrated on developing high performance
IT-SOFCs with a tape cast Ni-GDC anode using large micron-sized NiO particles [14].
Although this anode design provided sufficient mechanical properties and porosity
without additional pore-former, it still suffered from low performance. The low
performance is due to the coarse microstructure with large size pores at the electrolyte
interface, causing poor electrolyte deposition. Recently, Ahn et al. introduced a new
method to establish AFLs by dispersing a GDC precursor solution at the
anode/electrolyte interface by simple spray coating. This resulted in ultra fine particles
forming a much smoother interface, leading to extended TPB density [14]. Based on this
study, Lee et al. developed a novel AFL integrating a nanosized Ni-GDC particles into a
submicron-sized AFL by a simple precursor solution coating [57]. Because of the nature
of the precursor solution, very fine Ni-GDC particles were well-distributed and formed a
bimodally structured AFL. The AFL led to a high performance of ~1.3 W/cm2 at 650 °C
with a 10 μm thick GDC electrolyte. We have shown how microstructural changes due
to different particle sizes influence the electrochemical performance for SOFCs with
respect to the surface porosity and anode active reaction sites, TPBs. However, the
spatial distribution, amount of porosity and TPBs in two phase composite anodes can
be significantly affected by the amount of each phase [12, 58]. In this study, we
fabricated and investigated IT-SOFCs having AFLs of various compositions using
submicron-sized NiO and GDC particles at the electrolyte interface. Electrochemical

64
performance studies were conducted by current-volage (I-V) and impedance testing.
The optimal composition of this AFL was investigated, and the relationships between
composition and performance were analyzed.
4.2 Experimental
4.2.1 Cell Fabrication
Flat NiO-GDC anode supports were fabricated by the tape-casting method. In
order to provide a sufficient gas channel without the aid of pore-former, micron-sized
large NiO particles (Alfa Aesar) were mixed with nano sized GDC from Rhodia. In this
study, the composition of the anode support was fixed at 65 to 35wt% of NiO to GDC.
Based on the ethanol solvent, an appropriate binder system was prepared with
Solsperse, di-n-butyl phthalate (DBP) and poly-vinyl butyral (PVB) as the dispersant,
plasticizer, and binder respectively. For a homogeneous slurry with proper viscosity and
strength before and after tape casting, the binder system was mixed with the powder
mixture and ball-milled for 24 hrs. After a de-airing step to avoid cracks or defects
caused by air bubbles during the tape-casting process, a Procast tape casting system
(DHI, Inc) produced a NiO-GDC anode tape from the slurry. To make a button type fuel
cell, the dried tape was punched out into a circular shape with a 32 mm diameter and
pre-sintered at 900 °C for 2 hrs.
For a finer and graded AFL structure, submicron-sized NiO (JT-Baker) was mixed
with nano-sized GDC (Rhodia). To investigate the effect of the composition of the AFL,
various NiO-GDC AFL contents, from 40wt% to 80wt% of NiO, were fabricated on the
anode surface by spin coating. Similar to the tape casting slurry, a proper binder system
was added to each AFL powder, leading to a well dispersed colloidal slurry. During the
spin coating process, the thickness of the Ni-GDC AFL layer was controlled by the

65
number of depositions at the same spin speed and time. In this work, we produced the
same thickness of AFL by applying 3 coats at 1500 rpm for 15s. After deposition, the
AFL layer was pre-sintered at 900 °C for 1 hour to remove the binder system.
For the electrolyte, the same GDC powder for the anode and AFL was ball milled
for 48 hrs with a binder system based on an ethanol solution. As a binder system,
Solsperse (dispersant), PVB (binder) and DBP (plasticizer) were used. The thin GDC
electrolyte was coated by the spin coating method with same process as the AFL
deposition. After deposition, samples were dried at room temperature for 10 hrs. After
drying the multilayer anode/AFL/electrolyte structure was sintered at 1450 °C for 4 hrs.
A La0.6Sr0.4Co0.2Fe0.8O3-δ (LSCF) - GDC composite cathode was prepared and
applied on the GDC electrolyte surface. Cathode inks were synthesized by mixing LSCF
(Praxair) and GDC (Rhodia) at 50:50wt%. For a solvent, Alpha-terpiniol and ethanol
were used. DBP and PVB were used as the plastisizer and binder, respectively. After
mixing and grinding the cathode ink for 1 hour, the ink was brush-painted onto the GDC
electrolyte evenly. The first layer of cathode ink was dried in an oven for 1 hour at 120
°C, and a second layer of the same cathode ink was brush painted onto the first layer.
The active cathode area was ~0.4 cm2. The cathode was fired at 1100 °C for 1 hour. Ag
mesh and Pt wire were bonded onto both electrode surfaces using Pt paste for current
collecting and then fired at 900 °C for 1 hour.
4.2.3 Characterization
For electrochemical performance, the prepared cells were loaded on a fuel cell
testing set-up. In order to obtain the gas-tight sealing, the edge of the cell and testing
tube were covered with a mixture of two parts ceramic sealant using ceramabond-517
(Aremco). I-V tests were carried out by a Solartron 1407E with 3% wet hydrogen as a

66
fuel on the anode side and dry air as an oxidant on the cathode side at various
temperatures. The gas flow rate was controlled by a mass flow controller (MKS 647C).
In addition to current-voltage characteristics, electrochemical impedance spectroscopy
with a two-point probe was measured by a Solartron 1400 using a frequency range of
100 kHz to 100 mHz under the same gas and temperature conditions.
For microstructural analysis, the tested fuel cells were fractured and the cross-
sections of the multilayered structures were observed using a scanning electron
microscope (SEM, JEOL 6400 / 6335F) with the back-scattering mode.
4.3 Results and Discussion
In this study, five kinds of fuel cells with AFLs containing 40, 50, 60, 65, and 80
wt% of NiO were prepared in order to investigate the effect of AFL composition on the
microstructure and electrochemical performance. At the same time, a cell without AFL
was tested as a reference cell.
4.3.1 Microstructural Analysis
Figure 4-1 shows the microstructures from a cross-sectional view of the samples
with different AFL compositions after reducing and testing under 90 sccm of air on the
cathode side and hydrogen on the anode side. In order to directly compare the effect of
the AFL, the thickness of the electrolyte, anode, cathode, and active cathode area were
designed to be the same between the different samples. As seen in Figure 4-1-a~f, the
dense GDC electrolyte for each cell shows an even thickness of 17 to 19 μm, with a few
closed pores. For the other anode and cathode, the thicknesses were measured by
SEM and found to be nearly identical between the samples at 290 μm to 300 μm for
anode and ~30 μm for cathode. For the AFLs, each AFL thickness measured was about
10 μm. In addition, it is clearly shown that interfaces between the AFLs and GDC

67
electrolyte (Fig. 4-1-b~f) look very flat and continuous while the interface between the
GDC electrolyte and anode support (no AFL sample, Fig. 4-1-a) shows a very irregular
and discontinuous morphology due to large pores caused by reduction of large size NiO
into Ni.
In Fig. 4-2, the magnified microstructures of the anode/AFLs nearby the GDC
electrolyte after reducing and testing are presented. In comparing Fig. 4-2-a to 4-2-b~f,
particulate size differences between the AFLs and anode are clearly shown indicating
that submicron-sized NiO successfully formed a very fine Ni-GDC AFL structure. Using
backscattered mode the Ni (dark gray), GDC (white), and pore (black) phases are well
distinguishable due to contrast difference. As shown in Fig. 4-2-b~f, it is observed that
the amount of both Ni phase and porosity due to reduction of NiO into Ni during the
operation increased with higher NiOwt% in AFL.
4.3.2 Effect of AFL Composition on Power Density
4.3.2.1 I-V characteristics at 650 °C
Fig. 4-3 shows I-V characteristics of fuel cells with various compositions of AFL at
650 °C. The open circuit potential of the tested cells were 0.806, 0.834, 0.838, 0.814,
0.807, and 0.801 V for the cells with no AFL, 40, 50, 60, 65, and 80wt% NiO AFL. It has
been commonly reported that formation of AFL at the interface between the anode and
thin electrolyte enhances OCP [13, 14, 57]. Generally the theoretical Nernst voltage for
thin electrolytes below 10 μm can be lowered by gas permeation through electrolyte
which is caused by various structural defects such as open pores and microcracks in
addition to inherent internal shorting of a mixed ionic and electronic conductor (MIEC)
such as doped ceria. In that case, AFL can help to enhance the quality of the electrolyte
deposition by reducing the possibility of crack and pore formation at the interface due to

68
its finer and reduced surface porosity [14, 57]. In addition, as Chen et al. reported, AFL
itself can act as a barrier to gas permeation along with the electrolyte although this can
cause concentration polarization [13].
In this study, however, the OCP does not increase only by the existence of the
AFL, as shown between the AFL cell (0.806V) and 65% wt NiO AFL cell (0.807 V). It is
considered that the electrolyte thickness (~20um) was much larger than the size of bare
anode surface pore (below 5 μm), suggesting a similar gas permeability in all
electrolytes regardless of AFL existence. Instead, the observed OCP seems to be
influenced by AFL composition.
Fig. 4-4 shows the plot of OCP versus NiO composition of the AFL or anode at the
anode/electrolyte interface. Higher OCP is observed with decreasing NiO wt% in the
AFL. SEM observation of the anode and AFL structure before reduction reveals that the
anode without pore-former and AFL are relatively dense with little porosity. Therefore, it
is considered that the total pore volume in the anode or AFL after testing increases
proportionally with NiO content because the only source to produce porosity is the
reduction of NiO under operational conditions. This indicates that an AFL with lower NiO
content forms less porosity after reduction and is a better barrier of gas permeation,
leading to a higher OCP. In addition, the higher Ni content can cause lower OCP
because of greater electronic conductivity. It has been reported that for thin MIEC
electrolyte, OCP greatly depends on electrolyte thickness [59, 60]. Therefore it is noted
that for the ultra thin electrolyte system, the OCP change with AFL composition can be
much greater and have a significant impact on cell performance.

69
The maximum power densities (MPDs) of cells with no AFL, 40, 50, 60, 65, and 80
wt% NiO AFL were obtained from the power density curves in Fig. 4-3 as 882, 732,
1033, 1147, 1077, and 711 mW/cm2, respectively. In addition to MPDs, total area
specific resistance (ASR) value for each cell also estimated from the IV curves near
OCP region. Resultant MPDs and total ASRs are plotted in Fig. 4-5. Compared to the
no AFL cell, cells with 50, 60, and 65wt% NiO AFL showed significant improvement in
MPD at 650 °C. While the OCPs of these cells (Fig. 4-4) shows a different trend and
relatively trivial change (~0.03V), the resultant performance enhancement mostly comes
from decreasing polarization with AFL, as shown in Fig. 4-5. This implies that the finer
AFL structures (Fig. 4-2-c,d,e) effectively increased TPB density at the
anode/electrolyte interface. In contrast, MPDs of cells with 40 and 80wt% NiO AFL
compared to that of cell with no AFL were decreased. In this case, it is considered that
although the AFLs formed very fine particulate structures (Fig. 4-2-b,f), excessively high
content of NiO or GDC can reduce the connectivity of the TPBs (Ni, GDC, and pore)
leading to inactive regions. Therefore, the AFL composition should be considered as an
important factor in terms of SOFC performance.
As mentioned above, the highest MPD was obtained at the AFL with 60wt% of NiO
(1147 mW/cm2) showing a 30% increase compared to no AFL cell (882 mW/cm2), while
higher OCPs were observed at higher NiOwt% AFLs. Assuming full reduction of NiO
into Ni during operation, the Ni to GDC volume ratio of this AFL is easily calculated with
the densities of Ni, NiO and GDC. The results is 48.6vol% Ni to 51.4vol% GDC, that is
almost 1:1 volume ratio. This result is in good agreement with a recent study of NiO-
SDC (samarium-doped ceria) AFL system by Ai et al [12]. It was also predicted by

70
previous modeling work. Schnieder et al. conducted analytical modeling for estimating
TPB length of composite electrode using the discrete element method and showed that
the TPB length is maximized at 50vol% of the ionic conducting phase in the composite
anode [61]. On the other hand, another recent study by Wilson and Barnett reported the
lowest electrode ASR with the highest TPB length at 50wt% NiO in a NiO-YSZ(yttria-
stabilized zirconia) active layer, which is a 1:2 volume ratio of Ni to YSZ [62]. However,
it is reasonably considered that the ionic conductivity of stabilized zirconia is much lower
than that of doped ceria at the IT range (500 °C ~ 800 °C). The NiO particle size (~2.5
μm) used in that study was much larger compared to this study’s NiO size (< 1 μm).
Therefore, the lowest resistance with the highest TPB length can be achieved at lower
GDC content and higher NiOwt%, leading to higher porosity. For further understanding,
the quantification of microstructural properties will be needed to find relationship with
electrochemical performances.
4.3.2.2 Temperature dependence
In order to verify the validity of the optimal AFL composition of 60wt% NiO at the IT
range, a current-voltage measurement for each cell was conducted at various
temperatures from 450 to 650 °C with a 50 °C interval. The resultant MPDs with AFL
composition are plotted in Fig. 4-6, including the MPDs of the no AFL cell separately
marked as open symbols. For all temperatures tested, cells with 60wt% NiO in the AFL
shows highest MPDs with 1147, 626, 271, 118, and 45 mW/cm2 at 650, 600, 550, 500,
and 450 °C, respectively. This result shows that the effect of AFL optimal composition is
valid through the intermediate to low temperature ranges.

71
4.3.2.3 Long term stability
To see the effect of optimal composition AFL on high performance, a potentiostatic
test under an applied voltage where cells reached 98% of their MPD was done for each
cell. The applied voltages were 0.379 V for the AFL cell and 0.380 V for the no AFL cell.
Fig. 4-7 shows preliminary results of a 200 hrs long term stability test for the no AFL and
60wt% NiO AFL cells under the 90 sccm of H2/Air condition. While the no AFL cell
shows initial degradation of power density and stabilized behavior, the effect of the
optimal composition AFL was retained for 200 hrs with high power density of ~1.1
W/cm2. For practical application of this AFL, however, further long term testing under
various temperatures and gas conditions should be conducted.
4.3.2.4 Effect of AFL composition on ASR
In order for further investigation, electrochemical impedance tests were carried out
for all samples. Fig. 4-8-a shows the impedance spectra of each AFL composition at
650 °C for which an I-V test was conducted. From the high and low frequency complex-
plane intercepts of the impedance spectrum with the real axis, the ohmic, electrode, and
total ASR values were calculated while normalizing the resistance according to cathode
area. The detailed values are tabulated in Table 4-1 and plotted in Fig. 4-8-b. As shown
in the Table, in this study, total ASR values from electrochemical impedance (ASREIS)
are within 4% deviation from the ASR at IV curves (ASRIV) in Fig. 4-5.
As expected from the previous section, total ASRs from AFL composition show a
similar trend to the MPD. The lowest total ASR (0.188 Ωcm2) at 650 °C was achieved at
60wt% NiO AFL, which was decreased by 25.7% from that of the no AFL cell (0.253
Ω·cm2). The ohmic ASRs are similar for all samples because the samples tested in this
study have similar thicknesses of electrolytes with similar densities as supported by

72
microstructures shown in Fig. 4-1. Therefore, most of the ASR drop comes from the
electrode ASR drop, which is considered as anodic polarization reduction since the
cathodes should be identical. From this result, it is expected that different AFL
compositions directly influence a change in TPB density, affecting anodic polarization.
Most likely the TPB density is the highest at 60wt% of NiO in AFL, which is at 1:1
volume ratio of Ni to GDC after reduction.
Based on these results, the relationship between electrode ASR and MPD with
various AFL compositions are examined. As shown in Fig. 4-5, the performance
enhancement of power density reflects the ASR trend. In Fig. 4-9, it is clearly shown
that electrode ASR has an almost linear relationship with MPD. However, there are still
some deviations from the linearity. At this point it is noted that the ASRs were measured
at the open circuit condition, whereas the MPDs occurred at higher current densities
which have complex contributions from various polarizations, such as activation, ohmic
and concentration polarization as shown in I-V curves in Fig. 4-3. Therefore, for a more
precise study, the ASRs measured under applied currents will be done in the future. In
addition, to completely understand electrode ASR, comprehensive microstructural
features should be considered, such as surface area, porosity, tortuosity and TPB
density.
4.4 Conclusions
In this study, the effect of AFL composition on the electrochemical performance
was investigated for IT SOFCs. For this, the various AFLs with composition from 40 to
80wt% NiO were fabricated. The fine and well-distributed AFL structures with different
NiO amounts were confirmed by microstructural analysis. The optimal AFL composition
was achieved at 1:1 volume ratio of Ni to GDC in the AFL, which is 60wt% NiO. The

73
effect of the optimal AFL composition on MPD was valid at intermediate to low
temperature ranges. In addition, a preliminary long-term stability test showed the
possibility of practical application of this optimal composition. The measured MPD and
ASR show a linear relationship implying that the performance enhancement greatly
depends on the AFL composition, which might be caused by microstructural features
such as TPB density, porosity, tortuosity of pores and surface area. For further
understanding of the AFL effect on electrochemical performances, the quantitative
analysis of AFL microstructures should be done.

74
GDC electrolyte
LSCF-GDC cathode
Ni-GDC anode
(a) (b)
(d)(c)
(e) (f)
Anode functional layer
Figure 4-1. Backscattered images showing a cross-sectional view of anode-supported
SOFCs with different NiO content in the anode functional layers; no AFL(a), 40wt% (b), 50wt%(c), 60wt%(d), 65wt%(e), and 80wt%(f) NiO.

75
Ni
GDC
Pore
Ni
GDC
Pore
(a) (b)
(d)(c)
(e) (f)
Figure 4-2. Magnified microstructures of the anode or AFLs with different NiO content no AFL(a), 40wt% (b), 50wt%(c), 60wt%(d), 65wt%(e), and 80wt%(f) NiO. Backscattering mode provides better contrast to distinguish Ni (dark gray), GDC (white), and pore (black) phases.

76
0 1 2 3 4 5 60.0
0.2
0.4
0.6
0.8
1.0
1.2 no AFL 40:60 AFL 50:50 AFL 60:40 AFL 65:35 AFL 80:20 AFL
Current Density (A/cm2)
Pote
ntia
l (V)
0.0
0.2
0.4
0.6
0.8
1.0
1.2Power Density(W
/cm2)
Figure 4-3. I-V plots of fuel cells with various AFL compositions at 650oC; 40(), 50(), 60(), 65() and 80()wt% of NiO in AFL, and no AFL(). The gas condition was 90sccm of air and 3% of wet hydrogen on the anode and cathode side, respectively.

77
20 30 40 50 60 70 80 90 1000.79
0.80
0.81
0.82
0.83
0.84
0.85
OCP
(V)
NiO in AFL (wt%) .
Figure 4-4. Open circuit potential of the fuel cells with various NiO contents in NiO-GDC AFL. Solid line (red) shows linear fit of the measured data (square)

78
40 50 60 70 80200
400
600
800
1000
1200
1400
NiO in AFL (wt%)
MPD
(mW
/cm
2 )
0.10
0.15
0.20
0.25
0.30Total ASR
iv (Ω cm2)
Figure 4-5. MPD (Red square) and total ASRIV estimated from IV curves (blue star) are plotted with NiO contents in AFL. The open symbols represent no AFL cell.

79
600oC
550oC
500oC450oC
650oC
40 50 60 70 800
200
400
600
800
1000
1200
MPD
(mW
/cm2 )
NiO in AFL (wt %) .
Figure 4-6. Maximum power densities of fuel cells with various AFL compositions at the temperature range from 450 to 650 °C. Open symbols represent MPD of no AFL cell at each temperature.

80
Figure 4-7. Long term stability test of fuel cell with 60wt% of NiO in the AFL and the no
AFL cell for 200 hrs at 650 °C. Potentiostatic tests were conducted with an applied voltage of 0.379 V for the NiO 60wt% AFL cell and 0.380 V for the no AFL cell, at which the cells showed 98% of MPD. The gas condition was 90sccm of air and 3% of wet hydrogen on the anode and cathode side, respectively.

81
650oC
0.00 0.05 0.10 0.15 0.20 0.25 0.300.00
0.05
0.10
0.15
0.20
0.25
0.30 no AFL 40:60 AFL 50:50 AFL 60:40 AFL 65:35 AFL 80:20 AFL
-Z'' (
Ω c
m2 )
Z' (Ω cm2)
(a)
Electrode ASR
Ohmic ASR
Total ASR
40 50 60 70 800.00
0.05
0.10
0.15
0.20
0.25
0.30
0.35
Area
Spe
cific
Resis
tanc
e (Ω
cm2 )
NiO in AFL (wt%)
(b)
Figure 4-8. Impedance spectra with various AFL compositions (a), and total, electrode, and ohmic ASRs of fuel cells with different NiO content (b) calculated from impedance spectra (a). Open symbols represent no AFL results.

82
0.14 0.16 0.18 0.20 0.22
700
800
900
1000
1100
1200
Electrode ASR (Ω cm2)
MPD
(mW
/cm
2 )60:40 AFL
65:35 AFL
50:50 AFL
no AFL
40:60 AFL
80:20 AFL
Figure 4-9. MPD plots with electrode ASR shows a linear relationship . Red line is linear fitting of the measured data (black dots).

83
Table 4-1. Detailed ASR values of the testing cells with various NiO contents in AFL
AFL NiO (wt%)
Total ASR iv (Ω cm2)
Total ASR EIS
(Ω cm2)
Ohmic ASR
(Ω cm2)
Electrode ASR
(Ω cm2) 40:60 40 0.259 0.260 0.071 0.189 50:50 50 0.227 0.231 0.070 0.161 60:40 60 0.182 0.188 0.055 0.133 65:35 65 0.196 0.203 0.061 0.142 80:20 80 0.286 0.281 0.076 0.205
no AFL 65 0.253 0.253 0.074 0.179

84
CHAPTER 5 COMPREHENSIVE QUANTIFICATION OF NIO-GDC ANODE FUNCTIONAL LAYER
MICROSTRUCTURE BY THREE-DIMENSIONAL RECONSTRUCTION USING FIB/SEM
5.1 Introduction
The inevitable demand on lowering solid oxide fuel cell (SOFC) operational
temperatures has been fueled by commercialization of SOFCs [3, 5, 7, 9, 63]. Currently
the anode supported SOFC design has been widely studied due to possible
accommodation of ultra thin electrolyte [8, 20, 55]. For this design, however, the anode
polarization is possibly dominant due to the anode having the largest volume fraction in
the SOFC. To solve this problem, the electrode polarization losses at the anode should
be effectively reduced. It has been well known that the microstructures of an electrode
greatly influence the electrochemical properties in a SOFC. For example, the volume
fraction of the each component in the electrode can modify microstructures in an anode
or cathode[62]. In previous work, it was shown that tailoring different compositions of
the anode functional layer changed the electrochemical performance and power density
of the SOFC [64]. In the work, 60wt% of NiO in NiO-GDC AFL, which is Ni-GDC AFL
after reduction, showed highest maximum power density with 1.15 W/cm2 at 650 °C.
Reducing the electrode ASR is the major factor for increase performance, and the ASR
was found to have an optimal NiO composition (60wt%) of AFL. Moreover, the electrode
ASR and AFL composition change showed an inverse linear relation to maximum power
density. It was expected that at the optimal composition the number of reaction sites,
that is, triple phase boundaries (TPBs), which consisted of an electronic conductor (Ni),
ionic conductor (GDC), and gas diffusion path (pore), is highest. However, the
evaluation of TPB density is not easily achieved with the conventional two dimensional

85
(2D) SEM analysis. Some studies were conducted for estimating TPB length or density
by stereological methods using analysis of 2D SEM images [62, 65]. However, accuracy
of active TPB length estimation was limited due to phase interconnectivity issues, which
is three-dimensional (3D) property. Recently, 3D reconstruction techniques were
employed to deal with microstructural analysis of SOFCs using FIB/SEM dual beam
system [66-72]. Using this technique, more accurate and realistic quantifications of the
SOFC electrode microstructure has been available. Moreover, quantified microstructural
features were attempted to link directly with electrochemical properties. For example,
TPB density was linked to charge transfer and adsorption properties and the tortuosity
was used to describe concentration polarization[68]. However, most of the studies were
conducted for composite cathodes and Ni-YSZ anode for intermediate to high
temperature (> ~700 oC) SOFC applications.
In this study, the microstructural features of Ni-GDC AFLs, which is widely used for
intermediate to low temperature (400 ~ 700 oC) SOFCs, with different NiO contents
were investigated by 3D reconstruction technique using a FIB/SEM dual beam system.
After reconstruction, the comprehensive quantification for various properties of the
studied samples was conducted and the values were analyzed. Finally, the active TPB
density was calculated and linked with electrochemical performances
5.2 Experimental
In the work four AFL samples were reconstructed and quantified, which include
cells with 50, 60, 65, and 80wt% NiO AFL. As a reference, a sample without an AFL
was also reconstructed. The detailed fabrication process and electrochemical
performance test of the samples were described in previous work [64]. First of all, all
samples were mounted in an epoxy supporter using a Struers EpoVac System. At the

86
same time, this epoxy infiltrates into the samples and fills open pores inside porous Ni-
GDC anode/AFL structures, providing better contrast for SEM imaging. After the
mounting process, the sample stub was grinded and polished using sandpaper and
diamond paste down to 1μm roughness to obtain an even surface of the mount
exposing anode-electrolyte interface.
The automated sectioning and imaging were carried out with a FIB/SEM duel
beam system (FEI Strata DB 235). In this system, the electron beam pole (SEM)
against the ion beam pole (FIB) leans at a 52o angle. (Fig. 5-1-a) The image at each
slice was captured by SEM. To get better contrast difference among the phases, a
through-lens-detector (TLD) in backscatter mode was utilized. The FIB was used to
create a trench around the region of interest (ROI). The slicing distance (z-axis
resolution) was 60 nm. To avoid charging effect during SEM process and protect from
ion damage, protective platinum layers were deposited with an in-situ liquid metal-
organic ion source (LMIS). This repeated imaging and slicing processes were
automatically controlled using the Auto Slice and View software system (FEI Company).
After collecting the cross-sectional images for each sample, the alignment,
segment, cropping and labeling for the three dimensional reconstruction were
conducted by Amira software – ResolveRTTM (ver 4.0, Mercury Computer System Inc.).
Fig. 5-1-b shows the schematic diagram of 3D reconstruction process. Amira was also
utilized to quantify the various microstructural features from the 3D reconstructions of
the samples, such as each phase (Ni, GDC, and pore) volume and surface area, phase
gradient, and tortuosity of pores.

87
5.3 Results and Discussion
Fig. 5-2 shows the 3D reconstructions of the cells, which allows for direct
qualitative comparisons between the anode/AFL structures. The z-axis dimension
reconstructed for each sample was approximated at the distance of 8~10 μm from GDC
electrolyte interface. Considering AFL thickness (~10μm) measured in previous study,
the analyzed AFL depth in this study covers almost full cross-section of each AFL [64].
The detailed dimention for reconstructed samples are summariezed in Table 5-
1.Compared to the no AFL sample (Fig. 5-2-a), cells with AFLs (Fig. 5-2-b,c,d,e) show
much smaller particulate structures. Among the AFLs, the change of amount of Ni
(green in 3D reconstruction) and GDC (red in 3D reconstructions) is clear as NiOwt%
increases. This result is in good agreement with 2D SEM image observation discussed
in the previous section. Moreover, this 3D reconstruction allows the separation of each
phase, or to combine only two phases. As illustrated in Fig. 5-3, each phase of GDC, Ni,
pore, and combination of Ni-pore phases were reconstructed individually. From this
phase separation, the quantification of the phase gradient, volume fraction, and surface
area for each phase is possible. For the spatial distribution of each phase in AFLs, the
phase gradient for each AFL sample was plotted in Fig. 5-4. It is evident in Fig. 5-4 that
from b to e, the level of Ni and pore phase is getting higher, while the amount of GDC
phase is decreased. In addition, the all AFLs (Fig. 5-4-b,c,d,e) have a very narrow
transition zone (~ below 500nm) which is a region for significant increase of the GDC
phase nearby GDC electrolyte, compared to over 2000 nm for bare anode (Fig. 5-4-a).
This result indicates a very fine microstructure in the AFL and its features such as high
surface area and large amount of reaction sites (TPBs) are well retained at the interface
of the AFL/electrolyte. The anode without AFL lose many reaction sites and gas

88
diffusion paths due to penetration of the GDC electrolyte into large anode pores at the
interfacial zone which is known to be the most important active reaction zone for the
hydrogen oxidation.
For Ni, GDC and pore phases, the phase volume fractions were quantified using
AmiraTM tissue-statistics module. In this module, the number of voxels for each phase
were counted and based on this result the numerical volume fraction for each phase is
easily able to be calculated. This result can be one of the basic criteria for the practical
confirmation of the credibility of the resultant 3D reconstructions. It is because there are
theoretical values of Ni reduced from NiO, GDC, and pore volume fraction based on
initial AFL composition, which can be calculated from the material properties such as Ni,
NiO, and GDC densities when assuming full reduction of NiO into Ni. The theoretical
and measured values of total volume fraction of each phase for different AFL are
tabulated in Table 5-1 and plotted in Fig. 5-5-a. As observed in phase gradient graphs
(Fig. 5-4), the Ni contents and porosity in AFL increases with increasing NiOwt%, while
GDC is inversely proportional to initial NiOwt% in AFL. It is clearly shown that the Ni and
GDC volume fractions extracted from the 3D reconstruction are well matched with
theoretical values. For example, the volume fractions of Ni were 29.1 ± 1.0, 37.8 ± 5.9,
43.2 ± 6.7 and 51.1 ± 6.4vol% for 50, 60, 65, and 80wt% NiO AFL samples,
respectively, which are very close to the theoretical values of 30.4, 36.3, 39.2, and
47.7vol%. However, porosity is little below the theoretical value, which might be an
attributable to sampling resolution. In addition to the total volume fraction, the solid
phase volume fraction between GDC and Ni was also calculated (Fig. 5-5-b). As
expected from the theoretical value, at 60wt% NiO AFL the Ni to GDC volume ratio was

89
almost 1:1 with measured value of 48.1 ± 6.7 and 51.9 ± 6.7, at which ratio the highest
performance among studied samples were shown in previous section. At this point, it is
noted that these volume fraction results from the 3D reconstructions were based on
around 150 slices of 2D SEM images and the graded phase plots in Fig. 5-4 showed the
continuous fluctuation of each phase along the distance from the electrolyte. Therefore,
to quantify the structural analysis of the composite SOFC anodes, the 3D reconstruction
is more reliable and necessary compared to 2D SEM image analysis method.
The total surface area values of the AFL structures with different NiO contents
were calculated using Amira tissue statistics module. The resultant values are
normalized by the total volume of the region of interest (ROI) (Table 5-2).
The effective particle or pore diameters (d) for each AFL composition were
calculated with a Brunauer-Emmett-Teller (BET) method using a general formula written
as;
SVd 6= (5-1)
where V and S are the volume and surface area of the each phase, respectively.
The Amira tissue statistics program was utilized for the calculation of the phase volume
and surface area of Ni, GDC and pore in each sample. The effective diameters of Ni
(dNi) phase in 50, 60, 65 and 80wt% NiO AFL correspond to 683, 771, 917, and 1120
nm, respectively, showing the expected trend. The complete data set is tabulated in
Table 5-2 and plotted in Fig. 5-6. For all three phases, the linear relationship between
effective diameter and AFL composition is shown, which is the proportionality for Ni and
porosity, and an inverse proportionality for GDC. This result implies that the high NiO
content in the AFL produce a structure with large Ni particles and very small GDC

90
particles, which can cause poor connectivity of the smaller particle phase (GDC),
increasing the deactivated TPB sites. In contrast, for low NiO AFL, same situation for Ni
phase can occur but worse due to lower porosity, which interferes with the fast gas
diffusion. Therefore, it is expected that at the medium point, around 55~60wt% NiO AFL
can have optimal structure for highest TPB density. In this case, particle size control
should be considered with other factors, such as composition and porosity.
The tortuosity was estimated using the moment of inertia module in the Amira
software. Using this module, tracking of the center of the open pore phase through
sample from the beginning of the AFL to the GDC electrolyte interface is possible, which
allows us to measure the accumulated 3D Euclidian distance through the region. The
accumulated Euclidean distance divided by AFL thickness yielded the tortuosity of the
each sample (Table 5-2). For the 50, 60, 65, and 80wt% NiO AFL, the tortuosity values
were 2.77, 1.91, 1.91, and 1.69, respectively. This result is in good agreement with the
general theory that the higher porosity with larger pore diameter provides less
complicated gas diffusion paths thorough the open pores, which means low tortuosity.
This tortuosity concept can be combined with volume fraction of porosity to estimate
effective diffusion coefficient, which is directly related to concentration polarization [68].
Therefore, for further analysis of this property and cell performance the deconvolution of
the electrochemical impedance under applied current is in progress.
The TPB density for each AFL composition was quantified. The TPB site is where
the three phases such as Ni, GDC, and pore meet at the same place. However, the
TPB works only when these phases are properly connected. For example, the GDC
phase of a TPB site should be connected to the GDC electrolyte to make a path for

91
oxygen ions from anode(AFL)/ GDC electrolyte interface to the active site. At the same
time, the Ni phase and pores should have percolation to the interconnect (or current
collector) and fuel side (outside anode), respectively. The reasons are to bring hydrogen
gas from the fuel source to TPB sites, to conduct charge transfer during hydrogen
oxidation at the TPB, and to complete the extraction of electrons from the reaction site
outside circuit. Therefore, counting the active TPB and removing the inactive (dead)
TPB from the total TPB measurement is a critical issue[70, 72]. In this study, the TPB
density was calculated based on the 3D reconstruction. For 3D reconstruction, every
voxel was label one of the phases including GDC, Ni, and pore. Generally one edge is
shared by 4 voxels and if an edge is shared by all 3 kinds of phases, then it is counted
as TPB length (Fig. 5-7). In order to estimate the actual working TPB density, the TPB
sites were classified into 3 categories, which are active, inactive, and unknown TPB. For
this, connectivity of each phase at the TPB was traced along xy, yz, and zx plane. If the
Ni, GDC and pores are connected across the AFL from GDC electrolyte to end of the
AFL, it was counted as ‘active’ TPB. If one of the phases connected to the TPB site was
isolated inside the reconstructed region, which was referred to ‘inactive TPB’. Other
cases are sorted as ‘unknown’ TPBs. The total TPB length (LTPB) was estimated by
summation of the length of the voxel edges counted as the TPB. The TPB density (ρTPB)
is calculated by
total
TPBTPB V
L=ρ (5-2)
where the Vtotal is the total volume of ROI. The unit of TPB density is μm-2 (= μm/
μm3). For unknown TPBs, it was assumed that the same connectivity of the each phase
exists out of the ROI and the unknown TPBs might have the same portion of the active

92
and dead TPB in known region. Based on this assumption, the total active TPB density
(ρTPB, active, total) was estimated by
++=
deadTPBactiveTPB
unknownTPB
total
activeTPBtotalactiveTPB LL
LV
L
,,
,,,, 1ρ (5-3)
where the LTPB,active, LTPB,dead, and LTPB,unknown are active, dead, and unknown TPB
length in a measured volume, respectively. The calculated total active TPB densities
were 8.5 ± 1.4, 15.6 ± 5.0, 14.2 ± 3.4, and 6.3 ± 2.3 μm-2, respectively (Table 5-2). As
expected from total surface area and effective particle size analysis discussed above,
the highest TPB density was achieved in AFL with 60wt% NiO, which is 1:1 volume ratio
of Ni to GDC. Moreover this is in good agreement with the electrochemical impedance
analysis in previous chapter. However, the standard deviation of TPB is greater for
higher values. This result might reflect that the AFL with larger TPB density has higher
randomness and complicity of the structure. This scattering of the TPB density can be
reduced by introducing computational simulation method [72] or morphological
correction factor [71]. Fig. 5-8 shows the TPB result compared to surface area. The
surface area for each sample does not show any trend with AFL composition contrast to
TPB density. It does not seem to be in agreement with results from other studies that
the higher surface area produces higher probability of TPB density as previous shown
previous studies [65, 67]. However, it should be considered that in this study the
effective particle size and porosity was controlled by compositional change of AFL
accompanying volume fraction change between phases, while other studies the phase
composition of the electrodes were fixed. Fig. 5-9-a shows the TPB and electrode ASR
with various AFL compositions. For the electrode ASR, the result was taken from the
previous study [64]. In that study the electrode ASR measured from the AFL with

93
different NiO contents were presumable assumed that the cathode ASRs were the
same value due to same process of the cathode fabrication for each cell. Therefore, the
electrode ASR trend can show the anodic ASR change. As shown in Fig. 5-9-a, TPB
density shows the inverse trend of electrode (anode) ASR change. Previously, Bieberie
et. al reported that the main electrode process directly depends on the TPB length [73].
In that research, using a Ni pattern anode as a model electrode, they showed that the
electrode conductivity under open circuit condition is correlated to TPB length, which is
linear relationship between inverse resistance and TPB length. Fig. 5-9-b shows the
plotting of one over ASR corresponds to TPB density, also showing the linear
relationship. However, some deviation from the linearity is shown. This can be occurred
by scattering of the TPB length from the 3D reconstruction accuracy or the different
electrochemical mechanism dependence of compositional change of AFL on
electrochemical polarization. Previously, Smith et. al reported that for the LSM-YSZ
cathode the charge transfer and adsorption have a different dependence on TPB length,
which was evaluated by deconvolution of impedance[68]. Therefore, further study about
the effect of TPB density on anode polarization loss will be conducted through the
deconvolution of anode impedance under applied current.
5.4 Conclusions
In this work, microstructural properties of Ni-GDC anode functional layers for IT-
SOFCs were quantified by state-of-the-art 3D reconstruction technique. For 3D
reconstruction, each sample was automatically sectioned and each sectional image was
acquired using FIB/SEM dual beam system. After labeling of each image to give phase
separation, the series of sectioned images were incorporated and reconstructed in 3D
utilizing the Amira software. From this 3D reconstruction, the phase gradient through the

94
sample depth and volume fraction, effective diameter, surface area for each phases (Ni,
GDC, and pore), and pore tortuosity were quantified. This result showed that the volume
fraction was well matched with theoretical value showing each sample was well
reduced. In addition to volume fraction, the graded phase plot showed that the actual
AFL/ anode structure have some degree of deviation of the each phase volume fraction,
so the accurate quantification microstructural properties could be achieved by bulk
analysis. As one of the most important features in the anode microstructure, the active
TPB density was evaluated with the algorithm of checking the connectivity of voxels for
each phase. The highest TPB length was found at the 1:1 volume ratio of the Ni to GDC
in AFL. Moreover, the TPB densities showed a linear relation to the inverse of electrode
ASR. For the more accurate TPB estimation, the mathematical adjustment of
rectangular voxel will be needed. In addition, the detailed analysis of anode reaction
mechanism by deconvolution of impedance spectrum should be conducted for the direct
relation to electrochemical properties with quantified microstructural features.

95
(a)
YX
Z
50nm
YX
Z
50nm
10μm
Alignment, Cropping, Segmentation
3D reconstructionSerial sectioning-2D images
(b)
Figure 5-1. Schematic diagram of FIB/SEM dual beam system with sample (a) and 3D
reconstruction process (b)

96
(a) (b)
(c) (d)
(e)
Figure 5-2. 3D reconstruction of Ni-GDC anode (a), and AFLs with initial composition of
50 (b), 60 (c), 65 (d), and 80 (e)wt% NiO nearby at anode(or AFL)/electrolyte interface.

97
(a) (b)
(c) (d)
Figure 5-3. Individually reconstructed phases from the 3D reconstruction of AFL with 65
wt% NiO ; GDC (a), Ni (b), Pore (c), and combination of Ni and Pore phases

98
0 2000 4000 6000 8000 100000
20
40
60
80
100
Phas
e Vo
lum
e (%
)
Distance from electrolyte (nm)
Pore GDC Ni
(a)
0 2000 4000 6000 8000 100000
20
40
60
80
100
Distance from Electrolyte (nm)
Phas
e Vo
lum
e (%
)
Pore Ni GDC
(b)
Figure 5-4. Phase gradient of reconstructed samples with no AFL (a), 50 (b), 60 (c), 65
(d), and 80 (e)wt% NiO in Ni-GDC AFL

99
0 2000 4000 6000 8000 100000
20
40
60
80
100
Pore Ni GDC
Phas
e Vo
lum
e (%
)
Distance from Electrolyte (nm)
(c)
0 2000 4000 6000 8000 100000
20
40
60
80
100
Distance from Electrolyte (nm)
Phas
e Vo
lum
e (%
)
Pore Ni GDC
(d)
Figure 5-4. Continued

100
0 2000 4000 6000 8000 10000
20
40
60
80
100
Distance from Electrolyte (nm)
Phas
e Vo
lum
e (%
)
Pore Ni GDC
(e)
Figure 5-4. Continued

101
40 50 60 70 800
10
20
30
40
50
60
70
80
Volu
me
Frac
tion
(vol
%)
NiO in AFL (wt %)
NiGDCPore
(a)
40 50 60 70 800
10
20
30
40
50
60
70
80
Solid
Vol
ume
Frac
tion
(vol
%)
NiO (wt %)
NiGDCPore
(b)
Figure 5-5. Volume fraction of Ni, GDC and pore phase in total volume (a), and volume
fraction of Ni and GDC in solid volume of AFLs with various compositions. Open symbols represent theoretical values.

102
50 60 70 80
400
600
800
1000
1200
D
iam
eter
(nm
)
NiO in AFL (wt %)
NiGDCPore
Figure 5-6. Effective particle diameters of Ni (rectangular), GDC (circle), and pore
(triangle) phase of AFLs with various compositions

103
GDC
Ni
Pore
TPB
Figure 5-7. Schematic diagram of TPB length calculation from 3D reconstruction. A rectangular parallelepiped represents a voxel in a 3D reconstruction and each one is labeled as one of phases; Ni, GDC, or Pore phase. A edge which is shared by all three phases is counted as a TPB length.

104
50 60 70 800.0
0.5
1.0
1.5
2.0
2.5
3.0
3.5
4.0S
urfa
ce A
rea
per V
olum
e (µ
m-1)
NiO (wt %)
0
5
10
15
20
25
30
35
40TP
B density (µm
-2)
Figure 5-8. Plot of quantified surface area and TPB density of AFL with various NiO contents. Dotted lines are only for guide purpose.

105
50 60 70 800
10
20
30
40
NiO in AFL (wt %)
TPB
Dens
ity (1
/µm
2 )
0.00
0.05
0.10
0.15
0.20
0.25
Electrode ASR (Ω−cm
2)
(a)
0 5 10 15 20 254.0
4.5
5.0
5.5
6.0
6.5
7.0
7.5
8.0
8.5
1/(E
lect
rode
ASR
) (Ω
-1-c
m-2)
TPB Density (µm-2)
60:40 AFL
65:35 AFL
50:50 AFL
80:20 AFL
. (b)
Figure 5-9. (a) TPB density and electrode ASR with various AFL compositions (Dotted
lines are only for guide purpose.) (b) plot of 1 over electrode ASR with TPB density. A red line represents linear fit for the plot showing inverse relationship between TPB and electrode ASR.

106
Table 5-1. 3D reconstruction dimension and total volume fractions of Ni, GDC and pore phase and solid volume fractions of Ni and GDC
Initial AFL Composition
NiO (wt%) 50 60 65 80
GDC (wt%) 50 40 35 20
3D Reconstruction
Dimension
X (μm) 12.95 8.75 10.45 10.42
Y(μm) 10.22 6.06 7.95 7.88
Z(μm) 8.90 10.64 10.76 9.32
Total Reconstructed
volume (μm3) 1177.91 564.21 893.91 765.26
Phase Volume
After Reduction
Ni in Total volume(%)
Theoretical 30.4 36.3 39.2 47.7
Measured(SD) 29.1(~1.0) 37.8(~5.9) 43.2(~6.7) 51.1(~6.4)
GDC in total volume(%)
Theoretical 48.3 38.4 33.4 19.0
Measured(SD) 54.6(~3.0) 40.6(~4.8) 35(~5.5) 20.0(~5.9)
Pore in total volume(%)
Theoretical 21.2 25.3 27.4 33.3
Measured(SD) 16.3(~2.9) 21.6(~3.0) 21.8(~3.2) 28.9(~2.9)
Ni in solid volume(%)
Theoretical 38.6 48.6 53.9 71.6
Measured(SD) 34.8(~1.0) 48.1(~6.7) 55.1(~7.3) 71.9(~8.0)
GDC in solid volume(%)
Theoretical 61.4 51.4 46.1 28.4
Measured(SD) 65.2(~1.0) 51.9(~6.7) 44.9(~7.3) 28.1(~8.0)
Table 5-2. Summary of quantification of microstructural features of AFL with various
compositions Initial NiO composition in
AFL wt% 50 60 65 80
Effective Ni diameter, d Ni nm 683 771 917 1120 Effective GDC diameter,d GDC nm 890 642 650 316 Effective Pore diameter,d pore nm 381 452 489 560 Surface area per volume, SA/V μm-1 2.4 2.9 2.4 2.6
Tortuosity,τ N/A 2.77 1.91 1.91 1.69
TPB density,ρTPB(SD) μm-2 8.5(~1.4) 15.6(~5.0)
14.2(`3.4) 6.3(~2.3)
*Electrode ASR at 650oC Ω-cm2 0.161 0.133 0.142 0.205

107
CHAPTER 6 HIGH PERFORMANCE IT-SOFC WITH CERIA/BISMUTH OXIDE BILAYERED
ELECTROLYTES FABRICATED BY A SIMPLE COLLOIDAL ROUTE USING NANO-SIZED ESB POWDER
6.1 Introduction
Solid oxide fuel cells (SOFCs) have been widely accepted and studied as a next-
generation energy conversion device. They produces electricity by electrochemically
combining fuel and oxidant across a ceramic ionic conductor, i.e., a solid state
electrolyte [2]. The efficiency of SOFCs is not limited by theoretical Carnot efficiency,
unlike that of combustion-type systems is limited. The fuel-to-electrical efficiency can
reach approximately 45 to 60%. Considering utilization of the by-product heat in co-
generation or bottoming cycles, the projected system efficiency can exceed 80%. In
addition to high efficiency, SOFCs are attractive because of their reduced production of
SOx and NOx, and significantly lower green house gas emissions compared to
combustion engines [3].
High system cost is the one of the largest barriers to the commercialization of
SOFC technology. Ionic conduction in the solid electrolytes is a thermally activated
process, leading conventional SOFCs to operate in a temperature range from 900 oC to
1000 oC. Consequently this high operation temperature requires the use of ceramic
interconnects, high temperature seals, and supper-alloy based balance-of-plant
components, resulting in prohibitive system costs [9]. As Steele claimed, in lower
temperature operation (500~700 oC), the system cost can be significantly reduced by
allowing for the use of cheap stainless steel for the bipolar plates and the balance-of-
plant, combined with the use of high temperature gaskets rather than rigid glass-based
seals, which can also enhance its mechanical stability and lifetime [5].

108
Recent research efforts aim to develop alternative SOFC materials that operate in
the 500 to 800 ºC range. There are two major issues for lower temperature operation of
SOFCs. The first is that the reduced oxygen ion conduction in ceramic electrolytes
causes a significant increase in ohmic polarization at low and intermediate
temperatures. The second is that electrode polarization is significant due to reduced
cathode activity at the electrode and electrolyte interface. Therefore, development of
electrolytes with high ionic conductivity in the IT range (500 ~ 700 oC) has been widely
investigated by many researchers [5, 7].
Among the studied electrolyte materials, doped-ceria and stabilized bismuth oxide
have been reported to have 1~2 orders of magnitude of higher ionic conductivity than
conventional yttria stabilized zirconia electrolytes [74]. However, doped ceria shows
lower open circuit potential (0.7~0.8 V) than the theoretical Nernst voltage due to its
mixed ionic electronic conductivity (MIEC) causing electronic leakage and low power
density [31]. Moreover, although stabilized bismuth oxide has very high oxygen ionic
conductivity, its inherent thermodynamic instability under reducing conditions makes it a
poor choice by itself as an electrolyte for SOFCs [37].
To overcome these problems, Wachsman et al. suggested a bismuth oxide/ceria
bilayer electrolyte consisting of a layer of stabilized bismuth oxide on the oxidizing side
and a layer of doped ceria on the reducing side [18]. In this arrangement, the ceria layer
can improve the thermodynamic stability of the bismuth oxide layer by shielding it from
very low Po2 and the bismuth oxide layer can serve to block electronic flux from doped
ceria in reducing atmospheres, theoretically yielding high OCPs approaching the Nernst
potential at the IT range. For over a decade, several researches have demonstrated

109
that the OCP can be effectively improved using the bismuth oxide/ceria bilayered
electrolyte concept [18, 39-41]. However, high power density at low temperature was
not readily achieved due to high ohmic losses from thick electrolyte-supported cell
designs and the high reactivity of bismuth oxide with conventional perovskite cathodes,
such as La0.6Sr0.4Co0.2Fe0.8O3-δ (LSCF) due to weak metal-oxide bonds [75]. Therefore,
recent research has focused on development of thin erbia stabilized bismuth oxide
(ESB) / gadolinia doped ceria (GDC) bilayered electrolytes and ESB-compatible
cathodes. Previously, Park and Wachsman reported that an ultra thin (~0.2 μm) and
dense ESB layer can be deposited on Sm-doped ceria(SDC) pellets by pulsed laser
deposition (PLD) [39, 40]. In addition, to overcome the reactivity of ESB with
conventional perovskite cathodes, a bismuth ruthenate (Bi2Ru2O7, BRO7)- ESB
composite cathode was developed [76]. A recent optimization study by Camaratta et al.
reported that BRO7-ESB composite cathodes exhibited very low ASR (0.73 and 0.03 Ω
cm2 at 500 and 700 oC, respectively) [77].
Based on these studies, we demonstrated an impressively high performance of
~1.94 W/cm2 at 650 oC using a thin ESB/GDC electrolyte on an anode-supported cell
with highly optimized BRO7-ESB cathodes [19, 20]. To accommodate dense and thin
electrolytes on porous anode-supports, we integrated a recently developed a GDC
anode functional layer (AFL) between the anode and GDC electrolyte by spreading of a
precursor solution [14]. In this study thin (~4 μm) and relatively dense ESB was
successfully deposited by PLD technique on 10 μm thick GDC film. The obtained total
ASR was only 0.079 Ω-cm2, showing a ~40% decrease compared to a cell with a single
GDC electrolyte.

110
Up to now, these various studies have soundly proven that the bilayered
electrolyte concept is highly encouraging in practical SOFC applications for low
temperature operation. One of the key factors to fabricate ESB/GDC bilayered
electrolytes is to obtain a dense and thin ESB layer on the sintered GDC electrolyte.
Although PLD can be good for demonstration purposes in lab-scale experiments, a
more cost-effective and practical fabrication process is necessary for future application
of the ESB/GDC bilayered electrolyte.
In this study, we fabricated a thin and dense ESB/GDC bilayered electrolyte on
anode-supported SOFCs by a simple and cost-effective colloidal deposition process. To
obtain a dense ESB layer, nano-sized ESB particles used for the colloidal coating slurry
were synthesized by a wet chemical co-precipitation method. In order to optimize the
sintering conditions of the ESB layer on dense GDC, the evolution of the ESB
microstructure with sintering temperature was investigated. To gauge the performance
of the developed ESB/GDC electrolyte, current-voltage characteristics and
electrochemical impedance tests were carried out.
6.2 Experimental Procedure
6.2.1 ESB Powder Fabrication
To synthesis very fine ESB powder, a coprecipitation route was employed. Pure Bi
nitrate and Er nitrate were used as starting raw materials. They were weighed in
stoichiometric proportions and dissolved in 70% nitric acid to produce a solution. An
excess ammonia solution (Acros Organics, 28– 30% of NH3 solution in water) was
added to the stirred solution to increase the pH value to 12. The addition of the
ammonia solution resulted in the formation of a yellowish-brown color precipitate. The
precipitate was filtered, and then subsequently dried at 80 °C for 12 hrs. The

111
agglomerated powder was then ground into fine particles using a mortar and pestle. The
powder was then calcined at 900 °C for 10 hrs in air.
For comparison purpose, the ESB powder was synthesis by the conventional
solid-state route. A stoichiometric mixture of Bi2O3 (99.9995% pure) and Er2O3 (99.99%
pure), from Alfa Aesar, were mixed and ball-milled with zirconia ball media in a high-
density polyethylene bottle for 24 hrs. After drying, the mixed powders of ESB were
calcined at 800 °C for 16 hrs. Agglomerated powders were ground using mortar and
pestle and sieved using a 325 µm mesh.
6.2.2 Fuel Cell Fabrication
The SOFC fabrication involved GDC spin coating on tape-cast anodes followed by
ESB colloidal drop coating. The anode support was prepared by tapecasting 65 wt% of
NiO (Alfa Aesar) and 35 wt% of GDC (Rhodia) with an appropriate amount of solvents
and organic compounds. The anode tapes were presintered at 900 °C for 2 hrs. The
GDC AFL was deposited by spraying GDC precursor solution on presintered anode
surface. Subsequent heat treatment at 900 oC was carried out for the removal of the
binder system. Detailed preparation and fabrication of GDC AFL on tape-cast anode
were described the previous study [14].
Thin and uniform GDC electrolytes were deposited by spin coating with a GDC
colloidal slurry. The Rhodia GDC powder was ball milled for 24 hrs with solsperse
(dispersant) in ethanol. PVB (binder) and DBP (plasticizer) were added after the first
ball-milling step and the solution was ball-milled for an additional 24 hrs. For spin
coating, the anode substrates were fixed on the vacuum chuck of the spin coater. The
thickness of the GDC electrolyte was controlled by the number of depositions with same
spin speed. After deposition, samples were dried at room temperature for 10 hrs. After

112
drying, the multilayer anode/electrolyte structure was sintered at 1450 oC for 4 hrs using
a ramp rate of 3 oC /m in air.
For the ESB/GDC bilayered electrolyte, the ESB layer was colloidally deposited by
drop coating with co-precipitated ESB (cp-ESB) powder. To make a ESB colloidal
slurry, co-precipitated ESB powder was mixed with a binder system which consisted of
Solsperse, DBP and PVB as the dispersant, plasticizer, and binder, respectively. This
mixture was ball-milled in ethanol for 24 hrs, and drop-coated onto the sintered GDC
electrolyte surface. The drop-coating was repeated until a desired thickness was
achieved. To see the effect of sintering temperature on formation of ESB layer on dense
GDC electrolyte, as-deposited ESB/GDC bilayered cell was divided into several pieces
by a diamond saw and each sample was sintered at 700, 800, and 900 oC for 4 hrs
using a 400 °C 1 h binder burnout step, and a 5 °C/min ramp rate. For comparison, the
same experiments were repeated using solid state ESB powder.
Two different composite cathodes were used for this study-- LSCF-GDC (50:50
wt%) on GDC electrolyte and A BRO7-ESB (50:50 wt%) on ESB/GDC bilayered
electrolyte. The cathode development and cathoding procedure can be found earlier
work [19, 77].
6.2.3 Characterization
The phase and size of the crystallites of as-calcined ESB powders were
investigated by means of X-ray diffraction analysis (XRD, Philips APD 3720).
Microstructures of ESB powders and fuel cell structures with ESB/GDC bilayered
electrolytes were observed using scanning electron microscopy (SEM, JEOL 6400 /
6335F). Qualitative elemental analysis of the fuel cell structure was conducted by
energy-dispersive X-ray spectroscopy (EDX).

113
For electrochemical performance measurement, fuel cell samples were loaded in a
fuel cell testing set-up. Current-voltage (I-V) characteristics were conducted by a
Solartron 1287 potentiostat. The gas condition used was 30 sccm of dry air and 90
sccm of wet hydrogen to the cathode and anode side, respectively. To avoid gas
leakage, the edge of cell and testing alumina tube were covered with ceramic sealant
using the mixture of two part ceramabond-517 (liquid and power, Aremco). After the I-V
measurement, two-point probe impedance analysis was carried out under open circuit
condition using a Par-stat 2273 (Princeton Applied Research) over a frequency range of
100 KHz to 100 mHz.
6.3 Result and Discussion
6.3.1 Powder Characterization
Fig. 6-1 shows the XRD result of ESB powders synthesized by co-precipitation
(cp) and solid-state (ss) route. For cp-ESB, the precursor powder was calcined at 500
oC for 4 hrs, while ss-ESB powder was synthesized by calcined at 800 oC for 16 hrs. As
shown in Fig. 6-1-a, both cp-ESB and ss-ESB show a cubic-fluorite structure of doped-
bismuth oxide without any other phases. This result indicates that the wet chemical co-
precipitation method for synthesis of ESB powder is a greatly effective way to reduce
the calcination temperature and processing time compared to the conventional solid-
state route. Due to less thermal energy input during cubic-fluorite phase formation, we
can expect lowered grain growth and significantly reduced crystallite size of cp-ESB
powder. Generally the crystallite size of the material can be calculated by Scherrer
equation [78];
( )θ
λθcos
2L
KB = (6-1)

114
where K is the shape factor, λ is the x-ray wavelength, typically 1.54 Å, B is the
line broadening at half the maximum intensity (FWHM) in radians, θ is the Bragg angle,
and L is the crystallite length. Fig. 6-1-b shows the magnified x-ray diffraction pattern of
the (111) peak from Fig. 6-1-a at the theta range from 27 to 29 degree. Using this
graph, we calculated the crystallite size of the both ESB powers by eq. (1) and they are
summarized in Table 6-1. The crystallite size of cp-ESB was 1/3 the size of ss-ESB,
indicating a high possibility of smaller particle sizes of cp-ESB powder.
The microstructural analysis by SEM was carried out to investigate the size and
morphology of the ESB powder. Fig. 6-2 shows SEM images of the ESB prepared from
different synthesis methods, that is, conventional solid state and wet-chemical route
using co-precipitation. As shown in Fig. 6-2-a, the particle size of cp ESB powder is
much less than 5 μm and each particle consists of soft agglomeration of nano-sized rod-
shaped particulates with high aspect ratio. In contrast, the ss-ESB powder in Fig. 6-2-b
shows particle size over ~5 μm and each particle appears to be hard-agglomerated.
This result indicates that the co-precipitation process successfully reduced the resultant
ESB particle size and significantly enlarged surface area, allowing for much higher
sinterability.
6.3.2 Effect of Sintering Temperature on ESB/GDC Bilayered Electrolyte
In order to investigate the effect of particle size and sintering temperature on the
formation of an ESB layer on a GDC electrolyte, ESB/GDC bilayered electrolytes were
fabricated using cp-ESB and ss-ESB powder at various sintering temperatures (700,
800, and 900 oC).
The SEM images in Fig. 6-3 show cross-sectional views of the bilayered structures
on anode supports fired at various temperatures. Using backscatter imagery, the

115
different phases-ESB (white), GDC (light gray), and NiO (dark gray)-are easily
distinguished due to differences in elemental contrast. It should be noted that the SEM
images for each ESB layer (Fig. 6-3-a, c, e, g for ss-ESB and b, d, f, h for cp-ESB) were
taken at different magnifications. From these microstructures, it is clear that both cp-
and ss-ESB layers increase in density with increasing sintering temperature. However,
the ESB layer which was prepared from ss-ESB powder and fired at 900 oC is not fully
dense. Instead, this ss-ESB electrolyte looks less dense when fired at 900 oC (Fig. 6-3-
g) than when fired at 800 oC (Fig. 6-3-e) due to the formation of large pores. It is known
that the bismuth oxide melting temperature is ~ 825 oC [79]. As Jiang and Wachsman
reported, however, doped bismuth oxides have much higher melting temperature of
over 2000 oC and differential thermal analysis (DTA) also found no melting endotherm
for the stabilized bismuth oxide up to 1100 oC [80]. Therefore, we believe that this
phenomenon is possibly caused by the sublimation of bismuth oxide phase over 825oC.
Moreover, the sintering of ESB layer is processed on a highly densified GDC substrate
which was sintered at a much higher temperature (~1450 oC). In this case, the sintering
mechanism of ESB powder is primarily dependent on vertical shrinkage without lateral
shrinkage. Therefore, ss-ESB powder might not establish a dense layer below 800 oC
due to its insufficient surface area leading low sinterability. Additionally, ss-ESB powder
will be porous when fired above 900 oC due to the sublimation of bismuth oxide phase.
This result indicates that micron-sized ESB powder prepared by conventional solid state
synthesis is not appropriate for colloidal deposition of the ESB layer in ESB/GDC
bilayered electrolytes.

116
On the other hand, as shown in Fig. 6-3-b, d, f, h, when cp-ESB powder was used,
the ESB layer was highly dense when fired at 800 oC. SEM powder analysis (Fig. 6-3-
a), of the cp-ESB powder shows that it has a very high surface area due to the nano-
sized nature of the particles. Therefore, it is possible for cp-ESB powder to produce
sufficient surface energy at lower sintering temperatures for the particles to neck and
densify by surface and lattice diffusion. Unlike the layer prepared from ss-ESB powder,
the cp-ESB layer sintered at 900 oC (Fig. 6-3-h) looks very dense. However the ESB
thickness was reduced compared to the same layer sintered at 800 oC (Fig. 6-3-f).
Since 900 oC is above the pure bismuth oxide melting temperature, as discussed
above, this indicates that partial sublimation of bismuth oxide phase or penetration of
bismuth oxide into GDC layer have possibly occurred.
It should be noted that as seen in Fig 6-3-g, h, both ss- and cp- ESB layers
sintered at 900 oC show diffusion of ESB phase into ceria layer and segregation of it
into GDC grain boundaries. This is also clearly shown in Fig. 6-4 which is a magnified
image of Fig. 6-3-g. It is considered that the over melting temperature of pure bismuth
oxide (~825 oC) the partial pressure or fugacity of bismuth oxide might be high, which
can cause higher activity of bismuth oxide or bismuth in ESB lattice. Therefore, this high
activity can accelerate motion of bismuth oxide phase, leading diffusion of bismuth
oxide phase along the GDC grain boundaries which generally has a high surface
energy. It has also been reported that bismuth oxide can be soluble in CeO2 forming a
solid solution of Bi1-xCexO2-xO2-x/2 with a cubic fluorite structure [81]. Gil et al recently
reported that the solid solubility limit of bismuth oxide in doped ceria is ~ 0.8wt% [82].
Park and Wachsman predicted the possible existence of solid solutioning at the

117
interface between the stabilized bismuth oxide and doped ceria bilayered electrolytes
[40]. In this study, the conductivity of 2 mm thick Sm doped ceria (SDC) was lower than
that of ESB (~ 0.2 μm)/SDC (~ 2 mm) bilayered electrolyte due to the high grain
boundary conductivity of ESB/SDC. This phenomenon was explained as the formation
of a solid solution of ESB into the grain boundary of SDC, which can lower the activation
energy for oxygen ion transfer in SDC grain boundaries by a scavenging effect on
impurity phases. Therefore, we can expect a positive effect on lowering ohmic
polarization in the observed integrated ESB/GDC structure.
On the other hand, it is also shown that the fracture mode of GDC electrolyte with
ESB sintered at 900 oC changed from inter- granular to intra-granular (Fig. 6-4),
compared to GDC cross-sections near ESB layers sintered at lower temperature (Fig. 6-
3-a ~ f). This might cause deterioration in the mechanical strength of the GDC
electrolyte due to highly segregated bismuth oxide phase along the GDC grain
boundary. Therefore, this phenomenon should be carefully controlled and further
investigation will be needed.
Consequently, we could obtain dense ESB/GDC bilayered electrolytes by a simple
colloidal deposition using fine ESB powders made by a co-precipitation method. The
optimal sintering temperature for synthesizing dense ESB layers by colloidal deposition
was ~800 oC, which limited bismuth oxide sublimation and penetration into the GDC
electrolyte.
6.3.3 Microstructure of a Full Button Cell with ESB/GDC Bilayered Electrolyte
For comparison of electrochemical performance, two kinds of button cells were
prepared - a single GDC electrolyte cell and an ESB/GDC bilayered electrolyte cell
based on above study. To obtain similar electrolyte thickness, the colloidal deposition

118
process for each layer was repeated. For microstructural analysis before
electrochemical performance, another button cell with ESB/GDC bilayered electrolyte
was fabricated with the similar process. An ESB layer was deposited using colloidal
slurry containing cp-ESB powder and sintered at 800 oC for 4 hours. Fig. 6-5 shows the
cross-sectional SEM image of NiO-GDC anode/ ESB-GDC bilayered electrolyte/ BRO7-
ESB composite cathode. As shown in this figure, a dense ESB/GDC layer was obtained
and every layer is clearly distinguishable with good interfacial contact. To examine the
possible interdiffusion between layers, an energy dispersed x-ray (EDX) line scan
analysis was conducted along the base line (yellow) in Fig. 6-5. Three elements were
traced along the line, which includes Bi (red line), Ce (blue line), and Ni (white line). The
resultant data are overlapped in Fig. 6-5 and no solid state reaction or interdiffusion
between layers was observed.
Fig. 6-6 shows the microstructures of cross section and surface of anode
supported cells with a single GDC electrolyte and an ESB/GDC electrolyte after
electrochemical performance test. Both cross-section and surface view of the GDC
layer (Fig. 6-6-a,c) shows very high density without pores. In contrast, the ESB surface
(Fig. 6-6-d) shows some porosity and lower density compared to the GDC surface,
while the cross-section of ESB (Fig. 6-6-b) looks dense. For further densification, it
needs to be opmisized. As shown in Fig. 6-6, each electrolyte thickness was measured
from the SEM image. The GDC electrolyte thickness was identical, ~9 μm for each
cells. The ESB electrolyte thickness was ~4 μm.
6.3.4 Performance of a Button Cell with ESB/GDC Bilayered Electrolyte
Fig. 6-7-a shows the I-V characteristics of cells with GDC single layer and
ESB/GDC bilayered electrolyte at 650 oC. The measurement was conducted under 90

119
sccm of 3% wet hydrogen to anode side and 30 sccm of dry air to cathode side. The
maximum power density (MPD) of the ESB/GDC electrolyte reached ~1.47 W/cm2 with
a 69% increase in MPD compared to a GDC single layer (~ 0.87 W/cm2). The OCPs of
the single GDC electrolyte cell and ESB/GDC bilayered electrolyte cell were 0.75 and
0.80 V, respectively. This OCP improvement with bilayered electrolyte can be evidence
that the ESB layer in ESB/GDC bilayered electrolyte may effectively block the electronic
conduction from the GDC due to reduction of Ce4+ to Ce3+ at low Po2 region. Moreover,
we previously reported similar OCP enhancement with a thin ESB/GDC bilyaered
electrolyte. At that time we fabricated a dense ESB layer of ~ 4 μm by PLD technique
on ~ 10 μm thick GDC electrolyte by spray coating method, resulting OCP increase
from 0.72 to 0.77 V [20]. It is noted that in this study we obtained higher OCP for both
single and bilayered electrolyte cells compared to previous research results. We believe
that this is caused by higher GDC density due to spin coating method instead spraying
coating for GDC electrolyte in the previous study. Therefore, this result demonstrates
that thin and dense ESB/GDC bilayered electrolytes can be achieved by conventional
colloidal process by control of initial powder morphology and sintering condition.
Although the ~ 0.05 V increase in OCP was achieved in a dense bilayered electrolyte,
the major contribution of this outstanding enhancement in MPD came from ASR drop.
The estimated total ASRs from IV curves near OCP region were 0.084 Ωcm2 and 0.164
Ωcm2 for cells with ESB/GDC bilayer and GDC single layer, respectively.
For the further analysis electrochemical impedance test was conducted and the
result is shown in Fig. 6-7-b. In these Nyquist plots the total and ohmic ASR were
extracted from the low and high frequency intercepts of the impedance spectra with the

120
real axis, respectively, and the electrode ASR was calculated from the difference
between these two ASR values. The detailed values are tabulated in Table 6-2. The
total ASR of ESB/GDC bilayered cell (0.088 Ω·cm2) was decreased by 47.6% compared
to that of cell with GDC single layer (0.168 Ω·cm2). In addition, in this study the total
ASRs from this AC impedance tests are identical to the ASRs from the I-V curves (DC
impedances) within 5% deviation showing the good validity of the results. The electrode
ASR of the bilayered electrolyte cell was decreased by 62.6% compared to that of GDC
single cell. This ASR drop (0.062 Ω·cm2) is expected to mostly come from the cathodic
polarization reduction at the interface between high catalytic BRO7-ESB cathode and
ESB electrolyte, considering the both cells utilized the same anode material using
identical procedures. This result has been also well-supported by the former studies [19,
77]. The ohmic ASR was also decreased (26.1%, 0.018 Ω·cm2) at 650 oC. Previously, it
was shown that the ohmic ASR (ASRelectrolyte) of a bilyared electrolyte can be estimated
by a simple modeling for two series resistors written as
+=
GDCESBGDCeelectrolyt LASR
σστ 1 (6-2)
where LGDC is thickness of GDC electrolyte, τ is thickness ration of ESB to GDC,
and σESB and σGDC are the conductivities of ESB and GDC, respectively [19, 42]. Based
on known ESB and GDC conductivities [83], a similar or slightly higher ohmic ASR of
the ESB (~4 μm)/GDC (~9 μm) bilayered electrolyte than that of ~a single 9μm thick
GDC can be expected by eq. (2) due to much higher conductivity of ESB than GDC at
IT ranges. However, previous studies repeatedly showed that bilayer electrolyte can
effectively reduce the electrolyte ASR even when we used same GDC thickness with a
single GDC layer and an additional ESB layer was deposited [19, 20, 39]. Therefore, we

121
believe that this phenomenon is related to penetration and segregation of bismuth oxide
phase at the GDC grain boundary, even though it was not defective in EDX analysis.
Further discussion about ASR reduction of ESB/GDC bilayered electrolyte was
exposited elsewhere [19, 20].
However, this MPD result was somewhat lower compared to the previous highest
MPD with thin ESB by PLD and GDC bilayered electrolyte cell (~1.95 W/cm2) [20]. As
ohmic ASR results suggested, the density of cp-ESB layer might be still less dense
compared to PLD-ESB. Moreover, in this study, we used both solid state BRO7 and
ESB powder for the cathode, while in the previous study microstructurally optimized
BRO7-ESB cathode was used. Optimization of BRO7-ESB was described in detail by
Camaratta el. al [77]. Therefore, we can expect even higher MPD result by further
improvement of ESB density and cathode performance.
6.4 Conclusions
We fabricated thin and dense ESB/GDC bilayered electrolytes by a simple
colloidal deposition process. For producing highly sinterableESB particles, a wet
chemical co-precipitation route was introduced. Using this nano-scale ESB powder with
high surface area, a dense and very thin (~ 4 μm) ESB layer was established on a GDC
electrolyte by simple colloidal drop coating. The optimal sintering temperature of the
ESB layer was found to be ~800 oC due to its poor densification at lower temperatures
and evaporation at higher temperatures. Finally, an anode-supported SOFC with the
thin and dense ESB/GDC bilayered electrolyte coupled to a BRO7-ESB cathode
produced a very high maximum power density of ~ 1.5 W/cm2 at 650 oC. This was
possible due to the effect of the bilayered electrolyte on significantly decreasing eletrode
ASR as well as ohmic ASR. This study demonstrated that the high performance of

122
ESB/GDC bilayered electrolyte can be reproducible by the cost-effective and practical
colloidal deposition. Based on this study, fabrication of large-scale planar cells with
bilayered electrolytes for stack cell application is underway.

123
20 30 40 50 60 70 80
(420
)(3
31)
(400
)(222
)(3
11)
(220
)
(200
)
(111
)
800oC-16h
Coprecipitation Solid state route
500oC-4h
Inte
nsity
(arb
itrar
y un
it)
2θ angle
(111
)
(200
)
(220
)
(311
)(2
22)
(400
)
(331
)(4
20)
800oC-16h
500oC-4h
CoprecipitationSolid-state
.
(a)
27 28 29
Solid state (800oC for 16h)
(111
)
Inte
nsity
(arb
. uni
t)
2θ (angle)
Coprecipitation (500oC for 4h)
2θ angle
Inte
nsity
(arb
itrar
y un
it)
(111
)
Coprecipitation(500oC 4h)
Solid State(800oC 16h)
(b)
Figure 6-1. XRD diffraction pattern of ESB powders synthesized by coprecipitation route (red line) and solid state route (black line) (a). The magnified XRD diffraction pattern of the (111) peak is shown at the 2Θ range from 27 to 29o (b).

124
5μm
(a)
5μm
(b)
Figure 6-2. SEM of ESB powders synthesized by wet-chemical co-precipitation method
(a) and solid-state route (b).

125
Figure 6-3. Evolution of ESB layers on GDC electrolyte at various sintering
temperatures using ss-ESB (a,c,e,g) and cp-ESB (b,d,f,h). It is noted that the magnification of images for ESB electrolyte using cp-ESB powder is higher that that of ss-ESB powder.

126
5μmESB
GDC
Ni
Figure 6-4. Cross-sectional view of GDC electrolyte under ss-ESB layer after sintering at 900 oC, which is the magnified image from Fig. 5-3g. In backscattering mode, ESB (white), GDC (light gray), and NiO (dark gray) phases are well-distinguishable, showing ESB penetration into GDC grain boundaries.
GDC ESB
BilayeredElectrolyte
BRO7-ESBCathode
NiO-GDCAnode
Bi
CeNi
20μm
Figure 6-5. Cross-sectional SEM image of a full button cell with ESB/GDC bilayered electrolyte. EDX line scan was conducted along the straight base line (yellow) and the intensity of each elements are presented as red (Bi), blue (Ce), and white (Ni) lines

127
20μm
LSCF-GDC
GDC
NiO-GDC
9 μm
(a)
9 μm
4 μm
20μm
GDC
NiO-GDC
BRO7-ESB
ESB
(b) Figure 6-6. SEM image of cross-sectional view of a single GDC electrolyte cell (a) and
ESB/GDC bilayered cell (b). Surface views of GDC electrolyte (c) and ESB electrolyte (d) are shown.

128
20μm
(c)
20μm20μm
(b)
Figure 6-6. Continued

129
0 1 2 3 4 50.0
0.1
0.2
0.3
0.4
0.5
0.6
0.7
0.8
0.9
Current Density (Α/cm2)
Pote
ntia
l (V)
0.0
0.5
1.0
1.5
Power Density (W/cm
2)ESB/GDC
GDC
(a)
0.00 0.02 0.04 0.06 0.08 0.10 0.12 0.14 0.16 0.180.00
0.02
0.04
0.06
-Z" (
Ω−c
m2 )
Z' (Ω−cm2)
ESB/GDCGDC
. (b)
Figure 6-7. IV-Characteristics (a) and impedance spectra (b) of ESB/GDC bilayer (red
square) and GDC single layer (blue triangle) cell

130
Table 6-1. Calcination condition and crystallite size of ESB powders synthesis by co-precipitation and solid state route.
Synthesis Calcine condition FWHM (o2θ) Crystallite size (Å)
Co-precipitation 500oC for 4 h 0.48 171 Solid State 800oC for 16h 0.16 512
Table 6-2. Comparison of specification and electrochemical performance of the studied cells.
Cell Type GDC
thickness ESB
thickness OCP MPD Total ASRIV
Total ASREIS
Ohmic ASR
Electrode ASR Ref
μm μm V W/cm2 Ω·cm2 Ω·cm2 Ω·cm2 Ω·cm2
GDC 9 - 0.75 0.87 0.164 0.168 0.069 0.099 this study
cp-ESB/GDC 9 4 0.80 1.47 0.084 0.088 0.051 0.037 this study
PLD-ESB/GDC 10 4 0.77 1.94 0.075 0.079 0.046 0.033 [20]

131
CHAPTER 7 HIGH PERFORMANCE LSM-BASED CATHODE BOOSTED BY STABILIZED BISMUTH OXIDE FOR LOW TO INTERMEDIATE TEMPERATURE SOFCS
7.1 Introduction
La1-xSrxMnO3-δ (LSM) –based cathodes are some of the most widely used
cathodes for high temperature (over 800 oC) solid oxide fuel cells (SOFCs) due to their
high thermal and chemical stability, electrical conductivity, as well as their catalytic
activity for oxygen reduction. In addition, LSM-based cathodes exhibit good
compatibility with conventional electrolyte materials, such as stabilized zirconia and
doped ceria [2, 84-86]. However, despite these advantages, LSM-based cathodes are
not a popular choice for reduced temperature SOFCs. This is due to the fact that LSM
has negligible ionic conductivity and a high activation energy for oxygen reduction due
to slow oxygen incorporation reaction into the solid lattice, leading to significantly
deteriorated electrochemical catalytic effect at low temperatures [7, 63, 87, 88]. To
overcome this problem, dual-phase composite cathode systems have been explored.
Conventional ionic conducting phases such as yttria-stabilized zirconia (YSZ) and
godolia-doped ceria (GDC) have been mixed with LSM leading to significantly enhanced
electrochemical performance [84, 89-94]. For instance, Murray and Barnett reported
that the area specific resistance (ASR) of pure LSM was lowered from 51.03 Ω-cm2 to
11.37 Ω-cm2 for LSM-YSZ and 6.81 Ω-cm2 for LSM-GDC [90]. The improved
performance is a result of the increased number of three phase boundary (TPB)
reaction sites between gas, electronic and ionic conducting phases, and by the addition
of a pathway for ionic species to be transported thru the cathode. Thus it is expected
that dual phase cathodes which incorporate materials with an ionic conductivity will yield
further improvements in performance.

132
Stabilized bismuth oxide has been reported to have one of the highest known ionic
conductivities-one or two orders of magnitude higher than the conventional material
YSZ at intermediate temperatures (IT) [17, 95]. In addition to its high ionic conductivity,
bismuth-oxide enhances surface oxygen exchange rate as well as charge transfer and
oxygen dissociation, which is believed to be the rate-limiting step in the oxygen
reduction reaction at the cathode [96-100]. Therefore, stabilized bismuth oxide is a good
candidate for the ionic conducting phase in composite cathodes. For example, the
addition of yttria or erbia stabilized bismuth oxide (YSB or ESB) into a metallic cathode
silver (Ag) improved the performance of the cathode both by increasing TPBs and
forming an ionic conduction path to the electrolyte [101-103]. However, the long term
stability of Ag-based cathodes is poor [103]. Recently, we developed a bismuth-
ruthenate Bi2Ru2O7 (BRO7)-ESB composite cathode [76, 77]. Using this cathode on an
ESB/GDC bilayered electrolyte, we demonstrated exceptionally high power density (~
1.94 W/cm2 at 650 oC) [19, 20]. It was suggested in the above study that cathode
performance can be promoted not only by the addition of ESB into the cathode but also
by using an ESB electrolyte at the cathode interface due to effect of ESB on
improvement of oxygen dissociation followed by reduction of cathode polarization
losses.
Recently, in order to overcome limitations of LSM-based cathodes, the utilization
of stabilized bismuth oxides as the ionic conducting phase has received much attention
[104-113]. Jiang et al. reported the performance of LSM-YSB composite cathodes,
showing an interfacial resistance of ~1.0 Ω-cm2 at 600 oC, which is 11 times lower than
reported for LSM-YSZ cathodes [106]. Moreover, various fabrication techniques were

133
used in order to obtain increased TPB lengths by microstructural evolution [106, 107,
112]. Although these efforts progressively reduced the cathode ASR, the reported
power densities of SOFCs utilizing LSM-bismuth oxide cathodes are still relatively low at
IT (~600 mW/cm2 at 650oC) [107]. To date, most of the studies of LSM-bismuth oxide
composite cathodes have been conducted on zirconia-based electrolytes which exhibit
significant ohmic resistance at intermediate temperatures due to its high activation
energy for ionic conduction. Even though ultra thin YSZ electrolytes successfully reduce
total ohmic polarization losses at reduced temperature [8], significant deterioration of
ionic conduction and oxygen dissociation rate at the cathode/electrolyte interface is
inevitable due to the abrupt change in ionic conduction phase from bismuth oxide in the
cathode bulk to the zirconia electrolyte. Therefore, modification of the interface between
the LSM-bismuth oxide cathode and the electrolyte is needed in order to achieve high
performance at lower temperatures.
In this study, to overcome this, we introduced an (Er2O3)0.20(Bi2O3)0.80 (ESB)
electrolyte layer coupled to the (La0.80Sr0.20)MnO3-δ (LSM)-ESB composite cathode. To
gauge the effect of the ESB electrolyte on the cathode performance, the interfacial
resistance of the cathode on ESB and on GDC was measured on symmetric cells. The
actual performance improvement of the LSM-ESB cathode on an ESB electrolyte layer
was evaluated on anode-supported cells by I-V characterization.
7.2 Experimental
7.2.1 Sample Fabrication
The LSM-ESB composite electrode was prepared by simple powder mixing.
Commercial LSM powder with a surface area of 5.6 m2/g was purchased from Fuel Cell
Materials. The ESB powder for the cathode was synthesis by the conventional solid-

134
state method. A stoichiometric mixture of Bi2O3 (99.9995% pure), and Er2O3 (99.99%
pure), from Alfa Aesar, were mixed and ball-milled with zirconia ball media in a high-
density polyethylene bottle for 24 hrs. After drying, the mixed powders of ESB were
calcined at 800 °C for 16 hrs. Agglomerated powders were ground using a mortar and
pestle and sieved using a 325 µm mesh to get uniform particle sizes. For the LSM-ESB
electrode ink, LSM powder and ESB powder of the same weight ratio (50:50wt%) were
mixed with a binder system, which consists of alpha terpineol (Alfa Aesar), Di-n-butyl
phthalate (DBP) and ethanol as binder, plasticizer and solvent, respectively. To make
symmetric cells, we prepared both ESB and GDC electrolyte pellets by uniaxial pressing
and sintering at 890 °C for 16 hrs and 1500 °C for 10 hrs, respectively. Once an
appropriate viscosity was reached, the electrode slurry was applied to both sides of the
electrolyte substrates by brush painting. After drying the symmetric cells at 120 oC for 1
hrs, a second coat of electrode slurry was applied to the electrolyte substrates. The
doubly-coated cells were then sintered at 800 oC for 2 hrs in air. After sintering the
electrode, silver mesh current collectors and platinum lead wires were pressed against
the samples in a quartz reactor using a ceramic screw-and-bolt assembly.
For full button cell fabrication, the anode-supported cell structures with thin
electrolytes were employed. NiO-YSZ (65:35wt%) anode-supports and anode functional
layers (AFLs) consisting of NiO-GDC (65:35wt%) were tape-casted and attached to
each other by uniaxial press on heating substrate and presintered at 900 oC. Thin and
uniform GDC electrolytes were prepared by spin coating. In order to investigate the
effect of the ESB electrolyte on LSM-ESB cathode, ESB/GDC bilayered electrolyte was
prepared. To fabricate a thin and dense ESB layer on a GDC electrolyte, nano-sized

135
ESB powder was synthesized by wet chemical coprecipitation method. Using a colloidal
solution containing nano-sized ESB particles, the ESB layer was deposited by spin
coating. A detailed fabrication and discussion of ESB/GDC bilayered electrolytes was
described in the previous work [19]. The multilayer of ESB/GDC/AFL/NiO-GDC anode
structures is co-sintered at 1450 oC at 4 hrs. After sintering, the LSM-ESB cathode was
applied in two coats on both ESB and GDC electrolyte surfaces by brush painting and
sintered at 800 oC for 2hrs.
7.2.2 Characterization
The phase identification of LSM, ESB, and LSM-ESB composite cathodes were
investigated by means of X-ray diffraction analysis (XRD, Philips APD 3720).
Microstructures of fuel cells with LSM-ESB cathodes were obtaining by scanning
electron microscopy (SEM, JEOL 6400 / 6335F).
The interfacial polarization resistance of the LSM-ESB electrodes on symmetric
cells was conducted through two-point probe electrochemical impedance spectroscopy
(EIS) using a Solartron 1260. The measurement condition of impedance was an AC
voltage amplitude of 50 mV over the frequency range of 0.1 MHz to 0.1 Hz in air. The
frequency response analyzer was used in standalone mode and interfaced to a
computer using Zplot software. Measurements were made from 500 to 700 oC with an
interval of 50 oC.
For electrochemical performance of the button cells, samples were loaded in the
testing setup and sealed with cerambond sealant system. Current-voltage (I-V)
characteristics were conducted by a Solartron 1407E under 90 sccm of dry air and 3%
wet hydrogen to the cathode and anode side, respectively.

136
7.3 Result and Discussion
7.3.1 Impedance Spectroscopy for Symmetric Cells
In order to confirm the compatibility of ESB with LSM, a LSM and ESB powder
mixture (50 to 50wt%) was annealed at 900oC for 50 hrs. Fig. 7-1 shows the resultant X-
ray diffraction (XRD) patterns of LSM, ESB powder and mixtures of both powders
before and after heat-treatment. After annealing, the XRD pattern of LSM and ESB
mixture contains only the peaks of cubic fluorite structure from ESB and perovskite
structure from LSM without any other peaks. This result indicates no inter-phase
formation, suggesting that LSM and ESB are chemically stable even at 900 oC. This
result of compatibility between LSM and ESB is in good agreement with previously
reported results [106, 108, 113]. In contrast, it has been known that the pervoskite La1-
xSrxCo1-yFeyO3-δ (LSCF)-based cathode, which is widely used as the conventional
cathode for IT SOFCs, is highly reactive with ESB electrolyte due to weak metal-oxygen
bond of bismuth oxide [19, 77].
Fig. 7-2 shows a cross-sectional view of the symmetric cells with LSM-ESB
cathodes on ESB and GDC electrolyte pellets. In both cases, the composite cathodes
show good adhesion to electrolyte substrates at the cathode/electrolyte interface. In
order to distinguish each phase, backscattered SEM images were also observed, which
are shown as insets in Fig. 7-2. It is clearly shown that relatively large ESB particles are
well-distributed in a very fine LSM particle matrix. However, the majority in LSM-ESB
cathode seems to be LSM particles, even though we mixed 50: 50wt% of LSM to ESB
powders. It is noted that in this study the ESB powder in the composite cathode is large
(1~5 μm) and agglomerated due to solid state synthesis, while commercial LSM powder
is much smaller (< 1 μm) than ESB powder. As many studies reported, microstructural

137
optimization, such as particle size and spatial distribution can modify the connectivity
and increase the surface area of the composite cathodes to produce more active TPB
sites. Therefore, at this point, the performance of LSM-ESB composite cathode might
not be optimal.
Fig. 7-3 is the resultant impedance spectra measured under open circuit condition
from 500 to 700 oC with 50 oC interval for LSM-ESB/ESB/LSM-ESB and LSM-
ESB/GDC/LSM-ESB symmetric cells. For direct comparison of electrode ASR on the
different electrolytes, all of the impedance spectra have been ohmic resistance-
corrected. That is, the high frequency intercept at the real axis of each spectrum, which
corresponds to bulk electrolyte, electrode-sheet, and lead-contact resistance, has been
subtracted from each data point. The electrode ASRs of the LSM-ESB cathode on GDC
at 500, 550, 600, 650, and 700 oC were 10.56, 3.31, 1.11, 0.44, and 0.19 Ω-cm2,
respectively. This result is very comparable with the ASRs of the LSM-YSB cathode on
Sm-doped ceria (SDC) electrolytes reported by Li et al. In their study, the electrode
ASRs were ~ 1.08 and 0.15 Ω-cm2 at 600 and 700 oC, respectively. This suggests that
the performance of the LSM-ESB cathode in this study is reasonable. It should be
noted, however, that despite the fact that ESB has higher ionic conductivity than YSB
[114], the ASR of LSM-ESB on GDC in the present study is slightly higher than for LSM-
YSB on SDC. This might be due to microstructural features associated with infiltrated
nano-scale YSB particles into LSM backbones, while in this study, LSM-ESB cathode
was fabricated by a simple mechanical mixing method with micron-sized ESB powders.
As mentioned above, further improvements in electrochemical performance of this LSM-
ESB system can be expected by microstructural optimization. On the other hand, the

138
electrode ASRs of the LSM-ESB on ESB substrate were substantially lower--4.18, 1.29,
0.43, 0.19, and 0.08 at 500, 550, 600, 650, and 700 oC, respectively.
In Fig. 7-4, the electrode ASR values from the impedance spectra in Fig. 7-3 are
plotted with various temperatures (right Y-axis). In addition, the percent electrode ASR
reduction on ESB relative to that on GDC was calculated at each temperature (left Y-
axis in Fig. 7-4), and a ~ 60% reduction in ASR was retained for all testing
temperatures. This result indicates that the reduced interfacial resistance of LSM-ESB
cathode on the ESB electrolyte remained in effect throughout the IT range. We believe
that this dramatic electrode ASR drop using the ESB electrolyte is caused by the high
oxygen dissociation rate of the bismuth oxide and the continuous fast ionic conduction
pathways from the cathode to the electrolyte without an abrupt change at the LSM-ESB
cathode and ESB electrolyte interface.
As illustrated in Fig. 7-5, the measured cathodic resistances of LSM-ESB on both
ESB and GDC electrolyte are compared to that of LSM-GDC and LSM-bismuth oxide
composite cathodes on various electrolytes in recent literature studies. As expected, all
LSM-bismuth oxide cathodes including the results in this study showed lower electrode
polarization losses than those of LSM-GDC cathodes which were reported by Murray et
al [90]. This result indicates that bismuth oxide phase integrated into LSM based-
cathodes increases the effective TPB length due to its higher ionic conduction.
However, even though doped ceria such as GDC and SDC has higher ionic conductivity
than YSZ (or ScSZ) electrolytes at IT, the reported LSM-bismuth oxide cathodes (and
the LSM-ESB cathode in this study) on GDC or SDC show a similar level of electrode
ASRs compared to cathodes using zirconia-based electrolytes, while LSM-GDC

139
cathodes have shown lower ASR on GDC electrolytes compared to YSZ electrolytes. It
is considered that due to the superior ionic conductivity of ESB or YSB in the composite
cathode, the effect of the GDC electrolyte at the cathode/electrolyte interface against
the YSZ electrolyte can be negligible. Instead, the performance of the LSM-bismuth
oxide cathode on GDC or YSZ seems to depend on bismuth oxide phase fraction and
cathode microstructures as shown in previous studies.
On the other hand, it is clearly shown that the LSM-ESB cathode on an ESB
electrolyte exhibits significantly lower electrode polarization losses than that of any other
LSM-based cathode in all measured temperature ranges from 500 to 700 oC. This
outstanding result can be explained that the synergetic effect of the ESB phases both in
cathode bulk and at the electrolyte/cathode interface on enhancing oxygen dissociation
rate and accelerating ionic conduction leading to a dramatic reduction of activation
polarization for oxygen reduction in the cathode. Previously we reported a similar effect
of the ESB electrolyte on reducing electrode ASR for BRO7-ESB composite cathode on
ESB, showing 26% reduction of the ASR relative to that on GDC electrolyte [19].
Therefore, this study again demonstrates that the ESB electrolyte has a highly
significant effect on boosting the SOFC cathode reaction rate at the IT range.
Meanwhile, the activation energy of LSM-ESB cathodes on GDC and ESB was
estimated from ASR plots in Fig. 7-5 using an Arrhenius relationship. The calculated
activation energies for both cells were the same, ~1.24 eV, which is in good agreement
with low end of other reported values for LSM-bismuth oxide cathodes (1.23 ~ 1.5 eV),
which depend on microstructure and composition of the composite cathodes [104, 106,
108, 112]. In addition, it is been reported that the activation energy for the pure LSM on

140
SDC electrolyte is ~ 1.5 eV [106]. This result shows that the addition of ESB phase into
the cathode bulk or at the electrode/electrolyte interface might change the mechanism
of the oxygen reduction at cathode. In addition, this estimated activation energy implies
that the surface oxygen exchange reaction of which activation energy is known to ~ 1.25
eV at low temperature might be a rate-limiting step for the cathode reaction, providing a
good reason for use of ESB with high oxygen surface exchange rate to reduce the
electrode polarization [45].
In order to gauge the long-term stability of the LSM-ESB cathode, the electrode
ASR of the LSM-ESB cathode on an ESB electrolyte pellet was measured at 700 oC.
Fig. 7-6 is the resultant plot of the electrode ASR at 700oC for 100 hrs. The ASR of the
LSM-ESB cathode maintained a constant value for 100 hrs of 0.08 ± 0.001 Ω-cm2,
indicating no initial degradation in electrode performance. To verify the stability of the
LSM-ESB system for IT SOFCs, however, further long term testing in the lower
temperature ranges and under various applied current conditions should be carried out.
7.3.2 I-V Characterization for Button Cells
To further investigate the effect of LSM-ESB cathodes coupled to an ESB
electrolyte on the actual IT-SOFC performance, current-voltage measurements were
conducted on anode-supported button cells. In order to obtain an ESB electrolyte, an
ESB-GDC bilayered electrolyte cell design was utilized due to the thermodynamic
instability of the ESB electrolyte at low Po2 conditions [16, 18]. Further details regarding
the ESB-GDC bilayered electrolyte are available in the recent studies [19]. In this study
two cells were fabricated, which included LSM-ESB (cathode) / GDC (electrolyte) /Ni-
GDC and LSM-ESB/ESB-GDC/Ni-GDC.

141
Fig.7-7 shows SEM images of the two cells after testing. As shown in the cross-
sectional views (Fig. 7-7-a,b), the structure of two cells are identical except a thin ( ~ 3
μm) ESB electrolyte is observed in ESB/GDC bilayer cell between the LSM-ESB
cathode and GDC electrolyte (Fig. 7-7-b). Fig. 7-7-c,d show the surface views of the
GDC and ESB electrolyte for the GDC single electrolyte cell and GDC/ESB bilayered
electrolyte cell, respectively, and some cracks and pores can be observed. This
indicates that the densities of both electrolytes were not optimal. This issue will be
discussed later in this section.
The current-voltage measurement results of both cells at 650oC are plotted in Fig.
7-8-a. The maximum power densities (MPDs) obtained were 658 and 836 mW/cm2 for
LSM-ESB on GDC and LSM-ESB on ESB/GDC, respectively. Even though the OCP of
the cell with LSM-ESB on ESB/GDC is slightly lower than that of LSM-ESB on GDC, the
MPD of LSM-ESB on ESB/GDC was increased by 27% compared to that of GDC
single layer cell. The increased power density is due to the significant reduction in the
total ASR calculated from the IV curves in Fig. 7-8-a, which were reduced by ~ 54%
from 0.566 Ω-cm2 for cell-1 to 0.263 Ω-cm2 for LSM-ESB on ESB/GDC. In this study we
used the same fabrication procedure and confirmed identical microstructures for the two
cells with the exception of the ESB interlayer in ESB/GDC bilayer structure, as shown in
Fig. 7-7-a,b. Thus, we believe that MPD enhancement of the LSM-ESB on ESB/GDC
cell mostly came from the effect of ESB electrolyte on reducing the electrode (cathodic)
ASR at the LSM-ESB cathode/ ESB electrolyte interface.
For further analysis, two points probe impedance tests were conducted. Fig. 7-8-b
illustrates the resultant nyquist plots for each cell under open circuit condition with the

142
same gas condition for I-V test at 650 oC. From the high frequency intercepts (RH) and
low frequency intercepts (RL) at the real axis of the complex plane, the ohmic and total
ASR values were estimated, respectively. The electrode ASR including anode and
cathode polarization resistance was calculated using the equation written as;
HLelectrode RRASR −= (7-1)
The detailed values are tabulated in Table 7-1. In this study, the total ASR values
obtained using DC measurement from IV (ASRIV) and electrochemical impedance
(ASREIS) showed less than 1% deviation indicating high reliability of the resultant data.
As expected from symmetric cell measurements, the electrode ASR was significantly
reduced for the bilayered electrolyte cell (0.164 Ω-cm2), showing ~ 64% reduction
compared to single layer cell (0.450 Ω-cm2). This result is quite consistent with the
cathodic ASR change for the symmetric cell measurement in the previous section.
These I-V and impedance results demonstrate that the effect of the ESB electrolyte on
LSM-ESB cathode polarization losses directly influences the SOFCs performance at IT,
showing reasonably high maximum power density of over 850 mW/cm2 at 650 oC. At
this point it is noted that the GDC electrolyte densities in the testing cells were not high
and have many small pores and the ESB layer also showed poor density affected by
GDC layer as shown in Fig. 7-7. It is well known that the density and thickness of the
electrolyte strongly influence ohmic resistance and SOFC performance [14]. Therefore,
the MPD of the LSM-ESB cathode can be much higher if denser and thinner GDC and
ESB electrolytes are used.
Fig. 7-9 shows IV-curves of both cells at various temperature ranging from 450 to
650 oC. The MPDs of the cell with LSM-ESB on GDC were 25, 72, 182, 389, and 658

143
mW/cm2 at 450, 500, 550, 600, and 650 oC, respectively. In case of the bilayered cell,
higher MPDs were exhibited and are reported to be 50, 124, 275, 533, and 836 mW/cm2
at 450, 500, 550, 600, and 650 oC, respectively. The improvement in MPD from the cell
with LSM-ESB on GDC to the cell with LSM-ESB on ESB at each temperature was
calculated and plotted with actual MPD values for each cell in Fig. 7-10. It is noted that
in order to give better visualization of the MPDs at low temperature, a log scale was
used for the power density (left axis in Fig. 7-10). In this plot, it is clearly shown that the
enhancement in MPD linearly increases as temperature decreases. For instance, the
MPD of ESB/GDC bilayered cell compared to that of GDC single layer increased by less
than 30% at 650 oC but 51 and 100% at 550 and 450 oC, respectively. This indicates
that the effect of the ESB electrolyte on LSM-ESB performance is valid and even
greater at low temperature. It is believed that the portion of cathodic polarization losses
is larger at lower temperature due to its thermally activated nature [7]. Therefore, the
beneficial effect of the ESB electrolyte layer on cathode performance should be
emphasized on using LSM-ESB cathodes for low temperature SOFC application.
Fig. 7-11 shows a comparison of MPDs for SOFCs with various LSM-bismuth
oxide cathodes at low to intermediate temperatures. For all temperatures, the LSM-ESB
cathode coupled to ESB electrolyte shows highest MPD. To my knowledge, the MPDs
(LSM-ESB on ESB/GDC electrolyte) in this study are the highest for any SOFCs using
LSM-bismuth oxide composite cathodes reported to date. Furthermore, this LSM-ESB
cathode on an ESB electrolyte can be expected to produce much higher power density
at intermediate and even lower temperatures through microstructural tailoring, including
cathode structure as well as electrolyte density and thickness control.

144
7.4 Conclusions
Conventional LSM cathodes for high temperature SOFCs were prepared for low
temperature SOFC application by pairing it with ESB in a composite cathode. Due to the
inherent high conductivity and fast oxygen exchange rate of ESB, the LSM-ESB
composite cathode showed much lower cathodic polarization losses than any other
LSM-based cathode at the IT range. Moreover, when ESB was used as an electrolyte,
the electrode ASR was reduced further (by ~60%) compared to that of the same LSM-
ESB cathode on a GDC electrolyte. Using the LSM-ESB cathode on a ESB-GDC
bilayered electrolyte, the MPD produced at 650 oC was ~ 865 mW/cm2, which is the
highest reported MPD to date for SOFCs using LSM-bismuth oxide cathodes. This
study demonstrated that the performance of LSM-ESB cathodes can be effectively
boosted when using ESB electrolytes. This is a very promising finding for development
of SOFCs which operate at low to intermediate temperatures.

145
20 30 40 50 60 70 80
(c) LSM+ESB before annealing
(d) LSM+ESB after annealing
(a) Pure LSM
Inte
nsity
(arb
. uni
t)
2θ (degree)
(b) 20ESB
LSM+ESB after annealing
LSM+ESB before annealing
20ESB
Pure LSM
2 Θ (degree)
Inte
nsi
ty (
arb
itra
ry u
nit)
Figure 7-1. XRD pattern of LSM, ESB, and LSM+ESB (50:50wt%) powers before and
after annealing at 900 oC 50 hrs

146
ESB
LSM
GDC
20μm
(a)
ESB
LSM
20μm
(b) Figure 7-2. SEM images of LSM-ESB cathode on GDC electrolyte (a) and ESB
electrolyte (b). The insets are backscattered images.

147
0 2 4 6 8 10 120
1
2
3
-Z'' (
Ω−c
m2 )
0.0 0.5 1.0 1.5 2.0 2.5 3.0 3.50.0
0.5
1.0
1.5
-Z'' (
Ω−c
m2 )
0.0 0.2 0.4 0.6 0.8 1.0 1.20.00.10.20.30.40.5
-Z'' (
Ω−c
m2 )
0.0 0.1 0.2 0.3 0.4 0.50.00
0.05
0.10
0.15
0.20
-Z'' (
Ω−c
m2 )
0.00 0.05 0.10 0.15 0.20 0.250.000.020.040.060.080.10
-Z'' (
Ω−c
m2 )
Z' (Ω−cm2)
(a) 500oC
(b) 550oC
(c) 600oC
(d) 650oC
(e) 700oC
LSM-ESB on ESBLSM-ESB on GDC
Figure 7-3. Impedance spectra of the LSM-ESB cathode on ESB and GDC pellets at
the temperature ranges from 500 to 700 oC

148
500 550 600 650 700
0
2
4
6
8
10
12
Temperature (oC)
Ele
ctro
de A
SR
(Ω
-cm
2)
0
10
20
30
40
50
60
70
80
90
100A
SR
Decre
ase
(%)
Figure 7-4. Electrode ASRs of LSM-ESB cathode on GDC (blue circles) and ESB (red
squares) electrolytes, and ASR reduction rate (black stars).

149
[a][b]
[c][d]
[e][f][g][h]
0.95 1.00 1.05 1.10 1.15 1.20 1.25 1.30
0.1
1
10
LSM-GDC(50wt%) on YSZ LSM-GDC (50wt%) on GDC LSM-20ESB (15wt%) on YSZ LBSM-30ESB(50wt%) on ScSZ LSM-30ESB (50wt%)on ScSZ LSM-YSB(50wt%) on YSZ LSM-YSB(50wt%)on SDC LSM-YSB(77wt%) on YSZ LSM-20ESB(50wt%) on GDC, this study LSM-20ESB(50wt%) on ESB, this study
E
lect
rode
AS
R (Ω
−cm
2 )
1000/T (K-1)
Figure 7-5. Comparison of the electrode polarization resistance of LSM-bismuth oxide
cathodes at IT ranges. LBSM is short for La0.74Bi0.10Sr0.16MnO3-δ.
Ref : a,b-[90], c-[111], d-[104], e-[108], f-[109], g-[106], h-[112]

150
0 20 40 60 80 1000.00
0.02
0.04
0.06
0.08
0.10
AS
R (
Ωcm
2)
Time (h)Time (hours)
Ele
ctr
ode A
SR
(Ω
-cm
2)
Figure 7-6. Long term stability test of LSM-ESB cathode on ESB electrolyte at 700 oC
for 100 hours.

151
LSM-ESB
GDC
Ni-GDC20μm20μm
(a)
LSM-ESB
ESB
GDC
Ni-GDC
25μm
3 μm
50 μm
500 μm20μm20μm
(b)
Figure 7-7. SEM images of cross-sectional views for cell-1(a) and cell-2(b), and surface
views for cell-1 (c) and cell-2 (d)

152
GDC
20μm20μm
(c)
ESB
20μm20μm
(d) Figure 7-7. Continued

153
0.0 0.5 1.0 1.5 2.0 2.5 3.0 3.5 4.00.0
0.2
0.4
0.6
0.8
1.0
Current Density (A/cm2)
Pote
ntia
l (V)
0.0
0.1
0.2
0.3
0.4
0.5
0.6
0.7
0.8
0.9
Power Density (W/cm
2)650oC
Cell-1 (LSM-ESB on GDC)
Cell-2 (LSM-ESB on ESB)
(a)
Cell-2
Cell-1650oC
0.0 0.1 0.2 0.3 0.4 0.5 0.60.00
0.05
0.10
0.15
0.20
-Z" (
Ω-c
m2 )
Z' (Ω-cm2) . (b)
Figure 7-8. I-V characteristics (a) and impedance spectroscopy (b) of cell-1 and cell-2
at 650 oC

154
0.0 0.5 1.0 1.5 2.0 2.5 3.0 3.5 4.00.0
0.2
0.4
0.6
0.8
1.0
Current Density (A/cm2)
Pote
ntia
l (V)
0.0
0.1
0.2
0.3
0.4
0.5
0.6
0.7
0.8
0.9
Power Density (W/cm
2)
Cell-1 (LSM-ESB on GDC)
650oC
600oC
550oC
500oC450oC
(a)
0.0 0.5 1.0 1.5 2.0 2.5 3.0 3.5 4.00.0
0.2
0.4
0.6
0.8
1.0
Current Density (A/cm2)
Pote
ntia
l (V)
0.0
0.1
0.2
0.3
0.4
0.5
0.6
0.7
0.8
0.9
Power Density (W/cm
2)
Cell-2 (LSM-ESB on ESB) 650oC
600oC
550oC
500oC
450oC
(b)
Figure 7-9. I-V characteristics at various temperature for cell-1 (a) and cell-2 (b)

155
450 500 550 600 65010
100
1000
Temperature (oC)
MP
Ds
(mW
/cm
2 )
0
20
40
60
80
100M
PD
Improvem
ent (%)
Figure 7-10. Maximum power density improvement (black stars) of cell-2 (red squares) at various temperatures compared to cell-1 (blue circles)

156
450 500 550 600 650 7000
100
200
300
400
500
600
700
800
900
1000
1100
M
PD
s (m
W/c
m2 )
Temperature (oC)
LSM-20ESB(50wt%) on ESB, this study LSM-20ESB(50wt%) on GDC, this study LSM-YSB(50wt%) on SDC LSM-YSB(75wt%) on YSZ LSM-30ESB(50wt%) on YSZ LBSM-30ESB(50wt%) on ScSZ LSM-YSB(50wt%) on YSZ
[a][b]
[c][d]
[e]
Figure 7-11. Comparison of maximum power density of SOFCs using LSM-bismuth
oxide composite cathodes at IT ranges.
Ref : a-[107], b-[106], c-[112], d-[108], e-[111], f-[109]

157
Table 7-1. Detailed total, ohmic, and electrode ASR values for Cell-1 and Cell-2 at 650 oC
(unit : Ω-cm2) Cathode Electrolyte Total
ASRIV Total
ASREIS Ohmic ASR
Electrode ASR
Cell-1 LSM-ESB GDC 0.566 0.569 0.119 0.450 Cell-2 LSM-ESB ESB-GDC 0.263 0.261 0.097 0.164

158
CHAPTER 8 CONCLUSIONS
In this dissertation, several works have been conducted to reduce polarization
losses for the anode, electrolyte and cathode at reduced temperatures. In all, the goal
was to develop high performance solid oxide fuel cells running at low to intermediate
temperatures.
A novel AFL was developed to dramatically improve SOFC performance (Chapter
3). The bimodally integrated nano-/micron- composite AFL was fabricated by simply
spray coating a precursor solution into a conventional submicron Ni-GDC functional
layer. The composition used for the anode substrate, the colloidal AFL (C-AFL), and
the precursor- integrated AFL (N+C-AFL) was Ni- GDC. The electrolyte composition
was GDC, a system that has received much attention for its potential for use in IT-
SOFCs. A systematic study comparing cells using no AFL, a C-AFL, and the newly-
developed N+C-AFL was conducted. It showed that the N+C-AFL sample exhibited a
maximum power density of 1160 mW/cm2 at 600 °C—a 287% increase compared to the
sample with no AFL and a 70% increase compared to the sample using a conventional
AFL. Both ohmic and non-ohmic losses were lowered, suggesting that the 2D interfacial
region between the anode and the electrolyte was enhanced as well as TBP lengths.
Additionally, it was shown that the fractional improvement in power increases with
decreasing temperature, a critical point for reduced operating temperatures. These
findings are very encouraging not only based on dramatic improvement in performance,
but also in the simplicity of the technique itself. It is further believed that this N+C-AFL
technique is versatile enough to be applied to other SOFC systems for similar gains in
performance, and will be a milestone in the field of reduced temperature SOFCs.

159
In addition to the effect of particle size in AFL, the effect of AFL composition on the
electrochemical performance was investigated using submicronsized Ni-GDC AFL
(Chapter 4). For this, AFLs with composition ranging from 40 to 80wt% NiO were
fabricated. Microstructural analysis confirmed these functional layers to have phases
which are fine and well-distributed. The optimal AFL composition was achieved at 1:1
volume ratio of Ni to GDC, which corresponds to 60 wt% NiO. This composition
exhibited the higest MPD over the intermediate to low temperature range. In addition, a
preliminary long-term stability test showed the possibility of using this system in
practical SOFC applications. The measured MPD and ASR show an inverse linear
relationship implying that the performance enhancement greatly depends on AFL
composition.
To better understand the relationship between microstructure and electrochemical
performance, the effect composition on the microstructures of Ni-GDC AFLs was
investigated (Chapter 5). AFLs with various Ni-GDC compositions (50 – 80 wt% NiO
before reduction) were quantified by a three dimensional (3D) reconstruction technique
using a FIB/SEM dual beam system. Each AFL sample was automatically sectioned into
150 slices with 60 nm intervals. The Amira software package allowed for alignment,
segmentation, and reconstruction of the 2D images to a 3D image. From these
reconstructions, the volume fraction, effective particle size, phase gradient, and surface
area for Ni, GDC, and pore phases as well as pore tortuosity for each sample were
quantified. The estimated phase volume fraction was well matched to the theoretically
calculated value. The optimal effective particle size and phase fraction were seen at 60
wt% NiO. The active TPB densities were calculated based on the connectivity of voxels

160
labeled with each phase. The highest TPB density achieved was ~ 15.6 μm-2 and
corresponded to 60wt% NiO . The TPB density showed an inverse proportionality to
electrode ASR. This result implies that the quantified microstructural values, which are
controllable, can be directly applied to predict the electrochemical performance of
SOFCs
In Chapter 6, a discussion was given on the fabrication of a thin and dense bilayer
electrolyte consisting of erbium stabilized bismuth oxide (ESB) and gadolinium-doped
ceria (GDC) applied on a tape-cast anode-supported SOFC using a practical and cost-
effective colloidal deposition process. Using a wet chemical co-precipitation method,
nano-sized ESB particles were successfully synthesized at temperatures as low as ~
500 oC, which is much lower than those needed for powders prepared by the
conventional solid state route (~ 800 oC). Due to the high sinterability of this powder, a
dense erbia stabilized bismuth oxide (ESB) layer was successfully formed on a
gadolinia doped ceria (GDC) electrolyte by a simple colloidal coating method.. A
systematic study on the sintering behavior of ESB revealed that at higher sintering
temperatures, bismuth oxide can sublime or penetrate into the GDC sublayer. SEM and
EDX analysis of a full button cell with an ESB/GDC bilayer sintered at 800 oC showed
no visible interfacial diffusion between each layer. I-V measurement of the cell showed
high power density ( ~ 1.5 W/cm2) at 650 oC due to an enhancement in OCP and a
significant reduction in ASR when compared to a GDC single cell. This result
demonstrates that this ESB/GDC bilayer electrolyte is practical for high performance
SOFCs at low operational temperature.

161
In Chapter 7, an alternative high performance composite cathode for low to
intermediate temperature SOFCs was described. Using a highly conductive ESB phase,
the performance of conventional (La0.80Sr0.20)MnO3-δ (LSM) cathodes was dramatically
improved. The ESB phase was utilized not only as the ion-conducting phase in the
LSM-ESB composite cathode, but also as an electrolyte coupled to LSM-ESB cathode.
The electrode ASR measured from a symmetric cell consisting LSM-ESB electrodes on
an ESB electrolyte was only 0.08 Ω-cm2 at 700oC, which is ~60% lower than that of
LSM-ESB on GDC electrolytes (0.19 Ω-cm2). This exemplifies the synergetic effect the
ESB phase has both in the cathode bulk and at the electrolyte/electrode interface. The
ESB phase is presumed to increase the effective TPB length as well as enhance the
oxygen surface exchange reaction. This effect was shown to occur at all temperatures
tested, from 500 to 700 oC. The MPDs of the anode-supported SOFCs with LSM-ESB
cathodes on ESB/GDC bilayered electrolytes were 50, 124, 275, 533, and 836 mW/cm2
at 450, 500, 550, 600, and 650 oC, respectively. These are to date the highest reported
MPDs for SOFCs using LSM-bismuth oxide composite cathodes and demonstrate that
the LSM-ESB composite cathode boosted by an ESB electrolyte is very promising for
low-to-intermediate SOFC applications.

162
APPENDIX A DEPENDENCE OF OCP ON GDC ELECTROLYTE THICKNESS
In this dissertation, the GDC electrolyte has been used for all works. Contrast to
the conventional YSZ electrolyte with pure ionic conductivity, SOFCs with doped ceria
electrolyte have shown lower OCP from theoretical Nernst voltage due to electronic
leakage current and oxygen permeation of GDC [60]. It has been also reported that
these leakage current and oxygen permeation properties are function of the electrolyte
thickness [59, 60]. In this appendix, the dependence of the OCP on GDC electrolyte
thickness on Ni-GDC anode-supported SOFCs was briefly studied.
In order to gauge the effect of GDC electrolyte thickness on OCP of SOFCs in the
IT range, eight anode-supported SOFCs with different electrolyte thicknesses were
fabricated. The NiO-GDC anode supports were made by a tape-casting process. For
the better electrolyte deposition, submicronsized Ni-GDC AFL (50wt% NiO) was
colloidally deposited. Next, GDC electrolyte was coated on the AFL surface by a spin
coating method. Thickness of the electrolyte was controlled by the number of repeated
coating process in the fixed spin speed and time condition. Detailed fabrication process
of SOFCs with thin GDC electrolyte on the anode-support was described on Chapter 4.
Fig. A-1 shows the SEM images of the cross-sectional microstructures of the
tested samples. From these micrographs, it was observed that different GDC electrolyte
thicknesses of the prepared samples were obtained using the control of spin coating
process. The measured electrolyte thicknesses were varied from 6.2 to 32.9 μm. The
detailed values of electrolyte thickness measured were tabulated in Table A-1.
The OCP was measured under 90 sccm of hydrogen with 3% water as a fuel at
the anode side and 30 sccm of dry air as an oxidant at the cathode side in the

163
temperature range from 500 to 650 oC. The resultant OCP values at 500, 600, and 650
oC for each sample with electrolyte thickness were plotted in Fig. A-2, and summarized
in Table A-1. At all temperatures, the OCP was decreased as electrolyte thickness
decreased. These experimental results demonstrate the theory that the electronic
leakage current and oxygen permeation in GDC electrolyte is greater at thinner
electrolyte thickness [59, 60].
Recently this experiment result was verified by continuum-level electrochemical
model developed Duncan and Wachsman [60]. Fig. A-3 shows the resultant modeling fit
with author’s experimental data by Duncan. For this modeling, the OCP model equation
is given as
Φoc = Φth −ηoc −kBT
q1zV
lncv,0
cv,L
+De − Dv
zvDv − zeDe
lnzv ue − uv( )cv,0 − ueca
zv ue − uv( )cv,L − ueca
(A-1)
Detailed explanation and derivation of this model equation are in the previous work
by Duncan et. al [60].

164
32.9μm
(h)
LSCF-GDC cathode
GDC electrolyte
Ni-GDC anode
6.2μm
(a)
9.0μm
(b)
9.4μm
(c)
11.3μm
(d)
12.6μm
(e)
19.7μm
(f)
26.3μm
(g)
Figure A-1. Microstructures of Ni-GDC anode/GDC electrolyte/LSCF cathode SOFCs
with various electrolyte thicknesses.

165
650oC600oC500oC
5 10 15 20 25 30 35
0.65
0.70
0.75
0.80
0.85
0.90
0.95
1.00
Electrolyte thickness (10GDC, µm)
Open c
ircu
it pote
ntia
l (V
)
1
Figure A-2. Experimental OCP values from electrochemical test at 500, 600, and 650
oC as a function of GDC electrolyte thickness

166
0.7
0.8
0.9
1
0 10 20 30 40 50 60
OC
V (
V)
L (µm)
500 oC
650 oC
600 oC
OC
P
Electrolyte thickness (10GDC, μm)
Figure A-3. Fit of the OCP model (eq. A-1) to experimental data for OCP as a function
of electrolyte thickness.

167
Table A-1. Summary of sample description and OCP result
Sample# GDC Electrolyte Thickness(μm)
OCP at 650(oC)
OCP at 600(oC)
OCP at 500(oC)
1 6.2 0.648 0.664 - 2 9.0 0.749 - 0.838 3 9.4 0.790 - - 4 11.3 0.801 0.847 0.890 5 12.6 0.822 0.855 0.913 6 19.7 0.843 0.860 0.920 7 26.3 0.876 0.914 0.961 8 32.9 0.895 0.935 0.990
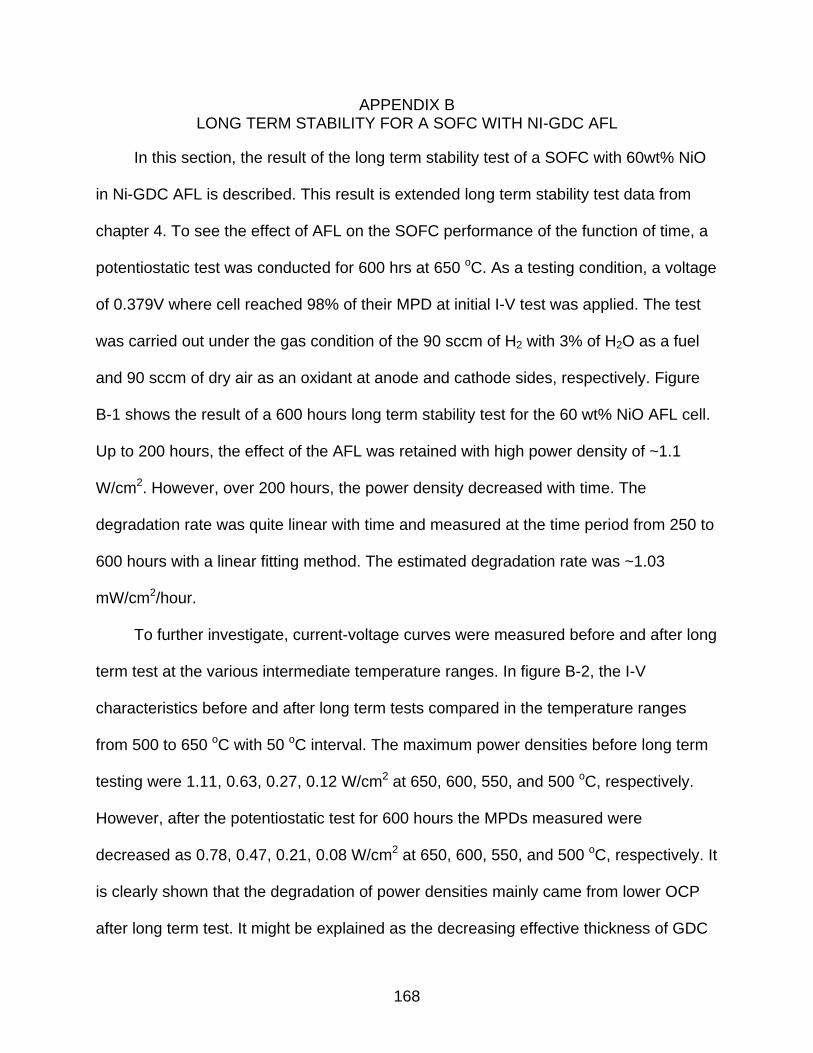
168
APPENDIX B LONG TERM STABILITY FOR A SOFC WITH NI-GDC AFL
In this section, the result of the long term stability test of a SOFC with 60wt% NiO
in Ni-GDC AFL is described. This result is extended long term stability test data from
chapter 4. To see the effect of AFL on the SOFC performance of the function of time, a
potentiostatic test was conducted for 600 hrs at 650 oC. As a testing condition, a voltage
of 0.379V where cell reached 98% of their MPD at initial I-V test was applied. The test
was carried out under the gas condition of the 90 sccm of H2 with 3% of H2O as a fuel
and 90 sccm of dry air as an oxidant at anode and cathode sides, respectively. Figure
B-1 shows the result of a 600 hours long term stability test for the 60 wt% NiO AFL cell.
Up to 200 hours, the effect of the AFL was retained with high power density of ~1.1
W/cm2. However, over 200 hours, the power density decreased with time. The
degradation rate was quite linear with time and measured at the time period from 250 to
600 hours with a linear fitting method. The estimated degradation rate was ~1.03
mW/cm2/hour.
To further investigate, current-voltage curves were measured before and after long
term test at the various intermediate temperature ranges. In figure B-2, the I-V
characteristics before and after long term tests compared in the temperature ranges
from 500 to 650 oC with 50 oC interval. The maximum power densities before long term
testing were 1.11, 0.63, 0.27, 0.12 W/cm2 at 650, 600, 550, and 500 oC, respectively.
However, after the potentiostatic test for 600 hours the MPDs measured were
decreased as 0.78, 0.47, 0.21, 0.08 W/cm2 at 650, 600, 550, and 500 oC, respectively. It
is clearly shown that the degradation of power densities mainly came from lower OCP
after long term test. It might be explained as the decreasing effective thickness of GDC

169
electrolyte due to gradual reduction of Ce4+ into Ce3+ under low Po2 condition, causing
increase of electronic current leakage through the electrolyte. In addition to leakage
current issue, this degradation is possibly explained that this performance degradation
phenomenon with time might come from the changing of microstructures of the anode
and cathode with time under applied current. For further investigation, electrochemical
impedance spectroscopy can be analyzed and the microstructural analysis of the long
term tested sample with SEM or 3D reconstruction using FIB/SEM dual beam system
will be required.

170
Figure B-1. Long term stability test of a SOFC with 60wt% NiO in Ni-GDC AFL. The
potentiostatic test was conducted at 650 oC for 600 hours under an applied voltage of 0.379 V.

171
0 2.5 5.0 7.50
0.25
0.50
0.75
1.00
I (Amps/cm2)
E (V
olts)
0
0.5
1.0
Pow
er (W
/cm
2)
BeforeAfter
650oC
(a)
0 1 2 3 40
0.25
0.50
0.75
1.00
I (Amps/cm2)
E (V
olts)
0
0.2
0.4
0.6
Pow
er (W
/cm
2)
Before
After
600oC
(b)
Figure B-2. Comparison of I-V plots of the testing sample between before long term test
and after long term test for 600 hours at 650oC(a), 600oC(b), 550oC(c), 500oC(d).

172
0 0.5 1.0 1.5 2.00
0.25
0.50
0.75
1.00
I (Amps/cm2)
E (V
olts)
0
0.1
0.2
0.3
Pow
er (W
/cm
2)
Before
After
550oC
(c)
0 0.1 0.2 0.3 0.4 0.5 0.6 0.70
0.25
0.50
0.75
1.00
I (Amps/cm2)
E (V
olts)
0
0.05
0.10
0.15
Pow
er (W
/cm
2)
Before
After
500oC
(d)
Figure B-2. Continued

173
APPENDIX C EXPERIMENTAL SETUP
Figure C-1. Schematic SOFC testing setup – a button cell testing setup configuration
and I-V and EIS testing equipment

174
Figure C-2. Illustration of symmetric cell configuration for EIS test (top) and EIS testing setup (bottom)
Tube furnace
Solatron 1260
Z-plot software
Quartz PlatesQuartz PlatesQuartz Plates

175
LIST OF REFERENCES
1. W.R. Grove, Philosophical Magazine and Journal of Science 14 (1839), p. 127.
2. N.Q. Minh, Journal of the American Ceramic Society 76 (1993) (3), p. 563.
3. S.M. Haile, Acta Materialia 51 (2003) (19), p. 5981.
4. E.D. Wachsman and S.C. Singhal, Electrochemical society interface 18 (2009) (3), p. 38.
5. B.C.H. Steele, Journal of Materials Science 36 (2001) (5), p. 1053.
6. J.W. Fergus, Journal of Power Sources 162 (2006) (1), p. 30.
7. B.C.H. Steele, Solid State Ionics 129 (2000) (1-4), p. 95.
8. S. deSouza, S.J. Visco and L.C. DeJonghe, Solid State Ionics 98 (1997) (1-2), p. 57.
9. B.C.H. Steele and A. Heinzel, Nature 414 (2001) (6861), p. 345.
10. R.E. Williford, L.A. Chick, G.D. Maupin, S.P. Simner and J.W. Stevenson, Journal of the Electrochemical Society 150 (2003) (8), p. A1067.
11. N. Ai, Z. Lu, K.F. Chen, X.Q. Huang, X.B. Du and W.H. Su, Journal of Power Sources 171 (2007), p. 489.
12. N. Ai, Z. Lu, J.K. Tang, K.F. Chen, X.Q. Huang and W.H. Su, Journal of Power Sources 185 (2008) (1), p. 153.
13. K.F. Chen, X.J. Chen, Z. Lu, N. Ai, X.Q. Huang and W.H. Su, Electrochimica Acta 53 (2008) (27), p. 7825.
14. J.S. Ahn, H. Yoon, K.T. Lee, M.A. Camaratta and E.D. Wachsman, Fuel Cells 9 (2009) (5), p. 643.
15. B.C.H. Steele, Solid State Ionics 75 (1995), p. 157.
16. T. Takahashi, T. Esaka and H. Iwahara, Journal of Applied Electrochemistry 7 (1977) (4), p. 299.
17. N.X. Jiang, E.D. Wachsman and S.H. Jung, Solid State Ionics 150 (2002) (3-4), p. 347.
18. E.D. Wachsman, P. Jayaweera, N. Jiang, D.M. Lowe and B.G. Pound, Journal of the Electrochemical Society 144 (1997) (1), p. 233.

176
19. J.S. Ahn, M.A. Camaratta, D. Pergolesi, K.T. Lee, H. Yoon, B.W. Lee, D.W. Jung, E. Traversa and E.D. Wachsman, Journal of the Electrochemical Society 157 (2010) (3), p. B376.
20. J.S. Ahn, D. Pergolesi, M.A. Camaratta, H. Yoon, B.W. Lee, K.T. Lee, D.W. Jung, E. Traversa and E.D. Wachsman, Electrochemistry Communications 11 (2009) (7), p. 1504.
21. A. Hammouche, E.J.L. Schouler and M. Henault, Solid State Ionics 28 (1988), p. 1205.
22. N.Q. Minh, Chemtech 21 (1991) (2), p. 120.
23. R.T. Dehoff, Thermodynamics in Materials Science, McGraw-Hill (1993).
24. P.J. Gellings and H.J.M. Bouwmeester, The CRC Handbook of Solid State Electrochemistry, CRC press (1997).
25. J. Larminie and A. Dicks, Fuel Cell System Explanied, Wiley (2003).
26. M. Yashima, M. Kakihana and M. Yoshimura, Solid State Ionics 86-8 (1996), p. 1131.
27. J.C. Boivin and G. Mairesse, Chemistry of Materials 10 (1998) (10), p. 2870.
28. D.W. Strickler and W.G. Carlson, Journal of the American Ceramic Society 47 (1964) (3), p. 122.
29. E.C. Subbarao and H.S. Maiti, Solid State Ionics 11 (1984) (4), p. 317.
30. H. Yahiro, Y. Eguchi, K. Eguchi and H. Arai, Journal of Applied Electrochemistry 18 (1988) (4), p. 527.
31. K. Eguchi, T. Setoguchi, T. Inoue and H. Arai, Solid State Ionics 52 (1992) (1-3), p. 165.
32. H.A. Harwig, Zeitschrift Fur Anorganische Und Allgemeine Chemie 444 (1978) (SEP), p. 151.
33. T. Takahashi, T. Esaka and H. Iwahara, Journal of Solid State Chemistry 16 (1976) (3-4), p. 317.
34. M.J. Verkerk, K. Keizer and A.J. Burggraaf, Journal of Applied Electrochemistry 10 (1980) (1), p. 81.
35. C.Z. Wang, X.G. Xu and B.Z. Li, Solid State Ionics 13 (1984) (2), p. 135.
36. P. Duran, J.R. Jurado, C. Moure, N. Valverde and B.C.H. Steele, Materials Chemistry and Physics 18 (1987) (3), p. 287.

177
37. E.D. Wachsman, G.R. Ball, N. Jiang and D.A. Stevenson, Solid State Ionics 52 (1992) (1-3), p. 213.
38. H. Yahiro, Y. Baba, K. Eguchi and H. Arai, Journal of the Electrochemical Society 135 (1988) (8), p. 2077.
39. J.Y. Park and E.D. Wachsman, Ionics 12 (2006) (1), p. 15.
40. J.Y. Park, H. Yoon and E.D. Wachsman, Journal of the American Ceramic Society 88 (2005) (9), p. 2402.
41. Y.J. Leng and S.H. Chan, Electrochemical and Solid State Letters 9 (2006) (2), p. A56.
42. E.D. Wachsman, Solid State Ionics 152 (2002), p. 657.
43. T.H. Etsell and S.N. Flengas, Chemical Reviews 70 (1970) (3), p. 339.
44. M. Godickemeier, K. Sasaki, L.J. Gauckler and I. Riess, Solid State Ionics 86-8 (1996), p. 691.
45. Z.P. Shao and S.M. Haile, Nature 431 (2004) (7005), p. 170.
46. C.W. Sun and U. Stimming, Journal of Power Sources 171 (2007) (2), p. 247.
47. E. Ramirez-Cabrera, A. Atkinson and D. Chadwick, Solid State Ionics 136 (2000), p. 825.
48. T. Suzuki, Z. Hasan, Y. Funahashi, T. Yamaguchi, Y. Fujishiro and M. Awano, Science 325 (2009) (5942), p. 852.
49. M.F. Liu, D.H. Dong, R.R. Peng, J.F. Gao, J. Diwu, X.Q. Liu and G.Y. Meng, Journal of Power Sources 180 (2008) (1), p. 215.
50. H. Koide, Y. Someya, T. Yoshida and T. Maruyama, Solid State Ionics 132 (2000) (3-4), p. 253.
51. J. Will, A. Mitterdorfer, C. Kleinlogel, D. Perednis and L.J. Gauckler, Solid State Ionics 131 (2000) (1-2), p. 79.
52. J.W. Kim, A.V. Virkar, K.Z. Fung, K. Mehta and S.C. Singhal, Journal of the Electrochemical Society 146 (1999) (1), p. 69.
53. J.J. Haslam, A.Q. Pham, B.W. Chung, J.F. DiCarlo and R.S. Glass, Journal of the American Ceramic Society 88 (2005) (3), p. 513.
54. D. Stover, H.P. Buchkremer and S. Uhlenbruck, Ceramics International 30 (2004) (7), p. 1107.

178
55. S.D. Kim, S.H. Hyun, J. Moon, J.H. Kim and R.H. Song, Journal of Power Sources 139 (2005) (1-2), p. 67.
56. E. Wanzenberg, F. Tietz, P. Panjan and D. Stover, Solid State Ionics 159 (2003) (1-2), p. 1.
57. K.T. Lee, H.S. Yoon, M.A. Camarratta, N.A. Sexson, J.S. Ahn and E.D. Wachsman, to be submitted.
58. M.D. Gross, J.M. Vohs and R.J. Gorte, Journal of the Electrochemical Society 154 (2007) (7), p. B694.
59. X. Zhang, M. Robertson, C. Deces-Petit, W. Qu, O. Kesler, R. Maric and D. Ghosh, Journal of Power Sources 164 (2007) (2), p. 668.
60. K.L. Duncan and E.D. Wachsman, Journal of the Electrochemical Society 156 (2009) (9), p. B1030.
61. L.C.R. Schneider, C.L. Martin, Y. Bultel, D. Bouvard and E. Siebert, Electrochimica Acta 52 (2006) (1), p. 314.
62. J.R. Wilson and S.A. Barnett, Electrochemical and Solid State Letters 11 (2008) (10), p. B181.
63. N.P. Brandon, S. Skinner and B.C.H. Steele, Annual Review of Materials Research 33 (2003), p. 183.
64. K.T. Lee, N.J. Vito, C.A. Mattehw, H.S. Yoon and E.D. Wachsman, ECS transactions to be submitted (2010).
65. N. Shikazono, Y. Sakamoto, Y. Yamaguchi and N. Kasagi, Journal of Power Sources 193 (2009) (2), p. 530.
66. J.R. Wilson, W. Kobsiriphat, R. Mendoza, H.Y. Chen, J.M. Hiller, D.J. Miller, K. Thornton, P.W. Voorhees, S.B. Adler and S.A. Barnett, Nature Materials 5 (2006) (7), p. 541.
67. D. Gostovic, J.R. Smith, D.P. Kundinger, K.S. Jones and E.D. Wachsman, Electrochemical and Solid State Letters 10 (2007), p. B214.
68. J.R. Smith, A. Chen, D. Gostovic, D. Hickey, D. Kundinger, K.L. Duncan, R.T. DeHoff, K.S. Jones and E.D. Wachsman, Solid State Ionics 180 (2009) (1), p. 90.
69. J.R. Wilson, A.T. Duong, M. Gameiro, H.Y. Chen, K. Thornton, D.R. Mumm and S.A. Barnett, Electrochemistry Communications 11 (2009) (5), p. 1052.
70. J.R. Wilson, M. Gameiro, K. Mischaikow, W. Kalies, P.W. Voorhees and S.A. Barnett, Microscopy and Microanalysis 15 (2009) (1), p. 71.

179
71. J.R. Wilson, J.S. Cronin, A.T. Duong, S. Rukes, H.Y. Chen, K. Thornton, D.R. Mumm and S. Barnett, Journal of Power Sources 195 (2010) (7), p. 1829.
72. N. Shikazono, D. Kanno, K. Matsuzaki, H. Teshima, S. Sumino and N. Kasagi, Journal of the Electrochemical Society 157 (2010) (5), p. B665.
73. A. Bieberle, L.P. Meier and L.J. Gauckler, Journal of the Electrochemical Society 148 (2001) (6), p. A646.
74. H. Inaba and H. Tagawa, Solid State Ionics 83 (1996) (1-2), p. 1.
75. V.V. Kharton, E.N. Naumovich and V.V. Samokhval, Solid State Ionics 99 (1997) (3-4), p. 269.
76. A. Jaiswal, C.T. Hu and E.D. Wachsman, Journal of the Electrochemical Society 154 (2007) (10), p. B1088.
77. M. Camaratta and E. Wachsman, Journal of the Electrochemical Society 155 (2008) (2), p. B135.
78. A.L. Patterson, Physical Review 56 (1939) (10), p. 978.
79. A.M. Azad, S. Larose and S.A. Akbar, Journal of Materials Science 29 (1994) (16), p. 4135.
80. N.X. Jiang and E.D. Wachsman, Journal of the American Ceramic Society 82 (1999) (11), p. 3057.
81. M. Hrovat, A. Bencan, J. Holc, T. Rojac and M. Kosec, Journal of Materials Research 18 (2003) (6), p. 1297.
82. V. Gil, J. Tartaj, C. Moure and P. Duran, Ceramics International 33 (2007) (3), p. 471.
83. D.W. Jung, K.L. Duncan and E.D. Wachsman, Acta Materialia 58 (2010) (2), p. 355.
84. E.P. Murray, T. Tsai and S.A. Barnett, Solid State Ionics 110 (1998) (3-4), p. 235.
85. S.P. Yoon, J. Han, S.W. Nam, T.H. Lim, I.H. Oh, S.A. Hong, Y.S. Yoo and H.C. Lim, Journal of Power Sources 106 (2002) (1-2), p. 160.
86. S.P. Jiang, Journal of Power Sources 124 (2003) (2), p. 390.
87. C.C. Kan, H.H. Kan, F.M. Van Assche, E.N. Armstrong and E.D. Wachsman, Journal of the Electrochemical Society 155 (2008) (10), p. B985.
88. C.C. Kan and E.D. Wachsman, Journal of the Electrochemical Society 156 (2009) (6), p. B695.

180
89. T. Kenjo, S. Osawa and K. Fujikawa, Journal of the Electrochemical Society 138 (1991) (2), p. 349.
90. E.P. Murray and S.A. Barnett, Solid State Ionics 143 (2001) (3-4), p. 265.
91. C.W. Tanner, K.Z. Fung and A.V. Virkar, Journal of the Electrochemical Society 144 (1997) (1), p. 21.
92. M. Juhl, S. Primdahl, C. Manon and M. Mogensen, Journal of Power Sources 61 (1996) (1-2), p. 173.
93. Y.J. Leng, S.H. Chan, K.A. Khor and S.P. Jiang, Journal of Solid State Electrochemistry 10 (2006) (6), p. 339.
94. J.L. Li, S.R. Wang, Z.R. Wang, R.Z. Liu, X.F. Ye, X.F. Sun, T.L. Wen and Z.Y. Wen, Journal of Power Sources 188 (2009) (2), p. 453.
95. N.M. Sammes, G.A. Tompsett, H. Nafe and F. Aldinger, Journal of the European Ceramic Society 19 (1999) (10), p. 1801.
96. B.A. Boukamp, I.C. Vinke, K.J. Devries and A.J. Burggraaf, Solid State Ionics 32-3 (1989), p. 918.
97. B.A. Boukamp, Solid State Ionics 136 (2000), p. 75.
98. J.C. Boivin, C. Pirovano, G. Nowogrocki, G. Mairesse, P. Labrune and G. Lagrange, Solid State Ionics 113 (1998), p. 639.
99. I.C. Vinke, K. Seshan, B.A. Boukamp, K.J. Devries and A.J. Burggraaf, Solid State Ionics 34 (1989) (4), p. 235.
100. M. Dumelie, G. Nowogrocki and J.C. Boivin, Solid State Ionics 28 (1988), p. 524.
101. C.R. Xia, Y. Zhang and M.L. Liu, Applied Physics Letters 82 (2003) (6), p. 901.
102. M. Camaratta and E. Wachsman, Solid State Ionics 178 (2007), p. 1411.
103. M. Camaratta and E. Wachsman, Solid State Ionics 178 (2007) (19-20), p. 1242.
104. J.L. Li, S.R. Wang, Z.R. Wang, R.Z. Liu, T.L. Wen and Z.Y. Wen, Journal of Power Sources 179 (2008) (2), p. 474.
105. J.L. Li, S.R. Wang, X.F. Sun, R.Z. Liu, X.F. Ye and Z.Y. Wen, Journal of Power Sources 185 (2008) (2), p. 649.
106. Z.Y. Jiang, L. Zhang, K. Feng and C.R. Xia, Journal of Power Sources 185 (2008) (1), p. 40.
107. J. Li, S. Wang, R. Liu, T. Wen and Z. Wen, Fuel Cells 9 (2009) (5), p. 657.

181
108. J.L. Li, S.R. Wang, Z.R. Wang, R.Z. Liu, T.L. Wen and Z.Y. Wen, Journal of Power Sources 194 (2009) (2), p. 625.
109. Z.Y. Jiang, L. Zhang, L.L. Cai and C.R. Xia, Electrochimica Acta 54 (2009) (11), p. 3059.
110. Z.Y. Jiang, C.R. Xia, F. Zhao and F.L. Chen, Electrochemical and Solid State Letters 12 (2009) (6), p. B91.
111. J.L. Li, S.R. Wang, Z.R. Wang, J.Q. Qian, R.Z. Liu, T.L. Wen and Z.Y. Wen, Journal of Solid State Electrochemistry 14 (2010) (4), p. 579.
112. Z. Jiang, Z. Lei, B. Ding, c. Xia, F. Zhao and F. Chen, International Journal of Hydrogen Energy in press (2010).
113. Q.S. Zhang, A. Hirano, N. Imanishi, Y. Takeda and K. Yamahara, Journal of Fuel Cell Science and Technology 6 (2009) (1).
114. P. Shuk, H.D. Wiemhofer, U. Guth, W. Gopel and M. Greenblatt, Solid State Ionics 89 (1996) (3-4), p. 179.

182
BIOGRAPHICAL SKETCH
Kang Taek Lee was born in Seoul Korea in 1976. After graduating from Saehwa
High School in Seoul, Korea, He started his campus life at Yonsei University in Korea
with Ceramic Engineering major. During his studies, he was enlisted in the Republic of
Korea Army for a general soldier in the department of biological and chemical weapon.
After that, he came back to the Yonsei University and finished his course work and
received his Bachelor of Science degree, in August 2002. His enthusiasm for materials
science drove him to enter the graduate school at Korea Institute of Advanced Science
and Engineering (KAIST) in Korea. After 2 years, he received the master’s degree and
worked at LG electronics for one and half years. In 2006, he moved to the U.S. and
entered University of Florida at the department of materials science and engineering.
He joined in Dr. Wachsman’s group, and finally received his Ph.D in August of 2010.