Embed Size (px)
Citation preview
DOT HS 812 225 December 2015
Acoustic Data for Hybrid and Electric Heavy-Duty Vehicles and Electric Motorcycles
Disclaimer
This publication is distributed by the U.S. Department of Transportation, National Highway Traffic Safety Administration, in the interest of information exchange. The opinions, findings, and conclusions expressed in this publication are those of the authors and not necessarily those of the Department of Transportation or the National Highway Traffic Safety Administration. The United States Government assumes no liability for its contents or use thereof. If trade or manufacturers’ names or products are mentioned, it is because they are considered essential to the object of the publication and should not be construed as an endorsement. The United States Government does not endorse products or manufacturers.
Suggested APA Format Citation: Hastings, A., Ahearn, M., Guthy-McInnis, C., Riley Garrott, R., & Garay-Vega, L. (2015, December).
Acoustic data for hybrid and electric heavy-duty vehicles and electric motorcycles. (Report No. DOT HS 812 225). Washington, DC: National Highway Traffic Safety Administration.
i
TECHNICAL REPORT DOCUMENTATION PAGE
1. Report No. DOT HS 812 225
2. Government Accession No. 3. Recipient's Catalog No.
4. Title and Subtitle Acoustic Data for Hybrid and Electric Heavy-Duty Vehicles and Electric Motorcycles
5. Report Date
December 2015
6. Authors Aaron Hastings; Meghan Ahearn; Catherine Guthy-McInnis –John A. Volpe National Transportation Systems Center; Riley Garrott –NHTSA’s Vehicle Research and Test Center; Lisandra Garay-Vega –NHTSA Vehicle Safety Research
7. Performing Organization Code
8. Performing Organization Report No.
9. Performing Organization Name and Address Volpe National Transportation Systems Center 55 Broadway Cambridge, MA 02142
10. Work Unit No. (TRAIS)
11. Contract or Grant No.
12. Sponsoring Agency Name and Address National Highway Traffic Safety Administration 1200 New Jersey Avenue SE. Washington, DC 20590
13. Type of Report and Period Covered
14. Sponsoring Agency Code NHTSA/NVS-300
15. Supplementary Notes The authors acknowledge data collection support from NHTSA’s Vehicle Research and Test Center (VRTC); the Transportation Research Center (TRC); and the NHTSA Quiet Vehicles Team.
16. Abstract
The Pedestrian Safety Enhancement Act (PSEA) of 2010 requires NHTSA to conduct a rulemaking to establish a Federal Motor Vehicle Safety Standard requiring an alert sound for pedestrians to be emitted by all types of motor vehicles that are electric or hybrid. NHTSA completed acoustic measurements for hybrid and electric heavy-duty vehicles (gross vehicle weight rating over 10,000 lb.) and for electric motorcycles. This acoustic data analysis was conducted to support activities related to the PSEA.
The measurements protocol used follows general procedures in SAE J 2889/1, Measurement of Minimum Noise Emitted by Road Vehicles, May 2012. Two electric motorcycles were tested at the Transportation Research Center in Columbus, Ohio. The test surface conforms to ISO 10844:2011 specifications. One electric vehicle delivery truck was tested at Navistar’s Fort Wayne, Indiana, proving grounds. The test surface conforms to an ISO 10844:1994 surface that is suitable for heavy vehicles.
In addition, screening data for four hybrid and electric heavy-duty vehicles were collected. The purpose of screening test was to obtain raw descriptions of the sound characteristics for a subset of heavy-duty vehicles. The measurements protocol used for the screening tests follows general procedures in SAE J 2889/1, Measurement of Minimum Noise Emitted by Road Vehicles. However the measurement protocol used for screening tests does not fulfill all the parameters stated in SAE J 2889/1. Several aspects are different, including the acoustic environment, operating conditions, test surface, number of microphones, and microphone position. Therefore the results obtained may deviate appreciably from the results obtained using specified conditions.
17. Key Words Pedestrian Safety Enhancement Act of 2010, PSEA, SAE J 2889/1, ISO 362, ISO 10844, electric vehicle, hybrid vehicle
18. Distribution Statement Document is available to the public from the National Technical Information Service www.ntis.gov
19. Security Classify. (of this report)
Unclassified
20. Security Classif. (of this page)
Unclassified
21. No. of Pages
31
22. Price
Form DOT F 1700.7 (8-72) Reproduction of completed page authorized
ii
TABLE OF CONTENTS
I. Introduction ..................................................................................................................................... 1
II. Crash Data for Motorcycles and Heavy Vehicles ............................................................................... 1
Low-Speed Crashes Involving Pedestrians ................................................................................................... 1
Pedestrians Injured by Crash Year and Vehicle Type .................................................................................... 2
III. Acoustic Measurements ................................................................................................................... 3
Test Methods ............................................................................................................................................... 3
Start-Up ................................................................................................................................................... 3
Stationary ................................................................................................................................................ 3
Constant Speed Pass-By ........................................................................................................................... 3
Acceleration ............................................................................................................................................. 3
Deceleration ............................................................................................................................................ 3
Test Vehicles ................................................................................................................................................ 4
Electric Motorcycles ................................................................................................................................ 4
Heavy Vehicles ......................................................................................................................................... 4
Test Facilities ............................................................................................................................................... 6
TRC ISO 10844 Surface ............................................................................................................................ 6
Navistar ISO 10844 Surface ..................................................................................................................... 7
Data Analysis and Results ............................................................................................................................ 7
Corrections for Background Noise ........................................................................................................... 7
Electric Motorcycles ................................................................................................................................ 8
Electric Heavy Vehicle ............................................................................................................................ 12
IV. Other Screening Tests .................................................................................................................... 15
Test Methods ............................................................................................................................................. 15
Test Vehicles .............................................................................................................................................. 15
Dayton Transit Hybrid Bus ..................................................................................................................... 15
Dayton Transit Electric Trolley ............................................................................................................... 15
2013 New Flyer Allison Xcelsior XDE40 (Diesel-Electric) ........................................................................ 16
Neoplan AN440LF (Electric Trackless Trolley) ........................................................................................ 16
Data Analysis and Results .......................................................................................................................... 16
iii
V. Summary ....................................................................................................................................... 20
Crash Data ................................................................................................................................................. 20
Acoustic Data ............................................................................................................................................. 20
VI. References ..................................................................................................................................... 21
Appendix A: Acoustic Data for Electric Motorcycles ............................................................................... 22
Appendix B: Acoustic Data for Electric Heavy Vehicle ............................................................................. 23
Appendix C: Screening Data for Electric and Hybrid Heavy Vehicles ........................................................ 24
iv
LIST OF TABLES
Table 1. Crash Data for Light-Duty Vehicles, Motorcycles, and Heavy-Duty Vehicles ....................................... 2 Table 2. Estimate of Pedestrians Injured in Motor Vehicle Traffic Crashes by Crash Year and
Striking Vehicle Type General Estimates System 2000-2011 ............................................................... 2 Table 3. A-Weighted Sound Levels, Electric Motorcycles (corrected for minimum ambient) ......................... 22 Table 4. A-Weighted Sound Levels, Electric Heavy Truck (corrected for minimum ambient) ......................... 23 Table 5. A-Weighted Sound Pressure Levels for Electric and Hybrid Heavy Vehicles for
One-Third Octave Bands in the NPRM14 15 ...................................................................................... 24
LIST OF FIGURES
Figure 1. Pass-By Microphone Locations ........................................................................................................... 4 Figure 2. 2012 Brammo Enertia Electric Motorcycle Tested ............................................................................. 5 Figure 3. 2012 Zero S Electric Motorcycle Tested ............................................................................................. 5 Figure 4. TRC Test Facility .................................................................................................................................. 6 Figure 5. TRC ISO 10844 Surface ....................................................................................................................... 6 Figure 6. Navistar Fort Wayne Noise Test Facility ............................................................................................. 7 Figure 7. Navistar Fort Wayne ISO 10844 Surface ............................................................................................. 7 Figure 8. Correction for Background Noise in NHTSA’s Proposed Rulemaking, January 14, 2013 .................... 8 Figure 9. One-Third Octave Band Levels for 2012 Brammo Enertia at 10 km/h ................................................ 9 Figure 10. One-Third Octave Band Levels for 2012 Brammo Enertia at 20 km/h ............................................. 9 Figure 11. One-Third Octave Band Levels for 2012 Brammo Enertia at 30 km/h ........................................... 10 Figure 12. One-Third Octave Band Levels for 2012 Zero S at 10 km/h ............................................................ 10 Figure 13. One-Third Octave Band Levels for 2012 Zero S at 20 km/h ............................................................ 11 Figure 14. One-Third Octave Band Levels for 2012 Zero S at 30 km/h ............................................................ 11 Figure 15. Overall Sound Pressure Level for Electric Motorcycles Tested ....................................................... 12 Figure 16. One-Third Octave Band Levels for Navistar eStar at 0 km/h .......................................................... 13 Figure 17. One-Third Octave Band Levels for Navistar eStar at 10 km/h ........................................................ 13 Figure 18. One-Third Octave Band Levels for Navistar eStar at 20 km/h ........................................................ 14 Figure 19. One-Third Octave Band Levels for Navistar eStar at 30 km/h ........................................................ 14 Figure 20. One-Third Octave Band Levels for Heavy Vehicles Screened at Stationary .................................... 17 Figure 21. One-Third Octave Band Levels for Heavy Vehicles Screened at 10 km/h ....................................... 17 Figure 22. One-Third Octave Band Levels for Heavy Vehicles Screened at 20 km/h ....................................... 18 Figure 23. One-Third Octave Band Levels for Heavy Vehicles Screened at 30 km/h ....................................... 18 Figure 24. Overall Sound Pressure Level for Heavy-Duty Vehicles Screened. (Data not
available for some vehicle-scenario combinations) ....................................................................... 19
1
I. Introduction
The research presented in this report supports the Pedestrian Safety Enhancement Act (PSEA) of 2010. The purpose of this research was to conduct a thorough investigation into the growing industry of hybrid/electric-propelled vehicles (passenger automobiles, commercial trucks, buses, motorcycles, electric scooters, recreational vehicles, etc.) and the sound pressure level (SPL) emitted. PSEA requires NHTSA to conduct a rulemaking to establish a Federal Motor Vehicle Safety Standard (FMVSS) requiring an alert sound to be emitted by all types of motor vehicles that are electric or hybrid (EVs and HVs) for pedestrian safety. The goal is to establish performance requirements for an alert sound that allows blind and other pedestrians to reasonably detect a nearby electric or hybrid vehicle (Public Law 111-373, 124 Stat 4086, 2011).
NHTSA’s Notice of Proposed Rulemaking (DOT Docket No. NHTSA-2011-0148-0075) proposes that the acoustic specifications apply to all hybrid and electric motor vehicles covered by the PSEA, including all hybrid and electric passenger cars, multipurpose vehicles, trucks, buses, low-speed vehicles, and motorcycles.1
This report includes an overview of crashes involving pedestrians and an estimate of pedestrians injured in motor vehicle crashes by crash year and striking vehicle type. The report then focuses on acoustic measurements for two electric motorcycles and one electric heavy-duty vehicle (delivery truck). The measurements protocol follows general procedures in SAE J 2889/1, Measurement of Minimum Noise Emitted by Road Vehicles. These measurements were completed on ISO 10844 certified test surfaces. Screening tests were also completed to obtain a raw description of the sound characteristics for a subset of hybrid and electric heavy-duty vehicles, and are documented in this report. The measurements protocol used for the screening tests follows general procedures in SAE J 2889/1 with several differences including the acoustic environment, operating conditions, test surface, number of microphones, and microphone position. Since the screening test does not fulfill all the parameters of SAE J 2889/1, the results obtained may deviate appreciably from the results obtained using specified conditions and should be considered illustrative. Even though the screening tests deviate from the SAE J 2889/1 guidance, they provide information related to general levels, sound sources, and operations that may need augmentation.
II. Crash Data for Motorcycles and Heavy Vehicles
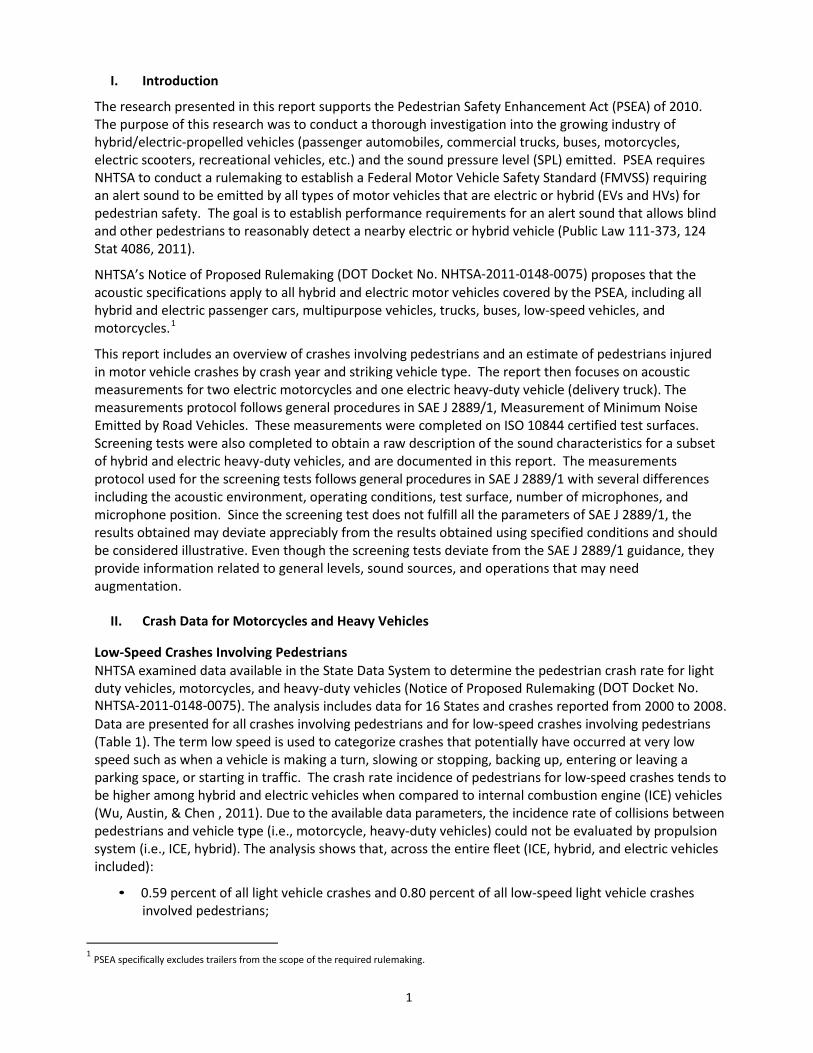
Low-Speed Crashes Involving Pedestrians NHTSA examined data available in the State Data System to determine the pedestrian crash rate for light duty vehicles, motorcycles, and heavy-duty vehicles (Notice of Proposed Rulemaking (DOT Docket No. NHTSA-2011-0148-0075). The analysis includes data for 16 States and crashes reported from 2000 to 2008. Data are presented for all crashes involving pedestrians and for low-speed crashes involving pedestrians (Table 1). The term low speed is used to categorize crashes that potentially have occurred at very low speed such as when a vehicle is making a turn, slowing or stopping, backing up, entering or leaving a parking space, or starting in traffic. The crash rate incidence of pedestrians for low-speed crashes tends to be higher among hybrid and electric vehicles when compared to internal combustion engine (ICE) vehicles (Wu, Austin, & Chen , 2011). Due to the available data parameters, the incidence rate of collisions between pedestrians and vehicle type (i.e., motorcycle, heavy-duty vehicles) could not be evaluated by propulsion system (i.e., ICE, hybrid). The analysis shows that, across the entire fleet (ICE, hybrid, and electric vehicles included):
• 0.59 percent of all light vehicle crashes and 0.80 percent of all low-speed light vehicle crashes involved pedestrians;
1 PSEA specifically excludes trailers from the scope of the required rulemaking.
2
• 0.44 percent of all motorcycle crashes and 0.27 percent of all motorcycle crashes at low speeds involved pedestrians; and
• 0.30 percent of all heavy-duty vehicle crashes and 0.42 percent of all heavy-duty vehicle crashes at low speeds involved pedestrians.
Table 1. Crash Data for Light-Duty Vehicles, Motorcycles, and Heavy-Duty Vehicles Data Element Light-Duty
Vehicles Motorcycles Heavy-Duty
Vehicles % of all crashes involving pedestrians 0.59 0.44 0.30 % of low-speed crashes involving pedestrians 0.80 0.27 0.42
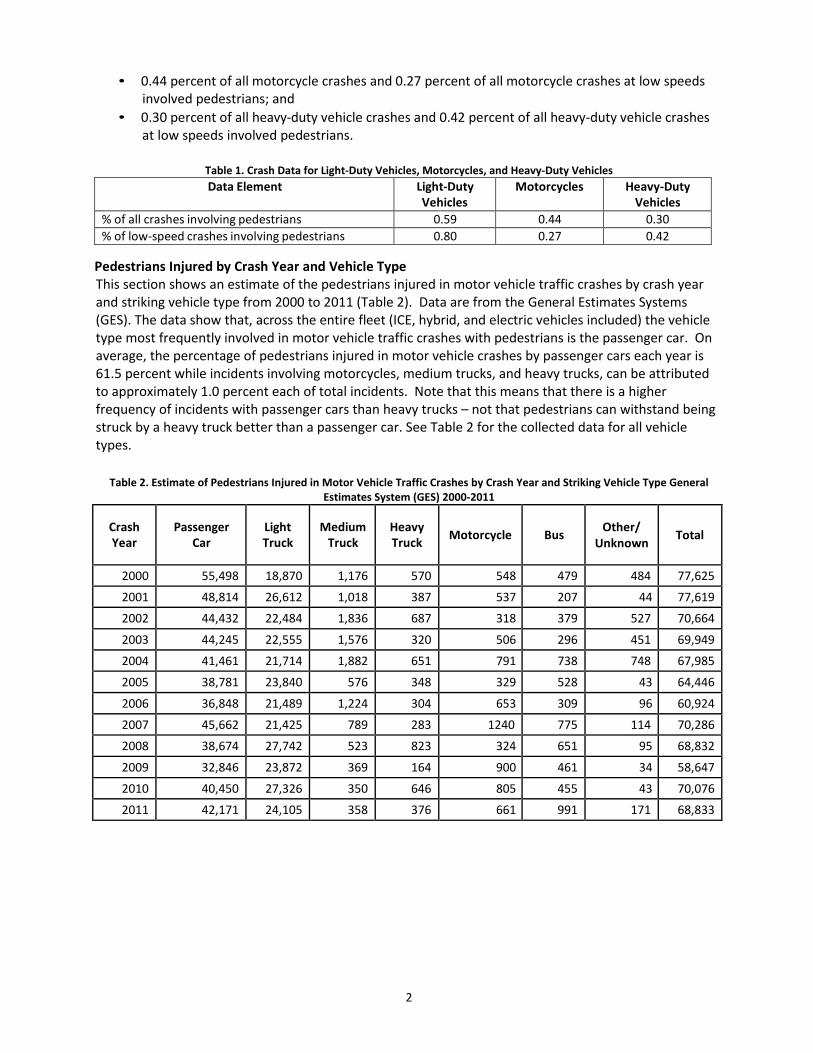
Pedestrians Injured by Crash Year and Vehicle Type This section shows an estimate of the pedestrians injured in motor vehicle traffic crashes by crash year and striking vehicle type from 2000 to 2011 (Table 2). Data are from the General Estimates Systems (GES). The data show that, across the entire fleet (ICE, hybrid, and electric vehicles included) the vehicle type most frequently involved in motor vehicle traffic crashes with pedestrians is the passenger car. On average, the percentage of pedestrians injured in motor vehicle crashes by passenger cars each year is 61.5 percent while incidents involving motorcycles, medium trucks, and heavy trucks, can be attributed to approximately 1.0 percent each of total incidents. Note that this means that there is a higher frequency of incidents with passenger cars than heavy trucks – not that pedestrians can withstand being struck by a heavy truck better than a passenger car. See Table 2 for the collected data for all vehicle types.
Table 2. Estimate of Pedestrians Injured in Motor Vehicle Traffic Crashes by Crash Year and Striking Vehicle Type General Estimates System (GES) 2000-2011
Crash Year
Passenger
Car
Light Truck
Medium
Truck
Heavy Truck
Motorcycle
Bus
Other/
Unknown
Total
2000 55,498 18,870 1,176 570 548 479 484 77,625
2001 48,814 26,612 1,018 387 537 207 44 77,619
2002 44,432 22,484 1,836 687 318 379 527 70,664
2003 44,245 22,555 1,576 320 506 296 451 69,949
2004 41,461 21,714 1,882 651 791 738 748 67,985
2005 38,781 23,840 576 348 329 528 43 64,446
2006 36,848 21,489 1,224 304 653 309 96 60,924
2007 45,662 21,425 789 283 1240 775 114 70,286
2008 38,674 27,742 523 823 324 651 95 68,832
2009 32,846 23,872 369 164 900 461 34 58,647
2010 40,450 27,326 350 646 805 455 43 70,076
2011 42,171 24,105 358 376 661 991 171 68,833
3
III. Acoustic Measurements
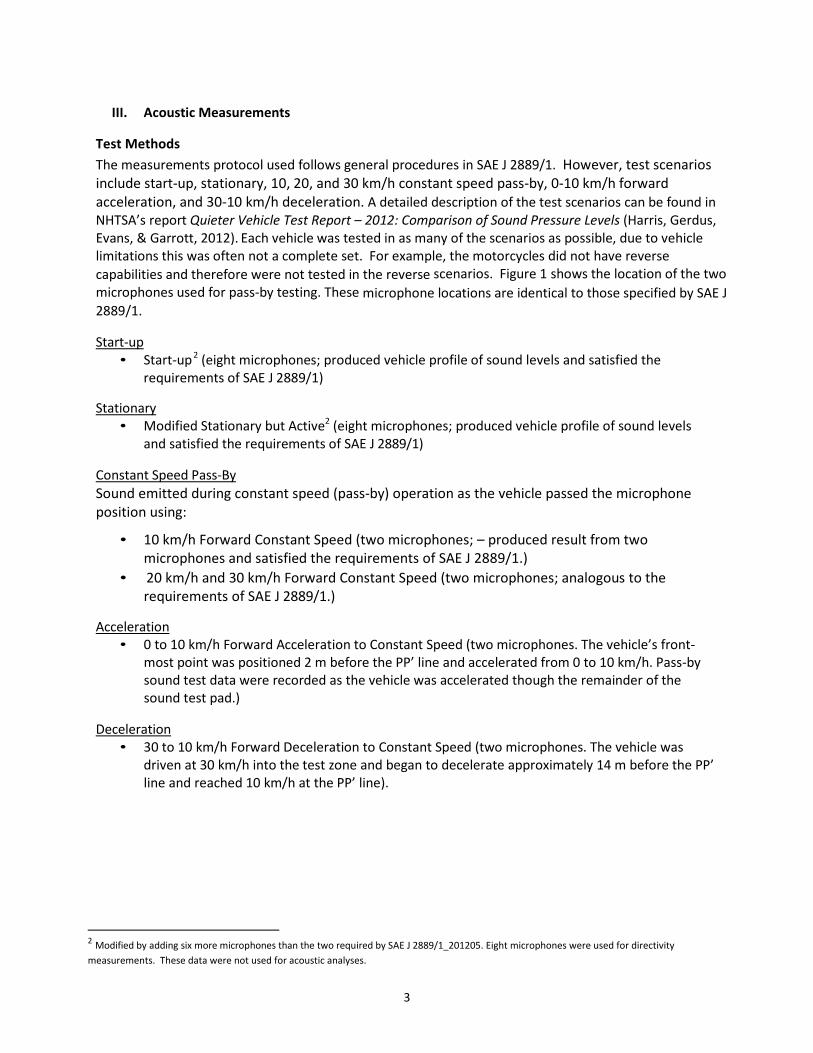
Test Methods The measurements protocol used follows general procedures in SAE J 2889/1. However, test scenarios include start-up, stationary, 10, 20, and 30 km/h constant speed pass-by, 0-10 km/h forward acceleration, and 30-10 km/h deceleration. A detailed description of the test scenarios can be found in NHTSA’s report Quieter Vehicle Test Report – 2012: Comparison of Sound Pressure Levels (Harris, Gerdus, Evans, & Garrott, 2012). Each vehicle was tested in as many of the scenarios as possible, due to vehicle limitations this was often not a complete set. For example, the motorcycles did not have reverse capabilities and therefore were not tested in the reverse scenarios. Figure 1 shows the location of the two microphones used for pass-by testing. These microphone locations are identical to those specified by SAE J 2889/1.
Start-up
• Start-up2 (eight microphones; produced vehicle profile of sound levels and satisfied the requirements of SAE J 2889/1)
Stationary
• Modified Stationary but Active2 (eight microphones; produced vehicle profile of sound levels and satisfied the requirements of SAE J 2889/1)
Constant Speed Pass-By Sound emitted during constant speed (pass-by) operation as the vehicle passed the microphone position using:
• 10 km/h Forward Constant Speed (two microphones; – produced result from two microphones and satisfied the requirements of SAE J 2889/1.)
• 20 km/h and 30 km/h Forward Constant Speed (two microphones; analogous to the requirements of SAE J 2889/1.)
Acceleration
• 0 to 10 km/h Forward Acceleration to Constant Speed (two microphones. The vehicle’s front- most point was positioned 2 m before the PP’ line and accelerated from 0 to 10 km/h. Pass-by sound test data were recorded as the vehicle was accelerated though the remainder of the sound test pad.)
Deceleration
• 30 to 10 km/h Forward Deceleration to Constant Speed (two microphones. The vehicle was driven at 30 km/h into the test zone and began to decelerate approximately 14 m before the PP’ line and reached 10 km/h at the PP’ line).
2 Modified by adding six more microphones than the two required by SAE J 2889/1_201205. Eight microphones were used for directivity measurements. These data were not used for acoustic analyses.
4
Figure 1. Pass-by Microphone Locations (Hastings, Pollard, Garay-Vega, Stearns, & Guthy, 2011)
Test Vehicles Below is a list of the motorcycles and heavy vehicles that were tested. For each of the vehicles a test date and list of scenarios tested are given. Other hybrid and electric heavy-duty vehicles (e.g., different size, configuration) were not available for this test because heavy electric vehicles were difficult to find and procure for testing.
Electric Motorcycles
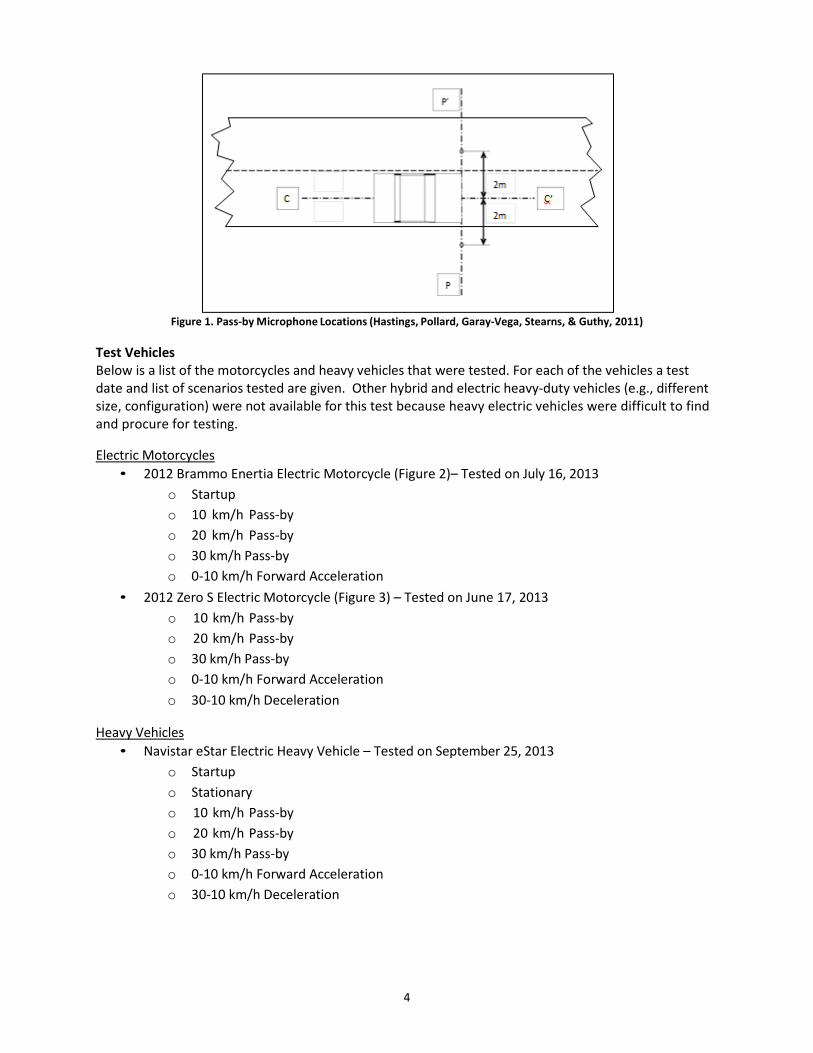
• 2012 Brammo Enertia Electric Motorcycle (Figure 2)– Tested on July 16, 2013 o Startup o 10 km/h Pass-by o 20 km/h Pass-by o 30 km/h Pass-by o 0-10 km/h Forward Acceleration
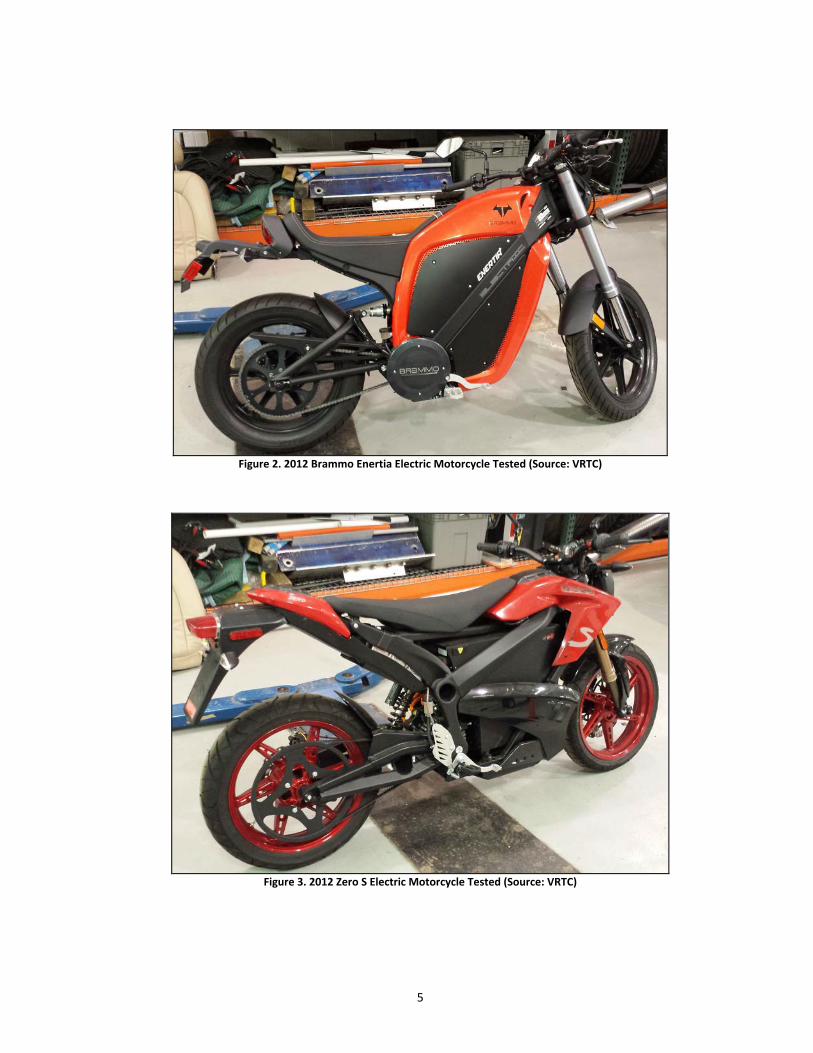
• 2012 Zero S Electric Motorcycle (Figure 3) – Tested on June 17, 2013 o 10 km/h Pass-by o 20 km/h Pass-by o 30 km/h Pass-by o 0-10 km/h Forward Acceleration o 30-10 km/h Deceleration
Heavy Vehicles
• Navistar eStar Electric Heavy Vehicle – Tested on September 25, 2013 o Startup o Stationary o 10 km/h Pass-by o 20 km/h Pass-by o 30 km/h Pass-by o 0-10 km/h Forward Acceleration o 30-10 km/h Deceleration
5
Figure 2. 2012 Brammo Enertia Electric Motorcycle Tested (Source: VRTC)
Figure 3. 2012 Zero S Electric Motorcycle Tested (Source: VRTC)
6
Test Facilities Test surfaces conform to ISO 10844:2011 and ISO 10844:1994 specifications.3
• Motorcycles measurements were conducted at the Transportation Research Center (TRC) in Columbus, Ohio.
• Heavy vehicle measurements were conducted at the Navistar proving grounds in Fort Wayne, Indiana.
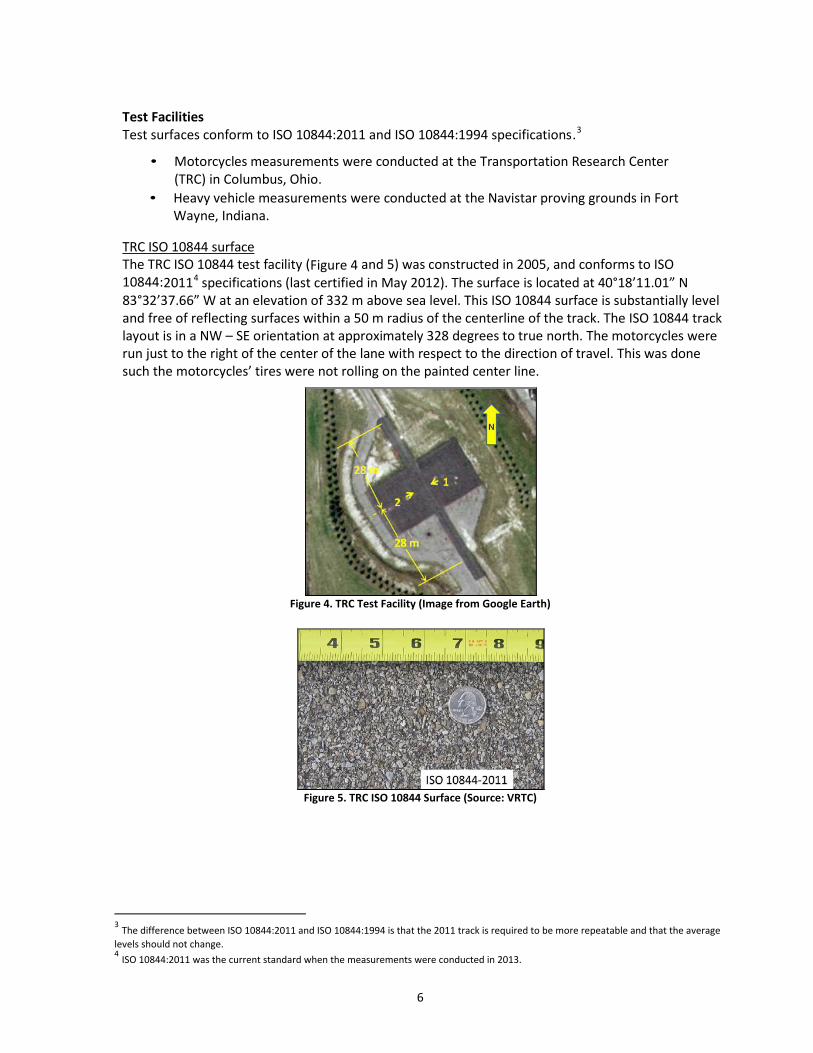
TRC ISO 10844 surface The TRC ISO 10844 test facility (Figure 4 and 5) was constructed in 2005, and conforms to ISO 10844:20114 specifications (last certified in May 2012). The surface is located at 40°18’11.01” N 83°32’37.66” W at an elevation of 332 m above sea level. This ISO 10844 surface is substantially level and free of reflecting surfaces within a 50 m radius of the centerline of the track. The ISO 10844 track layout is in a NW – SE orientation at approximately 328 degrees to true north. The motorcycles were run just to the right of the center of the lane with respect to the direction of travel. This was done such the motorcycles’ tires were not rolling on the painted center line.
Figure 4. TRC Test Facility (Image from Google Earth)
Figure 5. TRC ISO 10844 Surface (Source: VRTC)
3 The difference between ISO 10844:2011 and ISO 10844:1994 is that the 2011 track is required to be more repeatable and that the average levels should not change. 4 ISO 10844:2011 was the current standard when the measurements were conducted in 2013.
7
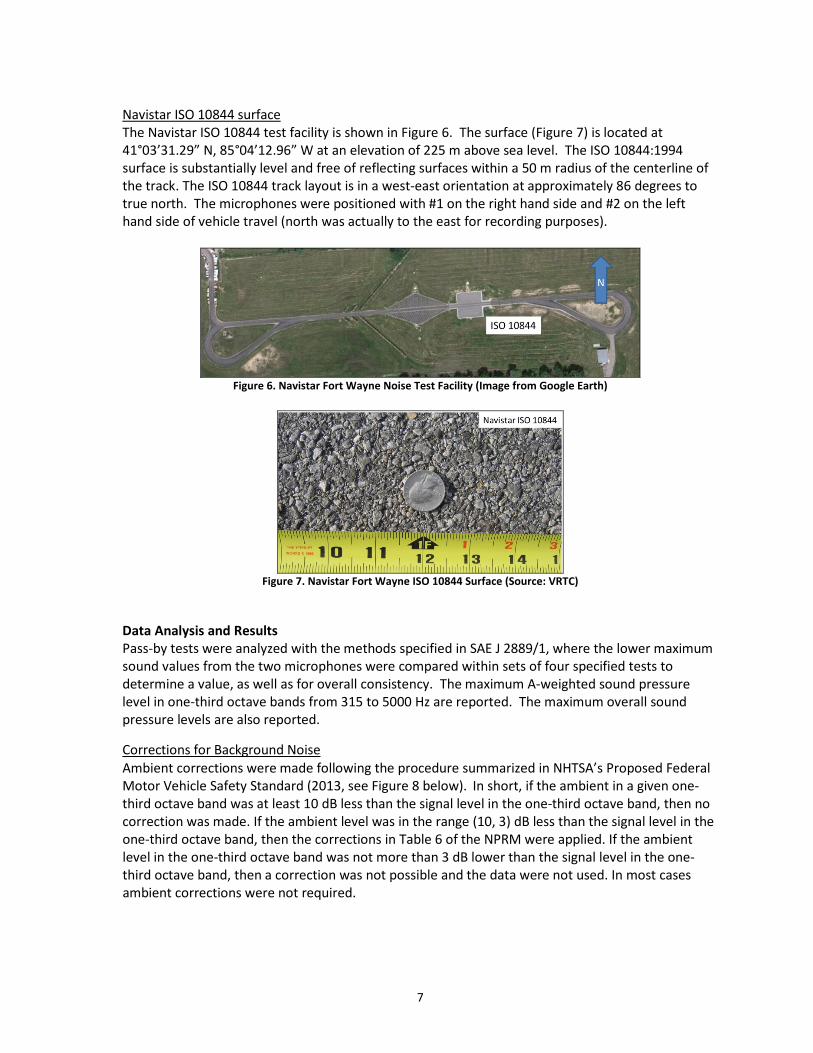
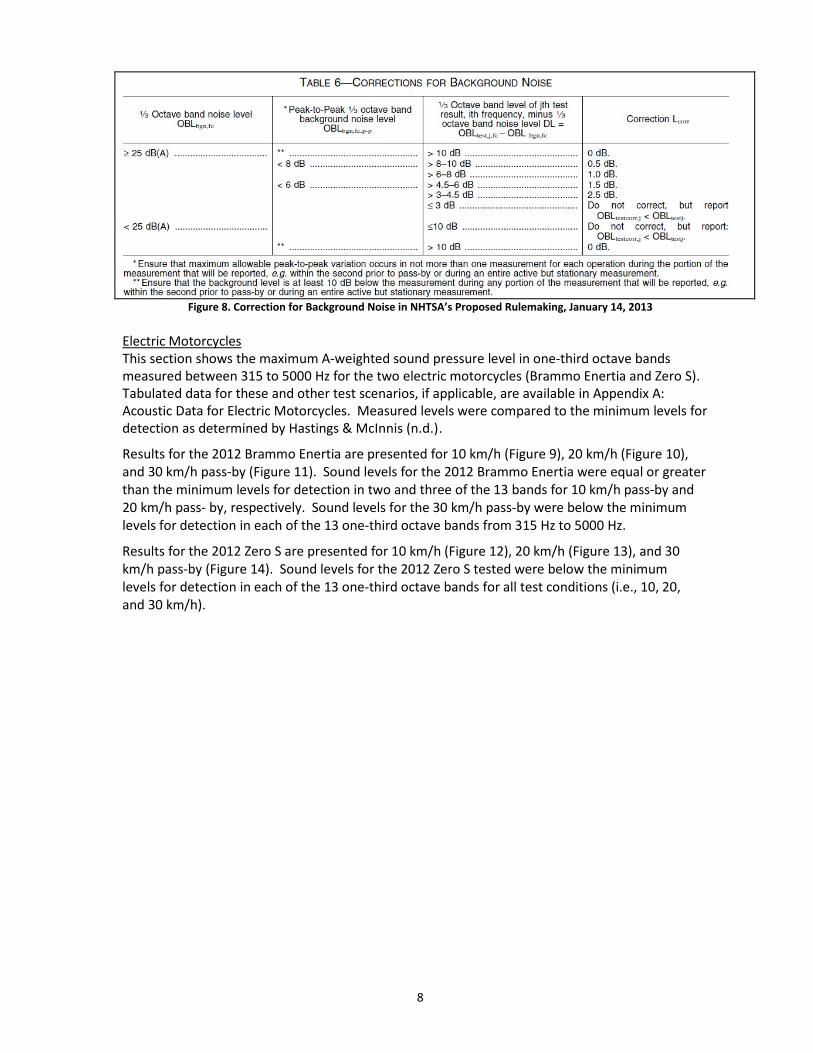
Navistar ISO 10844 surface The Navistar ISO 10844 test facility is shown in Figure 6. The surface (Figure 7) is located at 41°03’31.29” N, 85°04’12.96” W at an elevation of 225 m above sea level. The ISO 10844:1994 surface is substantially level and free of reflecting surfaces within a 50 m radius of the centerline of the track. The ISO 10844 track layout is in a west-east orientation at approximately 86 degrees to true north. The microphones were positioned with #1 on the right hand side and #2 on the left hand side of vehicle travel (north was actually to the east for recording purposes).
Figure 6. Navistar Fort Wayne Noise Test Facility (Image from Google Earth)
Figure 7. Navistar Fort Wayne ISO 10844 Surface (Source: VRTC)
Data Analysis and Results Pass-by tests were analyzed with the methods specified in SAE J 2889/1, where the lower maximum sound values from the two microphones were compared within sets of four specified tests to determine a value, as well as for overall consistency. The maximum A-weighted sound pressure level in one-third octave bands from 315 to 5000 Hz are reported. The maximum overall sound pressure levels are also reported.
Corrections for Background Noise Ambient corrections were made following the procedure summarized in NHTSA’s Proposed Federal Motor Vehicle Safety Standard (2013, see Figure 8 below). In short, if the ambient in a given one-third octave band was at least 10 dB less than the signal level in the one-third octave band, then no correction was made. If the ambient level was in the range (10, 3) dB less than the signal level in the one-third octave band, then the corrections in Table 6 of the NPRM were applied. If the ambient level in the one-third octave band was not more than 3 dB lower than the signal level in the one-third octave band, then a correction was not possible and the data were not used. In most cases ambient corrections were not required.
8
Figure 8. Correction for Background Noise in NHTSA’s Proposed Rulemaking, January 14, 2013
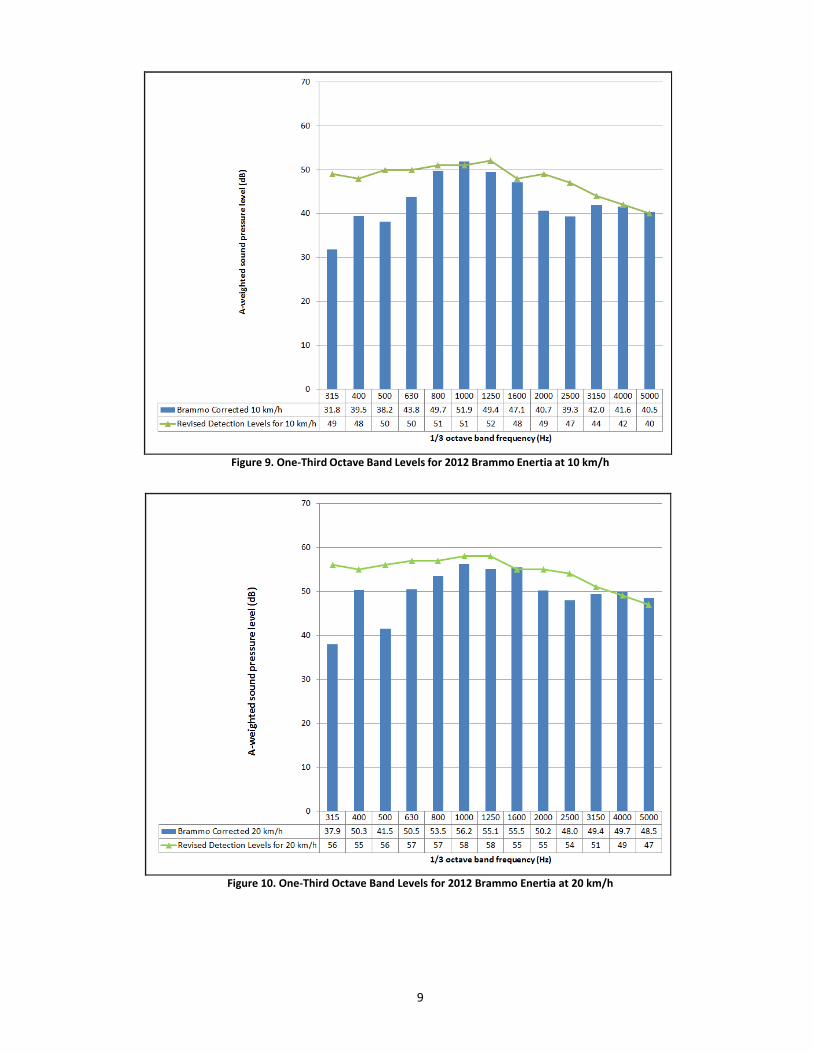
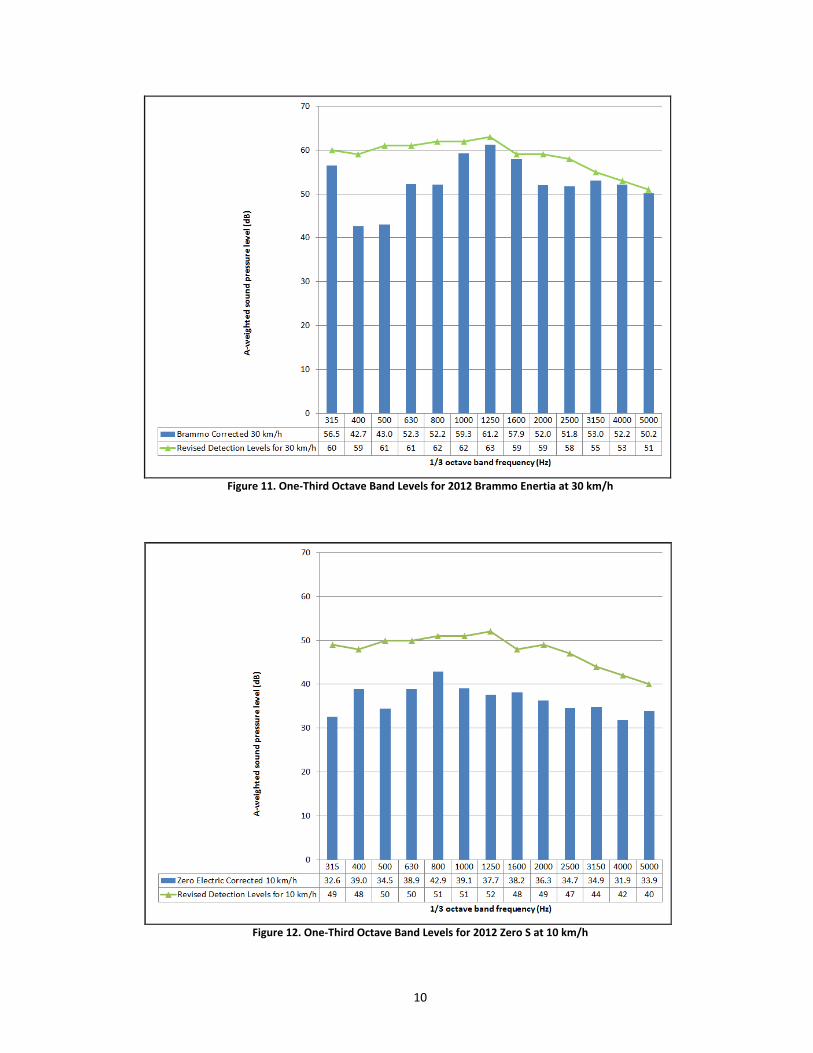
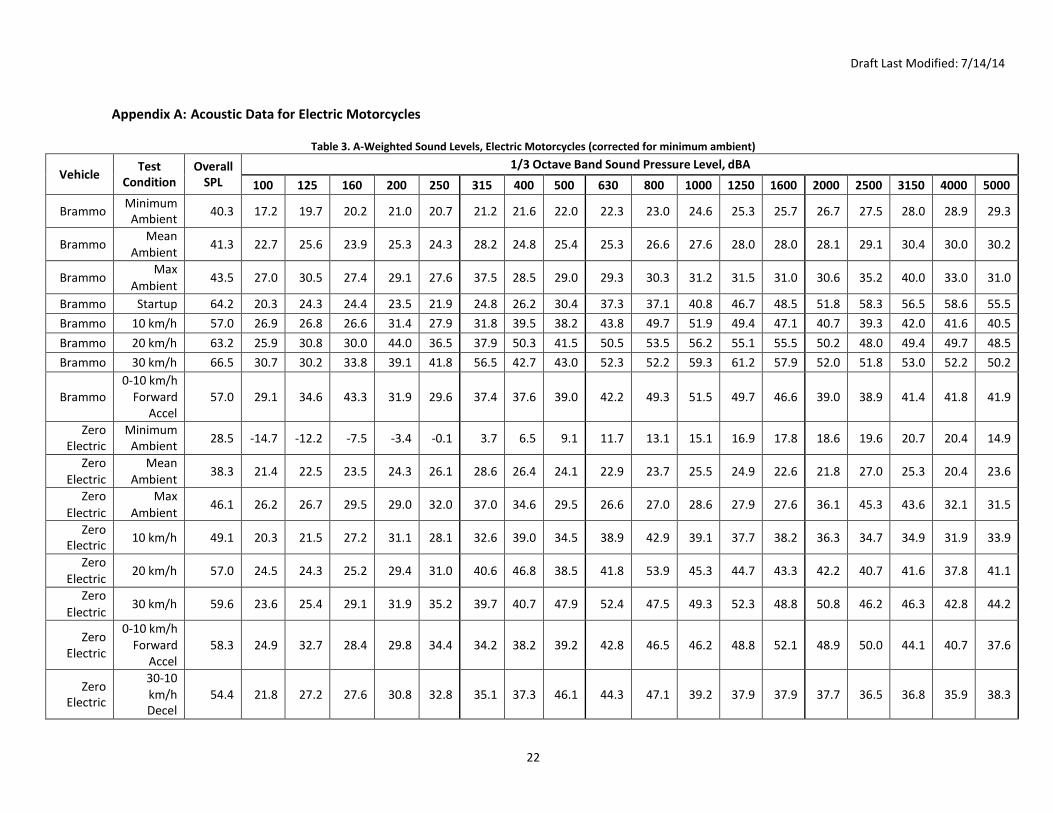
Electric Motorcycles This section shows the maximum A-weighted sound pressure level in one-third octave bands measured between 315 to 5000 Hz for the two electric motorcycles (Brammo Enertia and Zero S). Tabulated data for these and other test scenarios, if applicable, are available in Appendix A: Acoustic Data for Electric Motorcycles. Measured levels were compared to the minimum levels for detection as determined by Hastings & McInnis (n.d.).
Results for the 2012 Brammo Enertia are presented for 10 km/h (Figure 9), 20 km/h (Figure 10), and 30 km/h pass-by (Figure 11). Sound levels for the 2012 Brammo Enertia were equal or greater than the minimum levels for detection in two and three of the 13 bands for 10 km/h pass-by and 20 km/h pass- by, respectively. Sound levels for the 30 km/h pass-by were below the minimum levels for detection in each of the 13 one-third octave bands from 315 Hz to 5000 Hz.
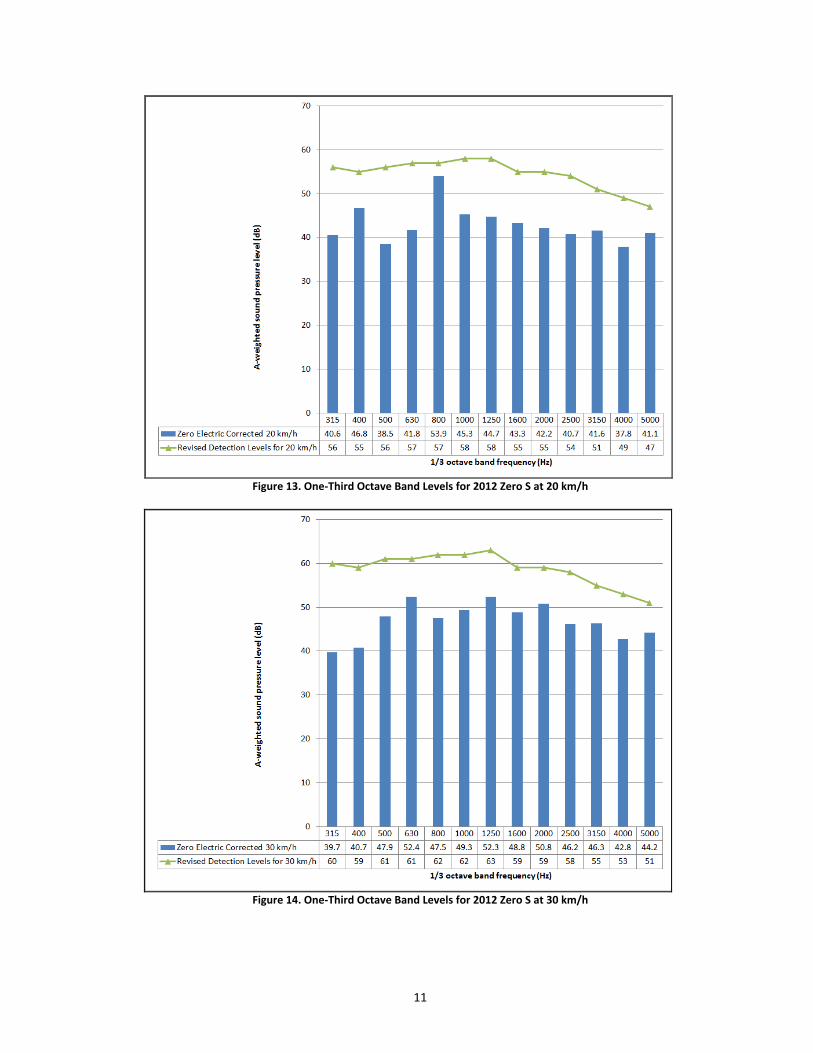
Results for the 2012 Zero S are presented for 10 km/h (Figure 12), 20 km/h (Figure 13), and 30 km/h pass-by (Figure 14). Sound levels for the 2012 Zero S tested were below the minimum levels for detection in each of the 13 one-third octave bands for all test conditions (i.e., 10, 20, and 30 km/h).
9
Figure 9. One-Third Octave Band Levels for 2012 Brammo Enertia at 10 km/h
Figure 10. One-Third Octave Band Levels for 2012 Brammo Enertia at 20 km/h
10
Figure 11. One-Third Octave Band Levels for 2012 Brammo Enertia at 30 km/h
Figure 12. One-Third Octave Band Levels for 2012 Zero S at 10 km/h
11
Figure 13. One-Third Octave Band Levels for 2012 Zero S at 20 km/h
Figure 14. One-Third Octave Band Levels for 2012 Zero S at 30 km/h
12
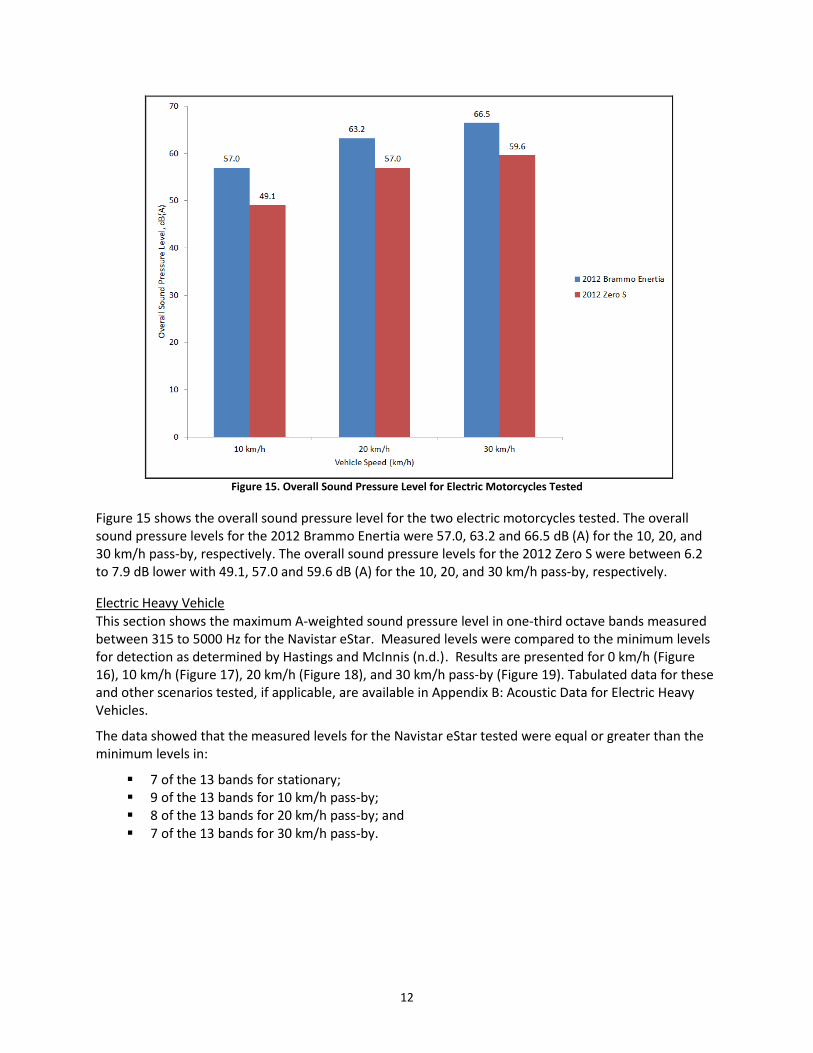
Figure 15. Overall Sound Pressure Level for Electric Motorcycles Tested
Figure 15 shows the overall sound pressure level for the two electric motorcycles tested. The overall sound pressure levels for the 2012 Brammo Enertia were 57.0, 63.2 and 66.5 dB (A) for the 10, 20, and 30 km/h pass-by, respectively. The overall sound pressure levels for the 2012 Zero S were between 6.2 to 7.9 dB lower with 49.1, 57.0 and 59.6 dB (A) for the 10, 20, and 30 km/h pass-by, respectively.
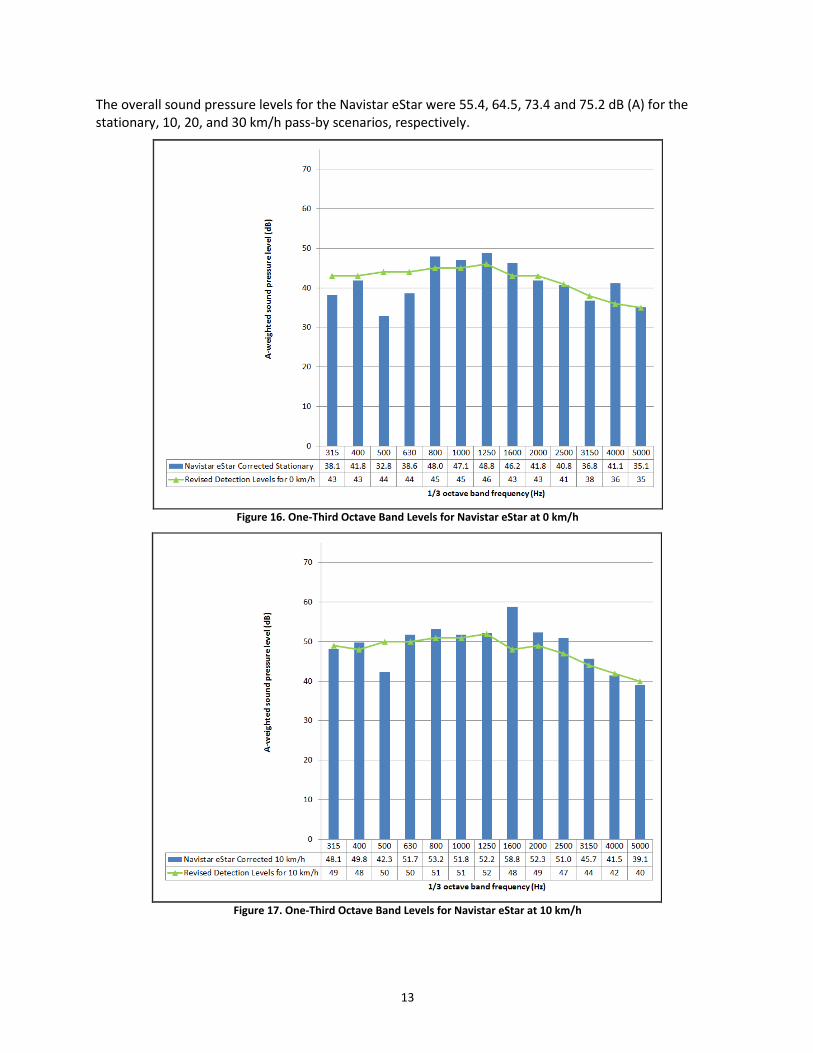
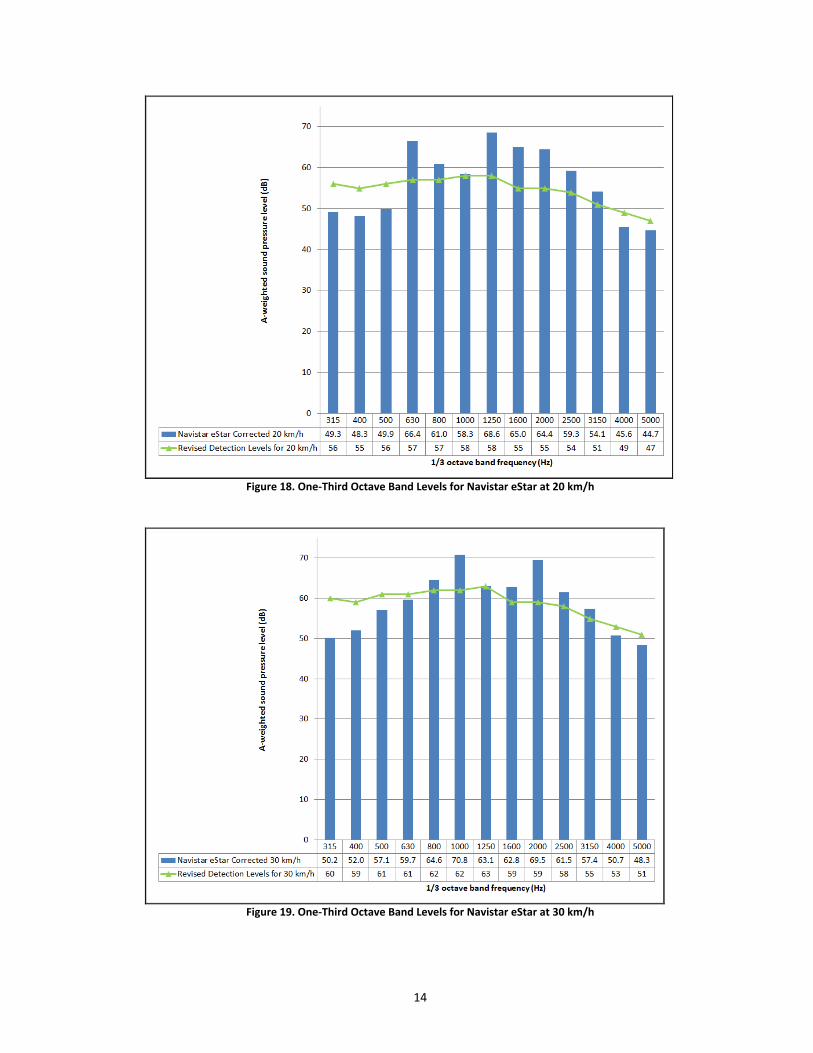
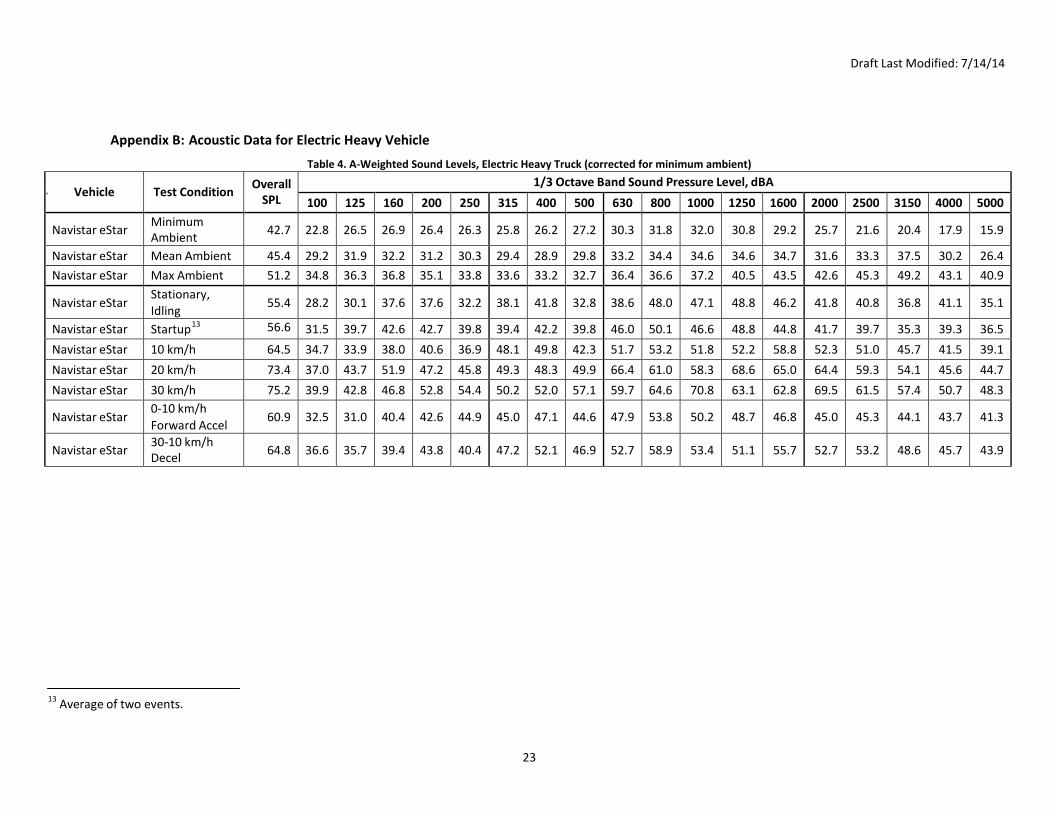
Electric Heavy Vehicle This section shows the maximum A-weighted sound pressure level in one-third octave bands measured between 315 to 5000 Hz for the Navistar eStar. Measured levels were compared to the minimum levels for detection as determined by Hastings and McInnis (n.d.). Results are presented for 0 km/h (Figure 16), 10 km/h (Figure 17), 20 km/h (Figure 18), and 30 km/h pass-by (Figure 19). Tabulated data for these and other scenarios tested, if applicable, are available in Appendix B: Acoustic Data for Electric Heavy Vehicles.
The data showed that the measured levels for the Navistar eStar tested were equal or greater than the minimum levels in:
7 of the 13 bands for stationary; 9 of the 13 bands for 10 km/h pass-by; 8 of the 13 bands for 20 km/h pass-by; and 7 of the 13 bands for 30 km/h pass-by.
13
The overall sound pressure levels for the Navistar eStar were 55.4, 64.5, 73.4 and 75.2 dB (A) for the stationary, 10, 20, and 30 km/h pass-by scenarios, respectively.
Figure 16. One-Third Octave Band Levels for Navistar eStar at 0 km/h
Figure 17. One-Third Octave Band Levels for Navistar eStar at 10 km/h
14
Figure 18. One-Third Octave Band Levels for Navistar eStar at 20 km/h
Figure 19. One-Third Octave Band Levels for Navistar eStar at 30 km/h
15
IV. Other Screening Tests
Test Methods Screening data were also collected. The purpose of screening tests was to obtain a rough estimate of the sound characteristics for a subset of heavy-duty vehicles. The measurements protocol used for the screening tests follows general procedures in SAE J 2889/1. The measurement protocol used does not fulfill all the parameters stated in SAE J 2889/1 and therefore the results obtained may deviate appreciably from the results obtained using specified conditions. This is because these vehicles could not be transported to sites that met the SAE ambient requirements. Several aspects are different including the acoustic environment, operating conditions, test surface, number of microphones, and microphone position.
Test Vehicles NHTSA collected data for four hybrid or electric heavy-duty vehicles at three locations: Dayton, Ohio; Washington, DC; and Cambridge, Massachusetts. A list of the vehicles, scenarios, and other relevant notes from the screening tests are given below. Each vehicle was tested in as many of the scenarios as possible, due to vehicle or site limitations this was often not a complete set.
Dayton Transit Hybrid Bus
Tested on: 7/24/2013 Site: Dayton, Ohio Scenarios: Stationary; 10 km/h pass-by; 20 km/h pass-by; 30 km/h pass-by Notes: The overall level and one-third octave levels were measured when the front bumper of
the bus passed the microphone (PP’) line. The maximum level was reached when the engine of the transit bus passed the PP’ line – about 1.5 to 4 seconds later depending on speed. The one- third octave values are uncorrected.
Dayton Transit Electric Trolley
Tested on: 7/30/2013 Site: Dayton, Ohio Scenarios: 10 km/h pass-by; 20 km/h pass-by; 10 km/h on battery power Notes: Due to testing location the Dayton Electric Trolley was run through a very limited set of
tests, also due to the testing location only one microphone was used. The overall level and one- third octave levels were measured when the front bumper of the motor of the trolley passed the microphone (PP’) line. The maximum level was reached when the engine of the transit bus or motor of the trolley passed the PP’ line – about 1.5 to 4 seconds later depending on speed. The trolley was measure on a public street in front of the Dayton Transit garage which imposed the following limitations:
• Trolley could only run past one way (E to W); • Could only use a single microphone on the edge of the curb, ~ 2.3 meters from the
centerline of travel lane; • Trolley could not reach 30 km/h between the switches on the overhead lines. Trolley
could only reach 10 km/h on battery backup.
16
• Only a few runs could be made since the trolley had to drive several blocks on city streets to return to the start position.
• Even with the noise of the city street background only the trolley on battery needed correction to the overall sound level. The one-third octave values are uncorrected.
2013 New Flyer Allison Xcelsior XDE40 (Diesel Electric)
Tested on: 8/8/2013 Site: Washington Metropolitan Area Transit Authority (WMTA), FedEx North Parking
Lot, Brightseat Road Scenarios: Stationary ; 10 km/h pass-by; 20 km/h pass-by; Reverse
Neoplan AN440LF (Electric Trackless Trolley)
Tested on: 11/20/2013 Site: MBTA Cambridge Bus Depot was shielded from road traffic but otherwise urban
ambient with slightly elevated high-frequency content. Scenarios: Stationary; 10 km/h pass-by Notes: Measurements could only be made at stationary and 10 km/h due to facility constraints. Ambient was sufficiently low that most measurements did not require corrections. Stationary measurements between 2500 and 4000 Hz required corrections. Stationary measurements at 5000 Hz could not be corrected.
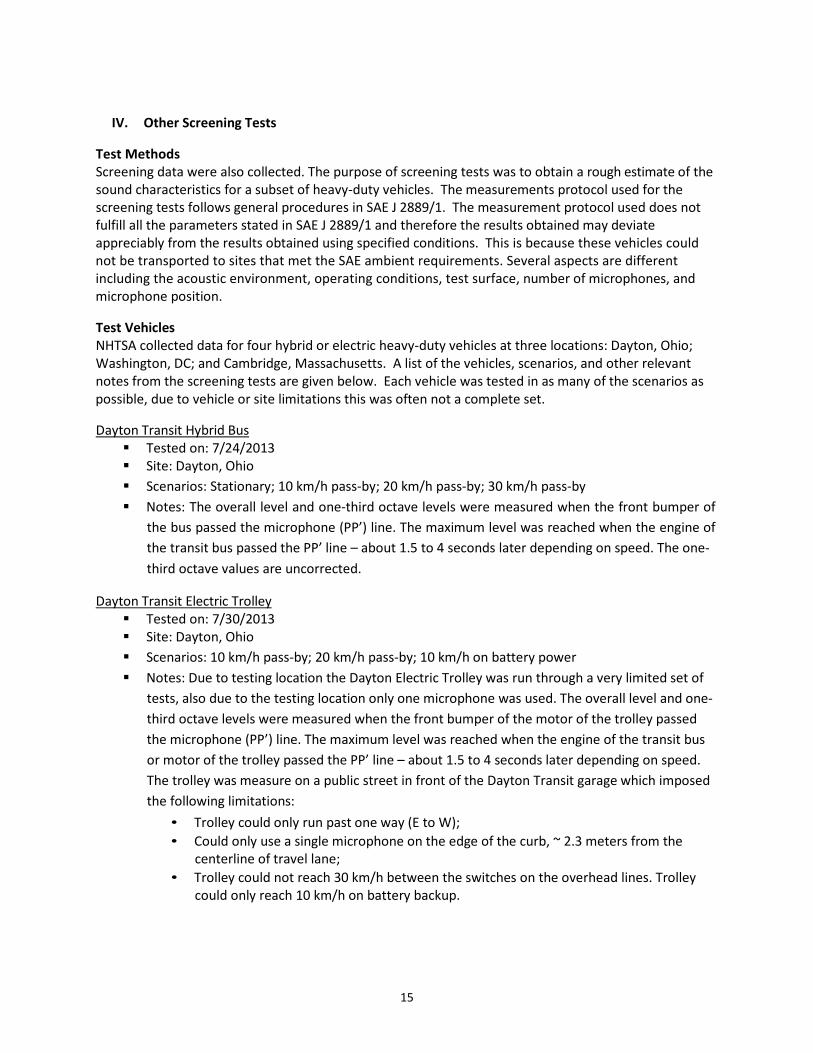
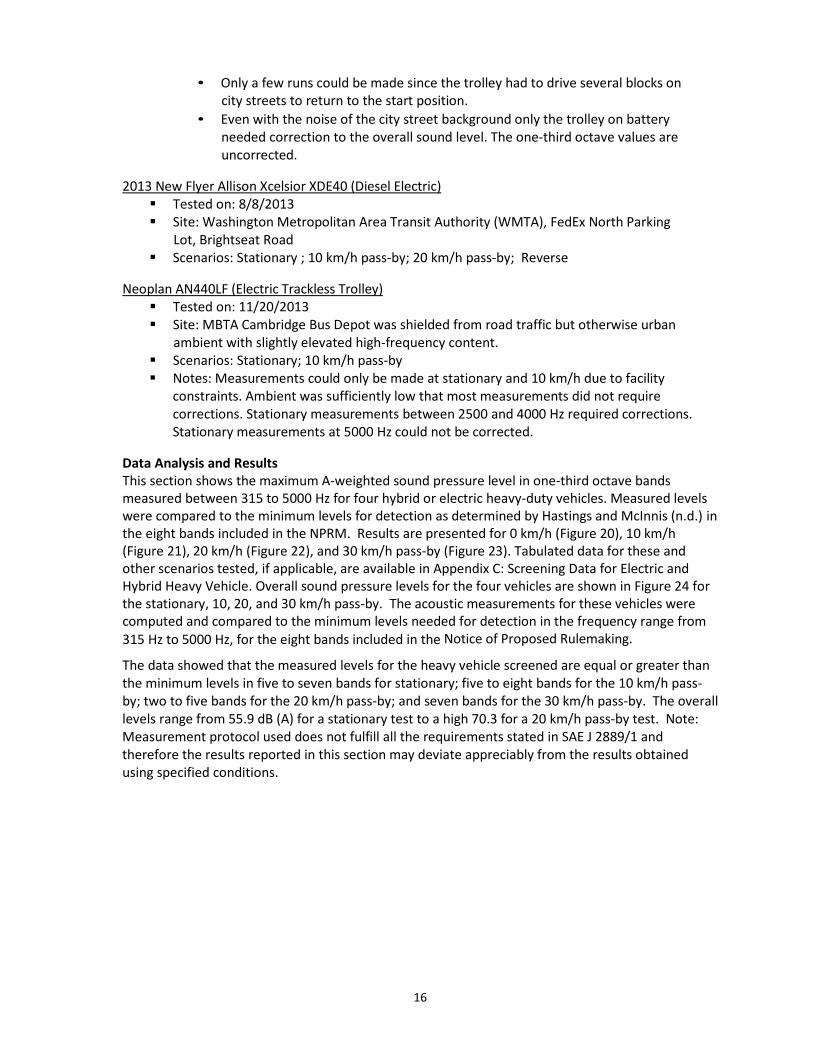
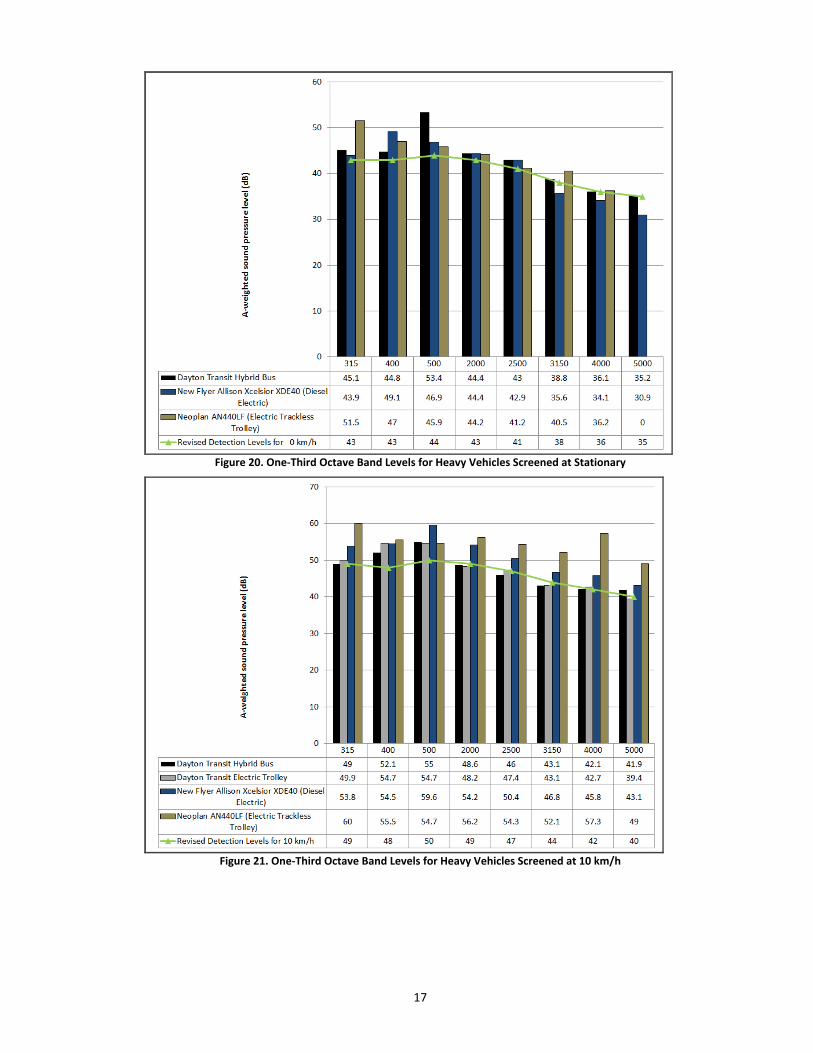
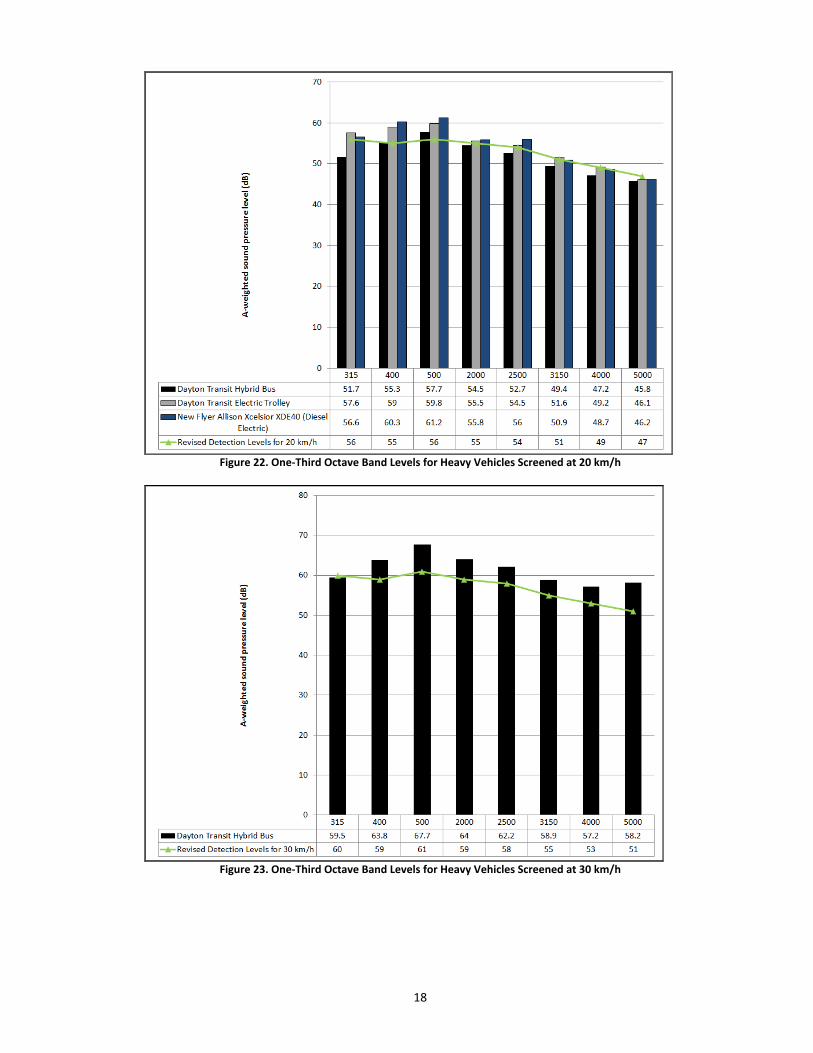
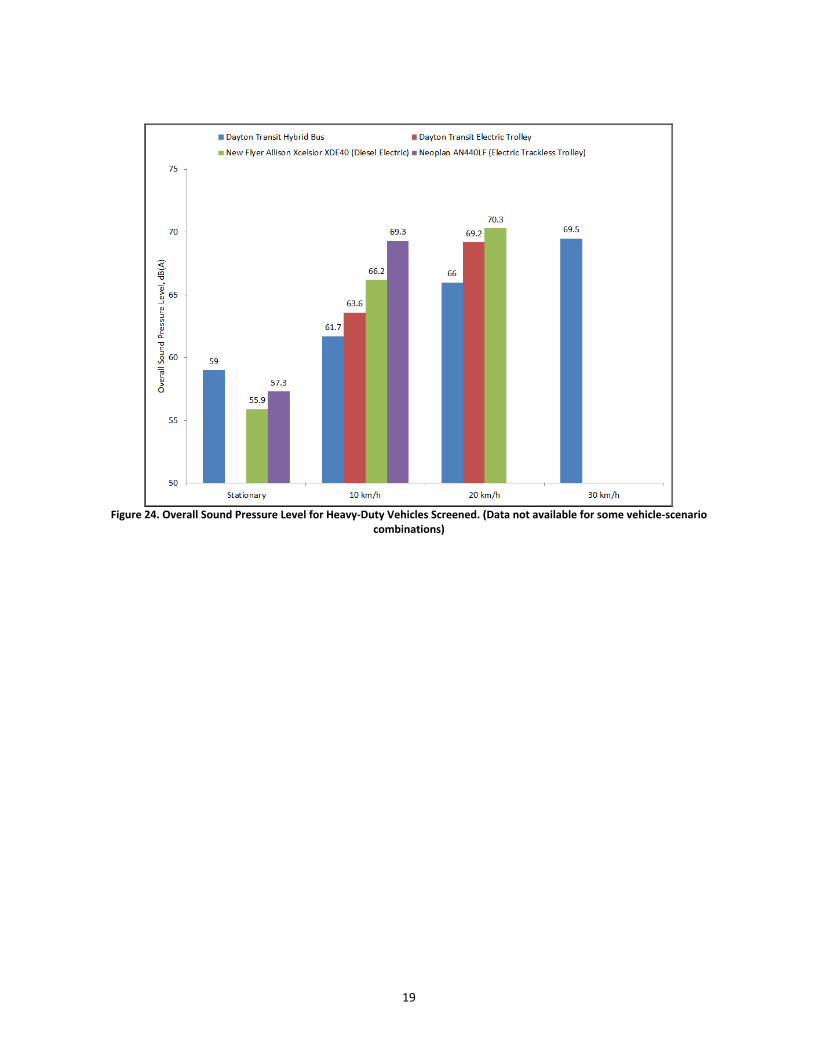
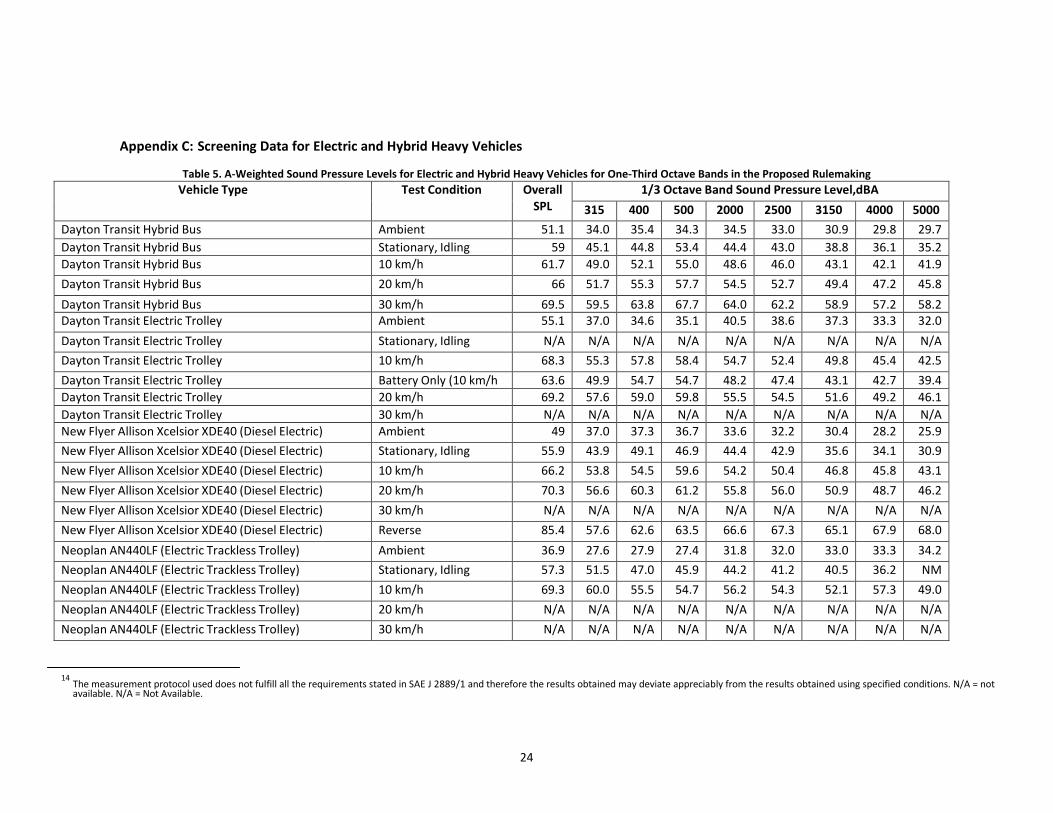
Data Analysis and Results This section shows the maximum A-weighted sound pressure level in one-third octave bands measured between 315 to 5000 Hz for four hybrid or electric heavy-duty vehicles. Measured levels were compared to the minimum levels for detection as determined by Hastings and McInnis (n.d.) in the eight bands included in the NPRM. Results are presented for 0 km/h (Figure 20), 10 km/h (Figure 21), 20 km/h (Figure 22), and 30 km/h pass-by (Figure 23). Tabulated data for these and other scenarios tested, if applicable, are available in Appendix C: Screening Data for Electric and Hybrid Heavy Vehicle. Overall sound pressure levels for the four vehicles are shown in Figure 24 for the stationary, 10, 20, and 30 km/h pass-by. The acoustic measurements for these vehicles were computed and compared to the minimum levels needed for detection in the frequency range from 315 Hz to 5000 Hz, for the eight bands included in the Notice of Proposed Rulemaking.
The data showed that the measured levels for the heavy vehicle screened are equal or greater than the minimum levels in five to seven bands for stationary; five to eight bands for the 10 km/h pass-by; two to five bands for the 20 km/h pass-by; and seven bands for the 30 km/h pass-by. The overall levels range from 55.9 dB (A) for a stationary test to a high 70.3 for a 20 km/h pass-by test. Note: Measurement protocol used does not fulfill all the requirements stated in SAE J 2889/1 and therefore the results reported in this section may deviate appreciably from the results obtained using specified conditions.
17
Figure 20. One-Third Octave Band Levels for Heavy Vehicles Screened at Stationary
Figure 21. One-Third Octave Band Levels for Heavy Vehicles Screened at 10 km/h
18
Figure 22. One-Third Octave Band Levels for Heavy Vehicles Screened at 20 km/h
Figure 23. One-Third Octave Band Levels for Heavy Vehicles Screened at 30 km/h
19
Figure 24. Overall Sound Pressure Level for Heavy-Duty Vehicles Screened. (Data not available for some vehicle-scenario
combinations)
20
V. Summary
Crash Data A crash data analysis, across the entire fleet, showed that the percentage of low-speed crashes with pedestrians is lower for heavy-duty vehicles (0.42) than for light-duty vehicles (0.80). Similarly, the percentage of low-speed crash with pedestrians is lower for motorcycles (0.27) than for light-duty vehicles (0.80). Pedestrians injured in motor vehicle traffic crashes by crash year and striking vehicle type from 2000 to 2011 were estimated using data from the GES. The data show that on average, the percentage of pedestrians injured in motor vehicle crashes by passenger cars is 61.5 while the corresponding value for motorcycles, medium trucks, and heavy trucks is 1.0 percent each. Statistics for pedestrian collision rates of hybrid and electric vehicles with GVWRs over 4,536 kg (10,000 lb.) and motorcycles were not available because of the limited penetration of these vehicles into the fleet.
Acoustic Data NHTSA collected acoustic data for two electric motorcycles on an ISO 10844:2011 compliant surface. The measurements protocol used follows general procedures in SAE J 2889/1 ‘Measurement of Minimum Noise Emitted by Road Vehicles’, May 2012 with some exceptions as described in this report. Results were compared to the minimum levels for detection as determined by Hastings and McInnis (n.d.). Results for the 2012 Brammo Enertia show that the measured levels for the motorcycle tests are equal or greater than the minimum levels in:
2 of the 13 bands for 10 km/h pass-by; and 3 of the 13 bands for 20 km/h pass-by.
Sound levels for the 30 km/h pass-by were below the minimum levels for detection in each of the 13 one-third octave bands from 315 Hz to 5000 Hz. Sound levels for the 2012 Zero S were also below the minimum levels for detection in each of the 13 bands for all pass-by tests (i.e., 10, 20, and 30 km/h).
NHTSA also collected acoustic data for a pure electric heavy vehicle (Navistar eStar) on an ISO 10844: 1994 compliant surface suitable for heavy vehicles. The acoustic measurements for this vehicle were compared to the minimum levels needed for detection. The data showed that the measured levels for the heavy vehicle tested are equal or greater than the minimum levels in:
7 of the 13 bands for stationary; 9 of the 13 bands for 10 km/h pass-by; 8 of the 13 bands for 20 km/h pass-by; and 7 of the 13 bands for 30 km/h pass-by.
NHTSA applied the proposed test procedure to motorcycles and heavy vehicles without major issues. One notable change is that that the motorcycles were run just to the right of the center of the lane with respect to the direction of travel. This was done such the motorcycles’ tires were not rolling on the painted center line. Also, motorcycles were not tested in the reverse scenarios since they did not have reverse capabilities. No issues were noted while applying the test protocol to the heavy vehicle tested. It is important to note, however, that the research team tested one delivery truck and was unable to find electric or hybrid heavy-duty vehicles with different size and configuration for this test.
21
VI. References
Evans, L. R., & Harris, J. R. (2012, June). Quieter vehicles performance test development research report. . (Submitted to DOT Docket No. NHTSA-2011-0148-0047). Washington DC: National
Highway Traffic Safety Administration. Harris, J. R., Gerdus, E., Evans, L. R., & Garrott, R. W. (n.d.). Quieter vehicle test report – 2012: Comparison
of sound pressure levels. (Submitted to DOT Docket No. NHTSA-2011-0148). Washington DC: National Highway Traffic Safety Administration.
Hastings, A., & McInnis, C. (n.d.). Detectability of alert signals for hybrid and electric vehicles: Acoustic
modeling and human subjects experiment. (Submitted to DOT Docket No. NHTSA-2011-0148). Washington DC: National Highway Traffic Safety Administration.
Hastings, A., Pollard, J., Garay-Vega, L., Stearns, M., & Guthy, C. (2011). Quieter cars and the safety of blind
pedestrians, phase 2: Development of potential specifications for vehicle countermeasure sounds. (Report No. DOT HS 811 496). Washington DC: National Highway Traffic Safety Administration. Available at www.nhtsa.gov/DOT/NHTSA/NVS/-Crash%20Avoidance/Technical%20Publications/2011/811496.pdf
International Organization for Standardization. (2011). Acoustics -- Specification of test tracks for measuring
noise emitted by road vehicles and their tires. (ISO 108444:2011). Geneva. Proposed Federal Motor Vehicle Safety Standard. (2013, January 14). Minimum sound requirements for
hybrid and electric vehicles. (Submitted to DOT Docket No. NHTSA-2011-0148-0075). Washington DC: National Highway Traffic Safety Administration. Available at www.noticeandcomment.com/Federal-Motor-Vehicle-Safety-Standards-Minimum-Sound-Requirements-for-Hybrid-and-Electric-Vehicles-fn-106.aspx
S. 841[111th]. (2011,. January 4). Pedestrian Safety Enhancement Act of 2010. Public Law No: 111-373. SAE International. (2012, May). SAE J 2889-1-2011, Measurement of Minimum Noise Emitted by Road
Vehicles. Warrendale, PA: Author. Wu, J., Austin, R., & Chen, C.L. (2011) Incidence rates of pedestrian and bicyclist crashes by hybrid electric
passenger vehicles: An update. (Report No. DOT HS 811 526). Washington, DC: National Highway Traffic Safety Administration. Available at www-nrd.nhtsa.dot.gov/Pubs/811526.pdf
Draft Last Modified: 7/14/14
22
Appendix A: Acoustic Data for Electric Motorcycles
Table 3. A-Weighted Sound Levels, Electric Motorcycles (corrected for minimum ambient)
Vehicle Test Condition
Overall SPL
1/3 Octave Band Sound Pressure Level, dBA 100 125 160 200 250 315 400 500 630 800 1000 1250 1600 2000 2500 3150 4000 5000
Brammo Minimum Ambient
40.3
17.2
19.7
20.2
21.0
20.7
21.2
21.6
22.0
22.3
23.0
24.6
25.3
25.7
26.7
27.5
28.0
28.9
29.3
Brammo Mean
Ambient
41.3
22.7
25.6
23.9
25.3
24.3
28.2
24.8
25.4
25.3
26.6
27.6
28.0
28.0
28.1
29.1
30.4
30.0
30.2
Brammo Max
Ambient
43.5
27.0
30.5
27.4
29.1
27.6
37.5
28.5
29.0
29.3
30.3
31.2
31.5
31.0
30.6
35.2
40.0
33.0
31.0
Brammo Startup 64.2 20.3 24.3 24.4 23.5 21.9 24.8 26.2 30.4 37.3 37.1 40.8 46.7 48.5 51.8 58.3 56.5 58.6 55.5 Brammo 10 km/h 57.0 26.9 26.8 26.6 31.4 27.9 31.8 39.5 38.2 43.8 49.7 51.9 49.4 47.1 40.7 39.3 42.0 41.6 40.5 Brammo 20 km/h 63.2 25.9 30.8 30.0 44.0 36.5 37.9 50.3 41.5 50.5 53.5 56.2 55.1 55.5 50.2 48.0 49.4 49.7 48.5 Brammo 30 km/h 66.5 30.7 30.2 33.8 39.1 41.8 56.5 42.7 43.0 52.3 52.2 59.3 61.2 57.9 52.0 51.8 53.0 52.2 50.2
Brammo
0-10 km/h Forward
Accel
57.0
29.1
34.6
43.3
31.9
29.6
37.4
37.6
39.0
42.2
49.3
51.5
49.7
46.6
39.0
38.9
41.4
41.8
41.9
Zero Electric
Minimum Ambient
28.5
-14.7
-12.2
-7.5
-3.4
-0.1
3.7
6.5
9.1
11.7
13.1
15.1
16.9
17.8
18.6
19.6
20.7
20.4
14.9
Zero Electric
Mean Ambient
38.3
21.4
22.5
23.5
24.3
26.1
28.6
26.4
24.1
22.9
23.7
25.5
24.9
22.6
21.8
27.0
25.3
20.4
23.6
Zero Electric
Max Ambient
46.1
26.2
26.7
29.5
29.0
32.0
37.0
34.6
29.5
26.6
27.0
28.6
27.9
27.6
36.1
45.3
43.6
32.1
31.5
Zero Electric
10 km/h
49.1
20.3
21.5
27.2
31.1
28.1
32.6
39.0
34.5
38.9
42.9
39.1
37.7
38.2
36.3
34.7
34.9
31.9
33.9
Zero Electric
20 km/h
57.0
24.5
24.3
25.2
29.4
31.0
40.6
46.8
38.5
41.8
53.9
45.3
44.7
43.3
42.2
40.7
41.6
37.8
41.1
Zero Electric
30 km/h
59.6
23.6
25.4
29.1
31.9
35.2
39.7
40.7
47.9
52.4
47.5
49.3
52.3
48.8
50.8
46.2
46.3
42.8
44.2
Zero Electric
0-10 km/h Forward
Accel
58.3
24.9
32.7
28.4
29.8
34.4
34.2
38.2
39.2
42.8
46.5
46.2
48.8
52.1
48.9
50.0
44.1
40.7
37.6
Zero Electric
30-10 km/h Decel
54.4
21.8
27.2
27.6
30.8
32.8
35.1
37.3
46.1
44.3
47.1
39.2
37.9
37.9
37.7
36.5
36.8
35.9
38.3
Draft Last Modified: 7/14/14
23
Appendix B: Acoustic Data for Electric Heavy Vehicle
Table 4. A-Weighted Sound Levels, Electric Heavy Truck (corrected for minimum ambient)
Vehicle
Test Condition Overall SPL
1/3 Octave Band Sound Pressure Level, dBA 100 125 160 200 250 315 400 500 630 800 1000 1250 1600 2000 2500 3150 4000 5000
Navistar eStar Minimum Ambient
42.7
22.8
26.5
26.9
26.4
26.3
25.8
26.2
27.2
30.3
31.8
32.0
30.8
29.2
25.7
21.6
20.4
17.9
15.9
Navistar eStar Mean Ambient 45.4 29.2 31.9 32.2 31.2 30.3 29.4 28.9 29.8 33.2 34.4 34.6 34.6 34.7 31.6 33.3 37.5 30.2 26.4 Navistar eStar Max Ambient 51.2 34.8 36.3 36.8 35.1 33.8 33.6 33.2 32.7 36.4 36.6 37.2 40.5 43.5 42.6 45.3 49.2 43.1 40.9
Navistar eStar Stationary, Idling
55.4
28.2
30.1
37.6
37.6
32.2
38.1
41.8
32.8
38.6
48.0
47.1
48.8
46.2
41.8
40.8
36.8
41.1
35.1
Navistar eStar Startup13 56.6 31.5 39.7 42.6 42.7 39.8 39.4 42.2 39.8 46.0 50.1 46.6 48.8 44.8 41.7 39.7 35.3 39.3 36.5
Navistar eStar 10 km/h 64.5 34.7 33.9 38.0 40.6 36.9 48.1 49.8 42.3 51.7 53.2 51.8 52.2 58.8 52.3 51.0 45.7 41.5 39.1 Navistar eStar 20 km/h 73.4 37.0 43.7 51.9 47.2 45.8 49.3 48.3 49.9 66.4 61.0 58.3 68.6 65.0 64.4 59.3 54.1 45.6 44.7 Navistar eStar 30 km/h 75.2 39.9 42.8 46.8 52.8 54.4 50.2 52.0 57.1 59.7 64.6 70.8 63.1 62.8 69.5 61.5 57.4 50.7 48.3
Navistar eStar 0-10 km/h Forward Accel
60.9
32.5
31.0
40.4
42.6
44.9
45.0
47.1
44.6
47.9
53.8
50.2
48.7
46.8
45.0
45.3
44.1
43.7
41.3
Navistar eStar 30-10 km/h Decel
64.8
36.6
35.7
39.4
43.8
40.4
47.2
52.1
46.9
52.7
58.9
53.4
51.1
55.7
52.7
53.2
48.6
45.7
43.9
13 Average of two events.
24
Appendix C: Screening Data for Electric and Hybrid Heavy Vehicles
Table 5. A-Weighted Sound Pressure Levels for Electric and Hybrid Heavy Vehicles for One-Third Octave Bands in the Proposed Rulemaking Vehicle Type Test Condition Overall
SPL 1/3 Octave Band Sound Pressure Level,dBA
315 400 500 2000 2500 3150 4000 5000 Dayton Transit Hybrid Bus Ambient 51.1 34.0 35.4 34.3 34.5 33.0 30.9 29.8 29.7 Dayton Transit Hybrid Bus Stationary, Idling 59 45.1 44.8 53.4 44.4 43.0 38.8 36.1 35.2 Dayton Transit Hybrid Bus 10 km/h 61.7 49.0 52.1 55.0 48.6 46.0 43.1 42.1 41.9 Dayton Transit Hybrid Bus 20 km/h 66 51.7 55.3 57.7 54.5 52.7 49.4 47.2 45.8 Dayton Transit Hybrid Bus 30 km/h 69.5 59.5 63.8 67.7 64.0 62.2 58.9 57.2 58.2 Dayton Transit Electric Trolley Ambient 55.1 37.0 34.6 35.1 40.5 38.6 37.3 33.3 32.0 Dayton Transit Electric Trolley Stationary, Idling N/A N/A N/A N/A N/A N/A N/A N/A N/A Dayton Transit Electric Trolley 10 km/h 68.3 55.3 57.8 58.4 54.7 52.4 49.8 45.4 42.5 Dayton Transit Electric Trolley Battery Only (10 km/h 63.6 49.9 54.7 54.7 48.2 47.4 43.1 42.7 39.4 Dayton Transit Electric Trolley 20 km/h 69.2 57.6 59.0 59.8 55.5 54.5 51.6 49.2 46.1 Dayton Transit Electric Trolley 30 km/h N/A N/A N/A N/A N/A N/A N/A N/A N/A New Flyer Allison Xcelsior XDE40 (Diesel Electric) Ambient 49 37.0 37.3 36.7 33.6 32.2 30.4 28.2 25.9 New Flyer Allison Xcelsior XDE40 (Diesel Electric) Stationary, Idling 55.9 43.9 49.1 46.9 44.4 42.9 35.6 34.1 30.9 New Flyer Allison Xcelsior XDE40 (Diesel Electric) 10 km/h 66.2 53.8 54.5 59.6 54.2 50.4 46.8 45.8 43.1 New Flyer Allison Xcelsior XDE40 (Diesel Electric) 20 km/h 70.3 56.6 60.3 61.2 55.8 56.0 50.9 48.7 46.2 New Flyer Allison Xcelsior XDE40 (Diesel Electric) 30 km/h N/A N/A N/A N/A N/A N/A N/A N/A N/A New Flyer Allison Xcelsior XDE40 (Diesel Electric) Reverse 85.4 57.6 62.6 63.5 66.6 67.3 65.1 67.9 68.0 Neoplan AN440LF (Electric Trackless Trolley) Ambient 36.9 27.6 27.9 27.4 31.8 32.0 33.0 33.3 34.2 Neoplan AN440LF (Electric Trackless Trolley) Stationary, Idling 57.3 51.5 47.0 45.9 44.2 41.2 40.5 36.2 NM Neoplan AN440LF (Electric Trackless Trolley) 10 km/h 69.3 60.0 55.5 54.7 56.2 54.3 52.1 57.3 49.0 Neoplan AN440LF (Electric Trackless Trolley) 20 km/h N/A N/A N/A N/A N/A N/A N/A N/A N/A Neoplan AN440LF (Electric Trackless Trolley) 30 km/h N/A N/A N/A N/A N/A N/A N/A N/A N/A
14 The measurement protocol used does not fulfill all the requirements stated in SAE J 2889/1 and therefore the results obtained may deviate appreciably from the results obtained using specified conditions. N/A = not available. N/A = Not Available.

DOT HS 812 225 December 2015
11729-122315-v2