Embed Size (px)
DESCRIPTION
acp
Citation preview
Atmos. Chem. Phys., 7, 69–79, 2007www.atmos-chem-phys.net/7/69/2007/© Author(s) 2007. This work is licensedunder a Creative Commons License.
AtmosphericChemistry
and Physics
Satellite monitoring of different vegetation types by differentialoptical absorption spectroscopy (DOAS) in the red spectral range
T. Wagner, S. Beirle, T. Deutschmann, M. Grzegorski, and U. Platt
Institut fur Umweltphysik, University of Heidelberg, Heidelberg, Germany
Received: 29 May 2006 – Published in Atmos. Chem. Phys. Discuss.: 16 August 2006Revised: 7 November 2006 – Accepted: 18 December 2006 – Published: 10 January 2007
Abstract. A new method for the satellite remote sensingof different types of vegetation and ocean colour is pre-sented. In contrast to existing algorithms relying on thestrong change of the reflectivity in the red and near infraredspectral region, our method analyses weak narrow-band (fewnm) reflectance structures (i.e. “fingerprint” structures) ofvegetation in the red spectral range. It is based on differen-tial optical absorption spectroscopy (DOAS), which is usu-ally applied for the analysis of atmospheric trace gas absorp-tions. Since the spectra of atmospheric absorption and veg-etation reflectance are simultaneously included in the analy-sis, the effects of atmospheric absorptions are automaticallycorrected (in contrast to other algorithms). The inclusion ofthe vegetation spectra also significantly improves the resultsof the trace gas retrieval. The global maps of the results il-lustrate the seasonal cycles of different vegetation types. Inaddition to the vegetation distribution on land, they also showpatterns of biological activity in the oceans. Our results in-dicate that improved sets of vegetation spectra might lead tomore accurate and more specific identification of vegetationtype in the future.
1 Introduction
Vegetation has a strong influence on the cycles of trace gasesand other important properties of the earth system, in par-ticular the earth’s energy budget. Vegetation modifies theground albedo and thus has a strong impact on the amountof backscattered solar energy. Vegetation also strongly influ-ences the water cycle through its influence on evaporation;the release of latent heat is important for the latitudinal en-ergy distribution. Plants are also sources and/or sinks formany important trace gases, in particular greenhouse gases.
Correspondence to:T. Wagner([email protected])
Therefore, the precise knowledge of the spatio-temporal vari-ation of the biological activity is an important prerequisite forthe correct understanding and simulation of global trace gasbudgets and of the earth’s climate. Of special importance isthe monitoring of the human-induced change of the globalvegetation patterns, e.g. caused by biomass burning or cli-mate change.
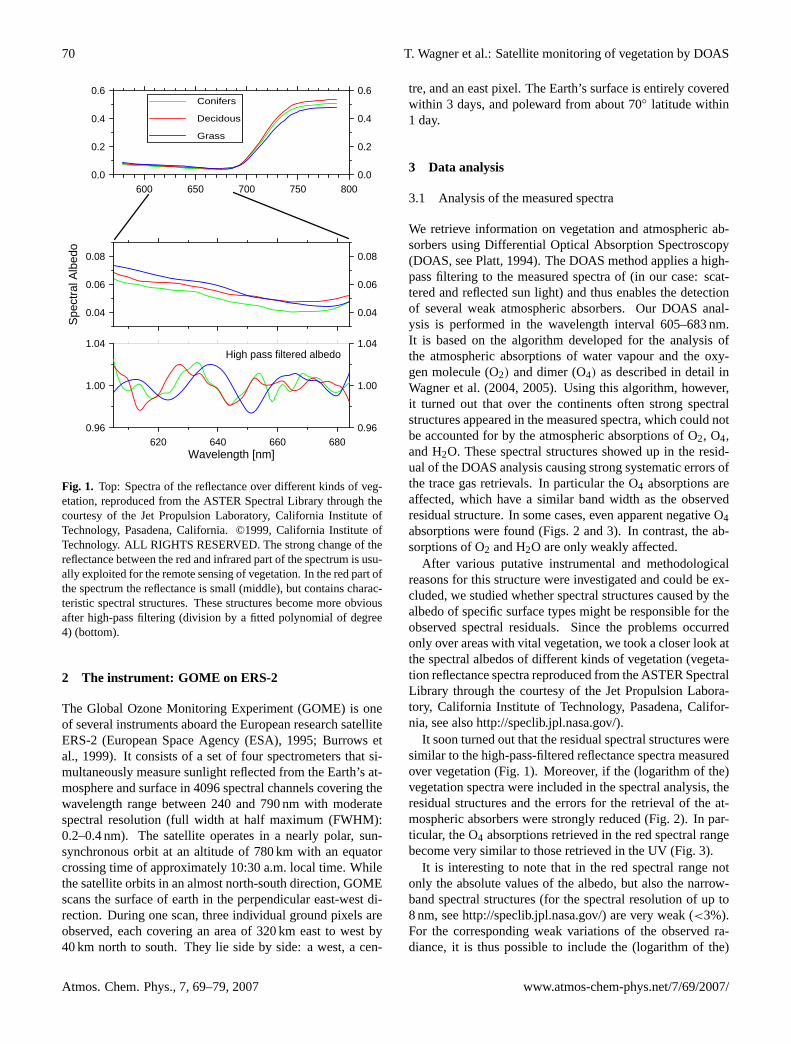
Algorithms for the remote sensing of vegetation have beendeveloped and are successfully applied to satellite observa-tions for a long time. Typically they are based on the mea-sured radiance in the red and near-infrared part of the spec-trum. Over this wavelength range, the reflectivity of vege-tation changes strongly (Fig. 1), caused by the absorption ofvarious kinds of chlorophyll and pigments. Thus a clear veg-etation signal can be easily derived. Definitions of variouskinds of vegetation indices based on intensity ratios can befound e.g. in Birth and McVey (1968), Jordan (1969), Rouseet al. (1974), Huete (1988), Gutman (1991), and Jensen(2000).
Here we present a new vegetation algorithm which can beapplied to new satellite sensors with moderate spectral reso-lution (but presently only coarse spatial resolution). A simi-lar method was already applied to airborne measurements byClark et al. (1995). In contrast to the existing algorithms, ourmethod exploits the narrow-band spectral information of thevegetation reflectance, which allows in particular to discrim-inate different types of vegetation. One additional advantageis that the influence of atmospheric absorption is automat-ically corrected. These findings are in agreement with theformulation of the forward model for the performed measure-ments; they are also confirmed by the analysis of simulatedspectra.
Published by Copernicus GmbH on behalf of the European Geosciences Union.
70 T. Wagner et al.: Satellite monitoring of vegetation by DOAS
600 650 700 750 800
620 640 660 680Wavelength [nm]
0.96
1.00
1.04
0.04
0.06
0.08
0.0
0.2
0.4
0.6
0.96
1.00
1.04High pass filtered albedo
Conifers
Decidous
Grass
0.0
0.2
0.4
0.6
0.04
0.06
0.08
Spec
tral A
lbed
o
Fig. 1. Top: Spectra of the reflectance over different kinds of veg-etation, reproduced from the ASTER Spectral Library through thecourtesy of the Jet Propulsion Laboratory, California Institute ofTechnology, Pasadena, California. ©1999, California Institute ofTechnology. ALL RIGHTS RESERVED. The strong change of thereflectance between the red and infrared part of the spectrum is usu-ally exploited for the remote sensing of vegetation. In the red part ofthe spectrum the reflectance is small (middle), but contains charac-teristic spectral structures. These structures become more obviousafter high-pass filtering (division by a fitted polynomial of degree4) (bottom).
2 The instrument: GOME on ERS-2
The Global Ozone Monitoring Experiment (GOME) is oneof several instruments aboard the European research satelliteERS-2 (European Space Agency (ESA), 1995; Burrows etal., 1999). It consists of a set of four spectrometers that si-multaneously measure sunlight reflected from the Earth’s at-mosphere and surface in 4096 spectral channels covering thewavelength range between 240 and 790 nm with moderatespectral resolution (full width at half maximum (FWHM):0.2–0.4 nm). The satellite operates in a nearly polar, sun-synchronous orbit at an altitude of 780 km with an equatorcrossing time of approximately 10:30 a.m. local time. Whilethe satellite orbits in an almost north-south direction, GOMEscans the surface of earth in the perpendicular east-west di-rection. During one scan, three individual ground pixels areobserved, each covering an area of 320 km east to west by40 km north to south. They lie side by side: a west, a cen-
tre, and an east pixel. The Earth’s surface is entirely coveredwithin 3 days, and poleward from about 70◦ latitude within1 day.
3 Data analysis
3.1 Analysis of the measured spectra
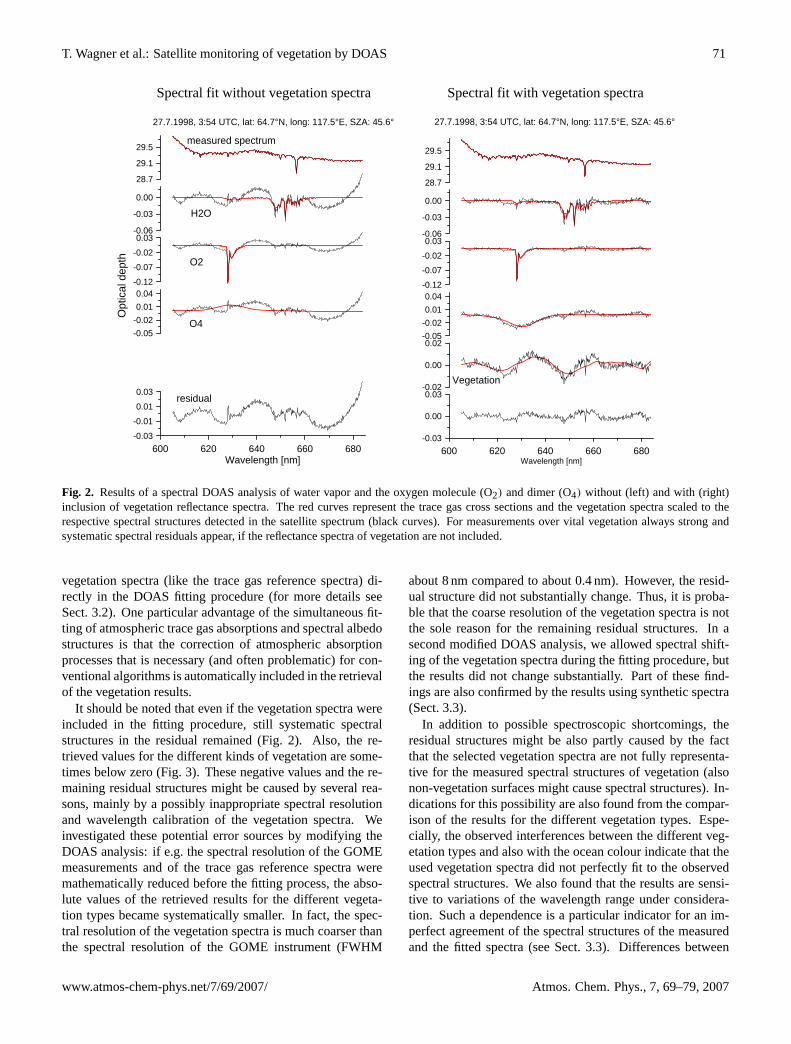
We retrieve information on vegetation and atmospheric ab-sorbers using Differential Optical Absorption Spectroscopy(DOAS, see Platt, 1994). The DOAS method applies a high-pass filtering to the measured spectra of (in our case: scat-tered and reflected sun light) and thus enables the detectionof several weak atmospheric absorbers. Our DOAS anal-ysis is performed in the wavelength interval 605–683 nm.It is based on the algorithm developed for the analysis ofthe atmospheric absorptions of water vapour and the oxy-gen molecule (O2) and dimer (O4) as described in detail inWagner et al. (2004, 2005). Using this algorithm, however,it turned out that over the continents often strong spectralstructures appeared in the measured spectra, which could notbe accounted for by the atmospheric absorptions of O2, O4,and H2O. These spectral structures showed up in the resid-ual of the DOAS analysis causing strong systematic errors ofthe trace gas retrievals. In particular the O4 absorptions areaffected, which have a similar band width as the observedresidual structure. In some cases, even apparent negative O4absorptions were found (Figs. 2 and 3). In contrast, the ab-sorptions of O2 and H2O are only weakly affected.
After various putative instrumental and methodologicalreasons for this structure were investigated and could be ex-cluded, we studied whether spectral structures caused by thealbedo of specific surface types might be responsible for theobserved spectral residuals. Since the problems occurredonly over areas with vital vegetation, we took a closer look atthe spectral albedos of different kinds of vegetation (vegeta-tion reflectance spectra reproduced from the ASTER SpectralLibrary through the courtesy of the Jet Propulsion Labora-tory, California Institute of Technology, Pasadena, Califor-nia, see alsohttp://speclib.jpl.nasa.gov/).
It soon turned out that the residual spectral structures weresimilar to the high-pass-filtered reflectance spectra measuredover vegetation (Fig. 1). Moreover, if the (logarithm of the)vegetation spectra were included in the spectral analysis, theresidual structures and the errors for the retrieval of the at-mospheric absorbers were strongly reduced (Fig. 2). In par-ticular, the O4 absorptions retrieved in the red spectral rangebecome very similar to those retrieved in the UV (Fig. 3).
It is interesting to note that in the red spectral range notonly the absolute values of the albedo, but also the narrow-band spectral structures (for the spectral resolution of up to8 nm, seehttp://speclib.jpl.nasa.gov/) are very weak (<3%).For the corresponding weak variations of the observed ra-diance, it is thus possible to include the (logarithm of the)
Atmos. Chem. Phys., 7, 69–79, 2007 www.atmos-chem-phys.net/7/69/2007/
T. Wagner et al.: Satellite monitoring of vegetation by DOAS 71
Spectral fit without vegetation spectra Spectral fit with vegetation spectra
600 620 640 660 680Wavelength [nm]
28.7
29.1
29.5
-0.06
-0.03
0.00
-0.12
-0.07-0.02
0.03
Opt
ical
dep
th
-0.05-0.020.010.04
-0.03
-0.01
0.01
0.03
measured spectrum
H2O
O2
O4
residual
27.7.1998, 3:54 UTC, lat: 64.7°N, long: 117.5°E, SZA: 45.6°
600 620 640 660 680
Wavelength [nm]
28.7
29.1
29.5
-0.06
-0.03
0.00
-0.12
-0.07-0.02
0.03
-0.05-0.020.010.04
-0.02
0.00
0.02
-0.03
0.00
0.03
27.7.1998, 3:54 UTC, lat: 64.7°N, long: 117.5°E, SZA: 45.6°
Vegetation
Fig. 2. Results of a spectral DOAS analysis of water vapor and the oxygen molecule (O2) and dimer (O4) without (left) and with (right)inclusion of vegetation reflectance spectra. The red curves represent the trace gas cross sections and the vegetation spectra scaled to therespective spectral structures detected in the satellite spectrum (black curves). For measurements over vital vegetation always strong andsystematic spectral residuals appear, if the reflectance spectra of vegetation are not included.
vegetation spectra (like the trace gas reference spectra) di-rectly in the DOAS fitting procedure (for more details seeSect. 3.2). One particular advantage of the simultaneous fit-ting of atmospheric trace gas absorptions and spectral albedostructures is that the correction of atmospheric absorptionprocesses that is necessary (and often problematic) for con-ventional algorithms is automatically included in the retrievalof the vegetation results.
It should be noted that even if the vegetation spectra wereincluded in the fitting procedure, still systematic spectralstructures in the residual remained (Fig. 2). Also, the re-trieved values for the different kinds of vegetation are some-times below zero (Fig. 3). These negative values and the re-maining residual structures might be caused by several rea-sons, mainly by a possibly inappropriate spectral resolutionand wavelength calibration of the vegetation spectra. Weinvestigated these potential error sources by modifying theDOAS analysis: if e.g. the spectral resolution of the GOMEmeasurements and of the trace gas reference spectra weremathematically reduced before the fitting process, the abso-lute values of the retrieved results for the different vegeta-tion types became systematically smaller. In fact, the spec-tral resolution of the vegetation spectra is much coarser thanthe spectral resolution of the GOME instrument (FWHM
about 8 nm compared to about 0.4 nm). However, the resid-ual structure did not substantially change. Thus, it is proba-ble that the coarse resolution of the vegetation spectra is notthe sole reason for the remaining residual structures. In asecond modified DOAS analysis, we allowed spectral shift-ing of the vegetation spectra during the fitting procedure, butthe results did not change substantially. Part of these find-ings are also confirmed by the results using synthetic spectra(Sect. 3.3).
In addition to possible spectroscopic shortcomings, theresidual structures might be also partly caused by the factthat the selected vegetation spectra are not fully representa-tive for the measured spectral structures of vegetation (alsonon-vegetation surfaces might cause spectral structures). In-dications for this possibility are also found from the compar-ison of the results for the different vegetation types. Espe-cially, the observed interferences between the different veg-etation types and also with the ocean colour indicate that theused vegetation spectra did not perfectly fit to the observedspectral structures. We also found that the results are sensi-tive to variations of the wavelength range under considera-tion. Such a dependence is a particular indicator for an im-perfect agreement of the spectral structures of the measuredand the fitted spectra (see Sect. 3.3). Differences between
www.atmos-chem-phys.net/7/69/2007/ Atmos. Chem. Phys., 7, 69–79, 2007
72 T. Wagner et al.: Satellite monitoring of vegetation by DOAS
-20 0 20 40 60Latitude [°]
-0.2
0.0
0.2
fit c
oeffi
cien
t
0.0
0.2
0.4
0.6
0.8
0.0
0.2
0.4
0.6
23.10.1998 (GOME orbit 81023092)
without vegetation
with vegetation
UV retrieval
Conifers
deciduous
grass
0
1E+23
2E+23
3E+23
without vegetation
with vegetation
H2O
O2
O4
vegetation
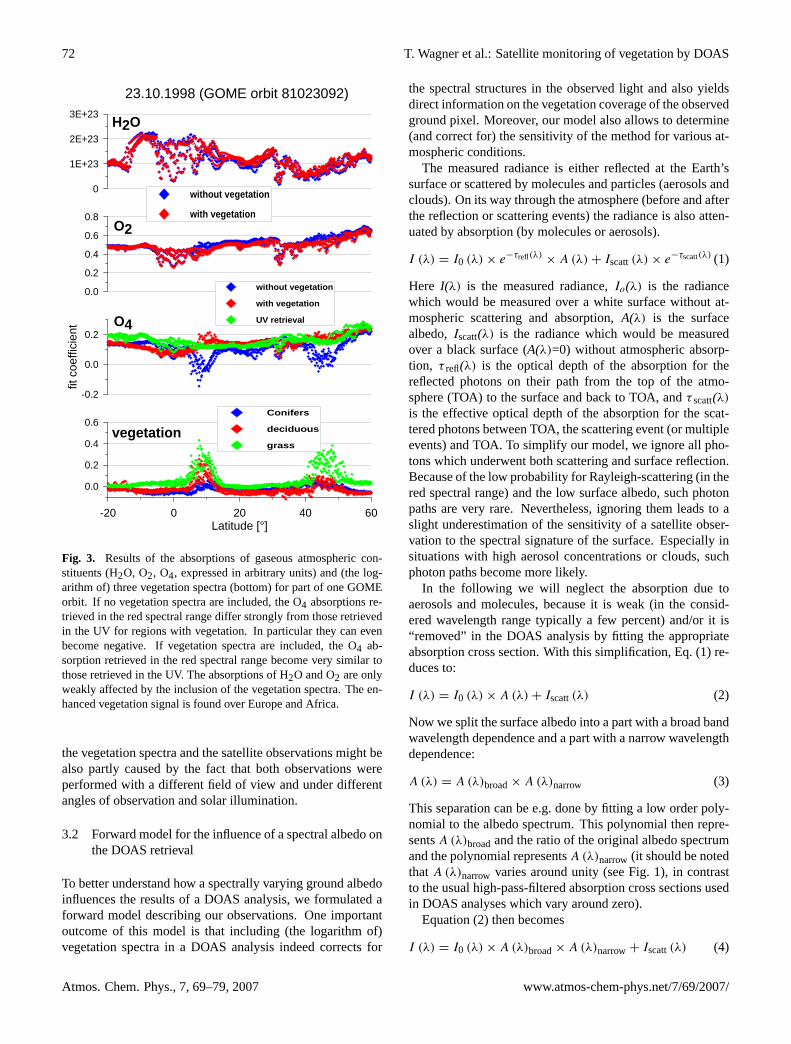
Fig. 3. Results of the absorptions of gaseous atmospheric con-stituents (H2O, O2, O4, expressed in arbitrary units) and (the log-arithm of) three vegetation spectra (bottom) for part of one GOMEorbit. If no vegetation spectra are included, the O4 absorptions re-trieved in the red spectral range differ strongly from those retrievedin the UV for regions with vegetation. In particular they can evenbecome negative. If vegetation spectra are included, the O4 ab-sorption retrieved in the red spectral range become very similar tothose retrieved in the UV. The absorptions of H2O and O2 are onlyweakly affected by the inclusion of the vegetation spectra. The en-hanced vegetation signal is found over Europe and Africa.
the vegetation spectra and the satellite observations might bealso partly caused by the fact that both observations wereperformed with a different field of view and under differentangles of observation and solar illumination.
3.2 Forward model for the influence of a spectral albedo onthe DOAS retrieval
To better understand how a spectrally varying ground albedoinfluences the results of a DOAS analysis, we formulated aforward model describing our observations. One importantoutcome of this model is that including (the logarithm of)vegetation spectra in a DOAS analysis indeed corrects for
the spectral structures in the observed light and also yieldsdirect information on the vegetation coverage of the observedground pixel. Moreover, our model also allows to determine(and correct for) the sensitivity of the method for various at-mospheric conditions.
The measured radiance is either reflected at the Earth’ssurface or scattered by molecules and particles (aerosols andclouds). On its way through the atmosphere (before and afterthe reflection or scattering events) the radiance is also atten-uated by absorption (by molecules or aerosols).
I (λ) = I0 (λ) × e−τrefl(λ)× A (λ) + Iscatt(λ) × e−τscatt(λ) (1)
Here I(λ) is the measured radiance,Io(λ) is the radiancewhich would be measured over a white surface without at-mospheric scattering and absorption,A(λ) is the surfacealbedo,Iscatt(λ) is the radiance which would be measuredover a black surface (A(λ)=0) without atmospheric absorp-tion, τ refl(λ) is the optical depth of the absorption for thereflected photons on their path from the top of the atmo-sphere (TOA) to the surface and back to TOA, andτ scatt(λ)
is the effective optical depth of the absorption for the scat-tered photons between TOA, the scattering event (or multipleevents) and TOA. To simplify our model, we ignore all pho-tons which underwent both scattering and surface reflection.Because of the low probability for Rayleigh-scattering (in thered spectral range) and the low surface albedo, such photonpaths are very rare. Nevertheless, ignoring them leads to aslight underestimation of the sensitivity of a satellite obser-vation to the spectral signature of the surface. Especially insituations with high aerosol concentrations or clouds, suchphoton paths become more likely.
In the following we will neglect the absorption due toaerosols and molecules, because it is weak (in the consid-ered wavelength range typically a few percent) and/or it is“removed” in the DOAS analysis by fitting the appropriateabsorption cross section. With this simplification, Eq. (1) re-duces to:
I (λ) = I0 (λ) × A (λ) + Iscatt(λ) (2)
Now we split the surface albedo into a part with a broad bandwavelength dependence and a part with a narrow wavelengthdependence:
A (λ) = A (λ)broad× A (λ)narrow (3)
This separation can be e.g. done by fitting a low order poly-nomial to the albedo spectrum. This polynomial then repre-sentsA (λ)broadand the ratio of the original albedo spectrumand the polynomial representsA (λ)narrow (it should be notedthatA (λ)narrow varies around unity (see Fig. 1), in contrastto the usual high-pass-filtered absorption cross sections usedin DOAS analyses which vary around zero).
Equation (2) then becomes
I (λ) = I0 (λ) × A (λ)broad× A (λ)narrow+ Iscatt(λ) (4)
Atmos. Chem. Phys., 7, 69–79, 2007 www.atmos-chem-phys.net/7/69/2007/
T. Wagner et al.: Satellite monitoring of vegetation by DOAS 73
In the DOAS analysis the logarithm of the ratio of an in-tensity including the narrow band albedo and the intensitywithout the narrow band albedo effect is calculated:
lnInarrow(λ)
Ibroad(λ)= ln
I0 (λ) ×Abroad(λ) ×Anarrow(λ) +Iscatt(λ)
I0 (λ) ×Abroad(λ) +Iscatt(λ)(5)
Since the variations of the narrow band albedo spectra areweak (<3%), we can use the approximation:
ln(1 + x) ≈ x (6)
and derive:
A (λ)narrow ≈ ln Anarrow(λ) + 1 (7)
Then Eq. (5) becomes:
lnInarrow(λ)
Ibroad(λ)= (8)
lnI0 (λ) ×Abroad(λ) +Iscatt(λ) +I0 (λ) ×Abroad(λ) × ln Anarrow(λ)
I0 (λ) ×Abroad(λ) +Iscatt(λ)
Since the termI0 (λ) ×Abroad(λ) × ln Anarrow(λ) is smallcompared toI0 (λ) ×Abroad(λ) +Iscatt(λ) , we can approx-imate Eq. (8) by:
≈I0 (λ) × Abroad(λ)
I0 (λ) × Abroad(λ) + Iscatt(λ)× ln Anarrow(λ) (9)
From Eq. (9) we conclude that if we include the logarithm ofthe narrow-band albedo spectrum in the DOAS analysis, thedetermined fitting coefficient represents the vegetation coverof the observed ground pixel weighted by the ratio of lightreflected at the surface to the total light (sum of reflected andscattered light).
To determine the sensitivity of the satellite observation onthe spectral signature of the albedo, the ratio of the reflectedlight and the total light can be calculated by radiative trans-fer models. To derive the actual vegetation cover for the ob-served ground pixel, the retrieved fitting coefficient for thealbedo spectrum has to be scaled according to this ratio. Inanalogy to the use of the term “air mass factor” in the DOASanalysis of atmospheric trace gases, this ratio could be re-ferred to as “surface factor”. For a pure Rayleigh atmo-sphere, surface albedo of about 5%, and overhead sun it isabout 0.7; for larger solar zenith angles (SZA) it decreasesbecause the probability for a photon to be scattered before itreaches the ground, increases (see Fig. 4, top).
3.3 Sensitivity studies using radiative transfer modelling
To investigate the sensitivity of the satellite observations ofspectral albedo structures in more detail, we calculated andanalysed synthetic spectra representing the satellite observa-tions. With this approach it was not only possible to confirmthe findings of our observations and of the forward model(Eqs. 1 to 9), but it was also possible to perform various sen-sitivity studies.
0
0.2
0.4
0.6
0.8
1
0 20 40 60 80 1SZA
Sens
itivi
ty to
veg
etat
ion
00
model_resultRef_6Ref_7Ref_8
conifersdeciduousgrass
0
0.2
0.4
0.6
0.8
1
0.1 1 10Aerosol optical depth
Sens
itivi
ty to
veg
etat
ion
model_resultRef_6Ref_7Ref_8
conifersdeciduousgrass
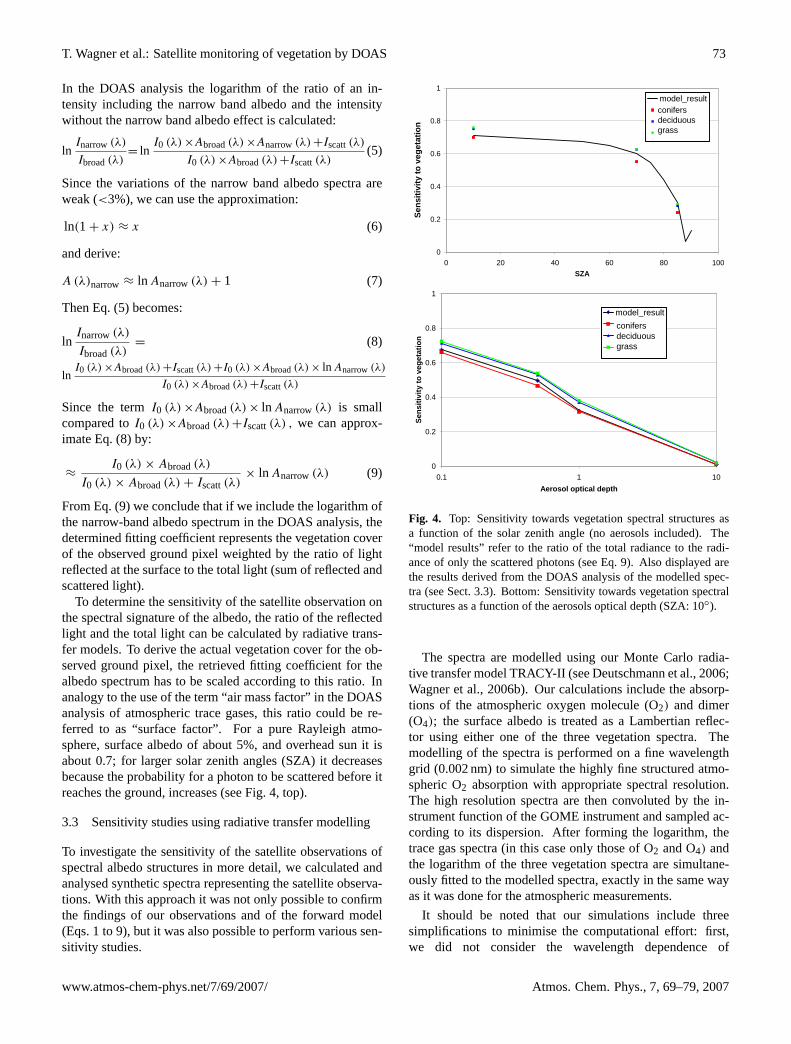
Fig. 4. Top: Sensitivity towards vegetation spectral structures asa function of the solar zenith angle (no aerosols included). The“model results” refer to the ratio of the total radiance to the radi-ance of only the scattered photons (see Eq. 9). Also displayed arethe results derived from the DOAS analysis of the modelled spec-tra (see Sect. 3.3). Bottom: Sensitivity towards vegetation spectralstructures as a function of the aerosols optical depth (SZA: 10◦).
The spectra are modelled using our Monte Carlo radia-tive transfer model TRACY-II (see Deutschmann et al., 2006;Wagner et al., 2006b). Our calculations include the absorp-tions of the atmospheric oxygen molecule (O2) and dimer(O4); the surface albedo is treated as a Lambertian reflec-tor using either one of the three vegetation spectra. Themodelling of the spectra is performed on a fine wavelengthgrid (0.002 nm) to simulate the highly fine structured atmo-spheric O2 absorption with appropriate spectral resolution.The high resolution spectra are then convoluted by the in-strument function of the GOME instrument and sampled ac-cording to its dispersion. After forming the logarithm, thetrace gas spectra (in this case only those of O2 and O4) andthe logarithm of the three vegetation spectra are simultane-ously fitted to the modelled spectra, exactly in the same wayas it was done for the atmospheric measurements.
It should be noted that our simulations include threesimplifications to minimise the computational effort: first,we did not consider the wavelength dependence of
www.atmos-chem-phys.net/7/69/2007/ Atmos. Chem. Phys., 7, 69–79, 2007
74 T. Wagner et al.: Satellite monitoring of vegetation by DOAS
-3
-2
-1
0
1
2
3
1 2 3 4 5 6 7 8 9 10 11
Air
Mas
s Fa
ctor
O4
-3
-2
-1
0
1
2
3
1 2 3 4 5 6 7 8 9 10 11
Air
Mas
s Fa
ctor
conifers decidous grass conifersno O2
no O4
incl
uded
incl
uded
incl
uded
incl
uded
excl
uded
excl
uded
excl
uded
excl
uded
O2
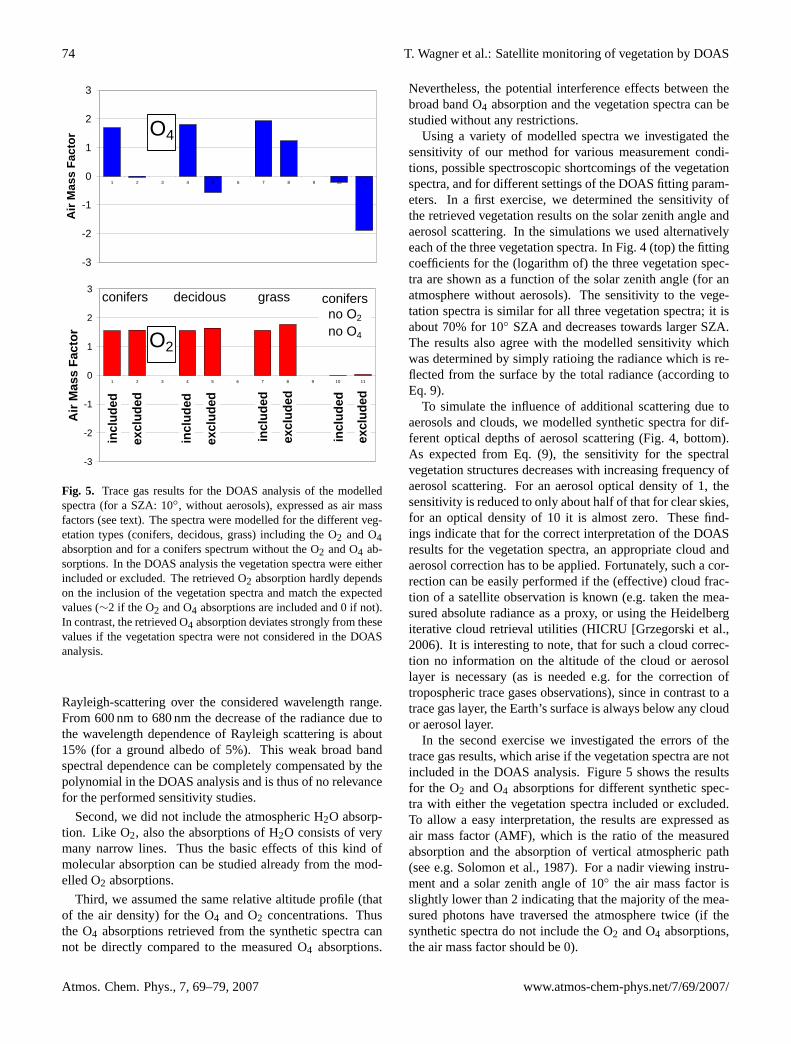
Fig. 5. Trace gas results for the DOAS analysis of the modelledspectra (for a SZA: 10◦, without aerosols), expressed as air massfactors (see text). The spectra were modelled for the different veg-etation types (conifers, decidous, grass) including the O2 and O4absorption and for a conifers spectrum without the O2 and O4 ab-sorptions. In the DOAS analysis the vegetation spectra were eitherincluded or excluded. The retrieved O2 absorption hardly dependson the inclusion of the vegetation spectra and match the expectedvalues (∼2 if the O2 and O4 absorptions are included and 0 if not).In contrast, the retrieved O4 absorption deviates strongly from thesevalues if the vegetation spectra were not considered in the DOASanalysis.
Rayleigh-scattering over the considered wavelength range.From 600 nm to 680 nm the decrease of the radiance due tothe wavelength dependence of Rayleigh scattering is about15% (for a ground albedo of 5%). This weak broad bandspectral dependence can be completely compensated by thepolynomial in the DOAS analysis and is thus of no relevancefor the performed sensitivity studies.
Second, we did not include the atmospheric H2O absorp-tion. Like O2, also the absorptions of H2O consists of verymany narrow lines. Thus the basic effects of this kind ofmolecular absorption can be studied already from the mod-elled O2 absorptions.
Third, we assumed the same relative altitude profile (thatof the air density) for the O4 and O2 concentrations. Thusthe O4 absorptions retrieved from the synthetic spectra cannot be directly compared to the measured O4 absorptions.
Nevertheless, the potential interference effects between thebroad band O4 absorption and the vegetation spectra can bestudied without any restrictions.
Using a variety of modelled spectra we investigated thesensitivity of our method for various measurement condi-tions, possible spectroscopic shortcomings of the vegetationspectra, and for different settings of the DOAS fitting param-eters. In a first exercise, we determined the sensitivity ofthe retrieved vegetation results on the solar zenith angle andaerosol scattering. In the simulations we used alternativelyeach of the three vegetation spectra. In Fig. 4 (top) the fittingcoefficients for the (logarithm of) the three vegetation spec-tra are shown as a function of the solar zenith angle (for anatmosphere without aerosols). The sensitivity to the vege-tation spectra is similar for all three vegetation spectra; it isabout 70% for 10◦ SZA and decreases towards larger SZA.The results also agree with the modelled sensitivity whichwas determined by simply ratioing the radiance which is re-flected from the surface by the total radiance (according toEq. 9).
To simulate the influence of additional scattering due toaerosols and clouds, we modelled synthetic spectra for dif-ferent optical depths of aerosol scattering (Fig. 4, bottom).As expected from Eq. (9), the sensitivity for the spectralvegetation structures decreases with increasing frequency ofaerosol scattering. For an aerosol optical density of 1, thesensitivity is reduced to only about half of that for clear skies,for an optical density of 10 it is almost zero. These find-ings indicate that for the correct interpretation of the DOASresults for the vegetation spectra, an appropriate cloud andaerosol correction has to be applied. Fortunately, such a cor-rection can be easily performed if the (effective) cloud frac-tion of a satellite observation is known (e.g. taken the mea-sured absolute radiance as a proxy, or using the Heidelbergiterative cloud retrieval utilities (HICRU [Grzegorski et al.,2006). It is interesting to note, that for such a cloud correc-tion no information on the altitude of the cloud or aerosollayer is necessary (as is needed e.g. for the correction oftropospheric trace gases observations), since in contrast to atrace gas layer, the Earth’s surface is always below any cloudor aerosol layer.
In the second exercise we investigated the errors of thetrace gas results, which arise if the vegetation spectra are notincluded in the DOAS analysis. Figure 5 shows the resultsfor the O2 and O4 absorptions for different synthetic spec-tra with either the vegetation spectra included or excluded.To allow a easy interpretation, the results are expressed asair mass factor (AMF), which is the ratio of the measuredabsorption and the absorption of vertical atmospheric path(see e.g. Solomon et al., 1987). For a nadir viewing instru-ment and a solar zenith angle of 10◦ the air mass factor isslightly lower than 2 indicating that the majority of the mea-sured photons have traversed the atmosphere twice (if thesynthetic spectra do not include the O2 and O4 absorptions,the air mass factor should be 0).
Atmos. Chem. Phys., 7, 69–79, 2007 www.atmos-chem-phys.net/7/69/2007/
T. Wagner et al.: Satellite monitoring of vegetation by DOAS 75
0
1
2
3
1 2 3 4 5 6 7
trace gas air m ass factors
-0.4
0
0.4
0.8
1.2
1 2 3 4 5 6 7
fitting coefficient for vegetation spectra
0
1
2
3
1 2 3 4 5 6 7 -0.4
0
0.4
0.8
1.2
1 2 3 4 5 6 7
0
1
2
3
1 2 3 4 5 6 7
O4O2
605
- 683
nm
, pol
. 4
611
- 683
nm
, pol
. 4
621
- 683
nm
, pol
. 4
611
- 664
nm
, pol
. 4
605
- 664
nm
, pol
. 4
605
- 683
nm, p
ol. 3
605
- 683
nm, p
ol. 2
-0.4
0
0.4
0.8
1.2
1 2 3 4 5 6 7
conifersdecidousgrass
605
- 683
nm
, pol
. 4
611
- 683
nm
, pol
. 4
621
- 683
nm
, pol
. 4
611
- 664
nm
, pol
. 4
605
- 664
nm
, pol
. 4
605
- 683
nm, p
ol. 3
605
- 683
nm, p
ol. 2
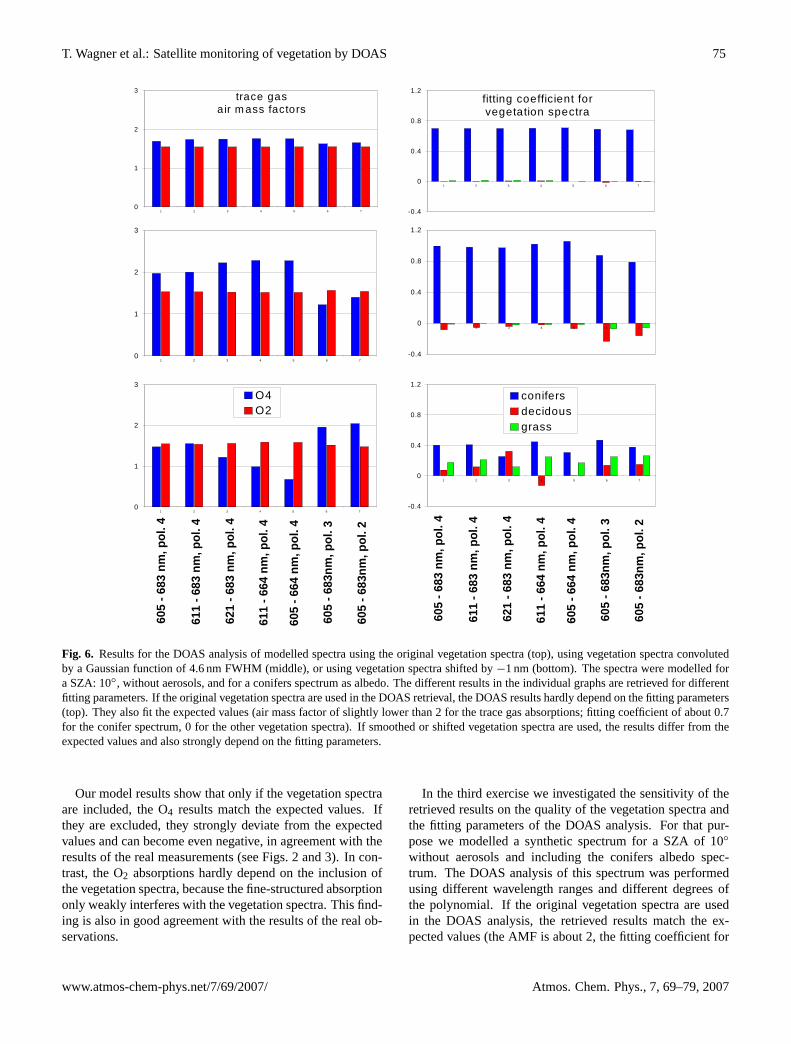
Fig. 6. Results for the DOAS analysis of modelled spectra using the original vegetation spectra (top), using vegetation spectra convolutedby a Gaussian function of 4.6 nm FWHM (middle), or using vegetation spectra shifted by−1 nm (bottom). The spectra were modelled fora SZA: 10◦, without aerosols, and for a conifers spectrum as albedo. The different results in the individual graphs are retrieved for differentfitting parameters. If the original vegetation spectra are used in the DOAS retrieval, the DOAS results hardly depend on the fitting parameters(top). They also fit the expected values (air mass factor of slightly lower than 2 for the trace gas absorptions; fitting coefficient of about 0.7for the conifer spectrum, 0 for the other vegetation spectra). If smoothed or shifted vegetation spectra are used, the results differ from theexpected values and also strongly depend on the fitting parameters.
Our model results show that only if the vegetation spectraare included, the O4 results match the expected values. Ifthey are excluded, they strongly deviate from the expectedvalues and can become even negative, in agreement with theresults of the real measurements (see Figs. 2 and 3). In con-trast, the O2 absorptions hardly depend on the inclusion ofthe vegetation spectra, because the fine-structured absorptiononly weakly interferes with the vegetation spectra. This find-ing is also in good agreement with the results of the real ob-servations.
In the third exercise we investigated the sensitivity of theretrieved results on the quality of the vegetation spectra andthe fitting parameters of the DOAS analysis. For that pur-pose we modelled a synthetic spectrum for a SZA of 10◦
without aerosols and including the conifers albedo spec-trum. The DOAS analysis of this spectrum was performedusing different wavelength ranges and different degrees ofthe polynomial. If the original vegetation spectra are usedin the DOAS analysis, the retrieved results match the ex-pected values (the AMF is about 2, the fitting coefficient for
www.atmos-chem-phys.net/7/69/2007/ Atmos. Chem. Phys., 7, 69–79, 2007
76 T. Wagner et al.: Satellite monitoring of vegetation by DOAS
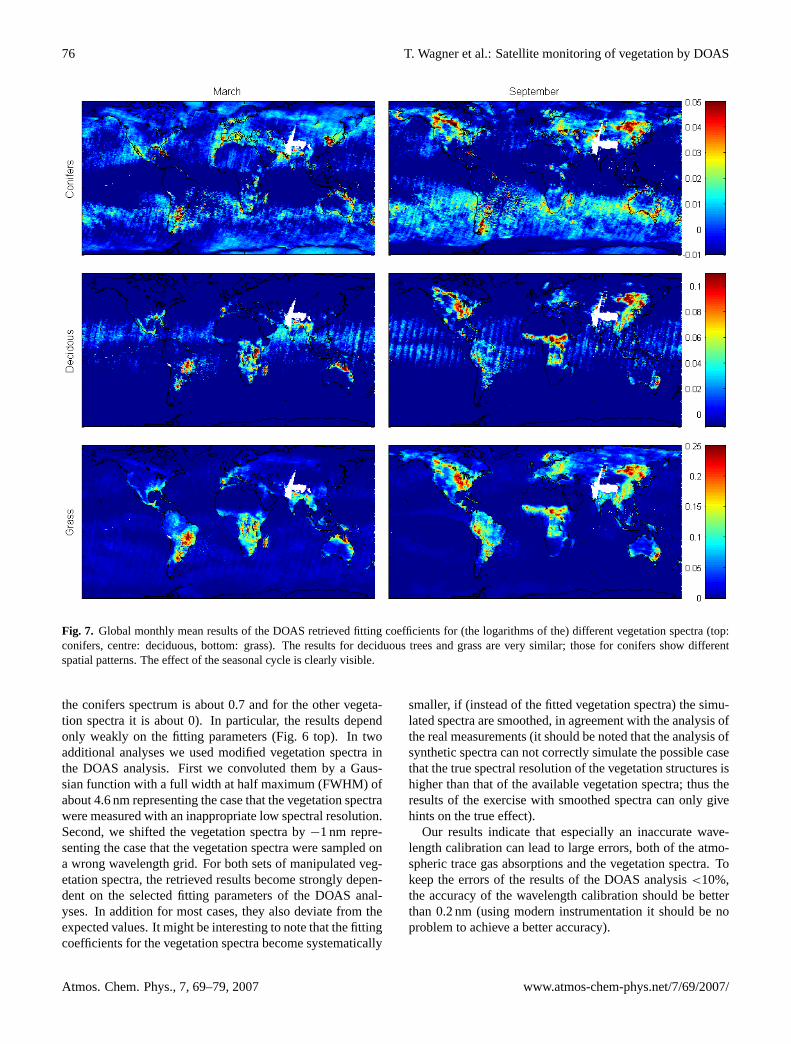
Fig. 7. Global monthly mean results of the DOAS retrieved fitting coefficients for (the logarithms of the) different vegetation spectra (top:conifers, centre: deciduous, bottom: grass). The results for deciduous trees and grass are very similar; those for conifers show differentspatial patterns. The effect of the seasonal cycle is clearly visible.
the conifers spectrum is about 0.7 and for the other vegeta-tion spectra it is about 0). In particular, the results dependonly weakly on the fitting parameters (Fig. 6 top). In twoadditional analyses we used modified vegetation spectra inthe DOAS analysis. First we convoluted them by a Gaus-sian function with a full width at half maximum (FWHM) ofabout 4.6 nm representing the case that the vegetation spectrawere measured with an inappropriate low spectral resolution.Second, we shifted the vegetation spectra by−1 nm repre-senting the case that the vegetation spectra were sampled ona wrong wavelength grid. For both sets of manipulated veg-etation spectra, the retrieved results become strongly depen-dent on the selected fitting parameters of the DOAS anal-yses. In addition for most cases, they also deviate from theexpected values. It might be interesting to note that the fittingcoefficients for the vegetation spectra become systematically
smaller, if (instead of the fitted vegetation spectra) the simu-lated spectra are smoothed, in agreement with the analysis ofthe real measurements (it should be noted that the analysis ofsynthetic spectra can not correctly simulate the possible casethat the true spectral resolution of the vegetation structures ishigher than that of the available vegetation spectra; thus theresults of the exercise with smoothed spectra can only givehints on the true effect).
Our results indicate that especially an inaccurate wave-length calibration can lead to large errors, both of the atmo-spheric trace gas absorptions and the vegetation spectra. Tokeep the errors of the results of the DOAS analysis<10%,the accuracy of the wavelength calibration should be betterthan 0.2 nm (using modern instrumentation it should be noproblem to achieve a better accuracy).
Atmos. Chem. Phys., 7, 69–79, 2007 www.atmos-chem-phys.net/7/69/2007/
T. Wagner et al.: Satellite monitoring of vegetation by DOAS 77
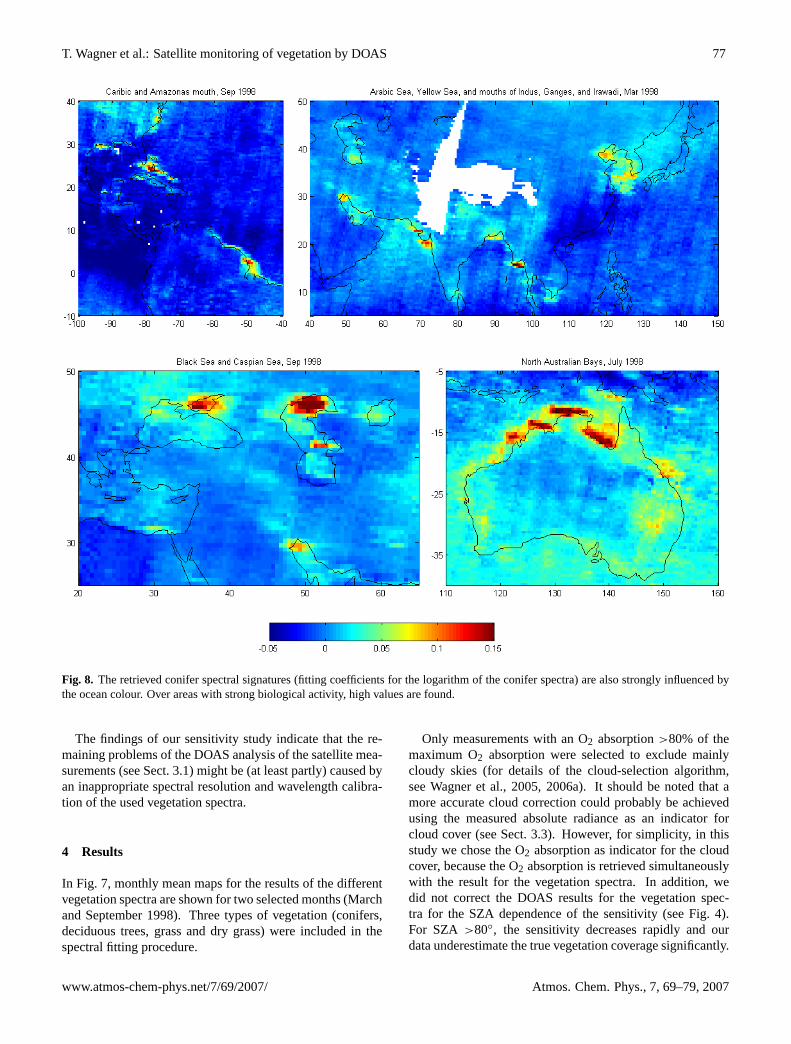
Fig. 8. The retrieved conifer spectral signatures (fitting coefficients for the logarithm of the conifer spectra) are also strongly influenced bythe ocean colour. Over areas with strong biological activity, high values are found.
The findings of our sensitivity study indicate that the re-maining problems of the DOAS analysis of the satellite mea-surements (see Sect. 3.1) might be (at least partly) caused byan inappropriate spectral resolution and wavelength calibra-tion of the used vegetation spectra.
4 Results
In Fig. 7, monthly mean maps for the results of the differentvegetation spectra are shown for two selected months (Marchand September 1998). Three types of vegetation (conifers,deciduous trees, grass and dry grass) were included in thespectral fitting procedure.
Only measurements with an O2 absorption>80% of themaximum O2 absorption were selected to exclude mainlycloudy skies (for details of the cloud-selection algorithm,see Wagner et al., 2005, 2006a). It should be noted that amore accurate cloud correction could probably be achievedusing the measured absolute radiance as an indicator forcloud cover (see Sect. 3.3). However, for simplicity, in thisstudy we chose the O2 absorption as indicator for the cloudcover, because the O2 absorption is retrieved simultaneouslywith the result for the vegetation spectra. In addition, wedid not correct the DOAS results for the vegetation spec-tra for the SZA dependence of the sensitivity (see Fig. 4).For SZA >80◦, the sensitivity decreases rapidly and ourdata underestimate the true vegetation coverage significantly.
www.atmos-chem-phys.net/7/69/2007/ Atmos. Chem. Phys., 7, 69–79, 2007
78 T. Wagner et al.: Satellite monitoring of vegetation by DOAS
However, for the GOME observations during the selectedmonths SZA>80◦ occur only for latitudes north and southof 75◦ N and 75◦ S, respectively.
The results for the three vegetation spectra show charac-teristic spatio-temporal patterns. The relative patterns for de-ciduous trees and grass are almost identical. This is an in-teresting finding, since both spectra show different narrow-band spectral structures (Fig. 1). It indicates that the ob-served spectral structures of vegetation contain componentsof both vegetation spectra. For conifers, different patternswere found. Enhanced values are mainly located over themid and high-latitude regions of the northern hemisphericcontinents, in good agreement with the global distributionof boreal coniferous forest. It is interesting to note that es-pecially the results for conifers are also influenced by theocean colour. Enhanced values are found over regions withhigh biological activity, particularly close to the mouths ofbig rivers (see Fig. 8). In some of these regions, also coralreefs exist, which might have also contributed to the mea-sured vegetation signal. It should be noted that in this study,no ocean spectra could be included in the analysis because ofthe typically very low spectral resolution and/or sampling ofavailable ocean spectra.
From our satellite results of vegetation and ocean colourthe seasonal cycle of the biological activity in different partsof the world can be clearly followed and similar patterns arefound in different years. A comparison to other global datasets of vegetation coverage reveals a good agreement (seee.g. the NOAA Global Vegetation Index Products, availablevia http://www.osdpd.noaa.gov/PSB/IMAGES/gvi.html). Acomprehensive validation is, however, out of scope of thisprototype study and should be the subject of future investi-gations.
The vegetation results can in principle be retrieved on adaily basis; averaging over longer periods of time leads tomore consistent patterns, mainly because then the maskingdue to clouds has a much weaker impact.
5 Discussion and conclusions
We included spectra of the (logarithm of the) spectral re-flectance for different types of vegetation in the DOAS fittingprocedure for the analysis of atmospheric trace gases in thered part of the electromagnetic spectrum. Besides a signif-icant improvement of the fitting results for the atmospherictrace gases, this inclusion enables also the retrieval of veg-etation properties from satellite observations. In contrast tothe analysis of vegetation indices in the red and near-infraredpart of the spectrum (e.g. Jensen, 2000), here we made use ofthe narrow-band spectral information. In the red part of thespectrum the amplitude of the spectral structures of vegeta-tion is small (<3%), but can be clearly identified in the mea-sured spectra. It is in particular possible to identify differentkinds of vegetation. Our new method is not only sensitive
to vegetation over the continents, but also to the biologicalactivity in the oceans. Especially in the mouths of big riversand over areas with coral reefs strong vegetation signals canbe found. One particular advantage of our new vegetationanalysis is that the correction of atmospheric absorption pro-cesses is automatically included in the retrieval.
Our results indicate that the currently available vegetationspectra are probably not of sufficient quality to obtain op-timum DOAS fitting results, which is understandable sincethese spectra were of course taken for other purposes. Evenif the vegetation spectra are included in the DOAS analysis,the residual still shows remaining systematic structures (seeFig. 2). From our sensitivity studies we conclude that par-ticularly the spectral resolution and the spectral calibrationshould be improved (accuracy of the wavelength calibrationshould be better than 0.2 nm and spectral resolution similar toGOME). In addition, it seems that the selected spectra mightnot be fully representative for the spectral structures typicallyobserved by satellite sensors. We therefore strongly recom-mend the measurement of new vegetation spectra coveringa larger variety of species including marine algae, differentkinds of phytoplankton and coral reefs with better spectralquality. Our results indicate that using this new method itmight be possible in the future to monitor the seasonal cyclesas well as short term variations of different types of vegeta-tion on a global scale.
Our new vegetation algorithm can also be applied toadditional satellite sensors with sufficient coverage of thered spectral region, namely the SCanning Imaging Absorp-tion SpectroMeter for Atmospheric ChartographY (SCIA-MACHY) on ENVISAT in Bovensmann et al. (1999), aswell as the three instruments of the GOME-II series (EU-METSAT, 2005) (the first instrument has been successfullylaunched in October 2006). Compared to the GOME-I in-strument, the spatial resolution of these sensors is much bet-ter (footprints of 30×60 km2 and 40×80 km2, respectively)allowing to retrieve much finer details of the vegetation pat-terns.
Acknowledgements.The spectra of the vegetation reflectance werereproduced from the ASTER Spectral Library through the courtesyof the Jet Propulsion Laboratory, California Institute of Technology,Pasadena, California. ©1999, California Institute of Technology.ALL RIGHTS RESERVED, see alsohttp://speclib.jpl.nasa.gov/.Special thanks are expressed to M. Bugert for helpful informationon chlorophyll spectra.
Edited by: S. Quegan
References
Birth, G. S. and McVey, G.: Measuring the color growing turf with areflectance spectrophotometer, Agronomy J., 60, 640–643, 1968.
Bovensmann, H., Burrows, J. P., Buchwitz, M., Frerik, J., Noel, S.,Rozanov, V. V., Chance, K. V., and Goede, A.: SCIAMACHY –
Atmos. Chem. Phys., 7, 69–79, 2007 www.atmos-chem-phys.net/7/69/2007/
T. Wagner et al.: Satellite monitoring of vegetation by DOAS 79
mission objectives and measurement modes, J. Atmos. Sci., 56,127–150, 1999.
Burrows, J. P., Weber, M., Buchwitz, M., Rozanov, V., Ladstatter-Weißenmayer, A., Richter, A., DeBeek, R., Hoogen, R., Bram-stedt, K., Eichmann, K.-U., Eisinger, M., and Perner, D.: TheGlobal Ozone Monitoring Experiment (GOME): Mission Con-cept and First Scientific Results, J. Atmos. Sci., 56, 151–175,1999.
Clark, R. N., King, T. V. V., Ager, C., and Swayze, G. A.: Initialvegetation species and senescence/stress mapping in the San LuisCalley, Colorado using imaging spectrometer data, Proceedings:Summitville Forum ’95, edited by: Posey, H. H., Pendelton, J.A., and Van Zyl, D., Colorado Geological Survey Special Publi-cation, 38, 64–69, 1995.
Deutschmann, T., Wagner, T., and v. Friedeburg, C.: TRACY-IIUsers manual, University of Heidelberg, 2006.
ESA Publication Division (SP-1182): GOME, Global Ozone Mon-itoring Experiment, users manual, edited by: Bednarz, F., Euro-pean Space Research and Technology Centre (ESTEC), Frascati,Italy, 1995.
EUMETSAT: GOME-2 Products Guide,http://www.eumetsat.int/en/area4/eps/productguides/GOME-2/GOME2-PG.pdf, 2005.
Grzegorski, M., Wenig, M., Platt, U., Stammes, P., Fournier, N., andWagner, T.: The Heidelberg iterative cloud retrieval utilities (HI-CRU) and its application to GOME data, Atmos. Chem. Phys.,6, 4461–4476, 2006,http://www.atmos-chem-phys.net/6/4461/2006/.
Gutman, G. G.: Vegetation indices from AVHRR: An update andfuture prospects, Rem. Sens. Environ. 35, 121–136, 1991.
Huete, A. R.: A Soil-Adjusted Vegetation Index (SAVI), Rem. Sens.Environ., 25, 295–309, 1988.
Jensen, J. R.: Remote Sensing of the Environment: An Earth Re-source Respective, Prentice Hall, Upper Saddle River, New Jer-sey, 353, 2000.
Jordan, C. F.: Derivation of leaf-area index from quality of light onthe forest floor, Ecology, 50(4), 663–666, 1969.
Platt, U.: Differential optical absorption spectroscopy (DOAS), Airmonitoring by spectroscopic techniques, edited by: Sigrist, M.W., Chemical Analysis Series, 127, John Wiley & Sons, Inc,1994.
Rouse, J. W., Haas, R. H., Schell, J. A., and Deering, D. W.: Mon-itoring Vegetation Systems in the Great Plains with ERTS, Pro-ceedings, Third Earth Resources Technology Satellite-1 Sympo-sium, Greenbelt: NASA SP-351, 3010–3017, 1974.
Solomon, S., Schmeltekopf, A. L., and Sanders, R. W.: On the in-terpretation of zenith sky absorption measurements, J. Geophys.Res, 92, 8311–8319, 1987.
Wagner, T., Beirle, S., Grzegorski, M., Sanghavi, S., and Platt, U.:El-Nino induced anomalies in global data sets of water vapourand cloud cover derived from GOME on ERS-2, J. Geophys.Res., 110, D15104, doi:10.1029/2005JD005972, 2005.
Wagner, T., Beirle, S., Grzegorski, M., and Platt, U.: Global trends(1996 to 2003) of total column precipitable water observed byGOME on ERS-2 and their relation to surface-near temperature,J. Geophys. Res., 111, D12102, doi:10.1029/2005JD006523,2006a.
Wagner, T., Burrows, J. P., Deutschmann, T., et al.: Comparisonof Box-Air-Mass-Factors and Radiances for Multiple-Axis Dif-ferential Optical Absorption Spectroscopy (MAX-DOAS) Ge-ometries calculated from different UV/visible Radiative TransferModels, Atmos. Chem. Phys. Discuss., 6, 9823–9876, 2006b.
www.atmos-chem-phys.net/7/69/2007/ Atmos. Chem. Phys., 7, 69–79, 2007


![Decreto 69 2007 de 29-05-2007[1]](https://img.pdfslide.net/doc/110x75/58ee009d1a28ab4b288b4567/decreto-69-2007-de-29-05-20071.jpg)