Embed Size (px)
Citation preview
Acquisition of Acquisition of Seabrook Nuclear Seabrook Nuclear Generating PlantGenerating PlantApril 16, 2002April 16, 2002

Safe Harbor Statement: Any statements made herein about future operating results or other future events are forward-looking statements under the Safe Harbor Provisions of the Private Securities Litigation Reform Act of 1995. Actual results may differ substantially from such forward-looking statements. A discussion of factors that could cause actual results or events to vary is contained in FPL Group's 2001 SEC Form 10-K.
2
Forward Statements
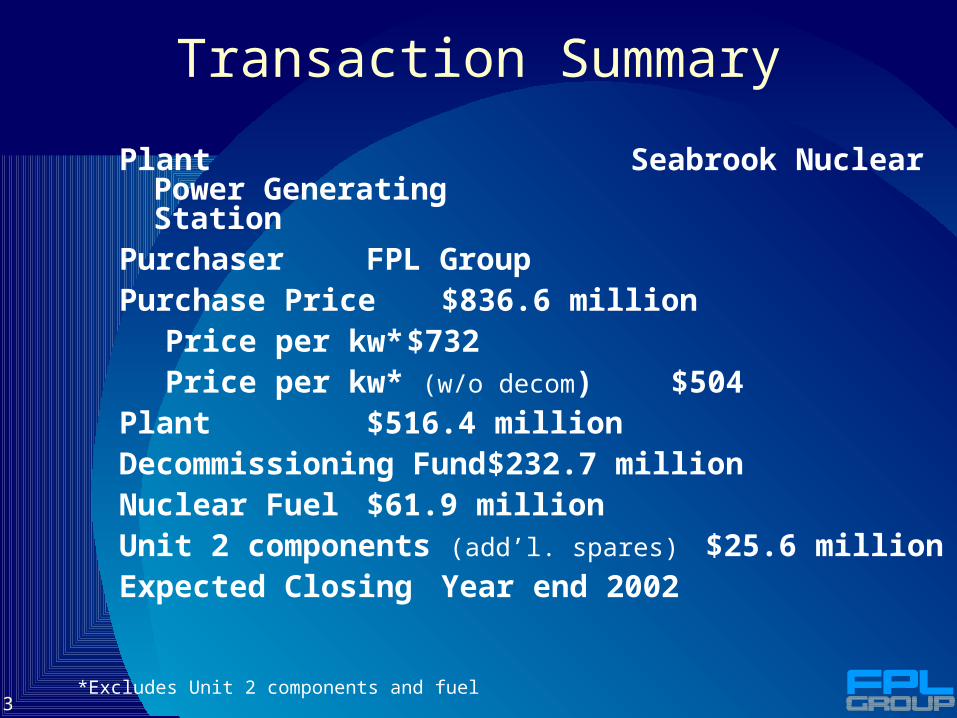
3*Excludes Unit 2 components and fuel
Transaction Summary
Plant Seabrook Nuclear Power GeneratingStation
Purchaser FPL GroupPurchase Price $836.6 million
Price per kw* $732Price per kw* (w/o decom) $504
Plant $516.4 million Decommissioning Fund $232.7 millionNuclear Fuel $61.9 millionUnit 2 components (add’l. spares) $25.6 millionExpected Closing Year end 2002
4
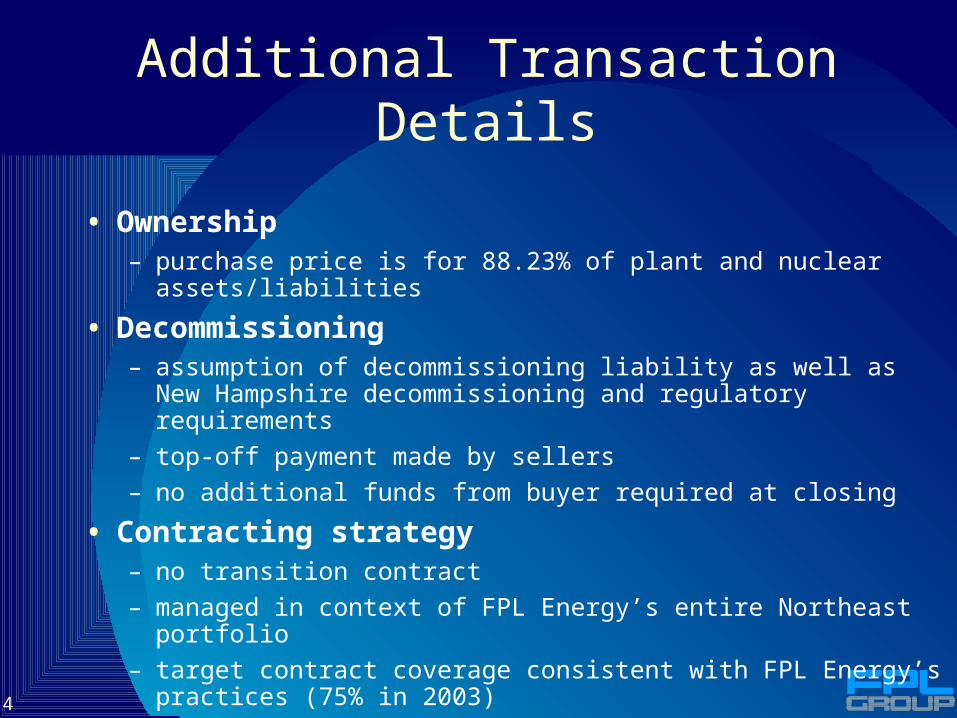
Additional Transaction Details
• Ownership– purchase price is for 88.23% of plant and nuclear assets/liabilities
• Decommissioning– assumption of decommissioning liability as well as New
Hampshire decommissioning and regulatory requirements
– top-off payment made by sellers
– no additional funds from buyer required at closing
• Contracting strategy – no transition contract
– managed in context of FPL Energy’s entire Northeast portfolio
– target contract coverage consistent with FPL Energy’s practices (75% in 2003)
5
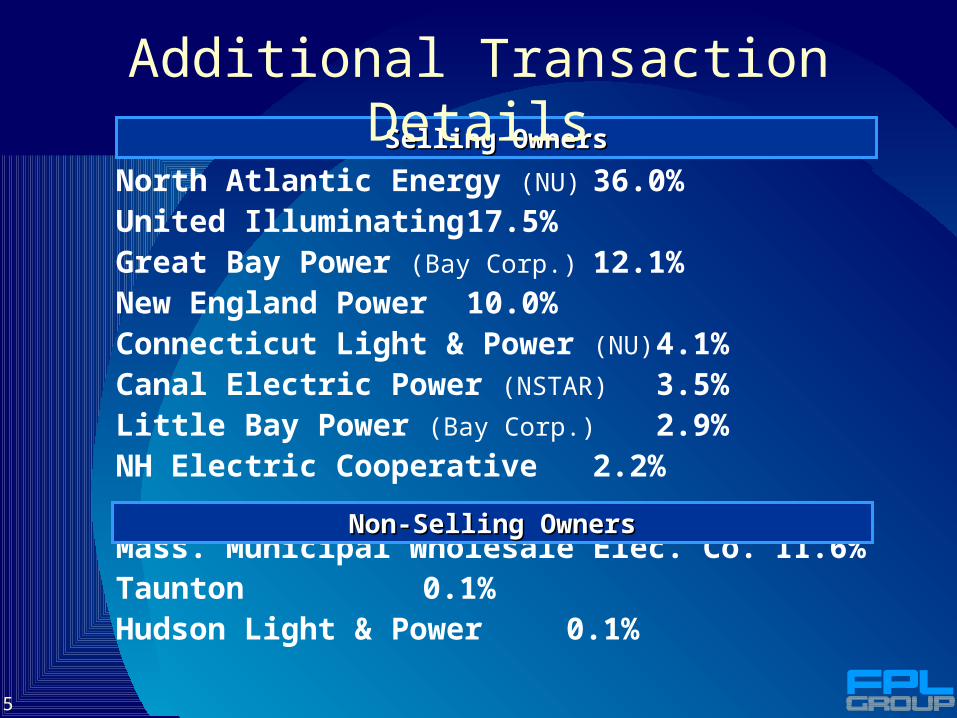
North Atlantic Energy (NU) 36.0%United Illuminating 17.5%Great Bay Power (Bay Corp.) 12.1%New England Power 10.0%Connecticut Light & Power (NU) 4.1%Canal Electric Power (NSTAR) 3.5%Little Bay Power (Bay Corp.) 2.9%NH Electric Cooperative 2.2%
Mass. Municipal Wholesale Elec. Co. 11.6%Taunton 0.1%Hudson Light & Power 0.1%
Selling OwnersSelling Owners
Non-Selling OwnersNon-Selling Owners
Additional Transaction Details

6
Governmental Approvals
• Federal Energy Regulatory Commission• Nuclear Regulatory Commission • Federal Trade Commission
or Department of Justice• Environmental Protection Agency • Federal Communications Commission• New Hampshire Nuclear Decommissioning
Finance Committee• New Hampshire Site Evaluation Committee• New Hampshire Department of
Environmental Services• Town of Seabrook

7
Why We Like the Deal
• Great asset• Fits our strategy• Complements our Northeast portfolio• Plays to our strengths
– nuclear operations– trading expertise
• Financially attractive
8
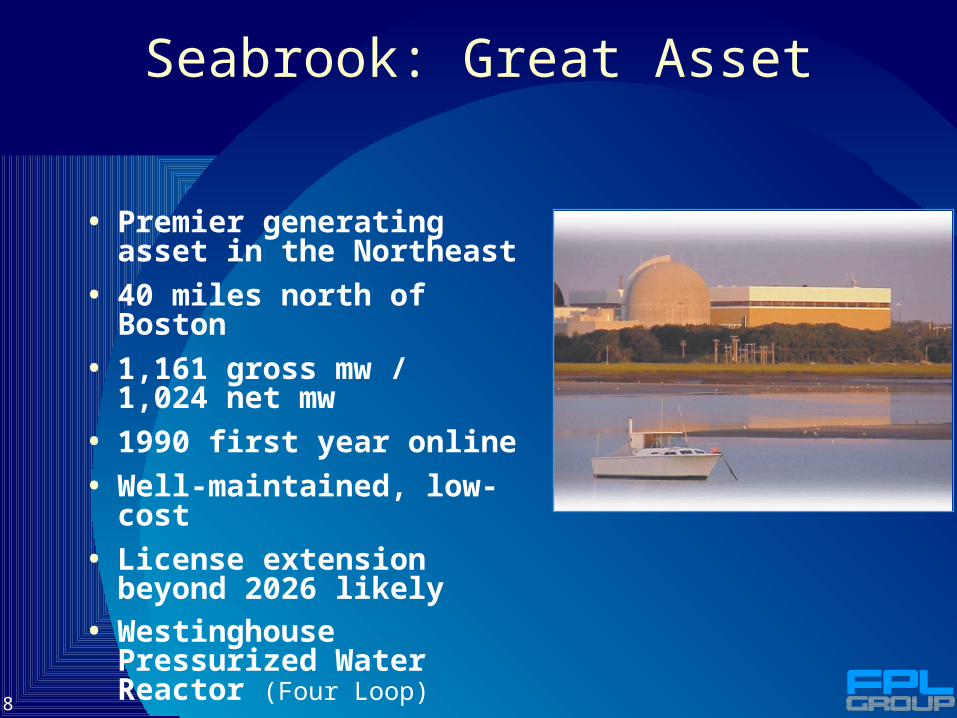
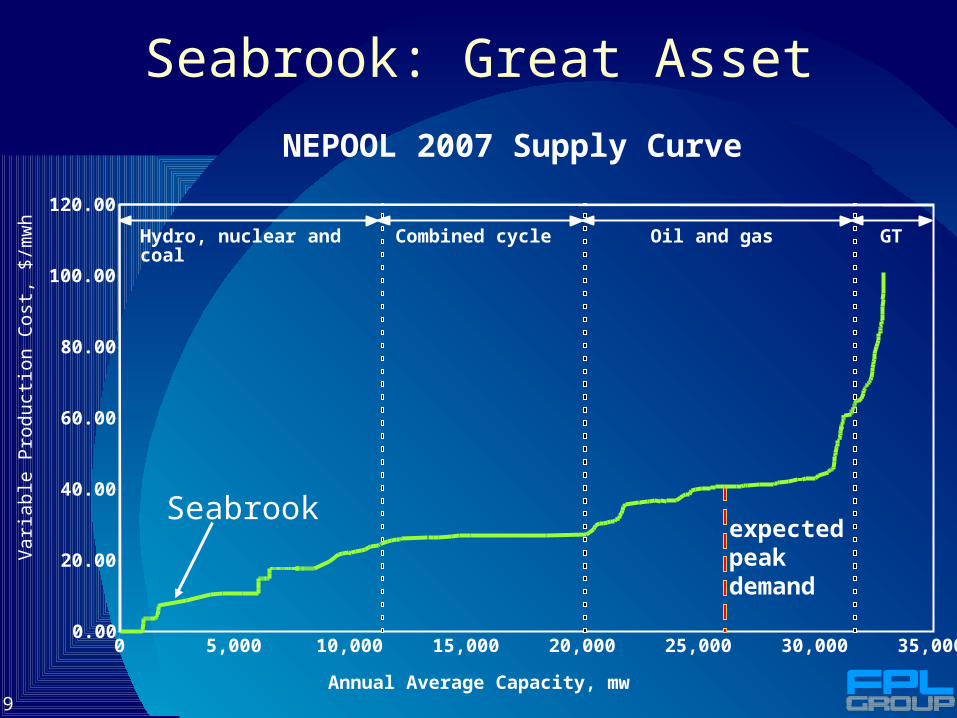
Seabrook: Great Asset
• Premier generating asset in the Northeast
• 40 miles north of Boston
• 1,161 gross mw / 1,024 net mw
• 1990 first year online
• Well-maintained, low-cost
• License extension beyond 2026 likely
• Westinghouse Pressurized Water Reactor (Four Loop)
9
NEPOOL 2007 Supply Curve
0.00
20.00
40.00
60.00
80.00
100.00
120.00
0 5,000 10,000 15,000 20,000 25,000 30,000 35,000
Annual Average Capacity, mw
Var
iabl
e P
rodu
ctio
n C
ost,
$/m
wh
Hydro, nuclear and coal Combined cycle Oil and gas GT
Seabrookexpected peak demand
Seabrook: Great Asset

10
Why We Like the Deal
• Great asset• Fits our strategy• Complements our Northeast portfolio• Plays to our strengths
– nuclear operations– trading expertise
• Financially attractive

11
Major diversified wholesale electric generator Major diversified wholesale electric generator which adds value by actively managing and trading which adds value by actively managing and trading energy commodities in conjunction with our assetsenergy commodities in conjunction with our assets
Major diversified wholesale electric generator Major diversified wholesale electric generator which adds value by actively managing and trading which adds value by actively managing and trading energy commodities in conjunction with our assetsenergy commodities in conjunction with our assets
Fits FPL Energy’s Strategy
Seabrook
• Clean• Diverse fuel sources • Build critical mass in key regions• Dispatch diversity• Low-cost• Operating control and majority ownership

12 Percentages may not add to 100% due to rounding
FPL Energy Fuel Source Diversity
Current
Pro forma w/Seabrook 12/31/02
Pro forma w/Seabrook 2004
Gas 46% 46% 59%
Wind 28% 24% 21%
Hydro 7% 5% 3%
Oil 15% 9% 7%
Other 5% 3% 2%
Nuclear 0% 13% 9%
100% 100% 100%
TOTAL mw 5,063 7,976 11,588

13Percentages may not add to 100% due to rounding
FPL Energy Regional Diversity
Northeast 28% 38% 26%
Central &Mid West
35% 29% 37%
Mid-Atlantic& Southeast
20% 13% 21%
West 16% 20% 16%
100% 100% 100%
TOTAL mw 5,063 7,976 11,588
Current
Pro forma w/Seabrook 12/31/02
Pro forma w/Seabrook 2004
14
Why We Like the Deal
• Great asset• Fits our strategy• Complements our Northeast portfolio• Plays to our strengths
– nuclear operations– trading expertise
• Financially attractive

15
Complements FPL Energy’s Northeast Portfolio
Hydro (29)
Oil (3)
RISEP
Bellingham
Sayreville
Seabrook
Bayswater
Ebensburg
Montgomery Co.
Marcus Hook 50Marcus Hook 750
Birch
In operationUnder construction

16
ProjectMaine Hydro 373Maine Oil 755Bellingham 148Sayreville 148Pennsylvania assets 75 Current Total 1,497
RISEP (mid ‘02)535Bayswater (mid ‘02) 54Seabrook (end ‘02) 1,024Marcus Hook 750 (mid ‘04) 744 Pro Forma Total 3,854
FPL Energy Assets inthe Northeast
Oil 20%
Natural Gas 44%
Nuclear 27%Hydro 10%
Other 1%
Net MW
Totals may not add due to rounding
17
Why We Like the Deal
• Great asset• Fits our strategy• Complements our Northeast portfolio• Plays to our strengths
– nuclear operations– trading expertise
• Financially attractive

18
FPL Group Nuclear Portfolio
Net mwReactor
Type
Turkey Point 3 693 PWR
Turkey Point 4 693 PWR
St. Lucie 1 839 PWR
St. Lucie 2 714 PWR
Total 2,939
Seabrook 1,024 PWR
Pro forma Total 3,963
• FPL is an experienced operator of PWRs
• Seabrook expands nuclear portfolio by more than 30%

19
Top-Tier Nuclear Performance
Data Source: Institute of Nuclear Power Operators (INPO) U.S. sites
2001 WANO Performance IndexAll U.S. Sites
0
20
40
60
80
100
Turkey Point 4 3 St. Lucie 2 1
20
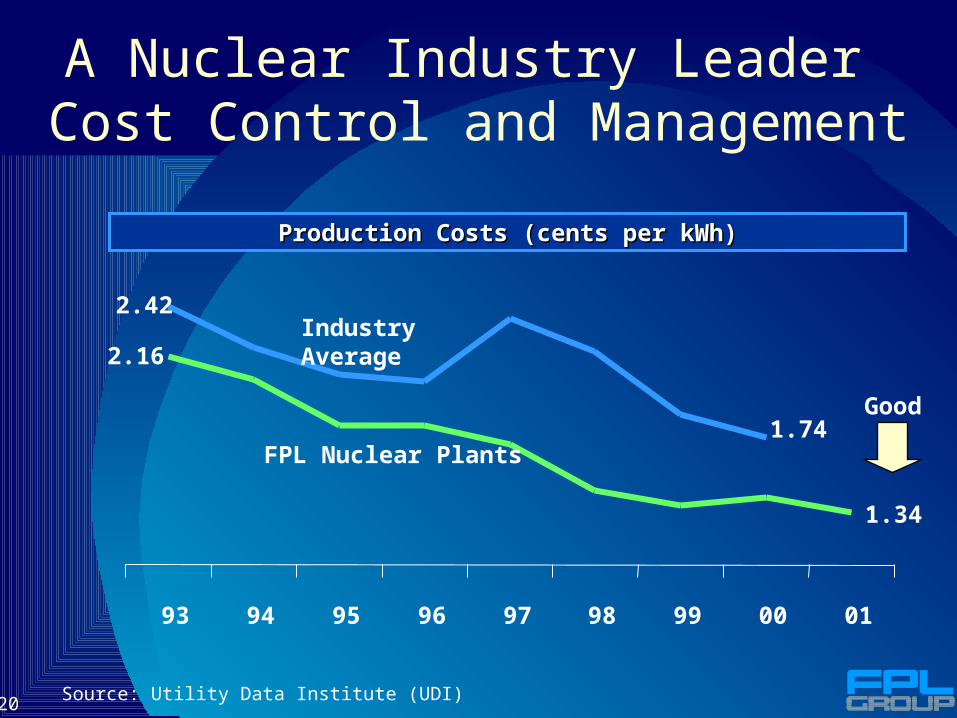
Production Costs (cents per kWh)Production Costs (cents per kWh)
1.74
2.42
2.16
1.34
93 94 95 96 97 98 99 00 01
Industry Average
FPL Nuclear Plants
Source: Utility Data Institute (UDI)
Good
A Nuclear Industry Leader Cost Control and Management
21
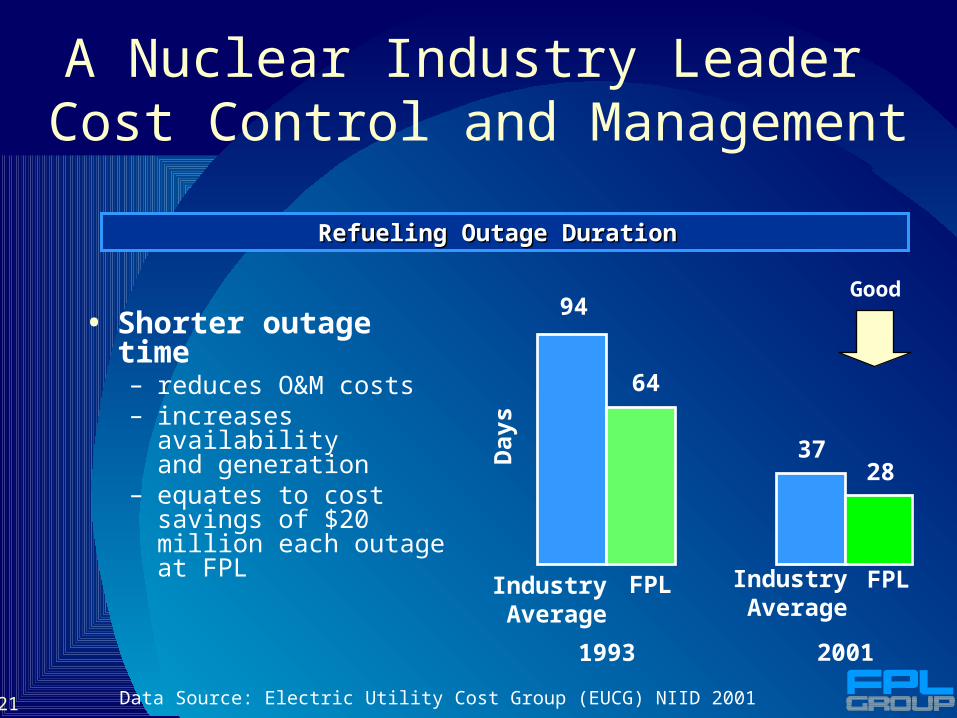
Refueling Outage Duration Refueling Outage Duration
Data Source: Electric Utility Cost Group (EUCG) NIID 2001
Good
Day
s
94
37
64
28
1993 2001
Industry Average
FPL Industry Average
FPL
A Nuclear Industry Leader Cost Control and Management
• Shorter outage time– reduces O&M costs– increases availability
and generation– equates to cost savings
of $20 million each outage at FPL
22
Significant Trading Experience in the Northeast
• 1,423 operating mw / 2,447 mw with Seabrook– Hydro, Gas, Oil, Nuclear
• Approximately 50% of FPL Energy’s marketing and trading activity is in NEPOOL
• Currently trading:– Gas– Fuel oil– Electricity
• FPL Energy employees’ trading and marketing in NEPOOL dates back to the early 1990’s
• FPL Energy employee (Roberto Denis) is NEPOOL Chairman
23
Why We Like the Deal
• Great asset• Fits our strategy• Complements our Northeast portfolio• Plays to our strengths
– nuclear operations– trading expertise
• Financially attractive
24
Financially Attractive
Purchase made at an attractive price• $732 / kW excluding fuel cost
– equal in price to Millstone 3
Positive impact on earnings• Modestly accretive to EPS in 2003 ($0.01-$0.04)
• $0.10 - $0.12 cents average annual EPS accretion 2004 - 2006
• Accelerating accretion beyond 2006• Based on current forward price curvesAttractive financial returns• Strong cash flow• Substantial NPV• 18 - 20% ROE

25
$0
$50
$100
$150
$200
$250
$300
$350
$400
$450
$500
Unit Uprate OperationalImprovements
License Renewal
NP
V U
psi
de
Po
ten
tial
$40 - $50
$280 - $330
$80 - $120
Substantial Value Creation Potential
$ millions

26
Financing Consistent with FPL Group Plan
• Strong commitment to credit quality
• Target 50% / 50% debt / equity ratio
• Initially financed via a combination of:– $200-300 million equity issuance in 2003 in
conjunction with acquisition
– short-term borrowings
• Opportunistically access capital markets for take-out of short-term financing
27
Summary
• Great asset• Fits our strategy• Complements our Northeast portfolio• Plays to our strengths
– nuclear operations– trading expertise
• Financially attractive