Embed Size (px)
Citation preview
ACT PubliC HeAlTH ServiCeSQuarterly Performance Report
June 2016
June 2016
ACT PubliC HeAlTH ServiCeS Quarterly Performance Report
2
introduction SummaryThis is the fourth Quarterly Report on ACT public health system performance for 2015–16. The format for the report provides readers with additional background information as well as a visualisation of the performance against existing targets. Recent targets implemented through the National Health Reform Agreement (NHRA); Improving Public Hospitals were discontinued in the 2014–15 Quarterly Report following the Federal Government’s decision, announced in the 2014–15 Federal Budget, to remove associated incentives. The performance measures have been retained by ACT Health and are contained in the respective Emergency Department (ED) and Elective Surgery sections of this report.
The Quality and Safety section of the report encompasses indicators such as the hospital acquired Staphylococcus aureus bacteraemia Infection rate (SAB rate) and hand hygiene audit results which are now reported nationally on the MyHospitals website.
In 2015–16, 66% of all Emergency Department presentations had a length of stay of four hours or less. This result is a 3% improvement when compared with the results reported for the same period last year.
Note: ACT Health undertakes data validations and continuous data quality improvement. This may lead to minor changes in activity figures across years.
In 2015–16, ACT public hospitals’ occupancy was 86%, this is consistent with the results for the same period in the previous year. In 2015–16, 83% of all radiotherapy patients were seen within standard timeframes. In 2014–15 the radiotherapy performance measures and targets were revised in line with the National Radiation Oncology Practice Standards. This means that radiotherapy waiting time results from 2014–15 on, are no longer comparable with previous years.
There have been a total of 5,288 births at ACT public hospitals in 2015–16.
June 2016
ACT PubliC HeAlTH ServiCeS Quarterly Performance Report
3
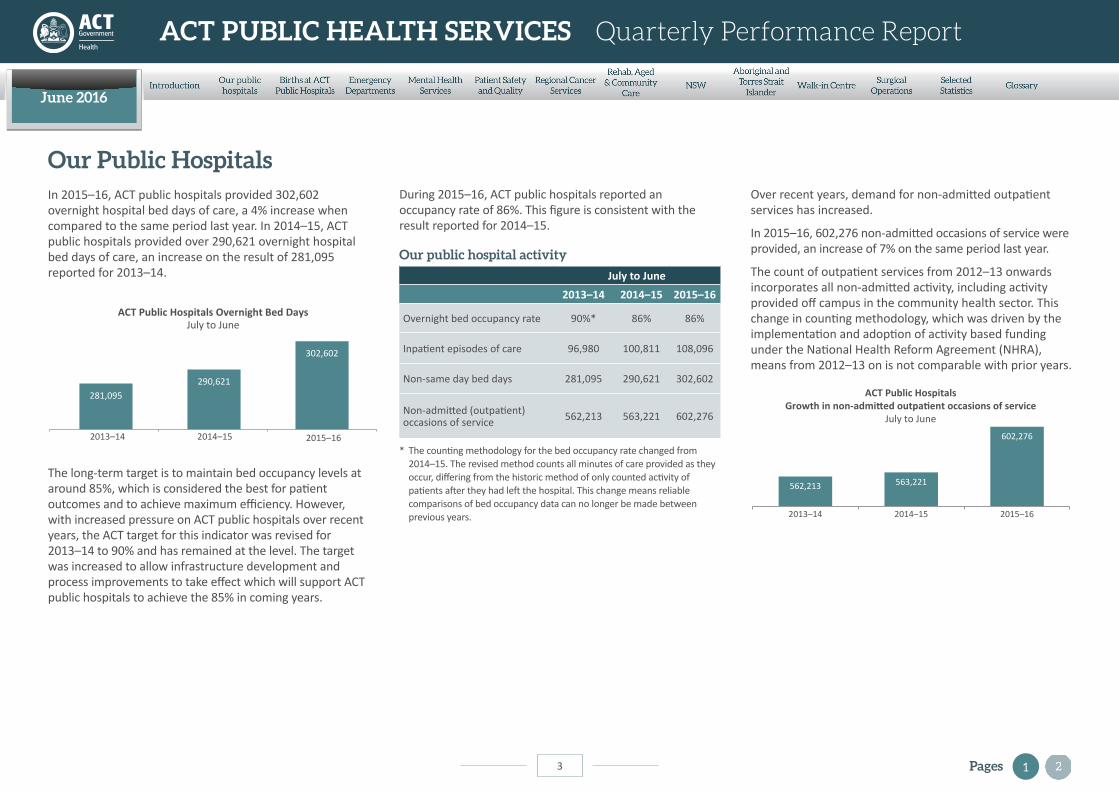
Our Public HospitalsIn 2015–16, ACT public hospitals provided 302,602 overnight hospital bed days of care, a 4% increase when compared to the same period last year. In 2014–15, ACT public hospitals provided over 290,621 overnight hospital bed days of care, an increase on the result of 281,095 reported for 2013–14.
ACT Public Hospitals Overnight Bed DaysJuly to June
281,095290,621
302,602
2013–14 2014–15 2015–16
The long-term target is to maintain bed occupancy levels at around 85%, which is considered the best for patient outcomes and to achieve maximum efficiency. However, with increased pressure on ACT public hospitals over recent years, the ACT target for this indicator was revised for 2013–14 to 90% and has remained at the level. The target was increased to allow infrastructure development and process improvements to take effect which will support ACT public hospitals to achieve the 85% in coming years.
During 2015–16, ACT public hospitals reported an occupancy rate of 86%. This figure is consistent with the result reported for 2014–15.
Our public hospital activity
July to June
2013–14 2014–15 2015–16
Overnight bed occupancy rate 90%* 86% 86%
Inpatient episodes of care 96,980 100,811 108,096
Non-same day bed days 281,095 290,621 302,602
Non-admitted (outpatient) occasions of service 562,213 563,221 602,276
* The counting methodology for the bed occupancy rate changed from 2014–15. The revised method counts all minutes of care provided as they occur, differing from the historic method of only counted activity of patients after they had left the hospital. This change means reliable comparisons of bed occupancy data can no longer be made between previous years.
Over recent years, demand for non-admitted outpatient services has increased.
In 2015–16, 602,276 non-admitted occasions of service were provided, an increase of 7% on the same period last year.
The count of outpatient services from 2012–13 onwards incorporates all non-admitted activity, including activity provided off campus in the community health sector. This change in counting methodology, which was driven by the implementation and adoption of activity based funding under the National Health Reform Agreement (NHRA), means from 2012–13 on is not comparable with prior years.
ACT Public HospitalsGrowth in non-admitted outpatient occasions of service
July to June
2013–14 2014–15
562,213 563,221
602,276
2015–16
1Pages
June 2016
ACT PubliC HeAlTH ServiCeS Quarterly Performance Report
4
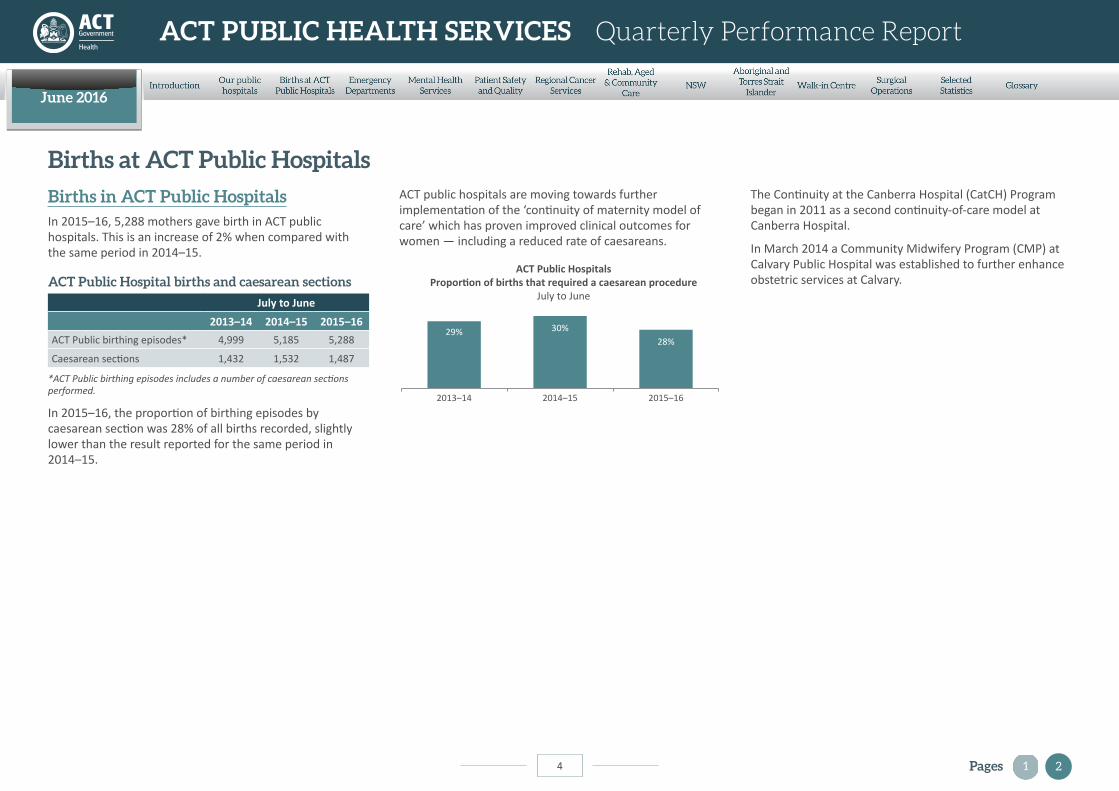
births in ACT Public HospitalsIn 2015–16, 5,288 mothers gave birth in ACT public hospitals. This is an increase of 2% when compared with the same period in 2014–15.
ACT Public Hospital births and caesarean sections
July to June
2013–14 2014–15 2015–16
ACT Public birthing episodes* 4,999 5,185 5,288
Caesarean sections 1,432 1,532 1,487
*ACT Public birthing episodes includes a number of caesarean sections performed.
In 2015–16, the proportion of birthing episodes by caesarean section was 28% of all births recorded, slightly lower than the result reported for the same period in 2014–15.
2Pages
births at ACT Public HospitalsACT public hospitals are moving towards further implementation of the ‘continuity of maternity model of care’ which has proven improved clinical outcomes for women — including a reduced rate of caesareans.
30%29%
2013–14 2014–15 2015–16
ACT Public HospitalsProportion of births that required a caesarean procedure
July to June
28%
The Continuity at the Canberra Hospital (CatCH) Program began in 2011 as a second continuity-of-care model at Canberra Hospital.
In March 2014 a Community Midwifery Program (CMP) at Calvary Public Hospital was established to further enhance obstetric services at Calvary.
June 2016
ACT PubliC HeAlTH ServiCeS Quarterly Performance Report
5
emergency DepartmentsACT Health is committed to improving waiting times in our Emergency Department (ED) services.
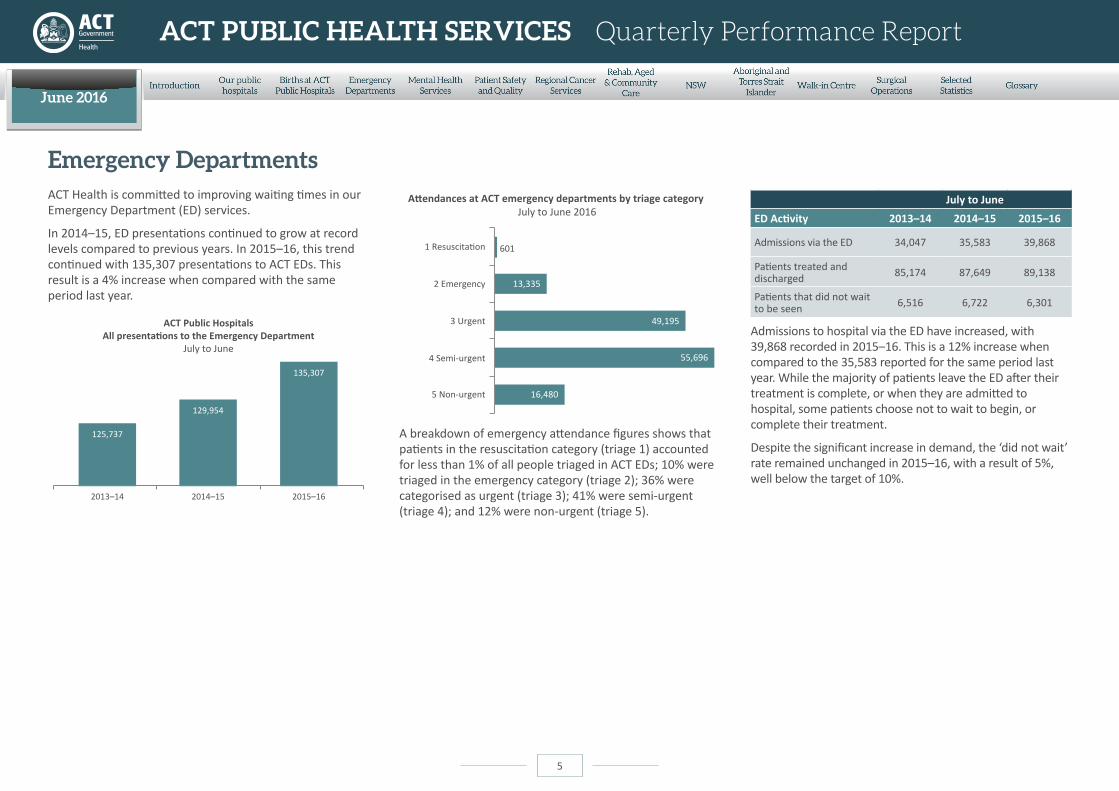
In 2014–15, ED presentations continued to grow at record levels compared to previous years. In 2015–16, this trend continued with 135,307 presentations to ACT EDs. This result is a 4% increase when compared with the same period last year.
ACT Public HospitalsAll presentations to the Emergency Department
July to June
2013–14 2014–15 2015–16
125,737
129,954
135,307
Attendances at ACT emergency departments by triage category July to June 2016
5 Non-urgent
4 Semi-urgent
3 Urgent
2 Emergency
1 Resuscitation 601
16,480
55,696
49,195
13,335
A breakdown of emergency attendance figures shows that patients in the resuscitation category (triage 1) accounted for less than 1% of all people triaged in ACT EDs; 10% were triaged in the emergency category (triage 2); 36% were categorised as urgent (triage 3); 41% were semi-urgent (triage 4); and 12% were non-urgent (triage 5).
July to June
ED Activity 2013–14 2014–15 2015–16
Admissions via the ED 34,047 35,583 39,868
Patients treated and discharged 85,174 87,649 89,138
Patients that did not wait to be seen 6,516 6,722 6,301
Admissions to hospital via the ED have increased, with 39,868 recorded in 2015–16. This is a 12% increase when compared to the 35,583 reported for the same period last year. While the majority of patients leave the ED after their treatment is complete, or when they are admitted to hospital, some patients choose not to wait to begin, or complete their treatment.
Despite the significant increase in demand, the ‘did not wait’ rate remained unchanged in 2015–16, with a result of 5%, well below the target of 10%.
June 2016
ACT PubliC HeAlTH ServiCeS Quarterly Performance Report
6
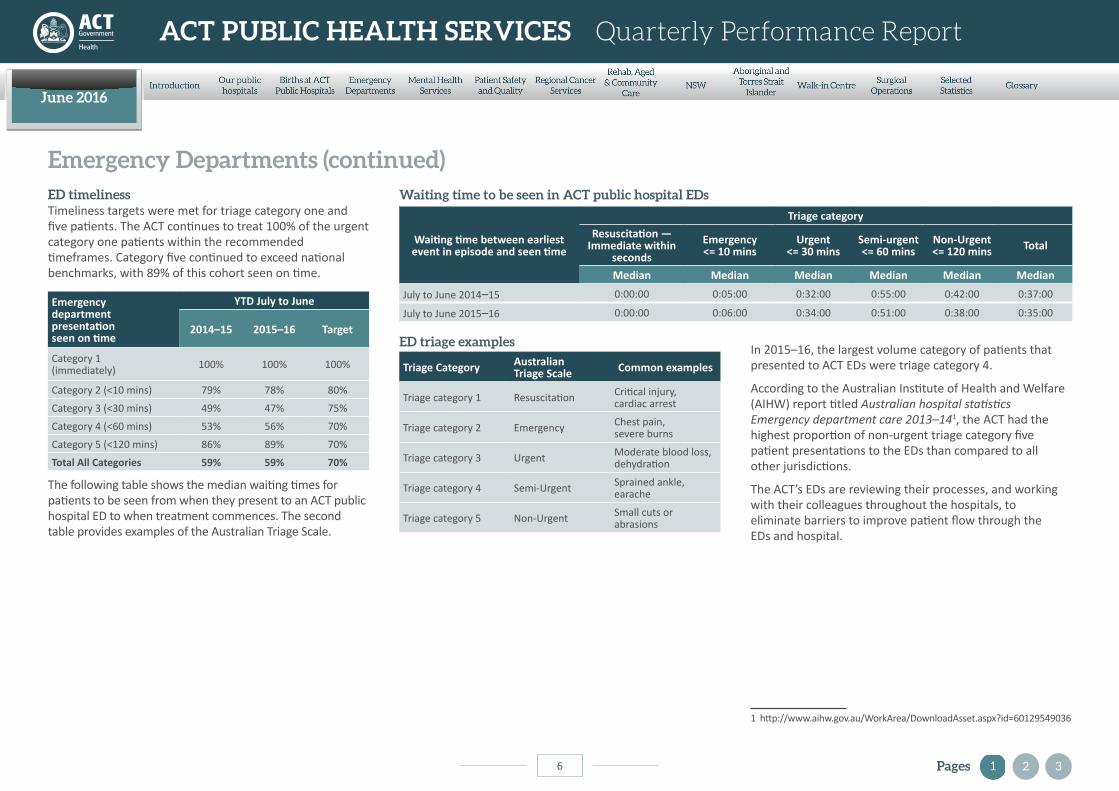
eD timelinessTimeliness targets were met for triage category one and five patients. The ACT continues to treat 100% of the urgent category one patients within the recommended timeframes. Category five continued to exceed national benchmarks, with 89% of this cohort seen on time.
Emergency department presentation seen on time
YTD July to June
2014–15 2015–16 Target
Category 1 (immediately) 100% 100% 100%
Category 2 (<10 mins) 79% 78% 80%
Category 3 (<30 mins) 49% 47% 75%
Category 4 (<60 mins) 53% 56% 70%
Category 5 (<120 mins) 86% 89% 70%
Total All Categories 59% 59% 70%
The following table shows the median waiting times for patients to be seen from when they present to an ACT public hospital ED to when treatment commences. The second table provides examples of the Australian Triage Scale.
In 2015–16, the largest volume category of patients that presented to ACT EDs were triage category 4.
According to the Australian Institute of Health and Welfare (AIHW) report titled Australian hospital statistics Emergency department care 2013–141, the ACT had the highest proportion of non-urgent triage category five patient presentations to the EDs than compared to all other jurisdictions.
The ACT’s EDs are reviewing their processes, and working with their colleagues throughout the hospitals, to eliminate barriers to improve patient flow through the EDs and hospital.
1 http://www.aihw.gov.au/WorkArea/DownloadAsset.aspx?id=60129549036
Waiting time to be seen in ACT public hospital eDs
Waiting time between earliest event in episode and seen time
Triage category
Resuscitation — Immediate within
seconds
Emergency <= 10 mins
Urgent <= 30 mins
Semi-urgent <= 60 mins
Non-Urgent <= 120 mins Total
Median Median Median Median Median Median
July to June 2014–15 0:00:00 0:05:00 0:32:00 0:55:00 0:42:00 0:37:00
July to June 2015–16 0:00:00 0:06:00 0:34:00 0:51:00 0:38:00 0:35:00
eD triage examples
Triage Category Australian Triage Scale Common examples
Triage category 1 Resuscitation Critical injury, cardiac arrest
Triage category 2 Emergency Chest pain, severe burns
Triage category 3 Urgent Moderate blood loss, dehydration
Triage category 4 Semi-Urgent Sprained ankle, earache
Triage category 5 Non-Urgent Small cuts or abrasions
2Pages 3
emergency Departments (continued)
June 2016
ACT PubliC HeAlTH ServiCeS Quarterly Performance Report
7
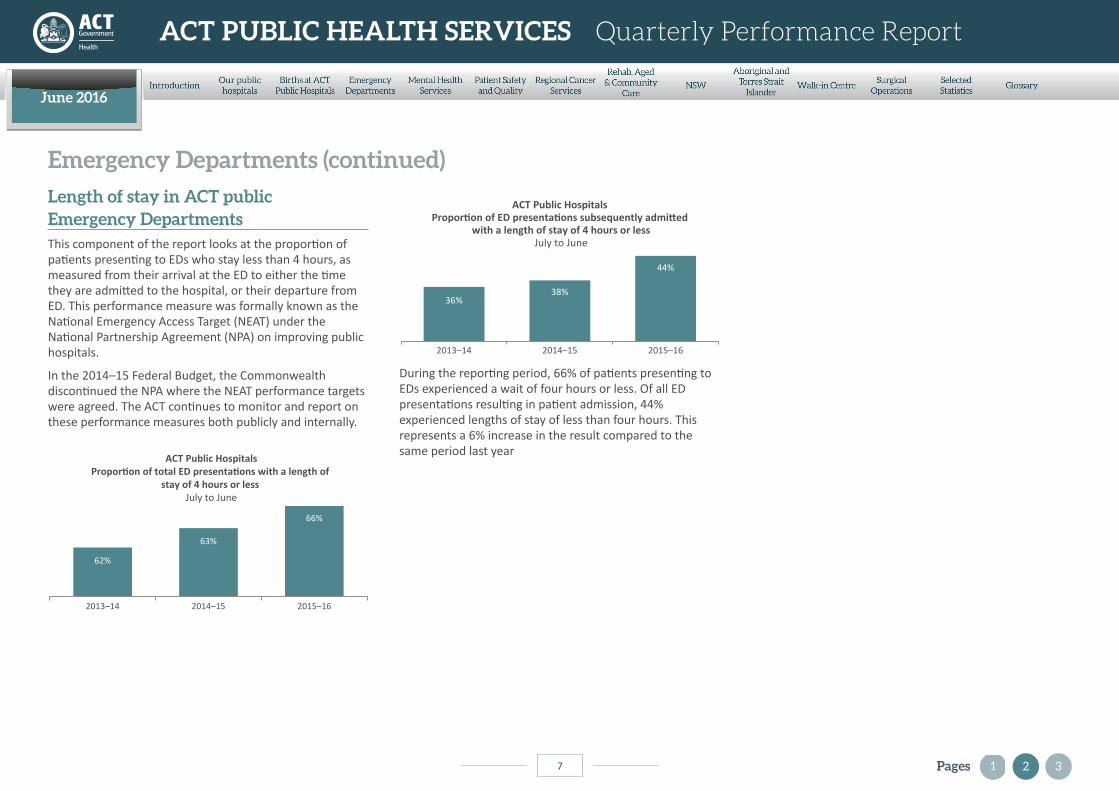
length of stay in ACT public emergency Departments This component of the report looks at the proportion of patients presenting to EDs who stay less than 4 hours, as measured from their arrival at the ED to either the time they are admitted to the hospital, or their departure from ED. This performance measure was formally known as the National Emergency Access Target (NEAT) under the National Partnership Agreement (NPA) on improving public hospitals.
In the 2014–15 Federal Budget, the Commonwealth discontinued the NPA where the NEAT performance targets were agreed. The ACT continues to monitor and report on these performance measures both publicly and internally.
2013–14 2014–15 2015–16
62%
63%
66%
ACT Public HospitalsProportion of total ED presentations with a length of
stay of 4 hours or less July to June
ACT Public Hospitals Proportion of ED presentations subsequently admitted
with a length of stay of 4 hours or lessJuly to June
2013–14 2014–15 2015–16
36%38%
44%
During the reporting period, 66% of patients presenting to EDs experienced a wait of four hours or less. Of all ED presentations resulting in patient admission, 44% experienced lengths of stay of less than four hours. This represents a 6% increase in the result compared to the same period last year
emergency Departments (continued)
2Pages 3
June 2016
ACT PubliC HeAlTH ServiCeS Quarterly Performance Report
8 2Pages 3
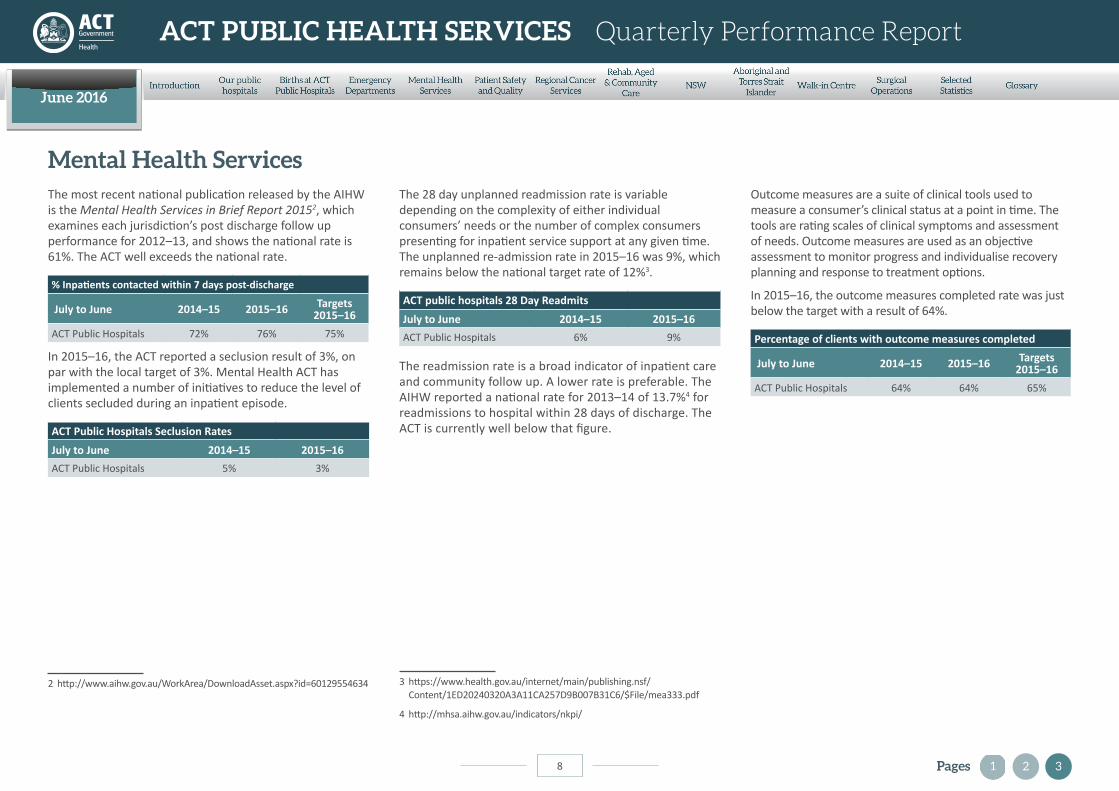
Mental Health ServicesThe most recent national publication released by the AIHW is the Mental Health Services in Brief Report 20152, which examines each jurisdiction’s post discharge follow up performance for 2012–13, and shows the national rate is 61%. The ACT well exceeds the national rate.
% Inpatients contacted within 7 days post-discharge
July to June 2014–15 2015–16 Targets 2015–16
ACT Public Hospitals 72% 76% 75%
In 2015–16, the ACT reported a seclusion result of 3%, on par with the local target of 3%. Mental Health ACT has implemented a number of initiatives to reduce the level of clients secluded during an inpatient episode.
ACT Public Hospitals Seclusion Rates
July to June 2014–15 2015–16
ACT Public Hospitals 5% 3%
2 http://www.aihw.gov.au/WorkArea/DownloadAsset.aspx?id=60129554634
The 28 day unplanned readmission rate is variable depending on the complexity of either individual consumers’ needs or the number of complex consumers presenting for inpatient service support at any given time. The unplanned re-admission rate in 2015–16 was 9%, which remains below the national target rate of 12%3.
ACT public hospitals 28 Day Readmits
July to June 2014–15 2015–16
ACT Public Hospitals 6% 9%
The readmission rate is a broad indicator of inpatient care and community follow up. A lower rate is preferable. The AIHW reported a national rate for 2013–14 of 13.7%4 for readmissions to hospital within 28 days of discharge. The ACT is currently well below that figure.
3 https://www.health.gov.au/internet/main/publishing.nsf/Content/1ED20240320A3A11CA257D9B007B31C6/$File/mea333.pdf
4 http://mhsa.aihw.gov.au/indicators/nkpi/
Outcome measures are a suite of clinical tools used to measure a consumer’s clinical status at a point in time. The tools are rating scales of clinical symptoms and assessment of needs. Outcome measures are used as an objective assessment to monitor progress and individualise recovery planning and response to treatment options.
In 2015–16, the outcome measures completed rate was just below the target with a result of 64%.
Percentage of clients with outcome measures completed
July to June 2014–15 2015–16 Targets 2015–16
ACT Public Hospitals 64% 64% 65%

June 2016
ACT PubliC HeAlTH ServiCeS Quarterly Performance Report
9
Patient Safety and QualityACT Health continually strives to provide a safe and high quality health care system, and is continually implementing service improvement to increase safety for all patients.
Due to the differing type and nature of services provided at each hospital campus the targets for each indicator are different. Canberra Hospital— the major teaching and referral hospital— manages more complex patients and higher levels of complications can be expected.
Moving averages are provided as well as month-by-month results. As there are relatively small numbers of patients who have unplanned returns to hospital or the operating theatre, or who acquire an infection during their hospital stay, there may be relatively large movements in results between months. The inclusion of the moving average works to level out these monthly fluctuations and provide a better understanding of trends in these important indicators.
0.0% 0.5% 1.0% 1.5% 2.0% 2.5% 3.0% 3.5%
Rate Moving Average Target
Canberra HospitalRate of unplanned hospital readmissions
within 28 days
Jul-1
3Au
g-13
Sep-
13O
ct-1
3N
ov-1
3De
c-13
Jan-
14Fe
b-14
Mar
-14
Apr-
14M
ay-1
4Ju
n-14
Jul-1
4Au
g-14
Sep-
14O
ct-1
4N
ov-1
4De
c-14
Jan-
15Fe
b-15
Mar
-15
Apr-
15M
ay-1
5Ju
n-15
Jul-1
5
Sep-
15O
ct-1
5N
ov-1
5De
c-15
Jan-
16Fe
b-16
Mar
-16
Apr-
16M
ay-1
6Ju
n-16
Aug-
15
0.0% 0.5% 1.0% 1.5% 2.0% 2.5% 3.0% 3.5%
Rate Moving Average Target
Calvary HospitalRate of unplanned hospital readmissions
within 28 daysJu
l-13
Aug-
13Se
p-13
Oct
-13
Nov
-13
Dec-
13Ja
n-14
Feb-
14M
ar-1
4Ap
r-14
May
-14
Jun-
14Ju
l-14
Aug-
14Se
p-14
Oct
-14
Nov
-14
Dec-
14Ja
n-15
Feb-
15M
ar-1
5Ap
r-15
May
-15
Jun-
15Ju
l-15
Sep-
15O
ct-1
5N
ov-1
5De
c-15
Jan-
16Fe
b-16
Mar
-16
Apr-
16M
ay-1
6Ju
n-16
Aug-
15
Both ACT public hospitals continue to report good results for the proportion of people who return to hospital within 28 days of discharge, with the results at the Canberra Hospital and Calvary Public Hospital remaining well below target over 2015–16.
0.0% 0.2% 0.4% 0.6% 0.8% 1.0% 1.2% 1.4%
Rate Moving Average Target
Canberra HospitalUnplanned return to operating theatre within
an episode of care
Jul-1
3Au
g-13
Sep-
13O
ct-1
3N
ov-1
3De
c-13
Jan-
14Fe
b-14
Mar
-14
Apr-
14M
ay-1
4Ju
n-14
Jul-1
4Au
g-14
Sep-
14O
ct-1
4N
ov-1
4De
c-14
Jan-
15Fe
b-15
Mar
-15
Apr-
15M
ay-1
5Ju
n-15
Jul-1
5
Sep-
15O
ct-1
5N
ov-1
5De
c-15
Jan-
16Fe
b-16
Mar
-16
Apr-
16M
ay-1
6Ju
n-16
Aug-
15
0.0% 0.1%
0.3%0.2%
0.4%
0.5% 0.6% 0.7% 0.8%
Rate Moving Average Target
Calvary HospitalUnplanned return to operating theatre within
Jul-1
3Au
g-13
Sep-
13O
ct-1
3N
ov-1
3De
c-13
Jan-
14Fe
b-14
Mar
-14
Apr-
14M
ay-1
4Ju
n-14
Jul-1
4Au
g-14
Sep-
14O
ct-1
4N
ov-1
4De
c-14
Jan-
15Fe
b-15
Mar
-15
Apr-
15M
ay-1
5Ju
n-15
Jul-1
5
Sep-
15O
ct-1
5N
ov-1
5De
c-15
Jan-
16Fe
b-16
Mar
-16
Apr-
16M
ay-1
6Ju
n-16
Aug-
15
an episode of care
Canberra Hospital’s rolling average results for unplanned return to the operating theatre during a hospital stay for 2015–16 mostly remained below target. Canberra Hospital only exceeded target in February 2016 with a result of 1.1%, 0.1% over the target.
In 2015–16, Calvary Public Hospital reported positive results for unplanned return to the operating theatre during a hospital stay compared to the same period last year. In July 2015 and May 2016, Calvary Public Hospital results were slightly over the 0.5% target. However, overall, during 2015–16, Calvary Public Hospital results have remained below the target of 0.5%.
June 2016
ACT PubliC HeAlTH ServiCeS Quarterly Performance Report
10
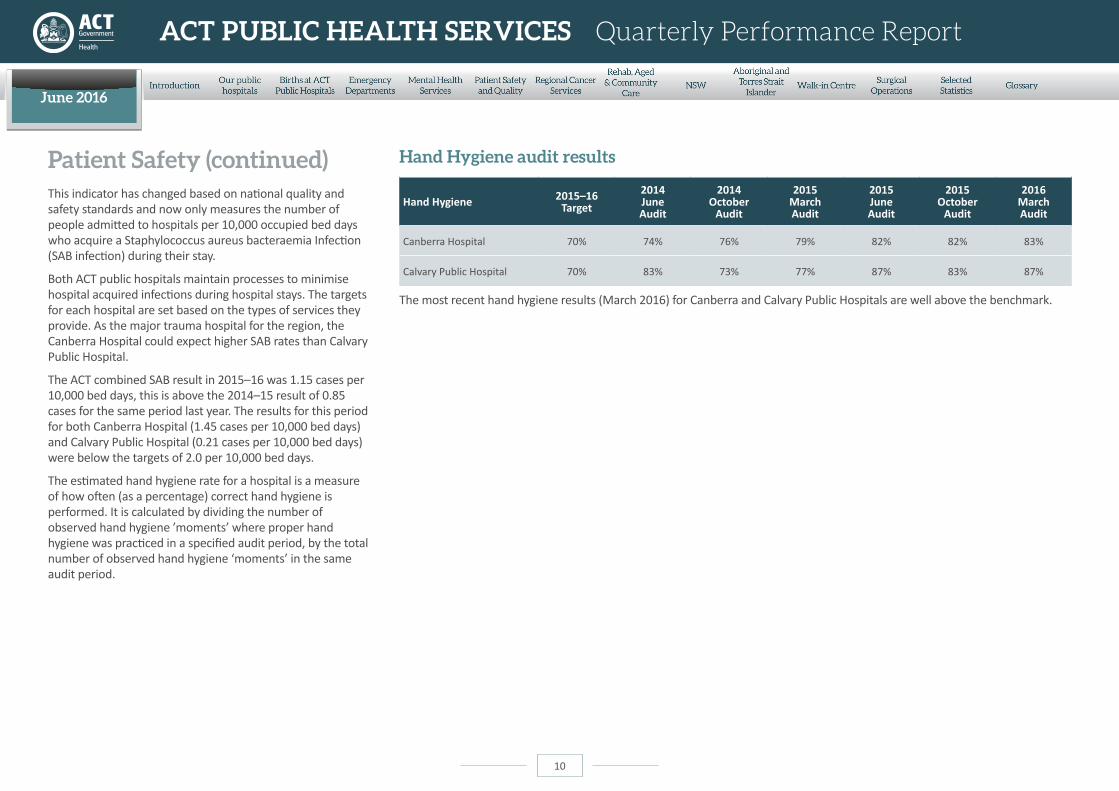
This indicator has changed based on national quality and safety standards and now only measures the number of people admitted to hospitals per 10,000 occupied bed days who acquire a Staphylococcus aureus bacteraemia Infection (SAB infection) during their stay.
Both ACT public hospitals maintain processes to minimise hospital acquired infections during hospital stays. The targets for each hospital are set based on the types of services they provide. As the major trauma hospital for the region, the Canberra Hospital could expect higher SAB rates than Calvary Public Hospital.
The ACT combined SAB result in 2015–16 was 1.15 cases per 10,000 bed days, this is above the 2014–15 result of 0.85 cases for the same period last year. The results for this period for both Canberra Hospital (1.45 cases per 10,000 bed days) and Calvary Public Hospital (0.21 cases per 10,000 bed days) were below the targets of 2.0 per 10,000 bed days.
The estimated hand hygiene rate for a hospital is a measure of how often (as a percentage) correct hand hygiene is performed. It is calculated by dividing the number of observed hand hygiene ’moments’ where proper hand hygiene was practiced in a specified audit period, by the total number of observed hand hygiene ‘moments’ in the same audit period.
Hand Hygiene audit results
Hand Hygiene 2015–16 Target
2014 June Audit
2014 October
Audit
2015 March Audit
2015 June Audit
2015 October
Audit
2016 March Audit
Canberra Hospital 70% 74% 76% 79% 82% 82% 83%
Calvary Public Hospital 70% 83% 73% 77% 87% 83% 87%
The most recent hand hygiene results (March 2016) for Canberra and Calvary Public Hospitals are well above the benchmark.
Patient Safety (continued)
June 2016
ACT PubliC HeAlTH ServiCeS Quarterly Performance Report
11
regional Cancer Services
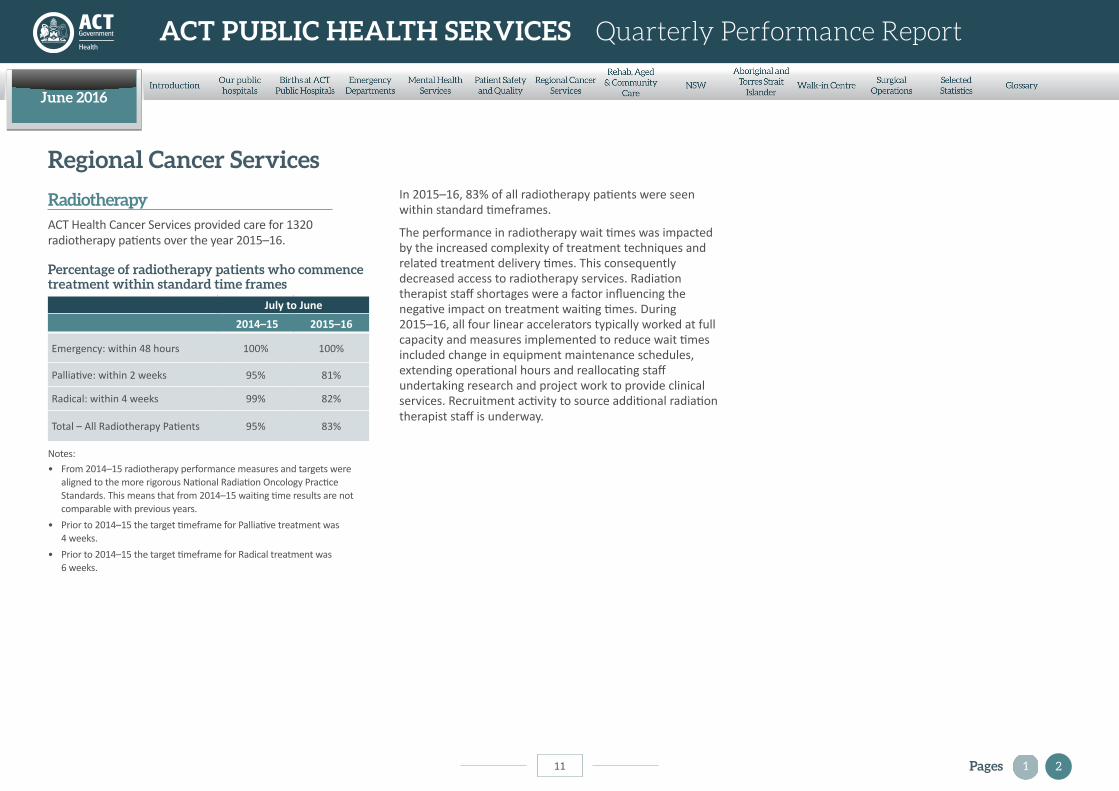
radiotherapy ACT Health Cancer Services provided care for 1320 radiotherapy patients over the year 2015–16.
Percentage of radiotherapy patients who commence treatment within standard time frames
July to June
2014–15 2015–16
Emergency: within 48 hours 100% 100%
Palliative: within 2 weeks 95% 81%
Radical: within 4 weeks 99% 82%
Total – All Radiotherapy Patients 95% 83%
Notes:• From 2014–15 radiotherapy performance measures and targets were
aligned to the more rigorous National Radiation Oncology Practice Standards. This means that from 2014–15 waiting time results are not comparable with previous years.
• Prior to 2014–15 the target timeframe for Palliative treatment was 4 weeks.
• Prior to 2014–15 the target timeframe for Radical treatment was 6 weeks.
In 2015–16, 83% of all radiotherapy patients were seen within standard timeframes.
The performance in radiotherapy wait times was impacted by the increased complexity of treatment techniques and related treatment delivery times. This consequently decreased access to radiotherapy services. Radiation therapist staff shortages were a factor influencing the negative impact on treatment waiting times. During 2015–16, all four linear accelerators typically worked at full capacity and measures implemented to reduce wait times included change in equipment maintenance schedules, extending operational hours and reallocating staff undertaking research and project work to provide clinical services. Recruitment activity to source additional radiation therapist staff is underway.
2Pages
June 2016
ACT PubliC HeAlTH ServiCeS Quarterly Performance Report
12
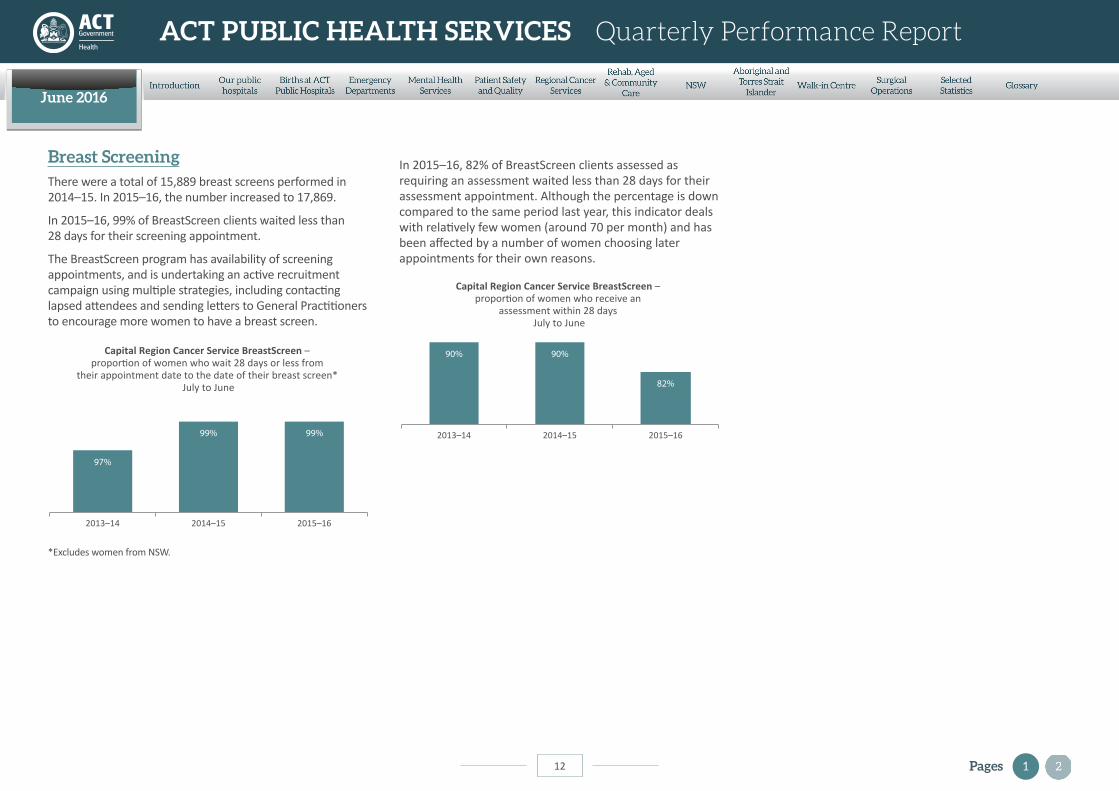
In 2015–16, 82% of BreastScreen clients assessed as requiring an assessment waited less than 28 days for their assessment appointment. Although the percentage is down compared to the same period last year, this indicator deals with relatively few women (around 70 per month) and has been affected by a number of women choosing later appointments for their own reasons.
90% 90%
82%
2013–14 2014–15 2015–16
Capital Region Cancer Service BreastScreen – proportion of women who receive an
assessment within 28 days July to June
breast Screening There were a total of 15,889 breast screens performed in 2014–15. In 2015–16, the number increased to 17,869.
In 2015–16, 99% of BreastScreen clients waited less than 28 days for their screening appointment.
The BreastScreen program has availability of screening appointments, and is undertaking an active recruitment campaign using multiple strategies, including contacting lapsed attendees and sending letters to General Practitioners to encourage more women to have a breast screen.
Capital Region Cancer Service BreastScreen – proportion of women who wait 28 days or less from
their appointment date to the date of their breast screen* July to June
97%
99% 99%
2013–14 2014–15 2015–16
*Excludes women from NSW.
1Pages
June 2016
ACT PubliC HeAlTH ServiCeS Quarterly Performance Report
13
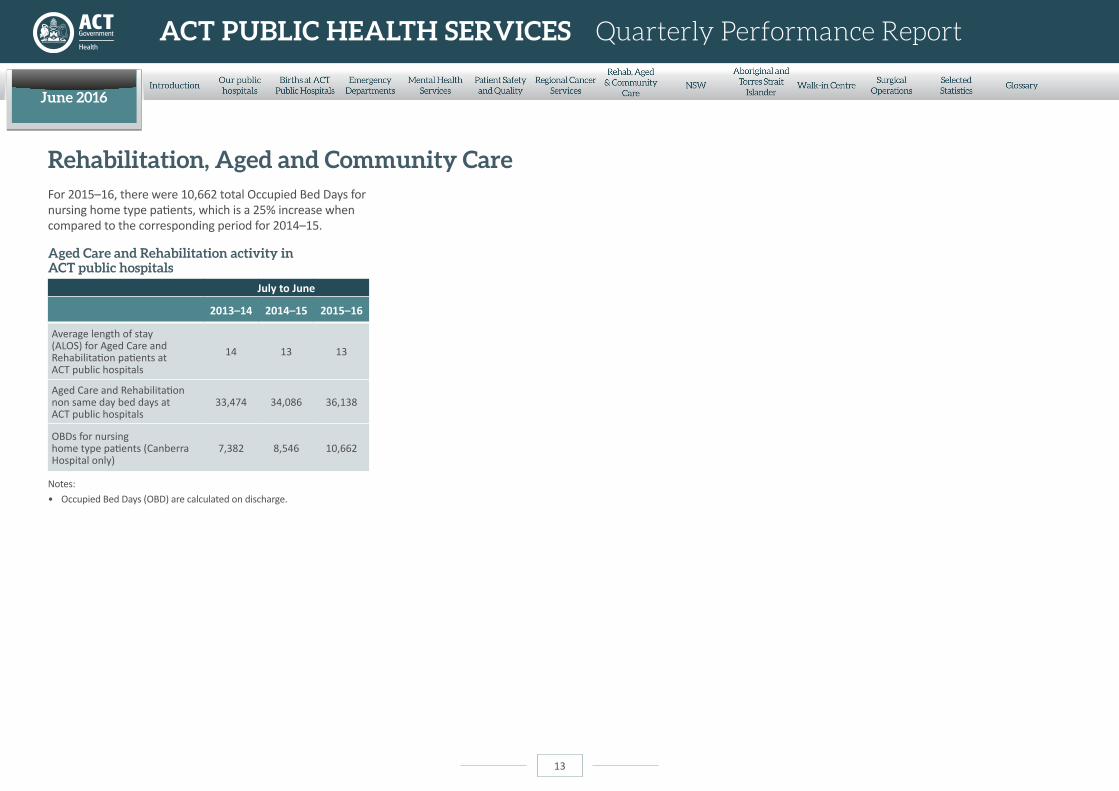
For 2015–16, there were 10,662 total Occupied Bed Days for nursing home type patients, which is a 25% increase when compared to the corresponding period for 2014–15.
Aged Care and rehabilitation activity in ACT public hospitals
July to June
2013–14 2014–15 2015–16
Average length of stay (ALOS) for Aged Care and Rehabilitation patients at ACT public hospitals
14 13 13
Aged Care and Rehabilitation non same day bed days at ACT public hospitals
33,474 34,086 36,138
OBDs for nursing home type patients (Canberra Hospital only)
7,382 8,546 10,662
Notes: • Occupied Bed Days (OBD) are calculated on discharge.
rehabilitation, Aged and Community Care
June 2016
ACT PubliC HeAlTH ServiCeS Quarterly Performance Report
14
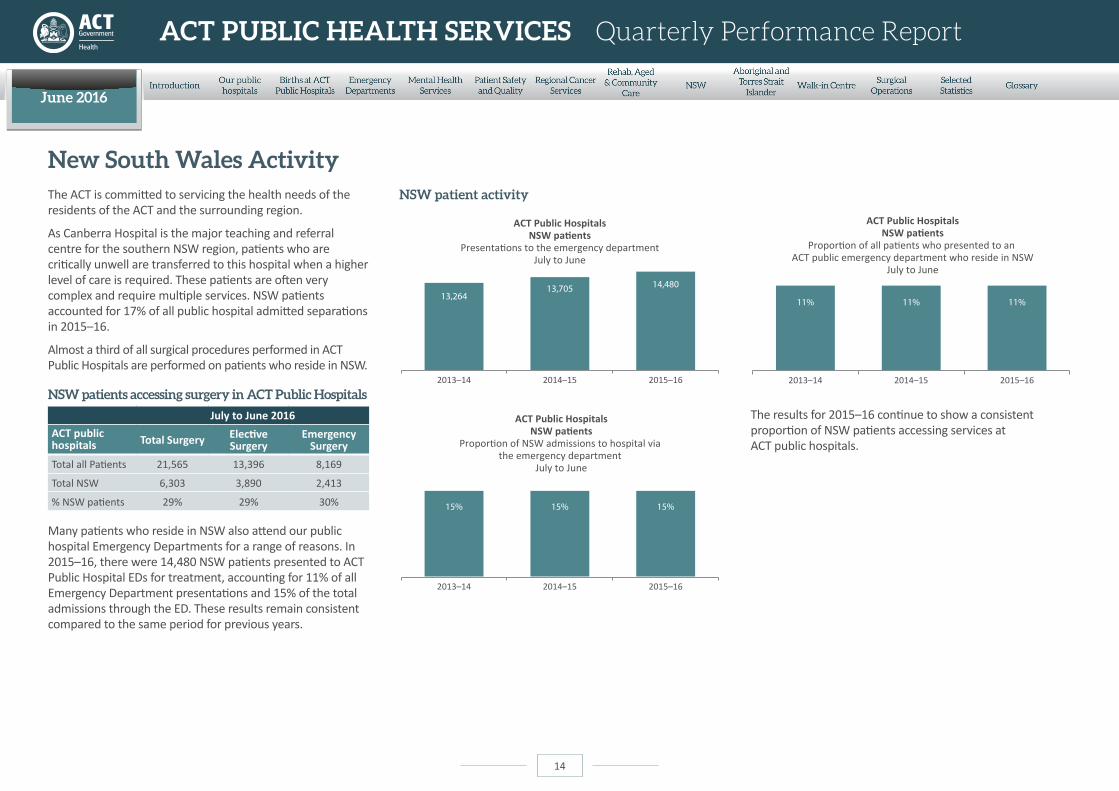
New South Wales ActivityThe ACT is committed to servicing the health needs of the residents of the ACT and the surrounding region.
As Canberra Hospital is the major teaching and referral centre for the southern NSW region, patients who are critically unwell are transferred to this hospital when a higher level of care is required. These patients are often very complex and require multiple services. NSW patients accounted for 17% of all public hospital admitted separations in 2015–16.
Almost a third of all surgical procedures performed in ACT Public Hospitals are performed on patients who reside in NSW.
NSW patients accessing surgery in ACT Public Hospitals
July to June 2016
ACT public hospitals Total Surgery Elective
SurgeryEmergency
Surgery
Total all Patients 21,565 13,396 8,169
Total NSW 6,303 3,890 2,413
% NSW patients 29% 29% 30%
Many patients who reside in NSW also attend our public hospital Emergency Departments for a range of reasons. In 2015–16, there were 14,480 NSW patients presented to ACT Public Hospital EDs for treatment, accounting for 11% of all Emergency Department presentations and 15% of the total admissions through the ED. These results remain consistent compared to the same period for previous years.
NSW patient activity
ACT Public HospitalsNSW patients
Presentations to the emergency departmentJuly to June
13,26413,705 14,480
2013–14 2014–15 2015–16
ACT Public HospitalsNSW patients
Proportion of NSW admissions to hospital via the emergency department
July to June
15% 15% 15%
2013–14 2014–15 2015–16
ACT Public HospitalsNSW patients
Proportion of all patients who presented to an ACT public emergency department who reside in NSW
July to June
11% 11% 11%
2013–14 2014–15 2015–16
The results for 2015–16 continue to show a consistent proportion of NSW patients accessing services at ACT public hospitals.
June 2016
ACT PubliC HeAlTH ServiCeS Quarterly Performance Report
15
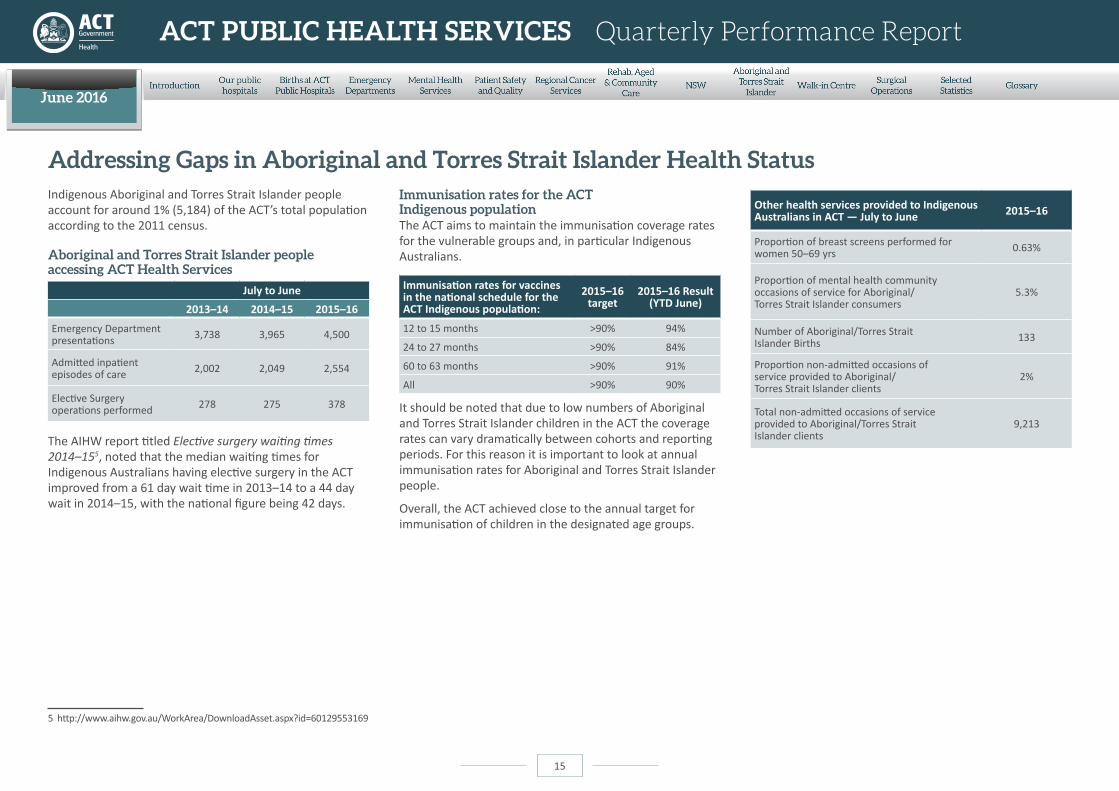
Indigenous Aboriginal and Torres Strait Islander people account for around 1% (5,184) of the ACT’s total population according to the 2011 census.
Aboriginal and Torres Strait islander people accessing ACT Health Services
July to June
2013–14 2014–15 2015–16
Emergency Department presentations 3,738 3,965 4,500
Admitted inpatient episodes of care 2,002 2,049 2,554
Elective Surgery operations performed 278 275 378
The AIHW report titled Elective surgery waiting times 2014–155, noted that the median waiting times for Indigenous Australians having elective surgery in the ACT improved from a 61 day wait time in 2013–14 to a 44 day wait in 2014–15, with the national figure being 42 days.
5 http://www.aihw.gov.au/WorkArea/DownloadAsset.aspx?id=60129553169
immunisation rates for the ACT indigenous populationThe ACT aims to maintain the immunisation coverage rates for the vulnerable groups and, in particular Indigenous Australians.
Immunisation rates for vaccines in the national schedule for the ACT Indigenous population:
2015–16 target
2015–16 Result (YTD June)
12 to 15 months >90% 94%
24 to 27 months >90% 84%
60 to 63 months >90% 91%
All >90% 90%
It should be noted that due to low numbers of Aboriginal and Torres Strait Islander children in the ACT the coverage rates can vary dramatically between cohorts and reporting periods. For this reason it is important to look at annual immunisation rates for Aboriginal and Torres Strait Islander people.
Overall, the ACT achieved close to the annual target for immunisation of children in the designated age groups.
Addressing Gaps in Aboriginal and Torres Strait islander Health Status
Other health services provided to Indigenous Australians in ACT — July to June 2015–16
Proportion of breast screens performed for women 50–69 yrs 0.63%
Proportion of mental health community occasions of service for Aboriginal/ Torres Strait Islander consumers
5.3%
Number of Aboriginal/Torres Strait Islander Births 133
Proportion non-admitted occasions of service provided to Aboriginal/ Torres Strait Islander clients
2%
Total non-admitted occasions of service provided to Aboriginal/Torres Strait Islander clients
9,213
June 2016
ACT PubliC HeAlTH ServiCeS Quarterly Performance Report
16
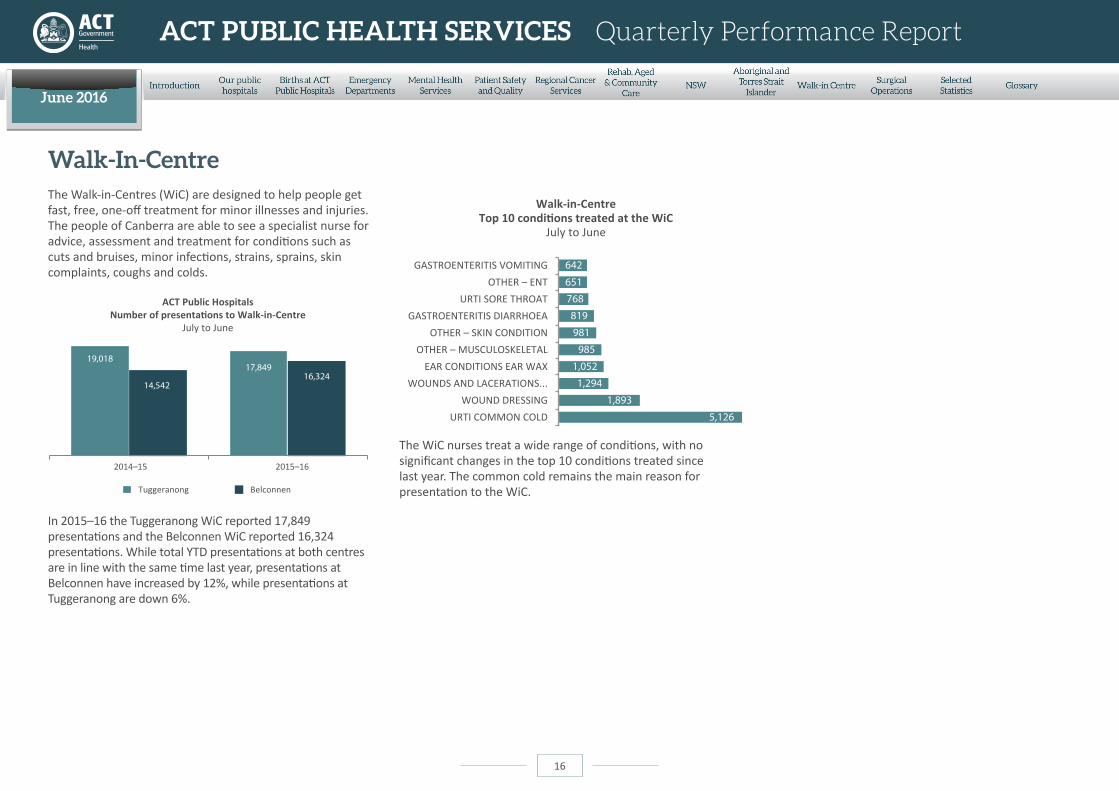
Walk-in-CentreThe Walk-in-Centres (WiC) are designed to help people get fast, free, one-off treatment for minor illnesses and injuries. The people of Canberra are able to see a specialist nurse for advice, assessment and treatment for conditions such as cuts and bruises, minor infections, strains, sprains, skin complaints, coughs and colds.
ACT Public HospitalsNumber of presentations to Walk-in-Centre
July to June
2014–15 2015–16
14,542
17,84916,324
19,018
Tuggeranong Belconnen
In 2015–16 the Tuggeranong WiC reported 17,849 presentations and the Belconnen WiC reported 16,324 presentations. While total YTD presentations at both centres are in line with the same time last year, presentations at Belconnen have increased by 12%, while presentations at Tuggeranong are down 6%.
Walk-in-CentreTop 10 conditions treated at the WiC
July to June
642
651
768
819
981
985
1,052
1,294
1,893
5,126URTI COMMON COLD
URTI SORE THROAT
WOUNDS AND LACERATIONS...
OTHER – MUSCULOSKELETAL
WOUND DRESSING
GASTROENTERITIS VOMITING
GASTROENTERITIS DIARRHOEAOTHER – SKIN CONDITION
EAR CONDITIONS EAR WAX
OTHER – ENT
The WiC nurses treat a wide range of conditions, with no significant changes in the top 10 conditions treated since last year. The common cold remains the main reason for presentation to the WiC.
June 2016
ACT PubliC HeAlTH ServiCeS Quarterly Performance Report
17
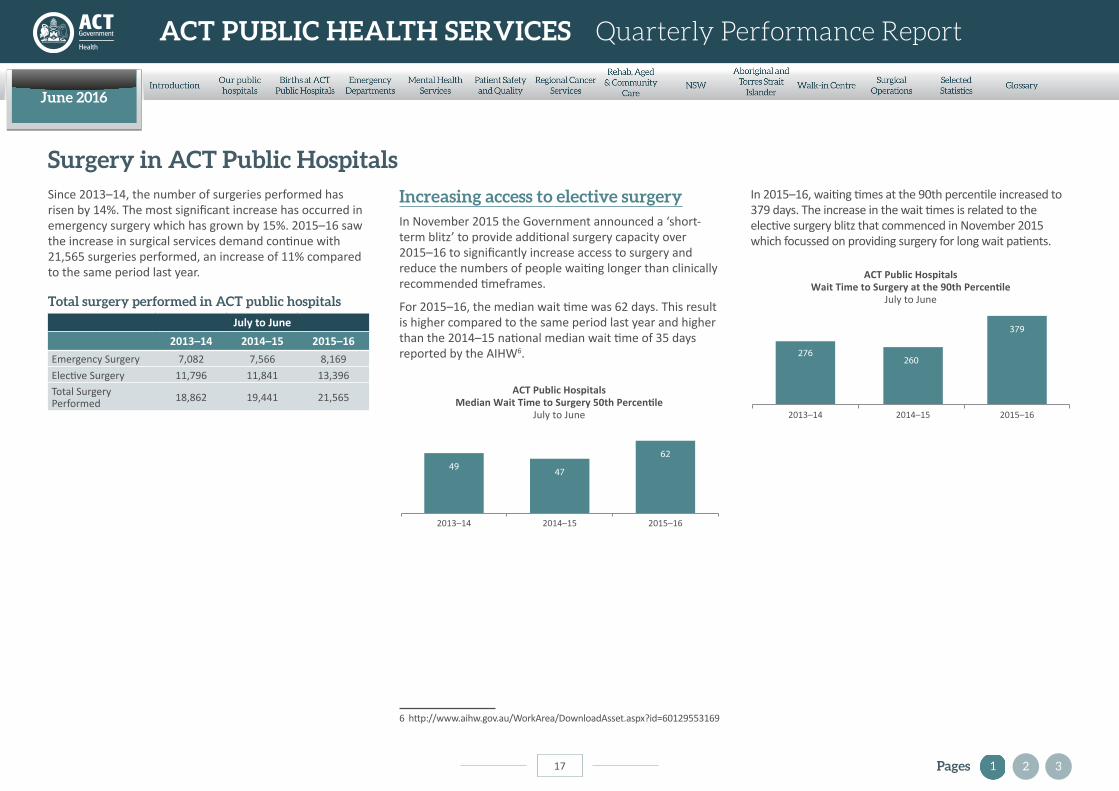
Since 2013–14, the number of surgeries performed has risen by 14%. The most significant increase has occurred in emergency surgery which has grown by 15%. 2015–16 saw the increase in surgical services demand continue with 21,565 surgeries performed, an increase of 11% compared to the same period last year.
Total surgery performed in ACT public hospitals
July to June
2013–14 2014–15 2015–16
Emergency Surgery 7,082 7,566 8,169Elective Surgery 11,796 11,841 13,396Total Surgery Performed 18,862 19,441 21,565
increasing access to elective surgeryIn November 2015 the Government announced a ‘short-term blitz’ to provide additional surgery capacity over 2015–16 to significantly increase access to surgery and reduce the numbers of people waiting longer than clinically recommended timeframes.
For 2015–16, the median wait time was 62 days. This result is higher compared to the same period last year and higher than the 2014–15 national median wait time of 35 days reported by the AIHW6.
2013–14 2014–15 2015–16
ACT Public HospitalsMedian Wait Time to Surgery 50th Percentile
July to June
49 47
62
6 http://www.aihw.gov.au/WorkArea/DownloadAsset.aspx?id=60129553169
Surgery in ACT Public Hospitals
2Pages 3
In 2015–16, waiting times at the 90th percentile increased to 379 days. The increase in the wait times is related to the elective surgery blitz that commenced in November 2015 which focussed on providing surgery for long wait patients.
2013–14 2014–15 2015–16
ACT Public HospitalsWait Time to Surgery at the 90th Percentile
July to June
276260
379
June 2016
ACT PubliC HeAlTH ServiCeS Quarterly Performance Report
18
Surgery in ACT Public Hospitals (continued)
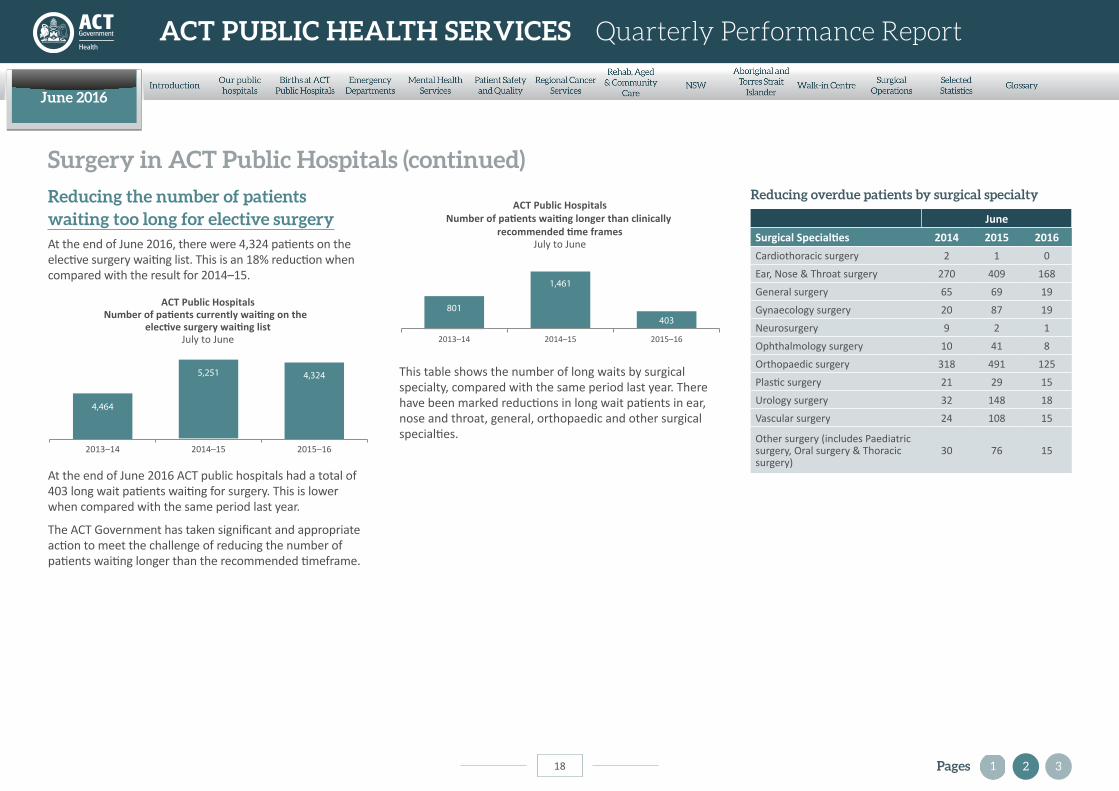
reducing the number of patients waiting too long for elective surgeryAt the end of June 2016, there were 4,324 patients on the elective surgery waiting list. This is an 18% reduction when compared with the result for 2014–15.
2013–14 2014–15 2015–16
ACT Public HospitalsNumber of patients currently waiting on the
elective surgery waiting listJuly to June
4,464
5,251 4,324
At the end of June 2016 ACT public hospitals had a total of 403 long wait patients waiting for surgery. This is lower when compared with the same period last year.
The ACT Government has taken significant and appropriate action to meet the challenge of reducing the number of patients waiting longer than the recommended timeframe.
2013–14 2014–15 2015–16
ACT Public HospitalsNumber of patients waiting longer than clinically
recommended time framesJuly to June
801
1,461
403
This table shows the number of long waits by surgical specialty, compared with the same period last year. There have been marked reductions in long wait patients in ear, nose and throat, general, orthopaedic and other surgical specialties.
2Pages 3
reducing overdue patients by surgical specialty
June
Surgical Specialties 2014 2015 2016
Cardiothoracic surgery 2 1 0
Ear, Nose & Throat surgery 270 409 168
General surgery 65 69 19
Gynaecology surgery 20 87 19
Neurosurgery 9 2 1
Ophthalmology surgery 10 41 8
Orthopaedic surgery 318 491 125
Plastic surgery 21 29 15
Urology surgery 32 148 18
Vascular surgery 24 108 15
Other surgery (includes Paediatric surgery, Oral surgery & Thoracic surgery)
30 76 15
June 2016
ACT PubliC HeAlTH ServiCeS Quarterly Performance Report
19
Surgery in ACT Public Hospitals (continued)
2Pages 3
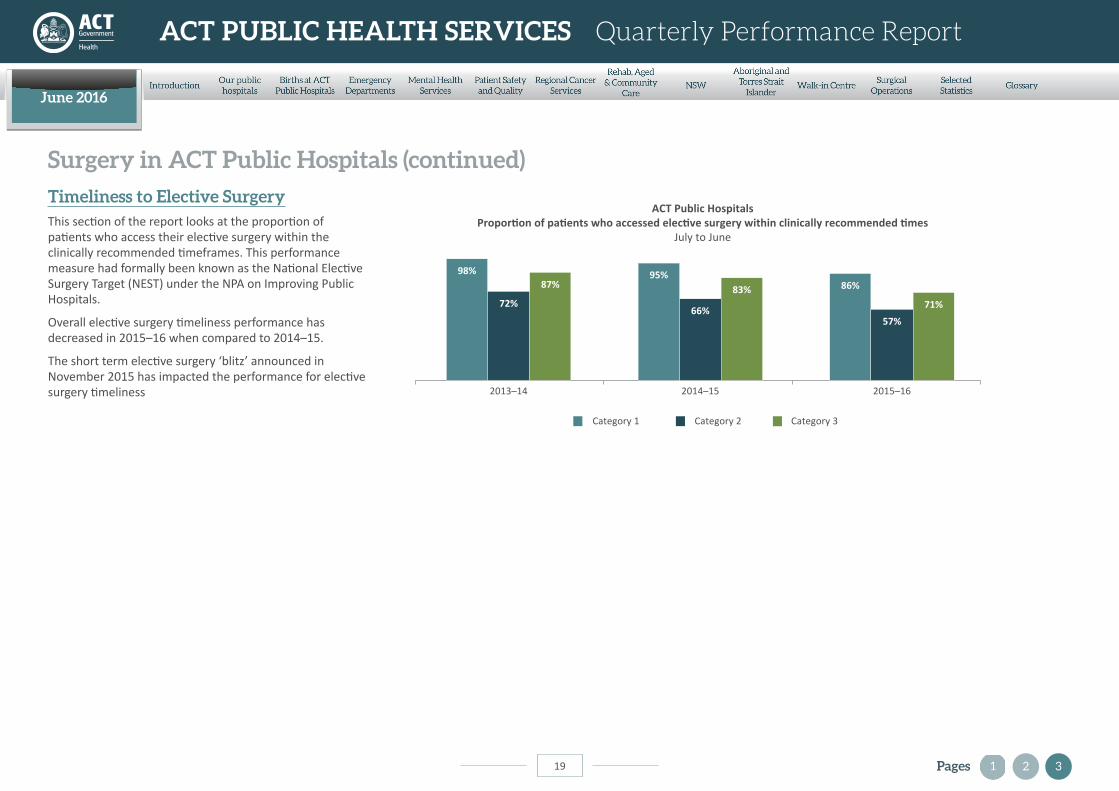
ACT Public HospitalsProportion of patients who accessed elective surgery within clinically recommended times
July to June
Category 1 Category 2 Category 3
2013–14
98%87%
72%
2014–15
95%
66%
83% 86%
2015–16
57%
71%
Timeliness to elective SurgeryThis section of the report looks at the proportion of patients who access their elective surgery within the clinically recommended timeframes. This performance measure had formally been known as the National Elective Surgery Target (NEST) under the NPA on Improving Public Hospitals.
Overall elective surgery timeliness performance has decreased in 2015–16 when compared to 2014–15.
The short term elective surgery ‘blitz’ announced in November 2015 has impacted the performance for elective surgery timeliness
June 2016
ACT PubliC HeAlTH ServiCeS Quarterly Performance Report
20
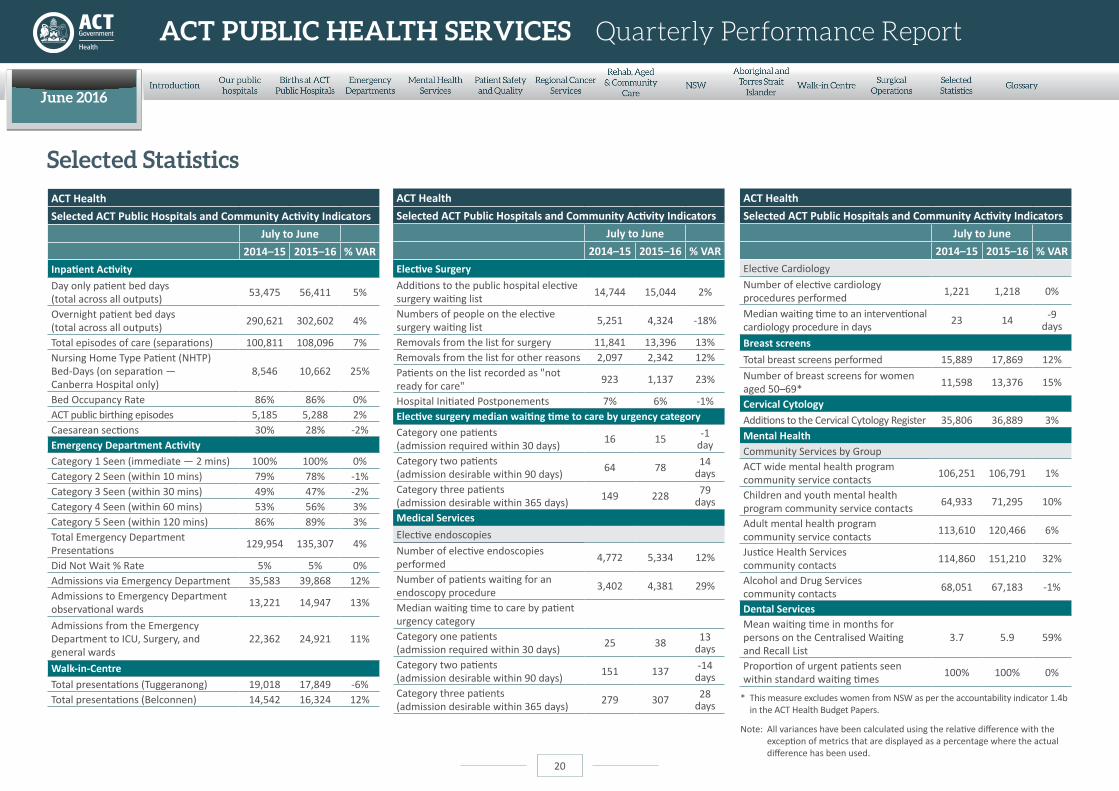
Selected Statistics
ACT Health
Selected ACT Public Hospitals and Community Activity Indicators July to June 2014–15 2015–16 % VAR
Inpatient Activity Day only patient bed days (total across all outputs) 53,475 56,411 5%
Overnight patient bed days (total across all outputs) 290,621 302,602 4%
Total episodes of care (separations) 100,811 108,096 7%Nursing Home Type Patient (NHTP) Bed-Days (on separation — Canberra Hospital only)
8,546 10,662 25%
Bed Occupancy Rate 86% 86% 0%ACT public birthing episodes 5,185 5,288 2%Caesarean sections 30% 28% -2%Emergency Department Activity Category 1 Seen (immediate — 2 mins) 100% 100% 0%Category 2 Seen (within 10 mins) 79% 78% -1%Category 3 Seen (within 30 mins) 49% 47% -2%Category 4 Seen (within 60 mins) 53% 56% 3%Category 5 Seen (within 120 mins) 86% 89% 3%Total Emergency Department Presentations 129,954 135,307 4%
Did Not Wait % Rate 5% 5% 0%Admissions via Emergency Department 35,583 39,868 12%Admissions to Emergency Department observational wards 13,221 14,947 13%
Admissions from the Emergency Department to ICU, Surgery, and general wards
22,362 24,921 11%
Walk-in-Centre Total presentations (Tuggeranong) 19,018 17,849 -6%Total presentations (Belconnen) 14,542 16,324 12%
ACT Health
Selected ACT Public Hospitals and Community Activity Indicators July to June 2014–15 2015–16 % VAR
Elective Surgery Additions to the public hospital elective surgery waiting list 14,744 15,044 2%
Numbers of people on the elective surgery waiting list 5,251 4,324 -18%
Removals from the list for surgery 11,841 13,396 13%Removals from the list for other reasons 2,097 2,342 12%Patients on the list recorded as "not ready for care" 923 1,137 23%
Hospital Initiated Postponements 7% 6% -1%Elective surgery median waiting time to care by urgency categoryCategory one patients (admission required within 30 days) 16 15 -1
dayCategory two patients (admission desirable within 90 days) 64 78 14
daysCategory three patients (admission desirable within 365 days) 149 228 79
daysMedical Services Elective endoscopies Number of elective endoscopies performed 4,772 5,334 12%
Number of patients waiting for an endoscopy procedure 3,402 4,381 29%
Median waiting time to care by patient urgency category
Category one patients (admission required within 30 days) 25 38 13
daysCategory two patients (admission desirable within 90 days) 151 137 -14
daysCategory three patients (admission desirable within 365 days) 279 307 28
days
ACT Health
Selected ACT Public Hospitals and Community Activity Indicators July to June 2014–15 2015–16 % VARElective Cardiology Number of elective cardiology procedures performed 1,221 1,218 0%
Median waiting time to an interventional cardiology procedure in days 23 14 -9
daysBreast screens
Total breast screens performed 15,889 17,869 12%Number of breast screens for women aged 50–69* 11,598 13,376 15%
Cervical Cytology Additions to the Cervical Cytology Register 35,806 36,889 3%Mental Health Community Services by GroupACT wide mental health program community service contacts 106,251 106,791 1%
Children and youth mental health program community service contacts 64,933 71,295 10%
Adult mental health program community service contacts 113,610 120,466 6%
Justice Health Services community contacts 114,860 151,210 32%
Alcohol and Drug Services community contacts 68,051 67,183 -1%
Dental Services Mean waiting time in months for persons on the Centralised Waiting and Recall List
3.7 5.9 59%
Proportion of urgent patients seen within standard waiting times 100% 100% 0%
* This measure excludes women from NSW as per the accountability indicator 1.4b in the ACT Health Budget Papers.
Note: All variances have been calculated using the relative difference with the exception of metrics that are displayed as a percentage where the actual difference has been used.
June 2016
ACT PubliC HeAlTH ServiCeS Quarterly Performance Report
21
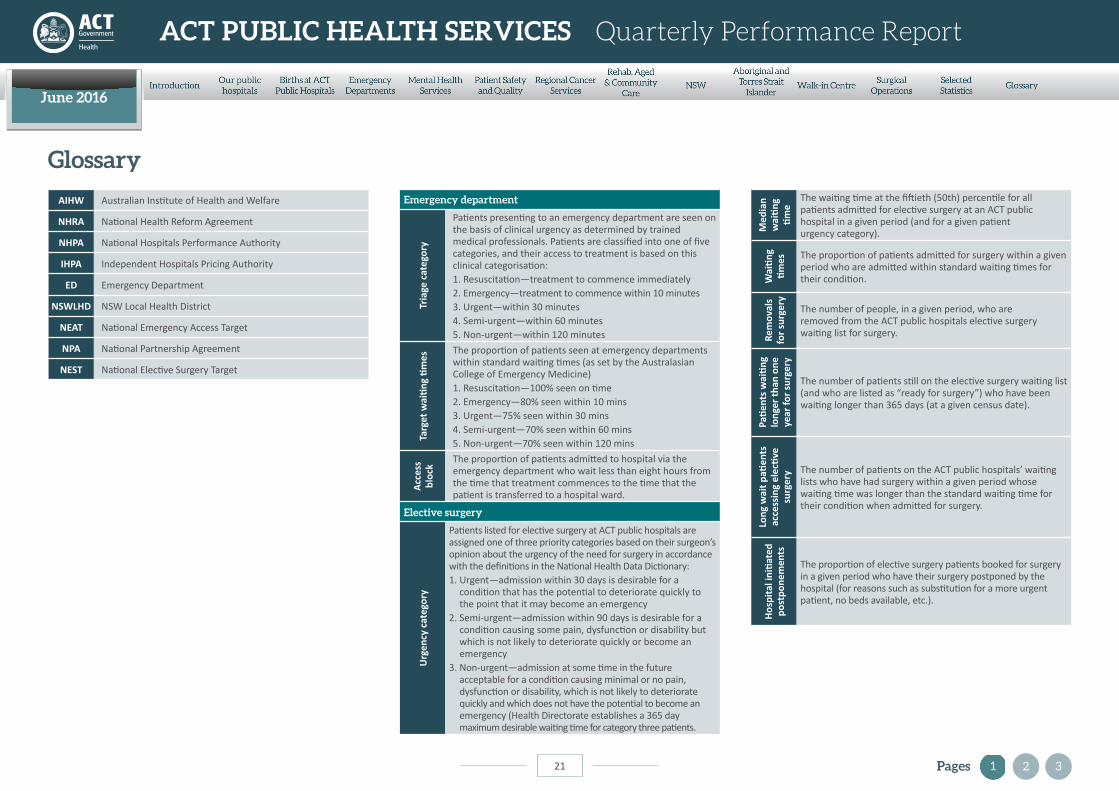
AIHW Australian Institute of Health and Welfare
NHRA National Health Reform Agreement
NHPA National Hospitals Performance Authority
IHPA Independent Hospitals Pricing Authority
ED Emergency Department
NSWLHD NSW Local Health District
NEAT National Emergency Access Target
NPA National Partnership Agreement
NEST National Elective Surgery Target
emergency department
Tria
ge c
ateg
ory
Patients presenting to an emergency department are seen on the basis of clinical urgency as determined by trained medical professionals. Patients are classified into one of five categories, and their access to treatment is based on this clinical categorisation:1. Resuscitation—treatment to commence immediately2. Emergency—treatment to commence within 10 minutes3. Urgent—within 30 minutes4. Semi-urgent—within 60 minutes5. Non-urgent—within 120 minutes
Targ
et w
aiti
ng ti
mes
The proportion of patients seen at emergency departments within standard waiting times (as set by the Australasian College of Emergency Medicine)1. Resuscitation—100% seen on time2. Emergency—80% seen within 10 mins3. Urgent—75% seen within 30 mins4. Semi-urgent—70% seen within 60 mins5. Non-urgent—70% seen within 120 mins
Acc
ess
bloc
k
The proportion of patients admitted to hospital via the emergency department who wait less than eight hours from the time that treatment commences to the time that the patient is transferred to a hospital ward.
elective surgery
Urg
ency
cat
egor
y
Patients listed for elective surgery at ACT public hospitals are assigned one of three priority categories based on their surgeon’s opinion about the urgency of the need for surgery in accordance with the definitions in the National Health Data Dictionary:1. Urgent—admission within 30 days is desirable for a
condition that has the potential to deteriorate quickly to the point that it may become an emergency
2. Semi-urgent—admission within 90 days is desirable for a condition causing some pain, dysfunction or disability but which is not likely to deteriorate quickly or become an emergency
3. Non-urgent—admission at some time in the future acceptable for a condition causing minimal or no pain, dysfunction or disability, which is not likely to deteriorate quickly and which does not have the potential to become an emergency (Health Directorate establishes a 365 day maximum desirable waiting time for category three patients.
Med
ian
wai
ting
ti
me
The waiting time at the fiftieth (50th) percentile for all patients admitted for elective surgery at an ACT public hospital in a given period (and for a given patient urgency category).
Wai
ting
ti
mes The proportion of patients admitted for surgery within a given
period who are admitted within standard waiting times for their condition.
Rem
oval
s fo
r su
rger
y
The number of people, in a given period, who are removed from the ACT public hospitals elective surgery waiting list for surgery.
Pati
ents
wai
ting
lo
nger
than
one
ye
ar fo
r su
rger
y
The number of patients still on the elective surgery waiting list (and who are listed as “ready for surgery”) who have been waiting longer than 365 days (at a given census date).
Long
wai
t pati
ents
ac
cess
ing
elec
tive
su
rger
y The number of patients on the ACT public hospitals’ waiting lists who have had surgery within a given period whose waiting time was longer than the standard waiting time for their condition when admitted for surgery.
Hos
pita
l ini
tiat
ed
post
pone
men
ts
The proportion of elective surgery patients booked for surgery in a given period who have their surgery postponed by the hospital (for reasons such as substitution for a more urgent patient, no beds available, etc.).
Glossary
2Pages 3
June 2016
ACT PubliC HeAlTH ServiCeS Quarterly Performance Report
22
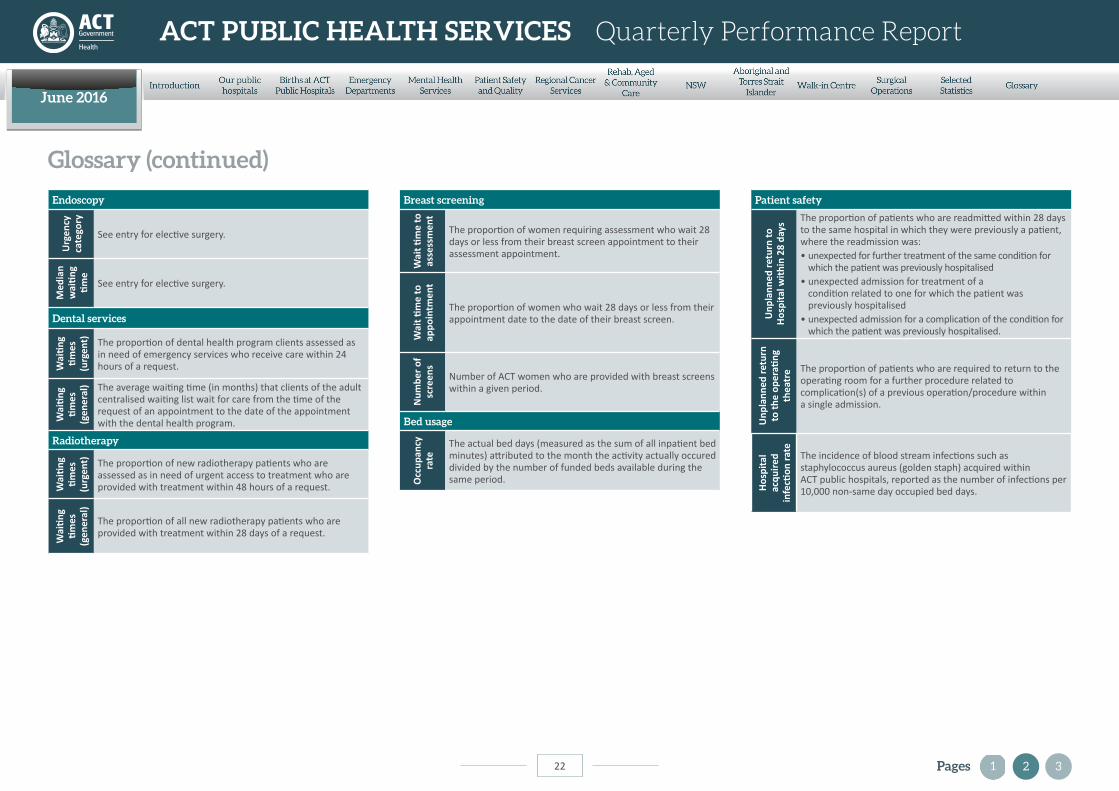
endoscopy
Urg
ency
ca
tego
ry
See entry for elective surgery.
Med
ian
wai
ting
ti
me
See entry for elective surgery.
Dental services
Wai
ting
ti
mes
(u
rgen
t) The proportion of dental health program clients assessed as in need of emergency services who receive care within 24 hours of a request.
Wai
ting
ti
mes
(g
ener
al) The average waiting time (in months) that clients of the adult
centralised waiting list wait for care from the time of the request of an appointment to the date of the appointment with the dental health program.
radiotherapy
Wai
ting
ti
mes
(u
rgen
t) The proportion of new radiotherapy patients who are assessed as in need of urgent access to treatment who are provided with treatment within 48 hours of a request.
Wai
ting
ti
mes
(g
ener
al)
The proportion of all new radiotherapy patients who are provided with treatment within 28 days of a request.
breast screening
Wai
t ti
me
to
asse
ssm
ent
The proportion of women requiring assessment who wait 28 days or less from their breast screen appointment to their assessment appointment.
Wai
t ti
me
to
appo
intm
ent
The proportion of women who wait 28 days or less from their appointment date to the date of their breast screen.
Num
ber
of
scre
ens
Number of ACT women who are provided with breast screens within a given period.
bed usageO
ccup
ancy
ra
teThe actual bed days (measured as the sum of all inpatient bed minutes) attributed to the month the activity actually occured divided by the number of funded beds available during the same period.
Patient safety
Unp
lann
ed re
turn
to
Hos
pita
l wit
hin
28 d
ays The proportion of patients who are readmitted within 28 days
to the same hospital in which they were previously a patient, where the readmission was:• unexpected for further treatment of the same condition for
which the patient was previously hospitalised• unexpected admission for treatment of a
condition related to one for which the patient was previously hospitalised
• unexpected admission for a complication of the condition for which the patient was previously hospitalised.
Unp
lann
ed re
turn
to
the
oper
ating
th
eatr
e The proportion of patients who are required to return to the operating room for a further procedure related to complication(s) of a previous operation/procedure within a single admission.
Hos
pita
l ac
quir
ed
infe
ction
rate The incidence of blood stream infections such as
staphylococcus aureus (golden staph) acquired within ACT public hospitals, reported as the number of infections per 10,000 non-same day occupied bed days.
2Pages
Glossary (continued)
3
June 2016
ACT PubliC HeAlTH ServiCeS Quarterly Performance Report
23
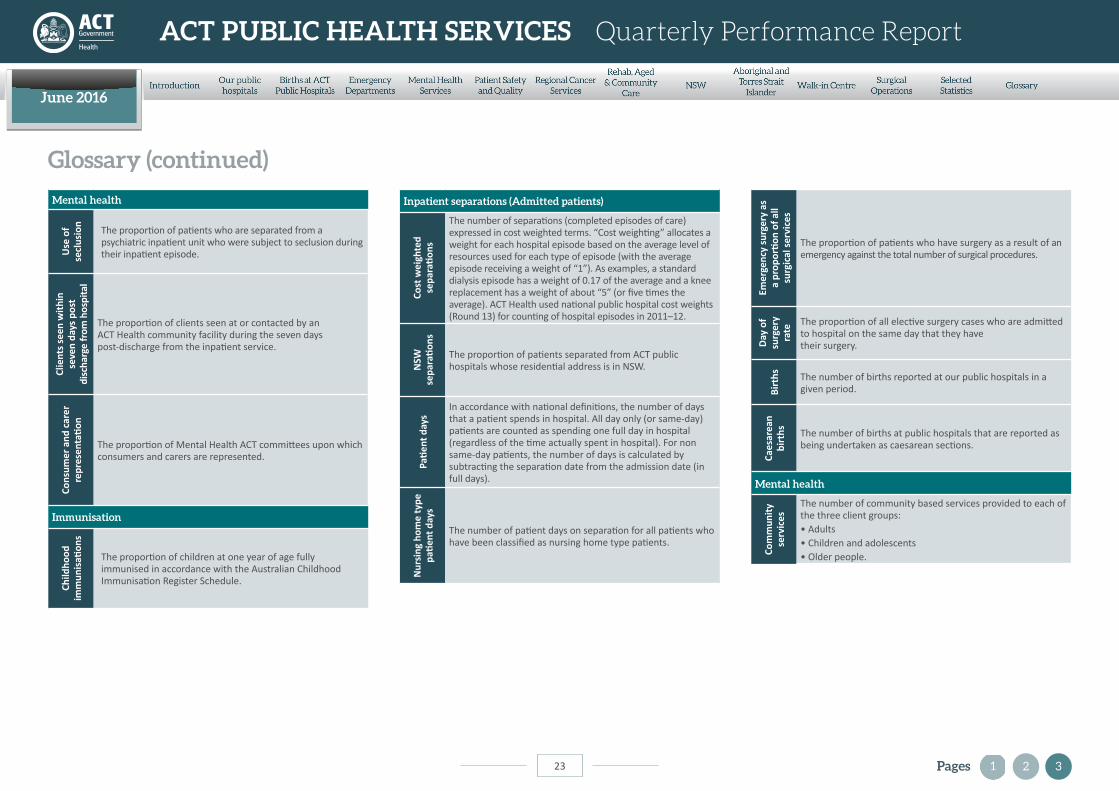
Mental health
Use
of
secl
usio
n The proportion of patients who are separated from a psychiatric inpatient unit who were subject to seclusion during their inpatient episode.
Clie
nts
seen
wit
hin
seve
n da
ys p
ost
disc
harg
e fr
om h
ospi
tal
The proportion of clients seen at or contacted by an ACT Health community facility during the seven days post-discharge from the inpatient service.
Cons
umer
and
car
er
repr
esen
tati
on
The proportion of Mental Health ACT committees upon which consumers and carers are represented.
immunisation
Child
hood
im
mun
isati
ons
The proportion of children at one year of age fully immunised in accordance with the Australian Childhood Immunisation Register Schedule.
2Pages 3
Glossary (continued)
inpatient separations (Admitted patients)
Cost
wei
ghte
d se
para
tion
s
The number of separations (completed episodes of care) expressed in cost weighted terms. “Cost weighting” allocates a weight for each hospital episode based on the average level of resources used for each type of episode (with the average episode receiving a weight of “1”). As examples, a standard dialysis episode has a weight of 0.17 of the average and a knee replacement has a weight of about “5” (or five times the average). ACT Health used national public hospital cost weights (Round 13) for counting of hospital episodes in 2011–12.
NSW
se
para
tion
s
The proportion of patients separated from ACT public hospitals whose residential address is in NSW.
Pati
ent d
ays
In accordance with national definitions, the number of days that a patient spends in hospital. All day only (or same-day) patients are counted as spending one full day in hospital (regardless of the time actually spent in hospital). For non same-day patients, the number of days is calculated by subtracting the separation date from the admission date (in full days).
Nur
sing
hom
e ty
pe
pati
ent d
ays
The number of patient days on separation for all patients who have been classified as nursing home type patients.
Emer
genc
y su
rger
y as
a
prop
orti
on o
f all
su
rgic
al s
ervi
ces
The proportion of patients who have surgery as a result of an emergency against the total number of surgical procedures.
Day
of
surg
ery
rate
The proportion of all elective surgery cases who are admitted to hospital on the same day that they have their surgery.
Birt
hs The number of births reported at our public hospitals in a given period.
Caes
area
n bi
rths The number of births at public hospitals that are reported as
being undertaken as caesarean sections.
Mental health
Com
mun
ity
serv
ices
The number of community based services provided to each of the three client groups:• Adults• Children and adolescents• Older people.