Embed Size (px)
Citation preview
Thom Craver | Senior SEO Analyst, CBS Interactive
PRE-CONFERENCE WORKBOOK
ACTIONABLE ANALYTICS: DATA-DRIVEN, DECISION
MAKING TO ATTAIN YOUR BUSINESS OBJECTIVES
© Conversion Sciences LLC. Used with permission.
TABLE OF CONTENTS
Introduction
The Process & Measuring for Meaning
Measuring for Meaning
Vanity metrics vs. Business Objectives
Exercise
Using Goals in Google Analytics
Website Goals and Funnels in Google Analytics
Exercise
Segmentation: Giving Meaning to Data
Measuring Visitors in Aggregate Means Nothing
Most Common Ways to Segment Visitors
Finding Your Analytics Segments
Segmenting by Goals Best Practices
Segmenting by Non-Goal Behaviors
Segmenting by Visitor Dimensions
Exercise
Tracking Campaigns: Online and Offline
Tagging Online Campaigns
Campaign Tracking Variables
How Tracking Variables Work
Web Analytics Campaign Tracking Variables
Adobe Analytics Campaign Variable
Campaign URL Builder
Exercise
Automating Campaign Tracking
Other Ways to Use Campaign Parameters
External URLs Only
Exercise
4
5
6
7
8
9
9
10
11
11
12
12
13
14
15
16
17
17
18
19
20
21
22
23
24
25
26
27
© Conversion Sciences LLC. Used with permission.
TABLE OF CONTENTS
Key Performance Indicators
KPIs vs. Standard Metrics
KPIs Correlate to Business Objectives
Characteristics of KPIs
Examples of Business Requirements for KPIs
Exercise
A/B Testing
Introduction to A/B Testing
Exercise
Attribution: Credit Where Credit is Due
What is Attribution Modeling?
Common Attribution Models
Lookback Makes a Big Difference
Comparing Attribution Models
How to Choose an Attribution Model
Exercise
Reporting and Dashboarding
Creating Dashboards
Common Mistake: Data overload
Data vs. Information
Actionable Reporting
Exercise
About Thom Craver
28
28
28
29
30
30
31
32
33
34
34
35
36
37
38
39
40
40
42
43
44
45
46
© Conversion Sciences LLC. Used with permission.

4
INTRODUCTION
eb analytics is more than dumping data points from a tool without insight or actionable recommendations. WYou could search the Web and get several definitions of web analytics. Most definitions are all accurate, but
not all-encompassing. Proper web analytics is a cycle the includes properly measuring the right data points,
understanding their context when compared to other groups of similar data. This should help you
understand multiple business objectives with your website in addition to helping you better understand how
visitors arrive at and interact with your site so you can optimize those interactions in the future to exceed
your organization's bottom line.
© Conversion Sciences LLC. Used with permission.
5
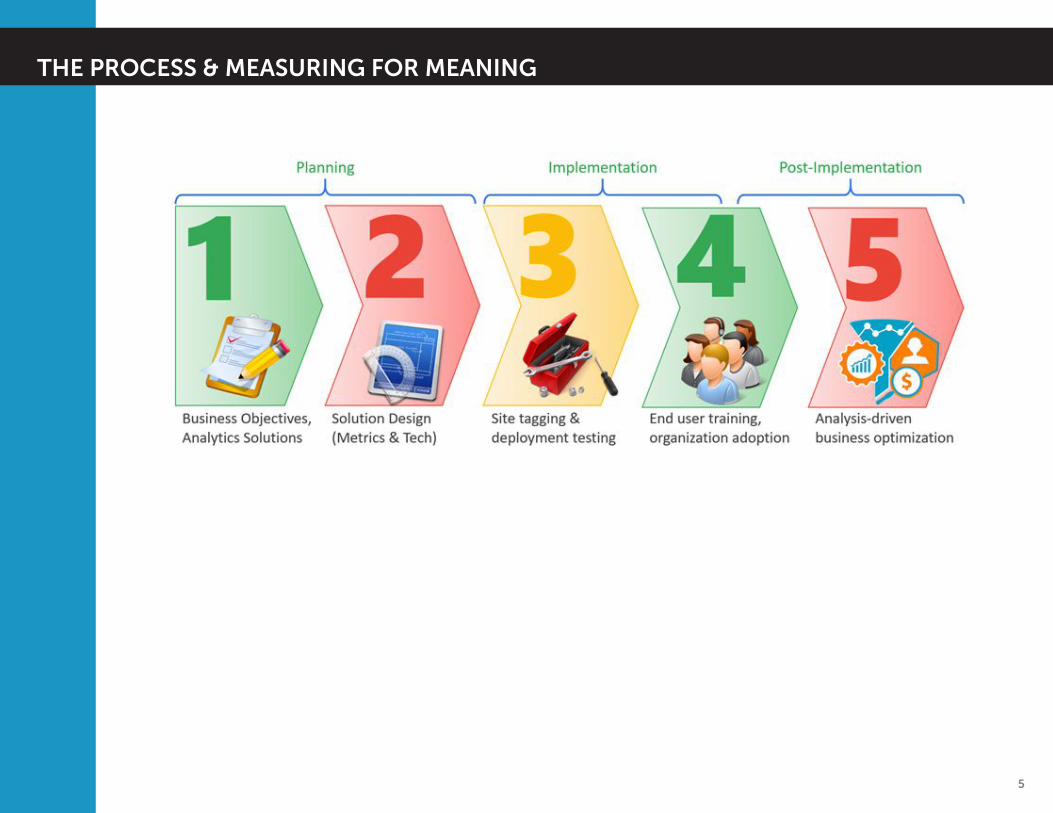
THE PROCESS & MEASURING FOR MEANING
© Conversion Sciences LLC. Used with permission.

6
THE PROCESS & MEASURING FOR MEANING
When collecting data points, know there are few limitations. From mouse movements to individual items clicked or
browser commands given, if it happens in the browser window, you can record it.
Types of data to collect:
1. Hit Level Metrics
e.g.: page views, time on page, downloads, events
2. Session Level Metrics
e.g.: visits (sessions), time on site, visitor source
3. Visitor Dimensions
e.g.: age, gender, location, language
MEASURING FOR MEANING
© Conversion Sciences LLC. Used with permission.
7
THE PROCESS & MEASURING FOR MEANING
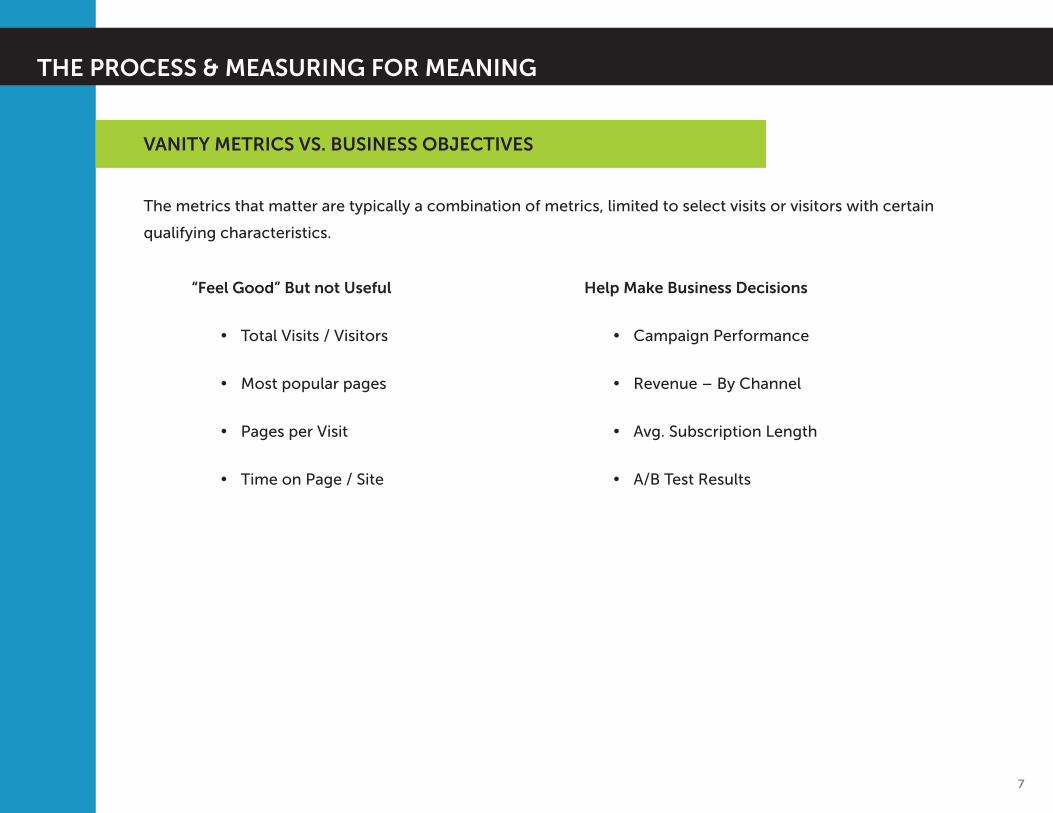
The metrics that matter are typically a combination of metrics, limited to select visits or visitors with certain
qualifying characteristics.
“Feel Good” But not Useful
Ÿ Total Visits / Visitors
Ÿ Most popular pages
Ÿ Pages per Visit
Ÿ Time on Page / Site
Help Make Business Decisions
Ÿ Campaign Performance
Ÿ Revenue – By Channel
Ÿ Avg. Subscription Length
Ÿ A/B Test Results
VANITY METRICS VS. BUSINESS OBJECTIVES
© Conversion Sciences LLC. Used with permission.

8
THE PROCESS & MEASURING FOR MEANING
1. What are the business objectives your website is trying to accomplish?
EXERCISE
2. What metrics and dimensions are required to measure those objectives?
© Conversion Sciences LLC. Used with permission.
9
USING GOALS IN GOOGLE ANALYTICS
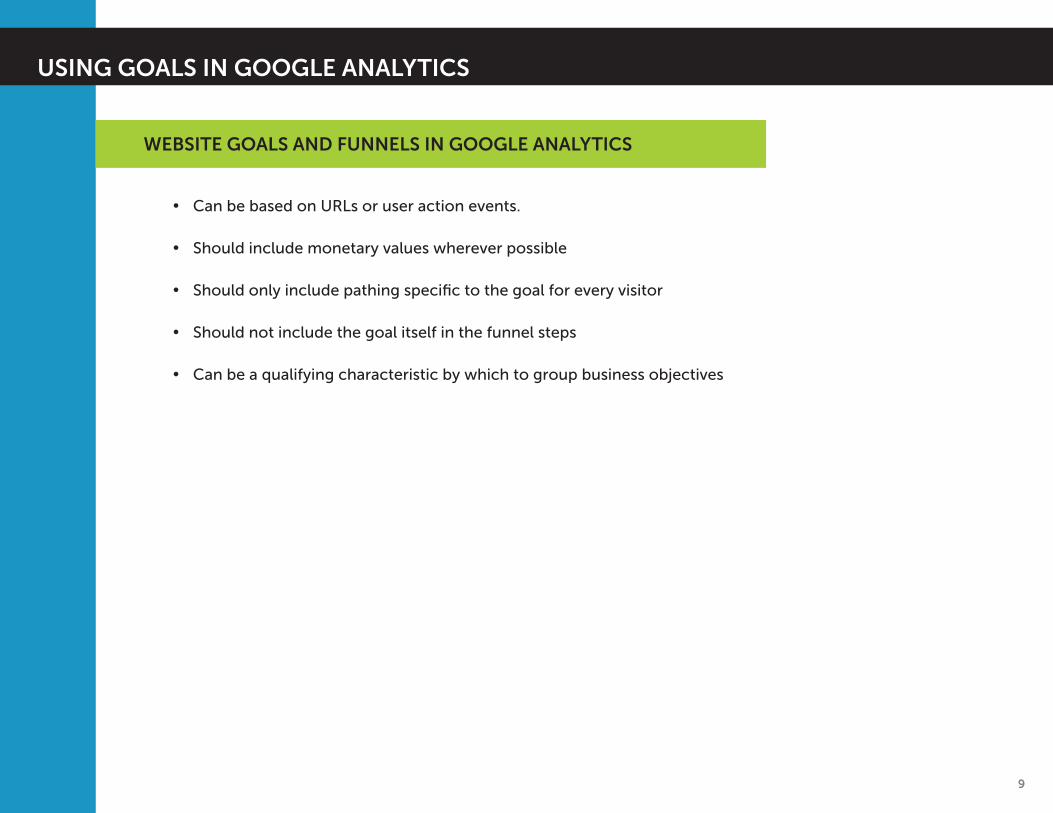
WEBSITE GOALS AND FUNNELS IN GOOGLE ANALYTICS
Ÿ Can be based on URLs or user action events.
Ÿ Should include monetary values wherever possible
Ÿ Should only include pathing specific to the goal for every visitor
Ÿ Should not include the goal itself in the funnel steps
Ÿ Can be a qualifying characteristic by which to group business objectives
© Conversion Sciences LLC. Used with permission.
10
USING GOALS IN GOOGLE ANALYTICS
EXERCISE
Go into your Google Analytics account and list the goals you have set up.
Star any goals without funnels or whose funnels are incorrectly setup.
Below, list steps that could be taken to correct those funnels:
© Conversion Sciences LLC. Used with permission.

11
MEASURING VISITORS IN AGGREGATE MEANS NOTHING
Ÿ Create “groups” or subsets
Ÿ Test goals and conversions against
Ÿ visitor subsets, page content
Ÿ ROI of campaigns, lists
Ÿ More meaningful information
SEGMENTATION: GIVING MEANING TO DATA
© Conversion Sciences LLC. Used with permission.
12
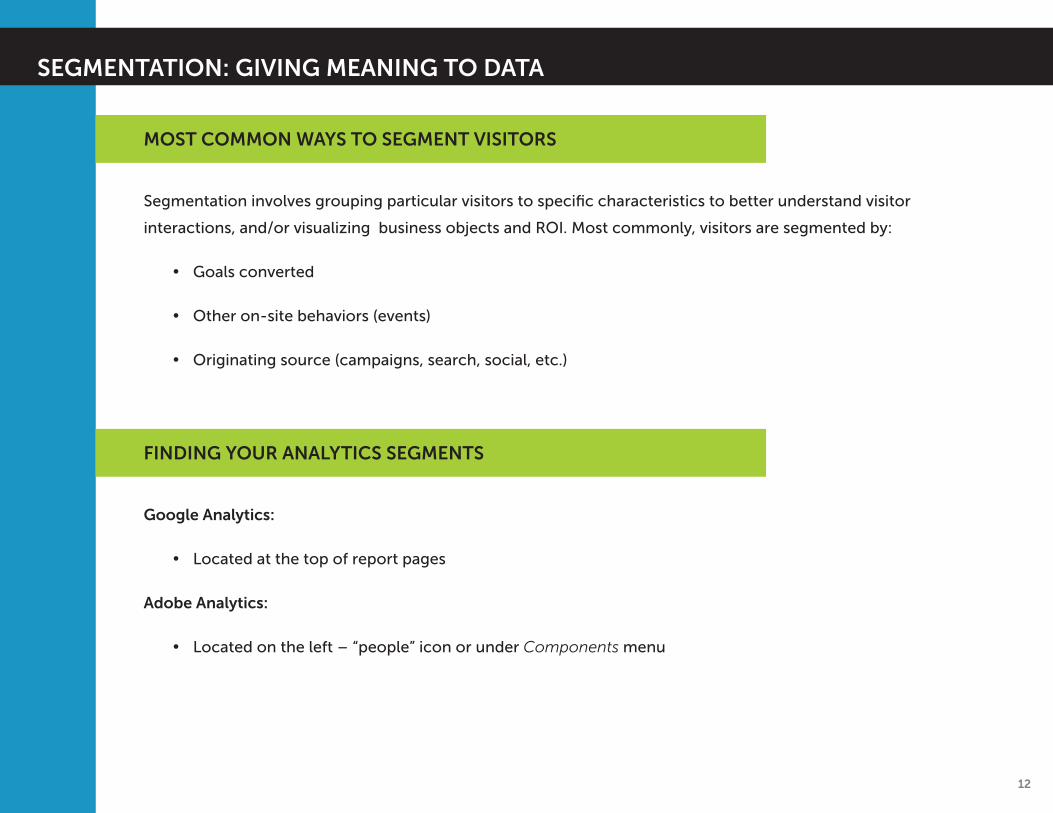
MOST COMMON WAYS TO SEGMENT VISITORS
Segmentation involves grouping particular visitors to specific characteristics to better understand visitor
interactions, and/or visualizing business objects and ROI. Most commonly, visitors are segmented by:
Ÿ Goals converted
Ÿ Other on-site behaviors (events)
Ÿ Originating source (campaigns, search, social, etc.)
FINDING YOUR ANALYTICS SEGMENTS
Google Analytics:
Ÿ Located at the top of report pages
Adobe Analytics:
Ÿ Located on the left – “people” icon or under Components menu
SEGMENTATION: GIVING MEANING TO DATA
© Conversion Sciences LLC. Used with permission.
13
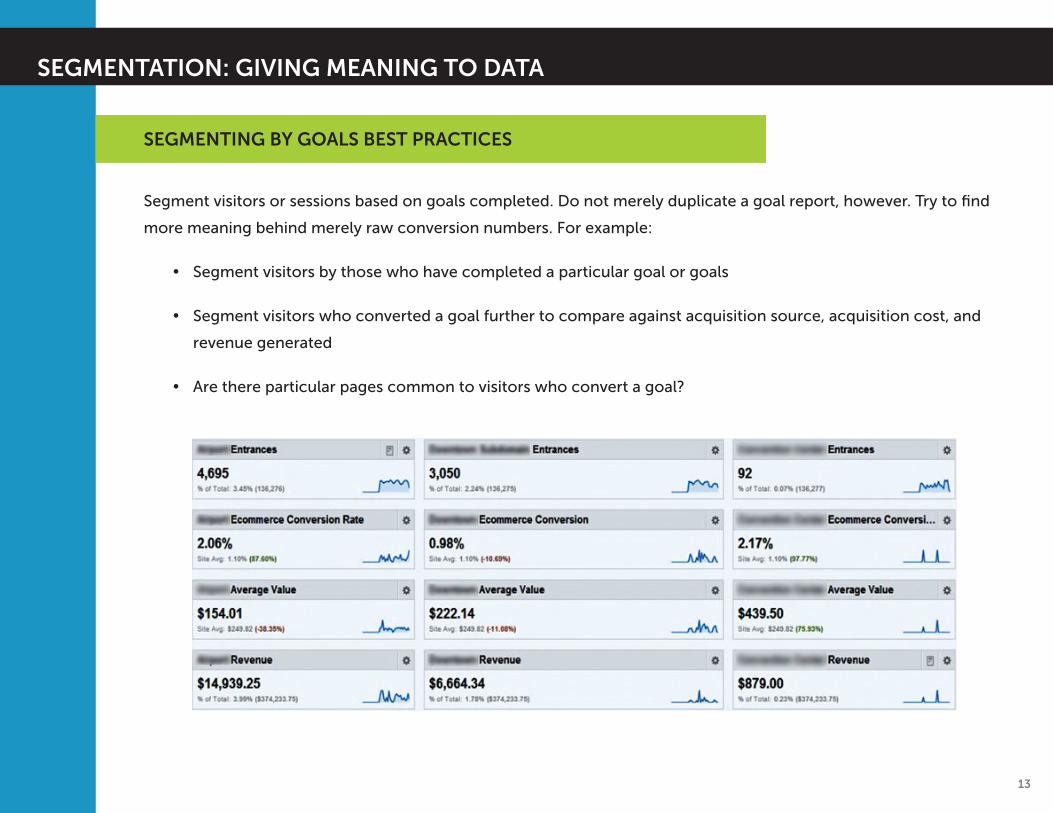
SEGMENTING BY GOALS BEST PRACTICES
Segment visitors or sessions based on goals completed. Do not merely duplicate a goal report, however. Try to find
more meaning behind merely raw conversion numbers. For example:
Ÿ Segment visitors by those who have completed a particular goal or goals
Ÿ Segment visitors who converted a goal further to compare against acquisition source, acquisition cost, and
revenue generated
Ÿ Are there particular pages common to visitors who convert a goal?
SEGMENTATION: GIVING MEANING TO DATA
© Conversion Sciences LLC. Used with permission.
14
SEGMENTING BY NON-GOAL BEHAVIORS
Segment visitors or sessions based on visitor behavior events that have meaning. Forms are most common. But don’t
limit to forms completed. Measure user activity to determine answer to questions like:
Ÿ What elements of a form were left blank upon abandonment?
Ÿ Were errors recorded during submission?
Ÿ What pages were viewed in lieu of form completion or was the whole site abandoned?
Ÿ What percentage of which videos are being viewed?
Ÿ What content are people interacting with most?
Ÿ Why are visitors leaving our site?
Ÿ Are they accomplishing their task even on a one-page visit (bounce)?
SEGMENTATION: GIVING MEANING TO DATA
© Conversion Sciences LLC. Used with permission.

15
SEGMENTING BY VISITOR DIMENSIONS
Segment visitors based from where they arrived prior. Organic search and social media visits are often built-in
segments. Understanding visitors from campaigns or geo-location can help determine answers to questions like:
Ÿ What is the ROI of our marketing campaigns?
Ÿ Should certain campaigns be paused or have their budgets increased?
Ÿ What content are different demographic groups more interested in consuming?
Ÿ Are geo-targeted ads (online or offline) having the desired effect on traffic?
Ÿ Are organic SEO efforts paying off?
Ÿ Are link-building efforts paying off?
Ÿ Was our website hit with a penalty from a search engine?
SEGMENTATION: GIVING MEANING TO DATA
© Conversion Sciences LLC. Used with permission.

16
EXERCISE
SEGMENTATION: GIVING MEANING TO DATA
Lookup the custom segments currently defined in your analytics account and list them below.
Are these segments useful toward helping clarify metrics by your organization's business objectives? Why or why not?
© Conversion Sciences LLC. Used with permission.

17
Tracking parameters conclusively define from which source a visitor arrived at your website. They are most
commonly used to track online marketing campaigns via email or social media. Links from these sources can often
appear as direct visits to a site, unless tracking is appended to the URLs in the calls to action.
TRACKING CAMPAIGNS: ONLINE AND OFFLINE
TAGGING ONLINE CAMPAIGNS
© Conversion Sciences LLC. Used with permission.

18
Campaign tracking variables – sometimes referred to as URL parameters – are added to the end of a URL and allow
analytics software to determine the true source of a visitor to a website. These variables must be unique and do not
affect how the page renders to the site visitor.
The format is variable name, then an equals sign, then the value. Additional tracking parameters use an ampersand
(&) character between the previous value and the next variable name. For example:
TRACKING CAMPAIGNS: ONLINE AND OFFLINE
CAMPAIGN TRACKING VARIABLES
www.MyDomain.com/landingPage.html? = & =variable1 variable2someValue somethingElse
© Conversion Sciences LLC. Used with permission.

19
Tracking variable allow you to tell your analytics software precisely from where a visitor originated.
TRACKING CAMPAIGNS: ONLINE AND OFFLINE
HOW TRACKING VARIABLES WORK
© Conversion Sciences LLC. Used with permission.
20
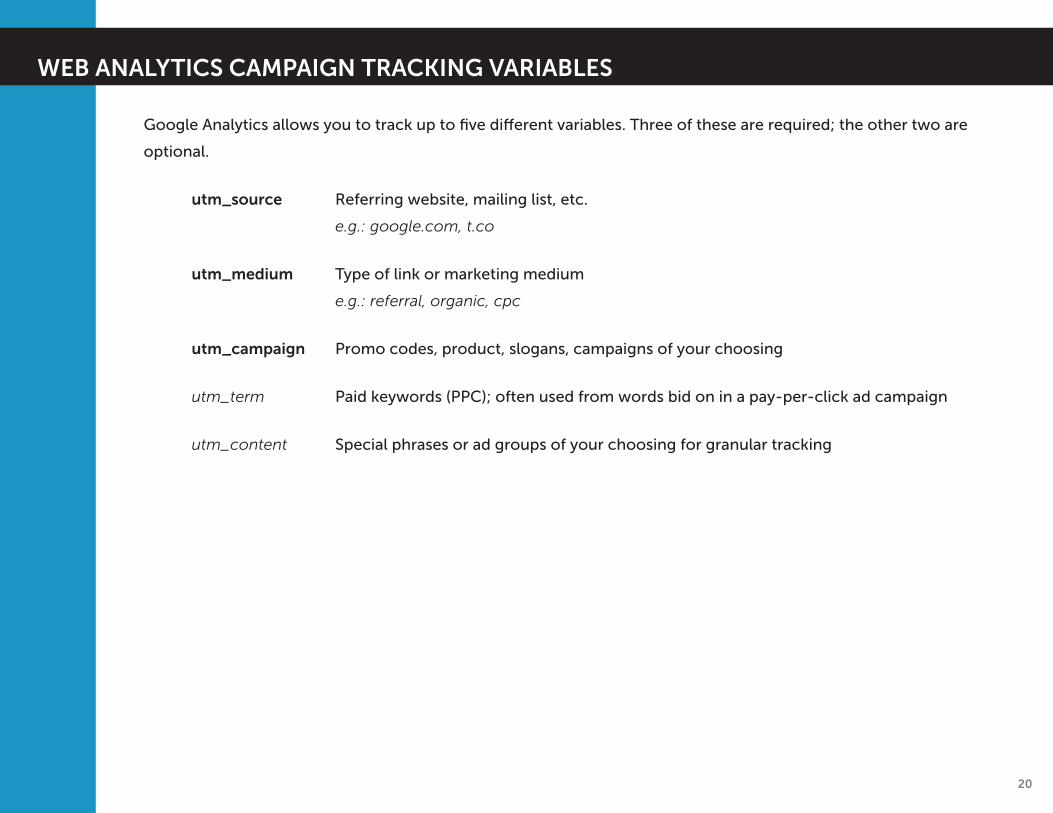
WEB ANALYTICS CAMPAIGN TRACKING VARIABLES
Google Analytics allows you to track up to five different variables. Three of these are required; the other two are
optional.
utm_source Referring website, mailing list, etc.
e.g.: google.com, t.co
utm_medium Type of link or marketing medium
e.g.: referral, organic, cpc
utm_campaign Promo codes, product, slogans, campaigns of your choosing
utm_term Paid keywords (PPC); often used from words bid on in a pay-per-click ad campaign
utm_content Special phrases or ad groups of your choosing for granular tracking
© Conversion Sciences LLC. Used with permission.
21
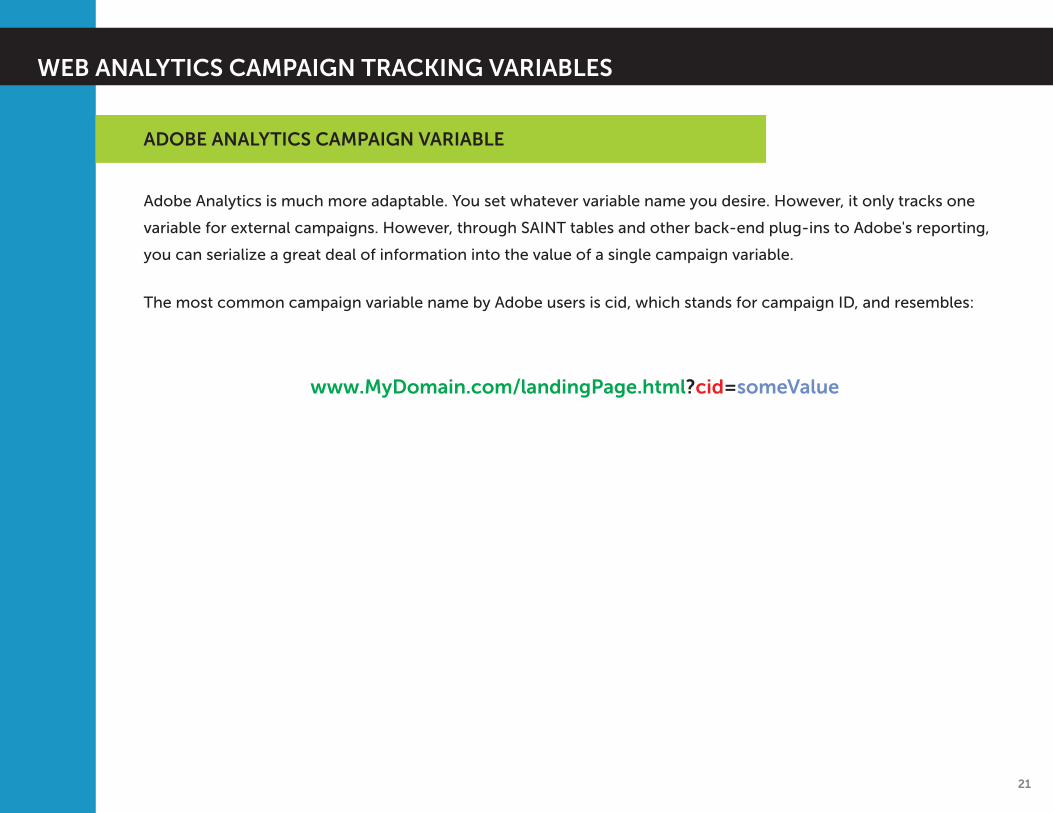
Adobe Analytics is much more adaptable. You set whatever variable name you desire. However, it only tracks one
variable for external campaigns. However, through SAINT tables and other back-end plug-ins to Adobe's reporting,
you can serialize a great deal of information into the value of a single campaign variable.
The most common campaign variable name by Adobe users is cid, which stands for campaign ID, and resembles:
ADOBE ANALYTICS CAMPAIGN VARIABLE
www.MyDomain.com/landingPage.html? =cid someValue
WEB ANALYTICS CAMPAIGN TRACKING VARIABLES
© Conversion Sciences LLC. Used with permission.

22
Google URL Builder is a free tool Google provides to assist you in adding campaign variables to your URLs. Simply fill
out your website / campaign URL, add your source and other campaign information, and the Campaign URL Builder
provides all the necessary connecting syntax automatically. Simply copy it and paste it into your campaign as the link
for your call to action.
CAMPAIGN URL BUILDER
WEB ANALYTICS CAMPAIGN TRACKING VARIABLES
© Conversion Sciences LLC. Used with permission.
23
Use Google's Campaign URL Builder to create a custom URL for an email campaign for your monthly newsletter with
the name November2017.
Write the resultant URL below:
________________________________________________________________________________________
Use Google's Campaign URL Builder to create a custom URL for any online campaign you recently executed or are
about to execute in your organization. Identify the relevant variables in the space provided and write the complete,
resultant URL.
utm_source: ______________________________________________________________________
utm_medium: ______________________________________________________________________
utm_name: ______________________________________________________________________
utm_term: ______________________________________________________________________
utm_content: ______________________________________________________________________
Campaign URL: ______________________________________________________________________
EXERCISE
WEB ANALYTICS CAMPAIGN TRACKING VARIABLES
© Conversion Sciences LLC. Used with permission.
24
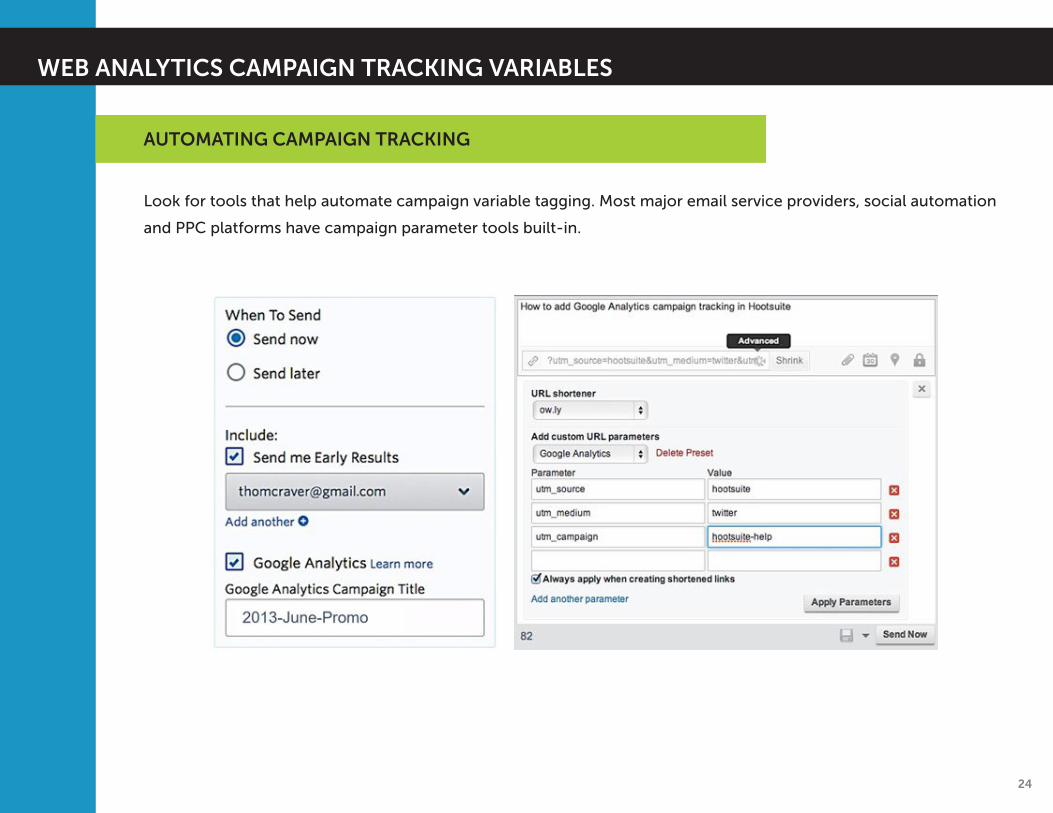
Look for tools that help automate campaign variable tagging. Most major email service providers, social automation
and PPC platforms have campaign parameter tools built-in.
AUTOMATING CAMPAIGN TRACKING
WEB ANALYTICS CAMPAIGN TRACKING VARIABLES
© Conversion Sciences LLC. Used with permission.
25
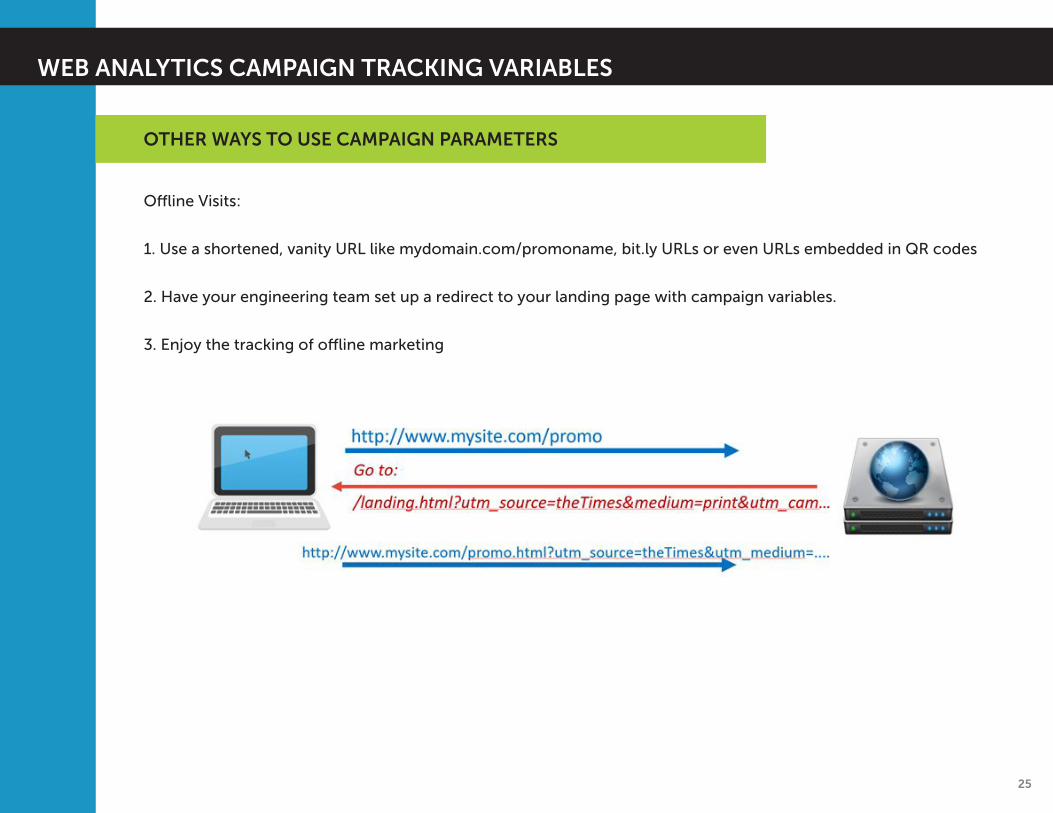
Offline Visits:
1. Use a shortened, vanity URL like mydomain.com/promoname, bit.ly URLs or even URLs embedded in QR codes
2. Have your engineering team set up a redirect to your landing page with campaign variables.
3. Enjoy the tracking of offline marketing
OTHER WAYS TO USE CAMPAIGN PARAMETERS
WEB ANALYTICS CAMPAIGN TRACKING VARIABLES
© Conversion Sciences LLC. Used with permission.

26
Only use campaign variables on URLs from sources external to your website. Never use to track internal campaigns.
Adobe Analytics has an internal campaign variable that works similar to the external campaign variable that you are
free to name as you see fit.
Google Analytics will register a new visit every time the utm_source campaign variable changes.
EXTERNAL URLs ONLY
WEB ANALYTICS CAMPAIGN TRACKING VARIABLES
© Conversion Sciences LLC. Used with permission.
27
List all promotional campaigns, online or offline, that could benefit from campaign tracking with URL parameters.
Which method would you use to track these?
EXERCISE
Campaign Name Online or Offline Tracking method utm_source utm_medium
WEB ANALYTICS CAMPAIGN TRACKING VARIABLES
© Conversion Sciences LLC. Used with permission.

28
KEY PERFORMANCE INDICATORS
KPIs VS. STANDARD METRICS
Web Metrics:
Ÿ Numerical data points representing measurable Web site actions
Ÿ Ratios of numbers representing Web Actions
Key Performance Indicators:
Ÿ Metrics that directly correlate to the business objective of your Web site
KPIs CORRELATE TO BUSINESS OBJECTIVES
Use segments and even custom metrics to come up with KPIs pertinent to your organizations’ business objectives.
Add values and provide relative historical context whenever possible.
KPIs answer what, which, and/or how questions for understanding your business requirements and solving your
business objectives. E.g.:
Ÿ What are my top-converting products?
Ÿ Which pages on my website contribute most to success?
Ÿ Which campaigns have the highest conversion? …ROI? …gross income?
© Conversion Sciences LLC. Used with permission.
29
KEY PERFORMANCE INDICATORS
CHARACTERISTICS OF KPIs
1. Clear
Ÿ Anyone can understand them
2. Pertinent
Ÿ Organization’s Business Objectives
3. Timely
Ÿ Now, not later
4. Instantly useful
Ÿ Get it right away
© Conversion Sciences LLC. Used with permission.
30
KEY PERFORMANCE INDICATORS
EXAMPLES OF BUSINESS REQUIREMENTS FOR KPIs
Ÿ Increase revenue generated through web sales of Product A by 15 percent in the current year.
Ÿ Decrease the cost per acquisition of Product A by 5 percent in the current year.
Ÿ Increase sales leads by 8 percent in the current year.
Ÿ Increase new sign-ups by 5 percent in the current year.
EXERCISE
Establish KPIs for the business objectives you created in your first exercise. Include all pertinent metrics, segments
and values.
© Conversion Sciences LLC. Used with permission.
31
A/B TESTING
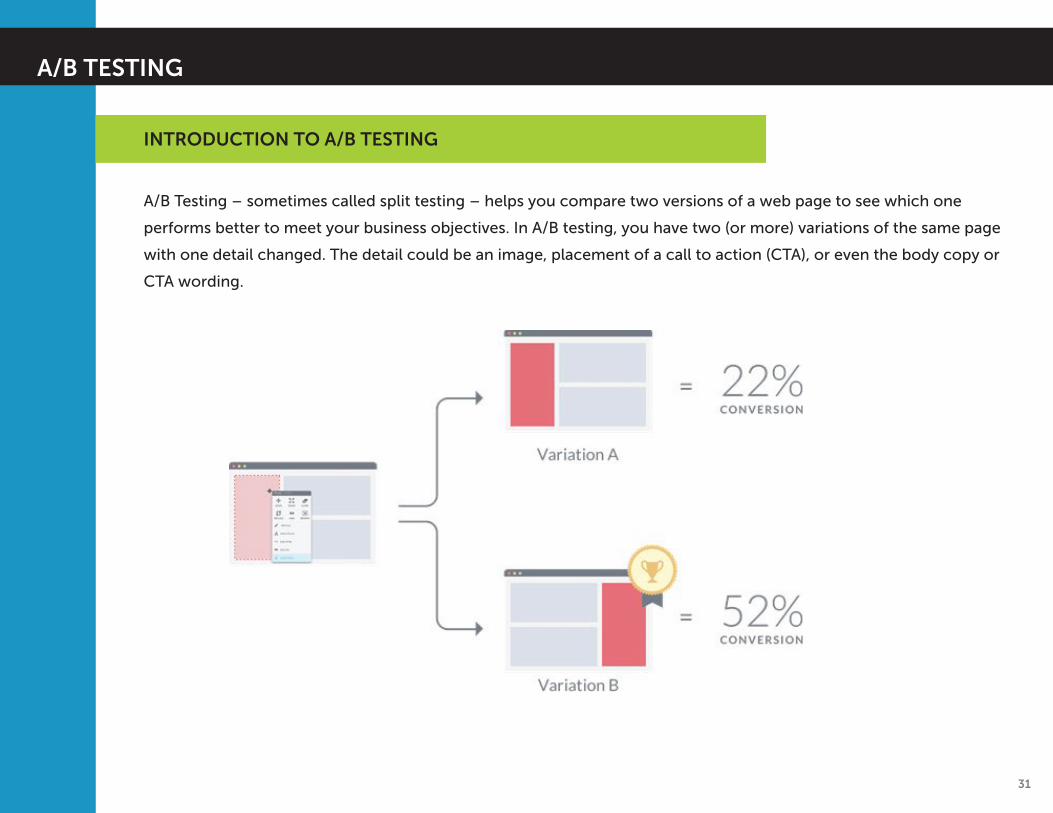
A/B Testing – sometimes called split testing – helps you compare two versions of a web page to see which one
performs better to meet your business objectives. In A/B testing, you have two (or more) variations of the same page
with one detail changed. The detail could be an image, placement of a call to action (CTA), or even the body copy or
CTA wording.
INTRODUCTION TO A/B TESTING
© Conversion Sciences LLC. Used with permission.
32
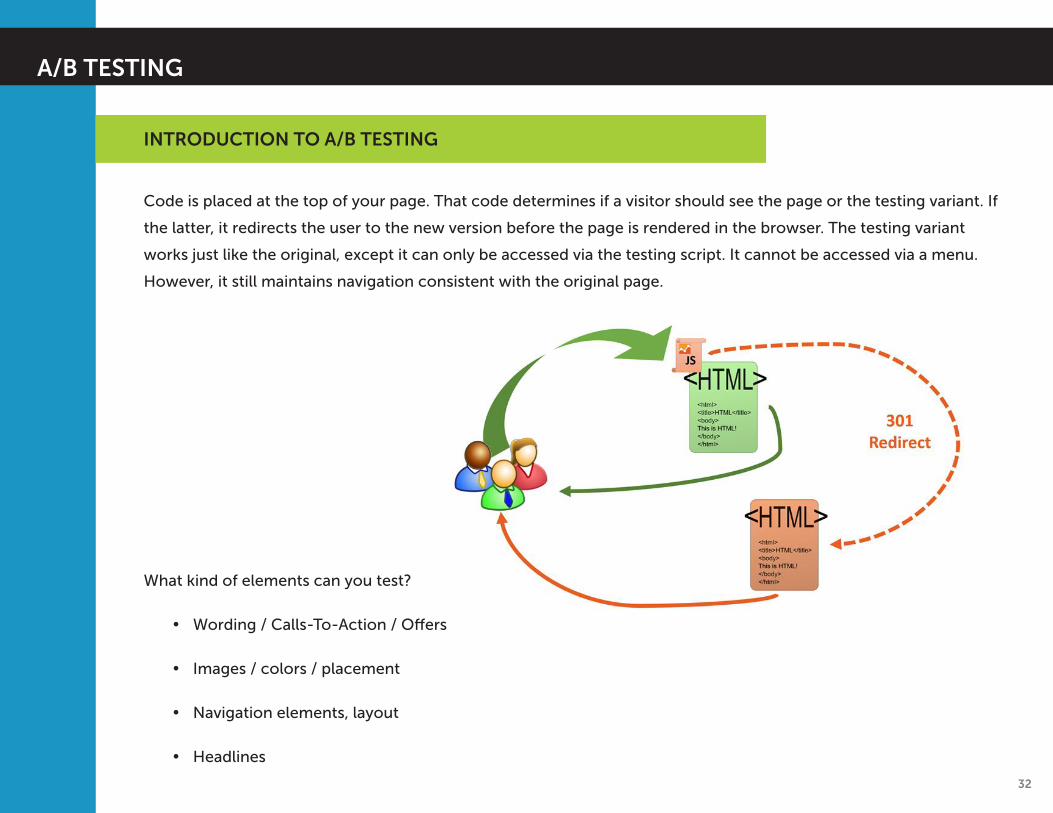
Code is placed at the top of your page. That code determines if a visitor should see the page or the testing variant. If
the latter, it redirects the user to the new version before the page is rendered in the browser. The testing variant
works just like the original, except it can only be accessed via the testing script. It cannot be accessed via a menu.
However, it still maintains navigation consistent with the original page.
What kind of elements can you test?
Ÿ Wording / Calls-To-Action / Offers
Ÿ Images / colors / placement
Ÿ Navigation elements, layout
Ÿ Headlines
A/B TESTING
INTRODUCTION TO A/B TESTING
© Conversion Sciences LLC. Used with permission.
33
Determine which pages you think might be underperforming. It could be a campaign landing page, your home page,
or even a form. List the page, which elements you'd like to test, and the number of variants you'd have in your
experiment.
EXERCISE
Page Conversion goal Elements to test
A/B TESTING
© Conversion Sciences LLC. Used with permission.
34
ATTRIBUTION: CREDIT WHERE CREDIT IS DUE
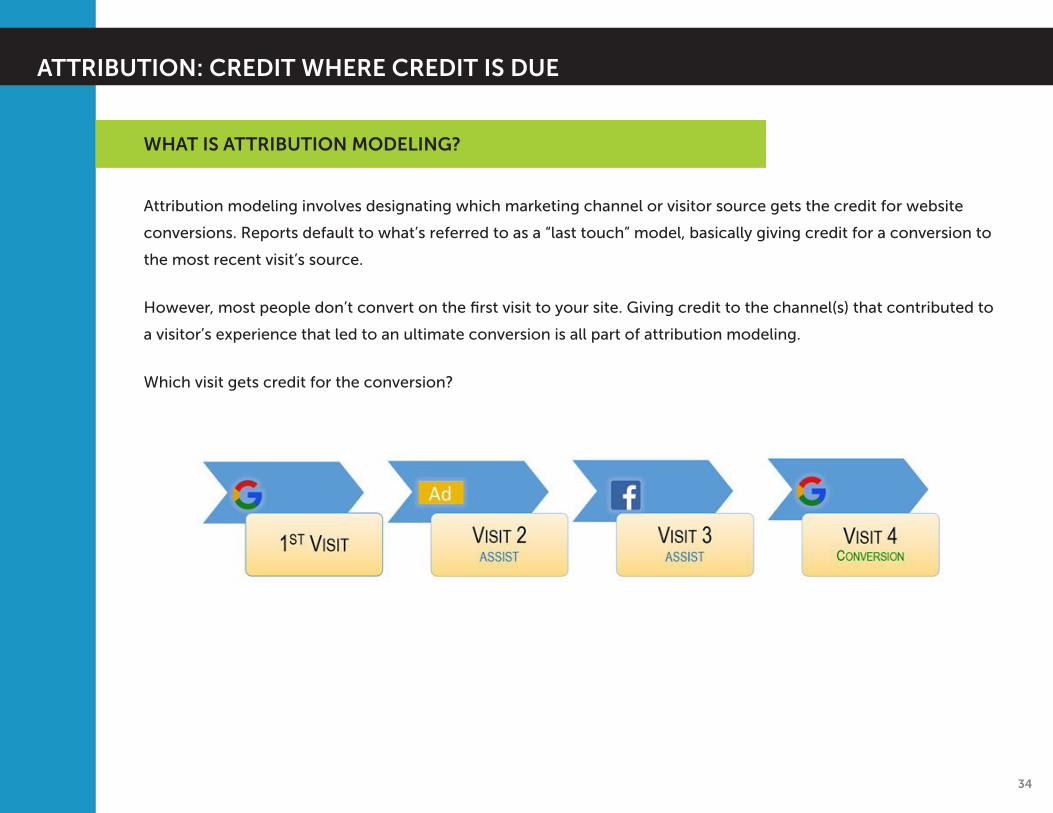
Attribution modeling involves designating which marketing channel or visitor source gets the credit for website
conversions. Reports default to what’s referred to as a “last touch” model, basically giving credit for a conversion to
the most recent visit’s source.
However, most people don’t convert on the first visit to your site. Giving credit to the channel(s) that contributed to
a visitor’s experience that led to an ultimate conversion is all part of attribution modeling.
Which visit gets credit for the conversion?
WHAT IS ATTRIBUTION MODELING?
© Conversion Sciences LLC. Used with permission.

35
ATTRIBUTION: CREDIT WHERE CREDIT IS DUE
COMMON ATTRIBUTION MODELS
© Conversion Sciences LLC. Used with permission.

36
ATTRIBUTION: CREDIT WHERE CREDIT IS DUE
LOOKBACK MAKES A BIG DIFFERENCE
The lookback window, sometimes called time lag, matters a great deal when attribution modeling. By default, most
analytics vendors look back at 30 days of data as the lookback window. If your customer visited multiple times prior
to that 30-day lookback, those prior visits would not be counted.
In the example below, with a 30-day lookback window and a first-touch attribution model, social media would get
the credit for a conversion, not the organic search that happened just two days prior.
© Conversion Sciences LLC. Used with permission.
37
ATTRIBUTION: CREDIT WHERE CREDIT IS DUE
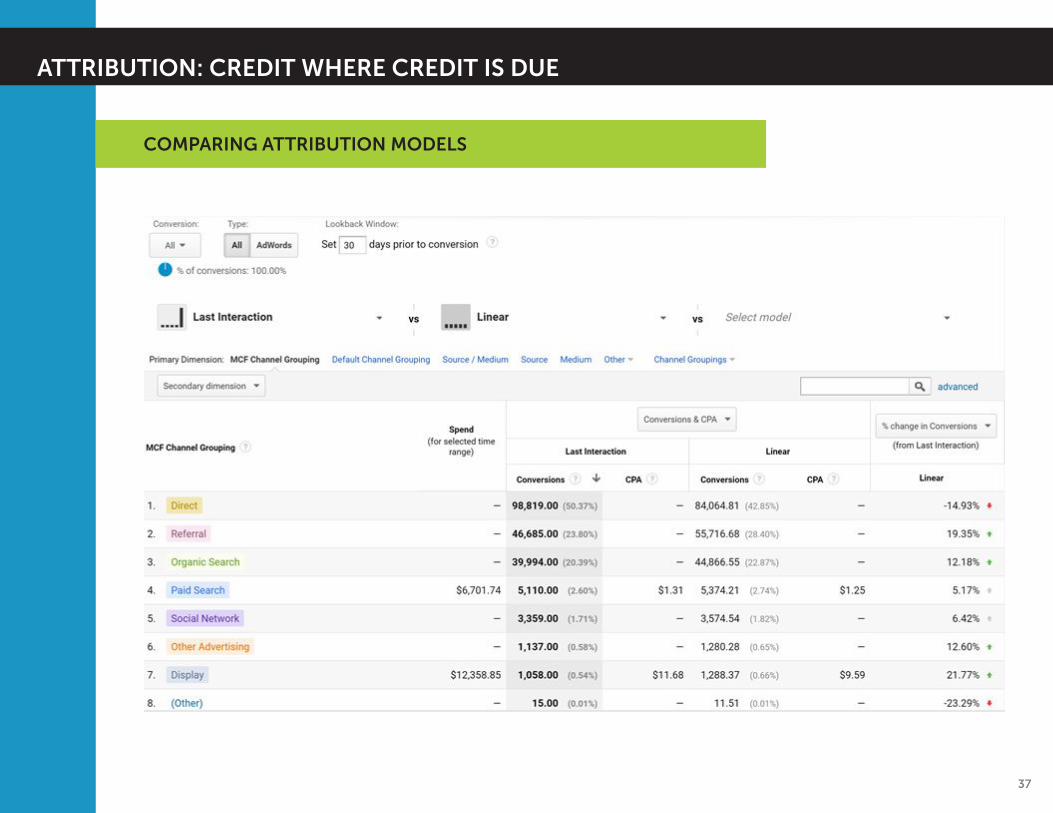
COMPARING ATTRIBUTION MODELS
© Conversion Sciences LLC. Used with permission.
38
Consider:
Ÿ Business model (affiliates?)
Ÿ Sales cycle length
Ÿ Lead / sales generation process
No model is perfect
Ÿ Find models that are useful
Ÿ Use the one that is most useful
HOW TO CHOOSE AN ATTRIBUTION MODEL
ATTRIBUTION: CREDIT WHERE CREDIT IS DUE
© Conversion Sciences LLC. Used with permission.
39
Select attribution models to compare. Answer the following questions to determine which to use:
1. What is the sales cycle for a typical order or service contract?
_________________________________________________________________________________
_________________________________________________________________________________
2. What kind of lead generation does your company perform?
_________________________________________________________________________________
_________________________________________________________________________________
3. Do you offer value-added offers online?
_________________________________________________________________________________
_________________________________________________________________________________
4. Do you offer reviews or comparisons?
_________________________________________________________________________________
_________________________________________________________________________________
Which attribution model(s) appear to make the most sense for your organization?
EXERCISE
ATTRIBUTION: CREDIT WHERE CREDIT IS DUE
© Conversion Sciences LLC. Used with permission.
40
REPORTING AND DASHBOARDING
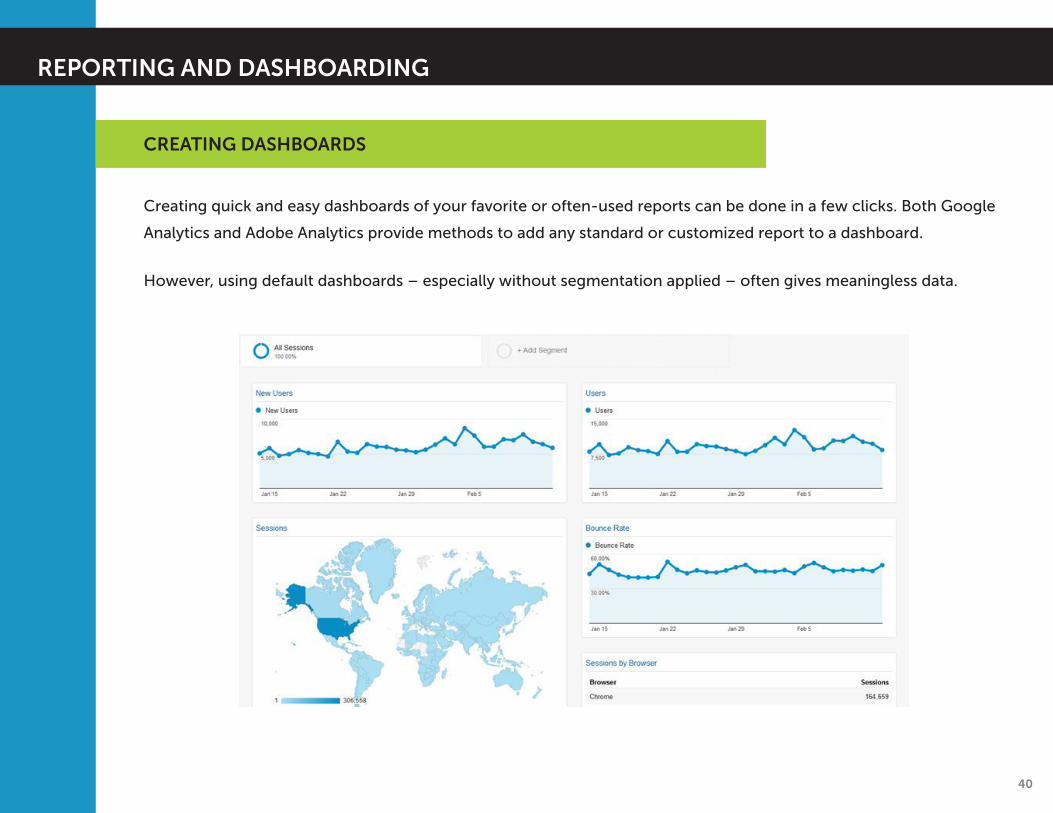
Creating quick and easy dashboards of your favorite or often-used reports can be done in a few clicks. Both Google
Analytics and Adobe Analytics provide methods to add any standard or customized report to a dashboard.
However, using default dashboards – especially without segmentation applied – often gives meaningless data.
CREATING DASHBOARDS
© Conversion Sciences LLC. Used with permission.
41
REPORTING AND DASHBOARDING
Quick “add to dashboard” widgets and dashlets are great for quick overview information. But for actionable
reporting, default dashboards don’t cut it because they can’t show action items.
Proper reports should:
Ÿ Show more than data
Ÿ Show patterns, trends
Ÿ Demonstrate rationale for (or against) idea
Ÿ Show benchmarking data (yours or others)
Ÿ Provide insight
Ÿ Make recommendations for action
CREATING DASHBOARDS
© Conversion Sciences LLC. Used with permission.
42
REPORTING AND DASHBOARDING
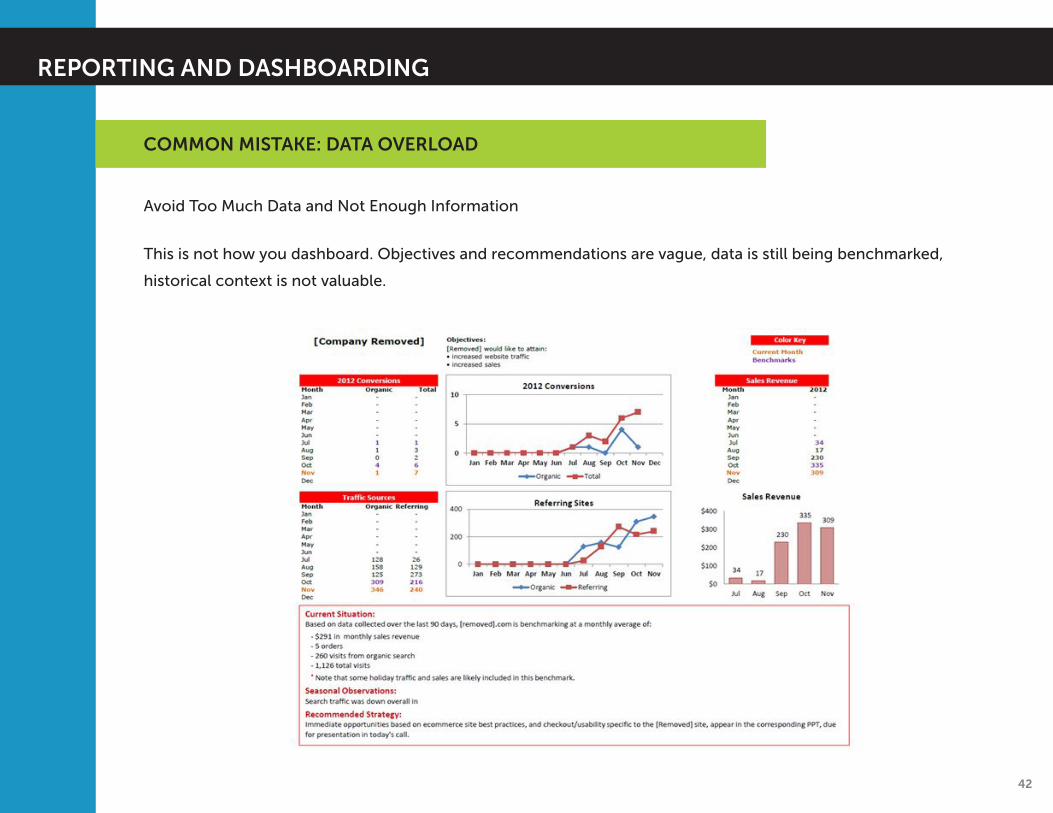
Avoid Too Much Data and Not Enough Information
This is not how you dashboard. Objectives and recommendations are vague, data is still being benchmarked,
historical context is not valuable.
COMMON MISTAKE: DATA OVERLOAD
© Conversion Sciences LLC. Used with permission.
43
REPORTING AND DASHBOARDING
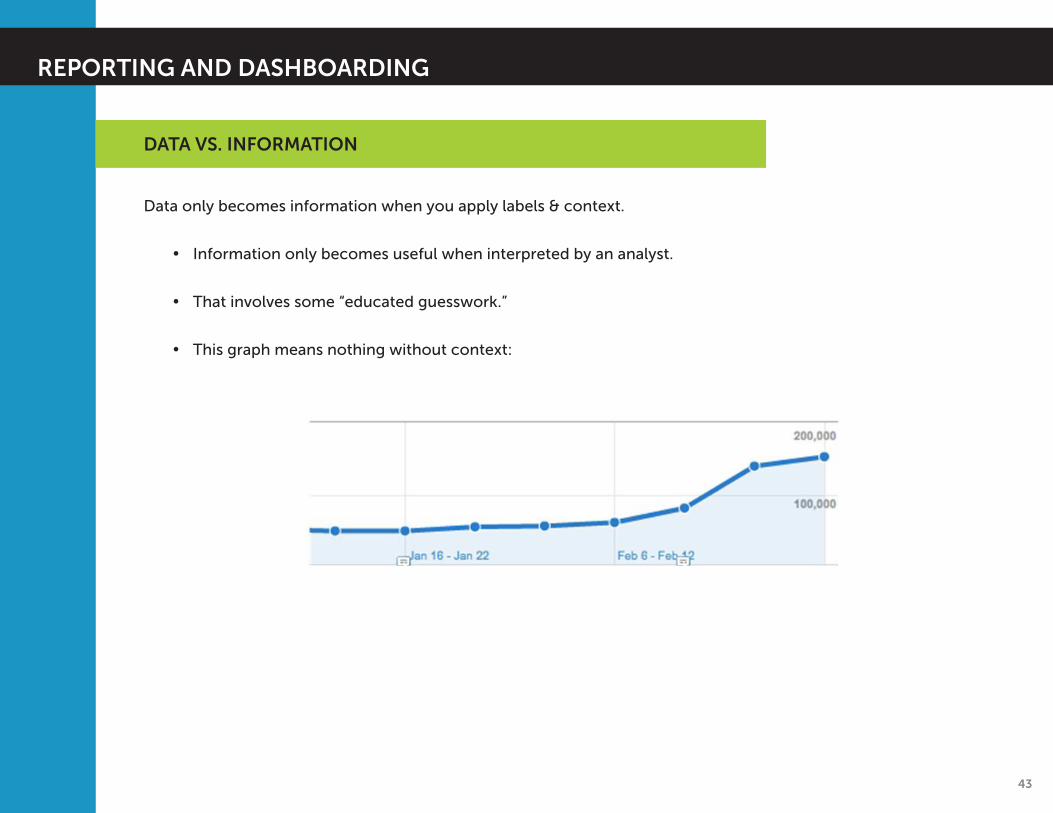
Data only becomes information when you apply labels & context.
Ÿ Information only becomes useful when interpreted by an analyst.
Ÿ That involves some “educated guesswork.”
Ÿ This graph means nothing without context:
DATA VS. INFORMATION
© Conversion Sciences LLC. Used with permission.
44
REPORTING AND DASHBOARDING
Reports should provide context and Action.
Ÿ Focus on the right number of KPIs and detail for your audience
Ÿ Different audiences might require different reporting
Ÿ Always state your objective
Ÿ Always add insights and pertinent trends / historical data
Ÿ Always recommend action
Ÿ Visualization is always key
ACTIONABLE REPORTING
© Conversion Sciences LLC. Used with permission.
45
REPORTING AND DASHBOARDING
Ÿ Who are the stakeholders for whom you generate reports?
____________________________________________________________________________________
____________________________________________________________________________________
Ÿ What KPIs should you report – based on which objectives?
____________________________________________________________________________________
____________________________________________________________________________________
Ÿ What context and historical trends should include?
____________________________________________________________________________________
____________________________________________________________________________________
Ÿ What would be suggested actions from underperforming KPIs? …overperforming KPIs?
____________________________________________________________________________________
____________________________________________________________________________________
EXERCISE
© Conversion Sciences LLC. Used with permission.
46
ABOUT THOM CRAVER
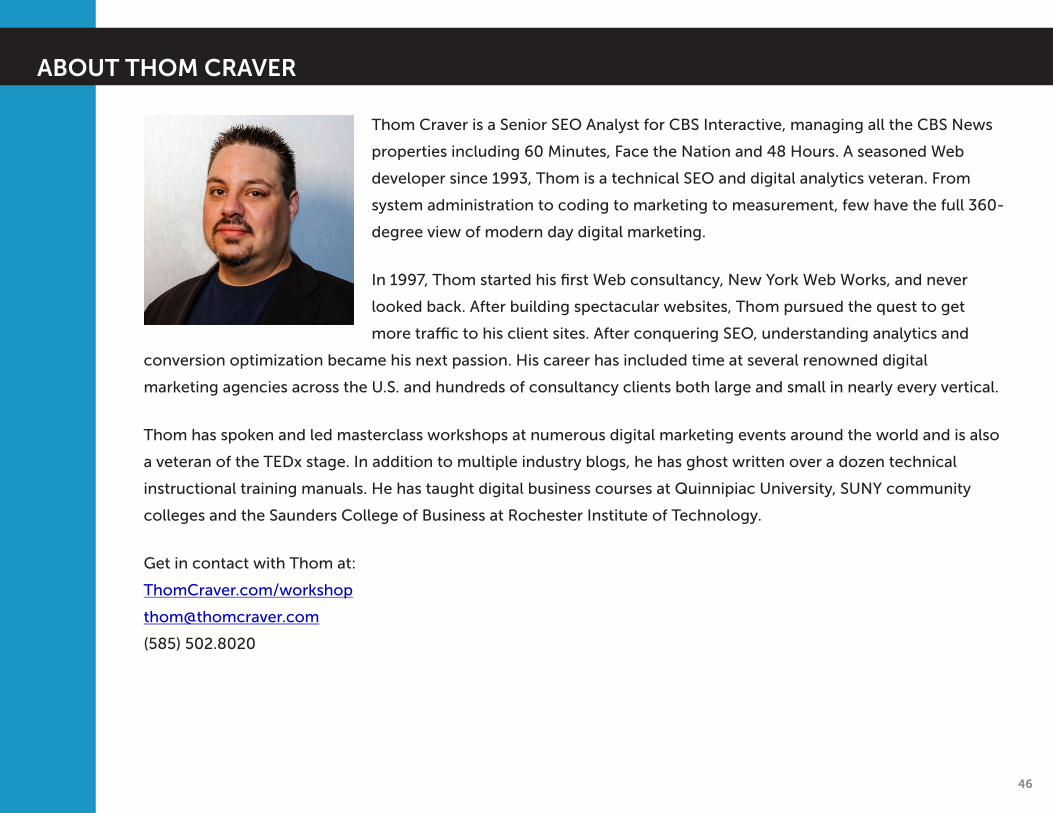
Thom Craver is a Senior SEO Analyst for CBS Interactive, managing all the CBS News
properties including 60 Minutes, Face the Nation and 48 Hours. A seasoned Web
developer since 1993, Thom is a technical SEO and digital analytics veteran. From
system administration to coding to marketing to measurement, few have the full 360-
degree view of modern day digital marketing.
In 1997, Thom started his first Web consultancy, New York Web Works, and never
looked back. After building spectacular websites, Thom pursued the quest to get
more traffic to his client sites. After conquering SEO, understanding analytics and
conversion optimization became his next passion. His career has included time at several renowned digital
marketing agencies across the U.S. and hundreds of consultancy clients both large and small in nearly every vertical.
Thom has spoken and led masterclass workshops at numerous digital marketing events around the world and is also
a veteran of the TEDx stage. In addition to multiple industry blogs, he has ghost written over a dozen technical
instructional training manuals. He has taught digital business courses at Quinnipiac University, SUNY community
colleges and the Saunders College of Business at Rochester Institute of Technology.
Get in contact with Thom at:
ThomCraver.com/workshop
(585) 502.8020
© Conversion Sciences LLC. Used with permission.