Embed Size (px)
Citation preview
ACTIVE FLOW CONTROL IN AN ADVANCED SERPENTINE JET
ENGINE INLET DUCT
A Thesis
by
AARON MICHAEL KIRK
Submitted to the Office of Graduate Studies of Texas A&M University
in partial fulfillment of the requirements for the degree of
MASTER OF SCIENCE
December 2006
Major Subject: Aerospace Engineering
ACTIVE FLOW CONTROL IN AN ADVANCED SERPENTINE JET
ENGINE INLET DUCT
A Thesis
by
AARON MICHAEL KIRK
Submitted to the Office of Graduate Studies of Texas A&M University
in partial fulfillment of the requirements for the degree of
MASTER OF SCIENCE
Approved by: Chair of Committee, Othon K. Rediniotis Committee Members, Rodney D.W. Bowersox Luis San Andres Head of Department, Helen L. Reed
December 2006
Major Subject: Aerospace Engineering

iii
ABSTRACT
Active Flow Control in an Advanced Serpentine Jet Engine
Inlet Duct. (December 2006)
Aaron Michael Kirk, B.S., Texas A&M University
Chair of Advisory Committee: Dr. Othon K. Rediniotis
An experimental investigation was performed to understand the development and
suppression of the secondary flow structures within a compact, serpentine jet engine
inlet duct. By employing a variety of flow diagnostic techniques, the formation of a pair
of counter-rotating vortices was revealed. A modular fluidic actuator system that would
apply several different methods of flow control was then designed and manufactured to
improve duct performance. At the two bends of the inlet, conformal flow control
devices were installed to deliver varying degrees of boundary layer suction, suction and
steady fluid injection, and suction and oscillatory injection. Testing showed that suction
alone could delay flow separation and improve the pressure recovery of the duct by as
much as 70%. However, this technique was not able to rid the duct completely of the
nonuniformities that exist at the engine face plane. Suction with steady blowing,
however, increased pressure recovery by 37% and reduced distortion by 41% at the
engine face. Suction with pulsed injection had the least degree of success in suppressing
the secondary flow structures, with improvements in pressure recovery of only 16.5%
and a detrimental impact on distortion. The potential for gains in the aerodynamic
efficiency of serpentine inlets by active flow control was demonstrated in this study.

iv
DEDICATION
I dedicate this thesis to my wife, Alison, and my parents, Gary and Sharon Kirk.
Their constant love and support over the years has allowed me to reach this level in my
career.

v
ACKNOWLEDGMENTS
I would like to thank Dr. Othon Rediniotis for allowing me to contribute to this
project and for his continual guidance in my education and research. I also thank my
committee members, Dr. Rodney Bowersox and Dr. Luis San Andres, for their support
and advice.
I extend thanks to my fellow graduate students involved in this project, Nathan
Tichenor and Abhinav Kumar. Their assistance in nearly every phase of this research
endeavor has contributed to its success. Additionally, I would like to thank Dr. Lance
Traub, whose expert knowledge and advice on experimental aerodynamics has been
invaluable.
I thank the technical staff of the Texas A&M University Aerospace Engineering
Department, Josh Wiemar and Rick Allen, for their help in the fabrication of the many
complex parts that this project required.
Finally, I would like to thank Dr. Rhett Jeffries from the Air Force Office of
Scientific Research for the generous grant that allowed this research to be possible.

vi
TABLE OF CONTENTS
Page ABSTRACT ..................................................................................................................... iii DEDICATION ..................................................................................................................iv ACKNOWLEDGMENTS..................................................................................................v TABLE OF CONTENTS ..................................................................................................vi LIST OF FIGURES..........................................................................................................vii LIST OF TABLES ............................................................................................................ix INTRODUCTION..............................................................................................................1
General ...........................................................................................................................1 Previous Work................................................................................................................3
EXPERIMENTAL SETUP AND PROCEDURES .........................................................11
Compact, Serpentine Jet Engine Inlet Duct .................................................................11 Wind Tunnel Facilities .................................................................................................16 Data Acquisition...........................................................................................................17 Fluidic Actuator............................................................................................................27
RESULTS AND DISCUSSION ......................................................................................38
Bench Top Fluidic Actuator Performance ...................................................................38 Baseline Duct Model ....................................................................................................43 Flow Control – Suction ................................................................................................50 Flow Control – Suction and Steady Blowing...............................................................54 Flow Control – Suction and Pulsed Blowing ...............................................................59
CONCLUSIONS AND RECOMMENDATIONS...........................................................64
Conclusions ..................................................................................................................64 Recommendations ........................................................................................................66
REFERENCES.................................................................................................................67 VITA ................................................................................................................................70

vii
LIST OF FIGURES
Page Figure 1: Secondary Flow Development at the Bends of a Serpentine Duct .....................4 Figure 2: Illustration of the Vortex Production by Straight and Angled Slots...................9 Figure 3: Geometry of the Compact, Serpentine Inlet Model Used in this Study ...........12 Figure 4: Baseline Duct Model ........................................................................................13 Figure 5: Molds Employed to Create Fiberglass Reproductions of the Inlet Duct ..........14 Figure 6: A Set of Fiberglass Duct Sections for the Integration of Flow Control ...........15 Figure 7: Experimental Setup for Duct Testing ...............................................................17 Figure 8: ESP Pressure Scanner for the Rapid Acquisition of Multiple Pressures ..........18 Figure 9: 32-Port Probe Rake for Engine Face Pressure Surveys....................................21 Figure 10: Data Points Conforming to the ARP1420 Guidlines......................................23 Figure 11: Seven-Hole Probe Mounted in the Sting ........................................................24 Figure 12: Probe Data Acquisition Grid ..........................................................................25 Figure 13: Schematic of the Fluidic Actuators.................................................................30 Figure 14: Centrifugal Fan and Fan Housing...................................................................31 Figure 15: First and Second Bend Suction Plenum Chambers and Fan Compartments ..31 Figure 16: Slotted Shaft Valves Linked with Universal Joints .......................................32 Figure 17: Slotted Shaft Valve Installed in a Blowing Plenum Chamber........................33 Figure 18: Assembled First and Second Bend Blowing Plenum Components ................34 Figure 19: Entire First Bend Flow Control Actuators......................................................34 Figure 20: Electric Motors Used to Drive the Fans (Left) and Slotted Shaft Valves (Right) .............................................................................................................36

viii
Page Figure 21: Schematic of the Control and Acquisition Setup............................................37 Figure 22: Steady Blowing Jet Velocity Calibration .......................................................39 Figure 23: Unsteady Fluidic Actuator Performance ........................................................41 Figure 24: FFT of the Jet Velocity at a Fan Speed of 15,000 RPM and a Pulsing Frequency of 100 Hz ......................................................................................41 Figure 25: Average Jet Velocity of the Oscillating Actuator at Various Fan Speeds ......42 Figure 26: Pressure Contours within the Duct Resulting from CFD Analysis ................44 Figure 27: CFD Streamline Trace ....................................................................................45 Figure 28: First Bend Surface Flow Visualization...........................................................47 Figure 29: Second Bend Surface Flow Visualization ......................................................47 Figure 30: Wall Static Pressure Distribution of the Baseline Duct Model ......................48 Figure 31: Engine Face Total Pressure Loss Coefficient Contour Plot with Velocity Vectors ............................................................................................................49 Figure 32: Comparison of Baseline and Suction Flow Control Wall Static Pressures ....52 Figure 33: Pressure Loss Coefficient Contour Plots Comparing Various Amounts of Suction Flow Control (Right Half) to the No Control Case (Left Half) .........53 Figure 34: Pressure Loss Coefficient Contour Plots Comparing Various Amounts of Steady Injection (Right Half) to the No Control Case (Left Half)..................56 Figure 35: A Plot of the Duct Performance Parameters for Different Methods and Levels of Control.............................................................................................57 Figure 36: CPloss and Velocity Vectors of the Duct with No Control (Left Half) and with Steady Suction and Injection (Right Half) ..............................................59 Figure 37: FFT of the Pressure at the Engine Face Plane .................................................61 Figure 38: Pressure Loss Coefficient Plots Comparing Various Frequencies of Pulsed Injection (Right Half) to the No Control Case (Left Half) ..................63

ix
LIST OF TABLES
Page Table 1: Average Coefficient of Pressure Loss and Distortion Descriptor Values Obtained with Suction Flow Control ..................................................................53 Table 2: Effects of Steady Blowing Flow Control on the Duct Performance Descriptors ..........................................................................................................55

1
INTRODUCTION General
Current trends in the advancement of U.S. military air superiority require aircraft
that emit low radar and infrared signatures. With regards to propulsion, this need for
stealth capabilities has led to the development of serpentine inlet ducts. These S-shaped
ducts do not provide a direct line of sight to the compressor blades, thus hiding the
engine from incoming radar waves. Also, serpentine inlets allow for buried engines,
which can help shield the infrared signature of high-temperature exhaust gases.
In addition to the benefits of low observability provided by serpentine ducts,
these jet engine inlets also allow for reductions in vehicle size due to their axially
compact geometries. This advantage is particularly important in unmanned aerial
vehicles (UAV’s). A scaling analysis performed by engineers at Lockheed Martin
showed that reducing duct length by one duct diameter can decrease the empty weight of
UAV’s by 15%1. In typical aircraft, the cockpit and associated life support and pilot
interface systems make up a significant portion of the fuselage, thus reducing the
importance of the jet engine inlet length in the overall design of the vehicle. However,
for unmanned aircraft, where these components are not present, the length of the engine
inlet can drive the fuselage size. Therefore, for such airplanes, the utilization of compact
jet engine inlet ducts can lead to smaller aircraft with decreased vehicle and operating
costs.
_____________ This thesis follows the format of the AIAA Journal.

2
Unfortunately, these duct geometries are conducive to the emergence of
significant secondary flow structures, leading to large amounts of pressure loss and flow
distortion. Poor pressure recovery results in reduced overall engine performance and
decreased fuel efficiency, while distortion at the engine face plane causes instabilities in
the compressor dynamics that lower engine surge and stall limits1,2,3. Additionally, the
circumferential distortion pattern acts as an unsteady forcing function, inducing blade
vibration that can result in structural fatigue and failure3. This shortcoming occurs when
the rotor blades pass through regions of reduced axial velocity (i.e., where the total
pressure is low). In these areas, since the flow velocity component due to rotation
becomes greater with respect to the axial component, the blade incidence angle is
increased. Much like the stalling of an airfoil at high angles of attack, the flow over the
blade separates at these large incidence angles. This action changes the loading on the
blade and creates flow instabilities that convect through the later compressor stages.
This thesis presents a study performed to gain an understanding of the
development and control of secondary flows that hinder the performance of compact,
serpentine jet engine inlet ducts. Using a variety of methods, such as a survey of
previous literature on the subject, computational fluid dynamics (CFD) analysis, flow
visualization tests, and pressure probe and wall static tap experiments at various
locations, the development and evolution of the secondary flow structures were
observed. With this information, flow control devices were designed and constructed to
control and suppress secondary flows and eliminate the associated pressure loss and flow
nonuniformities that are detrimental to engine performance. The results of this effort

3
will be presented using a variety of industry standard performance descriptors that allow
quantification of the gains achieved by flow control.
Previous Work
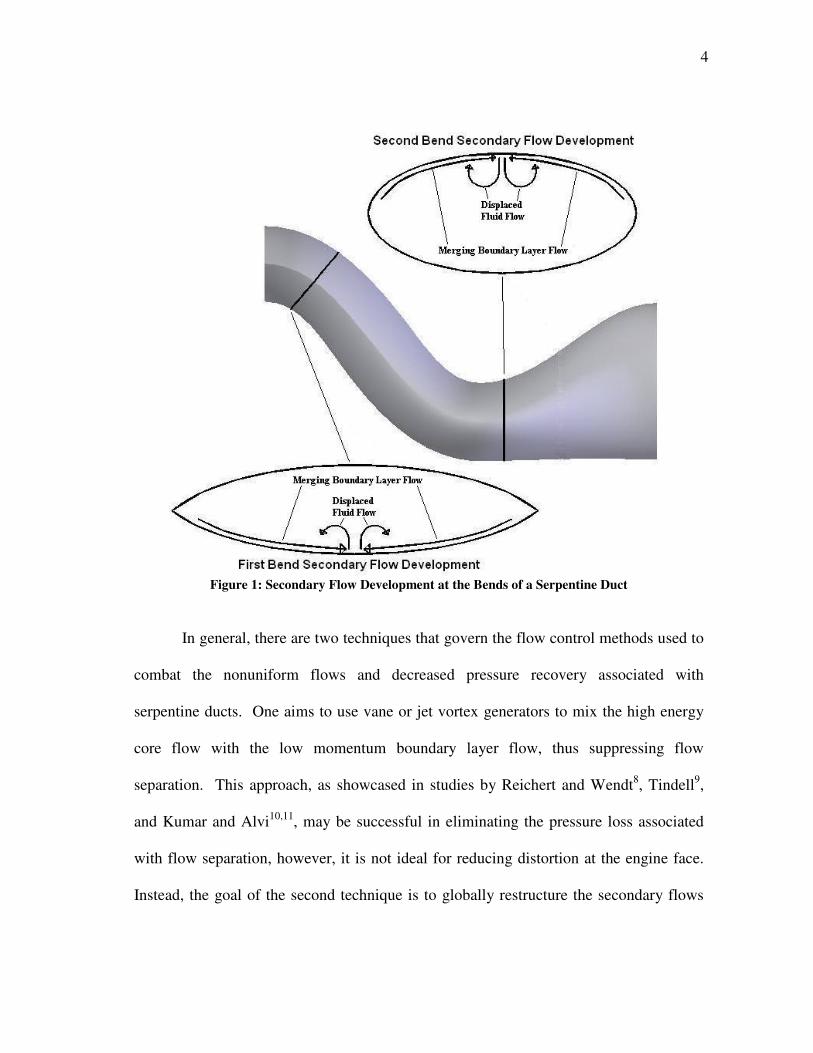
Many investigations have explained the development of the secondary flow in
serpentine ducts, which is characterized by a pair of large, counter-rotating vortices4,5,6.
When negotiating a bend, a centrifugal force is generated on the core flow, causing it to
accelerate. This action, in conjunction with flow separation towards the inner region of
the bend, produces a pressure differential, by which the pressure at the inside of the bend
is lower than that at the outside of the bend. The consequence of this cross-stream
pressure inconsistency is migration of the boundary layer flow towards the center of the
duct, where the merging flow is pushed away from the wall and back towards the outside
of the bend. From this motion, the lift-off of two counter-rotating vortices is produced.
An illustration of this process is shown in Figure 1. To supplement this description,
another study added that the low momentum fluid that converges at the duct centerline
thickens the local boundary layer7. Therefore, its ability to endure adverse pressure
gradients is reduced and flow separation is further encouraged. In the Results and
Discussion section of this thesis, photographs and plots provide a visual and quantitative
view of the above discussion regarding secondary flow development.
4
Figure 1: Secondary Flow Development at the Bends of a Serpentine Duct
In general, there are two techniques that govern the flow control methods used to
combat the nonuniform flows and decreased pressure recovery associated with
serpentine ducts. One aims to use vane or jet vortex generators to mix the high energy
core flow with the low momentum boundary layer flow, thus suppressing flow
separation. This approach, as showcased in studies by Reichert and Wendt8, Tindell9,
and Kumar and Alvi10,11, may be successful in eliminating the pressure loss associated
with flow separation, however, it is not ideal for reducing distortion at the engine face.
Instead, the goal of the second technique is to globally restructure the secondary flows

5
by using vortex generators to counter the merging boundary layer fluid and spread it
evenly around the duct periphery1,2,5. This method increases pressure recovery and
lessens the nonuniformities in the flow. The research presented in this thesis will
concentrate on the latter approach.
To date, many related studies have been performed on the topic of flow control in
diffusing S-ducts. The majority of the past research has utilized passive flow control
methods, such as vortex generators. Passive control devices are a popular choice for
many researchers because they are simple, inexpensive, achieve reasonable results, and
do not require the introduction of energy. Studies by Reichart and Wendt5,8 explored the
use of traditional vane vortex generators on a moderately curved duct with a diffusing,
circular cross-section. The researchers investigated the effects of vane height, spacing,
and axial location, and showed improvements in pressure recovery and distortion
reduction in almost all cases. However, this duct, the M2129, had a far simpler flowpath
than the one to be discussed in this thesis. In another set of experiments, Anabtawi et
al.2,4 showed that vane-type vortex generators were also successful in mitigating the
pressure loss and nonuniformity in a boundary layer ingesting duct. Again, this inlet,
which was designed for a blended-wing-body transport jet, had a much less aggressive
geometry than that employed for this thesis.
Vortex generation via aerodynamic vanes in simple serpentine ducts has even
transitioned to numerical research. Anderson and Gibb developed a mathematical model
of the vortices shed from vanes and used CFD to explore several vane configurations at

6
different flight conditions in the M2129 duct12. They later compared their numerical
results to experimental data and concluded that good agreement was achieved13.
Although it has been proven reliable in the aforementioned studies, passive
control by vortex generating vanes is not ideal because it can only be optimized to a
certain flow condition, usually cruise. During other phases of flight, such as landing or
takeoff where airspeeds are lower, or during maneuvers in which nonuniform flow can
enter the duct, vortex generators may not be effective. An additional shortcoming of
vane-type vortex generators is the risk of foreign object damage they pose14. Not only
could external objects damage the vanes and render them aerodynamically useless or
even detrimental, but the vanes themselves could become the foreign object if they were
to break and be ingested by the engine. Also, vane vortex generators are not ideal
because they have parasitic drag10, which contributes to pressure loss, particularly at off-
design conditions.
To avoid the problems associated with passive flow control devices, some studies
have explored the use of active control technologies. Active flow control requires
energy to be added to the system, which can increase complexity and cost. However, the
advantage of having the ability to modify flow control parameters to yield desirable
effects at all flight conditions without concern for foreign object damage or parasite drag
outweighs this downside. An active flow control method investigated in many studies is
steady blowing microjets. Kumar and Alvi10,11 showed that supersonic jets of 400 �m
diameter were successful in preventing flow separation. They explored the effects of
different amounts of momentum injection, microjet array locations, and microjet angles
7
on flow separation. However, the geometry used in that study was a simple, two-
dimensional ramp with gentle curvature called a Stratford ramp. During a research
project at Virginia Polytechnic Institute and State University, separate tests were
performed using suction, blowing, and suction and blowing together on a diffusing, S-
duct with a rectangular cross-section15. Here, a zero net mass flux actuator was
simulated and proved successful in enhancing the performance of the duct. As in the
above study, though, the test article was not representative of a modern serpentine inlet.
Additionally, only one type of orifice arrangement and control mass flow was
investigated.
In these microjet studies, the focus of the flow control was to prevent separation.
Therefore, based on the results obtained, it is difficult to determine whether microjets
would have any significant authority in restructuring the secondary flows in a serpentine
inlet. However, in the investigation performed by Hamstra et al.1, countering the
secondary flow structures was the primary motivation behind the use of microjets to
improve pressure recovery and distortion in a highly serpentine and compact duct. Here,
the researchers used the concept of vorticity signature in designing their vortex
generating jets. Vorticity signature is a principle that states that the strength,
distribution, and secondary flowfield interaction of the vortices generated by flow
control devices are the primary means by which secondary flow control is achieved.
This study was performed at realistic flight conditions and utilized a realistic flowpath,
but never fully succeeded in preventing the large, counter-rotating vortices from
developing. Additionally, only steady blowing jets were used. No investigation was

8
launched to determine the effect of pulsed blowing on the separation and secondary flow
development.
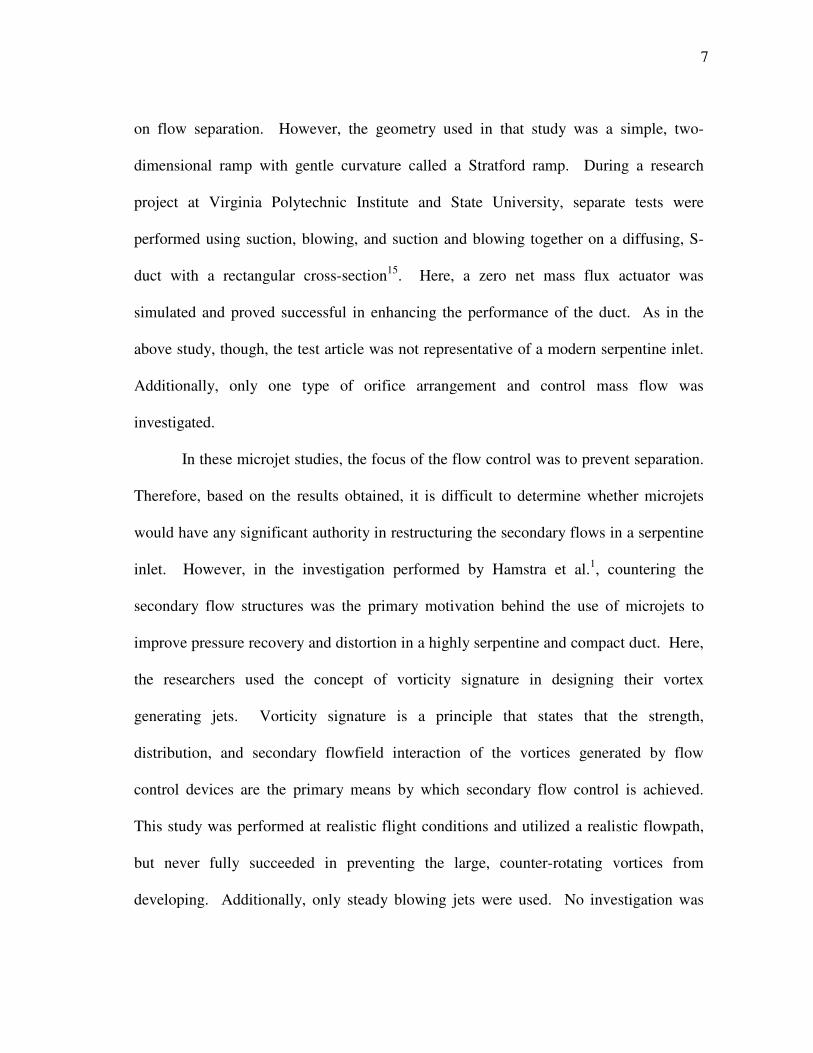
In all of the microjet research discussed above, the jets were formed through tiny
holes only. No effort was made into exploring other orifice geometries or
configurations, such as slots angled laterally to the freestream. This fact could explain
the ineffectiveness of such microjets in restructuring the secondary flow. Figure 2
illustrates the dynamics of the flow when a perpendicular jet interacts with the duct core
flow. A pair of streamwise, counter-rotating vortices develops directly above the jet that
enhances mixing of the high-energy freestream flow and the low-energy boundary layer
fluid. This mixing delays or prevents flow separation, but the counter-rotating vortices
are usually equal in strength. Therefore, no net vorticity is created that could redirect the
merging near-wall flow. This is not the case with traditional vane-type vortex
generators, which only create a single vortex.
Thus, to achieve the objective of reducing pressure loss and flow distortion, it
may be necessary to orient the jet slots in such a way as to create a single vortex.
Bridges and Smith showed that a lone vortex could be achieved by orienting the jet slot
at an angle to the streamwise direction16. In this situation, the jet fluid emerges from the
slot perpendicular to the freestream in similar fashion to the jet described previously.
However, since the broad side of the jet is exposed to the oncoming core flow, the
upstream side vortex formation is impeded while the downstream side vortex is
exacerbated. As the orientation angle of the slot is increased, so too is this effect. Also,
the penetration depth of the jet into the freestream flow decreases with larger slot angles.
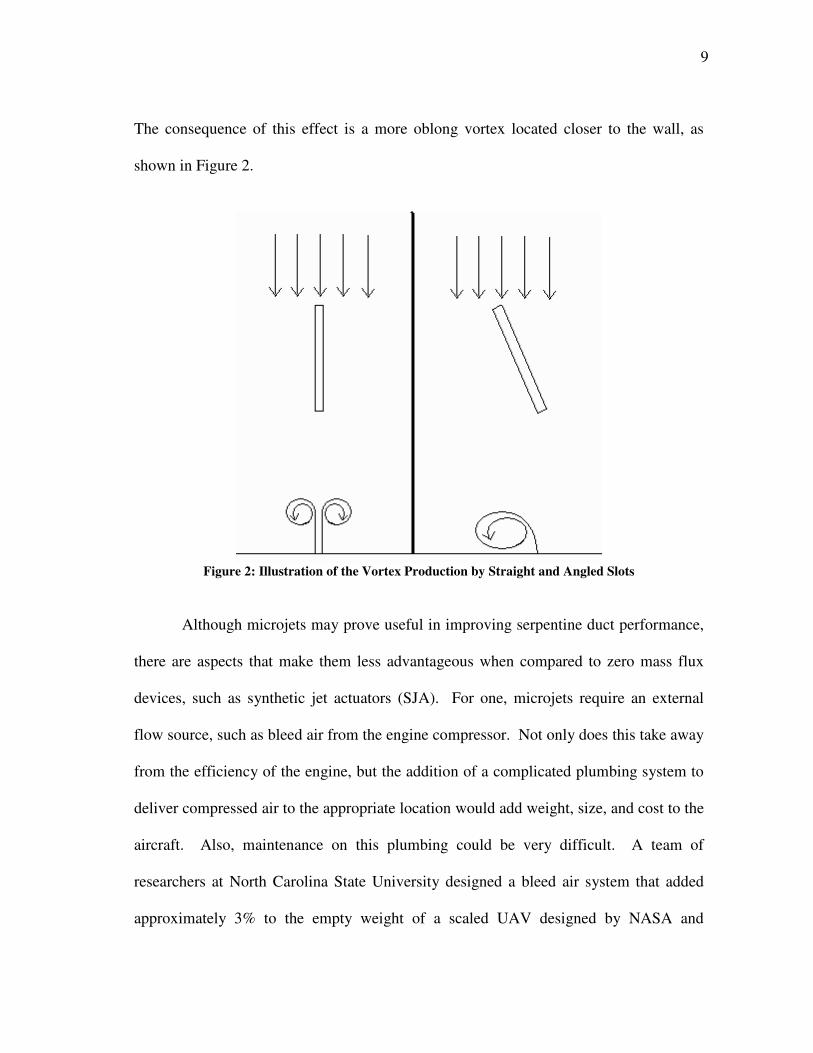
9
The consequence of this effect is a more oblong vortex located closer to the wall, as
shown in Figure 2.
Figure 2: Illustration of the Vortex Production by Straight and Angled Slots
Although microjets may prove useful in improving serpentine duct performance,
there are aspects that make them less advantageous when compared to zero mass flux
devices, such as synthetic jet actuators (SJA). For one, microjets require an external
flow source, such as bleed air from the engine compressor. Not only does this take away
from the efficiency of the engine, but the addition of a complicated plumbing system to
deliver compressed air to the appropriate location would add weight, size, and cost to the
aircraft. Also, maintenance on this plumbing could be very difficult. A team of
researchers at North Carolina State University designed a bleed air system that added
approximately 3% to the empty weight of a scaled UAV designed by NASA and

10
Lockheed Martin17. To cool the bleed air for injection into the inlet duct, the piping had
to be coiled and placed in the fuel tank, which would contribute greatly to maintenance
complexity.
Synthetic jet actuators have the potential to reduce pressure loss and flow
distortion in S-shaped inlet ducts without the negative aspects of the flow control
technologies described above. These systems are usually compact and require little, if
any, communication or connection to remote hardware18. Much of the research has
applied SJA’s to the suppression of separation and improvement of stall characteristics
for airfoils and bluff bodies, as described in publications by Gilarranz and Rediniotis18,
Gilarranz et al.19, Seifert and Pack20, and Glezer21. In these studies, actuators with
spanwise slots utilizing tangential blowing with respect to the wing surface were able to
prevent separation over the upper surface for very large angles of attack, thus improving
the stall threshold of the airfoils. Amitay et al.22 shifted this thinking to internal flows,
using an SJA array to delay separation in a rectangular, diffusing duct. This study was
successful in achieving its goal, but had no correlation to secondary flow suppression in
highly three-dimensional inlets.
11
EXPERIMENTAL SETUP AND PROCEDURES In this section, the experimental equipment utilized for this research endeavor
will be described. The features of a serpentine jet engine inlet will be discussed,
followed by an explanation of the methods used to obtain and manufacture the duct.
Also, the wind tunnel test facilities will be presented with a look at the data acquisition
hardware and software. Lastly, a new flow control actuator, designed specifically for
this project, will be characterized.
Compact, Serpentine Jet Engine Inlet Duct
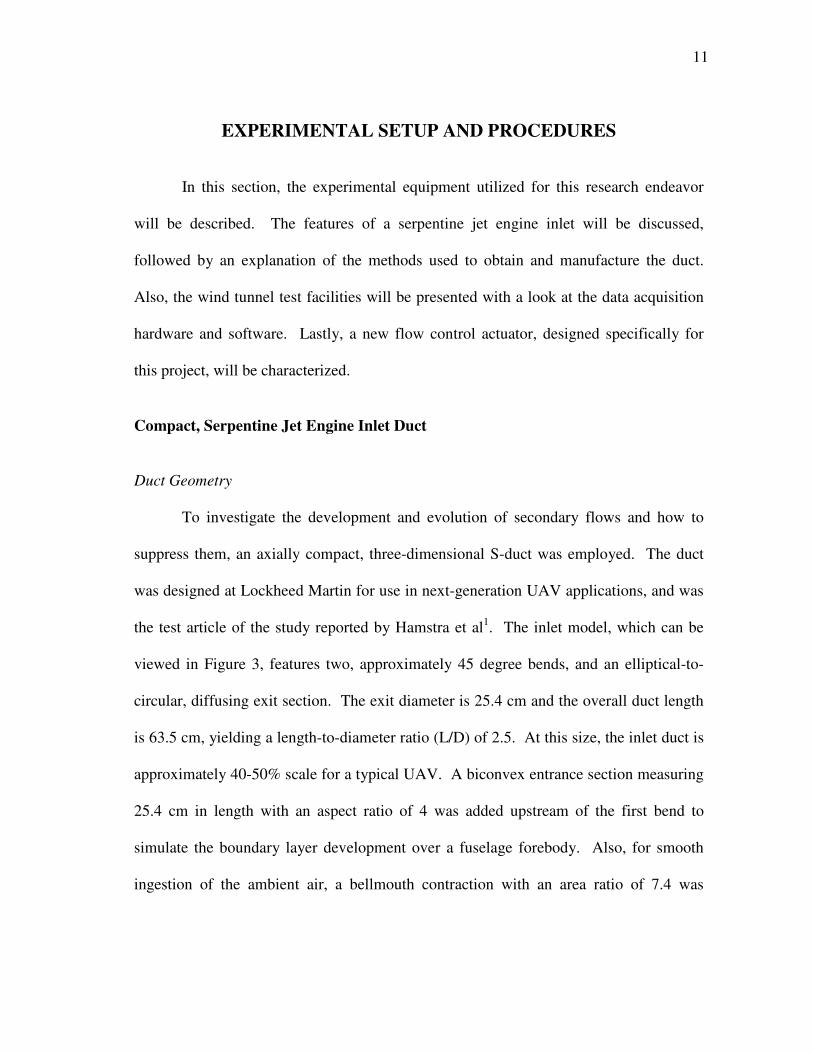
Duct Geometry To investigate the development and evolution of secondary flows and how to
suppress them, an axially compact, three-dimensional S-duct was employed. The duct
was designed at Lockheed Martin for use in next-generation UAV applications, and was
the test article of the study reported by Hamstra et al1. The inlet model, which can be
viewed in Figure 3, features two, approximately 45 degree bends, and an elliptical-to-
circular, diffusing exit section. The exit diameter is 25.4 cm and the overall duct length
is 63.5 cm, yielding a length-to-diameter ratio (L/D) of 2.5. At this size, the inlet duct is
approximately 40-50% scale for a typical UAV. A biconvex entrance section measuring
25.4 cm in length with an aspect ratio of 4 was added upstream of the first bend to
simulate the boundary layer development over a fuselage forebody. Also, for smooth
ingestion of the ambient air, a bellmouth contraction with an area ratio of 7.4 was

12
utilized. This addition prevents the flow from separating over the inlet lip as it enters the
duct and helps produce a uniform flowfield.
Figure 3: Geometry of the Compact, Serpentine Inlet Model Used in this Study
Baseline Duct Model Initial testing was performed on a baseline duct model donated to the Texas
A&M University Aerospace Engineering Department by Lockheed Martin Aeronautics
Company in Ft. Worth, Texas. The duct was fabricated through a laser stereo-
lithography (SLA) process and consists completely of hardened resin1. The model is
split into seven modules to accommodate interchangeable flow control blocks. Flanges
Biconvex Entrance Length = 25.4 cm Aspect Ratio = 4
Bellmouth Contraction Area Ratio = 7.4
Exit Section Diameter = 25.4 cm
Dual-bend Offset L/D = 2.5

13
house grooves for o-ring placement and allow the modules to be bolted together to
quickly assemble and disassemble the duct. Pressure taps incorporated along the
centerline of both the top and bottom walls allow surface static pressures to be obtained.
A photograph of this SLA constructed, resin inlet model is presented in Figure 4.
Figure 4: Baseline Duct Model
Flow Control Duct Model After the locations of flow separation and vortex lift-off were determined, several
of the duct modules were reconstructed to allow the integration of newly designed
fluidic actuators for flow control. Rebuilding the inlet was chosen over modifying the
existing sections due to the difficulty of machining the brittle resin. Several
technologies were considered for the fabrication of the replica, including rapid
prototyping by stereo-lithography or fused deposition modeling, computer numerical
control (CNC) machining, injection molding, and sheet metal forming. However,
Second Bend Module
Exit Module
Offset Module
Bellmouth Module
Entrance Module 1
Entrance Module 2
First Bend Module

14
because of budget concerns, a more economical method involving fiberglass with wood
reinforcement was elected.
This manufacturing technique began with the creation of reusable, fiberglass
molds. The resin duct model from Lockheed Martin was used as a basis for these molds.
Clear packaging tape was applied to the inside surface of each module to create a layer
of separation and prevent the fiberglass epoxy from adhering to the walls. Then, a layer
of woven fiberglass cloth was spread over the taped surface and a two-part epoxy
compound was brushed into the cloth. To ensure that the shape of the cured fiberglass
would hold after being removed from the duct walls, three layers of fiberglass cloth were
used. After hardening, imperfections in the fiberglass pieces were repaired with body
filler and sanded until smooth. As a finishing step in preparing the molds, about three
coats of primer were sprayed on the surfaces. This process was performed separately for
the top and bottom surfaces of each module. Then, the halves of the molds were joined,
and plastic extensions for the fabrication of flanges were added. Figure 5 shows the
completed molds.
Figure 5: Molds Employed to Create Fiberglass Reproductions of the Inlet Duct

15
The next phase in the construction of the duct model with flow control
capabilities started with the application of wax and a polyvinyl alcohol (PVA) release
film. This step was necessary to ensure easy release of parts from the molds.
Approximately four layers of the fiberglass cloth were then applied to the molds,
followed by two layers of unstructured, fiberglass matting. The thin, woven cloth was
much easier to shape than the matting, but was far weaker. Therefore, the combination
of the two fiberglass raw forms provided accurate and smooth, yet stiff replicas of the
duct modules. For further strengthening, wooden ribs were integrated in the layers of
fiberglass matting, as were wooden flanges for connecting adjacent sections. Rubber
gasket material was compressed between the flanges during assembly to prevent
leakage. In similar fashion to the original resin duct from Lockheed Martin, static
pressure taps were added along the centerline of the top and bottom walls. The
completed fiberglass modules can be seen in Figure 6.
Figure 6: A Set of Fiberglass Duct Sections for the Integration of Flow Control

16
Wind Tunnel Facilities
For testing, the inlet models were integrated into an open-circuit, suck-down
wind tunnel with a 0.4572 m x 0.4572 m, square cross-section. To connect the circular
exit of the inlet duct to the square wind tunnel, a fiberglass diffuser was built. Upstream
of the diffuser, a rubber pipe coupler was utilized to isolate the duct from vibrations
produced by the wind tunnel fan. The coupler was clamped to a steel pipe to which the
exit section of the duct was mounted. A slot with a width of 25 cm that spanned half the
circumference was cut from the pipe to allow probe access. The pipe rested upon an
adjustable stand, thus providing vertical support for the downstream portion of the inlet
model. To add a rigid brace to the opposite end of the duct, a steel frame was bolted
between the flanges of the bellmouth and first entrance modules. The frame legs
consisted of square pipe, and were welded to a quarter-inch sheet machined by CNC to
conform to the inner surface of the duct and the hole locations of the flanges. In Figure
7, the serpentine inlet experimental setup is pictured.
17
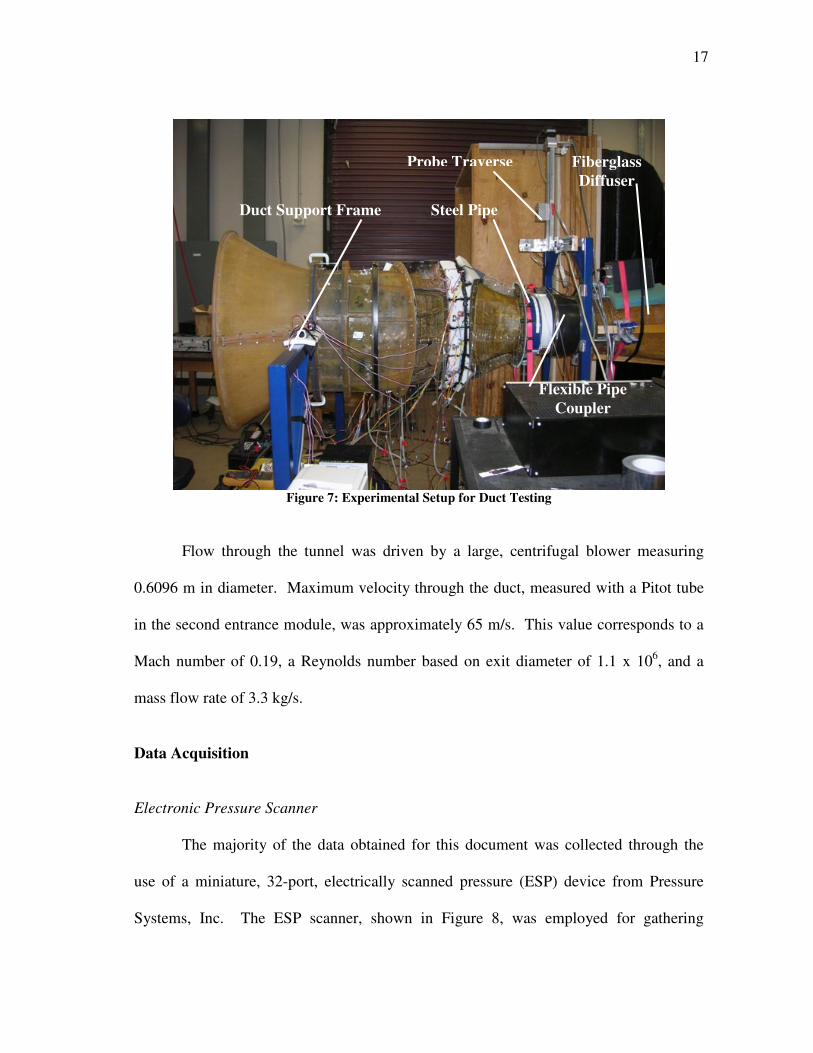
Figure 7: Experimental Setup for Duct Testing
Flow through the tunnel was driven by a large, centrifugal blower measuring
0.6096 m in diameter. Maximum velocity through the duct, measured with a Pitot tube
in the second entrance module, was approximately 65 m/s. This value corresponds to a
Mach number of 0.19, a Reynolds number based on exit diameter of 1.1 x 10⁶, and a
mass flow rate of 3.3 kg/s.
Data Acquisition
Electronic Pressure Scanner The majority of the data obtained for this document was collected through the
use of a miniature, 32-port, electrically scanned pressure (ESP) device from Pressure
Systems, Inc. The ESP scanner, shown in Figure 8, was employed for gathering
Probe Traverse Fiberglass Diffuser
Duct Support Frame
Flexible Pipe Coupler
Steel Pipe

18
pressures from the wall static taps, a seven-hole probe, and a 32-point probe rake. The
advantage of this sensor array is the rapid acquisition of all 32 ports. The sensors of the
pressure scanner are digitally multiplexed at rates up to 20,000 Hz. Therefore, over 600
samples of the entire array can be obtained every second. Additionally, another benefit
is the pneumatically actuated manifold inside the device that connects all 32 sensors to a
single port to allow quick and easy calibration. The accuracy of the sensors in the
pressure scanner is 0.05% of full scale, or 0.019 torr. The measurement uncertainty
using the ESP scanner with the various flow diagnostic devices will be discussed later.
Figure 8: ESP Pressure Scanner for the Rapid Acquisition of Multiple Pressures
To interface with the ESP scanner, special hardware is required to supply power
and perform the digital addressing. For the project presented in this thesis, the hardware
was provided by the Aeroprobe Corporation. Controlled by a PC using special software,
the mechanism provided pressure for pneumatic actuation of the ESP manifold and for
sensor calibration. The device also converted the digital output of the PC to CMOS
logic for port addressing.

19
Acquisition Software
Aeroprobe also supplied software for use with the pressure scanner and
associated hardware. This powerful program, called AeroAcquire, allows the user to
control the acquisition of pressures from the ESP system or from individual sensors. It
also performs automated calibration and, periodically, zero-offset adjustments for the
sensors. Within the program, sampling rate and the number of samples can be adjusted,
as can the number of ports to address. Unless otherwise stated, all pressure data
gathered for this study was done so for 10 seconds at a 256 Hz sampling rate. The
software can accommodate multiple ESP scanners as well as multiple pressure and fast
response probes. Probe calibration files can even be loaded into the program for real-
time data reduction, which involves the calculation of total pressure, static pressure, and
the three velocity components from the individual port pressures. With AeroAcquire,
the user also has the ability to load or generate a data acquisition grid and autonomously
traverse a probe through the grid by utilizing the stepper motor control aspect of the
software. The program can then output files containing time-series and averaged values
of the raw pressures and reduced velocities at each point.
Static Pressure Taps
Surface static pressure can provide a great deal of insight into determining the
regions of separated and attached flow. Therefore, the aforementioned pressure taps
integrated into both duct models were utilized in determining the nature of the near-wall
flow along the center of the duct for controlled and uncontrolled flow. Tygon tubing

20
connected the taps to the ESP pressure scanner, allowing the simultaneous collection of
static pressures from the entire top or bottom surface.
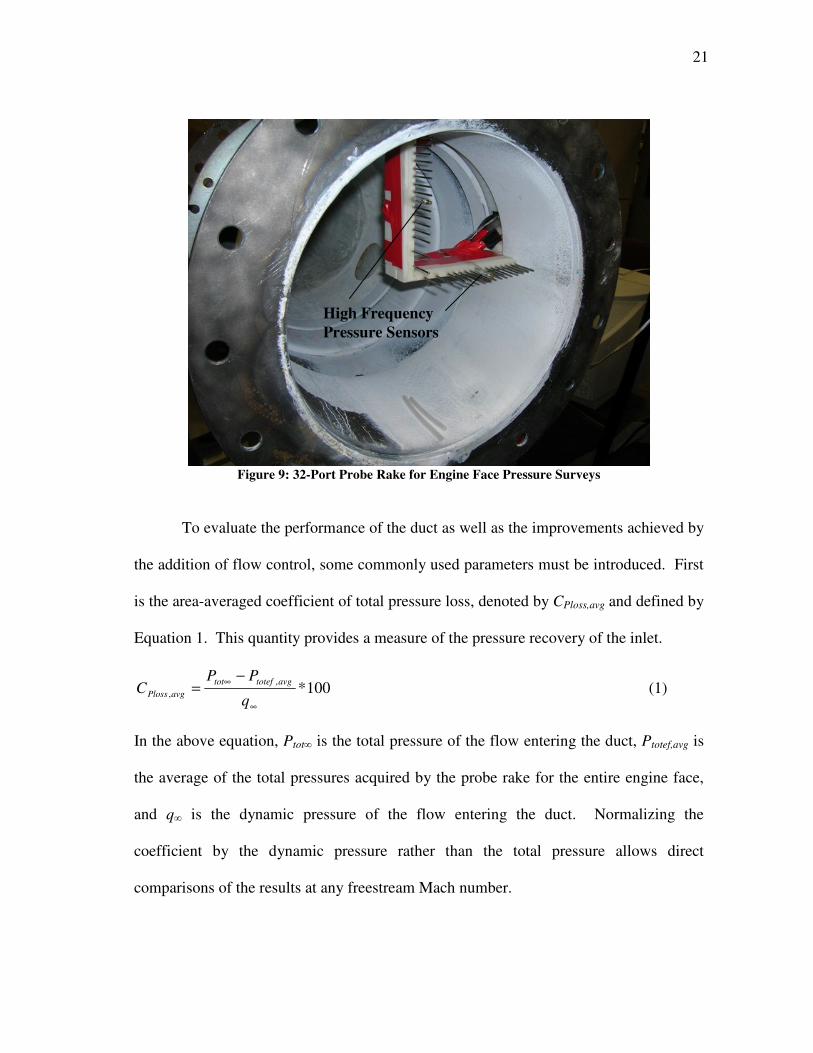
Probe Rake Data collected at the engine face plane is traditionally the primary means of
analyzing the performance of a jet engine inlet. Most importantly, the total pressure
variation at this location determines if the flow structures created within the inlet duct
will have an adverse effect on engine performance. To acquire total pressure values in a
quick and efficient manner, a rake consisting of 32 total pressure probes was designed
and constructed. The apparatus was comprised of two perpendicular arms, each with 15
stainless steel tubes measuring 1.5875 mm in diameter. At a radial location of 69.85
mm, stand-alone pressure sensors with high frequency response capabilities were
installed to obtain frequency content of the flow. The sensors were sampled at 1,024 Hz
for 10 seconds. Their position was chosen from initial experiments, which showed that
the vortex cores were in close proximity. Tygon tubing was attached to the probes and
routed through the outer rim of the rake to the ESP pressure scanner located outside the
tunnel. The rim, which was fit into a groove cut from the steel pipe, acted as a guide for
manual rotation of the rake. A graduated scale was placed around the perimeter of the
steel pipe to measure the angles of the rake arms. The uncertainty in the angular
measurement was 0.5 degrees. The probe rake was only able to survey one half of the
engine face plane. However, due to the symmetrical pattern of the flow, the pressures
obtained were mirrored about the symmetry axis to provide a full set of engine face data.
The probe rake is shown installed in Figure 9.
21
Figure 9: 32-Port Probe Rake for Engine Face Pressure Surveys
To evaluate the performance of the duct as well as the improvements achieved by
the addition of flow control, some commonly used parameters must be introduced. First
is the area-averaged coefficient of total pressure loss, denoted by CPloss,avg and defined by
Equation 1. This quantity provides a measure of the pressure recovery of the inlet.
100*,,
∞
∞ −=
q
PPC avgtoteftot
avgPloss (1)
In the above equation, Ptot� is the total pressure of the flow entering the duct, Ptotef,avg is
the average of the total pressures acquired by the probe rake for the entire engine face,
and q� is the dynamic pressure of the flow entering the duct. Normalizing the
coefficient by the dynamic pressure rather than the total pressure allows direct
comparisons of the results at any freestream Mach number.
High Frequency Pressure Sensors
22
The distortion descriptor, DC60, defined in Equation 2 is another parameter often
used to analyze jet engine duct efficacy. This value quantifies the flow distortion at the
engine face by comparing the minimum averaged total pressure over any 60 degree
wedge, Pmin60,avg, to the averaged total pressure over the entire engine face plane, Ptotef,avg.
For this thesis, the distortion descriptor is normalized by the area-averaged dynamic
pressure at the engine face, qef,avg, and is expressed as a percentage. The report by
Anabtawi et al. states that DC60 should be less than 20% to be considered acceptable4.
100*,
,60min,60
avgef
avgavgtotef
q
PPDC
−= (2)
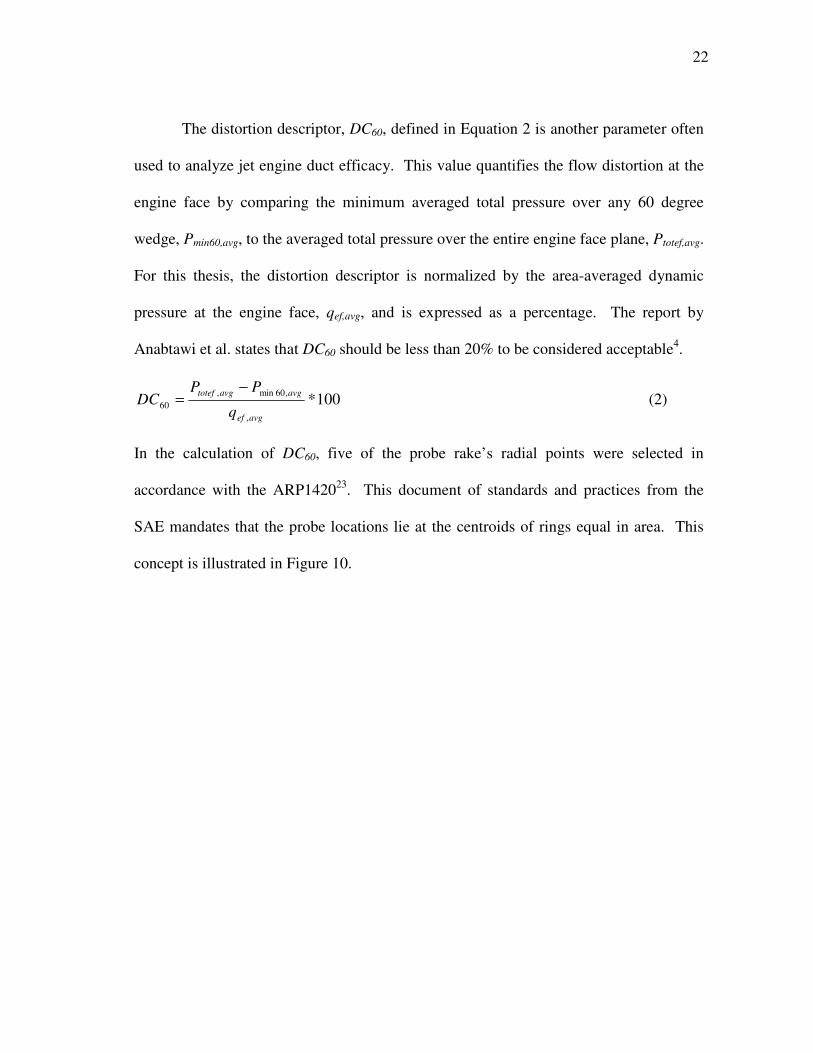
In the calculation of DC60, five of the probe rake’s radial points were selected in
accordance with the ARP142023. This document of standards and practices from the
SAE mandates that the probe locations lie at the centroids of rings equal in area. This
concept is illustrated in Figure 10.

23
Figure 10: Data Points Conforming to the ARP1420 Guidlines
Seven-Hole Probe To gather further information at the engine face, including static pressure and
velocity magnitude and components, a miniature, seven-hole probe was utilized. The
conical-tipped probe was manufactured at Texas A&M University and calibrated by the
Aeroprobe Corporation. With seven pressure ports, the probe has the ability to
accurately measure flow at angles up to 70 degrees. The tip diameter of the probe is a
mere 1.5875 mm. This characteristic makes it ideal for the measurement of internal
flows because flow blockage and disruption are negligible. Figure 11 presents a picture
of the miniature probe.
Ring 4 Ring 5
Ring 1
Ring 2
Ring 3
Rake Arm 1
Rake Arm 2

24
Figure 11: Seven-Hole Probe Mounted in the Sting
As discussed earlier, the AeroAcquire software can reduce the seven port
pressures into static pressure, total pressure, velocity magnitude, and flow direction. The
software utilizes a local least-squares reduction algorithm that compares parameters
calculated from the seven pressures in the unknown flowfield to parameters calculated
from a calibration file24. Given the density of the probe calibration file used for this
project, Aeroprobe estimates that the uncertainty in the velocity magnitude and flow
angles are 1.5% and 0.5 degrees, respectively.
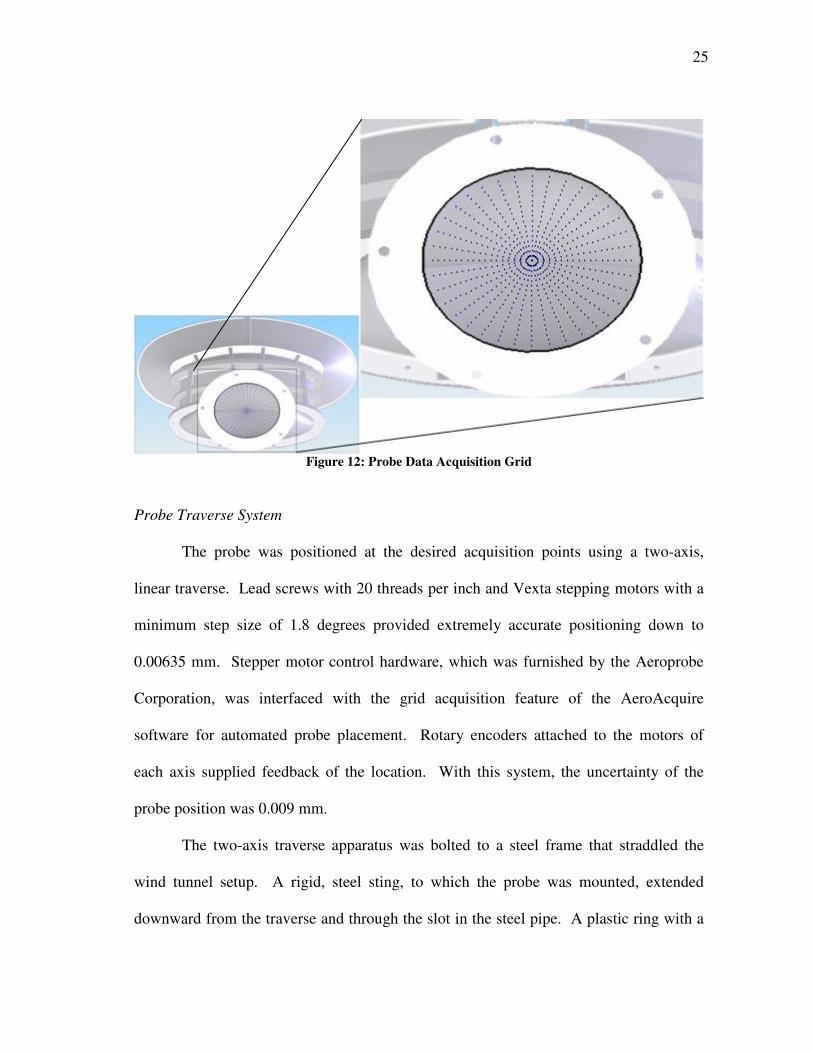
To obtain a sufficiently dense survey of the flowfield at the engine face, the data
acquisition grid illustrated in Figure 12 was employed. This grid puts the probe at 18
radial locations, spaced 6.35 mm apart, and 36 circumferential locations at 10 degree
increments. In all, 648 points composed the data acquisition mesh.
Seven-Hole Probe
Sting
25
Figure 12: Probe Data Acquisition Grid
Probe Traverse System
The probe was positioned at the desired acquisition points using a two-axis,
linear traverse. Lead screws with 20 threads per inch and Vexta stepping motors with a
minimum step size of 1.8 degrees provided extremely accurate positioning down to
0.00635 mm. Stepper motor control hardware, which was furnished by the Aeroprobe
Corporation, was interfaced with the grid acquisition feature of the AeroAcquire
software for automated probe placement. Rotary encoders attached to the motors of
each axis supplied feedback of the location. With this system, the uncertainty of the
probe position was 0.009 mm.
The two-axis traverse apparatus was bolted to a steel frame that straddled the
wind tunnel setup. A rigid, steel sting, to which the probe was mounted, extended
downward from the traverse and through the slot in the steel pipe. A plastic ring with a

26
small hole to accommodate the sting was utilized to seal the large slot. The ring was
guided by the aforementioned groove in the steel pipe and rotated in conjunction with
probe movement to avoid contacting the sting. To view the probe traverse system, refer
to Figure 7.
Uncertainty Analysis Like all scientific measurements, the results in this thesis have some error that
must be quantified to determine the confidence with which the measured values can be
used to describe the true value of a quantity. Estimating this uncertainty is commonly
done by combining the accuracy of the measuring system with the precision of the
measurements. While the accuracy is often stated by the device manufacturer, precision
error is associated with the random fluctuations and repeatability in the measurement
and can be determined using the standard deviation of a set of data samples. Equation 3
shows how the uncertainty is calculated using this method.
2 2i i iu a p= + (3)
In Equation 3, ui is the total uncertainty in the measurement, ai is the accuracy of the
measurement device, and pi is the precision of the measured value.
For this research endeavor, the standard deviation in the pressure measurements
was determined through a repeatability study in which tests using the static pressure taps
and engine face probe rake were repeated 10 times. Then, the precision was calculated
by doubling the standard deviation, thus providing a 95% probability that the
measurement was within the range of precision. Using this method, the average total

27
uncertainty in the static pressure tap measurements was 0.121 torr and the average
uncertainty in the probe rake pressures was 0.161 torr.
When computing a quantity that is based on a measurement, the uncertainty in
the measured value carries through the calculation process. To quantify this
propagation, Kline and McClintock proposed the formulation for constant odds
uncertainty predictions25. The constant odds approach states that if a parameter, R, is a
function of the n number of measured, independent variables that have a Gaussian
distribution, xi, then the uncertainty of R can be calculated using Equation 4.
2
1i
n
R xi i
Ru u
x=
� �∂= � �∂� �� (4)
In the above equation, uR is the uncertainty of the calculated parameter and uxi is the
uncertainty in the measured value of xi. In the Results and Discussion section of this
thesis, the uncertainties calculated using the above techniques will be represented by
error bars in the plots. Also, the errors of several calculated parameters will be displayed
in the data tables.
Fluidic Actuator
Actuator Setup
A novel fluidic actuator system was designed and fabricated to apply flow
control to the compact, serpentine inlet model. The flow control devices were based on
the concept of the synthetic jet actuator in that they are closed systems that do not
require external hardware such as plumbing for compressor bleed air. However, the

28
fluid actuators employed for this research are not true SJA’s because they are modular.
The term SJA refers to a zero net mass flux actuator in which the flow is alternately
ingested and blown through a common orifice. These devices are typically driven by
pistons, rotary engines, or oscillating membranes. Due to the highly complex and three-
dimensional geometry of the inlet duct, the difficulty of integrating such an actuator led
to the design of a more simple, segmented alternative with separate locations of flow
suction and injection.
The design process started with determining the proper placement of the
actuators. Using results from surface pressure tests and flow visualization experiments,
the locations of flow separation and vortex formation were resolved. From this
information, the streamwise positions of the actuator’s suction modules were
strategically established for both bends of the duct. The suction slots were placed just
upstream of the separation lines, where, according to a study by Kerrebrock et al.,
boundary layer removal is most effective in delaying or preventing flow separation26.
Conveniently, both of these locations coincided with the junctions of inlet model
sections, which allowed the fluidic actuators to be securely bolted to their adjacent,
upstream duct modules. The positions of the injection slots were then governed by the
physical size of the remaining fluidic actuator components and were placed as close as
possible to the suction orifices.
To span the entire width of the duct and meet estimated mass flow and jet
momentum needs, four actuators, placed side-by-side, were used at each bend.
Lockheed Martin provided computer aided design (CAD) drawings of the duct surface

29
geometry that were utilized to create an actuator system that would conform to the duct
shape. Using the CAD software SolidWorks, solid models of the actuator components
were designed. The drawing files were then uploaded to a fused deposition modeling,
rapid prototype machine. This computer controlled mechanism squirts a special, melted
ABS plastic from a traversing nozzle in the shape of the part. This process is repeated
for several layers, and upon cooling, a durable model results. The advantage of using
this manufacturing technique is the ability to easily construct parts having complex
geometries. Fine tolerances are not achievable, but the speed and low cost of this
method make it ideal for research oriented projects.
Figure 13 shows a schematic of the flow control system. Fluid from the duct first
enters the actuator through a 25 cm wide suction slot. Poisson-Quinton and Lepage
found that the best way to control separation via boundary layer suction was through a
finely perforated surface27. Therefore, the opening was covered by a perforated
aluminum sheet. The sheeting was 0.8 mm thick and contained 1.5875 mm holes spaced
3.175 mm apart. A plenum chamber was utilized to equalize the pressure below the
perforated sheet and provide an evenly distributed ingestion of the duct fluid.

30
Figure 13: Schematic of the Fluidic Actuators
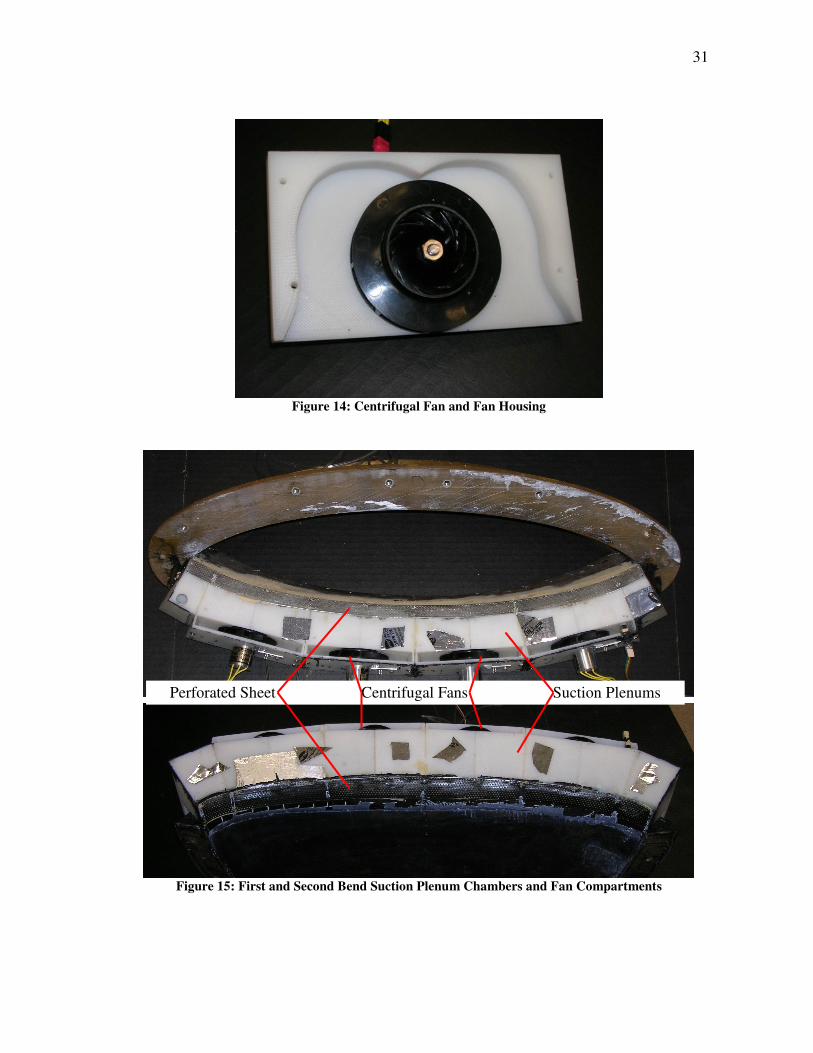
Below the suction chamber is the second component of the fluidic actuator, the
fan compartment. Here, an enclosed centrifugal fan pulls air from the plenum and
accelerates it for injection into the duct flow. The fan has an outer diameter of 67.85
mm and was originally intended for use in small, handheld vacuums. The cartoid-
shaped fan housing is used to efficiently direct the flow towards the exit of this module.
The fan and compartment, in a detached state from the rest of the fluidic actuator, can be
viewed in Figure 14. Figure 15 presents photographs of the assembled suction plenum
chambers and fan compartments for both the first and second bend actuator arrays.
31
Figure 14: Centrifugal Fan and Fan Housing
Figure 15: First and Second Bend Suction Plenum Chambers and Fan Compartments
Perforated Sheet Centrifugal Fans Suction Plenums

32
After being energized by the fan, the fluid enters another plenum chamber
through a slotted shaft. The shaft is 12.7 mm in diameter with a 6.35 mm slot. It can be
rotated to become an oscillating valve for pulsed air injection, or, alternatively, remain
open to produce steady blowing. During unsteady actuation, two jet pulses are produced
per revolution of the shaft.
The rotating shafts of the four actuators were linked together to allow operation
by a single motor. To accommodate the angular misalignment of the actuators, universal
joints were employed. These couplers were guided by miniature bearings and affixed to
the slotted shafts by set screws. This design aspect is demonstrated in Figure 16 by a
photograph of the joined valves before their insertion into the fluidic actuator devices.
Figure 16: Slotted Shaft Valves Linked with Universal Joints
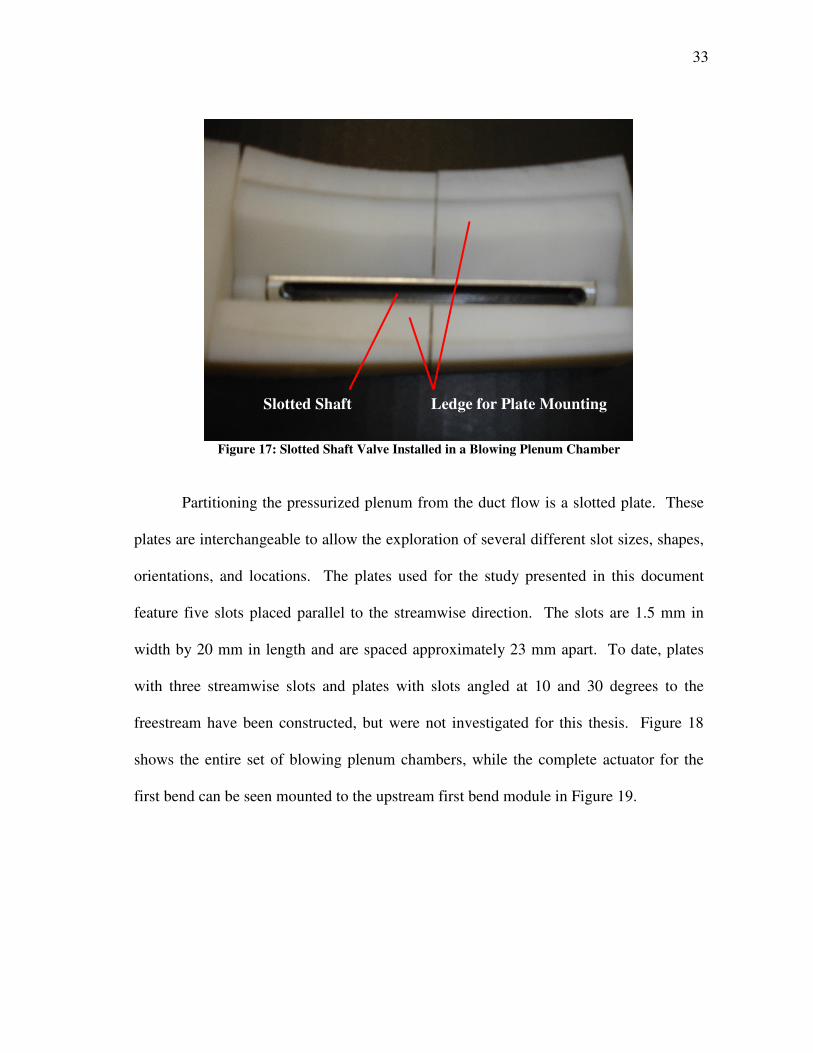
The blowing plenum, which is the third module of the fluidic actuator system, is
again used to equalize the pressure before the air reenters the duct. This action ensures
that the exit velocity of the created jet is common to all slots. The volume of the plenum
chambers for the four separate actuators was kept constant to provide similar frequency
effects across the span of the duct during pulsed blowing. A blowing plenum with an
installed slotted shaft valve is shown in Figure 17.
33
Figure 17: Slotted Shaft Valve Installed in a Blowing Plenum Chamber
Partitioning the pressurized plenum from the duct flow is a slotted plate. These
plates are interchangeable to allow the exploration of several different slot sizes, shapes,
orientations, and locations. The plates used for the study presented in this document
feature five slots placed parallel to the streamwise direction. The slots are 1.5 mm in
width by 20 mm in length and are spaced approximately 23 mm apart. To date, plates
with three streamwise slots and plates with slots angled at 10 and 30 degrees to the
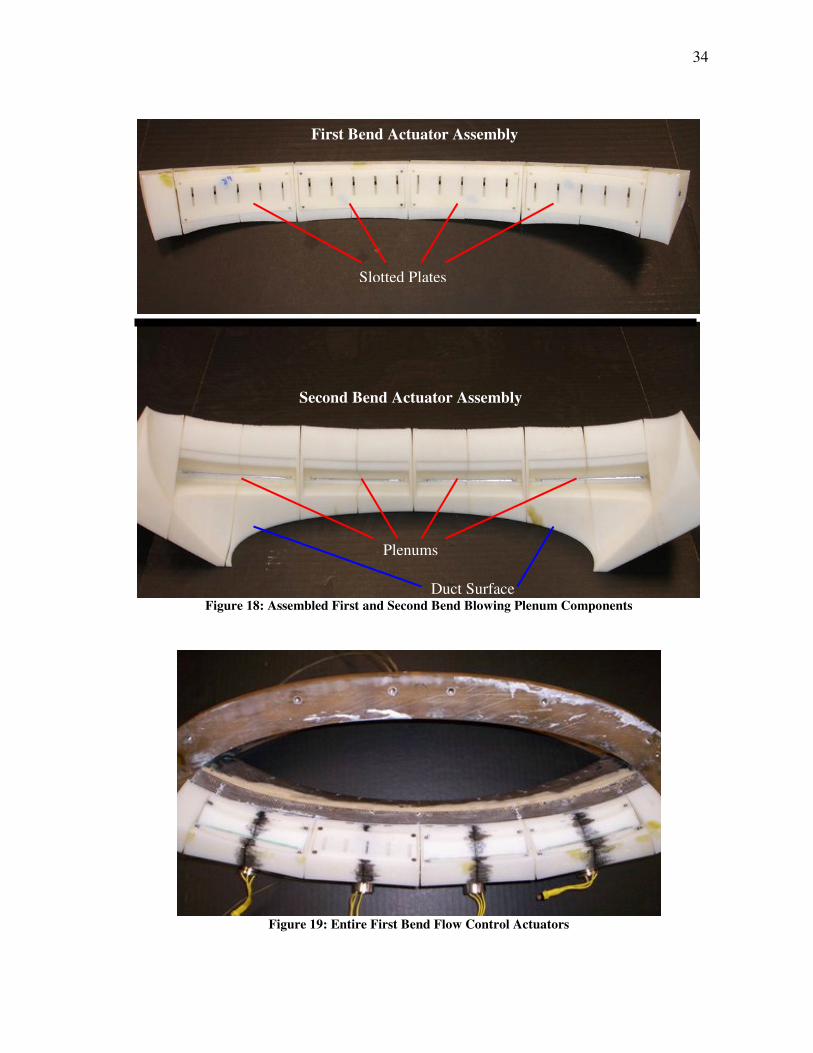
freestream have been constructed, but were not investigated for this thesis. Figure 18
shows the entire set of blowing plenum chambers, while the complete actuator for the
first bend can be seen mounted to the upstream first bend module in Figure 19.
Slotted Shaft Ledge for Plate Mounting
34
Figure 18: Assembled First and Second Bend Blowing Plenum Components
Figure 19: Entire First Bend Flow Control Actuators
First Bend Actuator Assembly
Slotted Plates
Second Bend Actuator Assembly
Plenums
Duct Surface
35
Actuator Control
Traditional SJA technologies rely on a single actuator driving mechanism to
provide both momentum and frequency to the fluid. In such a configuration, the jet
velocity is coupled to the actuation frequency. With the fluidic actuators designed for
this study, this restriction is not relevant because the fans that produce the jets can be
independently adjusted. This fact could be a significant advantage in the control of the
secondary flows in an axially-compact S-duct.
The centrifugal fans were powered by Mighty Micro 010 brushless motors from
AstroFlight, Inc. These direct current (DC) motors, typically employed in miniature,
radio-controlled (R/C) aircraft, are extremely small and lightweight. The slotted shaft
assembly for each bend was rotated separately by Mighty Micro 020 brushless motors.
These motors are similar to those used for the fans, but are about twice the length for the
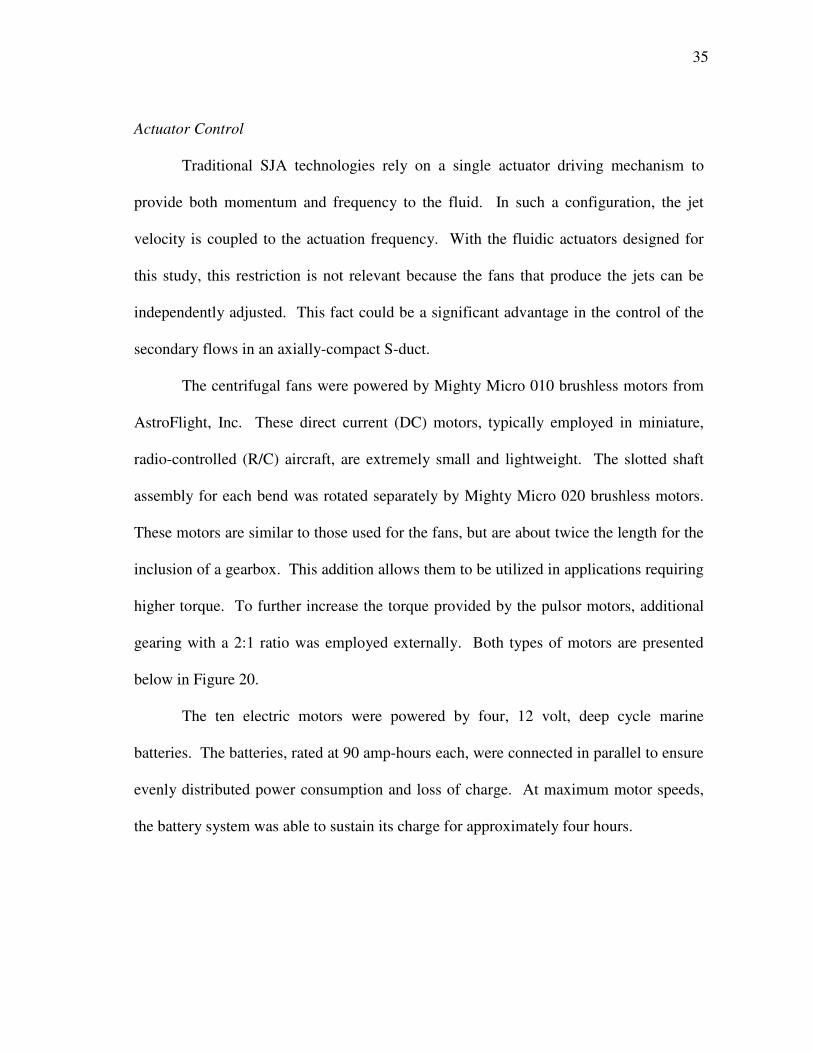
inclusion of a gearbox. This addition allows them to be utilized in applications requiring
higher torque. To further increase the torque provided by the pulsor motors, additional
gearing with a 2:1 ratio was employed externally. Both types of motors are presented
below in Figure 20.
The ten electric motors were powered by four, 12 volt, deep cycle marine
batteries. The batteries, rated at 90 amp-hours each, were connected in parallel to ensure
evenly distributed power consumption and loss of charge. At maximum motor speeds,
the battery system was able to sustain its charge for approximately four hours.

36
Figure 20: Electric Motors Used to Drive the Fans (Left) and Slotted Shaft Valves (Right)
Control of the motors was accomplished through electronic speed controllers
provided with the Mighty Micro systems. These devices take the servo-based pulse
width signal supplied by the radio receiver of an R/C product, and output the necessary
current to the motor. To generate these pulse width signals, thus emulating a radio
receiver, a 32-channel servo controller was obtained from Lynxmotion Robotics. This
PC-based card takes serial commands as input and produces the corresponding pulse
width modulation. With this support system, operation of the fluidic actuators by
computer was possible.
To apply feedback control, software was created using LabVIEW. The
LabVIEW program received user input in the form of fan and pulsor frequencies, then
continually communicated with the Lynxmotion servo controller and RPM sensors to
maintain the desired rotational rates. These optical sensors, triggered by reflective tape,
reported the frequencies of the motors through two, 8-channel USB-6009 data
acquisition boards from National Instruments. These external boards feature 14-bit
resolution at a maximum sample rate of 48,000 samples per second and connect to the
Centrifugal Fan Motor Pulsing Valve Motor
Electronic Speed Control
Gearing
Optical RPM Sensor
Motor Mount

37
PC via USB ports for convenience. For further clarification of the control and
acquisition methods utilized in this study, Figure 21 shows a flowchart illustrating the
process.
Figure 21: Schematic of the Control and Acquisition Setup
38
RESULTS AND DISCUSSION This section will document the results of experiments performed on the
serpentine inlet duct and the fluidic actuator devices. First, the characteristics of the
actuator system will be described from the analysis of bench top tests. Then, results
from the baseline, resin duct model will be shown through flow surveys at the engine
face, wall static pressure distributions, CFD analysis, and flow visualization
experiments. Finally, using similar methods, the effects of flow control actuators on the
performance of the duct will be presented.
Bench Top Fluidic Actuator Performance
Before the actuator devices were integrated into the fiberglass duct model for
testing, experiments were run to characterize their performance. Given that the actuators
are driven by centrifugal fans, they are susceptible to reduced efficiency when an
adverse pressure gradient is applied across them. Such is the case for their installation
locations in the serpentine inlet. Due to the flow physics inside the duct, the static
pressure at the suction point is lower than that at the blowing point. Therefore, for a
given fan rotational speed, the velocity of the resulting jet is reduced as this pressure
differential is increased.
To simulate the pressure gradient across the fan, the suction plenum of the fluidic
actuator was affixed to an open-circuit wind tunnel, while the blowing plenum was
exposed to ambient pressure. Several pressure differentials were attained by varying the
flow speed within the wind tunnel. By affixing the five-slotted plate to the blowing
39
chamber and monitoring the steady jet velocity with a tiny, boundary layer probe, a
series of calibration curves was produced to map the fan effectiveness at various fan
speeds and pressure gradients. The boundary layer probe was connected to a Barocel
transducer with an accuracy of 0.05% of reading. The static pressure in the wind tunnel
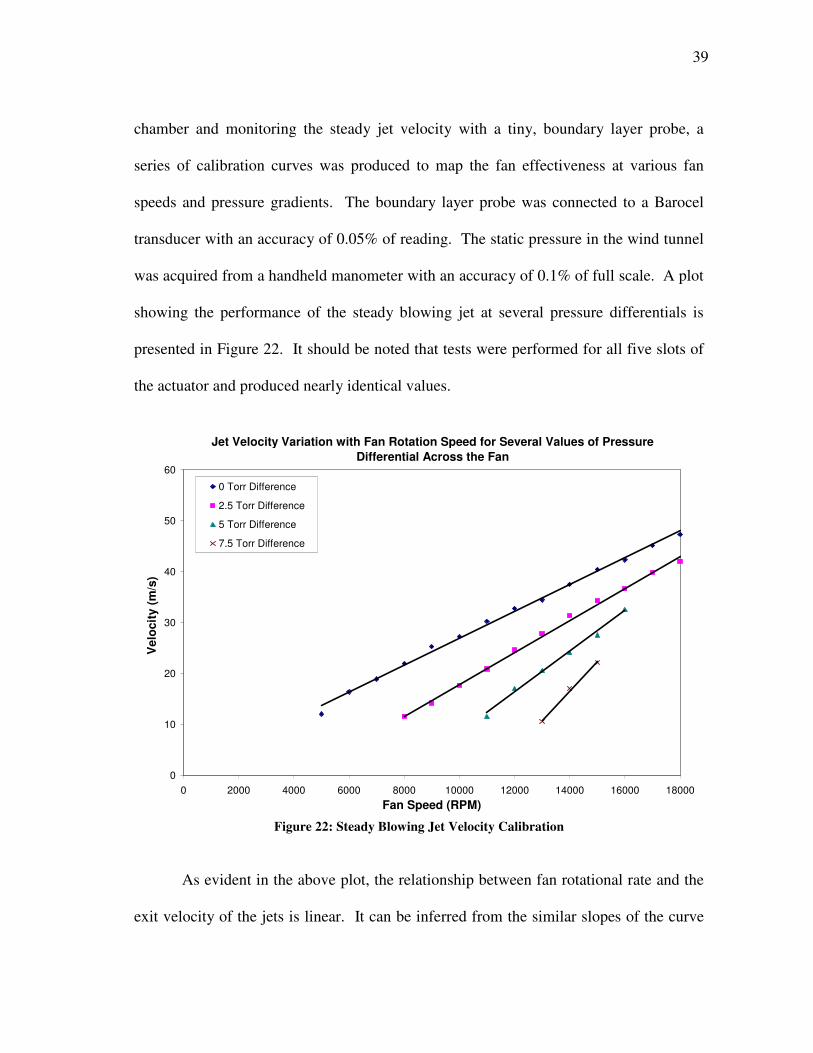
was acquired from a handheld manometer with an accuracy of 0.1% of full scale. A plot
showing the performance of the steady blowing jet at several pressure differentials is
presented in Figure 22. It should be noted that tests were performed for all five slots of
the actuator and produced nearly identical values.
Jet Velocity Variation with Fan Rotation Speed for Several Values of Pressure
Differential Across the Fan
0
10
20
30
40
50
60
0 2000 4000 6000 8000 10000 12000 14000 16000 18000Fan Speed (RPM)
Vel
ocity
(m/s
)
0 Torr Difference
2.5 Torr Difference
5 Torr Difference
7.5 Torr Difference
Figure 22: Steady Blowing Jet Velocity Calibration
As evident in the above plot, the relationship between fan rotational rate and the
exit velocity of the jets is linear. It can be inferred from the similar slopes of the curve
40
fits that, for a given fan speed, the jet velocity varies linearly with pressure differential as
well. This aspect of the actuators could be highly advantageous for the application of
closed-loop feedback control, as a nonintrusive means of acquiring real-time jet
velocities in the duct is beyond the scope of this research.
Additional bench top experiments were done to assess the operation of the fluidic
actuators for pulsed injection. This investigation was performed with no pressure
applied across the fan. To measure the high frequency, unsteady jet velocity, an IFA
300 hot-wire anemometry system from TSI was employed. Fan speeds of 9000 RPM,
12,000 RPM, and 15,000 RPM were each tested at frequencies of 80 Hz, 100 Hz, 200
Hz, and 400 Hz. In Figure 23, the unsteady jet velocity variation with time for a pulsing
frequency of 100 Hz can be seen. A fast Fourier transform (FFT) of the 15,000 RPM
plot is presented in Figure 24. The graph clearly shows that a frequency of 100 Hz is
dominant.

41
Time-series Record of Jet Velocity at 100 Hz Pulsing Frequency
0
5
10
15
20
25
30
35
40
45
0 0.005 0.01 0.015 0.02 0.025 0.03 0.035 0.04
Time (s)
Jet V
eloc
ity (m
/s)
9000 RPM12000 RPM15000 RPM
Figure 23: Unsteady Fluidic Actuator Performance
Figure 24: FFT of the Jet Velocity at a Fan Speed of 15,000 RPM and a Pulsing Frequency of 100 Hz
42
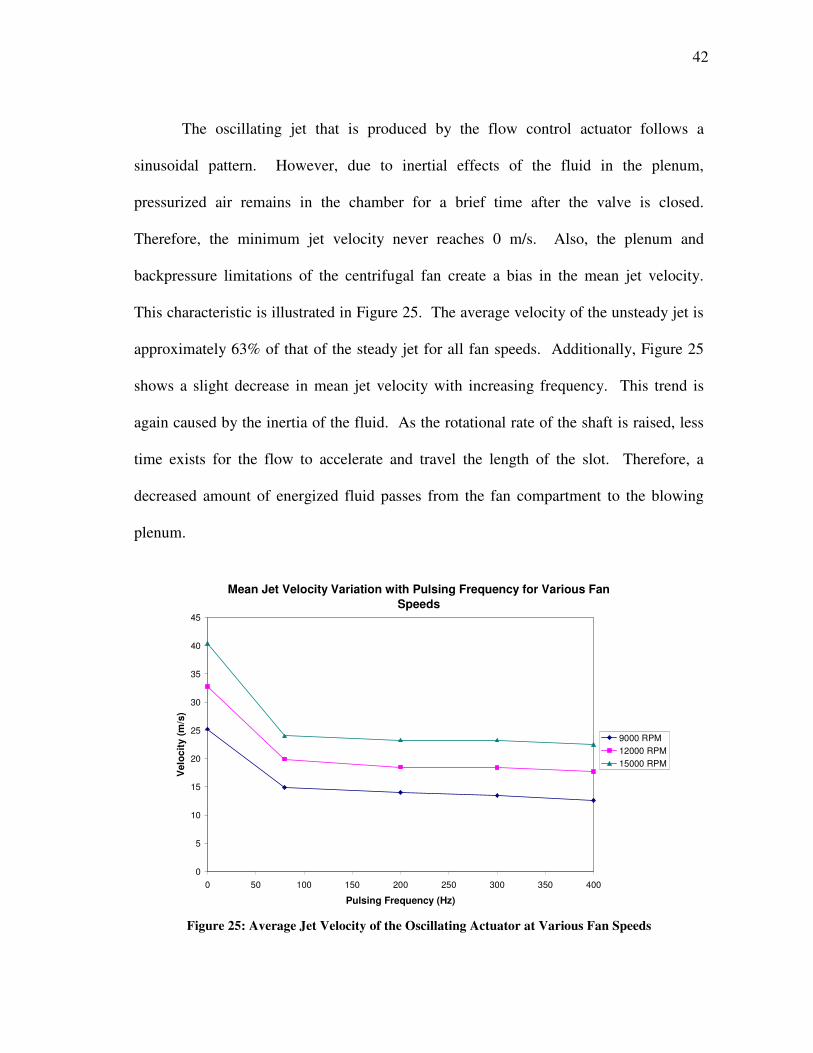
The oscillating jet that is produced by the flow control actuator follows a
sinusoidal pattern. However, due to inertial effects of the fluid in the plenum,
pressurized air remains in the chamber for a brief time after the valve is closed.
Therefore, the minimum jet velocity never reaches 0 m/s. Also, the plenum and
backpressure limitations of the centrifugal fan create a bias in the mean jet velocity.
This characteristic is illustrated in Figure 25. The average velocity of the unsteady jet is
approximately 63% of that of the steady jet for all fan speeds. Additionally, Figure 25
shows a slight decrease in mean jet velocity with increasing frequency. This trend is
again caused by the inertia of the fluid. As the rotational rate of the shaft is raised, less
time exists for the flow to accelerate and travel the length of the slot. Therefore, a
decreased amount of energized fluid passes from the fan compartment to the blowing
plenum.
Mean Jet Velocity Variation with Pulsing Frequency for Various Fan
Speeds
0
5
10
15
20
25
30
35
40
45
0 50 100 150 200 250 300 350 400
Pulsing Frequency (Hz)
Vel
ocity
(m/s
)
9000 RPM12000 RPM15000 RPM
Figure 25: Average Jet Velocity of the Oscillating Actuator at Various Fan Speeds

43
Baseline Duct Model
Before design of the flow control actuators took place, the flow within the
baseline inlet was analyzed. To accomplish this task, several experiments were
performed using the resin duct model from Lockheed Martin. These tests provided a
great deal of insight into the formation of the secondary flows within the compact,
serpentine inlet. By combining the results of this investigation with the knowledge
obtained from literature on the subject, a keen understanding of the flow physics was
acquired.
CFD Analysis
In addition to physical surveys of the flow, computational methods were also
employed to gain an understanding of the flow phenomena. The advantage of CFD is
the multitude of options available in post-processing. One can view velocity, total or
static pressure, vorticity, and many other important aerodynamic quantities at any
location in the flowfield. Also, streamlines can be plotted to reveal information
regarding the fluid mechanics. However, the downside of computationally exploring
such a complex flowfield is the accuracy of the results. As shown by Hamstra et al.1,
CFD solutions for the flow in this duct fail to capture the extent of flow separation,
vortex size, and pressure loss. Nonetheless, computational analysis does show
significant secondary flow development. Therefore, its use as a basis for qualitative
exploration of the flow physics is justified.
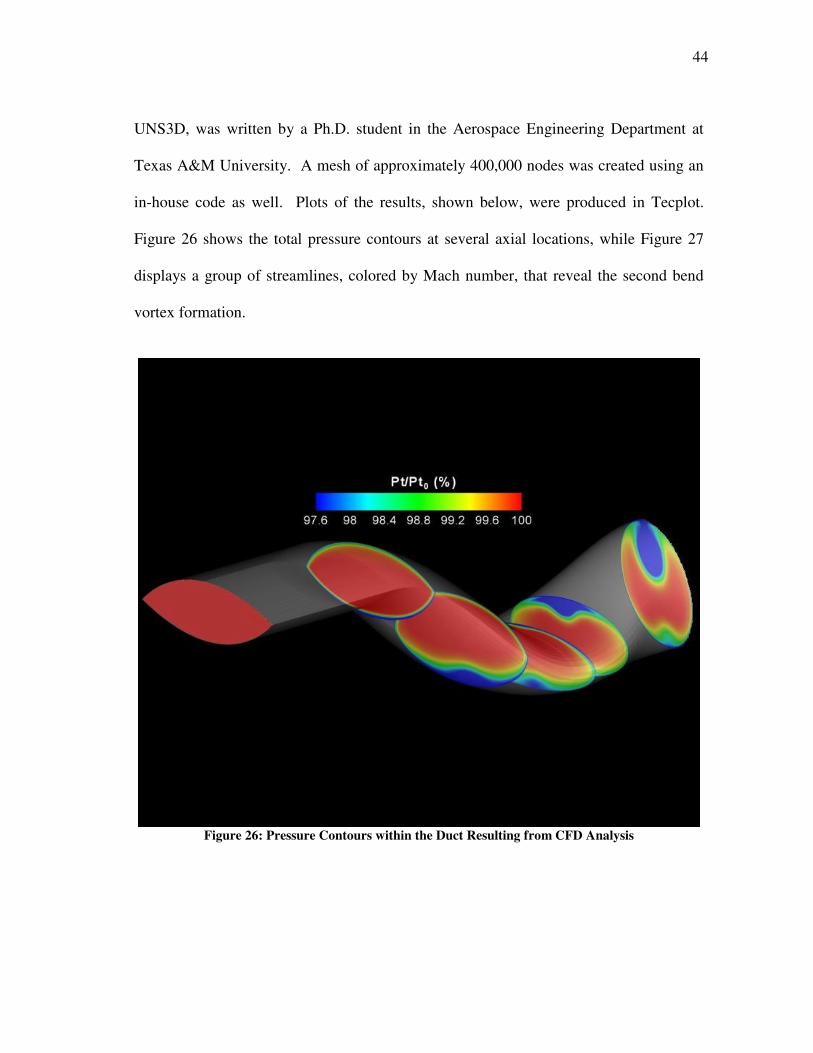
For the CFD analysis performed in this study, a three-dimensional, unstructured
Navier-Stokes solver with k-omega turbulence modeling was utilized. This code, named
44
UNS3D, was written by a Ph.D. student in the Aerospace Engineering Department at
Texas A&M University. A mesh of approximately 400,000 nodes was created using an
in-house code as well. Plots of the results, shown below, were produced in Tecplot.
Figure 26 shows the total pressure contours at several axial locations, while Figure 27
displays a group of streamlines, colored by Mach number, that reveal the second bend
vortex formation.
Figure 26: Pressure Contours within the Duct Resulting from CFD Analysis

45
Figure 27: CFD Streamline Trace
Combining the information revealed by each of these plots, the description of the
secondary flow development provided in the introductory section of this document is
confirmed. Just downstream of each bend, flow separation causes the emergence of low
pressure regions near the wall that are concentrated towards the center of the duct
(signified by the blue areas). These pressure deficits cause the flow to rush in from the
sides of the duct, converging at the centerline where the fluid is then forced into a
vortical pattern.

46
Surface Flow Visualization For a further qualitative study of the mechanisms governing the secondary flow
formation, flow visualization on the walls of the duct was carried out. To accomplish
this test, a mixture of titanium dioxide, kerosene, mineral oil, and oleic acid was
employed. The titanium dioxide, a heavy, white powder, becomes suspended in the
compound. The concoction can then be painted onto the surface. When the flow is
activated, shear stresses at the wall force the liquid components of the mixture to migrate
downstream, leaving behind the tiny particles of titanium dioxide. In Figure 28 and
Figure 29, photographs of the first and second bends of the duct, respectively, are shown
after undergoing an application of the titanium dioxide compound. The viewpoint of the
first bend picture is upstream, looking at the bottom wall. In the second bend
photograph, the top wall is the focus from a downstream location. In both pictures, the
merging near-wall flow is evident, as are the locations of vortex lift-off. In the
photograph of the first bend flow visualization, a line indicating the point of flow
separation can be seen. A comparison of the two bends indicates that the second bend
vortices are much stronger than those of the first bend. This is evident from the thick
pooling of liquid at the first bend vortex cores, where too little flow energy existed to
pull the mixture off the duct surface.

47
Figure 28: First Bend Surface Flow Visualization
Figure 29: Second Bend Surface Flow Visualization
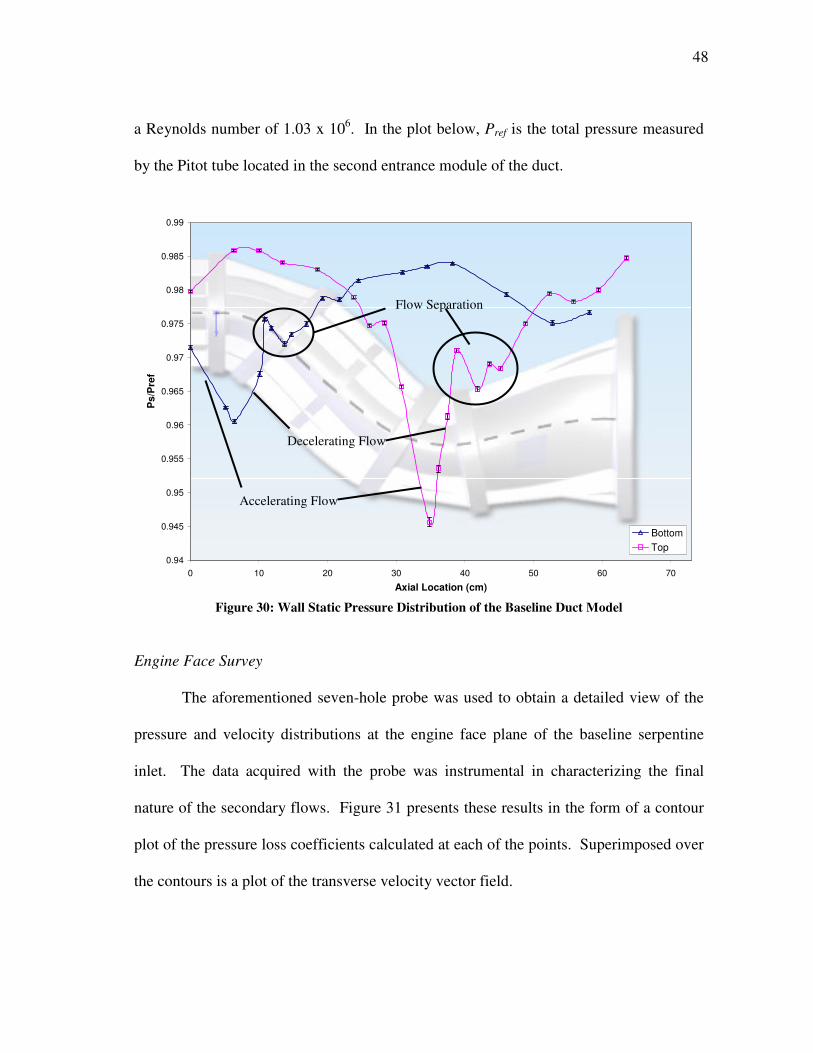
Surface Static Pressure Taps Quantifying the formation of secondary flows in this S-duct began with an
experiment involving surface static pressures. Using the data presented in Figure 30,
regions of accelerating and decelerating flow were identified, as were areas of flow
separation. Both the bottom and top surfaces are represented in the static pressure plot
of Figure 30. For spatial reference, the duct geometry is included as the background
image of the graph. These static tap tests were run at an inlet Mach number of 0.18 with
Separation Point
Weak Vortex Development
Strong Vortex Development
48
a Reynolds number of 1.03 x 10⁶. In the plot below, Pref is the total pressure measured
by the Pitot tube located in the second entrance module of the duct.
0.94
0.945
0.95
0.955
0.96
0.965
0.97
0.975
0.98
0.985
0.99
0 10 20 30 40 50 60 70
Axial Location (cm)
Ps/
Pre
f
BottomTop
Figure 30: Wall Static Pressure Distribution of the Baseline Duct Model
Engine Face Survey The aforementioned seven-hole probe was used to obtain a detailed view of the
pressure and velocity distributions at the engine face plane of the baseline serpentine
inlet. The data acquired with the probe was instrumental in characterizing the final
nature of the secondary flows. Figure 31 presents these results in the form of a contour
plot of the pressure loss coefficients calculated at each of the points. Superimposed over
the contours is a plot of the transverse velocity vector field.
Accelerating Flow
Decelerating Flow
Flow Separation

49
Figure 31: Engine Face Total Pressure Loss Coefficient Contour Plot with Velocity Vectors
As clearly shown in Figure 31, the strong, counter-rotating vortices shed from the
second bend constitute the dominant flow features that deteriorate the performance of
this S-duct. Therefore, flow control efforts will focus on weakening or eliminating these
structures to improve inlet efficiency. The vortices, denoted by the red region at the top
of the plot, cover nearly an eighth of the engine face area and create a region of severe
pressure deficit.
Close inspection of the above plot does not show any indication of the presence
of vortices produced by the first bend. A low pressure strip does extend to the bottom

50
wall of the duct, but the vectors do not reveal any significant circulation. At this stage in
the research project, the evolution of the vortices produced by the first bend fluid
dynamics is unclear. One possibility is that they feed into the second bend vortices and
are consumed. Another is that, due to their weak nature, the vortices break down after
diffusing over the lower portion of the duct. Future efforts at Texas A&M University
will employ CFD and experimental techniques in an attempt to clarify this occurrence.
Flow Control – Suction
Initial flow control attempts were conducted by applying only suction to the
bends of the serpentine inlet. The goal of this method was to delay or prevent separation
to increase the pressure recovery at the engine face plane. From the explanation of
vorticity signature provided in the Introduction section of this thesis, it was expected that
suction would not be successful in deterring the development of the secondary flows.
However, an investigation into the effects of this control technique on the severity of the
pressure loss within the secondary flow structures was of interest.
Boundary layer suction is the process of removing low energy fluid that is prone
to separation when exposed to adverse pressure gradients and deflecting higher energy
flow towards the wall28. To achieve this action within the duct, the fluidic actuator
system, minus the blowing plenum components, was integrated into the model. In this
configuration, the low pressure side of the centrifugal fans was exposed to the static
pressure in the inlet while the high side was connected to vacuum pumps. The vacuums
were used to equalize the pressure across the fans to ensure their ability to remove the
boundary layer flow despite the low static pressure inside the duct.
51
To analyze the effects of suction on the performance of the jet engine inlet,
surface static pressure and engine face surveys were again run at a Mach number of 0.18.
Three levels of suction, expressed as a percentage of the core mass flow, were explored.
The mass flows were measured with probes located in the vacuum pump hosing. Figure
32 shows the change in static pressure for the top and bottom surfaces of the duct when
suction amounts of 1.25%, 1.75%, and 2.25% were applied. In the plot, the wall static
pressures for each case follow a similar distribution, but are shifted. The vertical shift
represents a decrease in total pressure loss and the horizontal displacement indicates a
delay in flow separation. The static pressure tests showed that first bend flow separation
was delayed nearly 5 cm and the second bend separation point was moved downstream
approximately 2 cm when 1.25% boundary layer suction was initiated. Increasing the
amount of suction beyond 1.25% did not have any additional effect on the location of the
separation point.

52
0.960
0.965
0.970
0.975
0.980
0.985
0.990
0.00 10.00 20.00 30.00 40.00 50.00 60.00
Axial Location (cm)
Ps/
Pre
f
Bottom Surface, BaselineTop Surface, BaselineBottom Surface, 2.25% SuctionTop Surface, 2.25% SuctionBottom Surface, 1.75% SuctionTop Surface, 1.75% SuctionBottom Surface, 1.25% SuctionTop Surface 1.25% Suction
Figure 32: Comparison of Baseline and Suction Flow Control Wall Static Pressures
A seven-hole probe was again utilized to map the contours of CPloss at the engine
face plane for the suction experiments. As expected, the strong vortices emerging from
the second bend were still prevalent. However, with suction applied the degree of
pressure recovery in these vortices and throughout the engine face was greatly increased.
Also, a strong relationship developed between the amount of suction and the associated
pressure loss. Each increase in suction led to a further reduction in CPloss,avg. This effect
can be inferred from Figure 33, which shows the engine face contours of CPloss for the
three values of suction. Each of the plots only portrays one half of the engine face plane
with suction applied. For reference, the other half is replaced by the baseline pressure
contour plot. Following the figure, Table 1 presents the values of CPloss,avg and DC60
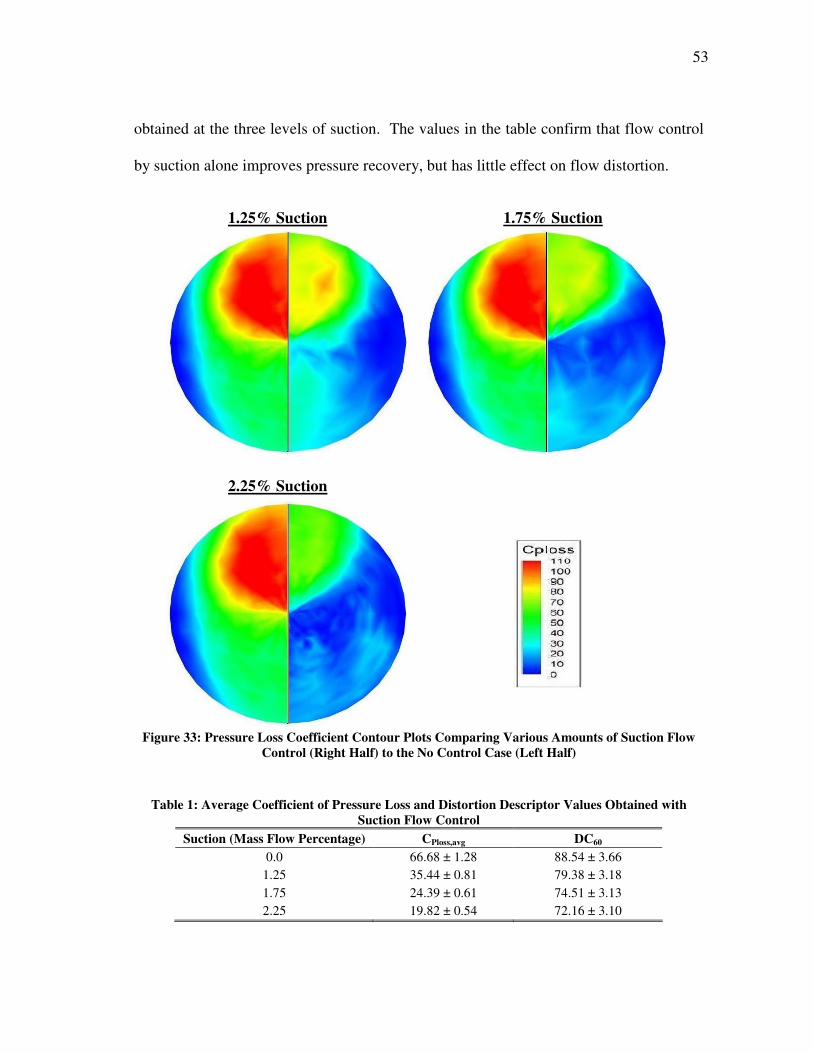
53
obtained at the three levels of suction. The values in the table confirm that flow control
by suction alone improves pressure recovery, but has little effect on flow distortion.
Figure 33: Pressure Loss Coefficient Contour Plots Comparing Various Amounts of Suction Flow
Control (Right Half) to the No Control Case (Left Half)
Table 1: Average Coefficient of Pressure Loss and Distortion Descriptor Values Obtained with Suction Flow Control
Suction (Mass Flow Percentage) CPloss,avg DC60
0.0 66.68 ± 1.28 88.54 ± 3.66 1.25 35.44 ± 0.81 79.38 ± 3.18 1.75 24.39 ± 0.61 74.51 ± 3.13 2.25 19.82 ± 0.54 72.16 ± 3.10
1.25% Suction 1.75% Suction
2.25% Suction
54
Flow Control – Suction and Steady Blowing
Upon completion of the suction flow control tests, the blowing plenum chambers
were reconnected to the fluidic actuator system and incorporated into the duct model.
Differential pressure sensors with an accuracy of 0.009 torr were employed to monitor
the real-time pressure gradient across the fans. These values were averaged over the
duration of the testing and applied to the curve fits of the fluidic actuator performance
plot to calculate the jet velocities. For this document, experiments with the operation of
flow control via steady suction and blowing were run at an inlet Mach number of 0.09
and a Reynolds number of 5.07 x 10⁵. This low velocity was chosen because the
pressure differential across the fans was negligible, thus yielding the maximum
efficiency of the actuators for each fan speed.
Unlike the suction case, the degree of flow control applied to the inlet by steady
or unsteady injection can not be expressed only as a percentage of the core mass flow.
Instead, a new term representing the momentum addition provided by the jets must be
introduced because momentum injection, not mass addition, governs flow control
effectiveness28. The parameter, called the jet momentum coefficient and denoted by C�,
compares the momentum of the jet emerging from the slot to the momentum of the
freestream fluid. The definition of C� used in this study was derived from the research
of Amitay et al22. Equation 5 presents this definition for the jet momentum of the entire
actuator array.
( )( )
2
2
jet
duct
U l w nC
U Aµ
ρ
ρ
⋅ ⋅ ⋅ ⋅=
⋅ ⋅ (5)
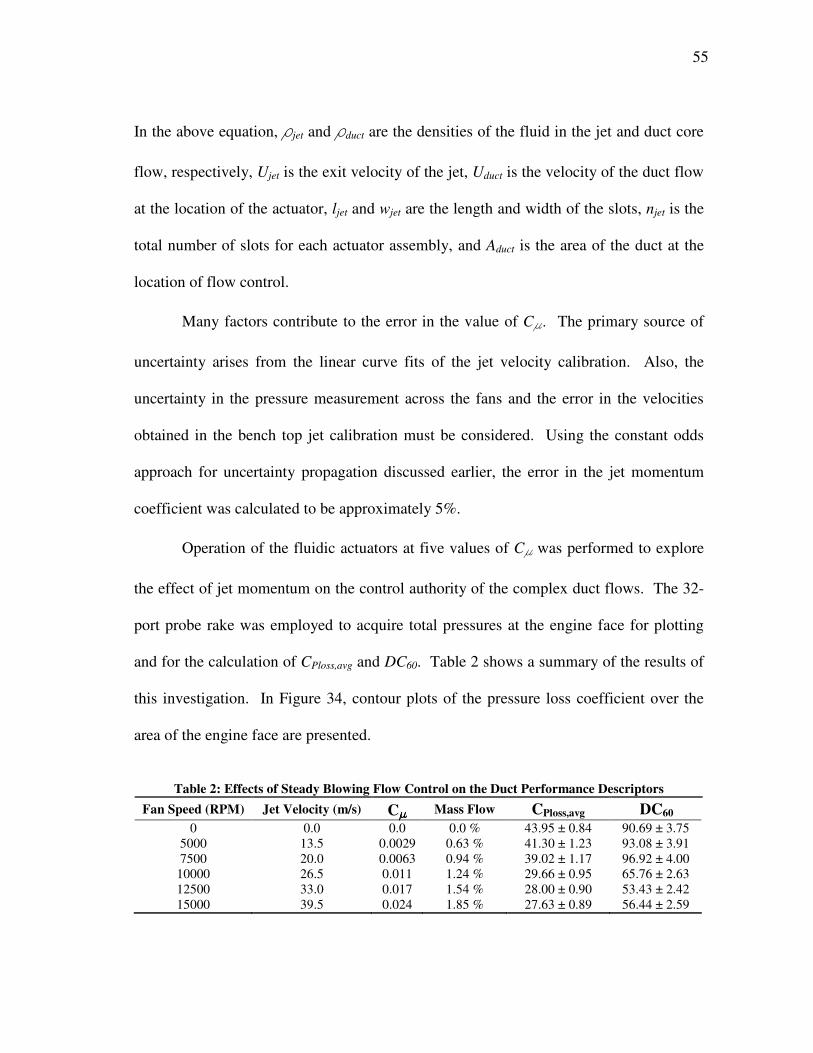
55
In the above equation, �jet and �duct are the densities of the fluid in the jet and duct core
flow, respectively, Ujet is the exit velocity of the jet, Uduct is the velocity of the duct flow
at the location of the actuator, ljet and wjet are the length and width of the slots, njet is the
total number of slots for each actuator assembly, and Aduct is the area of the duct at the
location of flow control.
Many factors contribute to the error in the value of C�� The primary source of
uncertainty arises from the linear curve fits of the jet velocity calibration. Also, the
uncertainty in the pressure measurement across the fans and the error in the velocities
obtained in the bench top jet calibration must be considered. Using the constant odds
approach for uncertainty propagation discussed earlier, the error in the jet momentum
coefficient was calculated to be approximately 5%.
Operation of the fluidic actuators at five values of C� was performed to explore
the effect of jet momentum on the control authority of the complex duct flows. The 32-
port probe rake was employed to acquire total pressures at the engine face for plotting
and for the calculation of CPloss,avg and DC60. Table 2 shows a summary of the results of
this investigation. In Figure 34, contour plots of the pressure loss coefficient over the
area of the engine face are presented.
Table 2: Effects of Steady Blowing Flow Control on the Duct Performance Descriptors
Fan Speed (RPM) Jet Velocity (m/s) C���� Mass Flow CPloss,avg DC60 0 0.0 0.0 0.0 % 43.95 ± 0.84 90.69 ± 3.75
5000 13.5 0.0029 0.63 % 41.30 ± 1.23 93.08 ± 3.91 7500 20.0 0.0063 0.94 % 39.02 ± 1.17 96.92 ± 4.00
10000 26.5 0.011 1.24 % 29.66 ± 0.95 65.76 ± 2.63 12500 33.0 0.017 1.54 % 28.00 ± 0.90 53.43 ± 2.42 15000 39.5 0.024 1.85 % 27.63 ± 0.89 56.44 ± 2.59

56
Figure 34: Pressure Loss Coefficient Contour Plots Comparing Various Amounts of Steady
Injection (Right Half) to the No Control Case (Left Half)
C���� = 0.011 C���� = 0.017
C���� = 0.024
C���� = 0.0029 C���� = 0.0063
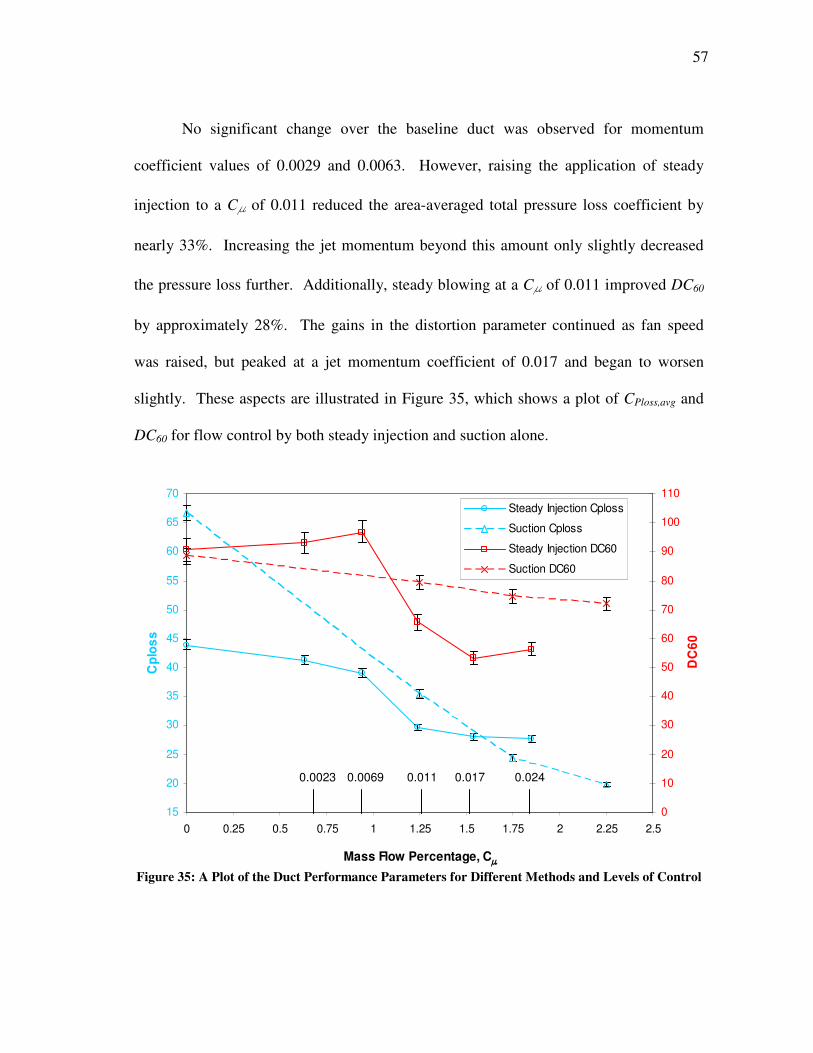
57
No significant change over the baseline duct was observed for momentum
coefficient values of 0.0029 and 0.0063. However, raising the application of steady
injection to a C� of 0.011 reduced the area-averaged total pressure loss coefficient by
nearly 33%. Increasing the jet momentum beyond this amount only slightly decreased
the pressure loss further. Additionally, steady blowing at a C� of 0.011 improved DC60
by approximately 28%. The gains in the distortion parameter continued as fan speed
was raised, but peaked at a jet momentum coefficient of 0.017 and began to worsen
slightly. These aspects are illustrated in Figure 35, which shows a plot of CPloss,avg and
DC60 for flow control by both steady injection and suction alone.
15
20
25
30
35
40
45
50
55
60
65
70
0 0.25 0.5 0.75 1 1.25 1.5 1.75 2 2.25 2.5
Mass Flow Percentage, C����
Cpl
oss
0
10
20
30
40
50
60
70
80
90
100
110
DC
60
Steady Injection Cploss
Suction Cploss
Steady Injection DC60
Suction DC60
Figure 35: A Plot of the Duct Performance Parameters for Different Methods and Levels of Control
0.0023 0.0069 0.011 0.017 0.024
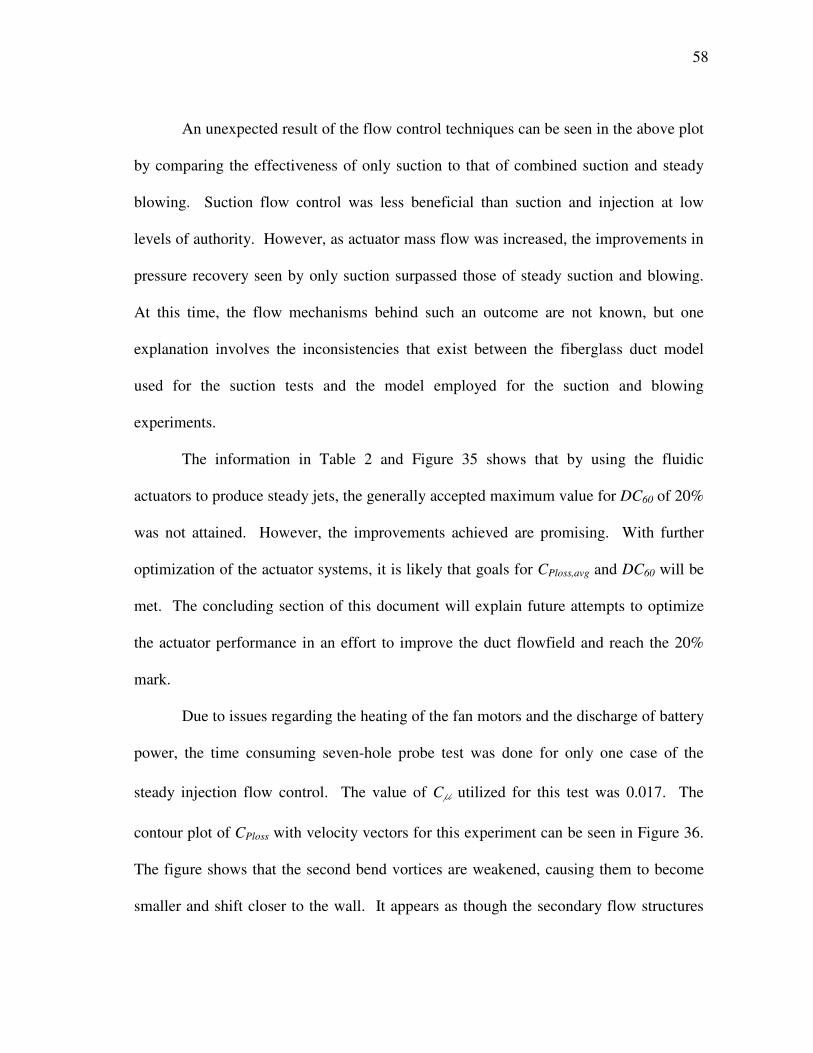
58
An unexpected result of the flow control techniques can be seen in the above plot
by comparing the effectiveness of only suction to that of combined suction and steady
blowing. Suction flow control was less beneficial than suction and injection at low
levels of authority. However, as actuator mass flow was increased, the improvements in
pressure recovery seen by only suction surpassed those of steady suction and blowing.
At this time, the flow mechanisms behind such an outcome are not known, but one
explanation involves the inconsistencies that exist between the fiberglass duct model
used for the suction tests and the model employed for the suction and blowing
experiments.
The information in Table 2 and Figure 35 shows that by using the fluidic
actuators to produce steady jets, the generally accepted maximum value for DC60 of 20%
was not attained. However, the improvements achieved are promising. With further
optimization of the actuator systems, it is likely that goals for CPloss,avg and DC60 will be
met. The concluding section of this document will explain future attempts to optimize
the actuator performance in an effort to improve the duct flowfield and reach the 20%
mark.
Due to issues regarding the heating of the fan motors and the discharge of battery
power, the time consuming seven-hole probe test was done for only one case of the
steady injection flow control. The value of C� utilized for this test was 0.017. The
contour plot of CPloss with velocity vectors for this experiment can be seen in Figure 36.
The figure shows that the second bend vortices are weakened, causing them to become
smaller and shift closer to the wall. It appears as though the secondary flow structures
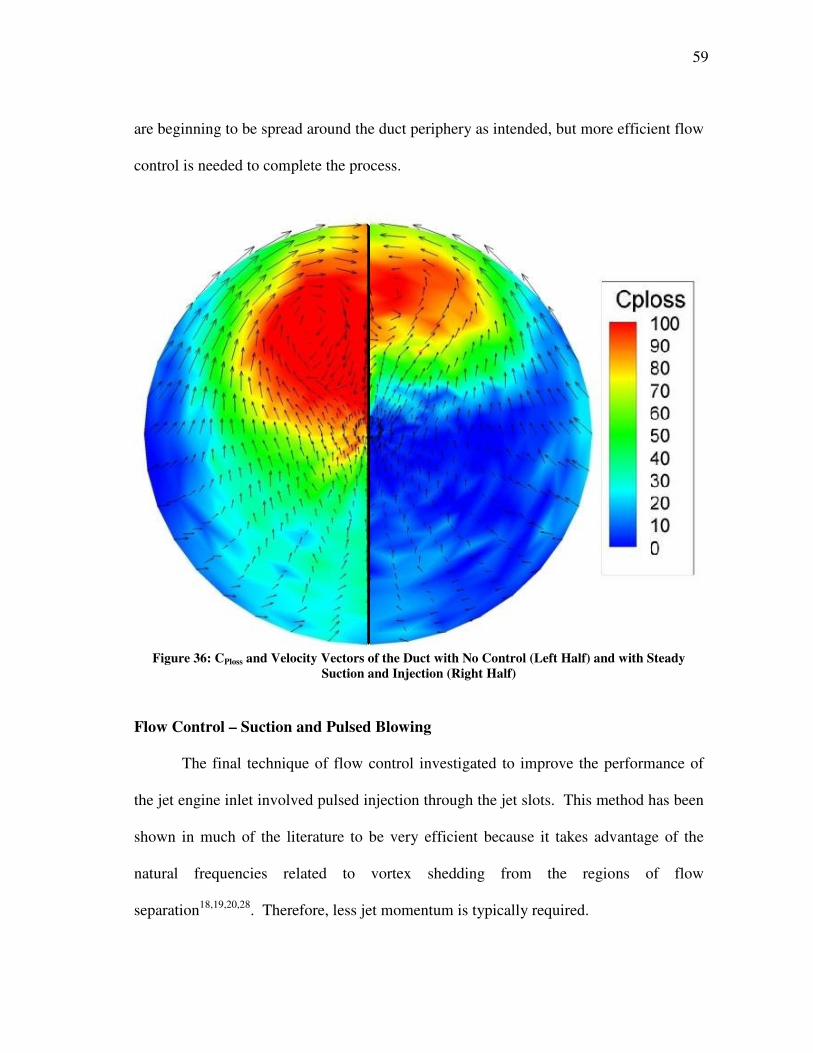
59
are beginning to be spread around the duct periphery as intended, but more efficient flow
control is needed to complete the process.
Figure 36: CPloss and Velocity Vectors of the Duct with No Control (Left Half) and with Steady
Suction and Injection (Right Half) Flow Control – Suction and Pulsed Blowing
The final technique of flow control investigated to improve the performance of
the jet engine inlet involved pulsed injection through the jet slots. This method has been
shown in much of the literature to be very efficient because it takes advantage of the
natural frequencies related to vortex shedding from the regions of flow
separation18,19,20,28. Therefore, less jet momentum is typically required.
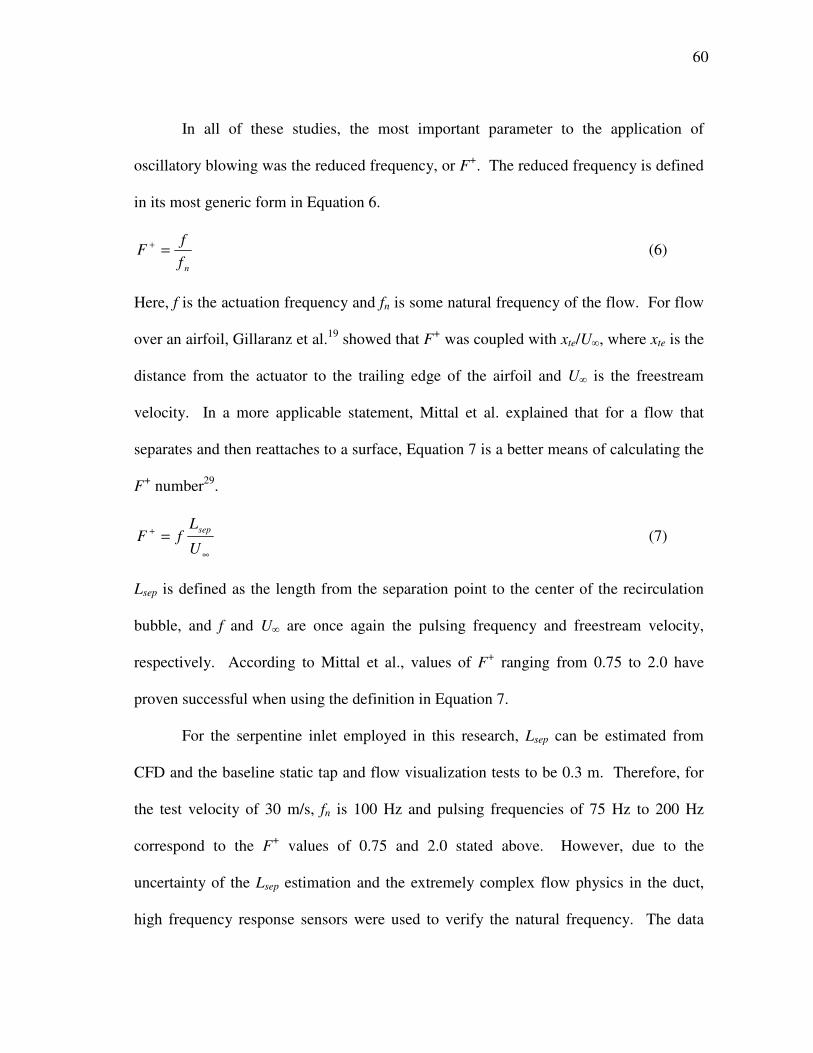
60
In all of these studies, the most important parameter to the application of
oscillatory blowing was the reduced frequency, or F+. The reduced frequency is defined
in its most generic form in Equation 6.
nff
F =+ (6)
Here, f is the actuation frequency and fn is some natural frequency of the flow. For flow
over an airfoil, Gillaranz et al.19 showed that F+ was coupled with xte/U�, where xte is the
distance from the actuator to the trailing edge of the airfoil and U� is the freestream
velocity. In a more applicable statement, Mittal et al. explained that for a flow that
separates and then reattaches to a surface, Equation 7 is a better means of calculating the
F+ number29.
∞
+ =U
LfF sep (7)
Lsep is defined as the length from the separation point to the center of the recirculation
bubble, and f and U� are once again the pulsing frequency and freestream velocity,
respectively. According to Mittal et al., values of F+ ranging from 0.75 to 2.0 have
proven successful when using the definition in Equation 7.
For the serpentine inlet employed in this research, Lsep can be estimated from
CFD and the baseline static tap and flow visualization tests to be 0.3 m. Therefore, for
the test velocity of 30 m/s, fn is 100 Hz and pulsing frequencies of 75 Hz to 200 Hz
correspond to the F+ values of 0.75 and 2.0 stated above. However, due to the
uncertainty of the Lsep estimation and the extremely complex flow physics in the duct,
high frequency response sensors were used to verify the natural frequency. The data

61
acquired from the sensors was fed into an FFT code written in Matlab to produce the
plot in Figure 37. The plot reveals a dominant frequency of 72 Hz, which was common
to most of the points explored in the survey. It is unclear whether this frequency was the
result of a flow process too complicated for Equation 7 to predict, or if the value of Lsep
was miscalculated. Nonetheless, pulsing frequencies of 75 Hz, 100 Hz, 125 Hz, and 150
Hz were chosen to explore reduced frequencies on the order of both values of the natural
frequency. In the remainder of this document, the natural frequency used to calculate F+
will be the experimentally acquired frequency of 72 Hz.
Figure 37: FFT of the Pressure at the Engine Face Plane

62
When utilizing oscillatory injection, the value of Ujet for the calculation of the jet
momentum coefficient can be the maximum, root mean square, or mean jet velocity. For
this study, the maximum jet velocity was chosen because it allowed for a direct
comparison of the flow control authority between steady and unsteady actuation. As
discussed earlier, performance limitations of the centrifugal fan cause the mean jet
velocity to decrease significantly when pulsing begins. However, the maximum jet
velocity during oscillation is identical to the velocity of the steady jet. Therefore, to
evaluate the effectiveness of the steady and pulsing actuation modes for a given fan
speed (i.e., for a given control input and energy expenditure), the maximum jet velocity
is the most practical option for calculating C�.
A set of experiments were run at a C� of 0.016 to ascertain the effects of pulsed
injection flow control for reduced frequencies of 1.04, 1.39, 1.74, and 2.08. For these
tests, only the probe rake was utilized for data acquisition. Figure 38 shows the contours
of CPloss obtained for each of the frequencies, compared to the case of no flow control.
As seen in the contour plots, pulsed blowing at a jet momentum coefficient of
0.016 had little effect on the duct secondary flows. CPloss,avg only showed improvements
of 15.6% with the activation of flow control. Then, for all pulsing frequencies, the value
of this parameter remained nearly constant at approximately 43.00. Also, the unsteady
actuation induced no reduction in the distortion descriptor. In fact, a slight increase
occurred. This poor performance of the pulsing flow control method can be attributed to
the decrease in mean jet velocity associated with the fan backpressure limitations
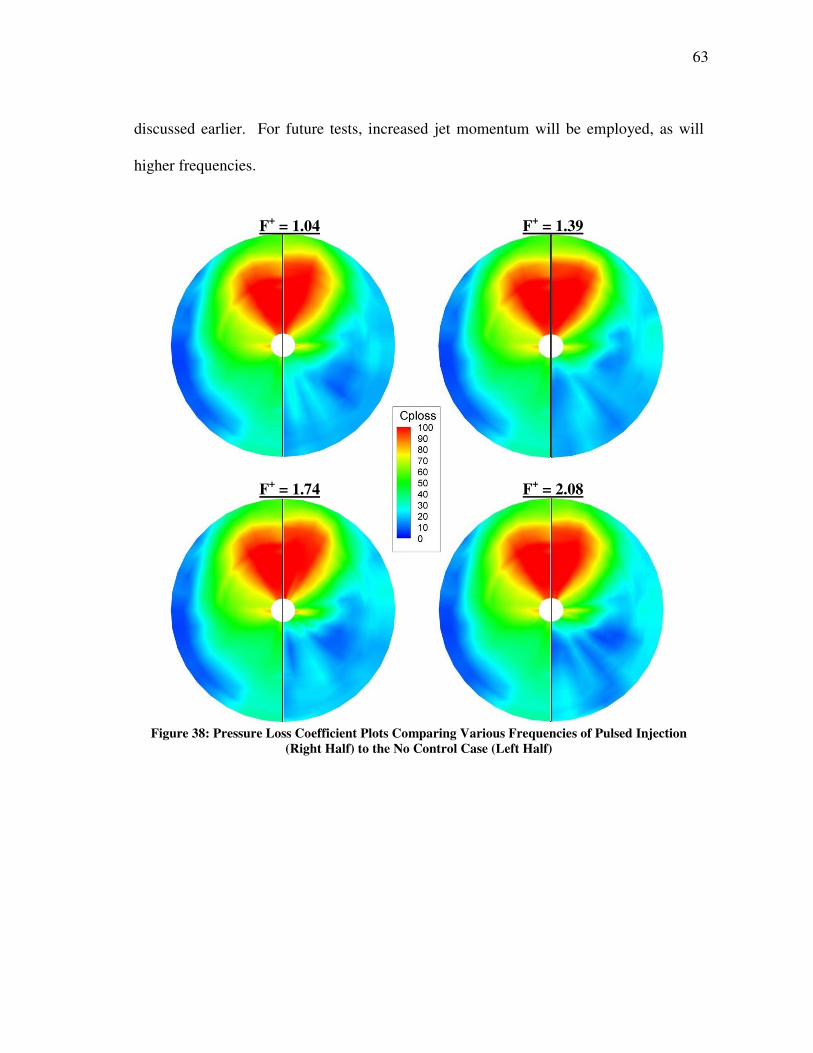
63
discussed earlier. For future tests, increased jet momentum will be employed, as will
higher frequencies.
Figure 38: Pressure Loss Coefficient Plots Comparing Various Frequencies of Pulsed Injection
(Right Half) to the No Control Case (Left Half)
F+ = 1.04 F+ = 1.39
F+ = 1.74 F+ = 2.08

64
CONCLUSIONS AND RECOMMENDATIONS Within this final section, a summary of the results obtained in this document will
be presented. Conclusions will be derived from the work, and a set of recommendations
for future efforts relating to the research project will be discussed.
Conclusions
A study was performed to gain an understanding of the development and
suppression of the secondary flows within a compact, serpentine inlet. Several methods
of analysis were employed to characterize the flow mechanics before an investigation
was launched to determine the effects of various flow control technologies on the duct
performance. The advantages provided by S-shaped inlets include reduced radar cross-
section and smaller, lighter, and cheaper air vehicles. The benefits of this study could
allow future unmanned aircraft to incorporate this type of jet engine inlet without
sacrificing fuel efficiency, engine performance, and longevity.
Experiments run using a baseline duct model revealed the existence of two, large,
counter-rotating vortices at the engine face that were produced by the second bend of the
inlet. Flow control was instituted at each of the bends of the duct in an attempt to
eliminate these vortices. A modular fluidic actuator system was designed to conform to
the inlet shape and allow the exploration of three methods of flow control: suction only,
suction and steady blowing, and suction and pulsed blowing. Bench top tests showed
that, for the slot configuration used in this study, maximum steady jet velocities of just
over 40 m/s were possible for sustainable fan speeds. The unsteady injection velocity
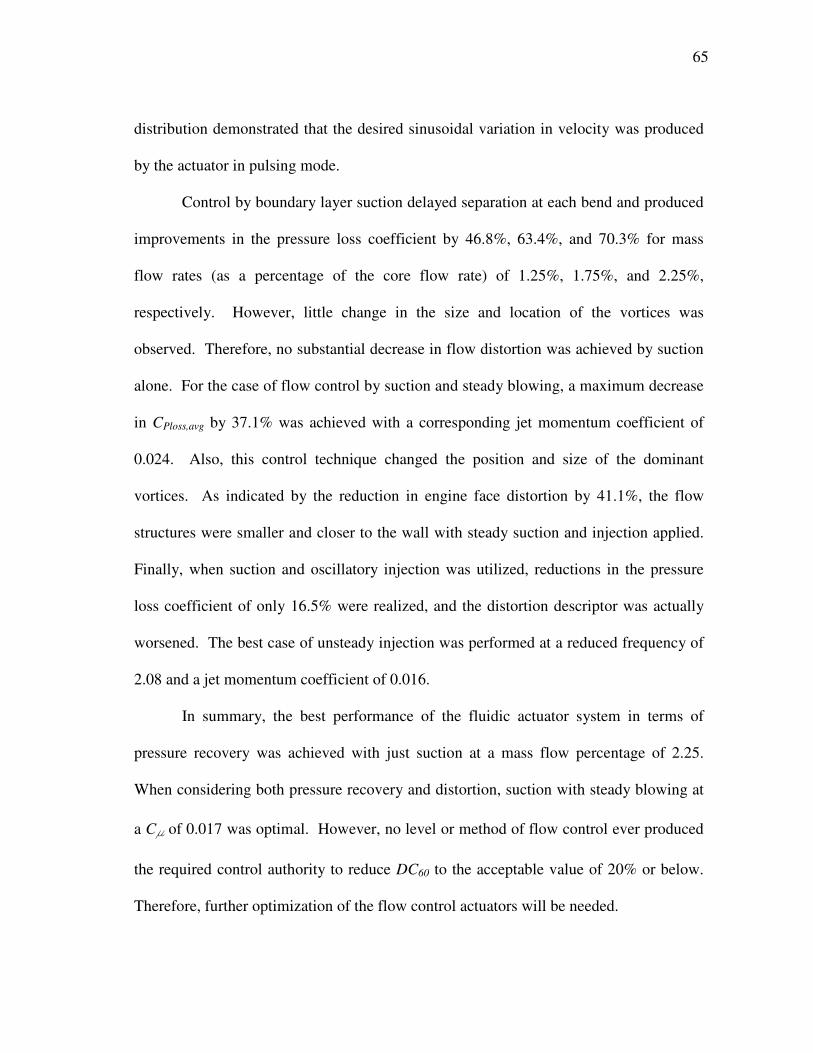
65
distribution demonstrated that the desired sinusoidal variation in velocity was produced
by the actuator in pulsing mode.
Control by boundary layer suction delayed separation at each bend and produced
improvements in the pressure loss coefficient by 46.8%, 63.4%, and 70.3% for mass
flow rates (as a percentage of the core flow rate) of 1.25%, 1.75%, and 2.25%,
respectively. However, little change in the size and location of the vortices was
observed. Therefore, no substantial decrease in flow distortion was achieved by suction
alone. For the case of flow control by suction and steady blowing, a maximum decrease
in CPloss,avg by 37.1% was achieved with a corresponding jet momentum coefficient of
0.024. Also, this control technique changed the position and size of the dominant
vortices. As indicated by the reduction in engine face distortion by 41.1%, the flow
structures were smaller and closer to the wall with steady suction and injection applied.
Finally, when suction and oscillatory injection was utilized, reductions in the pressure
loss coefficient of only 16.5% were realized, and the distortion descriptor was actually
worsened. The best case of unsteady injection was performed at a reduced frequency of
2.08 and a jet momentum coefficient of 0.016.
In summary, the best performance of the fluidic actuator system in terms of
pressure recovery was achieved with just suction at a mass flow percentage of 2.25.
When considering both pressure recovery and distortion, suction with steady blowing at
a C� of 0.017 was optimal. However, no level or method of flow control ever produced
the required control authority to reduce DC60 to the acceptable value of 20% or below.
Therefore, further optimization of the flow control actuators will be needed.
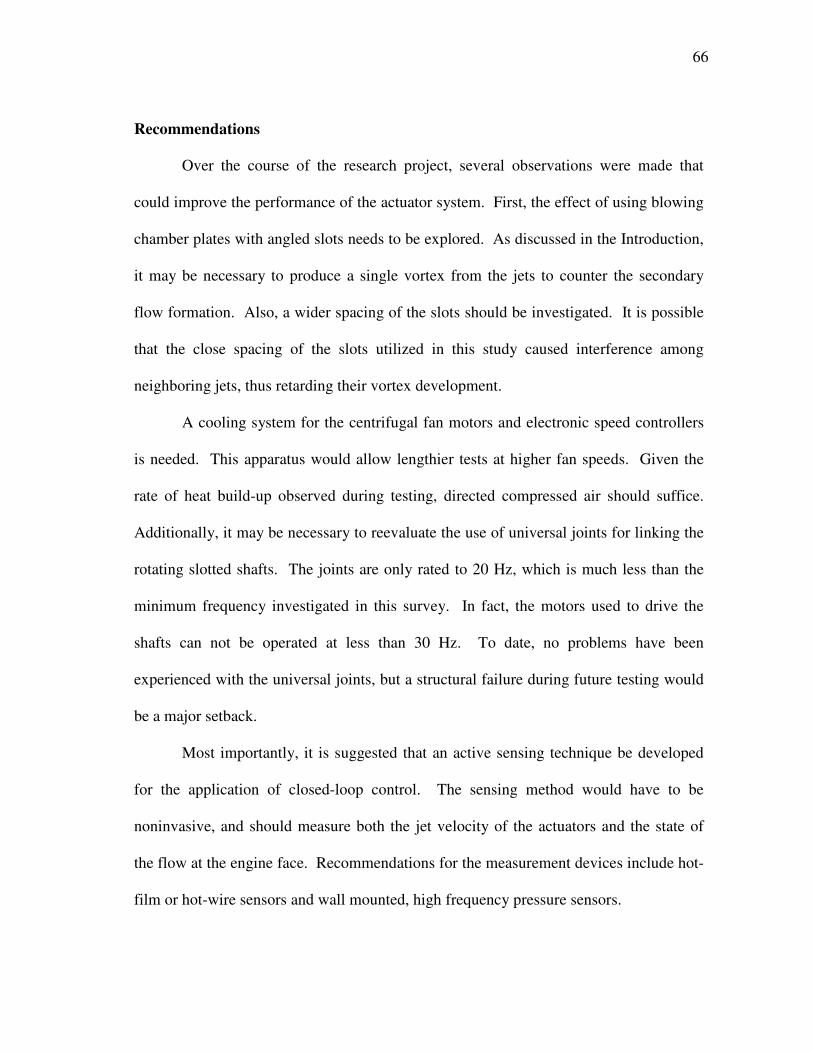
66
Recommendations
Over the course of the research project, several observations were made that
could improve the performance of the actuator system. First, the effect of using blowing
chamber plates with angled slots needs to be explored. As discussed in the Introduction,
it may be necessary to produce a single vortex from the jets to counter the secondary
flow formation. Also, a wider spacing of the slots should be investigated. It is possible
that the close spacing of the slots utilized in this study caused interference among
neighboring jets, thus retarding their vortex development.
A cooling system for the centrifugal fan motors and electronic speed controllers
is needed. This apparatus would allow lengthier tests at higher fan speeds. Given the
rate of heat build-up observed during testing, directed compressed air should suffice.
Additionally, it may be necessary to reevaluate the use of universal joints for linking the
rotating slotted shafts. The joints are only rated to 20 Hz, which is much less than the
minimum frequency investigated in this survey. In fact, the motors used to drive the
shafts can not be operated at less than 30 Hz. To date, no problems have been
experienced with the universal joints, but a structural failure during future testing would
be a major setback.
Most importantly, it is suggested that an active sensing technique be developed
for the application of closed-loop control. The sensing method would have to be
noninvasive, and should measure both the jet velocity of the actuators and the state of
the flow at the engine face. Recommendations for the measurement devices include hot-
film or hot-wire sensors and wall mounted, high frequency pressure sensors.

67
REFERENCES 1 Hamstra, J. W., Miller, D. N., Truax, P. P., Anderson, B. A. and Wendt, B. J., “Active Inlet Flow Control Technology Demonstration,” ICAS Paper 2000-6.11.2, August 2000. 2 Anabtawi, A. J., Blackwelder, R. F., Liebeck, R. H. and Lissaman, P. B. S., “Experimental Investigation of Boundary Layer Ingesting Diffusers of a Semi-Circular Cross Section,” AIAA Paper 98-0945, January 1998. 3 MacMartin, D. G., Murray, R. M., Verma. A. and Paduano, J. D., “Active Control of Integrated Inlet / Compressor Systems: Initial Results,” FEDSM2001-18275, June 2001. 4 Anabtawi, A. J., Blackwelder, R. F., Lissaman, P. B. S. and Liebeck, R. H., “An Experimental Study of Vortex Generators in Boundary Layer Ingesting Diffusers with a Centerline Offset,” AIAA Paper 99-2110, June 1999. 5 Reichert, B. A. and Wendt, B. J., “Improving Diffusing S-Duct Performance by Secondary Flow Control,” AIAA Paper 94-0365, January 1994. 6 Vakili, A. D., Wu J. M., Liver, P. and Bhat, M. K., “Experimental Investigation of Secondary Flows in a Diffusing S-Duct,” The University of Tennessee Space Institute Technical Report UTSI 86/14, 1984. 7 Wendt, B. J. and Reichert, B. A., “The Effects of Vortex Ingestion on the Flow in a Diffusing S-Duct,” NASA Technical Memorandum 106652, June 1994. 8 Reichert, B.A. and Wendt, B.J., “An Experimental Investigation of S-Duct Flow Control Using Arrays of Low Profile Vortex Generators,” NASA Technical Memorandum 106030, January 1993. 9 Tindell, R. H., “Highly Compact Inlet Diffuser Technology,” Journal of Propulsion, Vol. 4, No. 6, pp. 557-563, December 1988. 10 Kumar, V. and Alvi, F. S., “Use of Supersonic Microjets for Active Separation Control in Diffusers,” AIAA Paper 2003-4160, June 2003. 11 Kumar, V. and Alvi, F. S., “Efficient Control of Separation Using Microjets,” AIAA Paper 2005-4879, June 2005. 12 Anderson, B. H. and Gibb, J., “Study on Vortex Generator Flow Control for the Management of Inlet Distortion,” Journal of Propulsion and Power, Vol. 9, No. 3, pp. 422-430, June 1993.
68
13 Anderson, B. H. and Gibb, J., “Vortex-Generator Installation Studies on Steady-State and Dynamic Distortion,” Journal of Aircraft, Vol. 35, No. 4, pp. 513-520, August 1998. 14 Jenkins, L. N., Althoff Gorton, S. and Anders, S. G., “Flow Control Device Evaluation for an Internal Flow with an Adverse Pressure Gradient,” AIAA Paper 2002-0266, January 2002. 15 Harper, D. K., “Boundary Layer Control and Wall-Pressure Fluctuations in a Serpentine Inlet,” M.S. Thesis, Mechanical Engineering Department, Virginia Polytechnic Institute and State University, Blacksburg, VA, May 2000. 16 Bridges, A. and Smith, D. R., “The Influence of Orifice Orientation on the Interaction of a Synthetic Jet with a Turbulent Boundary Layer,” AIAA Paper 2001-2774, June 2001. 17 Collie, W. V., Burgun, R., Heinzen, S. N., Hall Jr., C. E. and Chokani, N., “Advanced Propulsion System Design and Integration for a Turbojet Powered Unmanned Aerial Vehicle,” AIAA Paper 2003-0415, January 2003. 18 Gilarranz, J. L. and Rediniotis, O. K., “Compact, High-Power Synthetic Jet Actuators for Flow Separation Control,” AIAA Paper 2001-0737, January 2001. 19 Gilarranz, J. L., Traub, L. W. and Rediniotis, O. K., “Characterization of a Compact, High-Power Synthetic Jet Actuator for Flow Separation Control,” AIAA Paper 2002-0127, January 2002. 20 Seifert, A. and Pack, L., “Oscillatory Excitation of Unsteady Compressible Flows Over Airfoils at Flight Reynolds Number”, AIAA Paper 99-0925, January 1999. 21 Glezer, A., “Shear Flow Control Using Synthetic Jet Fluidic Actuator Technology,” AFOSR Final Technical Report, July 1999. 22 Amitay, M., Pitt, D., Kibens, V., Parekh, D. and Glezer, A., “Control of Internal Flow Separation Using Synthetic Jet Actuators,” AIAA Paper 2000-0903, January 2000. 23 SAE Committee S-16, Turbine Engine Inlet Flow Distortion, “Aerospace Recommended Practice: Gas Turbine Engine Inlet Flow Distortion Guidelines,” ARP 1420, Society of Automotive Engineers, June 1977. 24 Johansen, E. S., Rediniotis, O. K. and Jones, G., “The Compressible Calibration of Miniature Multi-Hole Probes,” Journal of Fluids Engineering, Vol. 123, pp. 128-138, March 2001.

69
25 Kline, S. J. and McClintock, F. A., “Describing Uncertainties in Single-Sample Experiments,” Mechanical Engineering, Vol. 75, pp. 3-8, January 1953. 26 Kerrebrock, J. L., Drela, M., Merchant, A. A. and Schuler, B. J., “A Family of Designs for Aspirated Compressors,” ASME 98-GT-196, 1998. 27 Poisson-Quinton, Ph. and Lepage, L., “Survey of French Research on the Control of Boundary Layer and Circulation,” Boundary Layer and Flow Control, Vol. 1, Pergamon Press, New York, 1961. 28 Greenblatt, D. and Wygnanski, I. J., “The Control of Flow Separation by Periodic Excitation,” Progress in Aerospace Sciences, Vol. 36, pp. 487-545, 2000. 29 Mittal, R., Kotapati, R. B. and Cattafesta III, L. N., “Numerical Study of Resonant Interactions and Flow Control in a Canonical Separated Flow,” AIAA Paper 2005-1261, January 2000.

70
VITA Name: Aaron Michael Kirk Address: H.R. Bright Building, Rm. 701 3141 TAMU College Station, TX 77843-3141 Education: B.S., Aerospace Engineering, Texas A&M University, 2003 M.S., Aerospace Engineering, Texas A&M University, 2006