Embed Size (px)
Citation preview
' i
AD-A019 503
INVESTIGATION OF K(o) TESTING IN COHESIONLESS SOILS
Mosald M. A1-Hussa1n1, et al
Army Engineer Waterways Experiment Station Vlcksburg, Mississippi
December 1975
DISTRIBUTED BY:
urn National Technical Information Service U. S. DEPARTMENT OF COMMERCE
Approved For Public Release; Distribution Unlimited
Prepared tor Assistant Secretary of the Army (R&D) Washington, D. C. 20314
Under Project No. 4 A 0 6 I I 0 I A 9 I D Reproduced by
NATIONAL TECHNICAL INFORMATION SERVICE
U S Department of Commorce Springfield, VA. 22151
IN
TECHNICAL REPORT S-75-16
INVESTIGATION OF K0 TESTING COHESIONLESS SOILS
Mosaid M. Ai-Hussaini, Frank C. Townsend
Soils and Pavements Laboratory U. S. Army Engineer Waterways Experiment Station
P. O . Box 631, Vicksburg, Miss. 39180
D«c«mb«r 1975
UnclRfialfMprt MCumrv CLASHncATioM or THII PAOI Chm Dm» «»>•<««
REPORT DOCUMENTATION PAGE I. NIPORT NUMIKN
Technical Report S-75-lt)
2. OOVT ACCEHIOH NO
4. TITLE (m* SuMKI«)
INVESTIGATION OF K TESTING IN COHESIONLESS SOILS o
7. AUTHOftflJ
Mosaid M. Al-Hussalni Frank C. Townsend
t. PCnrORMINa ONOANIZATION NAME AMD AOORCSS
U. S. Army Engineer Waterways Experiment Station Soils and Pavements Laboratory P. 0. Box 631, Vicksburg. Miss. 39180 H, CONTNOLLINO OFFICE NAME ANO AOORESS
Assistant Secretary of the Army (P&D) Washington, D. C. 2031U 14. MONITORINO AOENCV NAME A AOORESSCI/ dltltnnl Inm Conimlllnt Olllem)
READ INSTRUCTIONt BEFORE COMPLETPtQ TOIUi
I. NECIPIENT1^! CATALOG NUMIBII
f. TYPE OF REPORT 4 PERIOD COVERED
Final report 4. PCRFORMINO ORO. REPORT NUMBER
4. CONTRACT OR ORANT NUMRERr«)
10. PNOORAM ELEMENT. PROJECT, TASK AREA 4 WORK UNIT NUMBERS
Project No. l4A06ll01A91D
IS. REPORT DATE
Deeemi-er 1Q7S 11. NUMBER OF PAGES
72 IS. SECURITY CLASS, (ol thlt upon)
Unclassified ISa. OECLASSIFICATION/0O«N0RA0INa
SCHEDULE
14. DISTRIBUTION STATEMENT (ol thl» Ropott)
Approved for public release; distribution unlimited.
17. DISTRIBUTION STATEMENT (ol III« mbitttcl mltnd In Block 20, II dllloronl horn Ropott)
IS. SUPPLEMENTARY NOTES
19. KEY WORDS (Conllnum on lovotto »Id* II ntcftry and Idonllly by block numbor)
Coefficient of earth pressure Soil tests Earth pressure Stress-strain relations (soils) Noncohesive soils Sands
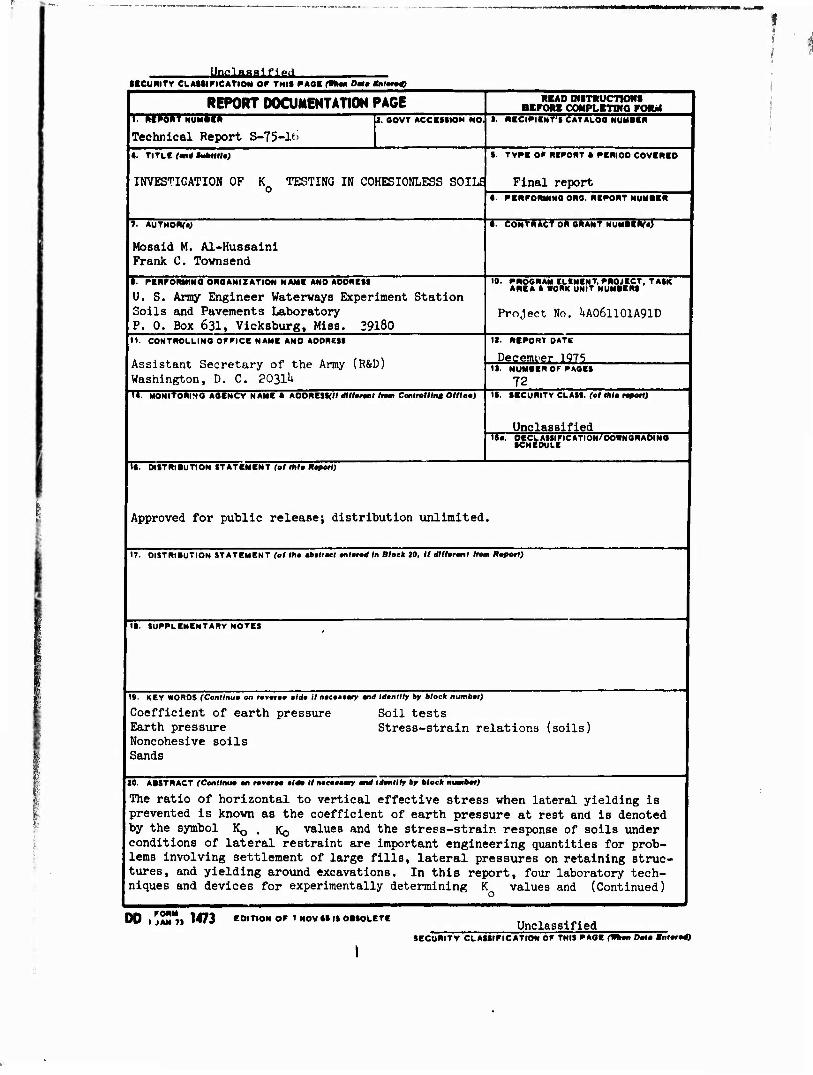
20. ABSTRACT fCandnua an ravaraa »Id» II nacaaaaty and Idonlllf by block numbtt)
The ratio of horizontal to vertical effective stress when lateral yielding is prevented is known as the coefficient of earth pressure at rest and is denoted by the symbol KQ . KQ values and the stress-strain response of soils under conditions of lateral restraint are important engineering quantities for prob- lems involving settlement of large fills, lateral pressures on retaining struc- tures, and yielding around excavations. In this report, four laboratory tech- niques and devices for experimentally determining K values and (Continued)
DO | j AN 7» 1473 EDITION OF I NOV 44 IS OBSOLETE Unclassified SECURITY CLASSIFICATION OF THIS PAOE (Whm Data Bntorod)
Unclassified «ICUHITV CLASSIFICATION OF THIS PAGE'Wian £>•
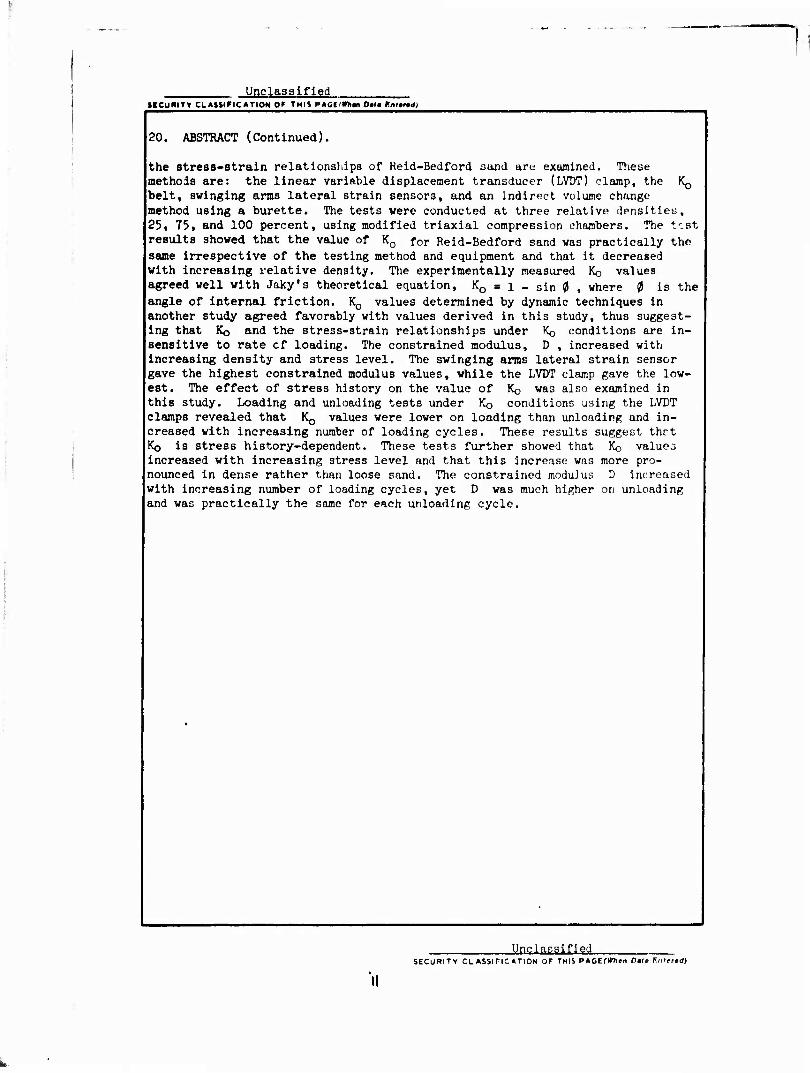
20. ABSTRACT (Continued).
the stress-strain relationships of Reid-Bedford aand aru examined. These methois are: the linear variable displacement transducer (LVDT) clamp, the K0
belt, swinging arms lateral strain sensors, and an indirect volume change method using a burette. The tests were conducted at three relative densities, 25, 75, and 100 percent, using modified triaxial compression chambers. The test results showed that the value of K0 for Reid-Bedford sand was practically the same irrespective of the testing method and equipment and that it decreased with increasing relative density. The experimentally measured KQ values agreed well with Jaky's theoretical equation, K0 = i _ sin 0 ! where 0 is the angle of internal friction. K0 values determined by dynamic techniques in another study agreed favorably with values derived in this study, thus suggest- ing that KQ and the stress-strain relationships under KQ conditions are in- sensitive to rate cf loading. The constrained modulus, D , increased with increasing density and stress level. The swinging arms lateral strain sensor gave the highest constrained modulus values, while the LVDT clamp gave the low- est. The effect of stress history on the value of Ko was also examined in this study. Loading and unloading tests under KQ conditions using the LVDT clamps revealed that K0 values were lower on loading than unloading and in- creased with increasing number of loading cycles. These results suggest thr.t KQ is stress history-dependent. These tests further showed that KQ valueJ increased with increasing stress level and that this increase was more pro- nounced in dense rather than loose sand. The constrained modulus D increased with increasing number of loading cycles, yet D was much higher on unloading and was practically the same for each unloading cycle.
Unclassified SECURITY CL ASSiriC ATION OF THIS PAGErWhsn C»l» Fmertd)
Destroy this report when no longer needed. Do not return it to the originator.
m'
THE CONTENTS OF THIS REPORT ARE NOT TO BE
USED FOR ADVERTISING, PUBLICATION, OR
PROMOTIONAL PURPOSES. CITATION OF TRADE
NAMES DOES NOT CONSTITUTE Ail OFFICIAL EN-
PORSEMENT OR APPROVAL OF THE USE OF SUCH
COMMERCIAL PRODUCTS.
rr J
PREFACE
The investigation reported herein was conducted under Department
of the Army Project No. UAO6ll01A91D, In-House laboratory Independent
Research (ILIR) Program, sponaored by the Asristant Secretary of the
Army (R&D). Authorization for the study was initally granted by WESVB
Disposition Form, dated 2 February 1972, subject: "In-House Laboratory
Independent Research Program FY 1973." Authorization for continuation
during 1971* was granted by WESVB Disposition Form, dated 2 June 1973,
subject: "In-House Laboratory Independent Research Progran FY 1971*."
This investigation was conducted curing the period August 1973-June 197'*
in the Soils and Pavements Laboratory, U. S. Army Engineer Waterways Ex-
periment Station (WES).
A one-dimensional compression testing device was designed at WES,
and the investigation was conducted by Dr. Mosaid M. Al-Hussaini assisted
by Mr. Willie J. Hughes, both of the Soils Research Facility. This re-
port was prepared by Dr. Al-Hussaini and Dr. Frank C. Townsend, Chief,
Soils Research Facility, under the general supervision of Mr. Clifford L.
McAnear, Chief, Soil Mechanics Division, and Mr. J. P. Sale, Chief, Soils
and Pavements Laboratory.
Director of WES during the investigation and preparation of this
report was COL G. H. Hilt, CE. Technical Director was Mr. P. R. Brown.
CONTENTS
Page
PREFACE 2
CONVERSION FACTORS, U. S. CUSTOMARY TO METRIC (SI) UNITS OF MEASUREMENT k
PART I: INTRODUCTION 5
Background 3 Objectives and Scope of Study 6
PART II: LITERATURE FSVIEW T
Scale Model Testing T Laboratory Testing 9 Field Measurement of K0 20 Theoretical Evaluation of K 27 o
PART III: MATERIAL, TESTING EQUIPMENT, AND PROCEDURES 32
Material 32 Testing Equipment 33 Test Procedures hi
PART IV: TEST RESULTS AND DISCUSSION OF EXPERIMENTAL RESULTS . . k3
Coefficient of Earth Pressure at Rest K 1+3 Stress-Strain Relationship 50 Factors Affecting K and Constrained Modulus 52 o
PART V: CONCLUSIONS AND RECOMMENDATIONS 66
Conclusions 66 Recommendations 67
REFERENCES 68
APPENDIX A: NOTATION
f
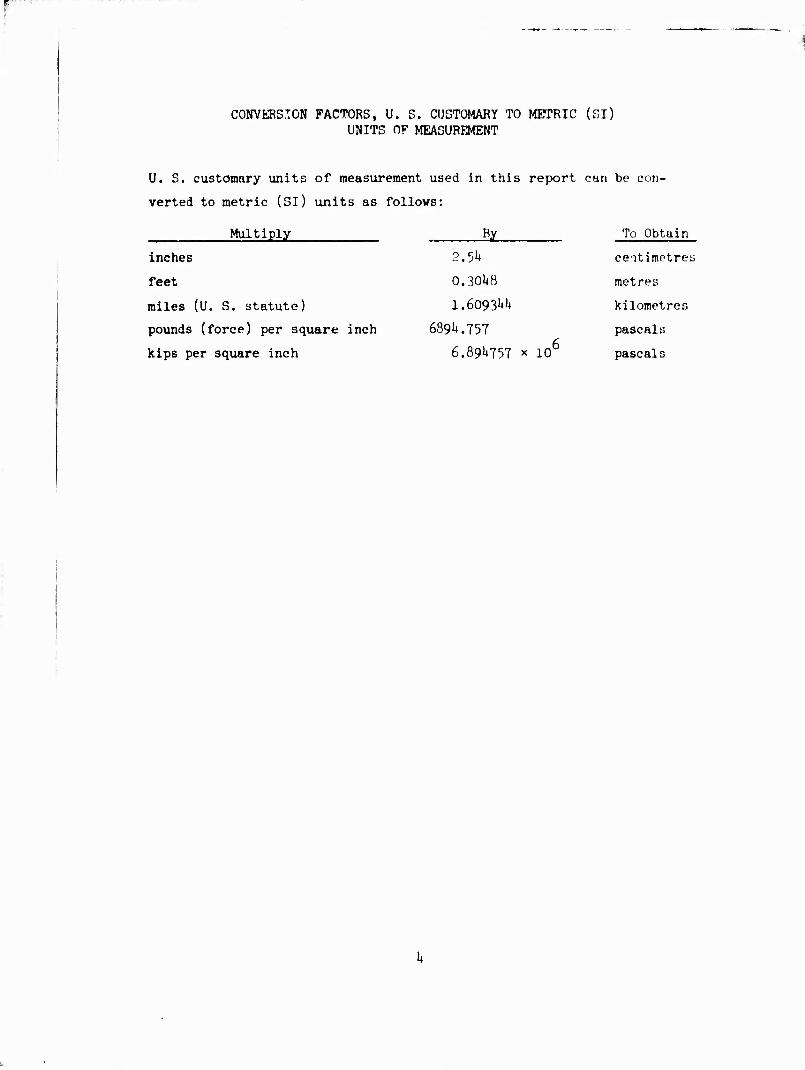
CONVERSION FACTORS, U. S. CUSTOMARY TO METRIC (Cl) UNITS OF MEASUREMENT
U. S. customary units of measurement used in this report can be con-
verted to metric (Si) units as follows:
Multiply By To Obtain
inches 2.5i4 ce-itimetres
feet 0.30^8 metres
miles (U. S. statute) 1.6093W kilometres
pounds (force) per square inch 68914.757
106
pascals
kips per square inch 6.89^757 x pascals
INVESTIGATION OF K TESTING IN COHESIONLESS SOILS o
PART I: INTRODUCTION
Background
1. The ratio of horizontal to vertical stress when lateral yield-
ing is prevented is known as the coefficient of earth pressure at rest
and in denoted by the symbol K ,* For elastic Isotropie materials
under first loading, the value of K can be expressed directly in
terms of Poisson's ratio v , e.g., K = v/l - v . Consequently, K
can be considered as an elastic soil parameter. Many naturally occurring
sediments as well as man-made fills are deposited and compacted in al-
most horizontal layers where little or no lateral yielding occurs.
Hence the value of K and stress-strain response of soils under con-
ditions of lateral restraint are important engineering considerationr,
for problems involving settlement of large fills, lateral pressures on
nonyielding retaining structures, and excavations. Furthermore, since
K is an elastic soil parameter, a knowledge of K is applicable to
static problems and many dynamic problems, e.g., the displacement in
laterally confined strata due to one-dimensional wave propagation.
2. The measurement of K in the laboratory as well as in the
field has always been of interest to engineers since stresses under K
conditions play a major role in the behavior of soil. Many methods and
testing devices have been developed Tot determining uniaxial stress-
strain and K values. In this context, the problem is to determine
which method and technique provide the best estimate of K and what r o factors significantly affect the measured values.
* For convenience, symbols and unusual abbreviations are listed and defined in the Notation (Appendix A).
Objectives and Scope of Study
3. The purpose of this study was to examine various experimental
and analytical methods used in evaluating K , Polsson's ratio, and the
stress-strain behavior of sands in one-dimensional compression. The var-
ious factors which affrct granular soil behavior under one-dimensional
compression were also investigated.
k. Because it is practically impossible to study the performance
of every device developed for measuring K in the laboratory, only
four devices were selected for this comparative study. The selected
methods and equipment were (a) the linear variable displacement trans-
ducer (LVDT) clamp, (b) the lateral strain sensor with strain gages,
(c) the indirect method which uses a burette to measure volume change,
and (d) swinging arms with external LVDT. Several granular materials
were selected for the test program; however, the bulk of the data was
generated from testing sand known locally as Reid-Bedford sand. Speci-
mens of Reid-Bedford sand were prepared at three densities—loose, me-
dium dense, and dense—and loaded in a triaxial compression device under
K conditions, o
WPIIiiHWWftWWIWMW
PART II: LITERATURE REVIEW
5. The purpose of this part is to review some of the significant
experimental and theoretical work on one-dimensionel compression (i.e.,
K ) characteristics of soils. All the work which has contributed to o the understanding of the behavior of soil under K conditions is not
included; only those investigations which seemed pertinent to this study
are reviewed.
Scale Model Testing
Experiments with retaining walls
6. The idea of testing soil under K conditions is not new. o
In fact, early tests on soil under no lateral yield were performed on
full-scale retaining walls in an effort to examine the effect of out-
ward yielding on the horizontal thrust exerted on the wall by the re-
tained soil. In early 1931*, Terzaghi presented test data on a model
retaining wall T ft* high and lk ft wide which could be moved inward,
outward, or tilted around the lower edge. Results on compacted sand
showed that inward movement of the wall for a distance of 0.001 h
(where h is the depth of the fill) increased the ratio of lateral soil
pressure to the assumed hydrostatic pressure by 2-2.5 times, while out-
ward movement by the same amount decreased the lateral pressure ratio to 2
about 0.1 over that of a nonyielding wall. Rinkert conducted studies
on a reinforced concrete cantilever retaining wall 2.0 m high, 6.0 m
long, and 0.2 m wide. The wall surface was covered with sheet metal
coated with grease to reduce wall friction with the filling materiel.
Two materials were used in the test program. One material ^as crushed
stone ranging from 3.2 to 6.h cm in diameter, and the other was rounded
pebbles ranging from 1.6 to 3.2 cm in diameter. The results showed that
an average outward movement of 1/3000 of the wall height for the crushed
* A table of factors for converting U. S. customary units of measure- ment to metric (SI) units is presented on page h.
stone and 1/800 of the wall height for the pebbles was sufficient to in-
duce an active state of stress in the backfill material.
Effect of lateral movement
7. The studies by Terzaghi and Rinkert demonstrated the dependency
ol' the lateral earth pressure of a backfill material on the amount and
direction of yielding of a retaining structure. They clearly indicated
that very small movements in the retaining wall may change the state
of stress in the fill material to either the passive or active state
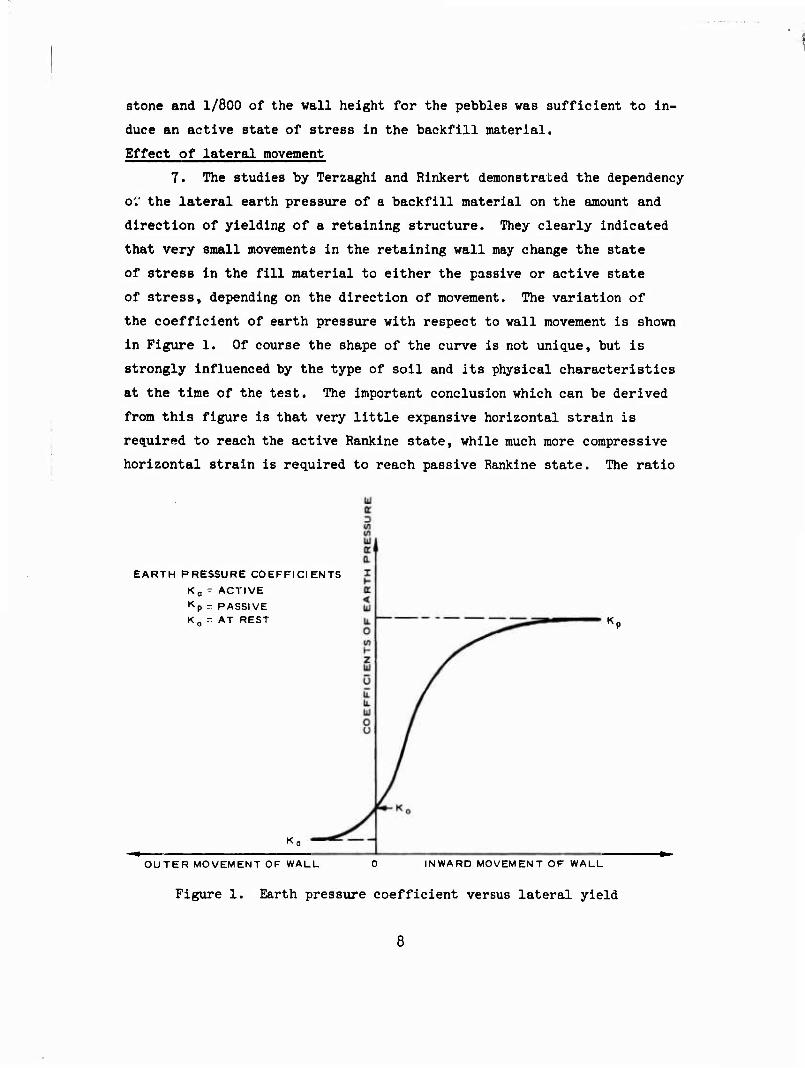
of stress, depending on the direction of movement. The variation of
the coefficient of earth pressure with respect to wall movement is shown
in Figure 1. Of course the shape of the curve is not unique, but is
strongly influenced by the type of soil and its physical characteristics
at the time of the test. The important conclusion which can be derived
from this figure is that very little expansive horizontal strain is
required to reach the active Rankine state, while much more compressive
horizontal strain is required to reach passive Rankine state. The ratio
EARTH PRESSURE COEFFICIENTS
Ka = ACTIVE Kp = PASSIVE K„ - AT REST
OUTER MOVEMENT OF WALL 0 IN WARD MOVEM EN T OF WALL
Figure 1. Earth pressure coefficient versus lateral yield
8
of the horizontal strains for the passive sxote to those of the active
state varies vith density of material and type of soil considered.
According to Mackey and Kirk, this ratio may vary from about U for dense
sand Increasing to about 30 for loose sand.
8. The classic method of designing retaining vails, which is
still practiced by many designers, is to assume that the soil behind the
retaining wall is in cm active state of stress regardless of the mag-
nitude of the movement required to produce the active state of stress.
In cases in which the magnitude of lateral movement is limited, the as-
sumption of an active state of stress could be dangerous since this
assumption greatly underestimates the magnitude of the actual lateral
pressure acting on the wall. The knowledge of the value of K in such
cases is vital.
Laboratory Testing
9. Two conditions must be satisfied in testing soils under K
conditions: (a) lateral yielding must be of negligible magnitude and
(b) the soil must deform freely in the axial direction (i.e., no
friction or other interference from the testing equipment). Previous
investigators have employed numerous devices and methods for testing
soils; some of the devices are described herein.
Classic methods
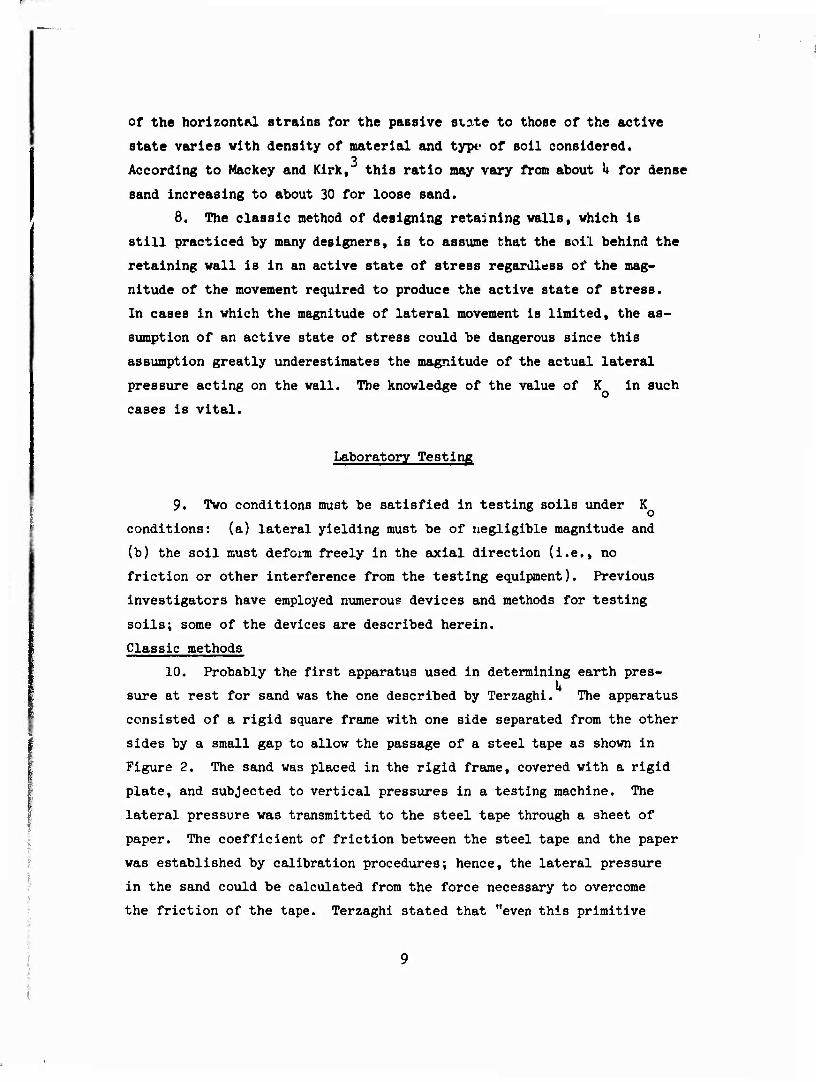
10. Probably the first apparatus used in determining earth pres- k
sure at rest for sand was the one described by Terzaghi. The apparatus
consisted of a rigid square frame with one side separated from the other
sides by a small gap to allow the passage of a steel tape as shown in
Figure 2. The sand was placed in the rigid frame, covered with a rigid
plate, and subjected to vertical pressures in a testing machine. The
lateral pressure was transmitted to the steel tape through a sheet of
paper. The coefficient of friction between the steel tape and the paper
was established by calibration procedures; hence, the lateral pressure
in the sand could be calculated from the force necessary to overcome
the friction of the tape. Terzaghi stated that "even this primitive
9
PULLEY
RIGID FRAME
SHEET OF PAPER
STEEL TAPE
Figure 2. Terzaghi apparatus for determining earth pressure at rest
apparatus furnished very satisfactory results."
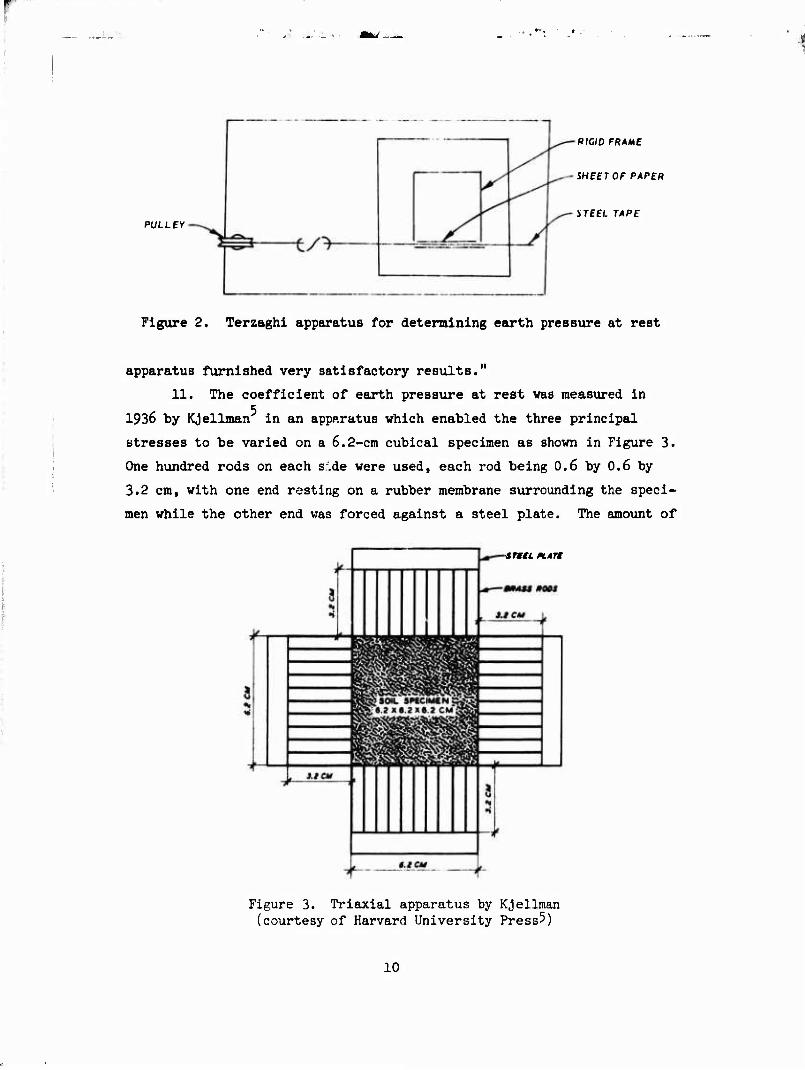
11. The coefficient of earth pressure at rest was measured in
1936 by KJellman in an apparatus which enabled the three principal
stresses to be varied on a 6.2-cra cubical specimen as shown in Figure 3.
One hundred rods on each side were used, each rod being 0.6 by 0,6 by
3.2 cm, with one end resting on a rubber membrane surrounding the speci-
men while the other end was forced against a steel plate. The amount of
snei Htrt
Figure 3. Triaxial apparatus by KJellman (courtesy of Harvard University Press5)
10
stress applied on each side of the specimen was calculated from the mea-
surements of the toted force applied to the rods, and the deformation
within the soil was calculated from the relative movement of each steel
plate from Its original position. The apparatus was not widely used
simply because of the difficulties Involved in preparing the specimen.
The significant observation from the KJellman test was that the value
of K was found to Increase with increasing overconsolidatlon ratio
for sand.
Modern techniques
12. Since the early experimental work of Terzaghl and KJellman
for determining the ccefficlent of earth pressure at rest, many new
techniques and devices for measuring K have evolved. These new pro-
cedures can be divided into the following categories:
ii. Modified odometer test
b. Modified triaxlal compression test
£. Indirect or burette method
d. Other methods
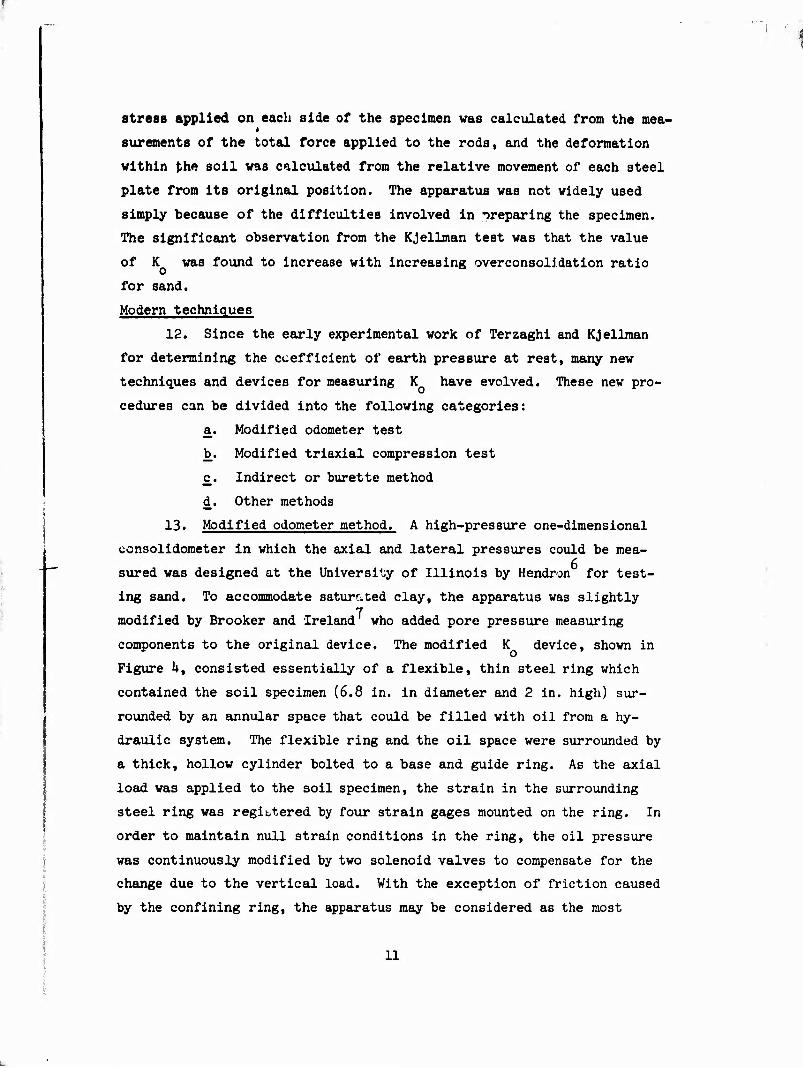
13. Modified odometer method. A high-pressure one-dimensional
consolidometer in which the axial and lateral pressures could be mea-
sured was designed at the University of Illinois by Hendron for test-
ing sand. To accommodate saturated clay, the apparatus was slightly 7
modified by Brooker and Ireland who added pore pressure measuring
components to the original device. The modified K device, shown in
Figure kt consisted essentially of a flexible, thin steel ring which
contained the soil specimen (6.8 in. in diameter and 2 in. high) sur-
rounded by an annular space that could be filled with oil from a hy-
draulic system. The flexible ring and the oil space were surrounded by
a thick, hollow cylinder bolted to a base and guide ring. As the axial
load was applied to the soil specimen, the strain in the surrounding
steel ring was registered by four strain gages mounted on the ring. In
order to maintain null strain conditions in the ring, the oil pressure
was continuously modified by two solenoid valves to compensate for the
change due to the vertical load. With the exception of friction caused
by the confining ring, the apparatus may be considered as the most
11
GROOVE FOROuner OF
STRAIN CACf. LfADS"
>l6MErALFO/l. STRAIN Yy CAGES ON INSIDE OF / LOADING HEAD /. CONNECTED IN SERIES— /.
GROOVE FOR 1/4-IN. OD COPPER ruafs
• LOADING MEAD
'GUIDE RING
•I/2-IN.-DIAM. HIGH-STRENGTH STEEL BOLTS
WALL
-3/8-/N. NPT FOR 8LACKHAWK FITTING
•BASE DRAIN CONNECTION
3/*~ltl.-DIAM. HICH-iTRENCTh STEEL BOLTS
NOTE ©TO® ARE O-RING SEALS.
Figure k. University of Illinois K apparatus (after Reference 7)
suitable for testing soil under high pressure.
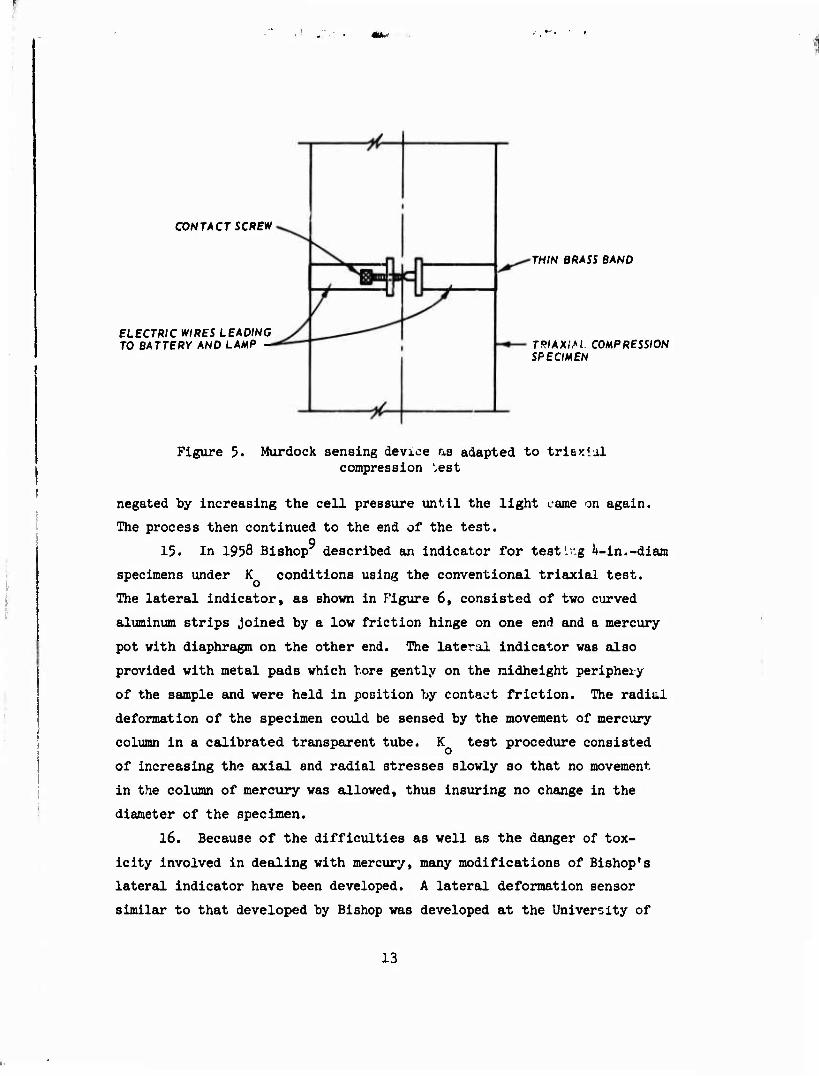
lU. Modified triaxial compression test. In view of difficulties
associated with side friction and in placing undisturbed samples con-
taining small stones in the conventional consolidometer, a special K 8 o
testing apparatus was devised by Murdock. The apparatus used was a
modified triaxial compression apparatus in which a sensing device was
added to detect the change in the diameter of the soil specimen during
testing. The sensing device consisted of a thin metal band with an
adjustable contact screw and two wires leading to a battery and lamp as
shown in Figure 5. As axial load was applied to the specimen, any ten-
dency on the part of the specimen to bulge caused breaking of the elec-
trical contact and put out the li^ht. This small change in diameter was
12
CONTACT SCREW
ELECTRIC WIRES LEADING TO BATTERY AND LAMP
THIN BRASS BAND
TRIAXIM COMPRESSION SPECIMEN
Figure 5. Murdock sensing device as adapted to triexlul compression '.est
negated by increasing the cell pressure until the light came on again.
The process then continued to the end of the test.
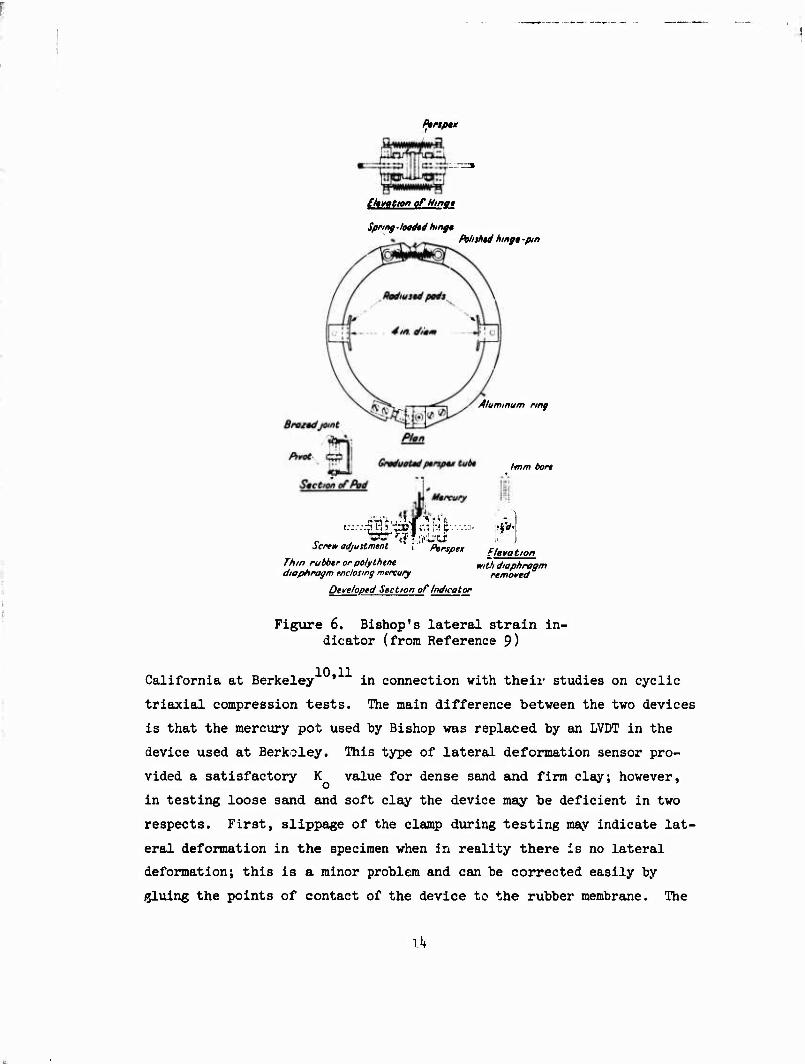
15. In 1958 Bishop described an indicator for testing lt-in.-diam
specimens under K conditions using the conventional triaxial test.
The lateral indicator, as shown in Figure 6, consisted of two curved
aluminum strips Joined by a low friction hinge on one end and a mercury
pot with diaphragm on the other end. The lateral indicator was also
provided with metal pads which bore gently on the raidheight periphery
of the sample and were held in position by contaot friction. The radial
deformation of the specimen could be sensed by the movement of mercury
column in a calibrated transparent tube. K test procedure consisted
of increasing the axial and radial stresses slowly so that no movement
in the column of mercury was allowed, thus insuring no change in the
diameter of the specimen.
16. Because of the difficulties as well as the danger of tox-
icity involved in dealing with mercury, many modifications of Bishop's
lateral indicator have been developed. A lateral deformation sensor
similar to that developed by Bishop was developed at the University of
13
Pirtpvr
£/»vation ofMinot
Spnng-loadtd hing* Mihtd hing» -pin
Aluminum ring
l-mm bort
icrrw adjustment , Persptt
Thin rutber or polythene diaphragm enclosing mercury
Developed Section of Indicator
IV,
fleva t ion wit'i diaphragm
removed
Fig\ire 6. Bishop's lateral strain in- dicator (from Reference 9)
California at Berkeley ' in connection with their studies on cyclic
triaxial compression tests. The main difference between the two devices
is that the mercury pot used by Bishop was replaced by an LVDT in the
device used at Berkeley. This type of lateral deformation sensor pro-
vided a satisfactory K value for dense sand and firm clay; however,
in testing loose sand and soft clay the device may be deficient in two
respects. First, slippage of the clamp during testing may indicate lat-
eral deformation in the specimen when In reality there is no lateral
deformation; this is a minor problem and can be corrected easily by
gluing the points of contact of the device to the rubber membrane. The
il*
I i
second problem is that loose sand and soft clay may yield at points of
contact between the specimen and the sensor. This problem can be solved
by enlarging the contact surface area or by using another lateral defor-
mation sensing device called the K belt. A lateral deformation
sensing device similar to that used at Berkeley was constructed at the
U. S. Army Engineer Waterways Experiment Station (WES) and has been
selected for comparative study and evaluation in this report.
17. The K belt has been used at WES to obtain K values for 0 o
granular materials. The K belt consisted of a thin metal band Instru-
mented with four strain gages and placed around the middle of triaxlal
specimens; more detailed description of the device is presented In
Reference 12. The WES K belt was used in this study, and the results
will be presented In later parts of this report. Another K belt
which Is siui±2ex In many respects to the WES K belt was described
by Moore.
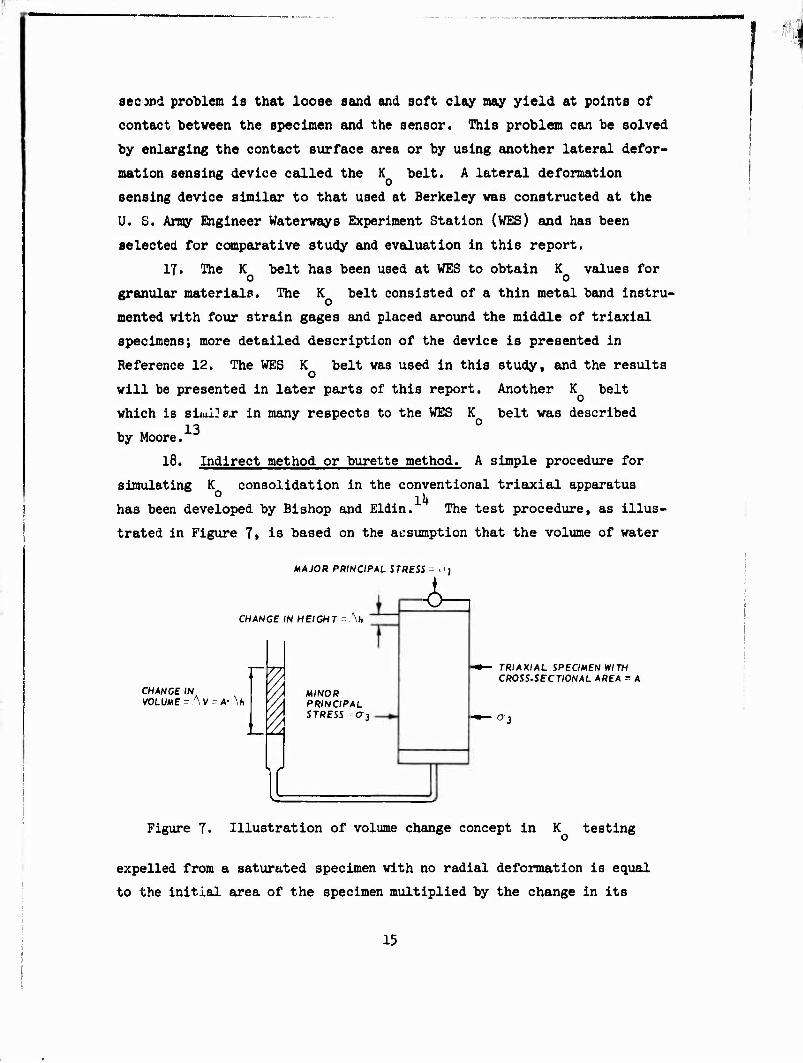
18. Indirect method or burette method. A simple procedure for
simulating K consolidation in the conventional triaxlal apparatus 0 ll*
has been developed by Bishop and Eldln. The test procedure, as illus-
trated In Figure 7» is based on the atrsumption that the volume of water
/MAJOR PRINCIPAL STRESS = Oj
CHANGE IN HEIGHT- \h
CHANCE IN VOLUME = \V - A- \h
I
MINOR PRINCIPAL STRESS -CTj
TRIAXIAL SPECIMEN WITH CROSS-SECTIONAL AREA = A
Figure 7. Illustration of volume change concept in K testing
expelled from a saturated specimen with no radial deformation is equal
to the Initial area of the specimen multiplied by the change in its
15
t.*:-i-'
height. Therefore, K conditions could be maintained by Increasing
the radial and axial stresses such that the volume change indicated by
the burette corresponds to the vertical deformation of the sample. The
most attractive feature of the Indirect test method is its simplicity.
The device requires nothing more than a burette, vhich is usually in-
corporated in most trlaxlal cells, for measuring volume change. For
this reason alone, the test was chosen for comparison with other testing
techniques presented in this study. The test, however, has been criti-
cized by Andrawes and El-Sohby ^ as it takes a long time to conduct the
test on cohesive soil In which no appreciable hydraulic gradient is
allowed. The test procedure Is not applicable for testing partially
saturated clay or dry sand. In tests of saturated granular soil, care-
ful correction should be made to the volume change due to both membrane
penetration and water evaporation from the burette.
19. Modified trlaxlal apparatus with swinging arms. A new de-
vice for consolidating cylindrical specimens of cohesive soil under K
conditions was developed at Purdue University. The device, as described
by Holtz, consisted of two arms placed in contact with the specimen in
a conventional triaxial apparatus. The two arms were supported on two
posts which passed through the base of the triaxial cell and were con-
nected to an LVDT. Any lateral movement in the soil specimen during
the test would cause the arms to rotate, which in turn was measured by
the LVDT. The LVDT was monitored with a voltmeter, while em air pres-
sure regulator was adjusted manually to keep the voltmeter as close as
possible to the null value during the test. This swinging arms concept
was adopted by WES, and a new triaxial cell equipped with this nulling
device was constructed for comparative study of K in this report.
The major advantage of the swinging arm K device is that the LVDT is o placed outside the trlaxlal cell, which eliminates the influence of con-
fining fluid on the nulling device used in the test.
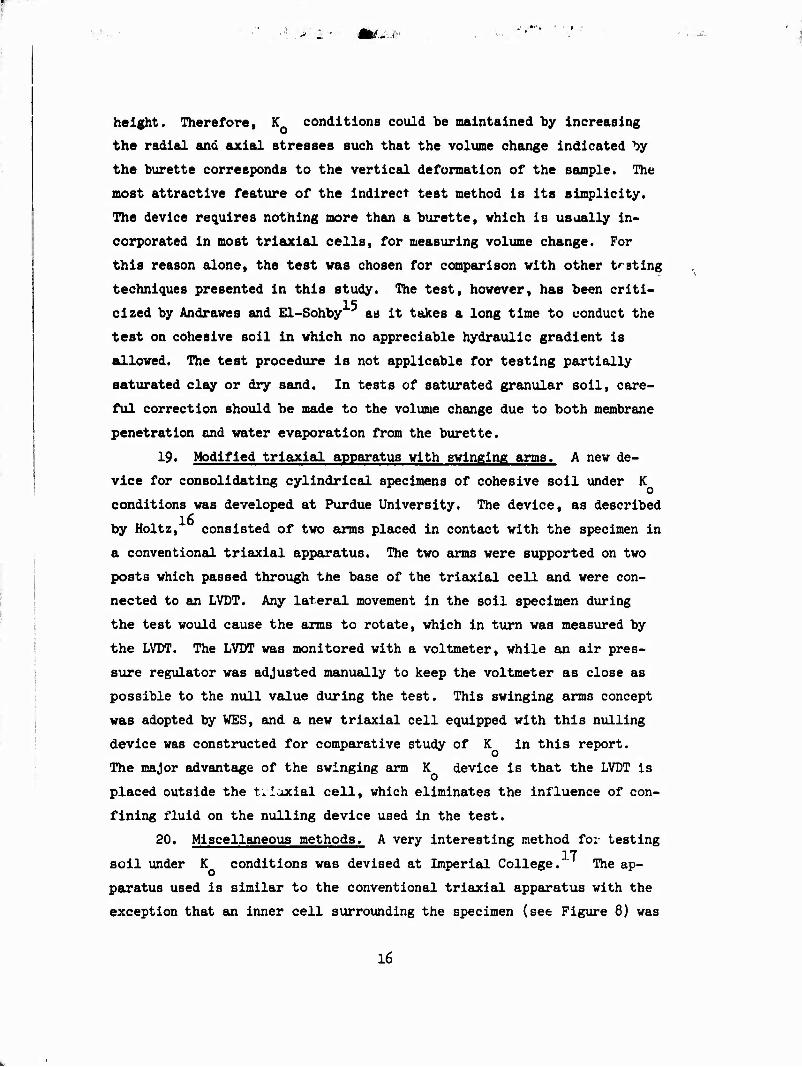
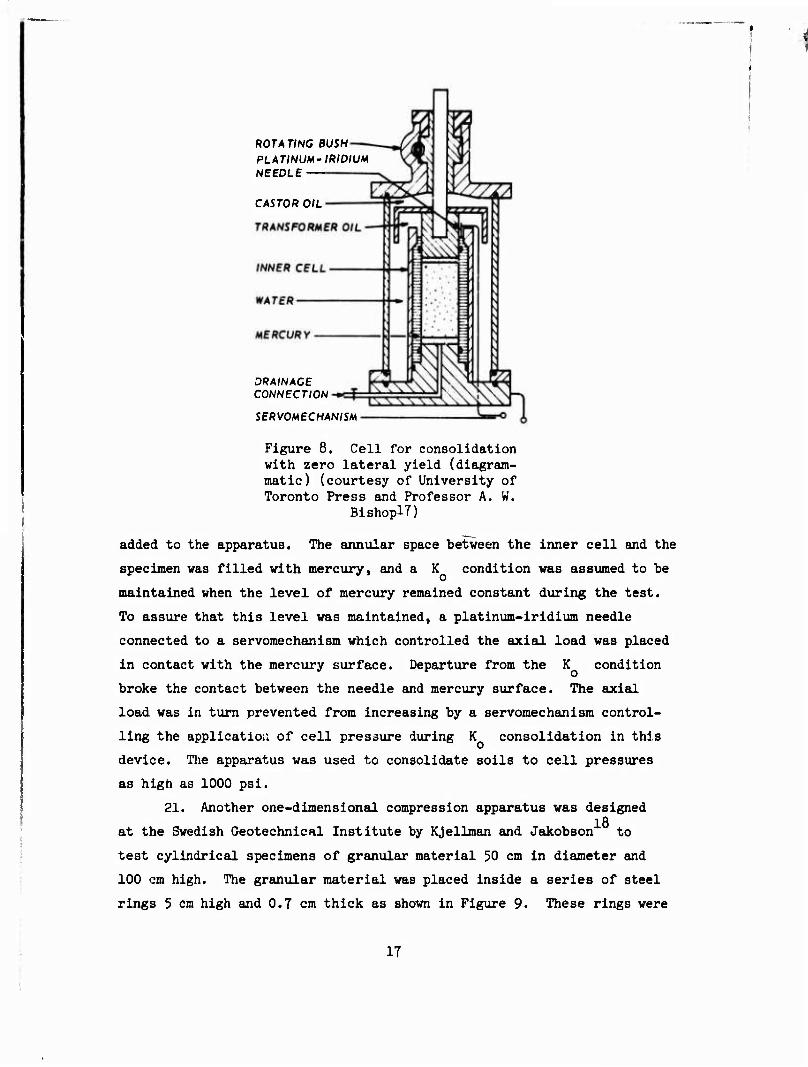
20. Miscellaneous methods. A very interesting method for testing
soil under K conditions was devised at Imperial College. The ap-
paratus used is similar to the conventional triaxial apparatus with the
exception that an inner cell surrounding the specimen (see Figure 8) was
16
ROTATING BUSH PLATINUM-IRIDIUM NEEDLE
CASTOR OIL
DRAINAGE CONNECTION
SERVOMECHANISM
Figure 8. Cell for consolidation with zero lateral yield (diagram- matic) (courtesy of University of Toronto Press and Professor A. W.
BishoplT)
added to the apparatus. The annular space between the inner cell and the
specimen was filled with mercury, and a K condition was assumed to be
maintained when the level of mercury remained constant during the test.
To assure that this level was maintained, a platinum-iridium needle
connected to a servomechanism which controlled the axial load was placed
in contact with the mercury surface. Departure from the K condition
broke the contact between the needle and mercury surface. The axial
load was in turn prevented from increasing by a servomechanism control-
ling the application of cell pressure during K consolidation in this
device. The apparatus was used to consolidate soils to cell pressures
as high as 1000 psl.
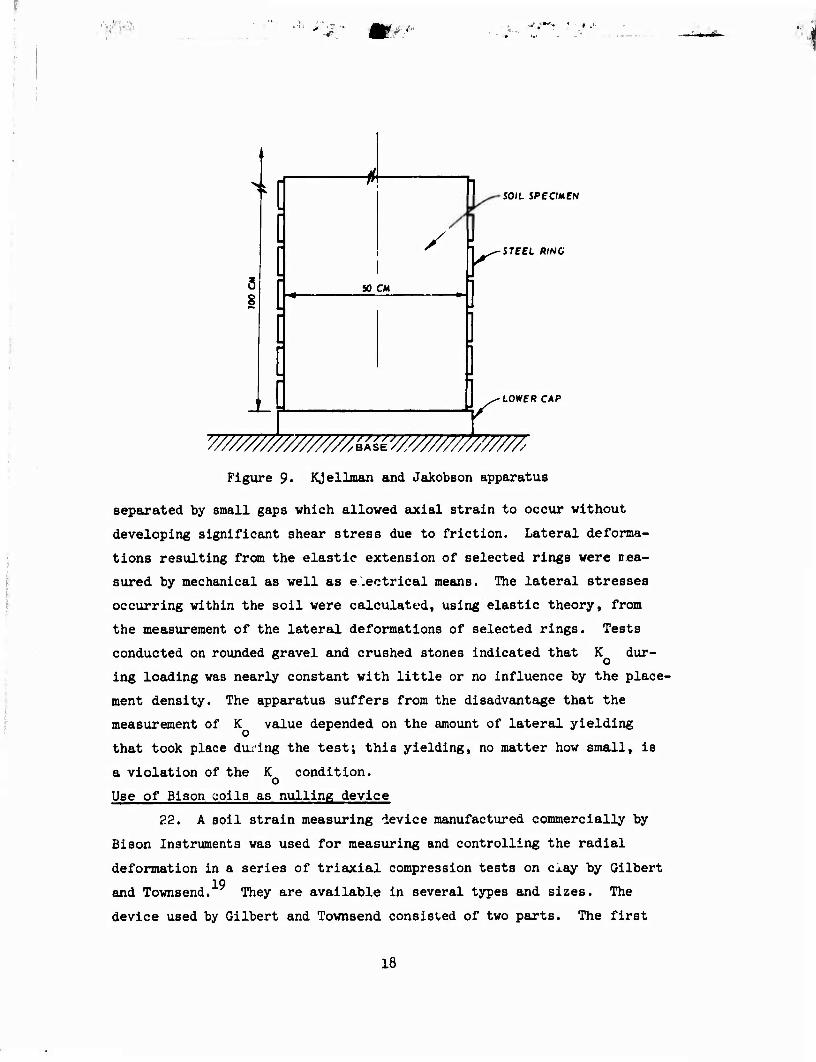
21. Another one-dimensional compression apparatus was designed 18
at the Swedish Geotechnical Institute by KJellman and Jakobson to
test cylindrical specimens of granular material 50 cm in diameter and
100 cm high. The granular material was placed inside a series of steel
rings 5 cm high and 0.7 cm thick as shown in Figure 9. These rings were
17
J ;*<, ,. , , J.
11
/
SO CM
SOIL JPEOMEN
STEEL R/NC
•LOWER CAP
Figure 9* KJellman and Jakobson apparatus
separated by small gaps which allowed axial strain to occur without
developing significant shear stress due to friction. Lateral deforma-
tions resulting from the elastic extension of selected rings were nea-
sured by mechanical as well as electrical means. The lateral stresses
occurring within the soil were calculated, using elastic theory, from
the measurement of the lateral deformations of selected rings. Tests
conducted on rounded gravel and crushed stones indicated that K dur-
ing loading was nearly constant with little or no influence by the place-
ment density. The apparatus suffers from the disadvantage that the
measurement of K value depended on the amount of lateral yielding
that took place during the test; this yielding, no matter how small, is
a violation of the K condition. o Use of Bison coils as nulling device
22. A soil strain measuring device manufactured commercially by
Bison Instruments was used for measuring and controlling the radial
deformation in a series of triaxial compression tests on clay by Gilbert 19
and Townsend. They are available in several types and sizes. The
device used by Gilbert and Townsend consisted of two parts. The first
18
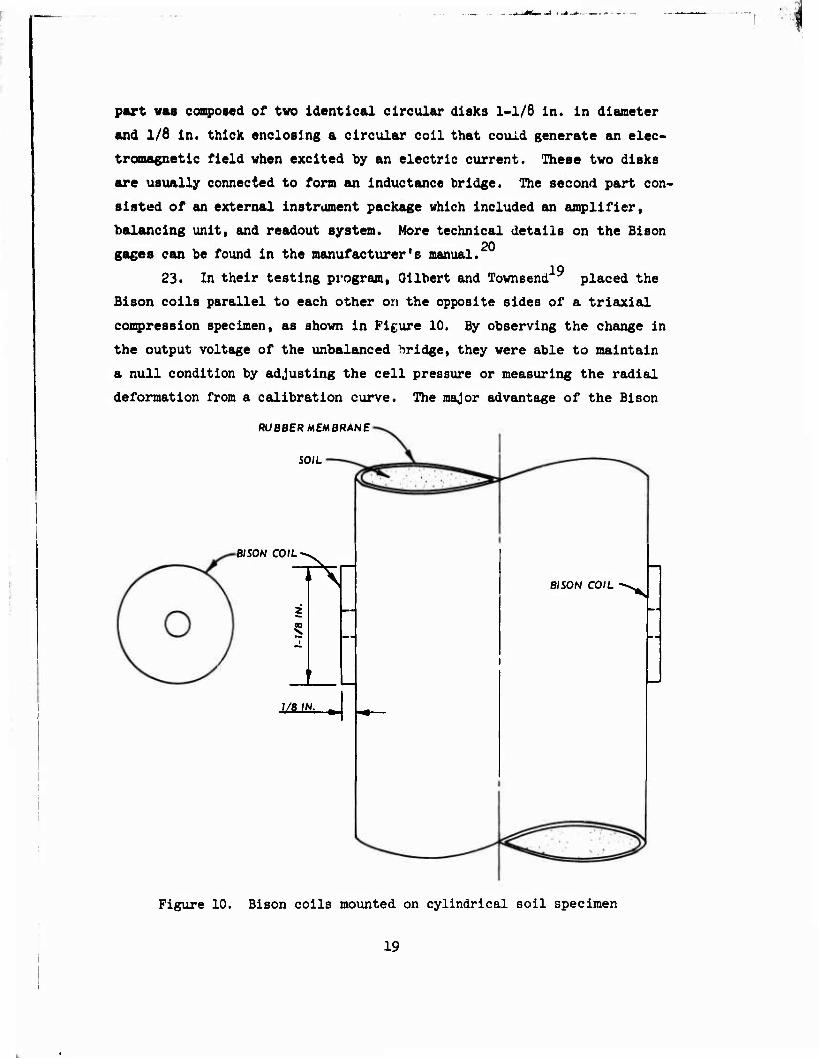
part was composed of two identical circular disks 1-1/6 in. in diameter
and 1/8 in. thick enclosing a circular coll that could generate an elec-
tromagnetic field when excited by an electric current. These two disks
are usually connected to form cm inductance bridge. The second part con-
sisted of an external instrument package which included an amplifier,
balancing unit, and readout system. More technical details on the Bison 20 gages can be found in the manufacturer's manual.
19 23. In their testing program, Gilbert and Townsend placed the
Bison coils parallel to each other on the opposite sides of a triaxial
compression specimen, as shown in Figure 10. By observing the change in
the output voltage of the unbalanced bridge, they were able to maintain
a null condition by adjusting the cell pressure or measuring the radial
deformation from a calibration curve. The major advantage of the Bison
RUBBER MEMBRANE
SOIL
BISON COIL •
UJ IN.
BISON COIL
Figure 10. Bison coils mounted on cylindrical soil specimen
19
coll is that it is'battery-operated, thus providing flexibility for use
both In the laboratory as well as in the field. The effects of rota-
tional or transverse movement, moisture, and temperature are of little
significance. However, because the Bison coils are extremely sensitive
to the surrounding metallic objects within tneir electromagnetic field,
they require very complex and time-consuming calibration when used in a
metallic triaxial device. They are therefore impractical for routine
laboratory testing.
Use of cantilever spring arm as nulling device
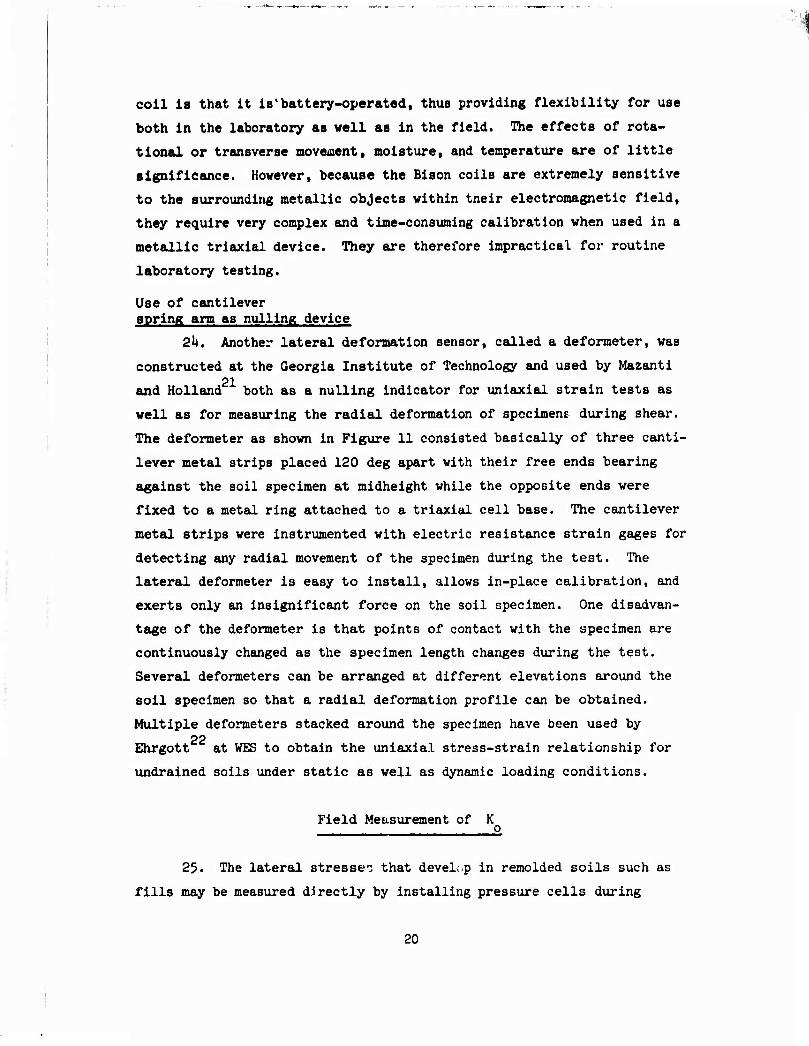
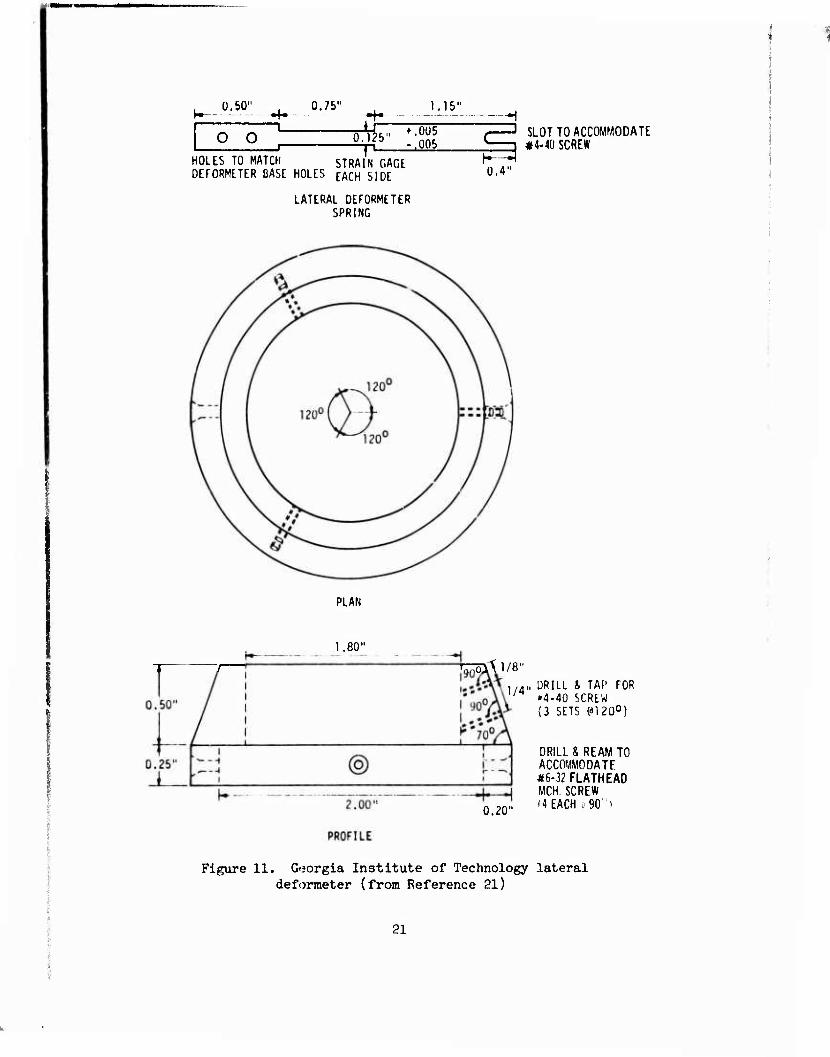
2k. Another lateral deformation sensor, called a deformeter, was
constructed at the Georgia Institute of Technology and used by Mazantl 21 and Holland both as a nulling Indicator for unlaxlal strain tests as
well as for measuring the radial deformation of spocimenE during shear.
The deformeter as shown in Figure 11 consisted basically of three canti-
lever metal strips placed 120 deg apart with their free ends bearing
against the soil specimen at midheight while the opposite ends were
fixed to a metal ring attached to a triaxial cell base. The cantilever
metal strips were instrumented with electric resistance strain gages for
detecting any radial movement of the specimen during the test. The
lateral deformeter is easy to Install, allows ln-place calibration, and
exerts only an insignificant force on the soil specimen. One disadvan-
tage of the deformeter is that points of contact with the specimen are
continuously changed as the specimen length changes during the test.
Several deformeters can be arranged at different elevations around the
soil specimen so that a radial deformation profile can be obtained.
Multiple deformeters stacked around the specimen have been used by 22 Ehrgott at WES to obtain the unlaxial stress-strain relationship
undralned soils under static as well as dynamic loading conditions.
Field Measurement of K o
25. The lateral stresse: that develop in remolded soils such as
fills may be measured directly by installing pressure cells during
20
0.50"
o o
0.75" 1.15"
"L ±r j-
0.125' ♦ .005 -.005
HOLES TO MATCH STRAIN GAGE DEFORMETER BASE HOLES EACH SIDE
LATERAL DEFORMETER SPRING
PLAN
1.80"
1 SLUT TO ACCOMMODATE
40 SCREW K 0.4"
^öXM/8"
0.20"
1/4„ DRILL & TAP FOR «4-40 SCREW (3 SETS («120°)
DRILL & REAM TO ACCOMMODATE *6-32 FLATHEAD MCH, SCREW (4 EACH .90)
Figure 11. Guorgia Institute of Technology lateral deformeter (from Reference 21)
21
construction of the fill; however, exact measurements of the stresses are
not easily obtained with the pressure cells. Accurate measurement of
lateral stresses in an undisturbed soil is extremely difficult since
insertion of «my measuring device will cause some disturbance of the
soil which adversely affects the local stresses. However, if extra care
is taken during installation of the measuring devices and. a certain mar-
gin of error can be accepted, lateral stresse:: could be measured in an
undisturbed soil with reasonable degree of confidence. Several methods
are known to be used for measuring the in situ value of K . A descrip-
tion of some of these methods follows.
Direct installation of pressure cells test
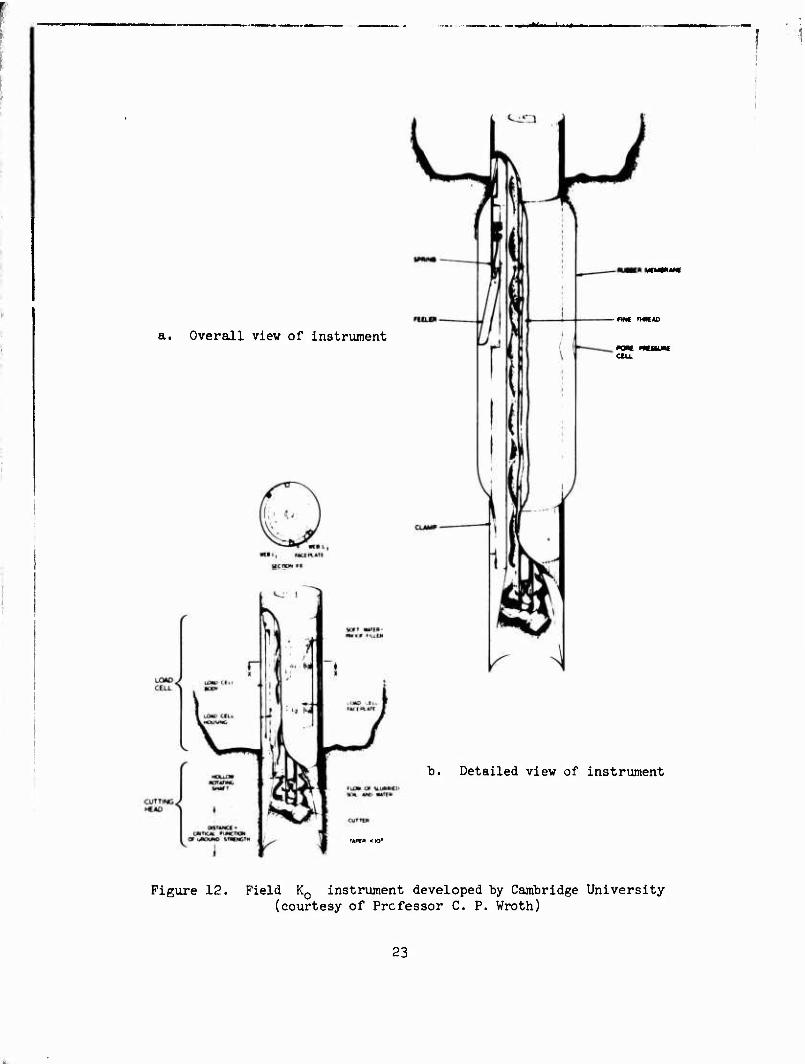
26. A special instrument that drilled itself into the ground and 23 measured the lateral stresses was developed at Cambridge University.
The instrument shown in Figure 12 consisted of a hollow cylinder which
could be pushed slowly into the ground while the soil was being exca-
vated by a rotating cutter. Water circulated down the central tube on
which the cutter was mounted and moved upward through the annulus carry-
ing the soil cuttings. The shield which protected the cutter and the
rotating shaft was instrumented with pressure cells for measuring the
total lateral stress. From the measuxeaents of the lateral stress and
calculated axial stress at any depth, the in situ K value could be
determined. The top of the instrument was provided with openings which
permitted expansion of a rubber membrane against the wall of the bore,
thus enabling the measurement of the in situ stress-strain properties
of the soil. A series of radiograph pictures taken before and after a
controlled test showed that disturbance was confined to a thin zone
probably not greater than 2 mm thick from the surface of the instrument. 23 The instrument has been used successfully for soft clay in the field,
where measured values of K compared closely with those obtained from
hydraulic fracture tests. For stiff soils, however, this instrument may
not be useful.
Hydraulic fracture test
27. If a mass of soil is subjected to an increasing internal
22
a. Overall view of instrument FINf rMKU)
ecu
b. Detailed view of instrument
TiPC» <IO'
Figure 12. Field K0 instrument developed by Cambridge University (courtesy of Professor C. P. Wroth)
23
pressure, a local fracture in the soil will eventually occur, provided
the soil mass has a reasonably low permeability. This simple principle
has been used as a basis for calculating the in situ K for normally
consolidated soil by assuming that the measured pressure applied to
close the local fracture is equivalent to the in situ lateral stress.
Tests of this kind have been used by many investigators "" because
of its simplicity and low cost.
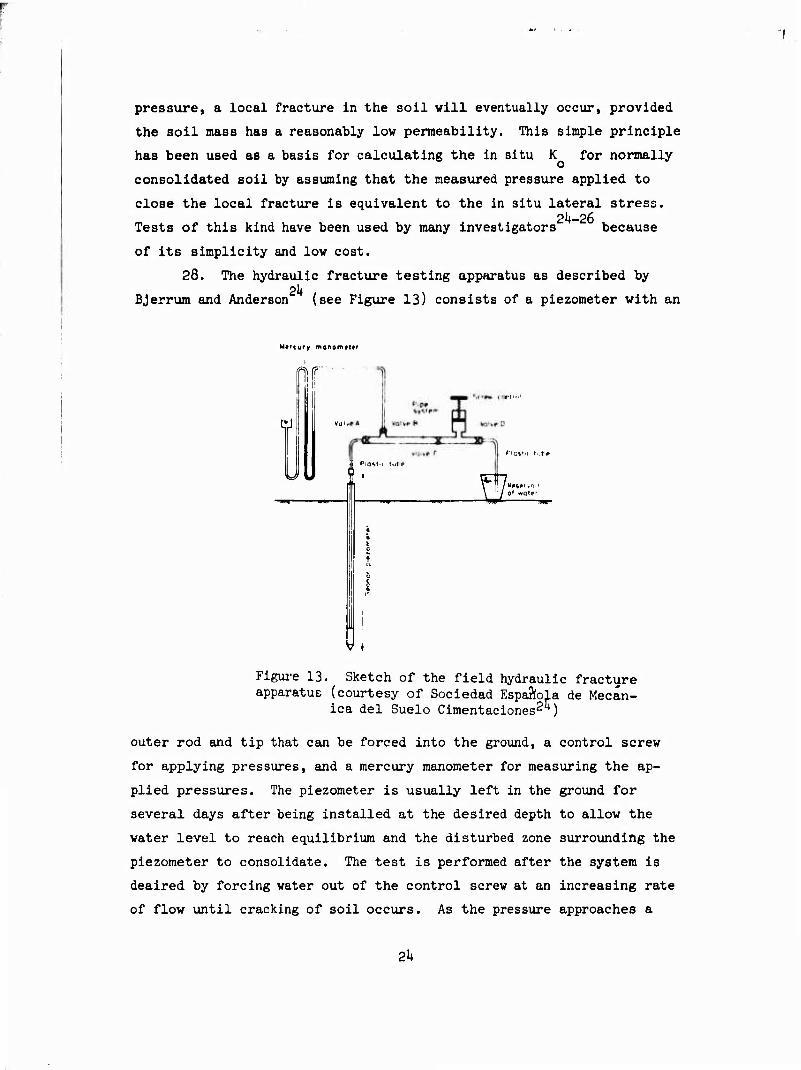
28. The hydraulic fracture testing apparatus as described by
BJerrum and Anderson (see Figure 13) consists of a piezometer with an
Mtrcury manofntt*r
W
r
w Plaits lute
\ u/ o" «ale -Jw»* mr-
Figure 13. Sketch of the field hydraulic fracture apparatus (courtesy of Sociedad EspaJfola de Mecan-
ica del Suelo Cimentaciones2^)
outer rod and tip that can be forced into the ground, a control screw
for applying pressures, and a mercury manometer for measuring the ap-
plied pressures. The piezometer is usually left in the ground for
several days after being installed at the desired depth to allow the
water level to reach equilibrium and the disturbed zone surrounding the
piezometer to consolidate. The test is performed after the system is
deaired by forcing water out of the control screw at an increasing rate
of flow until cracking of soil occurs. As the pressure approaches a
2k
constant value, the flow of water Is stopped and the system is allowed
to operate as a falling head permeability test. A plot of the applied
pressure versus the rate of flow is then generated, and point of max-
imum curvature is established. The pressure which corresponds to the
maximum curvature is assumed to be equal to the in situ lateral stresses.
When the lateral stress and the overburden pressure are known, the value
of the in situ K can be determined. Field measurement of K using o o 0
this method on different kinds of normally consolidated clays compared
favorably with those obtained from laboratory measurements.
29. Although the performance of the hydraulic fracture test is
simple, the interpretation of the result is difficult since it involves
many assumptions concerning the orientation of principal stresses, frac-
ture mechanism, the extent to which seepage pressure develops, and also
the shear and tensile strength of the material tested. The test is use-
ful only for a radially symmetric stress system and for normally consoli-
dated or slightly overconsolidated soils where K is less than unity.
Field vibratory test
30. The in situ measurement of K can be obtained indirectly
from the measurement of the time required for an elastic wave to travel 27 a known distance within a soil media. The test procedure used by WES
involves measuring the velocity of waves propagated at known frequencies
along the exposed surface of soil (surface or Rayleigh waves) as well as
measuring the velocity of waves refracted at known frequencies from a
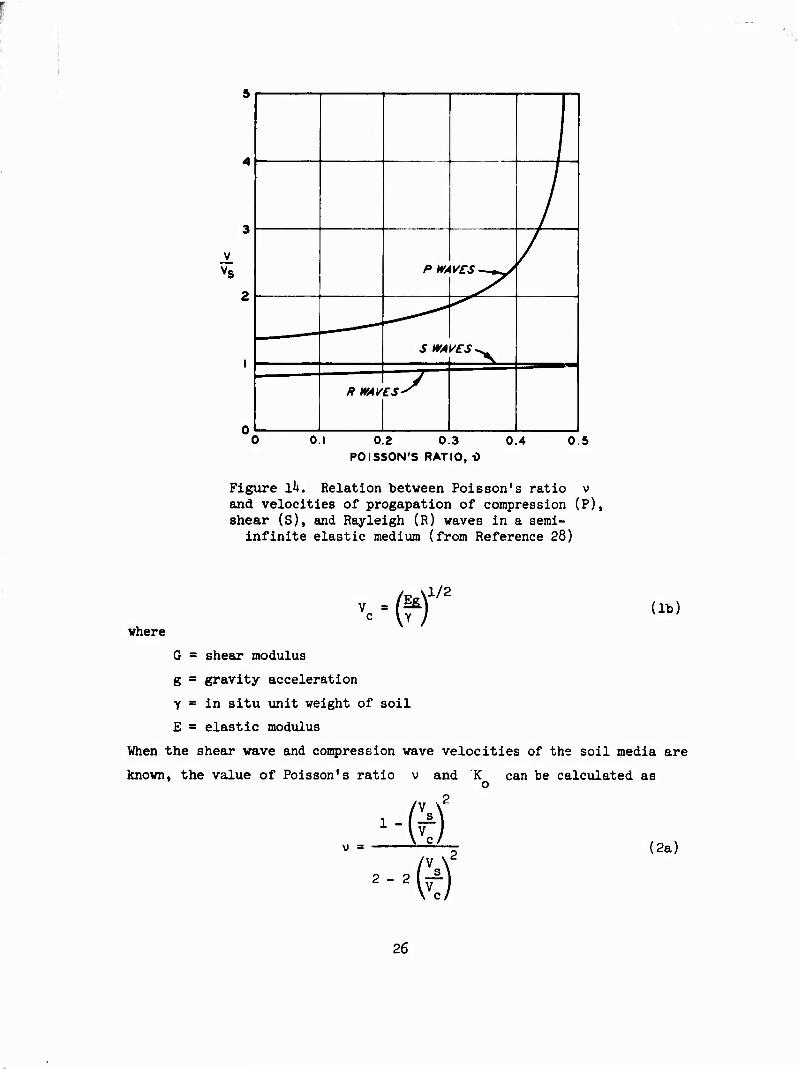
known depth of the soil (compression wave). It has been indicated
(see Figure ik) that the difference between the surface wave and the
shear wave with the change in Poisson's ratio is so small that the prop-
agated surface waves can be considered as shear waves for all practical
purposes.
31. For isotropic elastic media the shear wave velocity V and
the compression wave velocity V may be expressed as
1/2 Vs = f^) (la) ■(f)
25
/ y P WAVES —*y/
/
— —- S WAVES^ 1 ^—
R WAV „> 0.2 0.3
POISSON'S RATIO, -0 0.4 0.5
Figure l^. Relation between Poisson's ratio v and velocities of progapation of compression (P), shear (S), and Rayleigh (R) waves in a semi-
infinite elastic medium (from Reference 28)
■« VY / (lb)
where
G = shear modulus
g = gravity acceleration
Y = in situ unit weight of soil
E = elastic modulus
When the shear wave and compression wave velocities of the soil media are
known, the value of Poisson's ratio and
2
K can be calculated as
v =
-ftj (2a)
26
K ■ 1 o -ft)'
(2b)
32. The major advantage of the vibratory field test is that a
considerably large area can be tested quickly without disturbing the
soil. Also the theoretical basis of the method is sound and simple.
However, the disadvantage of the method is that the soil media is as-
sumed to be isotropic and elastic, thus the values of v and K rep-
resent more or less average values for all the material encountered in
the site tested.
Theoretical Evaluation of K
33. Although bhere are many procedures for determining the value
of K by experimental means, there have been ouly two successful at-
tempts for predicting K analytically. The first theoretical ap- 0 29 6 proach was derived by Jaky and the second was derived by Hendron.
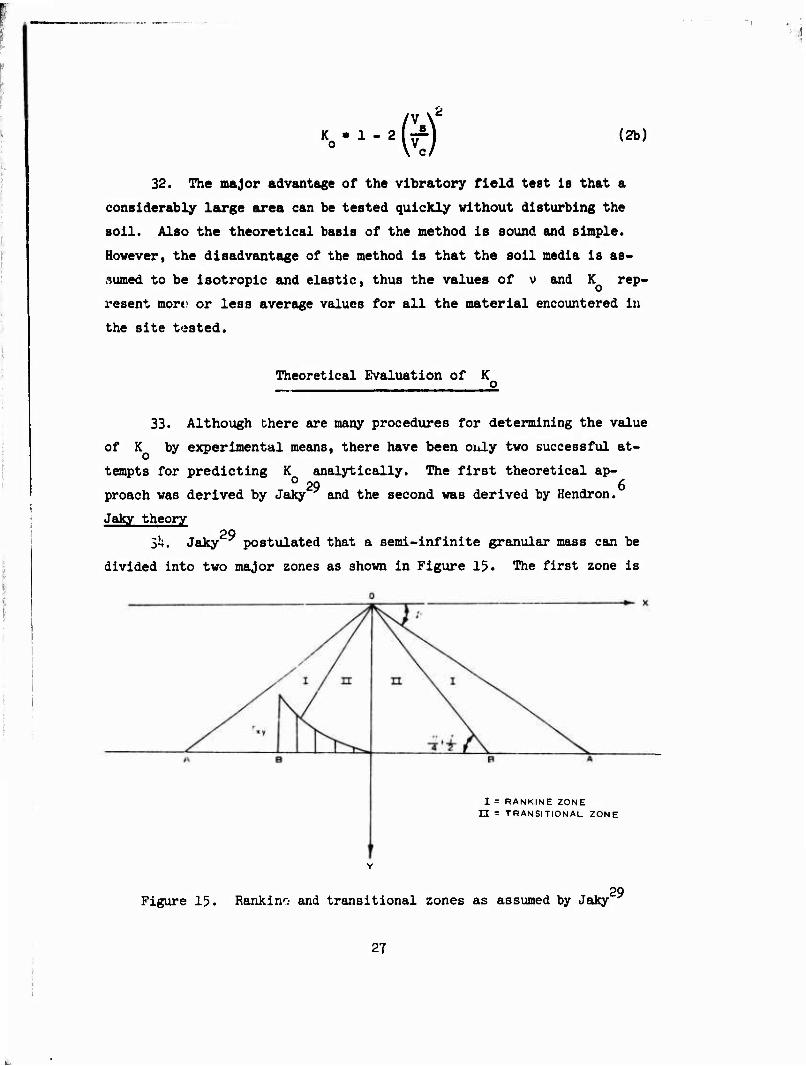
Jaky theory " 29 $4. Jaky postulated that a semi-infinite granular mass can be
divided into two major zones as shown in Figure 15. The first zone is
I = RANKINE ZONE n - TRANSITIONAL ZONE
Figure 15. Ranking and transitional zones as assumed by Jaky 29
27
the Rankine zone (I) bounded by lines at angles of 0 and (n/l* + 0/2)
with the horizontal plane, where 0 Is the failure angle. The second
zone (II) is a transitional zone extending from OB vhi^'t represents
the limiting equilibrium boundary to OY which represents the elastic
state. Jaky also assumed that the shear distribution on any horizontal
plane within the transitional zone is parabolic. Using equilibrium
conditions and Rankine theory, Jaky was able to derive an expression for
K as follows: o
Ko = (l+fsin0)tan2^.f) (3)
The value of 0 for typical soils ranges from 20-U5 deg, and without
significant loss of accuracy. Equation 3 may be simplified further to
K * 0.9(1 - sin 0) (k)
However, if the shear distribution were chosen to be cubic rather than
parabolic, the 0.9 would have been slightly greater than 1.0. Thus a
good approximation for K would be
Ko * (1 - sin 0) (5)
Hendron theory
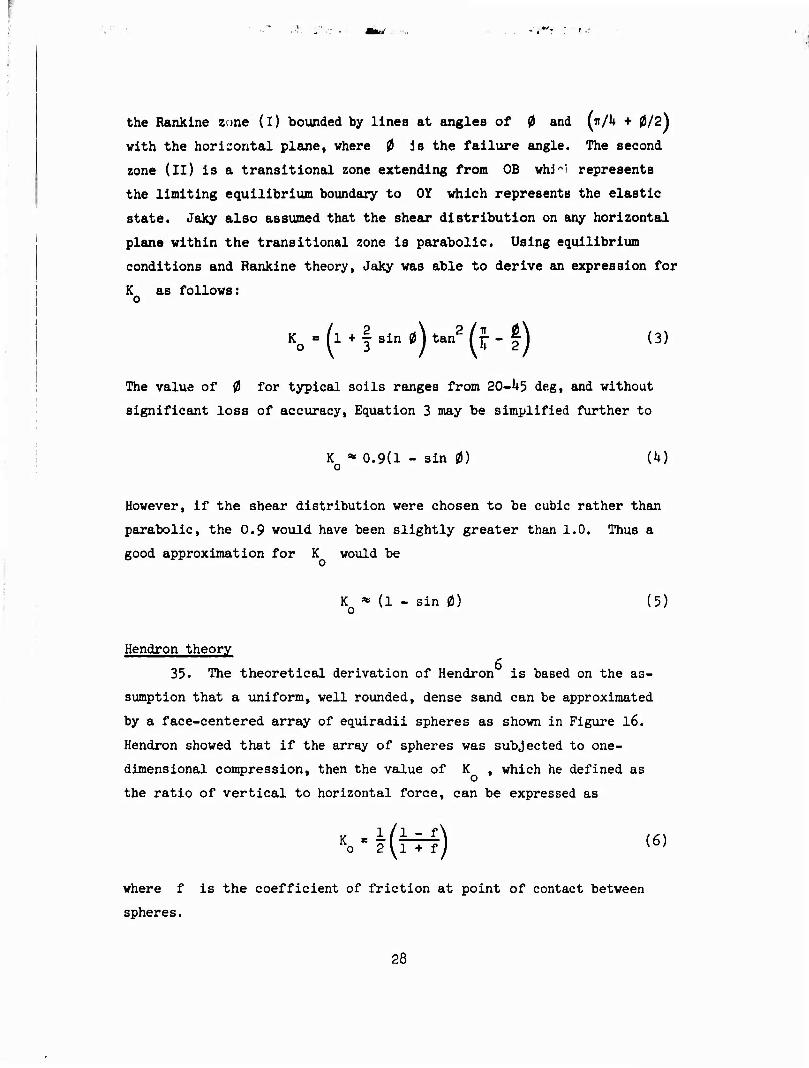
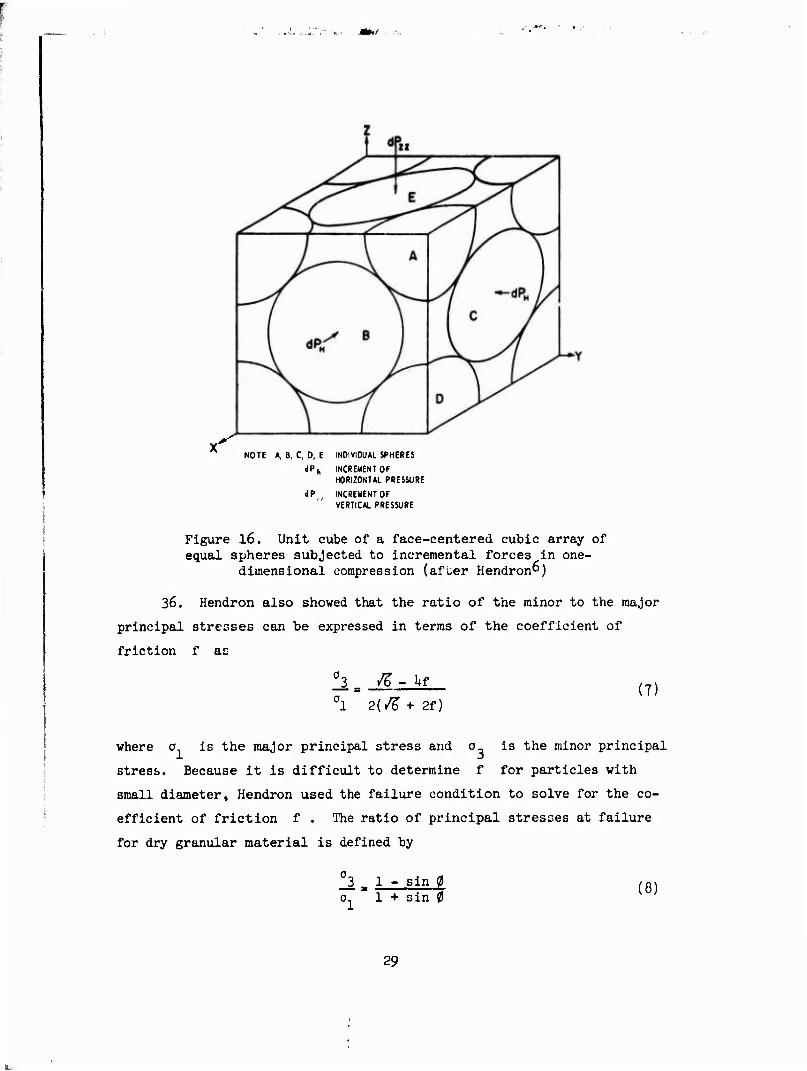
35. The theoretical derivation of Hendron is based on the as-
sumption that a uniform, well rounded, dense sand can be approximated
by a face-centered array of equiradii spheres as shown in Figure 16.
Hendron showed that if the array of spheres was subjected to one-
dimensional compression, then the value of K , which he defined as
the ratio of vertical to horizontal force, can be expressed as
where f is the coefficient of friction at point of contact between
spheres.
28
NOTE A, B, C, D, E INDIVIDUAL SPHERES
dPh INCREMENT OF HORIZONTAL PRESSURE
«IP., INCREMENT OF VERTICAL PRESSURE
Figure 16. Unit cube of a face-centered cubic array of equal spheres subjected to incremental forces in one-
dimensional compression (after Hendron")
36. Hendron also showed that the ratio of the minor to the major
principal stresses can be expressed in terms of the coefficient of
friction f as
q3 _ .JLjjf 01 2(^+ 2f)
(7)
where o is the major principal stress and o is the minor principal
stress. Because it is difficult to determine f for particles with
small diameter, Hendron used the failure condition to solve for the co-
efficient of friction f . The ratio of principal stresses at failure
for dry granular material is defined by
II _ 1 - sin 0 0 ~ 1 + sin 0 (8)
29
Equating Equations 7 and 6, the coefficient of friction can be expressed
In terms of sin 0 as
\/S ft f.^8in0.2| (9)
Consequently the coefficient of earth pressure at rest and the angle of
internal friction for a face-centered array can be related to each other
by combining Equations 6 and 9 in the following form:
Ko 2
(4) sin 0
sin 0
(10)
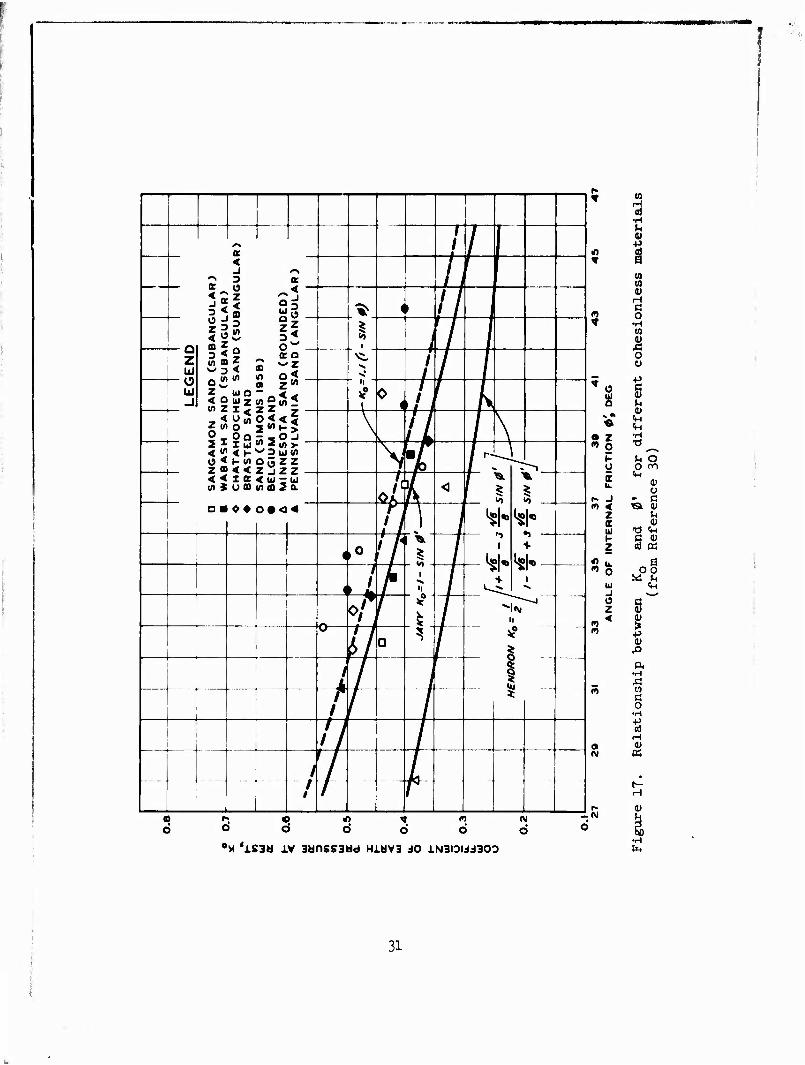
The relationship between K and sin 0 as suggested by Jaky and
Hendron is shown in Figure 17. It can be seen that the two expressions
diverge quantitatively, but their trend is similar in the qualitative
sense. It must be noted that the majority of experimental data on well
rounded cohesionless soils tend to confirm Hendron's theory, while ex-
perimental data on cohesive soils as well as on cohesionless soils with
angular particles agree more closely with Jaky's theory.
30
9
« SI
p U 5 u.
r- J <n <
Z It u h Z
s ^ « 0 u j o z
a N
•H
£ 1
1 / 1 u 9)
■P
CO (0 —
< j
or o
3 *. S y
m Z . o
1 ' <
O ^ " I 0)
1 z < 1
/ 7 / •H 10
z UJ
SA
NG
AM
ON
S
AN
D
(SU
W
AB
AS
H
SA
ND
(S
UB
A
CH
AT
AH
OO
CH
EE
S
AN
D
BR
AS
TE
D S
AN
D
SA
ND C
SIM
ON
S 1
95
8)
BE
LG
IUM
S
AN
D
MIN
NE
SO
TA
S
AN
D (R
l o z <
/ / / /
o o +> g I)
<M «tn •H
u o 0 ro
\ hi -1 <
- n -
I o,, i i L Z < 5 V < // / \ > z 7 \ % ^ --) UJ 0.
o/ A <
I
1
I«
1 4H
0) Ü
- ß D ■ «♦ o*< 4
i ] i
i 15 « -d Vi
1
t • o // i ^
^ f u L
—
td ps
a
4
/ p it
i 3
^
>l' oo
A 1 II
1 o 11
0
1
7 j ft
•H
W C o
•H
*
! II / Id H 0)
- - f 1 7 /
• H
0) « C
! > f e e
I X 'is
< c
3a x
> >
v aa
* c
1SS3I
» > id Hi
c
Lava
r j
iO 1
c
N3DI
j i dd30- D
c i
> c > •H
31
• ■ ■.;*-. ^ " mw'
PART III: MATERIAL, TESTING EQUIPMENT, AND PROCEDURES
Material
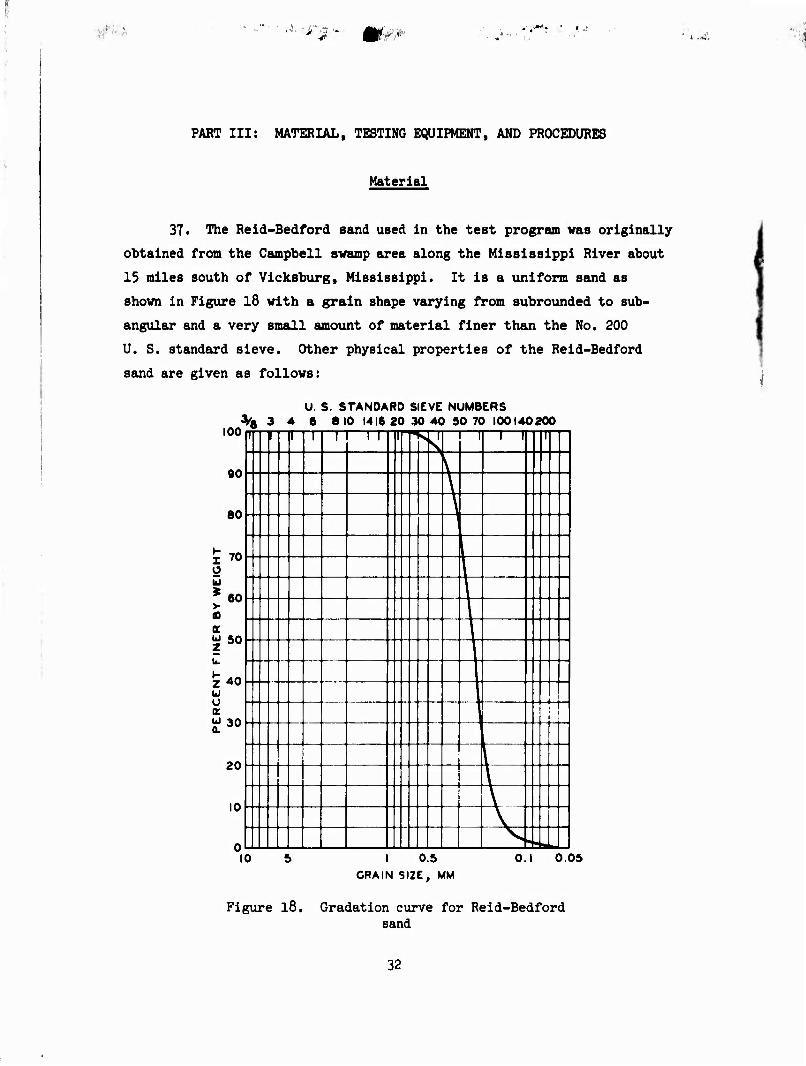
37» The Reld-Bedford sand used in the test program was originally
obtained from the Campbell swamp area along the Mississippi River about
15 miles south of Vicksburg, Mississippi. It is a uniform sand as
shown in Figure 18 with a grain shape varying from subrounded to sub-
angular and a very small amount of material finer than the No. 200
U. S. standard sieve. Other physical properties of the Reld-Bedford
sand are given as follows:
U. S. STANDARD SIEVE NUMBERS ^«3 4 S 810 1416 20 30 40 50 70 100140200
lOOn?
90
80
I 70 O ü ^60 > 0 K ^ 50
Z 40 u o K !H 30 Q.
20
10
III 11 r T I III ^
n —r i i Tn 1 1 '
V \ \
1
1!
II
L II \ 1 \ |)
\ ft NJJ j 11
10 I 0.5 GRAIN SIZE, MM
0.1 0.05
Figure 18. Gradation curve for Reld-Bedford sand
32
Specific gravity, G 2.66 8
Maximum void ratio, e 0.903 ' max Minimum void ratio, e . 0.593 min Mean grain diameter, D 0.123 mm a ' mean Coefficient of uniformity, C 1.5
Unified Soil Classification (SP)
Testing Equipment
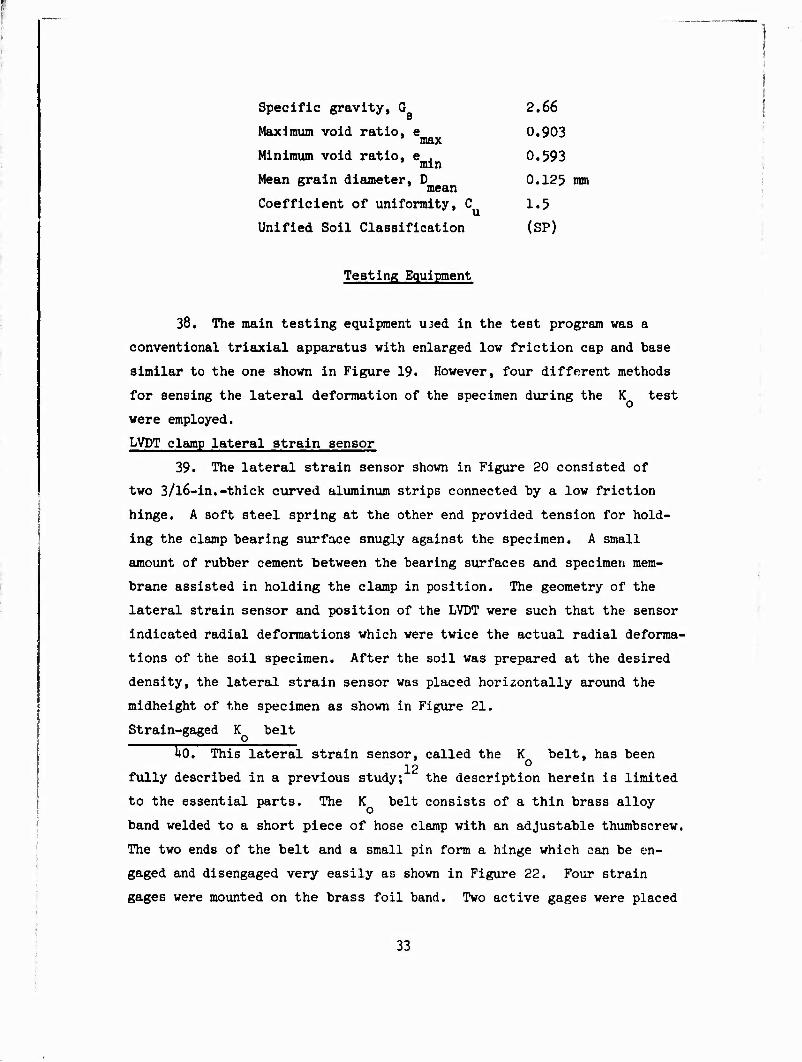
38. The main testing equipment ujed in the test program was a
conventional triaxial apparatus with enlarged low friction cap and base
similar to the one shown in Figure 19. However, four different methods
for sensing the lateral deformation of the specimen during the K test
were employed.
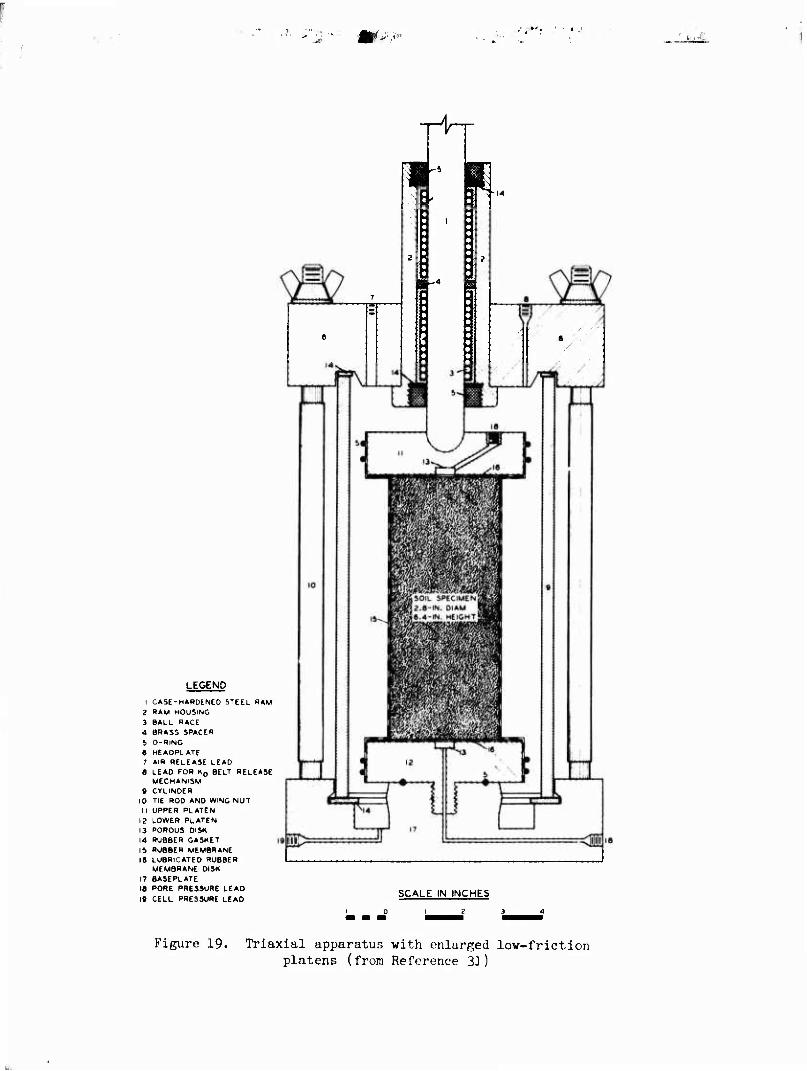
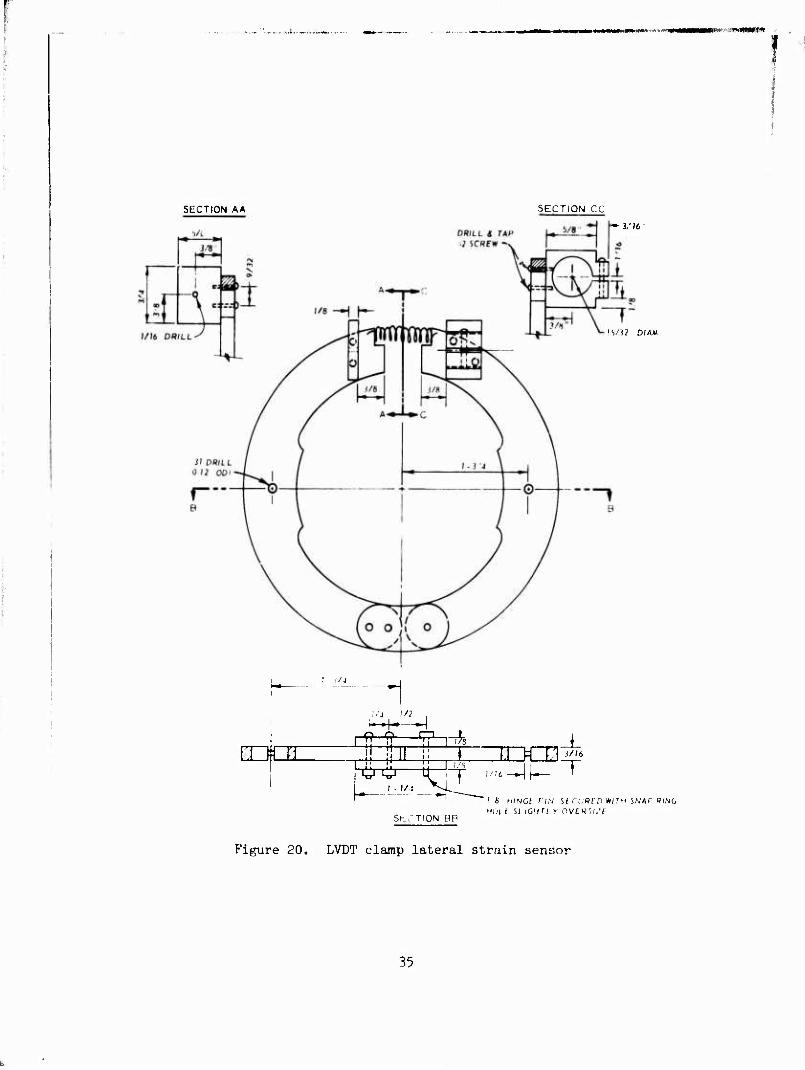
LVDT clamp lateral strain sensor
39. The lateral strain sensor shown in Figure 20 consisted of
two 3/l6-in.-thick curved aluminum strips connected by a low friction
hinge. A soft steel spring at the other end provided tension for hold-
ing the clamp bearing surface snugly against the specimen. A small
amount of rubber cement between the bearing surfaces and specimen mem-
brane assisted in holding the clamp in position. The geometry of the
lateral strain sensor and position of the LVDT were such that the sensor
indicated radial deformations which were twice the actual radial deforma-
tions of the soil specimen. After the soil was prepared at the desired
density, the lateral strain sensor was placed horizontally around the
midheight of the specimen as shown in Figure 21.
Strain-gaged K belt
w,This lateral strain sensor, called the K belt, has been 12 0
fully described in a previous study; the description herein is limited
to the essential parts. The K belt consists of a thin brass alloy
band welded to a short piece of hose clamp with an adjustable thumbscrew.
The two ends of the belt and a small pin form a hinge which can be en-
gaged and disengaged very easily as shown in Figure 22. Four strain
gages were mounted on the brass foil band. Two active gages were placed
33
Suit
I'
LEGEND
I CASE-HARDENED STEEL RAM
2 RAM HOUSING
3 BALL RACE
4 BRASS SPACER
5 O-RlNO
S HEAOPLATE 7 AIR RELEASE LEAD
8 LEAD FOR K0 BELT RELEASE MECHANISM
9 CYLINDER 10 TIE ROD AND WINO NUT
II UPPER PLATEN
12 LOWER PLATEN
13 POROUS DISK
14 RUBBER GASKET
15 RUBBER MEMBRANE
IS LUBRICATED RUBBER MEMBRANE DISK
17 BASEPLATE IS PORE PRESSURE LEAD
I« CELL PRESSURE LEAD
: I
3
SCALE IN INCHES
Figure 19. Triaxial apparatus with enlarged low-friction platens (from Reference 31)
SECTION AA SECTION CC
• 1/ 16
1
HDfCH 4M?—[^H4 rn—rr
15/32 DIAM
T I ITS L
n i ■ i/.i ^t.
St ."TI ON BP
f ,/,6-^li— T ' I 8 HINCt PIN Sf CURfD »/fN SfMT R/NC HOLt SL/OHn y OV[«W/.'e
Figure 20. LVDT clamp lateral strain sensor
35
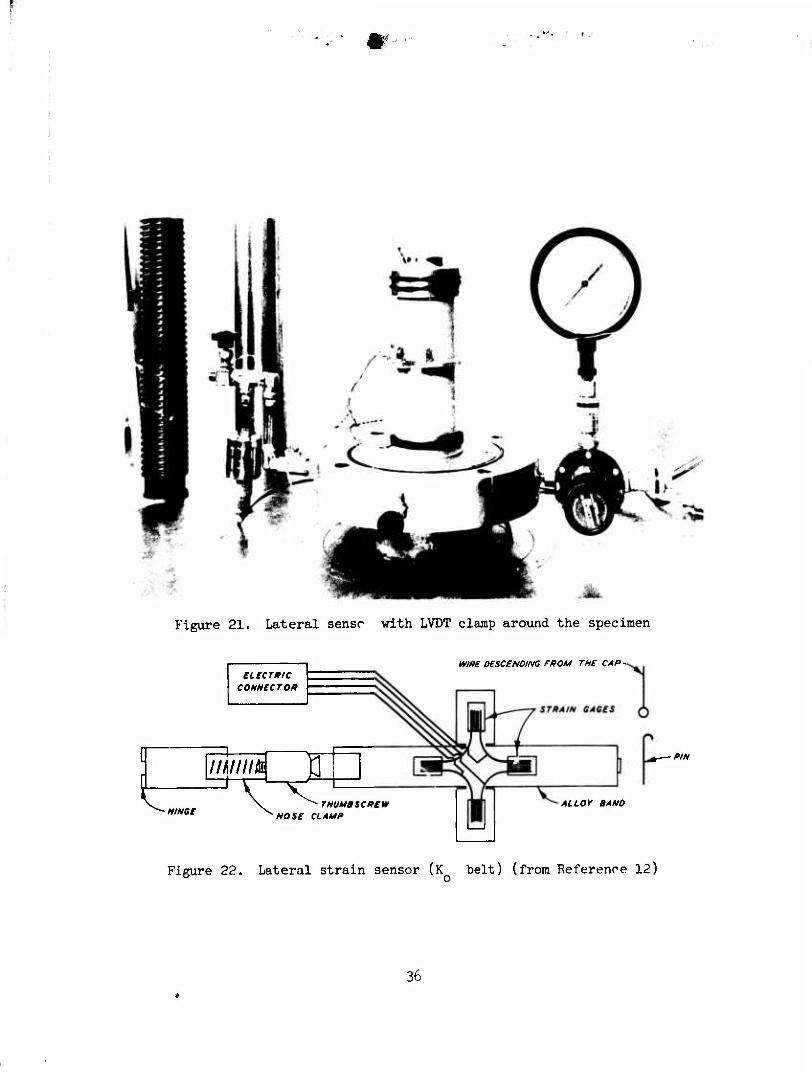
IT
Figure 21. Lateral sensr with LVDT clamp around the specimen
CONNECT OH
mRE DESCENDING FROM THE CAP-
t HINGE THUMBSCREW
HOSE CLAMP
■PIN
ALLOY BAND
Figure 22. Lateral strain sensor (Ko belt) (from Reference 12)
36
along the circumference and the other two were dummy gages placed along
the vertical axis on the portion of the band which projected above and
below the main band. The sensitivity of the strain gages to applied
pressure was found to be approximately equal to 6yv for each lOO-psi
increment of applied load, which was considered an acceptable error.
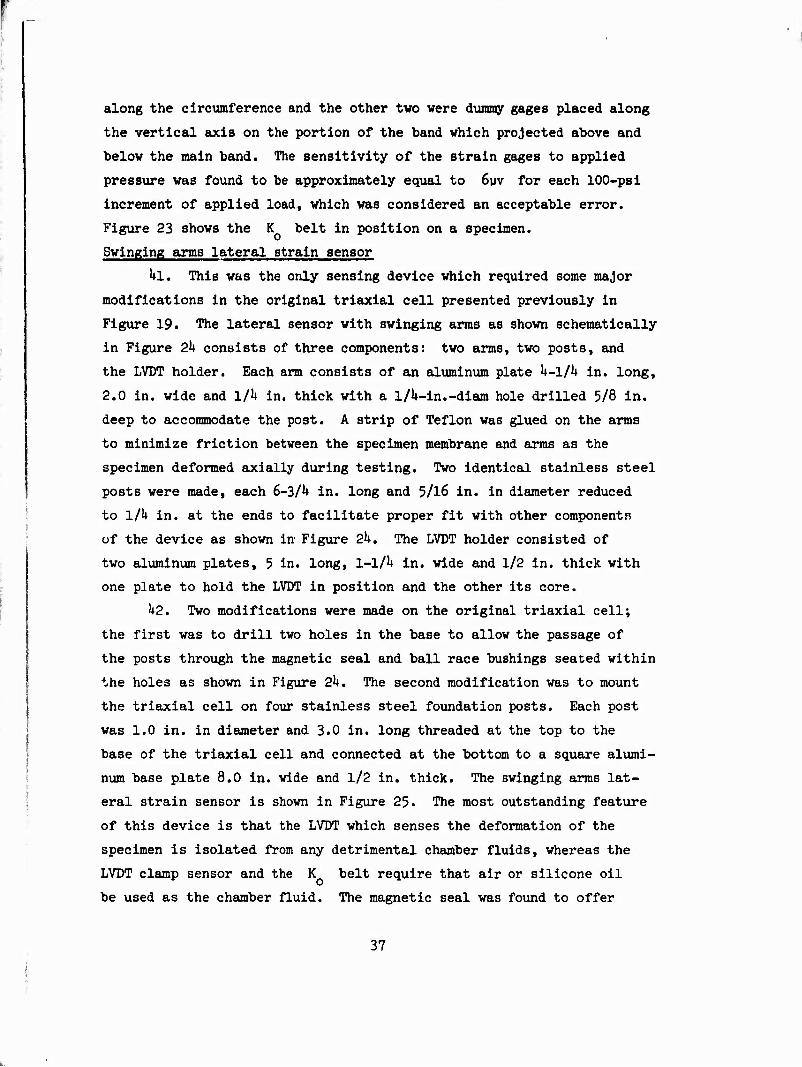
Figure 23 shows the K belt in position on a specimen.
Swinging arms lateral strain sensor
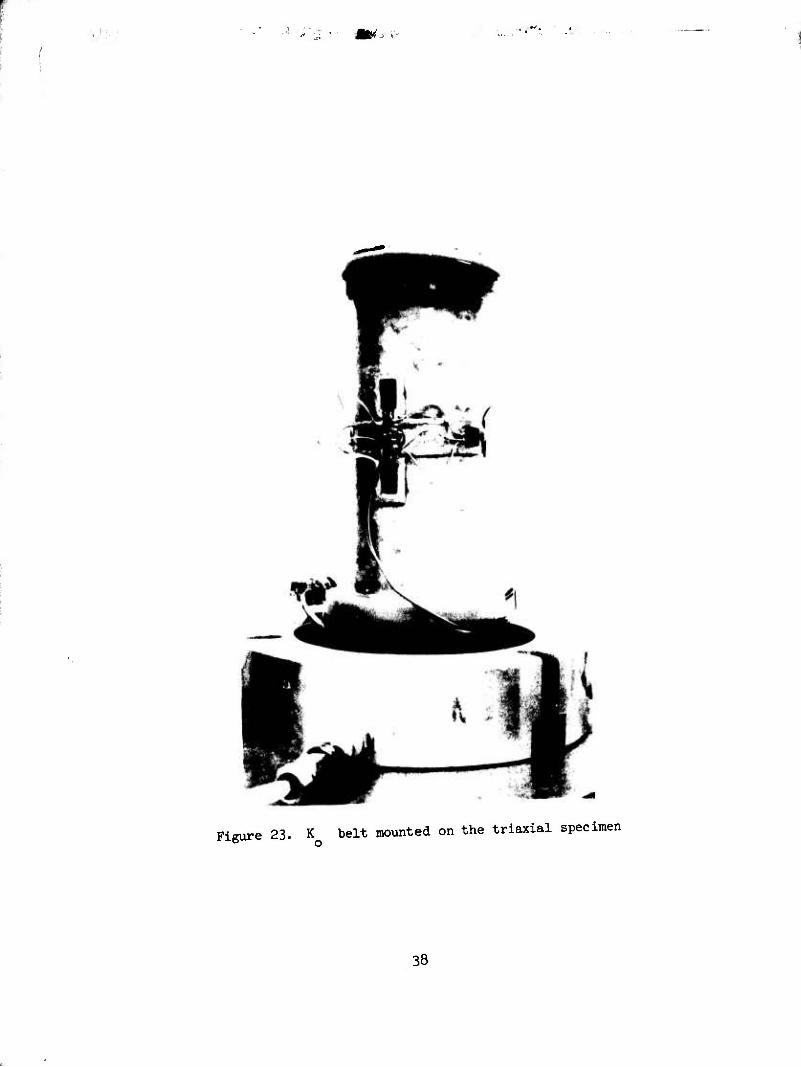
hi. This was the only sensing device which required some major
modifications in the original triaxial cell presented previously in
Figure 19. The lateral sensor with swinging arms as shown schematically
in Figure 2h consists of three components: two arms, two posts, and
the LVDT holder. Each arm consists of an aluminum plate k-l/k in. long,
2.0 in. wide and l/U in. thick with a l/U-in.-diam hole drilled 5/8 in.
deep to accommodate the post. A strip of Teflon was glued on the arms
to minimize friction between the specimen membrane and arms as the
specimen deformed axially during testing. Two identical stainless steel
posts were made, each 6-3A in. long and 5/l6 in. in diameter reduced
to l/k in. at the ends to facilitate proper fit with other componentn
of the device as shown in Figure 2k. The LVDT holder consisted of
two aluminum plates, 5 in. long, 1-l/U in. wide and 1/2 in. thick with
one p3ate to hold the LVDT in position and the other its core.
1+2. Two modifications were made on the original triaxial cell;
the first was to drill two holes in the base to allow the passage of
the posts through the magnetic seal and ball race bushings seated within
the holes as shown in Figure 2h. The second modification was to mount
the triaxial cell on four stainless steel foundation posts. Each post
was 1.0 in. in diameter and 3.0 in. long threaded at the top to the
base of the triaxial cell and connected at the bottom to a square alumi-
num base plate 8.0 in. wide and 1/2 in. thick. The swinging arms lat-
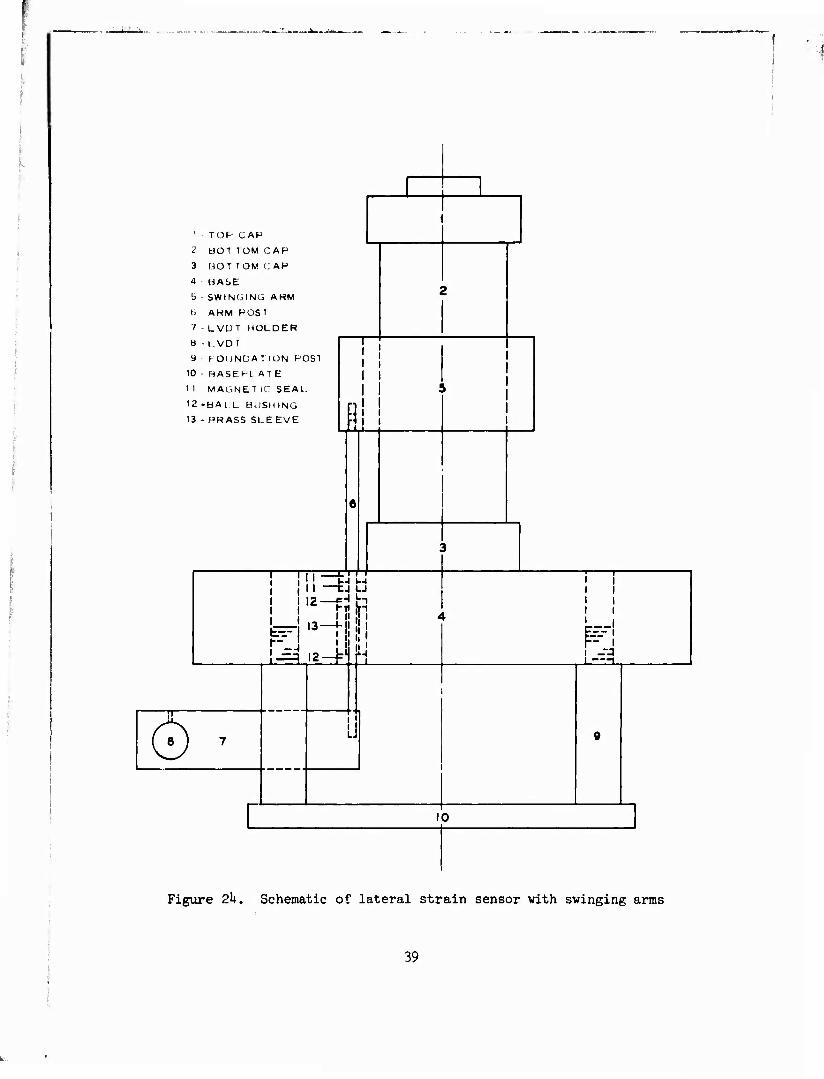
eral strain sensor is shown in Figure 25. The most outstanding feature
of this device Is that the LVDT which senses the deformation of the
specimen is isolated from any detrimental chamber fluids, whereas the
LVDT clamp sensor and the K belt require that air or sillcone oil
be used as the chamber fluid. The magnetic seal was found to offer
37
' .. . • I
Figure 23. K belt mounted on the triaxial specimen
38
' TOP CAP
? HOI TOM CAP
3 UOT TOM CAP
4 HASE
5 ■ SWINGING ARM
• > ARM POST
7 -LVUT HOLDER
B - LVD!
9 FOUNDATION POST
10 ■ HASEPL ATE
' I MAGNET IC SEAL.
12-BAIL BUSHING
13 - BRASS SLEEVE
0
11
i i i i
pi I
\-4 LJ "fei L
11,1
13—^!! !
12-b4
U
W' i - J I 1
10
Figure 2k. Schematic of lateral strain sensor with swinging arms
39
*m .i.
Figure 25. Lateral strain sensor with swinging arms
negligible resistance tc the rotation of the post in the horizontal
plane; however, any slight tilting of the post from the vertical posi-
tion could have broken the seal and caused leakage of the chamber fluid.
Indirect or burette method
U3. This method did not use a lateral strain sensor, as the
volume change of the soil specimen was used to indicate whether or
not zero lateral strain conditions were maintained during K tests. o
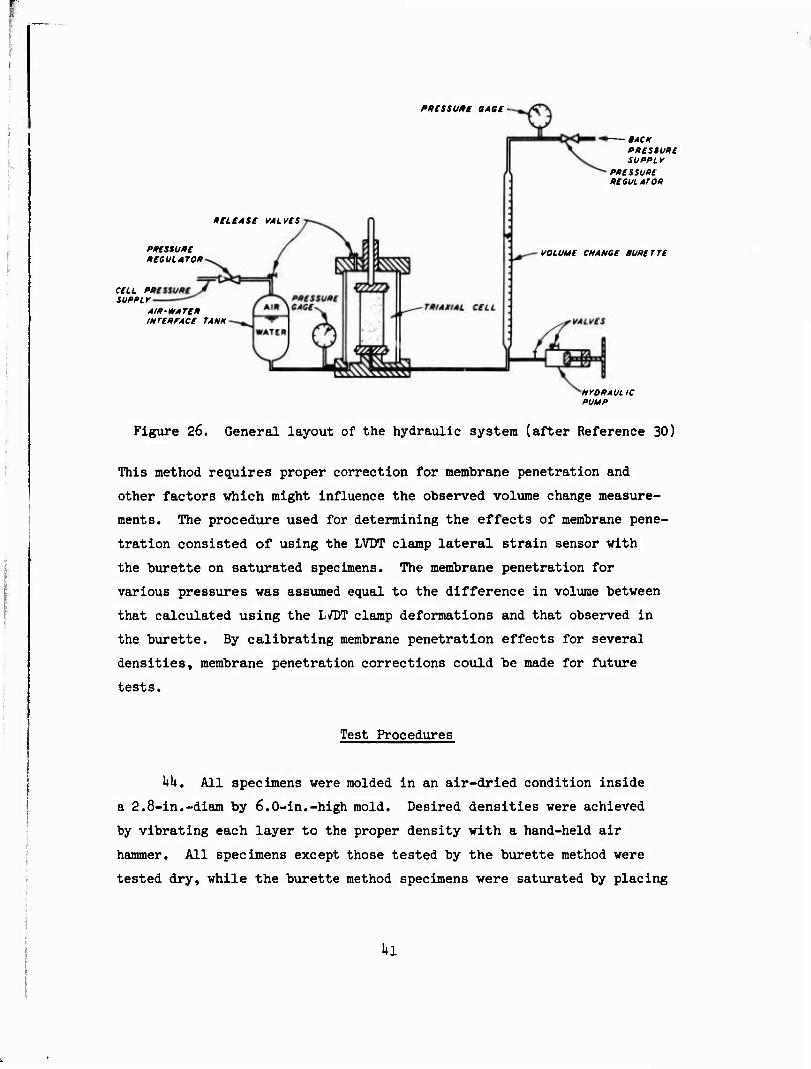
The test method and equipment (see Figure 26) were based on the assump-
tion that the volumetric strain of the specimen during one-dimensional
compression is equal to the axial strain. In other words, the ratio
of the change in volume to the change in height is constant and equal
to the initial area of the specimen. Therefore, if the initial area of
the soil specimen and the change in height of the specimen are known,
it is possible to adjust the cell pressure such that the volume change
indicated by the burette is equivalent to the calculated volume change.
ko
f>li£iSU/H GA6£
RCLCASe VALVCS
p*eisuf>£ RCeULATOR
ceu ptftssu/te SUPPLY
AIP-WATEP INTCPFACe TANK
-$ACK PPCSSUPl SUPPLr
PPCSSUPC PCaULATO»
VOLUME CHANOC BUPeTTt
HrOPAULIC PUMP
Figure 26. General layout of the hydraulic system (after Reference 30)
This method requires proper correction for membrane penetration and
other factors which might influence the observed volume change measure-
ments. The procedure used for determining the effects of membrane pene-
tration consisted of using the LVDT clamp lateral strain sensor with
the burette on saturated specimens. The membrane penetration for
various pressures was assumed equal to the difference in volume between
that calculated using the L/DT clamp deformations and that observed in
the burette. By calibrating membrane penetration effects for several
densities, membrane penetration corrections could be made for future
tests.
Test Procedures
kk. All specimens were molded in an air-dried condition inside
a 2.8-in.-diam by 6.0-in.-high mold. Desired densities were achieved
by vibrating each layer to the proper density with a hand-held air
hammer. All specimens except those tested by the burette method were
tested dry, while the burette method specimens were saturated by placing
hi
the specimens underwater and subjecting them to a vacuum to remove
any air prior to testing.
1*5, The test procedure used in consolidating the specimen with
no lateral yielding was about the same whether the lateral sensor was
Instrumented with an internal or external LVDT or strain gages. First
a null reading was established on the readout system connected to the
lateral strain sensor used for the particular test. Both axial load
and confining pressure were increased simultaneously such that a null
condition was maintained during the entire test. Readings of axial
load and axial deformation were recorded at every 10-psi increment of
confining pressure.
h6. The procedure used in the indirect method was slightly
different from the test procedure used in the other methods since no
null point was needed in this test. First, a correlation was computed
between the change in height and the change in the observed volume of
the specimen under no lateral yielding, and then the axial load and cell
pressure were Increased as dictated by the computed correlation. The
procedure was slow and tedious and required continuous adjustment of
the cell pressure; readings were taken whenever the collected test data
fell on the established volume change versus axial deformation
relationship.
k2
PART IV: TEST RESULTS AND DISCUSSION OF EXPERIMENTAL RESULTS
kf. During K consolidation, the diameter at mldheight of the
specimen was held constant. The average axial stress a was assumed EL
to be equal to the major principal stress o.. , and the radial stress o
was considered to be equal to the minor principal stress a- .
1*8. Generally, the value of K for the Reid-Bedford sand was
found to be practically the same irrespective of the method used in con-
trolling the radial deformation of the specimen. A special effort was
made to present the various factors affecting the value of K and to
correlate the experimental data with available theoretical analysis. The
axial stress behavior for the Reid-Bedford sand tested was found to
vary slightly from one method of radial restraining to the other. An
explanation and the implication of such variation were offered.
Coefficient of Earth Pressure at Rest K o
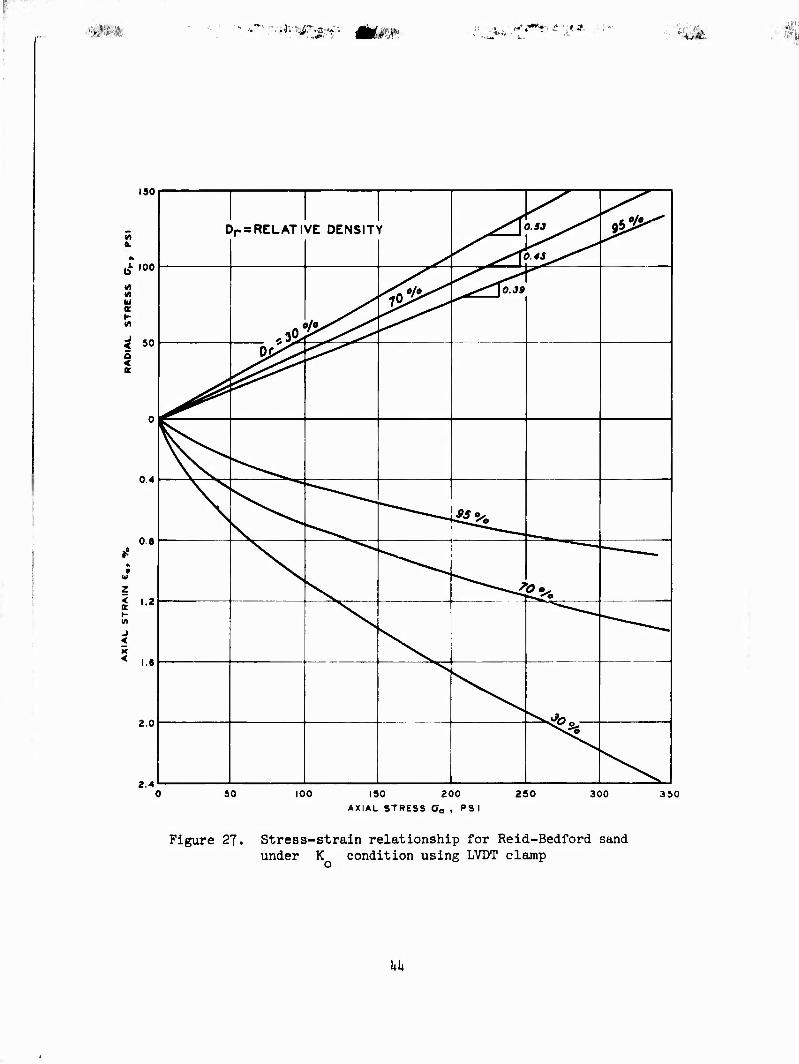
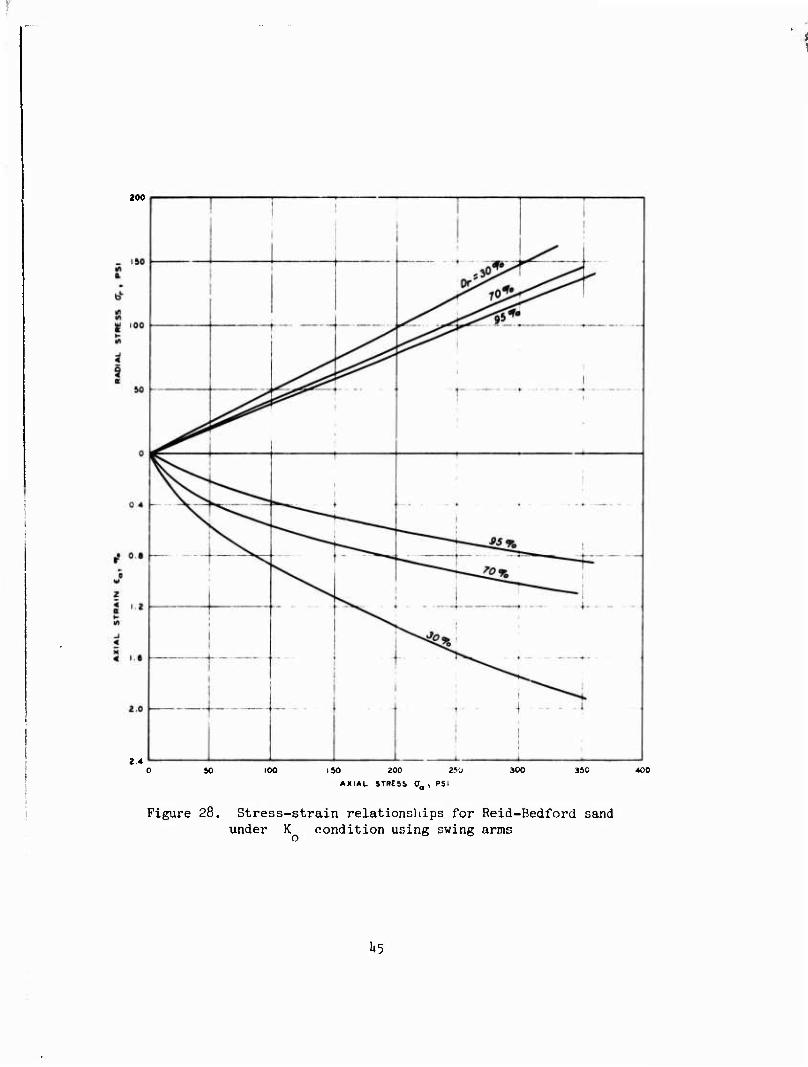
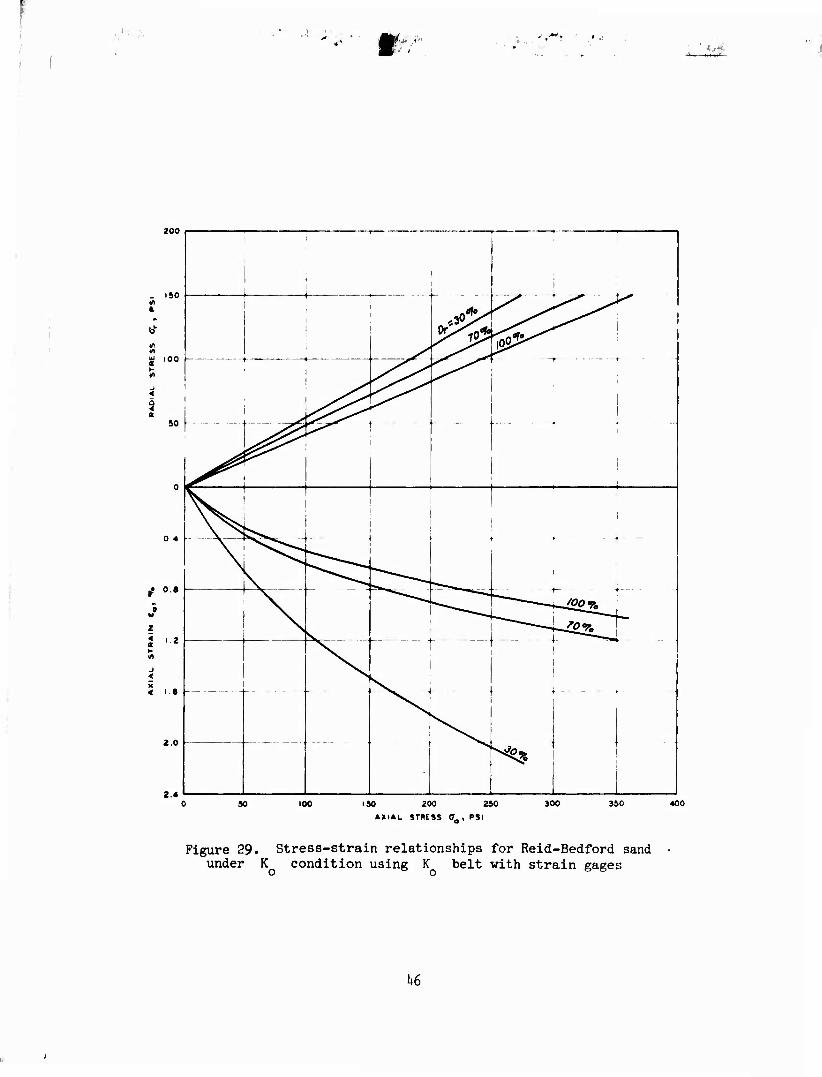
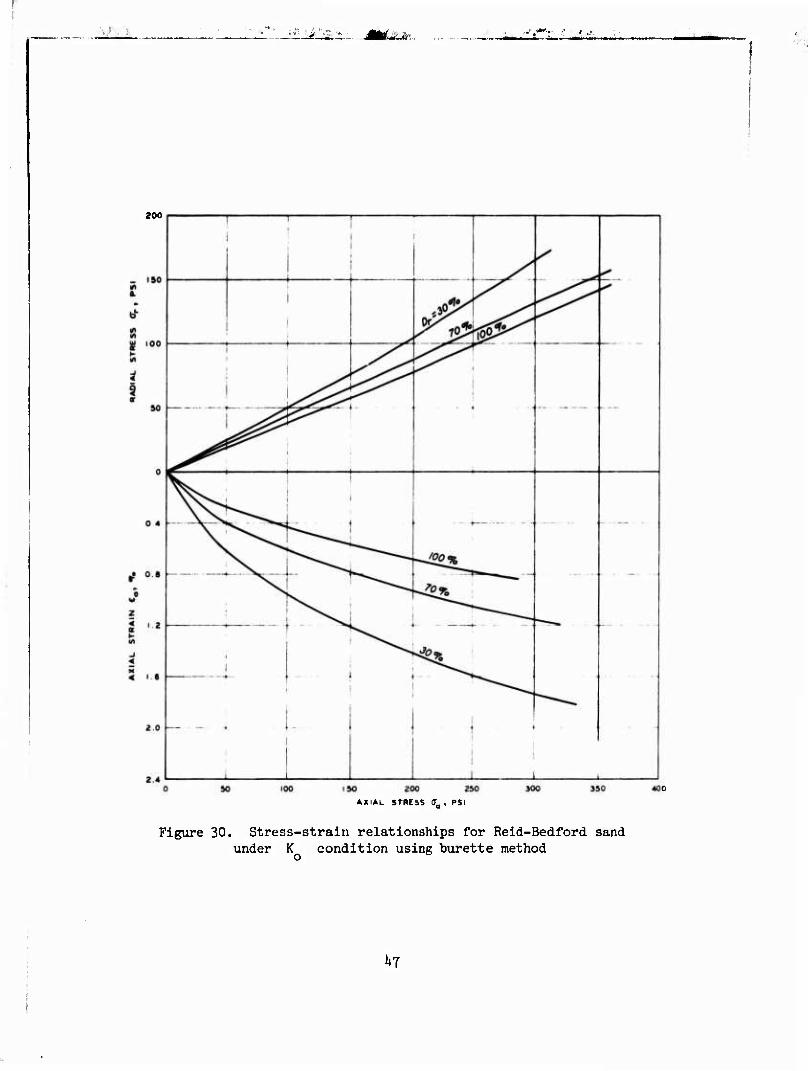
1*9• The stress-strain curves for the Reid-Bedford sand tested
using the LVDT clamp, the swinging arms, the K belt with strain gages,
and the burette method are shown in Figures 27-30, respectively. The
upper portion of these figures shows the relationship between the radial
and axial stress, while the bottom portion shows the relationship be-
tween the axial stress, and axial strain. It is apparent from these
graphs that the relationship between a and a can be approximated
by a straight line passing through the origin; consequently, K can be
expressed as the ratio of o to o . Values of K for the sand r r a o tested using the LVDT clamp, swinging arms, the K belt with strain
gages, and the burette method are presented in the following tabulation.
LVDT Clamps Swinging Arm.-; o Belt Burette Method Rf'latlve Relative ' Relative " Relative Dcnaity Density Density Density
X) , t K V , % K D , % K D , 3S K
30.9 0.51 P5.6 0.51 P6.9 0.55 36.0 0.5? 75.1 0.1t5 72.1 0.li2 7P.9 O.I18 69.3 O.lili 91» ,0 0.39 99.5 0,39 96.5 0.1.? 96.8 0.39
1*3
■ J ■ " ^■■■'*:WM*r mm'. ■Jf^S-'HJh 'i-:^k
ISO
V)
b1 l00
M M U
J < 5 < it
50
0.4
0.S
J ,2 »- in
-i < s < 1.6
2.0
2.4
1 c ir = RELATIVE DENSIT r ^p^^ ^V^4*^^
^^
-i«; ̂ ^
S^*!*^^ nP^ ^\0.39
^-
L^ ^
*^^
^
^^
\ \
^i
\ \v
^^^^^ 2^0
""
\ \ ^
^v
^^sVo r^1^
\
50 100 190 200
AXIAL STRESS aa , PSI
290 300 350
Figure 27. Stress-strain relationship for Reid-Bedford sand under K condition using LVDT clamp
o
1+1*
200
2.4 iO I SO 200 2S0
AXIAL sTRess aa, PSI
300 400
Figure 28. Stress-strain relations!lips for Reid-Bedford sand under K condition using swing arms
^5
200
. 150
to'
M £ 100
50
i '2
4 I«
2.0
2.4
1 1 1
—
1 i
i i * ■
i i ^
f-— ■'■ — -■■■
- - -
i j
-+ -—■-* - \
i '
L ._.j^
\
i ■ 1
* ■*
i f- V- ]
^Sr- t ^^4
1
^ ̂ 3
> - ■ — -
50 100 150 200 250
*XiAL STRESS O-, PSI
300 350 400
Figure 29. Stress-strain relationships for Reid-Bedford sand under K condition using K belt with strain gages
1*6
- .,:r nrfi. <
200
SO 150 200 250
AXIAL STRESS OV , PSI
Figure 30. Stress-strain relationships for Reid-Bedford sand under K condition using burette method
hi
I >')5 'Jr*'^.,^,-. ft .';',»' '*>&
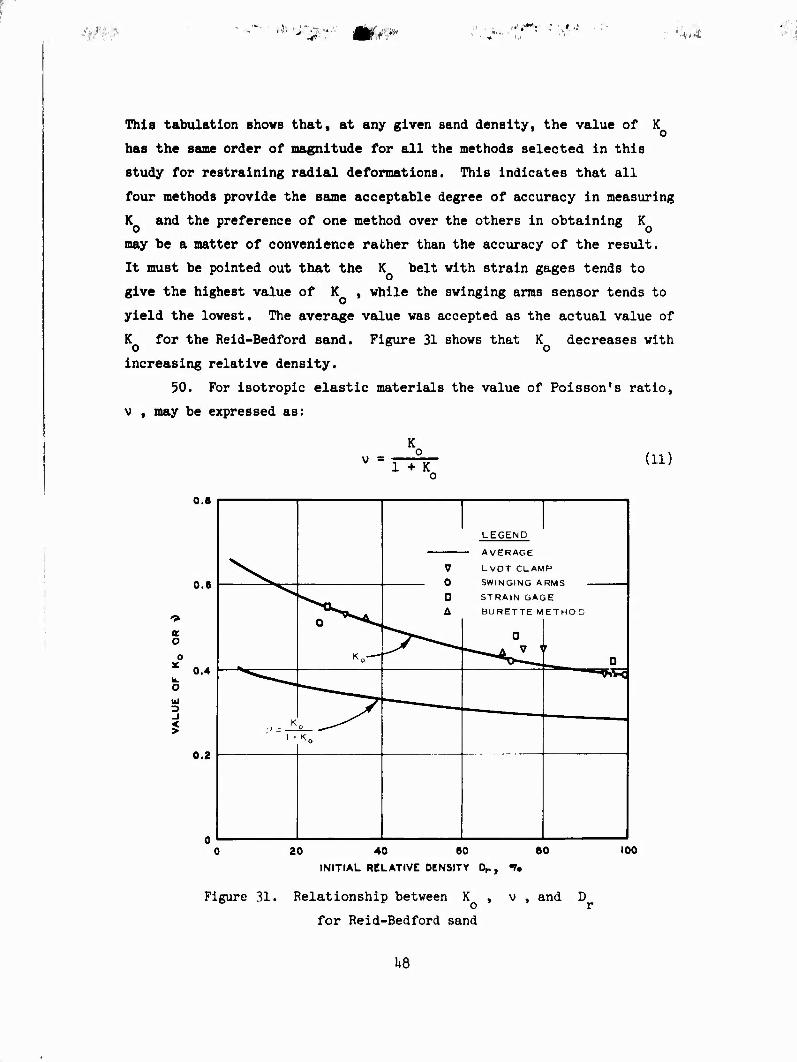
This tabulation shows that, at any given sand density, the value of K
has the same order of magnitude for all the methods selected In this
study for restraining radial deformations. This Indicates that all
four methods provide the same acceptable degree of accuracy In measuring
K and the preference of one method over the others in obtaining K o o may be a matter of convenience rather than the accuracy of the result.
It must be pointed out that the K belt with strain gages tends to
give the highest value of K , while the swinging arms sensor tends to
yield the lowest. The average value was accepted as the actual value of
K for the Reid-Bedford sand. Figure 31 shows that K decreases with o D o increasing relative density.
50. For Isotropie elastic materials the value of Poisson's ratio,
v , may be expressed as:
K v = 1 + K (11)
o o
U.B
LEGEND
\ 7 LVDT CLAMP
o.e ^v_ 0 SWINGING A RM^ ^N 0 STRAIN GAGE
a BURETTE METHOD o ^^.
^^ a
0.4 K0-i -^ ^A>U ■
□ TO«
-_
K0 ^^
0.2
1 f »<o
20 40 60 80
INITIAL RELATIVE DENSITY Dr, "7.
100
Figure 31. Relationship between K , v , and D
for Reid-Bedford sand
U8
aii._K
The variation of v as calculated from K with respect to the initial o
relative density of the Reiu-Peiiord sand is also presented in Fig-
ure 31. The trend of the data was expected because previous investiga- 29 6
tors such as Jaky and Hendron have reported that K is inversely
proportional to the angle of internal friction 0 . 29 6
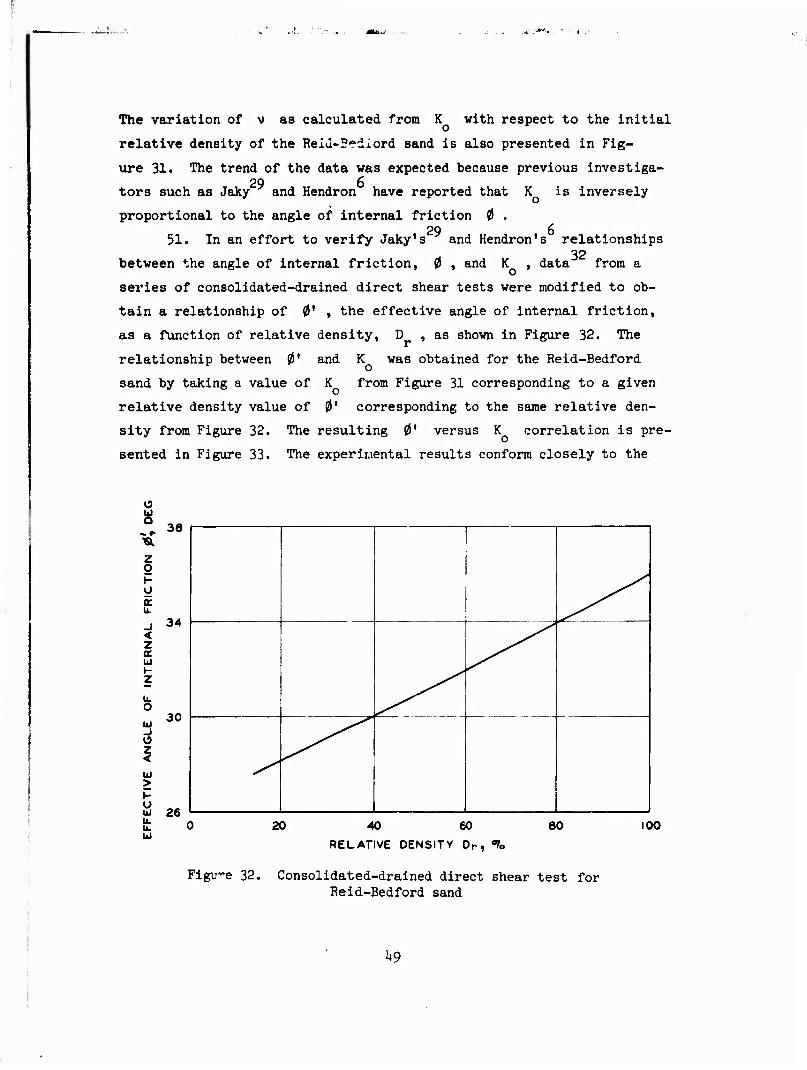
51. In an effort to verify Jaky's and Hendron's relationships 32
between the angle of internal friction, 0 , and K , data from a
series of consolidated-drained direct shear tests were modified to ob-
tain a relationship of 0' , the effective angle of internal friction,
as a function of relative density, D , as shown in Figure 32. The
relationship between 0' and K was obtained for the Reid-Bedford
sand by taking a value of K from Figure 31 corresponding to a given
relative density value of 0* corresponding to the same relative den-
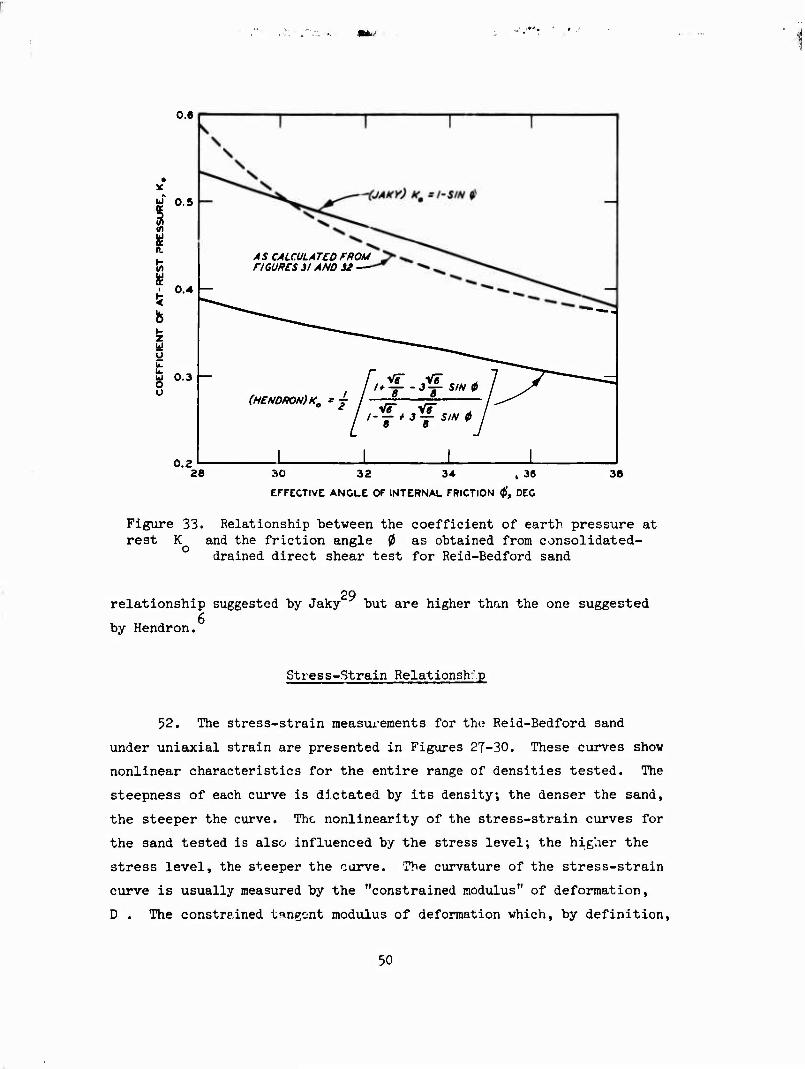
sity from Figure 32. The resulting 0* versus K correlation is pre-
sented in Figure 33. The experimental results conform closely to the
o ä
z o p o E
_i < z a.
z u. O
o z <
> o UJ u. b. UJ
AB
34
30
9«
'
j
-
20 40 60
RELATIVE DENSITY Dr, "Ra
80 100
Figure 32. Consolidated-drained direct shear test for Reid-Bedford sand
^9
0.6
0.4
W 0.5
I m
R.
i
z O
| 0-3 O
0.2 26
/45 CALCULATCD FROM FIGURES 31 AND S3 —
(HENDfK>N)K0 =j
30 32 34 , 36
EFFECTIVE ANGLE OF INTERNAL FRICTION 0', DEC
38
Figure 33. Relationship between the coefficient of earth pressure at rest K and the friction angle 0 as obtained from consolidated-
drained direct shear test for Reid-Bedford sand
relationship suggested by Jaky'
by Hendron.
29 but are higher than the one suggested
Stress-Strain Relationshrp
52. The stress-strain measurements for the Reid-Bedford sand
under uniaxial strain are presented in Figures 27-30. These curves show
nonlinear characteristics for the entire range of densities tested. The
steepness of each curve is dictated by its density; the denser the sand,
the steeper the curve. The nonlinearity of the stress-strain curves for
the sand tested is also influenced by the stress level; the higher the
stress level, the steeper the carve. The curvature of the stress-strain
curve is usually measured by the "constrained modulus" of deformation,
D . The constrained tangent modulus of deformation which, by definition.
50
is the ratio of axial stress with respect to strain under zero lateral
strain may be expressed as:
d 0
D = „ a äea
where e a is the axial strain.
(12)
For linear elastic materials, D may be expressed in terras of the mod-
ulus of elasticity E and Poisson's ratio v , as:
n - E(l - v) /TO\ D " (1 + v)(l - 2v) (13)
or the value E can be expressed in terms of D and K as:
D(l + 2K )(1 - K ) E rrfn ° (lk' o
53. From Figures 27-30 it appears that the constrained modulus
for the Reid-Bedford sand tends to increase with increasing density and
increasing stress level used in the testing program. A general compari-
son of the stress-strain curves shows that tests with the swinging arms
yielded the highest constrained modulus while ohe LVDT clamps yielded
the lowest value. The burette method and the K belt with strain o gages were second and third, respectively. The experimental stress-
strain curves obtained may be approximated by an exponential function of
the form:
aa = me^ (15)
where m and n are constant or they can be expressed by a rectangular
hyperbola of the form:
a
51
..AfXvc^.v im-mfr ■'■.'•W,f'^^"Ä?* *.,,:Ä, r- ■:^> .1 ./■.;■ ii»
where a and b are positive numbers. The experimental fit of the
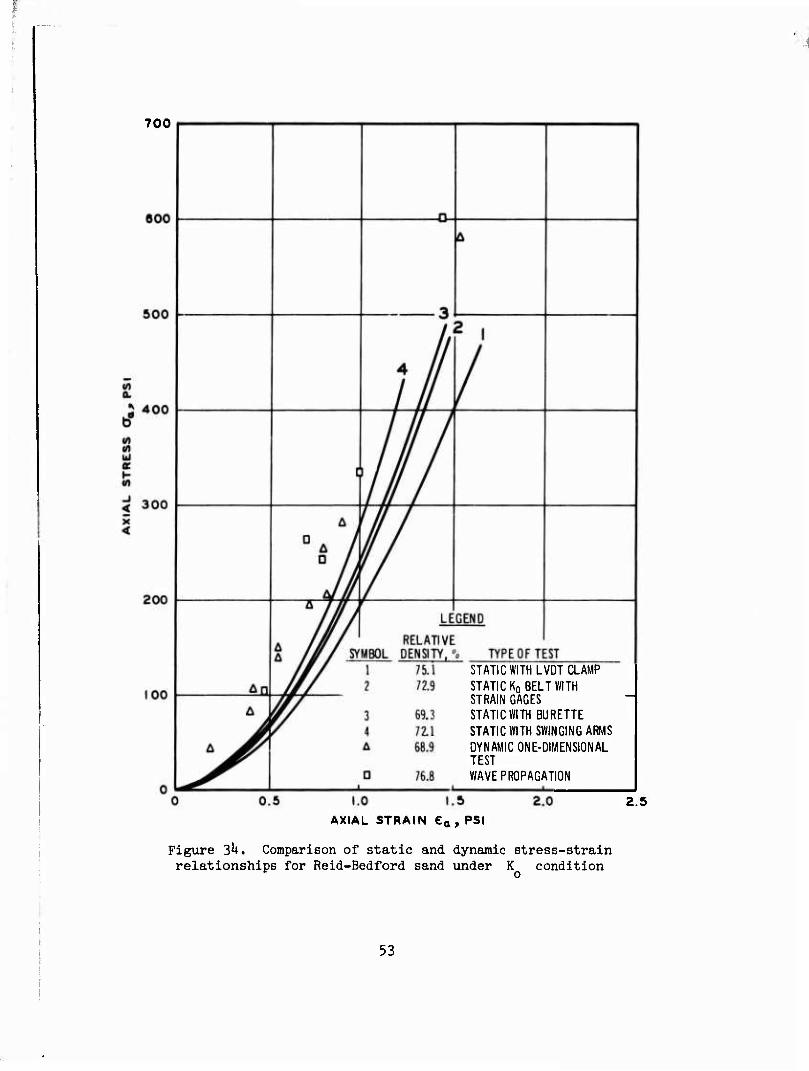
data is beyond the scope of this study. 33 5^. In a previous study Durbin conducted dynamic uniaxial com-
pression and wave propagation tests on 1.5-in.-diam specimens of Reid-
Bedford sand. These tests were compared at a comparable density with
static K tests conducted in this study, and the results are summa-
rized in Figure 31». It appears from the figure that the stiffness of
the sand in the static test is lower than that obtained from wave propa-
gation or dynamic uniaxial compression tests. However, the difference
is small enough so that K test data from static tests may be used in
a dynamic problem with reasonable accuracy. A comprehensive discussion
of the effects of loading rate on the stiffness and strength of sand is
beyond the scope of this report. This topic is summarized in recent re- 3^ 35 ports by Whitman and Isenberg.
Factors Affecting K and Constrained Modulus
55. It has been shown earlier that the values of K and the con- o strained modulus D are affected by the relative density and stress
level, but they are only slightly influenced by the method used in re-
straining the lateral movement during the test and the rate of loading.
However there are many other factors which may influence K and D ;
these factors are discussed in the following paragraphs.
Effect of lateral yielding
56. As early as 193^, Terzaghi pointed out the importance of no
lateral yielding on the measurement of earth pressure behind a retaining
wall. Since that time it has been considered that small lateral strains,
particularly when the soil sample is enclosed in a steel ring, as in the
case of a conventional consolidometer, have a negligible effect on the 36
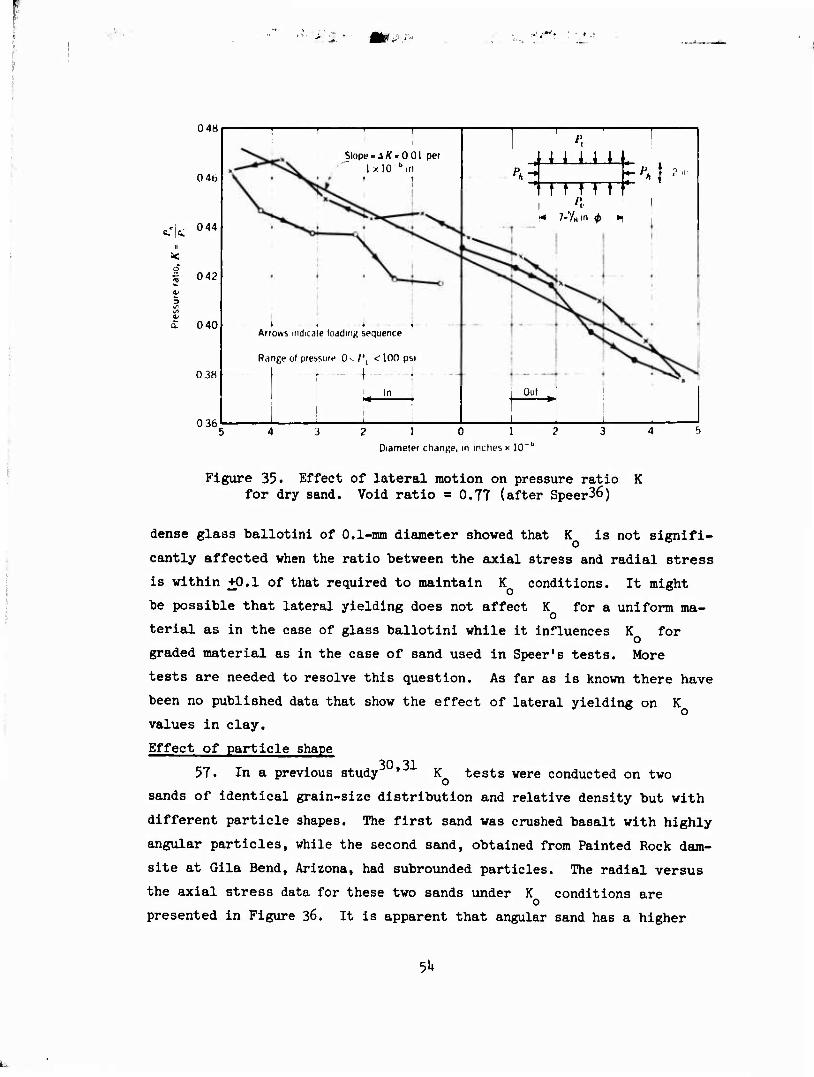
value of K . Research work credited to Speer by Fulton and Hendron
indicated that the lateral strain had a significant effect on the value
of K . Speer's results on sand presented in Figure 35 show that a lat- 0 -6
eral strain of 0.5 * 10* percent may cause a 10 percent reduction in
the value of K . However Andrawes and El-Sohby in a recent study on
52
i
700
STATIC WITH LVDT CLAMP STATIC KQ BELT WITH STRAIN GAGES STATIC WITH BURETTE STATIC WITH SWINGING ARMS DYNAMIC ONE-DIMENSIONAL TEST WAVE PROPAGATION
2.5 AXIAL STRAIN ea, PSI
Figure 3U. Comparison of static and dynamic stress-strain relationships for Reid-Bedford sand under K condition
53
048
0 4b
| 0 42
a
040
0 38
0 36
' I
Slope-^>001 per IxlO'Sn
r ]
* , -4 f- ArroAS indicate loading sequence
Range ot pressure 0 v /', < 100 psi
( ! I In
PH^
.1 M n n. . tTTTTTT
n i
Out
j I 2 10 1?
Diameter change, in inches x 10'''
Figure 35. Effect of lateral motion on pressure ratio K for dry sand. Void ratio =0.77 (after Speer36)
dense glass ballotini of O.l-mm diameter showed that K is not signifi-
cantly affected when the ratio between the axial stress and radial stress
is within +0.1 of that required to maintain K conditions. It might
be possible that lateral yielding does not affect K for a uniform ma- o terial as in the case of glass ballotini while it influences K for o graded material as in the case of sand used in Speer's tests. More
tests are needed to resolve this question. As far as is known there have
been no published data that show the effect of lateral yielding on K
values in clay.
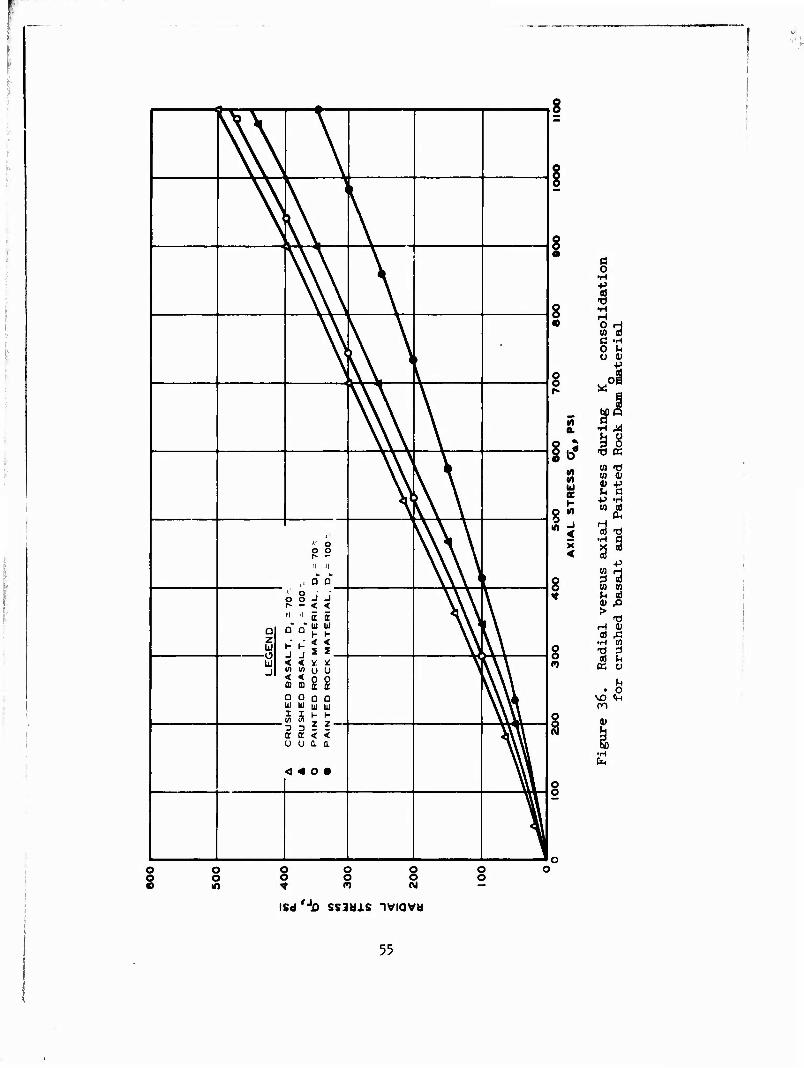
Effect of particle shape 30 31 57. In a previous study ' K tests were conducted on two
sands of identical grain-size distribution and relative density but with
different particle shapes. The first sand was crushed basalt with highly
angular particles, while the second sand, obtained from Painted Rock dam-
site at Gila Bend, Arizona, had subrounded particles. The radial versus
the axial stress data for these two sands under K conditions are o
presented in Figure 36. It is apparent that angular sand has a higher
5^
r
\ \
^ L V
\
\
I ^
\
\
\\
ii n 1 ̂
D z m -T
. D
, =
70"
-T,
D,
= 10
0 M
AT
ER
IAL
.,
MA
TE
RIA
L.
^
\
tu _i
SH
ED
BA
SA
I S
HE
D B
AS
AI
4T
ED
R
OC
K
4T
ED
R
OC
K N
1 3 3 t t c a < < U U Q. Q.
4 4 O •
\
1
8
n
a. •H » <k 08
b" -5 «
w W 4)
(0
'tS -d •H ß
X < S05
■p
^
1 o o
o o o o n o o O
O
OS o
'J, isd ro ss3uxs iviavu
55
&'f- ■■''*'*■•:
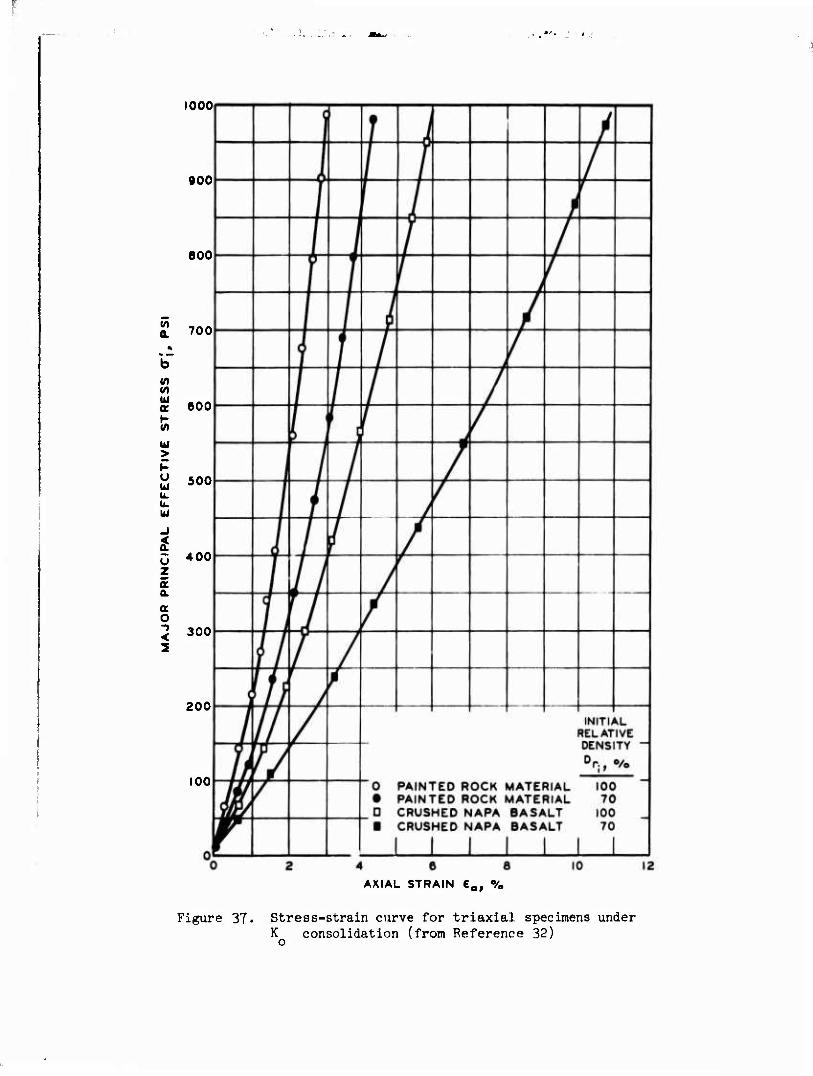
value of K than rounded sand, and the difference decreases with de- o creasing density. Figure 37 shows the axial stress-strain relationship
for these two sands and demonstrates that the constrained modulus for
Painted Rock material is much higher than that of crushed basalt. This
indicates that the constrained modulus decreases with increasing angu-
larity of the particles.
Effect of unloading and reloading
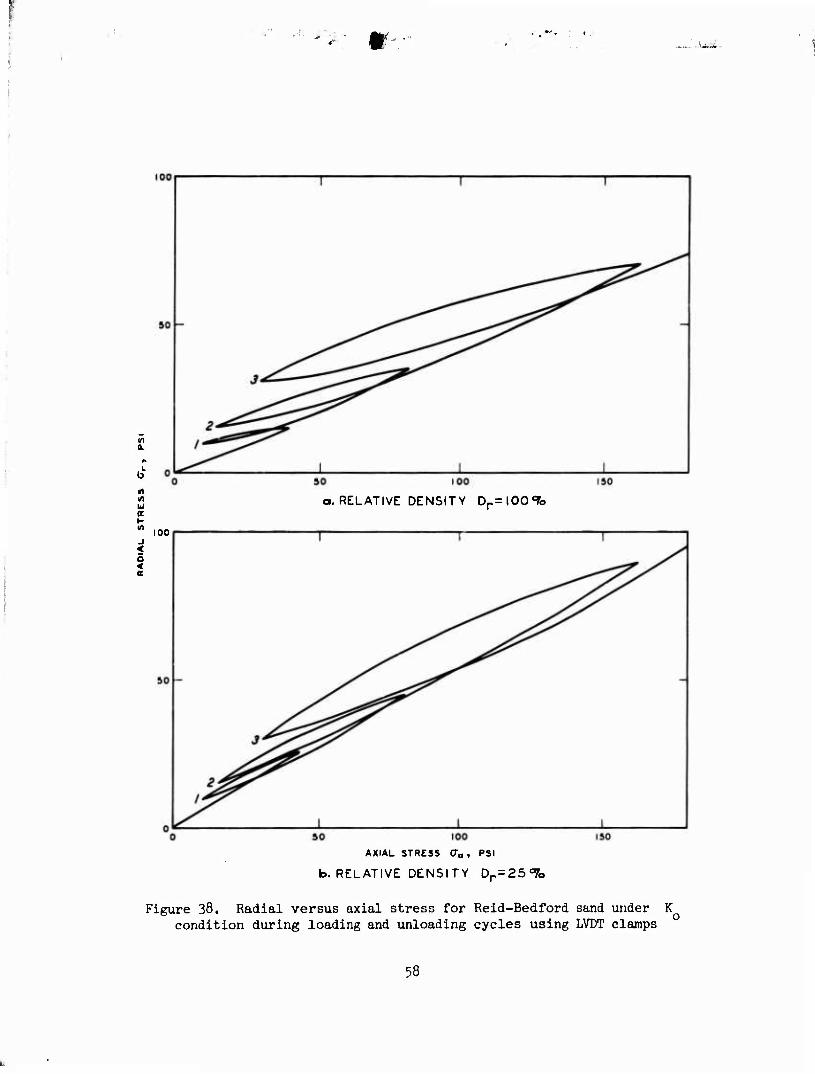
58. The relationship between the radial and axial stresses for
Reid-Bedford sand under repeated loading and unloading cycles using the
LVDT clamps is shown in Figure 38. The relationship for the first load-
ing cycle may be approximated by a straight line. However, upon unload-
ing, the stress-strain relationship becomes nonlinear with a convex shape.
The relationship during first reloading is also nonlinear and concave
upward with a slope much flatter than the first loading cycle but
steeper than the first unloading cycle. This trend was similar for the
dense and loose specimens; however, the denser specimen exhibited a
flatter slope than the loose specimen for any particular loading or un-
loading cycle. The results are presented in the following tabulation.
Variation of K
Stress Cycle Dr \ l00%
1st loading 0.37
1st unloading 0.37 to 0.9
2nd loading 0.9 to 0.U3
2nd unloading 0.k3 to 1.0
3rd loading 0.1+3 to 1.0
3rd unloading 1.0 to O.I43
Value
= 25J5
0.58
0.58 to 0.9
0.90 to O.56
O.56 to 0.90
0.90 to 0.55
0.55 to 1.0
These results also Indicate that K is always lower on loading than un-
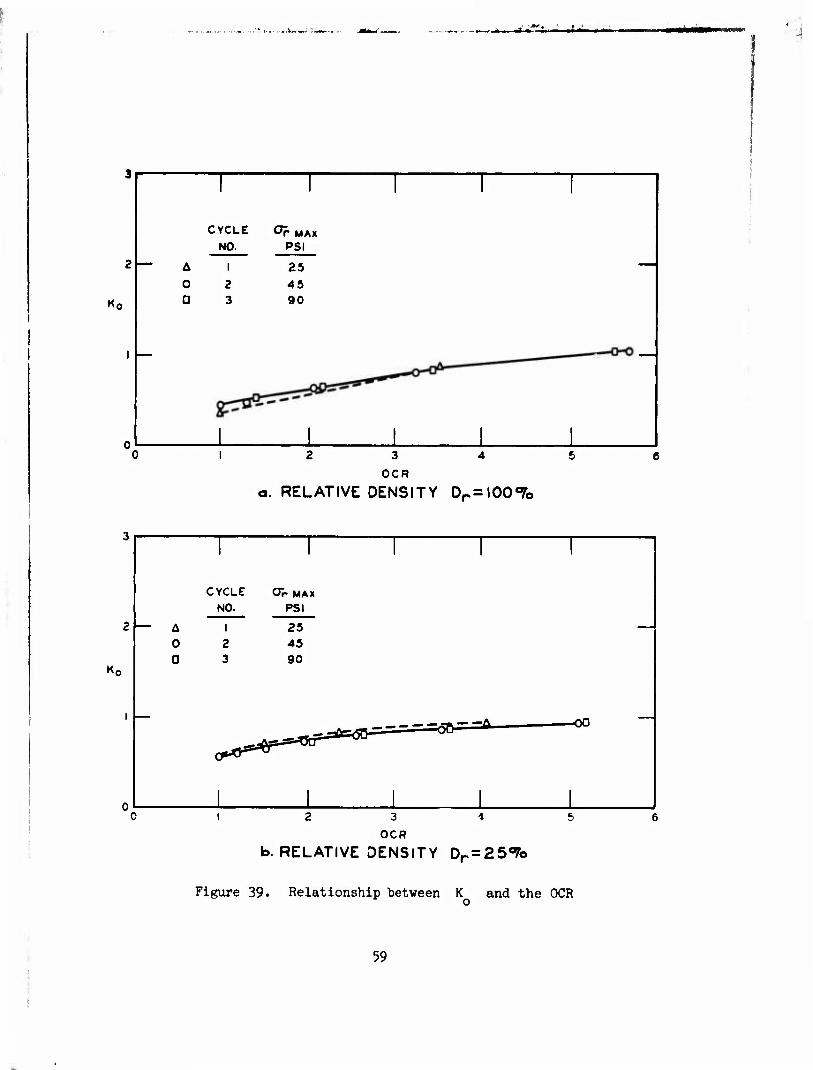
loading, and that K varies with increasing number of loading cycles.
The values K for different loading cycles when plotted as a func-
tion of the overconsolidation ratio (OCR) in Figure 39, show that K
increases progressively with increasing OCR in a manner which is inde-
pendent of the loading cycle. From Figures 38 and 39 it is obvious that
56
1000
900
eoo
a. 700 «
b V) V) til at 600 K (ft Ul > ^- o bJ 500 U. It. UJ
-1 < a. u 400 z a: a. a O -t < 300 3
200
100
4 6 AXIAL STRAIN 6.
Figure 37. Stress-strain curve for triaxial specimens under K consolidation (from Reference 32)
ft.
b1
10 m u BE (- in
J < 5 <
a. RELATIVE DENSITY Dr=l00<:fo
100
100
AXIAL STRESS Cra , PSI
b. RELATIVE DENSITY Dr=2507o
Figure 38. Radial versus axial stress for Reid-Bedford sand under K condition during loading and unloading cycles using LVDT clamps
58
...._*_-.-ij - ^.d
2 —
CYCLE ^r MAX NO. PSI
A 1 25 0 2 45 a 3 90
3
OCR
a. RELATIVE DENSITY D-slOO^o
CYCLC Or MAX
1 1
m,^ A
NO.
1
PSI
25 0 2 45 a 3 90
0^
i
=dlV=
1
^ — ■=<> oa
"
□
1 3
OCR
b. RELATIVE DENSITY Dr. = 2507o
Figure 39. Relationship between K and the OCR o
59
the value of K is influenced by stress history, a phenomenon which is o
more pronounced in cohesive soil.
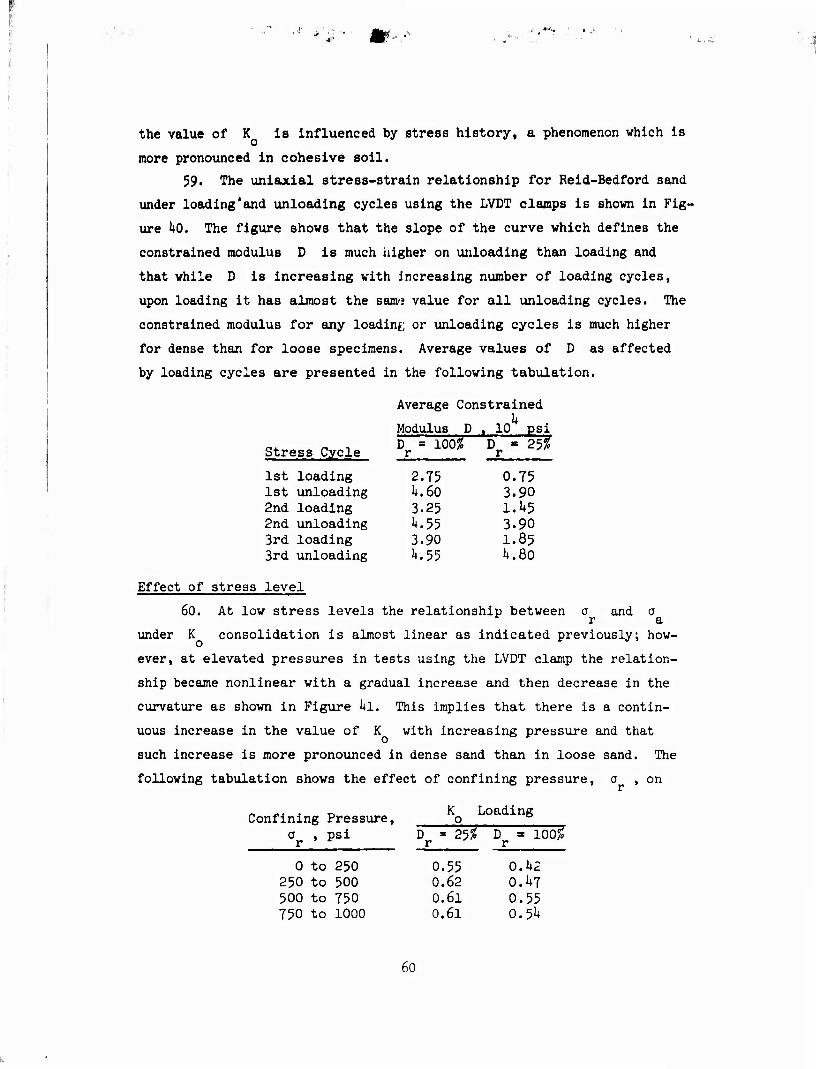
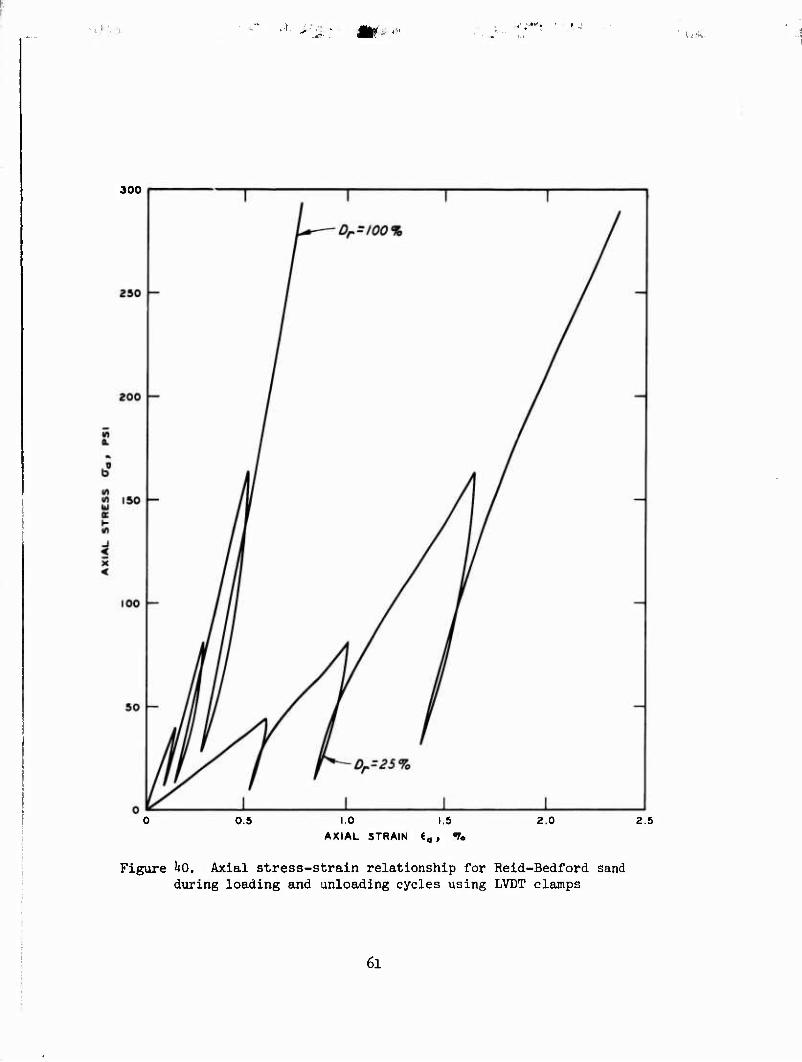
59. The uniaxial stress-strain relationship for Reid-Bedford sand
under loading'and unloading cycles using the LVDT clamps is shown in Fig-
ure ho. The figure shows that the slope of the curve which defines the
constrained modulus D is much higher on unloading than loading and
that while D is increasing with increasing number of loading cycles,
upon loading it has almost the sam«; value for all unloading cycles. The
constrained modulus for any loading or unloading cycles is much higher
for dense than for loose specimens. Average values of D as affected
by loading cycles are presented in the following tabulation.
Average Constrained
JSS Cycle
Modulus D . 10 psi
Str« D = 100^ Dr = 2555
1st loading 2.75 0.75 1st unloading 1*.60 3.90 2nd loading 3.25 1.U5 2nd unloading i*.55 3.90 3rd loading 3.90 1.85 3rd unloading ^.55 1+. 80
Effect of stress level
60. At low stress levels the relationship between o and o r a
under K consolidation is almost linear as indicated previously; how-
ever, at elevated pressures in tests using the LVDT clamp the relation-
ship became nonlinear with a gradual increase and then decrease in the
curvature as shown in Figure 1+1. This implies that there is a contin-
uous increase in the value of K with increasing pressure and that
such increase is more pronounced in dense sand than in loose sand. The
following tabulation shows the effect of confining pressure, a , on
Confining Pressure, or . psi
0 to 250 250 to 500 500 to 750 750 to 1000
K Loading
D = 255S r
0.55 0.62 0.61 0.61
D = 1005b r
0.U2 0.U7 0.55 0.5^
60
•>.'■[■% IJA.
300
0.5 1.0 1.5 AXIAL STRAIN ia , t»
2.0 2.5
Figure 1*0. Axial stress-strain relationship for Reid-Bedford sand during loading and unloading cycles using LVDT clamps
61
1000
soo
in a
eoo in in
% t- m j <
400
200
■ —_
^ t ^ ^
^
t^
^ f
Of/
if'
i
i |
^
^ zoo 400 eoo eoo IOOO 1200
AXIAL STRESS (T-, PSI
1400 1 eoo 1800 200L
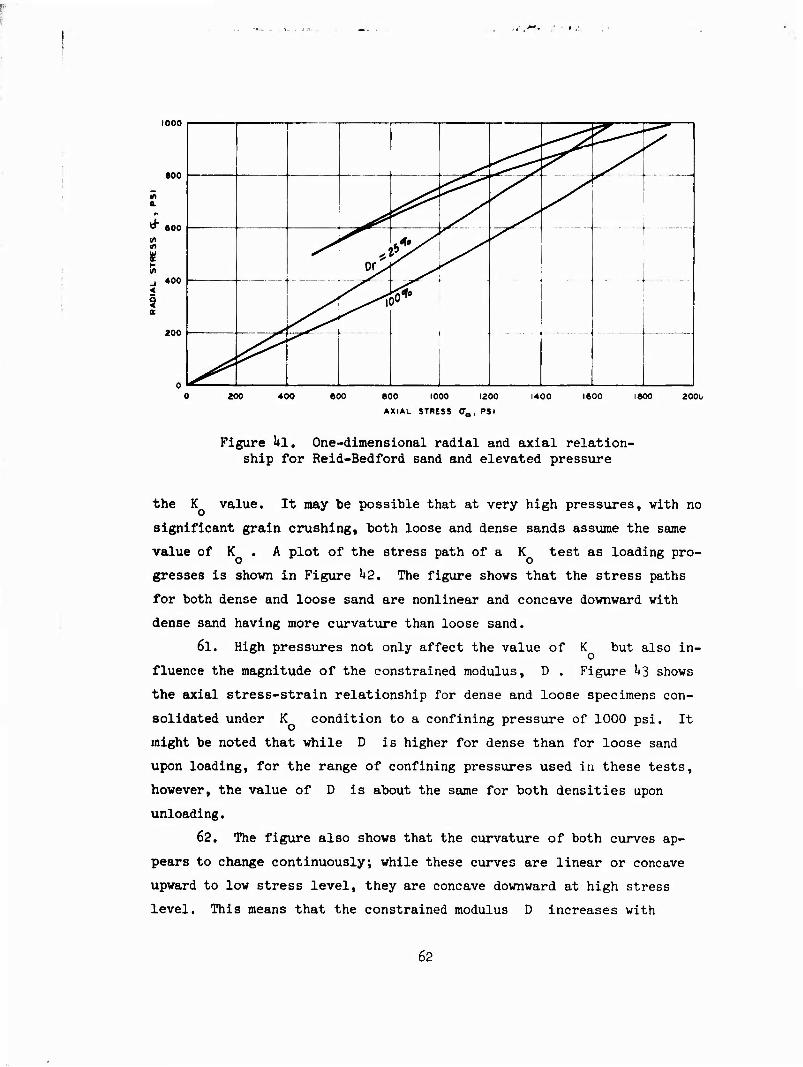
Figure \\. One-dimensional radial and axial relation- ship for Reid-Bedford sand and elevated pressure
the K value. It may be possible that at very high pressures, with no
significant grain crushing, both loose and dense sands assume the same
value of K . A plot of the stress path of a K test as loading pro-
gresses is shown in Figure U2. The figure shows that the stress paths
for both dense and loose sand are nonlinear and concave downward with
dense sand having more curvature than loose sand.
61. High pressures not only affect the value of K but also in-
fluence the magnitude of the constrained modulus, D . Figure I43 shows
the axial stress-strain relationship for dense and loose specimens con-
solidated under K condition to a confining pressure of 1000 psi. It
might be noted that while D is higher for dense than for loose sand
upon loading, for the range of confining pressures used in these tests,
however, the value of D is about the same for both densities upon
unloading.
62. The figure also shows that the curvature of both curves ap-
pears to change continuously; while these curves are linear or concave
upward to low stress level, they are concave downward at high stress
level. This means that the constrained modulus D increases with
62
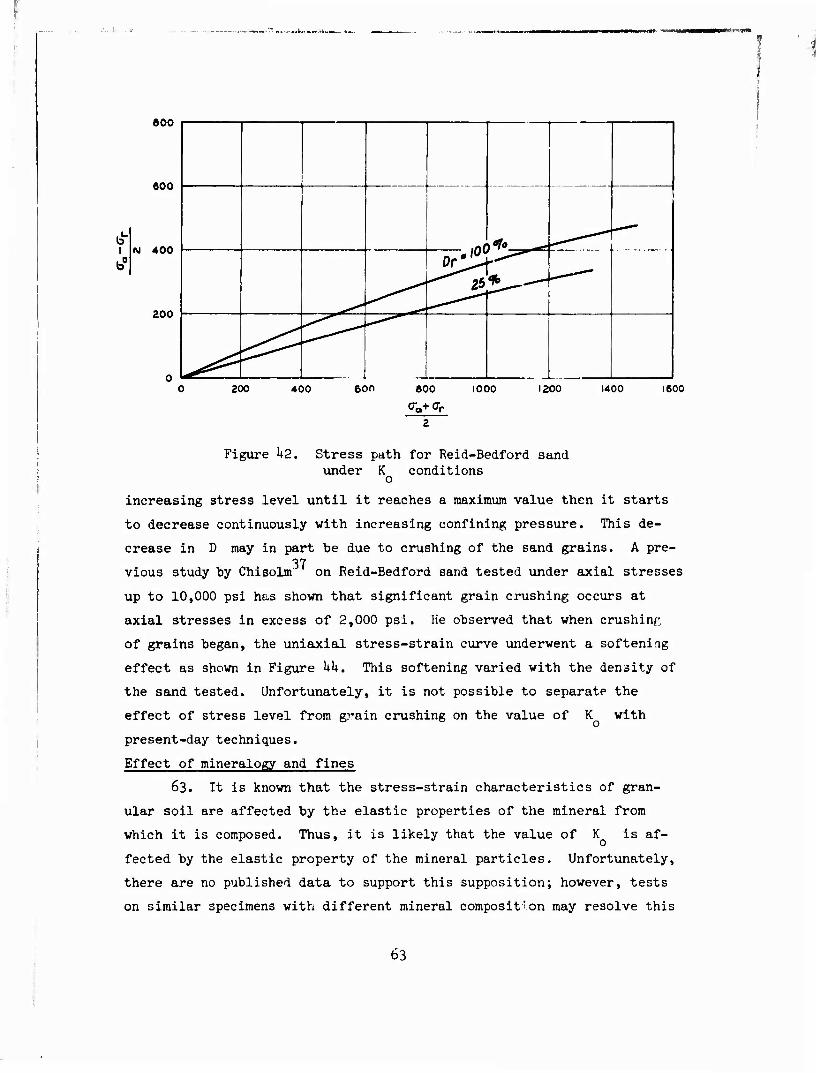
b1- I
800
600
N 400
200
nt
*_
, —
^- 25 -"
^
200 400 600 800 1000 1200 1400 1600
Figure ^2. Stress path for Reid-Bedford sand under K conditions
o
increasing stress level until it reaches a maximum value then it starts
to decrease continuously with increasing confining pressure. This de-
crease in D may in part he due to crushing of the sand grains. A pre- 37
vious study by Chisolm" on Reid-Bedford sand tested under axial stresses
up to 10,000 psi has shown that significant grain crushing occurs at
axial stresses in excess of 2,000 psi. He observed that when crushinf,
of grains began, the uniaxial stress-strain curve underwent a softening
effect as shown in Figure UU. This softening varied with the density of
the sand tested. Unfortunately, it is not possible to separate the
effect of stress level from grain crushing on the value of K with
present-day techniques.
Effect of mineralogy and fines
63. It is known that the stress-strain characteristics of gran-
ular soil are affected by the elastic properties of the mineral from
which it is composed. Thus, it is likely that the value of K is af-
fected by the elastic property of the mineral particles. Unfortunately,
there are no published data to support this supposition; however, tests
on similar specimens with different mineral composition may resolve this
63
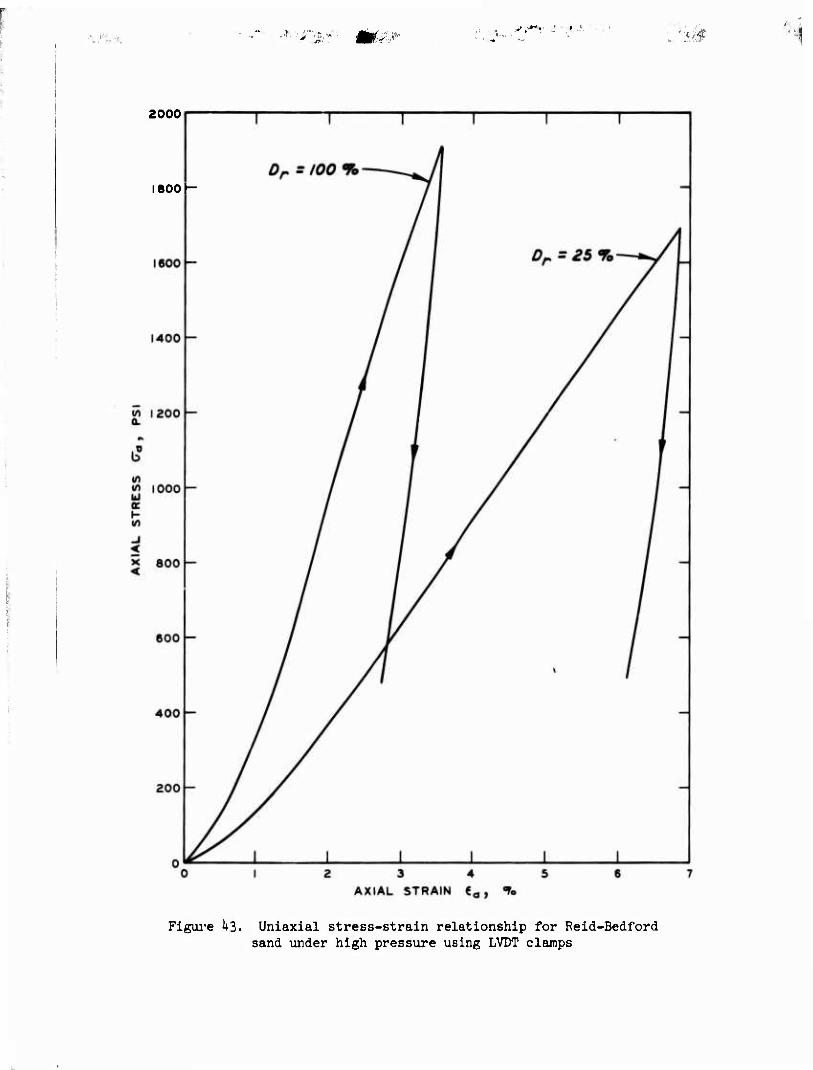
:J {**■•_■ .'. v-f .■.". ' ■ ;' vi'-ß : ■}■*
;i
2000
1800 -
Figure 1*3. Uniaxial stress-strain relationship for Reid-Bedford sand under high pressure using LVDT clamps
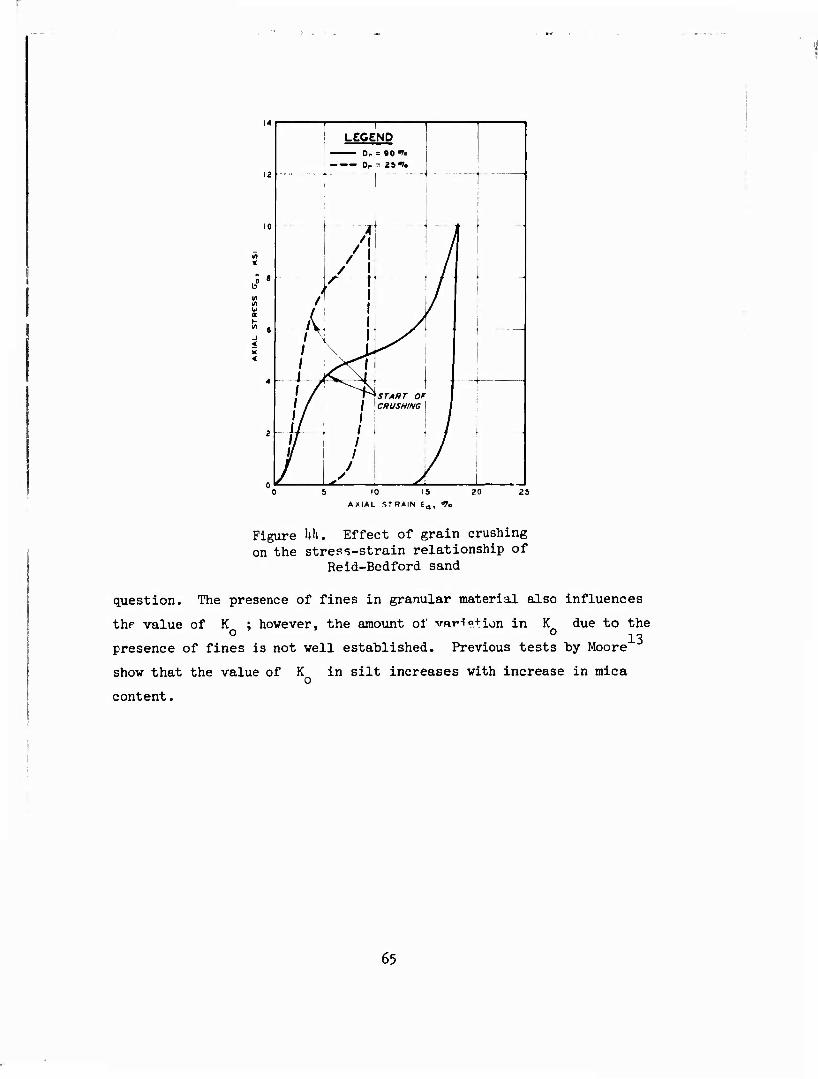
LEGEND
Or = Ztl»
I
1
( /
1
1 / / /\ ■
K. \i J ...A
■ if
/ / / / / /
/
STAUT OF CRUSHING
j \
5 10 15 20 AXIAL STRAIN €a, "^o
25
Figure W. Effect of grain crushing on the stress-strain relationship of
Reid-Bedford sand
question. The presence of fines in granular material also influences
the value of K ; however, the amount of variation in o ' ' K due to the
13 presence of fines is not well established. Previous tests hy Moore
show that the value of
content.
K in silt increases with increase in mica
65
PART V: CONCLUSIONS AND RECOMMENDATIONS
Conclusions
6k, Within the bounds of this investigation (the testing methods
employed, the material tested, and the procedures and equipment used),
the following conclusions are drawn:
a. The value of K for Reid-Bedford sand was found to be practically the same Irrespective of the method used in maintaining no radial deformations of the specimen. The LVDT clamp, KQ belt, swinging arm lateral strain sensors, and the indirect burette method all produced comparable K0 values for relative densities ranging from 25 to 99 percent. The K0' belt ti nded to give the highest K0 values while the swinging arras lateral strain sensor indicated the lowest values. The LVDT clamp is preferred for laboratory testing ^ ••nee it is easier to use and maintain and also provides reliable results.
IK The experimentally derived K0 values agree well with Jaky's^ theoretical equation:
K = 1 - sin 0 o
while Hendron's equation underestimated the experimental values.
£. K0 values determined by dynamic and wave propagation techniques conducted previously by Durbin33 agree well with those determined statically in this study. Hence K0 and the stress-strain relationships of Reid-Bedford sand under KQ conditions are only slightly affected by the rat a of loading, and statically determined K0 values and strass-strain relationships may be used for dynamic problems.
ci. K0 values are lower on loading than on unloading and vary with increasing number of loading cycles. Thus K is influenced by the stress history.
£. K0 increases with increasing stress level for dense sand and remains almost unchanged for loose sand.
£. The constrained modulus, D , of Peid-Bedford sand in- creases with increasing density and increasing stress' level. The swinging arms lateral strain sensor gave the highest constrained modulus values while the
66
r
.^fc^L.—.
LVDT clamp lateral strain sensor gave the lowest.
£. The constrained modulus, D , increases with increasing numbers of loading cycles, is much higher on unloading, and has almost the same value for each unloading cycle.
Recommendations
65. With regard to further development of the findings of this
study, it is recommended that:
a. A study be made of the effect of rate of strain, grain crushing, and the presence of fines on the value of K in granular soil.
b. A similar study be conducted on cohesive soils.
67
.*■ S"-^--- ma.-'ja* >: '■'..■ "''•'
REFERENCES
1. Terzaghi, K., "Large Retaining Wall Test," Engineering News Record. Vol 112, 193U, pp 136-lUo.
2. Rinkert, A., "Measurement of the Pressure of Filling Materials Against Walls," Proceedings. Royal Swedish Geotechnical Institute. No. 17, 1959.
3. Mackey, R. D. and Kirk, D. P., "At Rest, Active and Passive Earth Pressures," Proceedings. Southeast Asian Regional Conference on Soil Engineering. Apr 1967. PP 187-198.
1+. Terzaghi, K., "Old Earth Pressure Theories and New Test Results," Engineering News Record. Vol 85, No. Ik, 1920, pp 632-637.
5. KJellman, W., "Report on an Apparatus for the Consumate Investiga- tion of the Mechanical Properties of Soils," Proceedings. First In- ternational Conference on Soil Mechanics and Foundation Engineering. Vol II, 1936, pp 16-20.
6. Hendron, A. J., The Behavior of Sand in One-Dimensional Compression, Ph. D. Thesis, 1963, University of Illinois, Urbana, 111.
7. Brooker, E. W. and Ireland, H. 0., "Earth Pressure at Rest Related to Stress History," Canadian Geotechnical Journal, Vol 11, No. 1, 1965, pi. "^
8. Murdock, L. J., "Consolidation Tests on Soils Containing Stones," Proceedings. Second International Conference on Soil Mechanics and Foundation Engineering. Vol 1. 19^8. pp 169-173.
9. Bishop, A. W., "Discussion," Proceedings. Brussels Conference on Earth Pressure Problems. Vol III, Sep 1958, pp 36-39.
10. Terrel, R. L. , Factors Influencing the Resilient Characteristics of Asphalt Treated'Xggregates. Ph. DT Thesis, 1967, University of California, Berkeley, Calif.
11. Dehlen, G. L., The Effect of Nonlinear Material Response on the Behavior of Pavement Subjected to Traffic Load. Ph. D. Thesis, 1969, University of California, Berkeley, Calif.
12. Al-Hussaini, M. M., "The Influence of End Restraint and Method of Consolidation on the Drained Triaxial Compressive Strength of Crushed Napa Basalt," Miscellaneous Paper S-70-18, June 1970, U. S. Army Engineer Waterways Experiment Station, CE, Vicksburg, Miss.
13. Moore, C. A., "Effect of Mica on K0 Compressibility of Two Soils," Journal. Soil Mechanics and Foundation Division. American Society of Civil Engineers. Vol 97. No. SM9. 1971. PP 1275-1289.
lit. Bishop, A. W. and Eldin, A. K., "The Effect of Stress History on the Relation Between KQ and Porosity in Sand," Proceedings. Third International Conference on Soil Mechanics and Foundation Engineer- ing. Vol I, 1953, pp 100-105.
68
15. Andrawes, K. Z, and El-Sohtoy, M. A., "Factors Affecting Coef- ficient of Earv.h Pressure K0 ," Journal. Soil Mechanics and Founda- tion Division. American Society of Civil Engineers. Vol 99, SM7, 1973, pp 527-538.
16. Holtz, R. D., "Discussion: Use of Servo Mechanism for Volume Change Measurement and KQ Consolidation," Geotechnique. Vol XXII, No. 2, Jun 1972, pp 371-372.
17. Bishop, A. W., Webb, D. L., and Skinner, A. E., "Triaxial Test on Soil at Elevated Cell Pressure," Proceedings. Sixth International Conference on Soil Mechanics and Foundation Engineering. Vol 1, 1965, pp 170-17U.
18. KJellman, W. and Jakobson, B.', "Some Relations Between Stress and Strains in Coarse-Grained Cohesionless Materials," Proceedings. Royal Swedish Geotechnical Institute. No. 9, 1955.
19. Gilbert, P. A. and Townsend, F. C, "Use of Rison Strain Gages in Triaxial Testing" (unpublished data), Feb 19Y2, U. S. Army Engi- neer Waterways Experiment Station, CE, Vicksburg, Miss.
20. Bison Instruments, Inc., "Soil Strain Gage Model HlOlA," Instruc- tion Manual.
21. Mazanti, B. B. and Holland, C. N., "Study of Soil Behavior Under High Pressure; Response of Two Recompacted Soils to Various Stages of Stress," Contract Report S-70-2, Report 1, Vol 1, Feb 1970, U. S. Army Engineer Waterways Experiment Station, CE, Vicksburg, Miss., prepared by Georgia Institute of Technology under Contract No. DACA 39-67-C-0051.
22. Ehrgott, J. Q., "Calculation of Stress and Strain from Triaxial Test Data on Undrained Soil Specimen," Miscellaneous Paper S-71-9, May 1971, U. S. Army Engineer Waterways Experiment Station, CE, Vicksburg, Miss.
23. Wroth, C. P. and Hughes, J. M. 0., "An Instrument for the In-Situ Measurement of the Properties of Soft Clays," Proceedings. Eighth International Conference on Soil Mechanics and Foundation Engineer- ing. Vol 1.2. 1973» PP h8l-k9h.
2k. BJerrum, L. and Anderson, K. H., "In Situ Measurement of Lateral Pressure in Clay," Proceedings. Fifth European Conference on Soil Mechanics and Foundation Engineering. Vol 1, 1972, pp 11-20.
25. Penman, A. D. M., "Discussion," Proceedings. Fifth European Con- ference on Soil Mechanics and Foundation Engineering. Vol 2, 1972,
26. Vaughan, P. R., "Discussion," Proceedings. Fifth European Conference on Soil Mechanics and Foundation Engineering. Vol 2, 1972, pp 72-75.
27. Fry, Z. B., "A Procedure for Determining Elastic Moduli of Soils by rifc;ld Vibratory Technique," Miscellaneous Paper No. ^-577, Jun 1963, U. S. Army Engineer Waterways Experiment Station, CE, Vicks- burg, Miss.
69
28. Richart, F. E., Jr., "Foundation Vibrations," Journal. Soil Mechan- ics and Foundations Division. American Society of Civil Engineers. Vol 86, Part 1, No. SMk, Aug I960, pp 1-3U. -—
29. Jaky, J., "Tl^e Coefficient of Earth Pressure at Rest," Journal. Society of Hungarian Architects and Engineers. Budapest, Hungary, 19hh, pp 355-358.
30. Al-Hussaini, M. , "Investigation of Plane Strain Shear Testing; Plane Strain and Triaxial Compression Tests on Painted Rock Dam Material," Technical Report S-Tl-2, Report 3, Sep 1972, U. S. Army Engineer Waterways Experiment Station, CE, Vicksburg, Miss.
31. , "Investigation of Plane Strain Shear Testing; Drained Plane Strain and Triaxial Compression Tests on Crushed Napa Basalt," Technical Report S-71-2, Report 2, Jun 1971. U. S. Army Encineer Waterways Experiment Station, CE, Vicksburg, Miss.
32. Kennedy, T. E., Albritton, G. E., and Walker, R. E., "Initial Eval- uation of the Free-Field Response of the Large Blast Load Gener- ator," Technical Report No. 1-723, Jun 1966, U. S. Army Engineer Waterways Experiment Station, CE, Vicksburg, Miss.
33. Durbin, W. L., "Study of the Dynamic Stress-Strain and Wave- Propagation Characteristics of Soils; Measurements of Stress- Strain, Peak Particle Velocity, and Wave-Propagation Velocity in Three Sands," Contract Report No. 3-91, Report 3, Feb 1965, U. S. Army Engineer Waterways Experiment Station, CE, Vicksburg, Miss., prepared by United Research Services, Inc., under Contract No. DA-22-079-eng-373.
3^. Whitman, R. V., "The Response of Soils to Dynamic Loadings; Final Report," Contract Report No. 3-26, Report 26, May 1970, U. S. Array Engineer Waterways Experiment Station, CF, Vicksburg, Miss., pre- pared by Massachusetts Institute of Technology under Contract No. DA-22-079-eng-22l4.
35. Isenberg, J., "Nuclear Geoplosics, A Sourcebook of Underground Phenomena and Effects of Nuclear Weapons, Part 2, Mechanical Properties of Earth Materials," DNA 1285H2, Nov 1972, Defense Nuclear Agency, Washington, D. C.
36. Fulton, R. E. and Hendron, A. J., "Discussion of Impact Waves in Sand: Theory Compared with Experiments on Sand Columns," Journal, Soil Mechanics and Foundations Division, American Society of Civil Engineers, Vol 87, No. SM6, 196l, pp 69-73.
37. Chisolm, E. E., "Behavior of Granular Materials Under High Stresses" (unpublished data), Apr 1971, U. S, Army Engineer Water- ways Experiment Station, CE, Vicksburg, Mlrji.
70
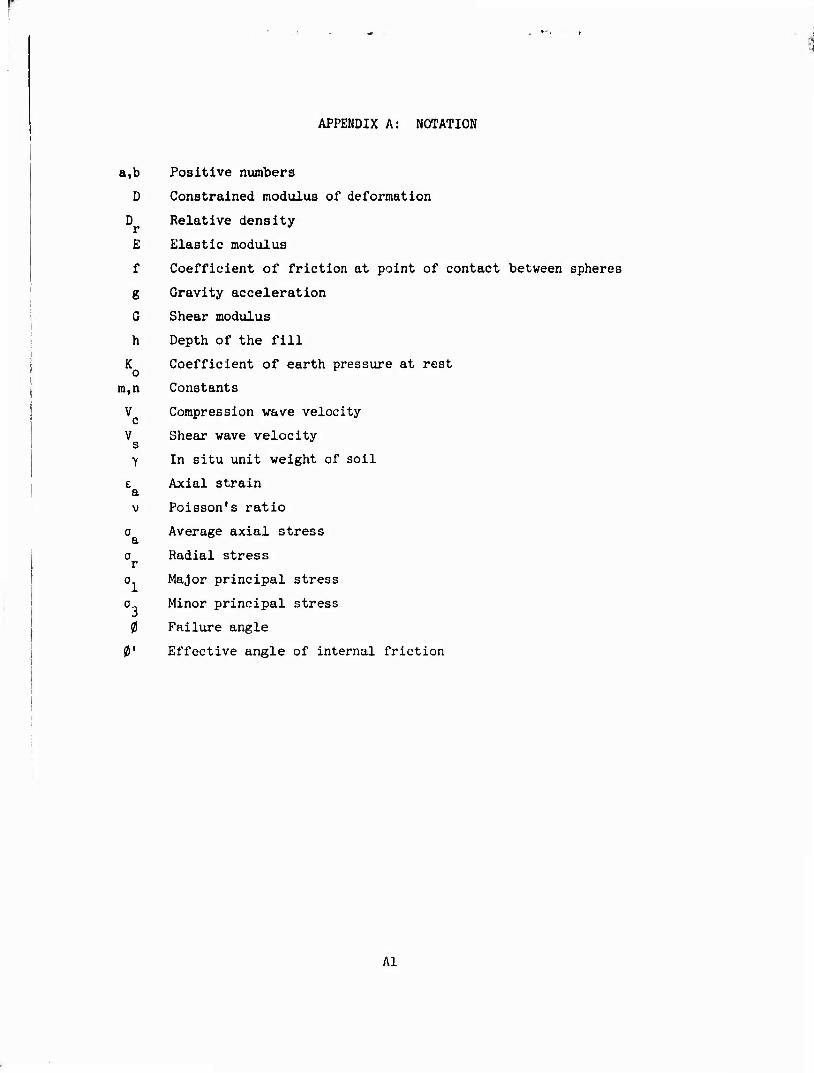
APPENDIX A: NOTATION
a,b Positive numbers
D Constrained modulus of deformation
D Relative density
E Elastic modulus
f Coefficient of friction at point of contact between spheres
g Gravity acceleration
G Shear modulus
h Depth of the fill
K Coefficient of earth pressure at rest o r
m,n Constants
V Compression wave velocity
V Shear wave velocity
Y In situ unit weight of soil
e Axial strain a v Poisson's ratio
o Average axial stress
o Radial stress r
o Major principal stress
o_ Minor principal stress
0 Failure angle
t' Effective angle of internal friction
Al