Embed Size (px)
Citation preview
AD-A244 574
December 1991 M91-112
Volume 2Example System Design Details
M. Leiter, R. I. Millar, J. L. Ramsey, B. E. White, W. J. Wilson, ed.
M. Leiter Technical Feasibility ofR. I. Millar Digital Three-DimensionalJ. L. Ramsey Cellular CommunicationsR. D. Sakamoto for Air Traffic ControlB. E. White ApplicationsW. J. Wilson DTJC
JAN 2 2 19_9,_ 1
Li
92-01496II il l Mli i U I1m1
Approved for public release;distribution unlimited.
MITREBedford, Massachusetts 92 1 16 07 8
p
December 1991 V91-112Volume 2Example System Design Details
M. Leiter, R. I. Millar, J. L. Ramsey, B. E. White, W. J. Wilson, ed.
M. Leiter Technical Feasibility ofR. I. Millar Digital Three-DimensionalJ. L. Ramsey Cellulm CommunicationsR. D. Sakamoto for Air Traffic ControlB. E. White ApplicationsW. J. Wilson
P E. . 9Ij......-I
CONTRACT SPONSOR MITRE Sponsored ResearchCONTRACT NO. N/APROJECT NO. 91550DEPT D053
Approved for public release;
distribution unlimited.
IP MITREThe MITRE CorporationBedford, Massachusetts
0
M. Leiter
MITRE Project ApprovaI/ % IIB. E. White
0
0
ABSTRACT
MITE's Center for Advanced Aviation System Development (CAASD) has
proposed a set of concepts for improving VHF communications for air traffic controlapplications. One idea, called CTAG for Cellular Trunked Air Ground (CRAG)communications is to extend land-mobile cellular-trunked digital communicationstechnology to air-ground communication between pilots and controllers. This studywas aimed at addressing the technical feasibility of this approach. Detailed resultsshow that significant benefits can indeed be obtained in not only automating routinecommunications functions but also in reducing the number of frequency channelsrequired compared with existing analog voice-only procedures. Further work isrequired to quantify potential system costs, particularly those associated with theground portions of the CTAG network.
'vs
I
(
PREFACE
This report is subdivided into three volumes. Volume 1 is the Introduction andSummary which contains an overview of the entire report including background,requirements, assumptions, and a summary of the principal results. Volume 2 containsExample System Design Details on all but the Ground Network Architecture work.The latter is contained in Volume 3.
i
VOLUMES 1 AND 2 ACKNOWLEDGMENTS
This work would not have been possible without the encouragement and technical support ofMITRE's Center for Advanced Aviation System Development (CAASD). Particular thanks areextended to the CTAG Project Leader, Dr. L. del Cid, J. J. Dieudonne, D. J. Chadwick, andDr. R. M. Harris.
Other MITRE/Bedford contributors to this study and/or report, in addition to the principalauthors, include R. G. Bland, C-H. Chen, R. W. Davis, T. A. Reed, D. K. Snodgrass, andK. A. Wickwire. Their contributions are gratefully acknowledged.
~v
VOLUME 2 TABLE OF CONTENTS
SECTION PAGE
2 Modulation and Coding 2-12.0 Introduction 2-12.1 Analog Modulation Techniques 2-12.2 Digital Modulation Techniques 2-72.3 Digital Coding Techniques 2-13
3 Radio Implementation and Cost Estimates 3-13.0 Introduction 3-13.1 Cost Analysis 3-1
3.1.1 Scope 3-13.1.2 Ground Rules and Assumptions 3-13.1.3 Approach 3-13.1.4 Estimating Methodology 3-2
3.2 Estimates for Ground Radio Equipment 3-3
4 Spread Spectrum Multiple Access 4-14.0 Introduction 4-14.1 Background 4-14.2 Advantages 4-14.3 Limitations 4-24.4 Conclusions 4-4
5 Voice Message Traffic Model 5-15.0 Introduction 5-15.1 Terminal Sequence 5-25.2 Enroute Sequence 5-35.3 Estimates of Mean Call Occurrence Times and Exchange Durations 5-45.4 The Distribution of Exchange Lengths 5-55.5 Estimating the Maximum and Minimum Number of Cells 5-6
Needed in an Area
6 Three-Dimensional Cellular Solutions 6-16.1 Fundamental Considerations 6-16.2 Outline of Specific Solution 6-4
7 CTAG Frequency Reuse 7-17.0 Introduction 7-17.1 Background 7-17.2 Cell Structure 7-17.3 Required Signal-to-Noise Ratio 7-27.4 Frequency Reuse Patterns 7-27.5 Propagation Effects 7-57.6 Frequency Management 7-117.7 Summary 7-12
vii
VOLUME 2 TABLE OF CONTENTS (Concluded)
SECTION PAGE
8 Operational Procedures 8-18.0 Introduction 8-18.1 Cellular HandOff 8-1
8.1.1 Current Cellular Telephone HandOff Procedures 8-1and problems
8.1.2 C'TAG Cell-Cell HandOff Concepts 8-28.2 How Does CTAG Work 8-38.3 Message Traffic Requirements for Routine Cellular 8-3
HandOff in CTAG
9 TDMA Example Design 9-19.0 Introduction 9-19.1 Assumptions 9-19.2 Frame Structure 9-29.3 Key Procedures 9-2
9.3.1 Net Entry 9-29.3.2 Circuit Maintnance 9-49.3.3 Voice Cormnunications 9-69.3.4 Cell Monitoring/Cell Handover 9-79.3.5 Emergency Communications 9-8
9.4 Link Synchronization 9-9
10 FDMA Comparison 10-110.0 Introduction 10-1
List of Volume I References RE- 1Appendix 1 Al-1Appendix 2 A2-1Appendix 3 A3-1Appendix 4 A4-1Volumes 1 and 2 Glossary GL-1Distribution List DL- 1
F R VOLUME 2 LIST OF FIGURES
FIGURE PAGE
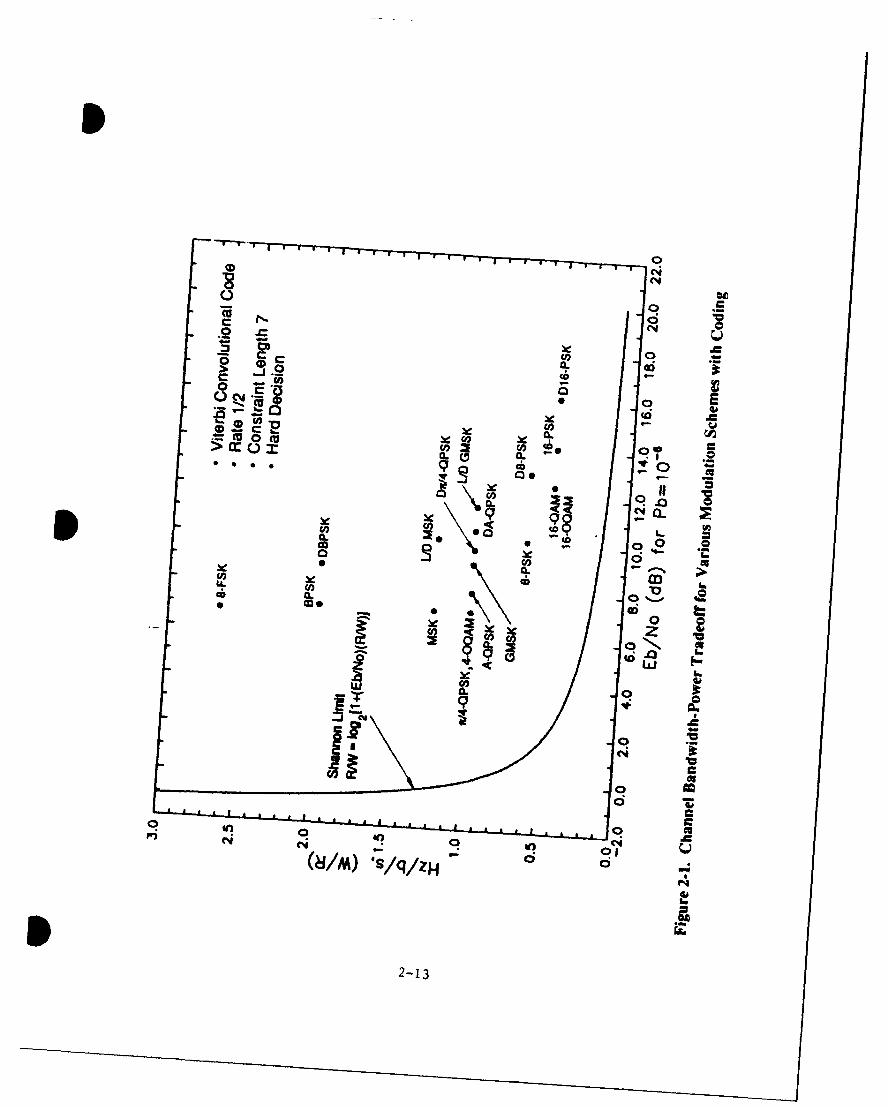
2-1 Channel Bandwidth-Power Tradeoff for Various Modulation 2-13Schemes with Coding
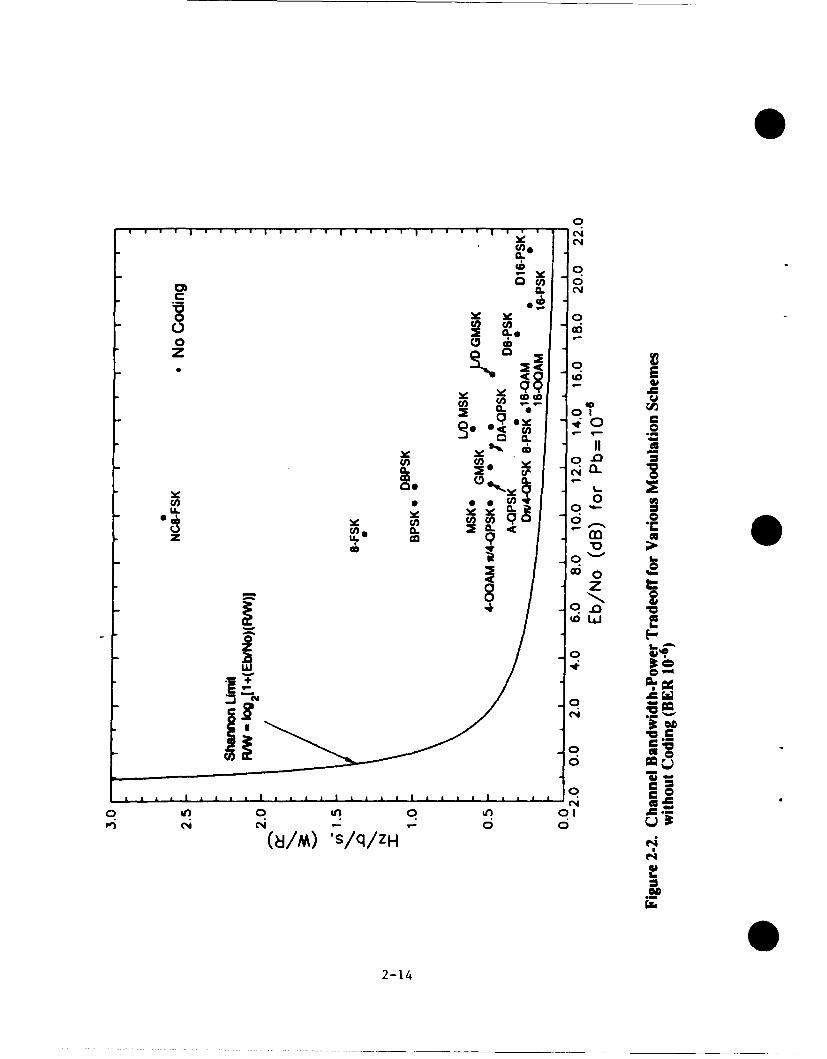
2-2 Channel Bandwidth-Power Tradeoff for Various Modulation 2-14Schemes without Coding (BER = 10-6)
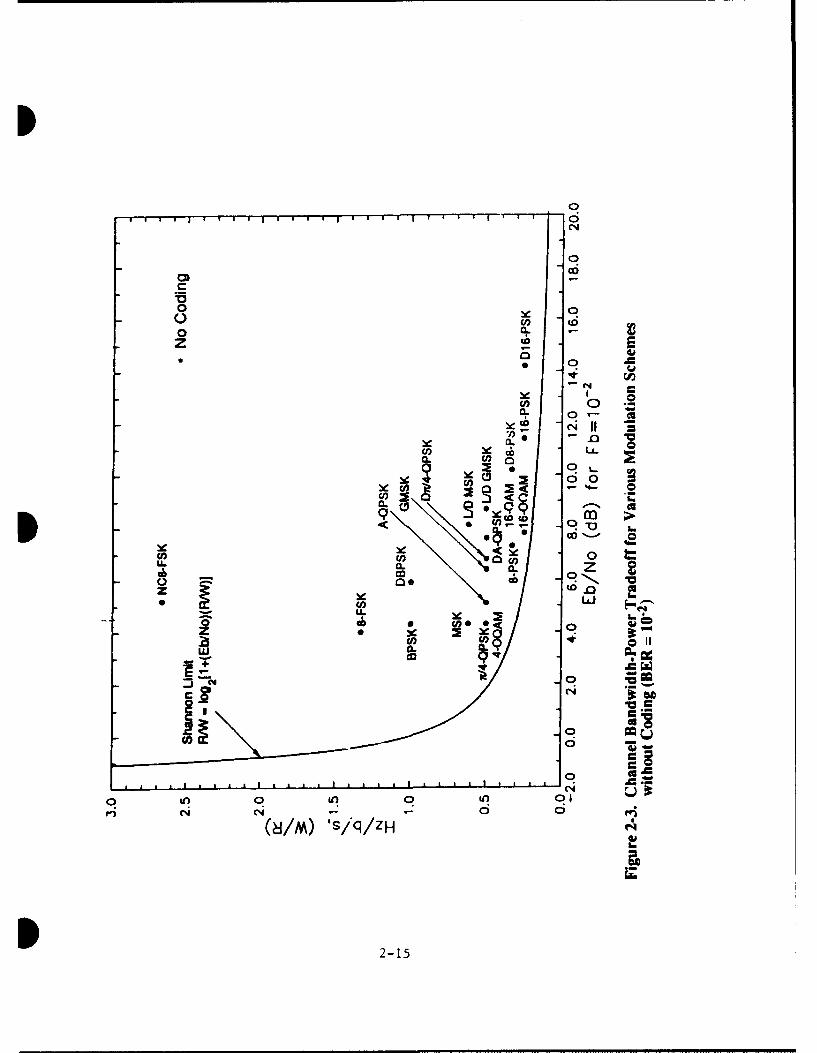
2-3 Channel Bandwidth-Power Tradeoff for Various Modulation 2-15Schemes without Coding (BER = 10-2)
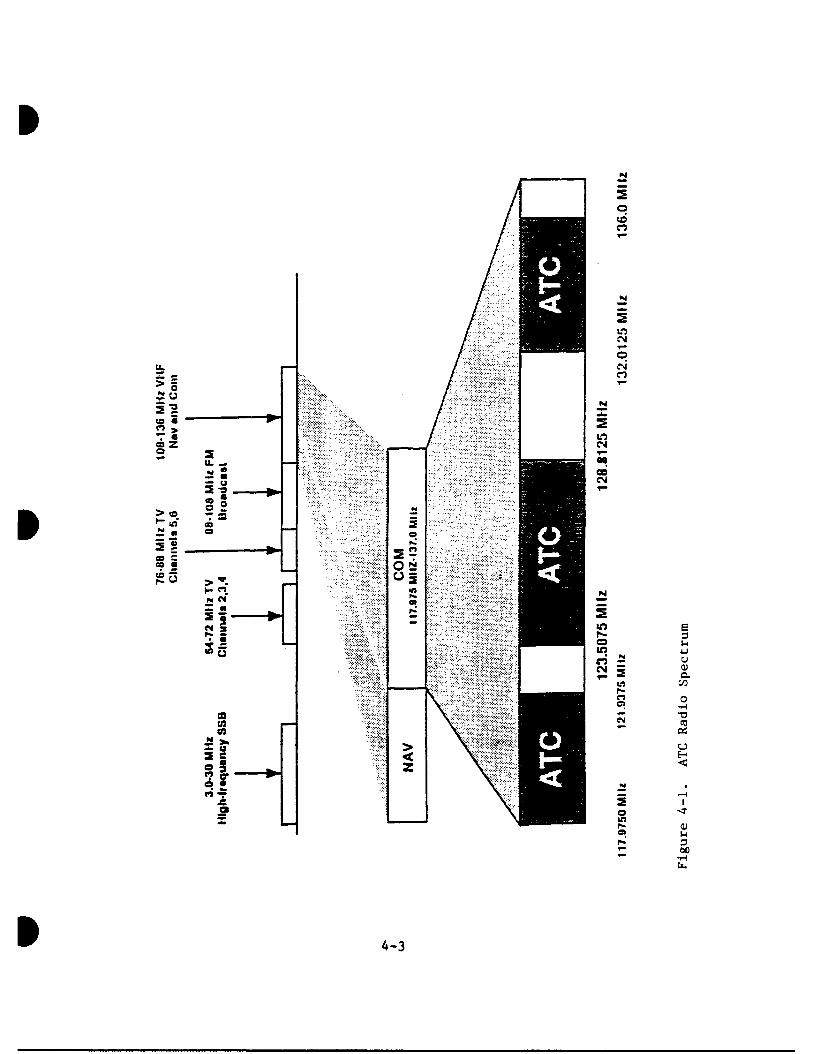
4-1 ATC Radio Spectrum 4-3
6-1 Two-Thirds Population of Hexagonal Cells Assuming at Least 6-5Double Coverage
6-2 Nesting of Three-Sized Triangles 6-7
6-3 Frequency Reuse Relationships for Cells with Double Coverage 6-8
7-1 6-Frequency Pattern 7-4
7-2 7-Frequency Pattern 7-4
7-3 8-Frequency Pattern 7-4
7-4 Excess Path Loss at 1,125 ft. 7-6
7-5 Excess Path Loss at 4,500 ft. 7-7
7-6 Excess Path Loss at 18,000 ft. 7-8
7-7 Excess Path Loss at 72,000 ft. 7-9
8-1 Entering the System 8-4
8-2 Cell Hand-off 8-5
8-3 Controller Hand-off 8-6
8-4 Procedure for Routine Cellular Handoff 8-8
8-5 Circuit Preparation in New Cell 8-10
8-6 Procedure for Cellular Transition at the Aircraft (A/C) 8-11
8-7 Bookkeeping Functions at Old Switch (A/C = aircraft) 8-13
I ix
VOLUME 2 LIST OF FIGURES (Concluded)
SECTION PAGE 09-1 TDMA Example Design Architectural Organization 9-3
9-2 Maintenance/Emergency Organization 9-5
10-1 Alternative FDMA Organization 10-2
x 0
i VOLUME 2 LIST OF TABLES
TABLE PAGE
2-1 Semi-Quantitative Comparison of Several Well-Known 2-2Analog Modulations
2-2 Quantitative Comparison of Several Advanced Digital Modulations 2-8
2-3 Quantitative Comparison of Several Advanced Digital Modulations 2-9
2-4 Quantitative Comparison of Several Advanced Digital Modulations 2-10
2-5 Quantitative Comparison of Several Advanced Digital Modulations 2-11
2-6 Quantitative Comparison of Several Advanced Digital Modulations 2-16
2-7 Quantitative Comparison of Several Advanced Digital Modulations 2-17
6-1 Cochannel Interference for Half-Duplex Operation 6-1
6-2 Cochannel Interference for Full-Duplex Operation 6-3
7-1 Service Volume Sizes 7-2
7-2 Frequency Reuse Pattern Data 7-3
7-3 Frequency Reuse Pattern Characteristics 7-3
7-4 Uplink S/I Ratios 7-10
7-5 Downlink S/I Ratios 7-10
*b xi
ISECTION 2
MODULATION AND CODING
2.0 INTRODUCTION
A review of modulation and coding techniques is documented in this section. Wellknown analog techniques are summarized for possible dual-mode radio use in a potentialtransition phase to the future mostly-digital system. Some of the better known digitaltechniques are also listed along with some newer, lesser known types. Standard coding gainsto be expected are also documented.
2.1 ANALOG MODULATION TECHNIQUES
Table 2-1 characterizes several analog modulations.
1. An improved Double Sideband Transmitted Carrier (DSBTC) scheme can bedescribed as follows. Channel spacing is expressed as the number of channels that might bepacked into a 25 kHz bandwidth allocation. There are 2 or 2.5 channels per 25 kHz. Theaudio bandwidth is 3.5 kHz. One needs a 7 kHz RF bandwidth centered on the carrierfrequency. Almost 1 kHz (a few ppm) for oscillator drift plus Doppler shift needs to beailowed. Also, there must be allowance for filter rolloff. One can use a 10 kHz or 12.5 kHzchannel spacing. New transceiver designs will be required wi-.h closer tolerances on localposcillator frequency drift, narrower IF filter bandwidths, and a much better receiverselectivity. Characteristics of this narrowband AM (other than capacity) can be itemized asfollows:
2. Need for Doppler tracking (for coherent demodulation), not required.
3. Power efficiency, usually expressed as carrier-to-noise ratio (C/N) needed forsatisfactory intelligibility of speech, poor. Most of the transmitted power isin the carrier.
(S/N) audio _ m2 (C/N), C / N >> 1, where m is the modulation index.
For 10 dB audio SNR with m = 30%, a 20.5 dB C/N is required.
4. Susceptibility to adjacent-cell and adjacent-channel interference, usually expressedas signal-to-interference ratio (S/I) or carrier-to-interference ratio (C/I) required,C/I required is same order of magnitude as C/N.
5. Complexity of radio design required to transmit and receive the modulation,simplest of any modulation.
10 2-1
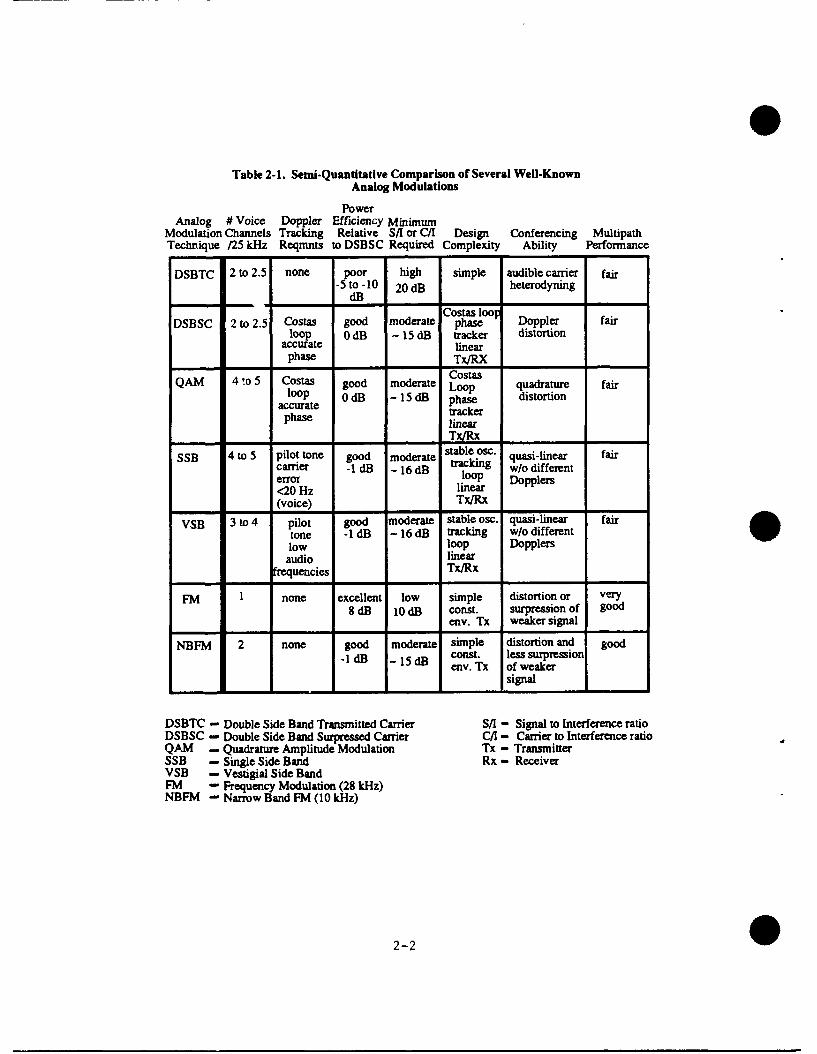
Table 2-1. Semi-Quantitative Comparison of Several Well-KnownAnalog Modulations
PowerAnalog # Voice Doppler Efficiency Minimum
Modulation Channels Tracking Relative S/I or C/I Design Conferencing MultipathTechnique /25 kHz Reqmnts to DSBSC Required Complexity Ability Performance
DSBTC 2 to 2.5 none poor high simple audible carrier fair5 to -10 20 dB heterodyning
dB d
Costas loopDSBSC 2 to 2.5 Costas good moderate phase Doppler fair
loop 0 dB ~ 15 dB tracker distortionaccurate linear
phase Tx/RXCostas
QAM 4 to 5 Costas good moderate Loop quadrature fairloop 0 dB - 15 dB phase distortion
accurate trackerphase linear
Tx/Rx
SSB 4 to 5 pilot tone good moderate stable osc. quasi-linear faircarrier -1 dB -16 dB tracking w/o differenterror loop Dopplers<20 Hz linear(voice) Tx/Rx
VSB 3 to 4 pilot good moderate stable osc. quasi-linear fairtone -1 dB ~ 16 dB tracking w/o differentlow loop Dopplersaudio linear
frequencies Tx/Rx
FM 1 none excellent low simple distortion or very8 dB I0 dB const. surpression of good
env. Tx weaker signal
NBFM 2 none good moderate simple distortion and goodconst, less surpression-i B 1 dB env. Tx of weaker
signal
DSBTC - Double Side Band Transmitted Carrier S/I - Signal to Interference ratioDSBSC - Double Side Band Surpressed Carrier C/I - Carrier to Interference ratioQAM - Quadrature Amplitude Modulation Tx - TransmitterSSB - Single Side Band Rx - ReceiverVSB - Vestigial Side BandFM - Frequency Modulation (28 kHz)NBFM -Narrow Band FM (10 kHz)
2-2
6. Speech intelligibility with two talkers inadvertently using the same channel(the conferencing effect), with older radios having less accurate local oscillators,carrier heterodyning usually produces a super-audible tone and quasi-linearconferencing occurs; with newer radios having more accurate local oscillators,however, carrier heterodyning can produce an audible tone and considerabledistortion results.
7. Performance degradation in multipath propagation conditions, multipath fading isan amplitude fluctuation. If the fading occurs at a rate commensurate with audiofrequencies, it can cause speech distortion. Similarly, for the other analogmodulations schemes, referring to table 2-1.
Double Sideband Suppressed Carrier (DSBSC
1. There are 2 or 2.5 channels per 25 kHz. Audio bandwidth is 3.5 kHz. Need a 7 kHzbandwidth centered on (suppressed) carrier. Allow for oscillator drift, Doppler, andfilter rolloff. Can use 10 kHz or 12.5 kHz channel spacing.
2. Need accurate tracking of both carrier frequency and carrier phase. Can be recoveredfrom DSBSC signal with a Costas loop.
3. Good. All power in modulation sidebands. There is no noise reduction (as there iswith FM), however. There is no detector threshold.
(S/N) audio = 2 (C/N) in
4. Better than AM because interfering signals have no carrier.
5. Need a Costas loop to reconstruct the (suppressed) carrier for synchronousdemodulation. Otherwise comparable to a SSB transceiver.
6. Considerable distortion results because two DSBSC signals are offset in frequency byDoppler shift. The carrier tracking loop must be mismatched to at least one signal.
7. DSBSC is still an amplitude modulation technique. Fading at audio frequency rates
will cause speech distortion.
Quadrature Amplitude Modulation (QAM) (Using two DSBSC signals)
1. There are four or five channels per 25 kHz. Can use 10 kHz or 12.5 kHz channelspacing, but can send two (quadrature) virtual channels in each frequency channel.Need for Doppler tracking (for coherent demodulation).
*2-3
2. Need accurate tracking of both carrier frequency and carrier phase. Can be recoveredfrom DSBSC signal with a Costas loop. Must track phase accurately to separate thetwo quadrature signals.
3. Good. All power in modulation sidebands. There is no noise reduction (as there is
with FM), however. There is no detector threshold.
4. Better than AM because interfering signals have no carrier.
5. Need a Costas loop to reconstruct the (suppressed) carrier for synchronousdemodulation. Need to maintain linearity in transmitter and receiver to keepquadrature signals from mixing and producing intermodulation distortion.
6. Considerable distortion will result. May not be possible to separate quadraturechannels.
7. QAM is still an amplitude modulation technique. Fading at audio frequency rateswill cause speech distortion.
Single Sideband (SSB)
1. There are four or five channels per 25 kHz. Channel spacing of 5 or 6.25 kHz couldbe used, providing for a 3.5 kHz audio band, with allowances for oscillator drift,Doppler shift, and filter rolloff.
2. Need to transmit a pilot tone (attenuated carrier) for Doppler tracking. Carrier errormust be less than 20 Hz, typically, for voice. This is much less than the Doppler shiftat Mach 1. Therefore, a Doppler tracking loop is required.
3. Good. Most of the power is in the modulation sideband. There is no noise reduction(as there is with FM), however. Since SSB reception is (conceptually) a directtranslation to baseband, input and output SNR of detector are equal. At first glance, itappears that SSB is 3 dB poorer than DSBSC in this regard, but remember that theSSB radio frequency bandwidth is half that of DSBSC, so that SSB has half the noiseto start with. This SSB and DSBSC have the same power efficiency (on an averagepower basis).
4. Better than AM because interfering signals have no carrier.
5. Need a stable local oscillator plus a carrier tracking loop (for local oscillator offsetbetween radios plus Doppler shift). Need a linear transmitter and receiver toaccommodate peaks of audio signal; there is no carrier to drive an automatic levelcontrol (ALC) in the power amplifier.
6. Quasi-linear conferencing may occur if Doppler shifts of two talkers aren't toodifferent.
2-4
7. SSB is still an amplitude modulation technique. Fading at audio frequency rates willcause speech distortion.
NOTE: Because SSB is a frequency translation of the baseband signal, Fourier seriescomponents that were harmonically related at baseband are no longer harmonically relatedafter the frequency translation. Thus, the time envelope of the SSB signal is grossly differentfrom the time envelope of the baseband signal. (See [9], Section 5.5.) This effect is not toobad for speech, but may be a problem for data communication.
Vestigial Sideband (VSB)
1. Intermediate between SSB and DSBSC cases. Could probably employ channelspacing of 6.25 kHz or 8.33 kHz. providing 3 or 4 channels per 25 kHz. Channelspacing depends upon how much of the vestigial sideband is transmitted, whichdepends upon filter rolloff.
2. Probably need a pilot tone (attenuated carrier) for Doppler tracking. VSB frequencyresponse extends to low audio frequencies.
3. Good. Most of the power is in the modulation sideband. There is no noise reduction(as there is with FM), however. Generally similar to SSB.
4. Better than AM because interfering signals have no carrier.
5. Comparable to a single sideband radio. Need a stable local oscillator, plus a lineartransmitter and receiver to accommodate peaks of audio signal; there is no carrier todrive an automatic level control (ALC) in the power amplifier.
6. Quasi-linear conferencing may occur if Doppler shifts of the two talkers aren't toodifferent.
7. VSB is still an amplitude modulation technique. Fading at audio frequency rates willcause speech distortion.
NOTE: The signal envelope distortion experienced by SSB also occurs with VSB, becausethe two modulations are so similar.
Frequency Modulation (FM'
1. One channel per 25 kHz, with a modulation index between 2 and 3.
2. Not required.
3. Good at large modulation index. FM threshold occurs around 10 dB CNR (lower forthreshold-extension demodulators). Audio SNR is 10-15 dB higher than CNR, onceCNR is above threshold.
2-5
4. If C/I is above the FM threshold of 10 dB, the interference is suppressed by the FMimprovement factor. Thus, FM is much better than AM in this regard.
5. FM receiver is relatively simple, only slightly more complex than an AM receiver.Transmitter for constant envelope FM waveform is simpler than a linear transmitter.
6. Considerable distortion occurs when amplitudes are about equal. When one signal ismuch stronger, it "captures" the FM demodulator and suppresses the weaker signal.
7. FM is very resistant to multipath fading. This is the main reason it is used for cellulartelephones.
From Swartz, Bennett, & Stein, p. 120: [10]
3a = 3 32 & 0 _At = frequency deviation (one-sided)No N' fin highest modulating frequency
Example:
fin - 3.5 kHz With Sc/N at 10 dB, which is theAf = 10 kHz FM threshold,
= = 2.86 So/No = 23.9 db
32 = 24.5 (13.9 dB)
From Carson's rule, the two - sided RF bandwidth is
2B E 2 (fm + Af) = 2 (3.5 + 10) = 27 kHz
Wideband FM is defined as:
03 > n/2, 332 > 7.4 (8.7 dB)
Narrowband Frequency Modulation (NBFM)
1. Two channels per 25 kHz, or a spacing of 12.5 kHz, might be possible with amodulation index <1. But there is little FM noise improvement with such a smallmodulation index.
2. Not required.
3. Somewhat better than AM. So/Nn = C/N with NBFM, whereas So/No = m2 C/Nwith AM.
2-6
S4. Not as good as FM with a large modulation index, but may be better than AM.
5. Relatively simple. FM receiver is only slightly more complex than an AM receiver.FM transmitter for constant envelope waveform is simpler than a linear transmitter.
6. Considerable distortion occurs. Larger signal capture effect is weak at a smallmodulation index.
7. Poorer performance than FM with a large modulation index, but may still be betterthan AM.
For a 12.5 kHz channel spacing, assume an RF bandwidth of 10 kHz can be used, with2.5 kHz guard space for filter rolloff.
Letfin = 3.2 kHz
From Carson's rule, 2B = 2fin (1+13)
If 2B = 10 kHz,
1+13 = 1 = 1.56 13 = 0.56,6.4
or the frequency deviation Af is
Af = 3fin = 1.8 kHz. so SCNo N
The FM noise improvement factor, 3132, is Sc > 10N
3132 = 0.95, so that - - above thresholdNo Nc
2.2. DIGITAL MODULATION TECHNIQUES
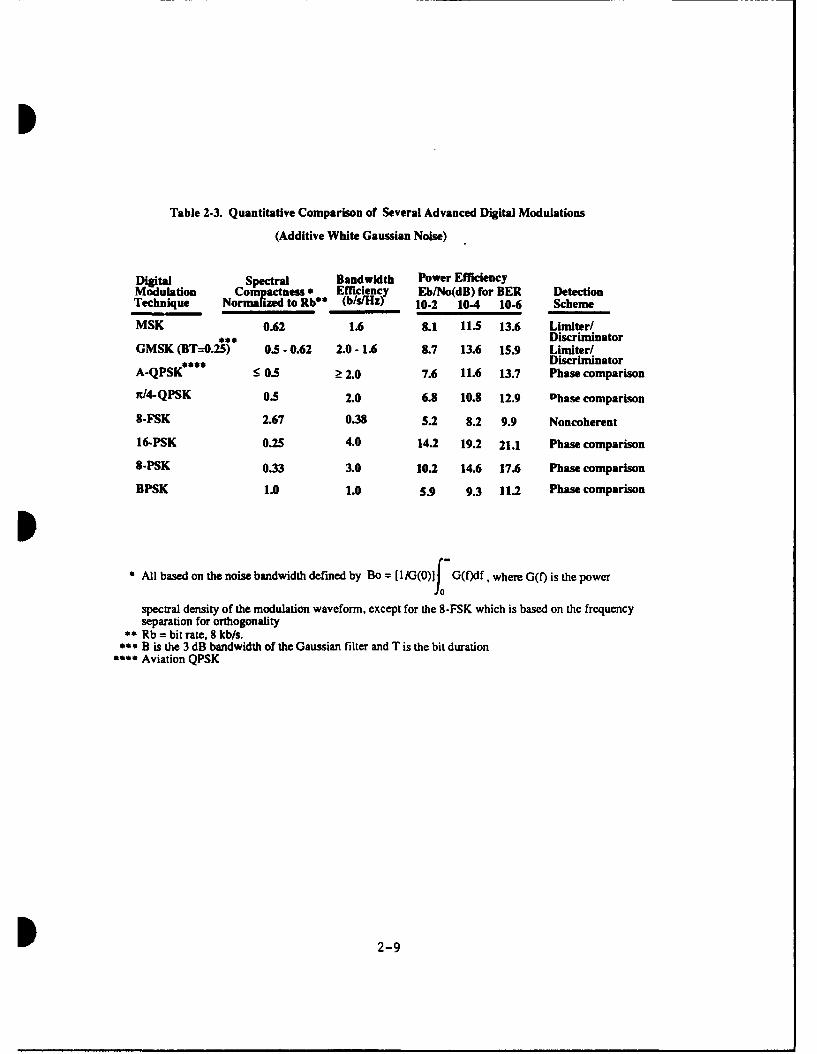
Tables 2-2 through 2-5 summarize the bandwidth and power efficiencies of severaldigital modulation techniques for both coherent and non-coherent detection. The first twotables use a noise bandwidth definition of the power spectrum, while the second two tablescompare the modulations with respect to where the power spectral densities have rolled off toonly the 3 dB down points.
2-7
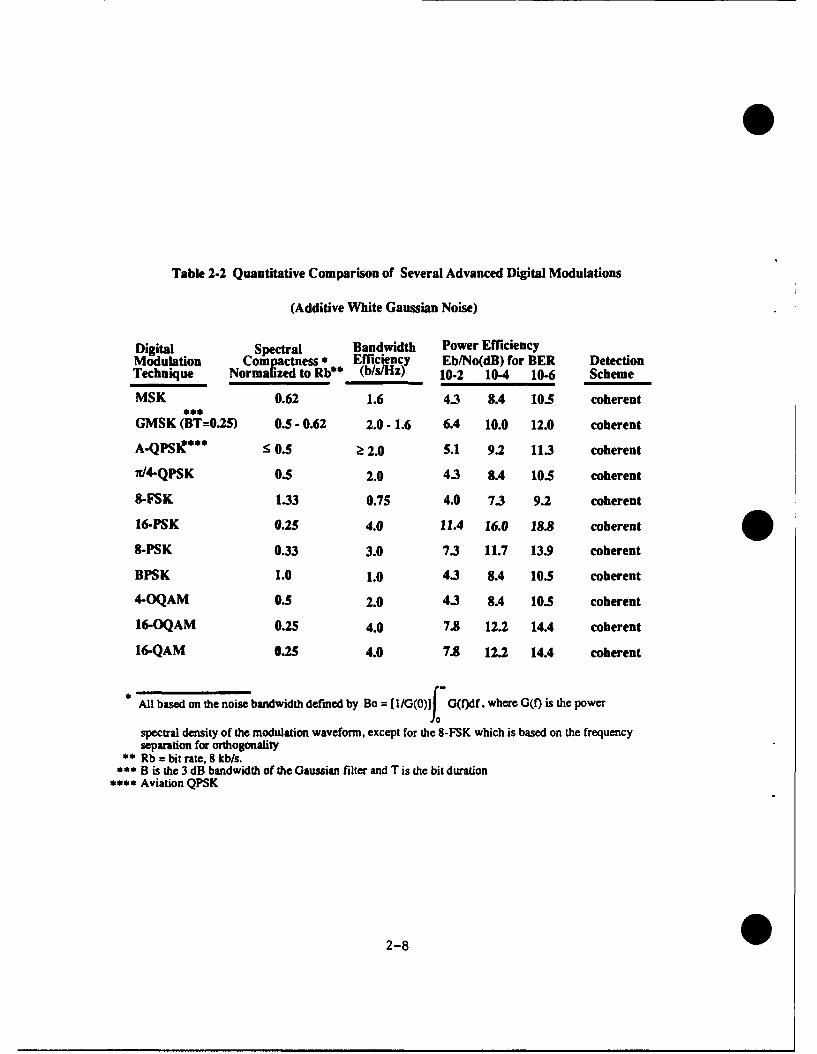
Table 2-2 Quantitative Comparison of Several Advanced Digital Modulations
(Additive White Gaussian Noise)
Digital Spectral Bandwidth Power EfficiencyModulation Comactness * Efficiency Eb/No(dB) for BER DetectionTechnique Normalized to Rb** (b/s/Hz) 10-2 10-4 10-6 Scheme
MSK 0.62 1.6 4.3 8.4 10.5 coherent
GMSK (BT=0.25) 0.5 - 0.62 2.0 - 1.6 6.4 10.0 12.0 coherent
A-QPSIt *** 0.5 > 2.0 5.1 9.2 11.3 coherent
lI4-QPSK 0.5 2.0 4.3 8.4 10.5 coherent
8-FSK 1.33 0.75 4.0 7.3 9.2 coherent
16-PSK 0.25 4.0 11.4 16.0 18.8 coherent
8-PSK 0.33 3.0 7.3 11.7 13.9 coherent
BPSK 1.0 1.0 4.3 8.4 10.5 coherent
4-OQAM 0.5 2.0 4.3 8.4 10.5 coherent
16-OQAM 0.25 4.0 7.8 12.2 14.4 coherent
16-QAM 0.25 4.0 7.8 12.2 14.4 coherent
• All based on the noise bandwidth defined by Bo = [l/G(0)I G(f)df. where G(f) is the power
spectral density of the modulation waveform, except for the 8-FSK which is based on the frequencyseparation for orthogonality
•* Rb = bit rate, 8 kb/s.B is the 3 dB bandwidth of the Gaussian filter and T is the bit duration
•*** Aviation QPSK
2-8
I
Table 2-3. Quantitative Comparison of Several Advanced Digital Modulations
(Additive White Gaussian Noise)
Digital Spectral Bandwidth Power Efficiency
Modulation Comactness* Efficiency Eb/No(dB) for BER DetectionTechnique Normalized to Rb** (b/s/Hz) 10-2 10-4 10-6 Scheme
MSK 0.62 1.6 8.1 11.5 13.6 Limiter/Discriminator
GMSK (BT=0.25) 0.5 - 0.62 2.0 - 1.6 8.7 13.6 15.9 Limiter/Discriminator
A-QPSK* :5 0.5 2! 2.0 7.6 11.6 13.7 Phase comparison
n/4.QPSK 0.5 2.0 6.8 10.8 12.9 Phase comparison
8-FSK 2.67 0.38 5.2 8.2 9.9 Noncoherent
16-PSK 0.25 4.0 14.2 19.2 21.1 Phase comparison
8-PSK 0.33 3.0 10.2 14.6 17.6 Phase comparison
BPSK 1.0 1.0 5.9 9.3 11.2 Phase comparison
I• All based on the noise bandwidth defined by Bo = [I/G(O)]fo G(f)df, where OQ) is the power
spectral density of the modulation waveform, except for the 8-FSK which is based on the frequencyseparation for orthogonality
•* Rb = bit rate, 8 kb/s.** B is the 3 dB bandwidth of the Gaussian filter and T is the bit duration
*** Aviation QPSK
2-9
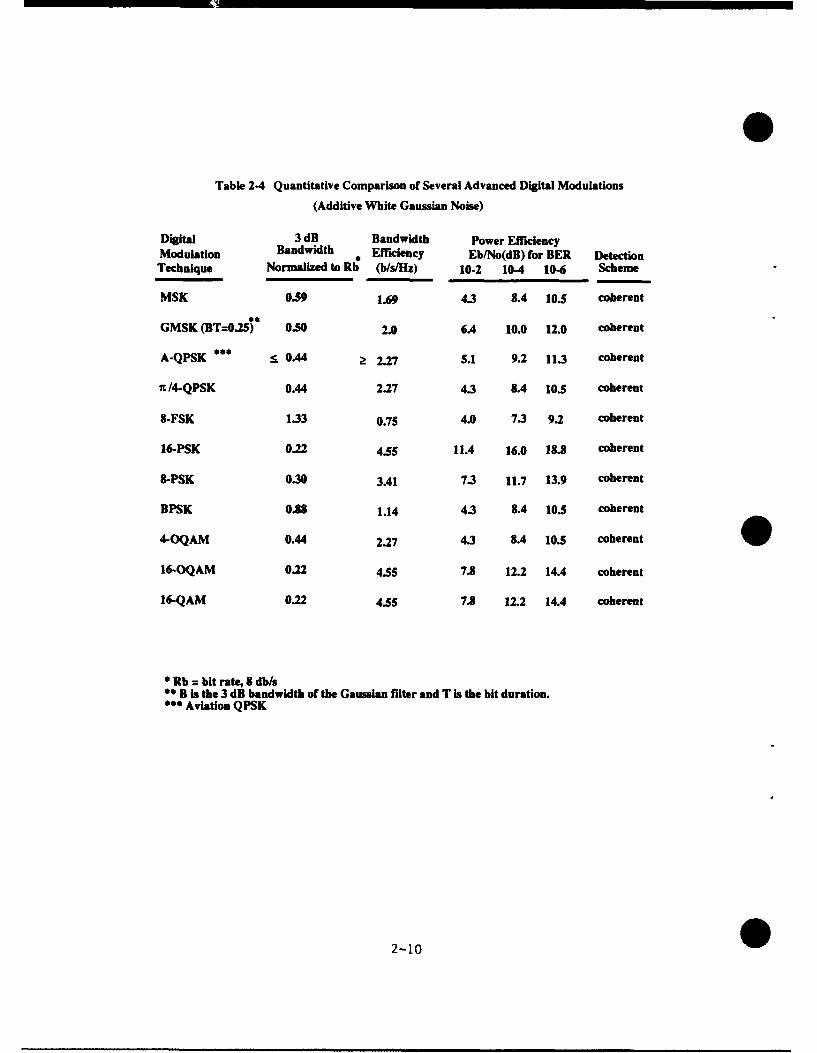
Table 2-4 Quantitative Comparison of Several Advanced Digital Modulations
(Additive White Gaussian Noise)
Digital 3 dB Bandwidth Power Efficiency
Modulation Bandwidth Efficiency Eb/No(dB) for BER DetectionTechnique Normalized to Rb (b/s/Hz) 10-2 10-4 10-6 Scheme
MSK 0.59 1.69 4.3 8.4 10.5 coherent
GMSK (BT=0.25) 0.50 2.0 6.4 10.0 12.0 coherent
A-QPSK *** :.0.44 > 2.27 S.1 9.2 11.3 coherent
x /4-QPSK 0.44 2.27 4.3 8.4 10.5 coherent
8-FSK 1.33 0.75 4.0 7.3 9.2 coherent
16-PSK 0.22 4.55 11.4 16.0 18.8 coherent
8-PSK 0.30 3.41 7.3 11.7 13.9 coherent
BPSK 0.88 1.14 4.3 8.4 10.5 coherent
4-OQAM 0.44 2.27 4.3 8.4 10.5 coherent
16-OQAM 0.22 4.5 7.8 12.2 14.4 coherent
16-QAM 0.22 4.55 7.8 12.2 14.4 coherent
Rb = bit rate, 8 db/s* B is the 3 dB bandwidth of the Gaussian filter and T is the bit duration.* Aviation QPSK
2-10
I
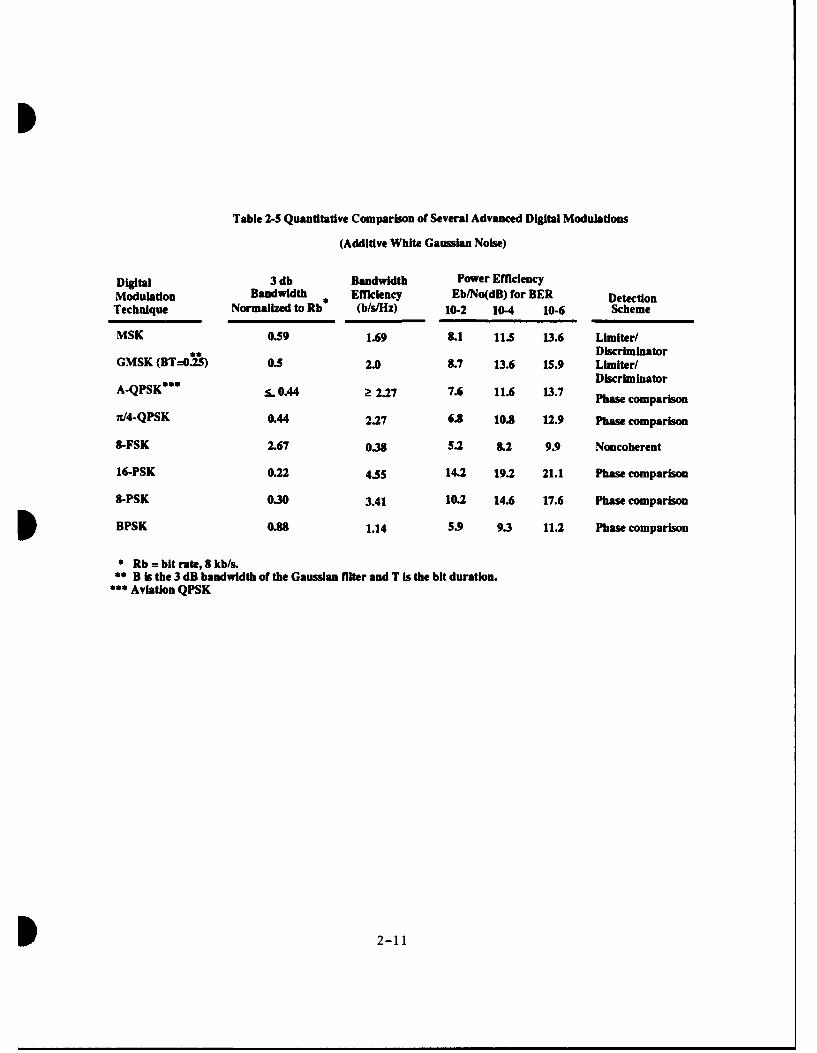
Table 2-5 Quantitative Comparison of Several Advanced Digital Modulations
(Additive White Gaussian Noise)
Digital 3 db Bandwidth Power EfficiencyModulation Bandwidth Efficiency Eb/No(dB) for BER DetectionTechnique Normalized to Rb (b/s/Hz) 10-2 10-4 10-6 Scheme
MSK 0.59 1.69 8.1 11.5 13.6 Limiter/Discriminator
GMSK (BT=025) 0.5 2.0 8.7 13.6 15.9 Limiter/
A-QPSK * s.044 > 2.27 7.6 11.6 13.7 DiscriminatorPhase comparison
n/4.QPSK 0.44 2.27 6.3 10.3 12.9 Phase comparison
8-FSK 2.67 0.38 5.2 8.2 9.9 Noncoherent
16-PSK 0.22 4.55 14.2 19.2 21.1 Phase comparison
8-PSK 0.30 3A1 10.2 14.6 17.6 Phase comparison
BPSK 0.8 1.14 5.9 9.3 11.2 Phase comparison
* Rb = bit rate, 8 kb/s.* B is the 3 dB bandwidth of the Gaussian filter and T is the bit duration.
* Aviation QPSK
2-11
Figures 2-1 through 2-3 show the spectral and power efficiencies with respect to theShannon limit using the noise bandwidth definition, since that data could be obtained fromliterature sources relatively early.
2.3 DIGITAL CODING TECHNIQUES
Improvements in power efficiency (Eb/No) at some expense in bandwidth efficiencyHz/(b/s) are shown in tables 2-6 and 2-7 using standard rate 1/2 convolution codingtechniques. Trellis coding admits the possibility of coding gain without bandwidthexpansion, at least in terms of the number of information bits per symbol bandwidthdefinition, where the symbol transmission rate is held constant (see Appendix 1); thiscorresponds to the zero crossing bandwidth being held fixed.
2-12
o oco
. .-
0 0
: 00 (d
C. X- -C
U) ~ d0. 00
V q
0a-
00
NN,
o z-C LLJ
LLI CL
0N
0 I-
2-G3
CLg
0.0 0
CL C1.' "0,
q ex -SCL0h11
cn w x 40
,..L •r C
, ... o
00.L
otS u/ q
ODO
0-I-
.4 C-
2-14
I00
0
CC
Z (0
CIq 0 00
U. amo
Cb co (L
w m it
in 0. L0u 00.
(8/M S ./Z
0 2-1
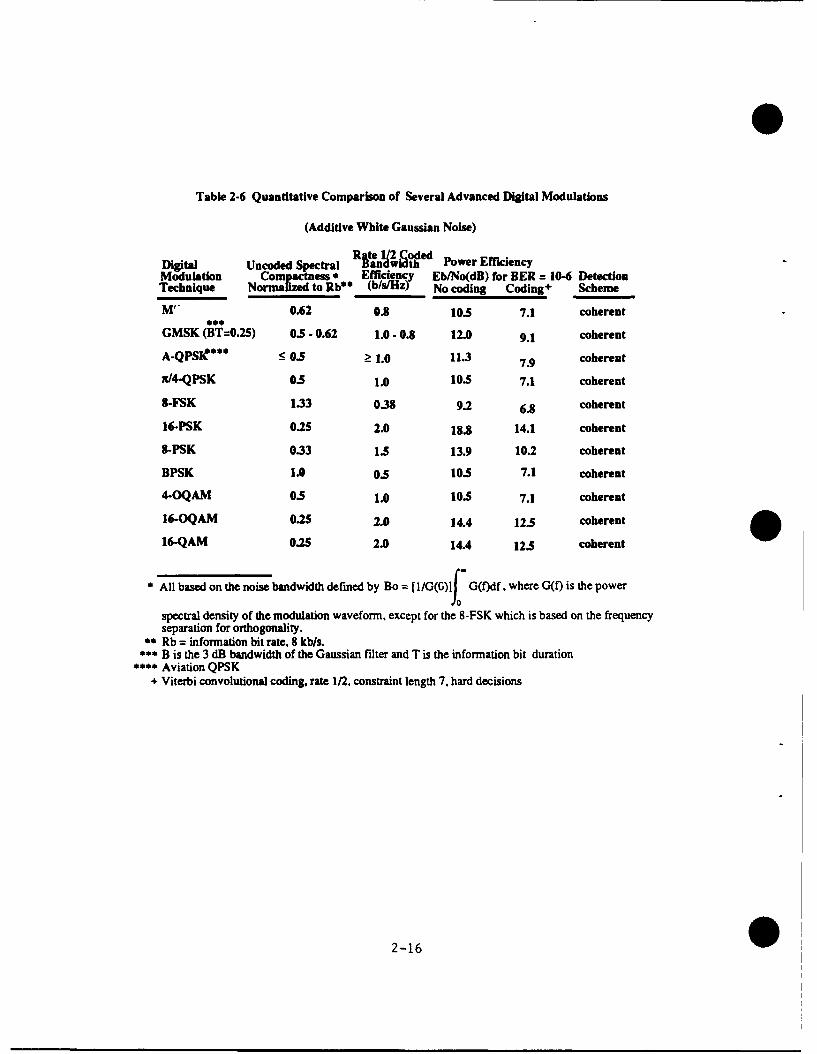
Table 2-6 Quantitative Comparison of Several Advanced Digital Modulations
(Additive White Gaussian Noise)
Rate 112.CodedDigital Uncoded Spectral Bandwidth Power EfficiencyModulation Compactness * Efficiency Eb/No(dB) for BER = 10-6 DetectionTechnique Normalized to Rbe* (b/s/Hz) No coding Coding + Scheme
M 0.62 0.8 10.5 7.1 coherent
GMSK (BT=0.25) 0.5 - 0.62 1.0 - 0.8 12.0 9.1 coherent
A-QPSiC* < 0-5 > 1.0 11.3 7.9 coherent
W/4-QPSK 0.5 1.0 10.5 7.1 coherent
8-FSK 1.33 0.38 9.2 6.8 coherent
16-PSK 0.25 2.0 18.8 14.1 coherent
8-PSK 0.33 15 13.9 10.2 coherent
BPSK 1.0 05 10.5 7.1 coherent
4-OQAM 0.5 1.0 105 7.1 coherent
16.OQAM 0.25 2.0 14.4 12.5 coherent
16-QAM 025 2.0 14.4 12.5 coherent
All based on the noise bandwidth defined by Bo = I/GI(G)] lf G(f)df. where G(f) is the power
spectral density of the modulation waveform, except for the 8-FSK which is based on the frequencyseparation for orthogonality.
* Rb = information bit rate, 8 kb/s.• B is the 3 dB bandwidth of the Gaussian filter and T is the information bit duration• Aviation QPSK
+ Viterbi convolutional coding, rate 1/2, constraint length 7, hard decisions
2-16
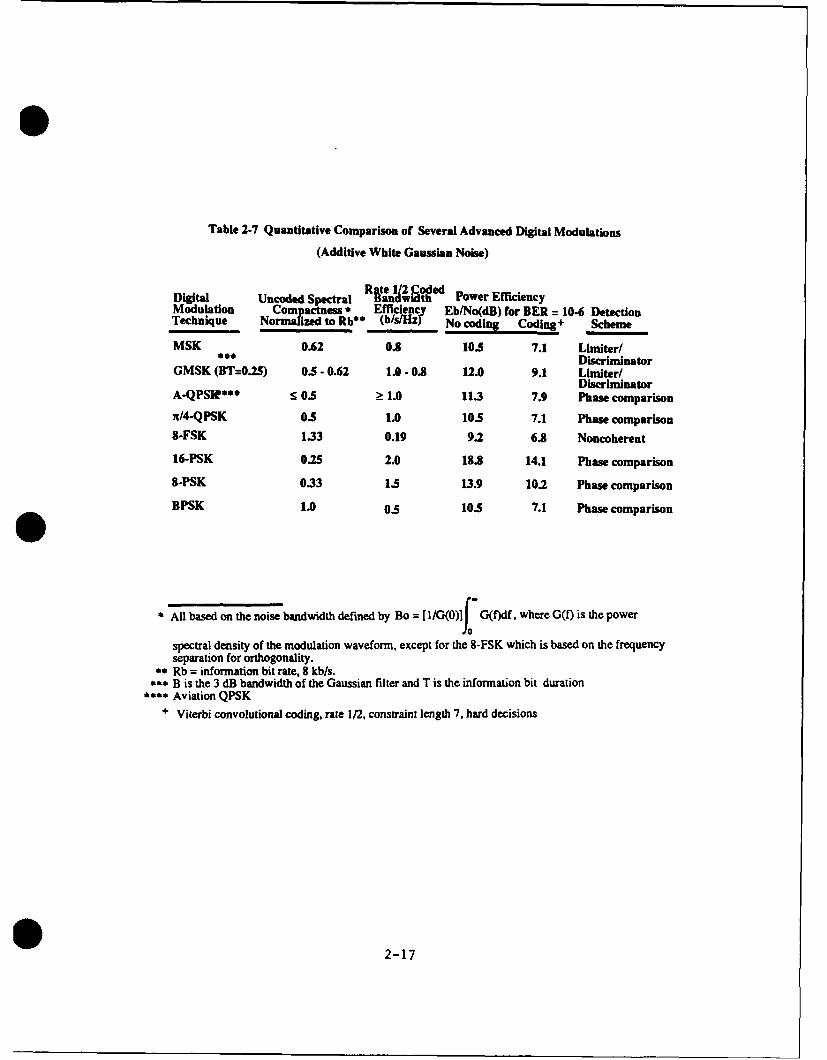
Table 2-7 Quantitative Comparison of Several Advanced Digital Modulations
(Additive White Gaussian Noise)
Digital Uncoded Spectral band ii Power EfficiencyModulation Copactness 0 Efficiency Eb/No(dD) for BER = 10-6 DetectionTechnique Normalized to Rb** (b/s/Hz) No coding Coding+ Scheme
MSK 0.62 0.8 10.5 7.1 Limiter/00* Discriminator
GMSK (BT=-0.25) 0.5 -0.62 1.0- 0.8 12.0 9.1 Limiter/Discrimidnator
A-QPSIC** 5 0.5 2:1.0 11.3 7.9 Phase comparison
ir/4-QPSK 0.5 1.0 10.5 7.1 Phase comparison8-FSK 1.33 0.19 9.2 6.8 Noncoherent
16-PSK 0.25 2.0 18.8 14.1 Phase comparison
8-PSK 0.33 1.5 13.9 10.2 Phase comparison
BPSK 1.0 0.5 10.5 7.1 Phase comparison
*AUl based on the noise bandwidth defined by Bo [I [/G(O)1j G(f)df, where GQ) is the power
spectral density of the modulation waveformn, except for the 8-FSK which is based on the frequencyseparation for orthogonality.
**Rb = informiation bit rate, 8 kb/s.* B is the 3 dB bandwidth of the Gaussian filter and T is the informnation bit duration
~**Aviation QPSK+ Viterbi convolutional coding, rate 1/2, constraint length 7. hard decisions
S 2-17
SECTION 3RADIO IMPLEMENTATION AND COST ESTIMATES
3.0 INTRODUCTION
This section documents the efforts of the Cost Analysis Technical Center (D093) in
taking a first look at the estimated prices of CTAG airborne and ground radios [11].
3.1 COST ANALYSIS
3.1.1 Scope
The analyses documented here cover only the conceptual designs of the front end ofairborne and ground radios that could be used in the CTAG system. Work breakdownstructures (WBSs) for both development and production have been outlined and are includedin Appendix 2. The estimates discussed herein relate only to WBS elements 1.1.1 (groundradio receiver), 1.1.3 (ground radio exciter), and 1.2 (airborne commercial radios), and do notinclude any estimates of software that might be required or installation costs.
3.1.2 Ground Rules and Assumptions
This analysis is based on vendor prices for equipment manufactured in roughly10,000 unit production lots. It is assumed that similar lot sizes will be used to produce thenew radio equipment.
It is assumed that all prices obtained from manufacturers include allowances for allnon-recurring development costs, all recurring production costs, costs of certification, andprofit. Therefore, it is assumed that the estimated prices drived from the model will containa profit margin. However, the exact value of the margin is unknown.
The cost of any circuitry to accomplish multiple access schemes was not considered,because a multiple access design solution has not been selected to date.
Complex packaging concepts that might be required to reduce weight and volume of
the radios were not considered.
All prices are in 1991 dollars.
3.1.3 Approach
A number of candidate modulation waveforms have been considered, including bothanalog and digital scnemes. The modulations selected for cost analysis include two analogwaveforms (Narrowband AM, and SSB), and three digital waveforms (GMSK, A-QPSK, and16-QAM). Radio front end block diagrams were designed for each waveform by D. K.Snodgrass (D053). These block diagrams considered all circuitry to receive and demodulate,
*3-1
or modulate and transmit, each waveform. The designs are based on a TDMA approach butdid not include any circuitry to effect a TDMA set up. The block diagrams are reproduced inAppendix 3.
The FASTE parametric cost estimating model was used [5]. Parametric costestimating is the process of transforming performance characteristics of items into coststhrough specific (though unknown to the user) relationships between those characteristics andcosts. The use of parametric cost estimating is most appropriate when design data anddefinitive information about a project are not available. This is especially true for a projectlike CTAG that is in the early stages of concept evolution.
FASTE uses the following relationship to estimate the cost of an item.
COST = f(ENTYPE, PLATFORM, PMX, WEIGHT) (1)
ENTYPE is a variable that expresses the character of technology of the item.ENTYPE has a range from 40 to 140, where 40 represents the highest level of technologyand 140 represents the lowest level of technology. FASTE suggests a range of 40 to 45 forelectronics so a value of 43 was chosen.
PLATFORM is the variable that reflects the requirements for an item in terms ofquality, reliability, maintainability, ease of use, safety, performance, and environmentalconditions. PLATFORM can range in value from 0.9 to 3.5 with 1.0 generally used forground or commercial equipment and 2.3 to 2.5 used for manned space systems. FASTEsuggests a range of 1.6 to 1.7 for commercial aircraft so a value of 1.65 was chosen for theairborne radio. For a ground environment, FASTE suggests a range of 1.2 to 1.4 for militaryequipment so a value of 1.3 was chosen for the ground radio. The baseline standard AMground radio is considered a military item since it carries a nomenclature (i.e., the receiver islisted as AN/GRR-23(V)l0). This is the same lIT radio that the FAA uses in RemoteControl Air-Ground (RCAG) ground sites. The Navy has also used this radio.
PMX is the variable that indicates a manufacturer's resources, skills, experience, andproductivity; the item's design and scope; and the production methods. This factor wasdetermined through calibration of the model based on price quotations obtained from themanufacturers.
COST and WEIGHT were values obtained from manufacturers' literature.
3.1.4 Estimating Methodology
First, FASTE was calibrated. Specifically, the data for a standard AM radio were inputinto the model, which used the cost relationship in equation (1) to determine the value ofPMX. Next, block diagrams of the candidate modulation schemes were generated.Engineering judgement was used to assess the complexities of those schemes as a percentageof the standard AM radio complexity. The complexity percentage values were then used tomultiply both PMX and WEIGHT of the standard AM radio. This procedure assumes that adesign of greater complexity will also weigh more unless steps are taken to reduce the weight
3-2
Sand/or volume through the extensive use of chip packaging concepts (e.g., ASICs, hybrids, orother specialized integrated circuits).
3.2 ESTIMATES FOR AIRBORNE RADIOS
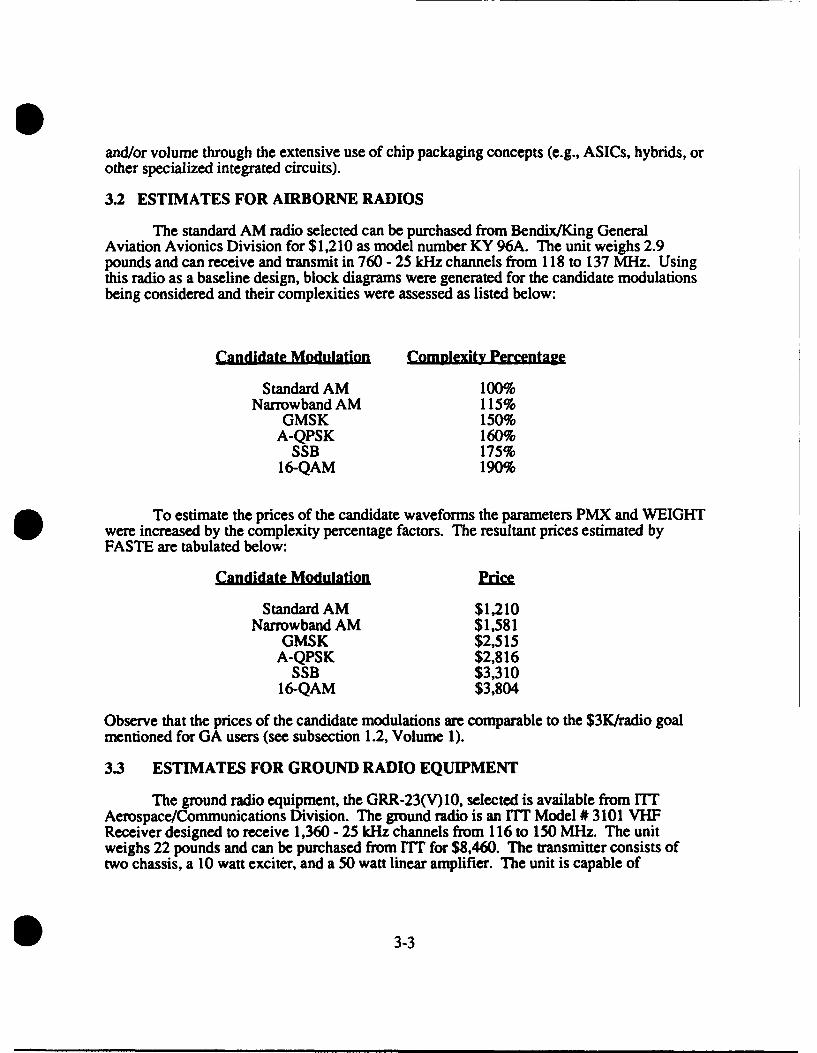
The standard AM radio selected can be purchased from Bendix/King GeneralAviation Avionics Division for $1,210 as model number KY 96A. The unit weighs 2.9pounds and can receive and transmit in 760 - 25 kHz channels from 118 to 137 MHz. Usingthis radio as a baseline design, block diagrams were generated for the candidate modulationsbeing considered and their complexities were assessed as listed below:
Candidate Modulation Complexity Percentage
Standard AM 100%Narrowband AM 115%
GMSK 150%A-QPSK 160%
SSB 175%16-QAM 190%
To estimate the prices of the candidate waveforms the parameters PMX and WEIGHTwere increased by the complexity percentage factors. The resultant prices estimated byFASTE are tabulated below:
Candidate Modulation Ed=
Standard AM $1,210Narrowband AM $1,581
GMSK $2,515A-QPSK $2,816
SSB $3,31016-QAM $3,804
Observe that the prices of the candidate modulations are comparable to the $3K/radio goalmentioned for GA users (see subsection 1.2, Volume 1).
3.3 ESTIMATES FOR GROUND RADIO EQUIPMENT
The ground radio equipment, the GRR-23(V)10, selected is available from ITTAerospace/Communications Division. The ground radio is an ITT Model # 3101 VHFReceiver designed to receive 1,360 - 25 kHz channels from 116 to 150 MHz. The unitweighs 22 pounds and can be purchased from ITT for $8,460. The transmitter consists oftwo chassis, a 10 watt exciter, and a 50 watt linear amplifier. The unit is capable of
* 3-3
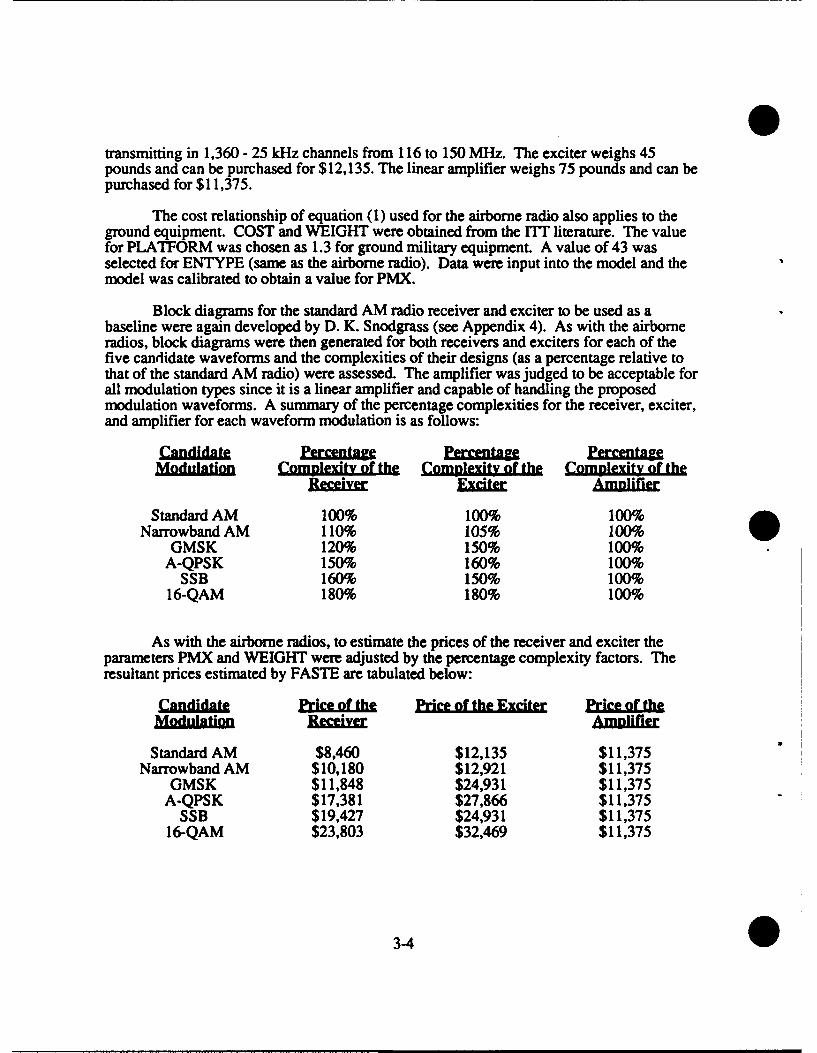
transmitting in 1,360 - 25 kHz channels from 116 to 150 MHz. The exciter weighs 45pounds and can be purchased for $12,135. The linear amplifier weighs 75 pounds and can bepurchased for $11,375.
The cost relationship of equation (1) used for the airborne radio also applies to theground equipment. COST and WEIGHT were obtained from the ITT literature. The valuefor PLATFORM was chosen as 1.3 for ground military equipment. A value of 43 wasselected for ENTYPE (same as the airborne radio). Data were input into the model and themodel was calibrated to obtain a value for PMX.
Block diagrams for the standard AM radio receiver and exciter to be used as abaseline were again developed by D. K. Snodgrass (see Appendix 4). As with the airborneradios, block diagrams were then generated for both receivers and exciters for each of thefive candidate waveforms and the complexities of their designs (as a percentage relative tothat of the standard AM radio) were assessed. The amplifier was judged to be acceptable forall modulation types since it is a linear amplifier and capable of handling the proposedmodulation waveforms. A summary of the percentage complexities for the receiver, exciter,and amplifier for each waveform modulation is as follows:
Candidate yea Perrcenla PercetageModulation Ciomplexitl of the Complexity of the Complexity of the
ReceveEr Am
Standard AM 100% 100% 100%Narrowband AM 110% 105% 100%
GMSK 120% 150% 100%A-QPSK 150% 160% 100%
SSB 160% 150% 100%16-QAM 180% 180% 100%
As with the airborne radios, to estimate the prices of the receiver and exciter theparameters PMX and WEIGHT were adjusted by the percentage complexity factors. Theresultant prices estimated by FASTE are tabulated below:
Camisde Price of the Price of the Exciter Price of theMReceiver Am
Standard AM $8,460 $12,135 $11,375Narrowband AM $10,180 $12,921 $11,375
GMSK $11,848 $24,931 $11,375A-QPSK $17,381 $27,866 $11,375
SSB $19,427 $24,931 $11,37516-QAM $23,803 $32,469 $11,375
3-4
Link budgets performed in conjunction with Sections 6 and 7 show that the 50Wamplifier is unnecessary for CTAG. This reduces the price of the ground radios significantly,about a third to a sixth, depending on the complexity of the modulation scheme.Nevertheless, this ground radio cost estimate for CTAG still appears to be exaggerated.Further cost modeling work in the radio area is warranted.
0
0F 3-5
SECTION 4
SPREAD SPECTRUM MULTIPLE ACCESS
4.0 INTRODUCTION
A communication system whose transmission bandwidth greatly exceeds its informationrate, and which can effectively operate at a low channel signal-to-noise ratio, is generallyreferred to as a spread spectrum system. Common examples of spread spectrum are directsequence pseudo noise (DSPN) and frequency hopping (FH) systems. The basic questionhere is whether CTAG can usefully employ spread spectrum to avoid the need for additionalfrequency allocations. Sufficient bandwidth must be available, and there must be tolerableself interference and acceptable interference to other systems.
4.1 BACKGROUND
Code Division Multiple Access (CDMA) communications employing spread spectrumhas been advocated for mobile cellular telephony, personal communication networks, andwireless local area networks by QUALCOMM [121 and others [13, 14]. Most of theproposals employ DSPN rather than FH. Claimed advantages of CDMA are: 1) a muchlarger number of users who can share a given spectrum allocation; and 2) the ability tooverlay new CDMA users on existing narrowband users.
The basic issue is the possible relevance of spread spectrum CDMA to CTAG. Do theclaimed advantages apply to VHF A-G communications [15]? What are the limitations ofspread spectrum CDMA? Before attempting to answer these questions, one should note thefundamental differences between cellular telephony and CTAG. In cellular telephonycapacity is all important. The economic feasibility of cellular telephone sysz,,.ms dependsupon maximizing capacity, i.e., the number of simultaneous users who can operate in a givengeographic area. Quality of service obtained versus cost tradeoffs are acceptable, e.g.,occasional loss of service for tens of seconds or even minutes is tolerable in order to providean affordable system.
On the other hand, reliability, or more precisely, link availability, is all important forCTAG. The required capacity is driven by the growth of aviation traffic. A high quality ofservice must be provided; loss of service is unacceptable. This usually implies that redundantcommunications links must be provided and that relatively rare events must be considered inthe system design.
4.2 ADVANTAGES
The most important attraction of CDMA is the promise of increased capacity, i.e., moreusers sharing a given spectrum allocation. This occurs because: 1) the entire frequencyAlocation can be used in every spatial CTAG "cell", and 2) the voice duty factor, i.e., periodsof silences inherent in speech, can be more easily exploited in interference-limited CDMAthan by bandwidth-limited TDMA and FDMA. Another strong advantage is the relatively
S 4-1
soft limit on capacity because of the gradual degradation under overload in CDMA, asopposed to the hard limit on capacity encountered with TDMA and FDMA.
Also, the overlaying of spread spectrum CDMA waveforms on the existing frequencyallocations of narrowband users may be acceptable to those users. The typical interference ofCDMA with any given narrowband channel is small and noiselike. Conversely, CDMAusers can employ reduced transmitter powers and still communicate if they excisenarrowband interference at their receivers.
In addition, accurate ranging is possible with a DSPN waveform. This would be useful inCTAG for cell-to-cell handover.
Finally, there is inherent privacy with spread spectrum CDMA as afforded by the DSPNcode sequence. On the other hand, privacy is not difficult to achieve with narrowband digitalcommunications through simple encryption techniques.
4.3 LIMITATIONS
A basic consideration in spread spectrum CDMA systems is the so-called "near-far"problem, viz., when the signal from a nearby transmitter dominates those arriving fromrelatively far away. As will be shown in more detail in subsection 6.1, in CTAG theseparation of the uplink and downlink frequency bands reduces the magnitude of the near-farinterference problem.
The same cell near-far interference on VHF A-G links is the limiting problem for spreadspectrum CDMA. With fixed transmitter power, the dynamic range of signals received at theground station can exceed the spread spectrum processing gain. Adaptive power control ofairborne transmitters is required to reduce this dynamic range. Also, an adaptive arrayantenna at ground station can further reduce the dynamic range because near and far aircrafttransmitters will usually be at different angles with respect to the ground station. The otherself interference problem in cellular communcation systems is adjacent cell interference.This is worse for VHF A-G communications than for cellular telephone systems because ofthe inverse-square propagation characteristic of LOS paths, as opposed to inverse-fourth-power propagation in land mobile cells.
The available processing gain of spread spectrum CDMA is about 250 = 2 x 10⁶/8 x 103.or 24 dB, assuming a spread spectrum bandwidth of 2 MHz and a baseband data rate of 8kb/s. As shown in figure 4-1, there are three allocated segments of VHF bandwidth for ATC.Two of these are about 4 MHz wide. A spreading bandwidth of only 2 MHz allows somemargin for decreasing potential interference in adjacent bands even further. The basebanddata rate of 8 kb/s permits vocoded speech and the coding of digital data at 4.8 kb/s or less.
It is not unreasonable to assume that the cochannel interference limit (!/S) of AM radio isabout -15 dB. Thus, without any power control within the CDMA system, the near-farmargin for a single A-G CDMA link is only 9 dB. This corresponds to a relative range ratioof only (100.9)1 /2 = 2.8. There are still likely scenarios where signals from nearby aircraftwould undesirably interfere with those from three times away.
4-2
40
C.,4
>5
0 2U- - -
4-3
With perfect adaptive power control, i.e., if this 9 dB variation in received signal strengthis controlled so that all CDMA signals are received with the same power regardless of theaircraft range, then 100.9 = 8 simultaneous CDMA A-G links can operate in each spatial cell[16].
To lessen potential interference to existing AM radios operating in the same band,operating the CDMA radios at a lower received signal level than the AM radios can provideadditional margin against interference to these AM radios. However, AM radio interferenceto the CDMA system obviously gets worse when this is done. This latter situation can bemitigated by excising narrowband AM signals in the spread spectrum CDMA receivers. Thisis relatively straightforward using notch filters if the AM frequencies are known and fixed. Ifthe AM frequencies are variable, some sort of adaptive excising technique would benecessary. In either case the complexity of the spread spectrum CDMA receiver would beincreased compared to one without the excision feature.
In any event a transition from narrowband AM to spread spectrum CDMA within existingfrequency allocations would be difficult. One would need to convince the frequencymanagers that the present AM equipment would not be adversely affected by the introductionof CDMA. This would undoubtedly require, at the minimum, interference testing inoperational environments where the interference of the spread spectrum CDMA system wasviewed as negligible.
Perhaps only one of the three ATC bands would be allowed for CDMA. Of course, ifCDMA could be proven to be effective and non-interfering, one might hope to obtainpermission to spread over larger bandwidths to attain increased processing gain.
4.4 CONCLUSIONS
From a cursory examination it is not possible to eliminate CDMA as a potentialalternative for CTAG. It remains an interesting one and deserves further analysis.
However, adaptive power control and/or adaptive array ground antennas are needed torealize the theoretical advantages of increased system capacity and a CDMA overlay on AMusers.
The implementation of CDMA is more "high tech" than the implementation of a newnarrowband radio. Much more extensive analysis, and simulation for that matter, is requiredto properly evaluate CDMA for CTAG. But again, spread spectrum CDMA should not berejected based upon the cursory analysis performed thus far.
4-4
ISECTION 5
VOICE MESSAGE TRAFFIC MODEL
5.0 INTRODUCTION
This section develops a model for the generation of voice traffic between airplanes andground controllers within the jurisdiction of a typical U.S. ARTCC, viz., Boston Center [ 17].The model produces estimates of the average number of message exchanges associated withen route and terminal activities within the center's area during a peak period of aircrafttraffic. In the case of terminal activities (aircraft arrivals and departures), the model reflectsmessage traffic at Logan International Airport. Overflights at Logan have been neglectedbecause they constitute a small fraction of the terminal traffic. The model also givesestimates of the length of exchanges.
It will be seen that the model lacks some desired details. For example, it doesn't treatthe distribution of message generation times within a peak period, which may not beexponential (exchanges come in bunches). To account for this distribution more detailedtraffic information is needed.
Although Boston center includes all of New England and a large portion of New YorkState, it is not the largest center. Logan International, is of category 4 (on a scale of 1 to 5,small to large) in size of the traffic it handles; Chicago (O'Hare) and Atlanta are in category5. Boston also has a significant amount of international and over-the-ocean air traffic.Trans-oceanic traffic to and from the Boston area is handled by a special facility under theNew York center. The Boston area is thus on the large side in terms of traffic and has a widevariety of traffic types. For these reasons it appears to be a suitable standard starting examplefor a larger airport CTAG analysis. Later, one may want to consider tougher cases in whichthere are more than one large airport in the center's area, for exampie, New York City.
The en route and terminal operations of a typical flight in terms of the number, lengthsand frequencies of the associated message exchanges with ground controllers are described inthis model. Monitoring of traffic and discussions with pilots and controllers suggest that thenumbers of exchanges during departure and arrival are roughly the same. The current radiosused by controllers appear to be set more or less permanently on one frequency in the VHFaircraft band (118-137 MHz).
After consideration of a typical flight's exchanges, estimates of the total numbers ofterminal operations and en route flights in a center's area during the peak traffic period [6],the duration of the peak, and the fraction of the total peak terminal traffic that uses Logan arecombined with the information on individual operations. The leads to estimates of
• the average number of exchanges per frequency during the peak, and• the average fraction of the peak period occupied by exchanges on one frequency.
These two numbers will give us an idea of what message volume or duty factor per frequencythe CTAG system will have to handle in a typical center's area.
5-1
The duration of the peak (gathered during a visit to the Manchester, New HampshireTRACON) may be pretty rough, as is the estimate of the total terminal traffic Logan handles,which is based only on a controller's confirmation of a suggested number.
5.1 TERMINAL SEQUENCE
In this subsection, "controllers" associated with departures and landings and theaverage number and length of exchanges associated with each controller for each flight arelisted. A controller is defined here as a fixed radio position that is usually on one frequencyat a time. Near a large airport, or when an en route controller is handling more than onesector, a controller may have exchanges with one airplane on one frequency that arebroadcast on other frequencies to other airplanes.
Note that different controllers may be located at the same place, and thatcommunications antennas associated with terminal operations are not necessarily at airports.Exchanges may be initiated by a controller or an aircraft. As a general rule, aircraft appear toinitiate the majority of the exchanges up to departure, and controllers the majority (inparticular, frequency hand offs) after take off. In each case, a typical value is given inparentheses. The typical values are taken from FAA publications [7] channel monitoring anddiscussions with pilots and controllers. Note also that when the weather is bad there will bemore traffic-including more repeats--than the amounts given here.
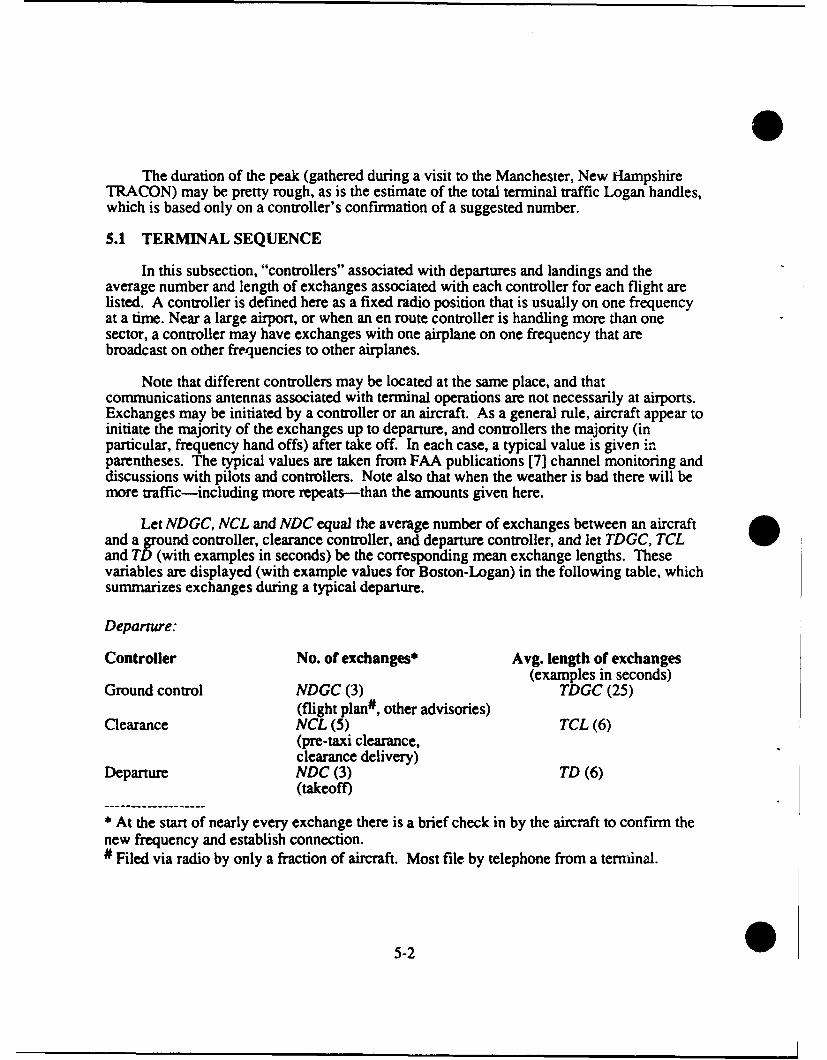
Let NDGC, NCL and NDC equal the average number of exchanges between an aircraftand a ground controller, clearance controller, and departure controller, and let TDGC, TCLand TD (with examples in seconds) be the corresponding mean exchange lengths. Thesevariables are displayed (with example values for Boston-Logan) in the following table, whichsummarizes exchanges during a typical departure.
Departure:
Controller No. of exchanges* Avg. length of exchanges(examples in seconds)
Ground control NDGC (3) TDGC (25)(flight plan#, other advisories)
Clearance NCL (5) TCL (6)(pre-taxi clearance,clearance delivery)
Departure NDC (3) TD (6)(takeoff)
* At the start of nearly every exchange there is a brief check in by the aircraft to confirm thenew frequency and establish connection.# Filed via radio by only a fraction of aircraft. Most file by telephone from a terminal.
5-2
SI
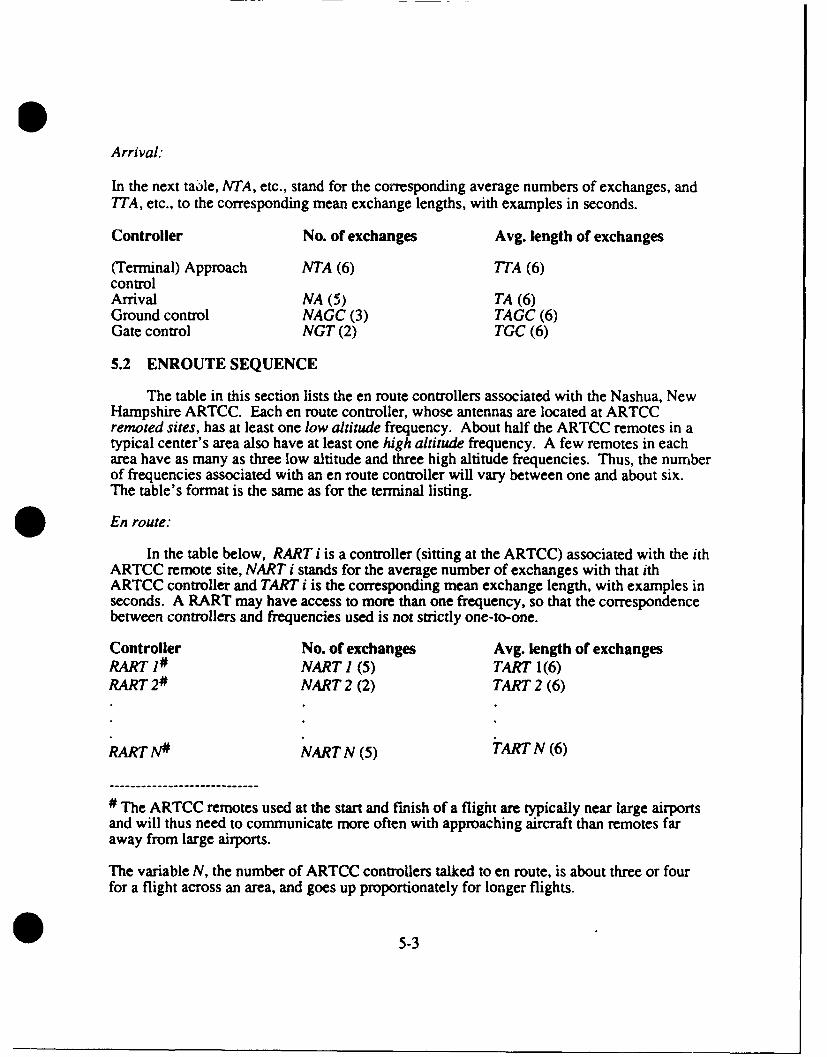
Arrival:
In the next table, NTA, etc., stand for the corresponding average numbers of exchanges, and
7TA, etc., to the corresponding mean exchange lengths, with examples in seconds.
Controller No. of exchanges Avg. length of exchanges
(Terminal) Approach NTA (6) 7TA (6)controlArrival NA (5) TA (6)Ground control NAGC (3) TAGC (6)Gate control NGT (2) TGC (6)
5.2 ENROUTE SEQUENCE
The table in this section lists the en route controllers associated with the Nashua, NewHampshire ARTCC. Each en route controller, whose antennas are located at ARTCCremoted sites, has at least one low altitude frequency. About half the ARTCC remotes in atypical center's area also have at least one high altitude frequency. A few remotes in eacharea have as many as three low altitude and three high altitude frequencies. Thus, the numberof frequencies associated with an en route controller will vary between one and about six.The table's format is the same as for the terminal listing.
En route:
In the table below, RART i is a controller (sitting at the ARTCC) associated with the ithARTCC remote site, NART i stands for the average number of exchanges with that ithARTCC controller and TART i is the corresponding mean exchange length, with examples inseconds. A RART may have access to more than one frequency, so that the correspondencebetween controllers and frequencies used is not strictly one-to-one.
Controller No. of exchanges Avg. length of exchangesRART 1# NART 1 (5) TART 1(6)RART2# NART 2 (2) TART 2 (6)
RART N# NART N (5) TART N (6)
* The ARTCC remotes used at the start and finish of a flight are typically near large airportsand will thus need to communicate more often with approaching aircraft than remotes faraway from large airports.
The variable N, the number of ARTCC controllers talked to en route, is about three or fourfor a flight across an area, and goes up proportionately for longer flights.
* 5-3
5.3 ESTIMATES OF MEAN CALL OCCURRENCE TIMES AND EXCHANGEDURATIONS
To produce these estimates the following definitions are introduced:TP = duration of peak traffic period in seconds (7,200 for morning peak, 14,400 for evening),NER = number of en route flights in Boston Center area during the peak (2,200),NERF = number of en route frequencies (- three times the number of ATRCC remotes) (61),NT = number of terminal flights in Boston Center during peak (250),NTF = number of terminal frequencies used at Logan during peak (9), anda = fraction of NT handled by Logan (0.7).(This artifice will not be necessary when we get statistics on the traffic at specific airports.)
Also letCD(CA)(CER) = average number of exchanges during departure (arrival) (en route flight);
hence:CD = NDGC + NCL + NDC (11) (see the notation under Departures in subsection 5.1),CA = NTA + NA + NAGC +NGT (16) (see Arrivals in subsection 5.1), and
N
CER= - NART i (= 5 + 2 + 2 + 2 + 5 = 16 forN [no. of RARTs contacted] = 5)], since CER
equals the average total number of exchanges with the N RARTs called en route (see Enroute in section 5.2).
Finally, letNXER = average number of (en route) exchanges per ARTCC controller during peak andNXT = average number of (terminal) exchanges per TRADOC/ARTCC controller duringpeak.
Then for en route traffic in the Boston ARTCCNXER = NER • CER • 1/NERF = 2200 • 16 • 1/61 = 577 en route exchanges/cell, and forLogan terminal traffic:NXT = a • NT • (CD + CA) • 1/NTF = 0.7 • 250 • 27 - 1/9 = 525 terminal exchanges/cell.
Since some of the ARTCC locations are in remote locations, they may handle significantlyless message traffic than those in busy areas, so NXER should be kept in mind as an average.
Now letTBEXER = average time between en route calls in seconds, andTBEXT = average time between terminal calls in seconds.If the exchanges are distributed uniformly across the peak period (they may not be), then oneobtainsTBEXER = TPINXER and
5-4
TBEXT = TP/NXT.
The TRACON controller in Manchester, NH, stated that the evening peak there, when aboutthe same amount of traffic is handled as in the morning peak, is about four hours long(14,400 s), whereas the morning peak is only two hours long, so for en route traffic in theBoston Center,
TBEXER = 7,200/577 = 12.5 s for the AM peak and 14,400/577 = 25 s for the PM peak.
For terminal traffic at Logan (assuming that the peaks at Logan last about as long as atManchester)
TBEXT = 7,200/525 = 13.7 s (AM peak) and 14,400/525 = 27.4 s (PM peak).
The peak values of aircraft traffic cited and used above are instantaneous values, and I'massuming that the peak instantaneous values persist during the peak period. One needs toknow more about how air traffic changes during the peak period before these estimates of theTBs can be refined.
Another approach"
During the 6 June video teleconference with CAASD, J. E. Dieudonne mentionedanecdotically that Washington National handles about one aircraft every 27 s at peak. If oneassumes that the same happens at Logan (which uses two runway frequencies), then thenumber of exchanges per second per runway frequency at Logan can be estimated as 1/27 •1/2 • NA = (5/54)/s, and TBEXT as the reciprocal of this, or about 10 s. (Recall that NA = 5 isthe average number of exchanges during a typical runway approach.) Given that Nationalprobably handles somewhat more peak traffic than Logan, this re.,ult provides somecorroboration of the previous TBEXT estimate.
5.4 THE DISTRIBUTION OF EXCHANGE LENGTHS
Monitoring of Logan and Manchester, NH, message traffic, and discussions withManchester and Nashua controllers and general aviation pilots have led to the followingobservations:
a. There is usually not much difference between the lengths of exchanges betweencontrollers and commercial or general aviation aircraft. Because of their generallysmaller experience, general aviation pilots may take slightly longer to completetheir exchanges than commercial pilots.
b. The distribution of exchange length (the great majority of calls bring forth animmediate response of roughly the same length as the call) seems to be bi-modal,with one mode at about 6 s and the other between about 20 to 30 s, primarilyassociated with filing or coordination of flight plans.
5-5
5.5 ESTIMATING THE MAXIMUM AND MINIMUM NUMBER OF CELLSNEEDED IN AN AREA
One way to estimate the largest number of cells needed to handle the en route andlarge-airport traffic in an ACF is to assume that these numbers equal the the numbers of enroute and large-airport controller frequencies that planes currently use for exchanges in theACF. The number of controllers, which is probably close to the smallest number of cells onemight want to assume, is smaller than the number of frequencies to which controllers haveaccess.
The number of ARTCC remote frequencies in an area is listed in the back of theAirport/Facility Directory [71 that applies to the ARTCC. In the Boston Center area thereare 26 ARTCC remotes. They use 61 (high and low altitude) frequencies.
In the Boston Center area there are three Flight Service Stations. Associated with themare about 20 Remote Communications Outlets (RCOs), each with at least one frequency fortwo-way communications mainly with general aviation aircraft. The RCOs couldconceivably be used as cells.
Associated with TRACONs are a number of Remote Control Air-Ground (RCAG)radio sites. A map in Nashua shows about 25 RCAGs used in the Boston Center. Some ofthe RCAG sites become RCAGs only at night, and are typically at airports. The ManchesterTRACON has Loring AFB and the former Pease AFB [now used commercially] as RCAGsat night. The RCAGs are probably also candidates for cell status.
5.6 CONCLUDING REMARKS
The analysis is summarized by figures 1-3 and 1-4 and table 1-6 in subsection 1.5.4,Volume 1. Additional progress on the traffic model might benefit from additionalinformation:
* More accurate data on the call occurrence and exchange length distributions forparticular controllers (especially near large airports). Rough estimates of these canbe inferred now, however.
* More detail on the correspondence between en route controllers and their use of thefrequencies assigned to the ARTCC remote sites. This will probably help determinemore accurately the cell site candidates.
" Length of the peak periods at typical, large airports (of less importance than the firsttwo categories of information).
Two themes re-occurred in discussions with pilots and the Manchester controllers. Oneis the eagerness of both pilots and controllers to have an automatic means for assigning andswitching airplane radios to new communications frequencies.
5-6
The second theme is the seriousness of the "stuck-mike" problem. One can easilyimagine that one of the accoutrements of a CTAG solution to the frequency handoff problemwould be an automatic means of informing pilots of stuck microphones. This could be doneon the receiving frequency in use (in the current CTAG concept), or on a frequency a stuckradio is switched to by the CTAG system.
5-7
SECTION 6THREE-DIMENSIONAL CELLULAR SOLUTION
6.0 INTRODUCTION
A three-dimensional cellular tessellation is proposed in this section. Propagationcharacteristics expected for LOS and BLOS signal paths are taken into account.
6.1 FUNDAMENTAL CONSIDERATIONS
Basic considerations on cell structure and frequency reuse are presented in thissubsection [181.
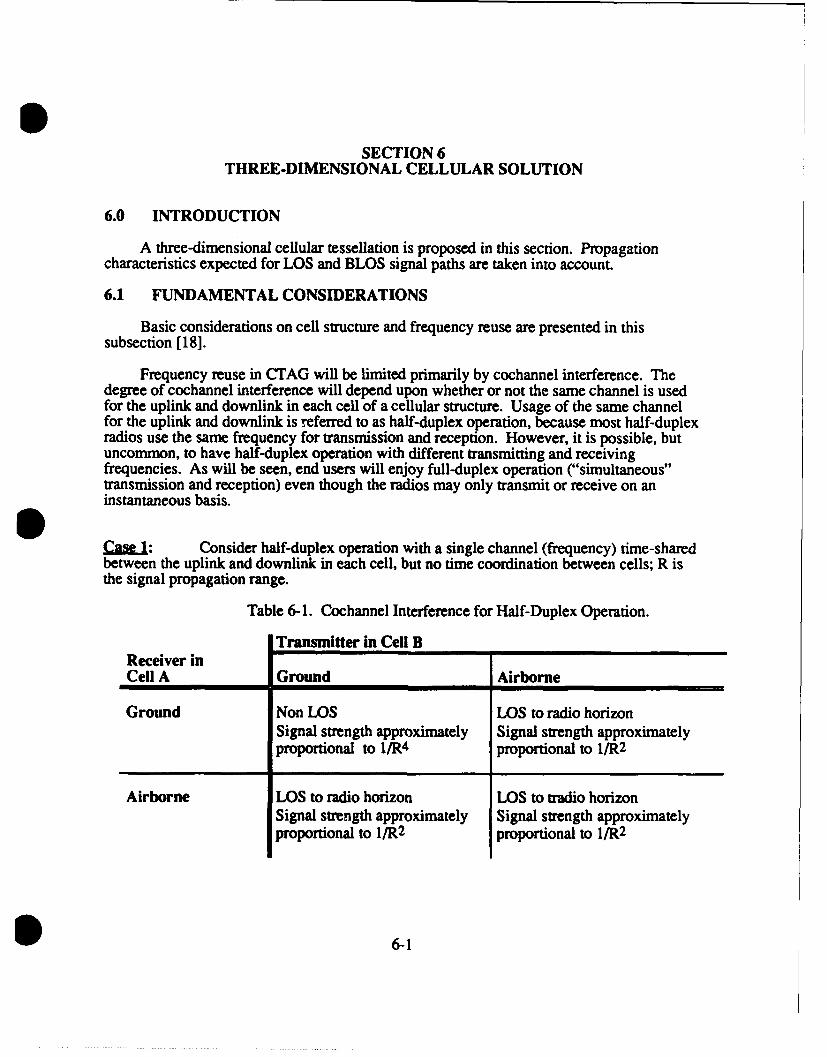
Frequency reuse in CTAG will be limited primarily by cochannel interference. Thedegree of cochannel interference will depend upon whether or not the same channel is usedfor the uplink and downlink in each cell of a cellular structure. Usage of the same channelfor the uplink and downlink is referred to as half-duplex operation, because most half-duplexradios use the same frequency for transmission and reception. However, it is possible, butuncommon, to have half-duplex operation with different transmitting and receivingfrequencies. As will be seen, end users will enjoy full-duplex operation ("simultaneous"transmission and reception) even though the radios may only transmit or receive on aninstantaneous basis.SCasI: Consider half-duplex operation with a single channel (frequency) time-sharedbetween the uplink and downlink in each cell, but no time coordination between cells; R isthe signal propagation range.
Table 6-1. Cochannel Interference for Half-Duplex Operation.
Transmitter in Cell BReceiver inCell A Ground Airborne
Ground Non LOS LOS to radio horizonSignal strength approximately Signal strength approximatelyproportional to l/R4 proportional to l/R2
Airborne LOS to radio horizon LOS to tradio horizonSignal strength approximately Signal strength approximatelyproportional to I/R 2 proportional to l/R 2
5 6-1
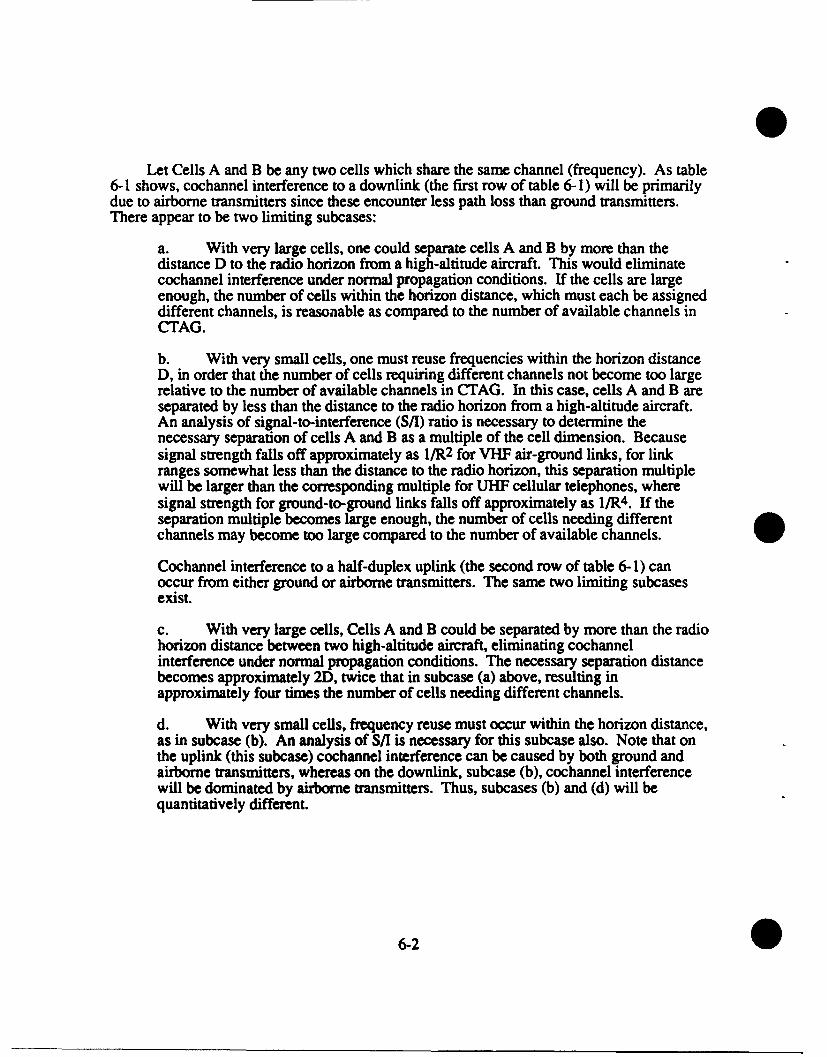
Let Cells A and B be any two cells which share the same channel (frequency). As table6-1 shows, cochannel interference to a downlink (the first row of table 6- 1) will be primarilydue to airborne transmitters since these encounter less path loss than ground transmitters.There appear to be two limiting subcases:
a. With very large cells, one could separate cells A and B by more than thedistance D to the radio horizon from a high-altitude aircraft. This would eliminatecochannel interference under normal propagation conditions. If the cells are largeenough, the number of cells within the horizon distance, which must each be assigneddifferent channels, is reasonable as compared to the number of available channels inCTAG.
b. With very small cells, one must reuse frequencies within the horizon distanceD, in order that the number of cells requiring different channels not become too largerelative to the number of available channels in CTAG. In this case, cells A and B areseparated by less than the distance to the radio horizon from a high-altitude aircraft.An analysis of signal-to-interference (S/I) ratio is necessary to determine thenecessary separation of cells A and B as a multiple of the cell dimension. Becausesignal strength falls off approximately as I/R 2 for VHF air-ground links, for linkranges somewhat less than the distance to the radio horizon, this separation multiplewill be larger than the corresponding multiple for UHF cellular telephones, wheresignal strength for ground-to-ground links falls off approximately as l/R4 . If theseparation multiple becomes large enough, the number of cells needing differentchannels may become too large compared to the number of available channels.
Cochannel interference to a half-duplex uplink (the second row of table 6- 1) canoccur from either ground or airborne transmitters. The same two limiting subcasesexist.
c. With very large cells, Cells A and B could be separated by more than the radiohorizon distance between two high-altitude aircraft, eliminating cochannelinterference under normal propagation conditions. The necessary separation distancebecomes approximately 2D, twice that in subcase (a) above, resulting inapproximately four times the number of cells needing different channels.
d. With very small cells, frequency reuse must occur within the horizon distance,as in subcase (b). An analysis of S/I is necessary for this subcase also. Note that onthe uplink (this subcase) cochannel interference can be caused by both ground andairborne transmitters, whereas on the downlink, subcase (b), cochannel interferencewill be dominated by airborne transmitters. Thus, subcases (b) and (d) will bequantitatively different.
6-2
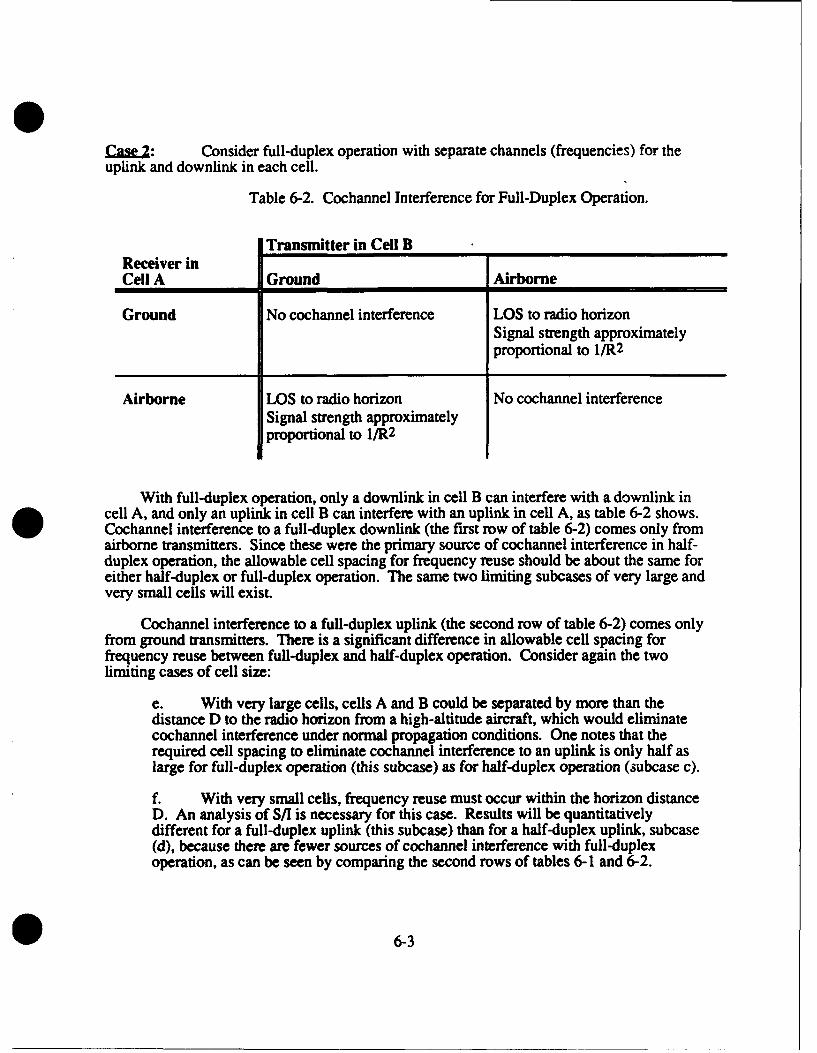
Case2: Consider full-duplex operation with separate channels (frequencies) for theuplink and downlink in each cell.
Table 6-2. Cochannel Interference for Full-Duplex Operation.
Transmitter in Cell BReceiver inCell A Ground Airborne
Ground No cochannel interference LOS to radio horizonSignal strength approximatelyproportional to 1/R2
Airborne LOS to radio horizon No cochannel interferenceSignal strength approximatelyproportional to h/R2
With full-duplex operation, only a downlink in cell B can interfere with a downlink in*cell A, and only an uplink in cell B can interfere with an uplink in cell A, as table 6-2 shows.
Cochannel interference to a full-duplex downlink (the first row of table 6-2) comes only fromairborne transmitters. Since these were the primary source of cochannel interference in half-duplex operation, the allowable cell spacing for frequency reuse should be about the same foreither half-duplex or full-duplex operation. The same two limiting subcases of very large andvery small cells will exist.
Cochannel interference to a full-duplex uplink (the second row of table 6-2) comes onlyfrom ground transmitters. There is a significant difference in allowable cell spacing forfrequency reuse between full-duplex and half-duplex operation. Consider again the twolimiting cases of cell size:
e. With very large cells, cells A and B could be separated by more than thedistance D to the radio horizon from a high-altitude aircraft, which would eliminatecochannel interference under normal propagation conditions. One notes that therequired cell spacing to eliminate cochannel interference to an uplink is only half aslarge for full-duplex operation (this subcase) as for half-duplex operation (subcase c).
f. With very small cells, frequency reuse must occur within the horizon distanceD. An analysis of S/I is necessary for this case. Results will be quantitativelydifferent for a full-duplex uplink (this subcase) than for a half-duplex uplink, subcase(d), because there are fewer sources of cochannel interference with full-duplexoperation, as can be seen by comparing the second rows of tables 6-1 and 6-2.
6-3
It qeems clear, even before performing detailed S/I analysis, that one should probablyseparate the uplinks and downlinks in frequency to minimize the separation between cellsable to reuse the same frequencies.
6.2 OUTLINE OF SPECIFIC SOLUTION
An outline of a possible solution to the cellular problem for CTAG [19] is contained inthis subsection. The requirements used for this solution include the following:
1. The volume to be covered includes the airspace over the U.S. from 2000 ft to60,000 ft (at least).
2. Any place in the above volume should be "covered" by at least two antennas.
3. The total number of sites allowed is about 1200.
4. Frequencies should be reused so as to minimize the total number of servicechannel frequencies that need to be scanned.
A quick look at this problem is enough to realize that a multitiered approach is required.In order to provide coverage at low levels antennas must be closely spaced. However, at highlevels many antennas will be in view so that frequency reuse is not effective if the samefrequencies are used for both high and low aircraft. It is shown below that a three levelapproach works well.
It is also assumed that separate sets of frequencies are used for uplinks and downlinks.As pointed out by R. I. Millar [ 18], this reduces A-A interference problems. When using thisapproach all A-A connectivity is accomplished via ground relay and would be under thecontrol of the air traffic controller.
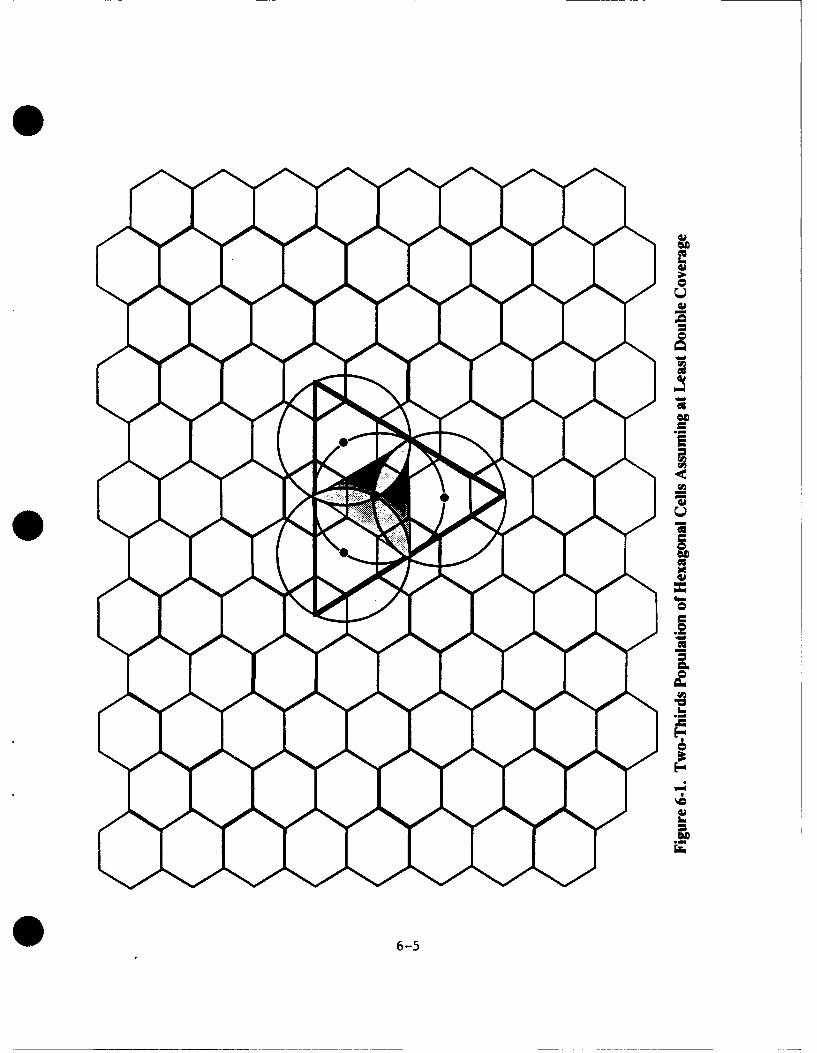
In a typical cellular problem only single coverage is required. The coverage providedby a single omnidirectional antenna is presumed to be circular. A close-packed array ofantennas thus produces a hexagonal pattern where the long dimension of each hexagon isequal to the diameter of the coverage circle. In this situation one wants dual coverage.Multiple coverage can be achieved by making the distance between antennas be equal to theradius of the coverage circle. However, if all cells in a hexagonal pattern are occupied itturns out that any point is within view of three antennas. Since one only needs doublecoverage only two thirds of the cell sites are populated. The resulting pattern is shown infigure 6-1. The smaller circle represents the LOS range of the antenna at its center. Thisrange clearly depends on the height of the aircraft. In this case that height is taken to be thelowest altitude served by the cell. If more small circles were drawn it would be easy to seethat the entire surface is covered by at least two circles. Note that the resulting pattern isreally triangular. Some of the triangles have been drawn in the figure. However, since mostreaders will be familiar with the hexagonal approach the hexagons are retained. One shouldbear in mind, however, that each antenna covers its own triangular cell and one third of eachof its three neighbors - for a total of two cells.
6-4
I-
C
3C
02
4D
=
02
C~)
C
C
CC.2
a.C
02
I-
3
08
6-5
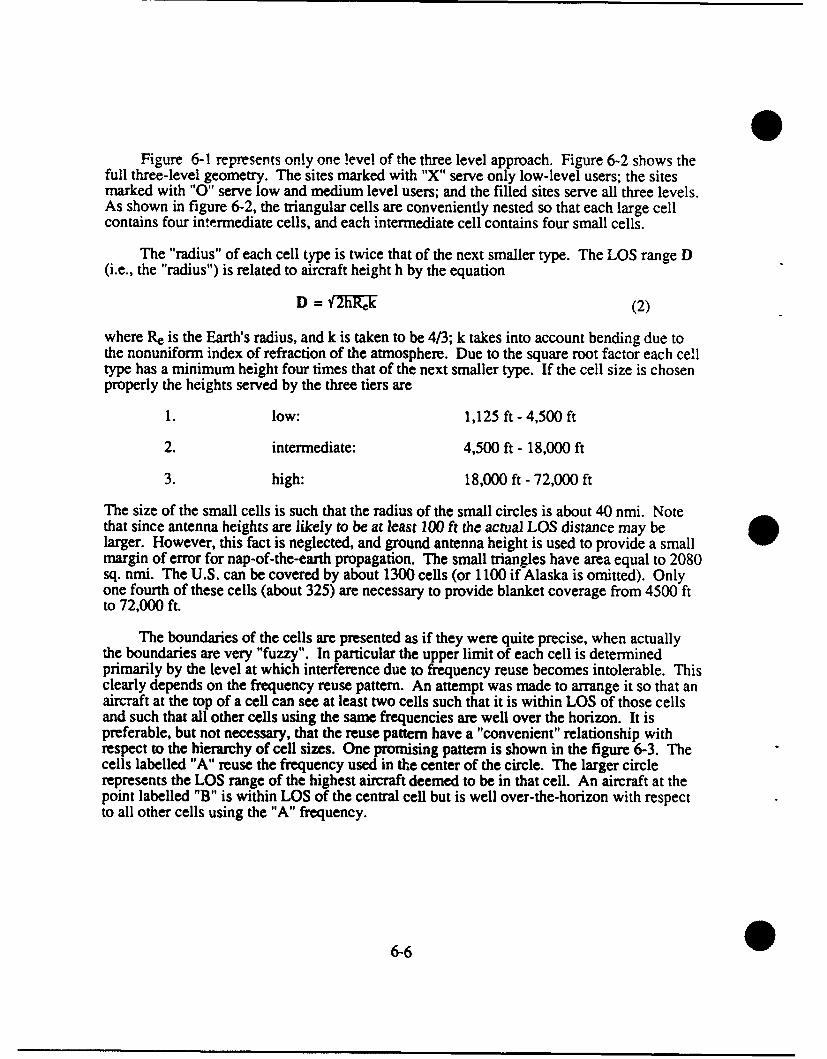
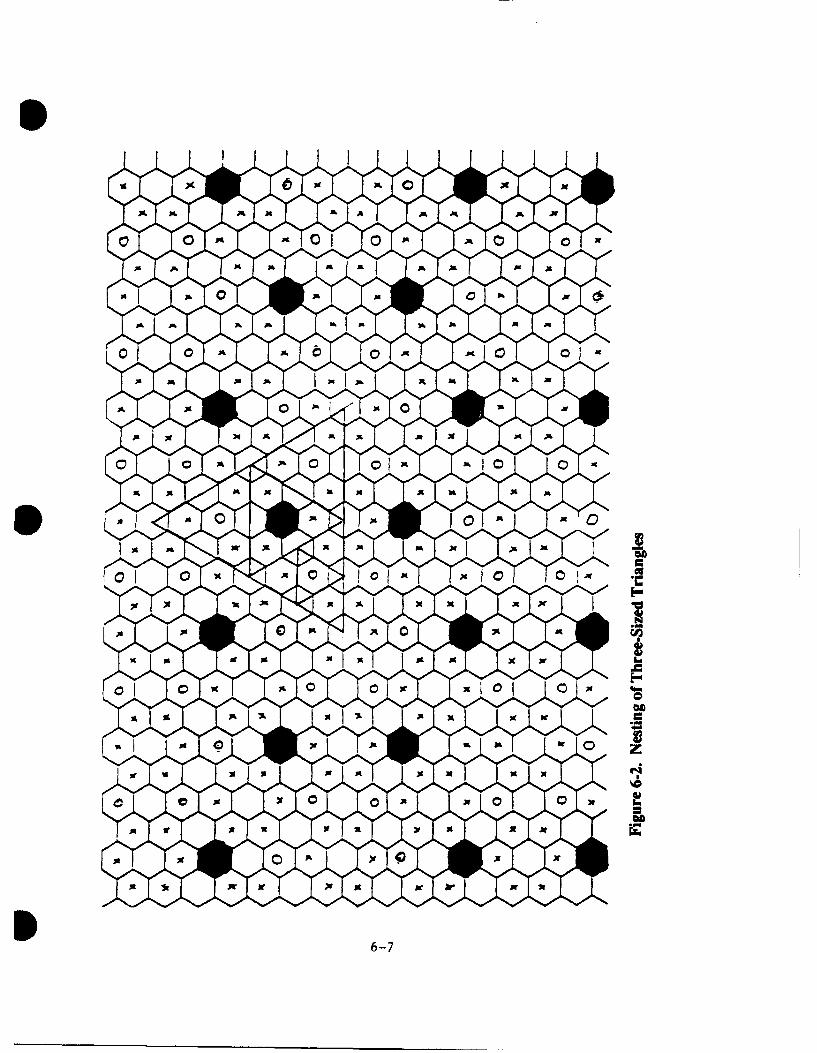
Figure 6-1 represents only one level of the three level approach. Figure 6-2 shows thefull three-level geometry. The sites marked with "X" serve only low-level users; the sitesmarked with "0" serve low and medium level users; and the filled sites serve all three levels.As shown in figure 6-2, the triangular cells are conveniently nested so that each large cellcontains four intermediate cells, and each intermediate cell contains four small cells.
The "radius" of each cell type is twice that of the next smaller type. The LOS range D(i.e., the "radius") is related to aircraft height h by the equation
D = f~gRU (2)
where Re is the Earth's radius, and k is taken to be 4/3; k takes into account bending due tothe nonuniform index of refraction of the atmosphere. Due to the square root factor each celltype has a minimum height four times that of the next smaller type. If the cell size is chosenproperly the heights served by the three tiers are
1. low: 1,125 ft - 4,500 ft
2. intermediate: 4,500 ft - 18,000 ft
3. high: 18,000 ft - 72,000 ft
The size of the small cells is such that the radius of the small circles is about 40 nmi. Notethat since antenna heights are likely to be at least 100 ft the actual LOS distance may belarger. However, this fact is neglected, and ground antenna height is used to provide a smallmargin of error for nap-of-the-earth propagation. The small triangles have area equal to 2080sq. nmi. The U.S. can be covered by about 1300 cells (or 1100 if Alaska is omitted). Onlyone fourth of these cells (about 325) are necessary to provide blanket coverage from 4500 ftto 72,000 ft.
The boundaries of the cells are presented as if they were quite precise, when actuallythe boundaries are very "fuzzy". In particular the upper limit of each cell is determinedprimarily by the level at which interference due to frequency reuse becomes intolerable. Thisclearly depends on the frequency reuse pattern. An attempt was made to arrange it so that anaircraft at the top of a cell can see at least two cells such that it is within LOS of those cellsand such that all other cells using the same frequencies are well over the horizon. It ispreferable, but not necessary, that the reuse pattern have a "convenient" relationship withrespect to the hierarchy of cell sizes. One promising pattern is shown in the figure 6-3. Thecells labelled "A" reuse the frequency used in the center of the circle. The larger circlerepresents the LOS range of the highest aircraft deemed to be in that cell. An aircraft at thepoint labelled "B" is within LOS of the central cell but is well over-the-horizon with respectto all other cells using the "A" frequency.
6-6
0 38
A Al
ApAja is M 31L6-7
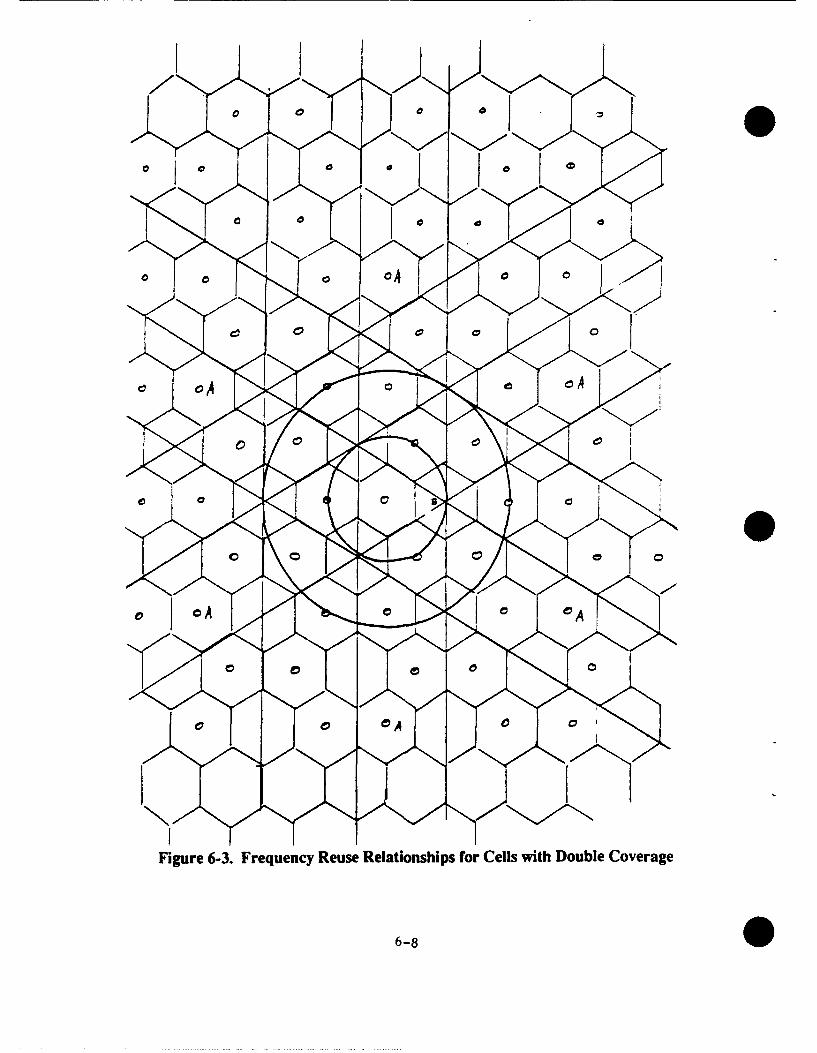
Figure 6-3. Frequency Reuse Relationships for Cells with Double Coverage
6-8
pThat is the main principle one tries to use to control S/I. The interference levels at point
B, based on range alone (using I/R 2 propagation), would be intolerable. Later (see section 7)using propagation models it was verified that the over-the-horizon propagation losses aregreat enough. If the frequency reuse pattern shown in the figure 6-3 works, then only eightfrequencies are needed for each level. Thus, there are at most 24 service frequencies whichneed to be scanned.
The work done to quantify the propagation losses and to relate those losses to theresulting S/I levels led to the realization that at least eight frequencies are needed at eachlevel, or at least 24 service frequencies need to be scanned. Additional frequencies may beneeded because of terrain conditions that prevail in a given region (see section 7). Thepropagation modeling results can also be related to requirements on the performance of themodulation technique chosen for voice and data communications.
6
*6-9
SECTION 7
CTAG FREQUENCY REUSE
7.0 INTRODUCTION
This section confirms the need for eight frequencies at each of the three cellular layersof section 6. This analysis is due to W. J. Wilson [201 with computational support andguidance from C. C. Li and R. I. Millar, respectively.7.1 BACKGROUND
The purpose of this exercise is to determine the most efficient frequency reuse patternfor CTAG. Recall that one of the basic principles of cellular communications is frequencyreuse. The most efficient system is the one which allows a given frequency to be reused themost times within a given geographical area. This criterion is equivalent to the criterion ofreusing a frequency within the shortest possible distance. High frequency reuse helps thecellular approach in two ways. First, high efficiency means that a small number offrequencies can be used as service frequencies, which simplifies and speeds up the cell hand-over problem. Second, high reuse means that more of the limited number of availablefrequencies can be assigned to each cell, thus increasing overall system capacity.
Technically, the reuse problem consists of determining the minimum distance betweentransmitters such that a receiver is close enough to one and far enough from all the others sothat the signal-to-interference (S/I) ratio is high enough to allow adequate communicaticnsperformance. In some ways the air-ground (A-G) problem encountered by CTAG is easierthan ground-ground (G-G) problem faced by cellular mobile radio. In the mobile case, alllinks are assumed to be over-the-horizon (OTH) and separations are based on r-4 (r - range)propagation models. The airborne situation can be arranged so that the desired link is alwaysline-of-sight (LOS) while the interferers are OTH.
This approach may at first seem simple. One needs only to find the horizon distancefor a given cell, and ensure that the cell's frequency is reused just beyond that distance.However, the situation is not so clear cut. The situation on the boundary between LOS andOTH is really rather blurry due to diffraction, refraction, and scattering effects. Also, thelocations of the boundary varies due to the local relief of the earth (i.e, it is not as smooth asa billiard ball). Thus, receivers which are just above and just below the radio horizon withrespect to a transmitter may receiver signals of similar strength. Therefore, one must allowfor a margin of error. Luckily, there are a number of models which can be used to estimatehow large the margin must be.
7.2 CELL STRUCTURE
Before proceeding much further the proposed cell structure is reviewed. The cellsconsist of a nested set of three sizes of equilateral triangles. The smallest set serves users at
7-1
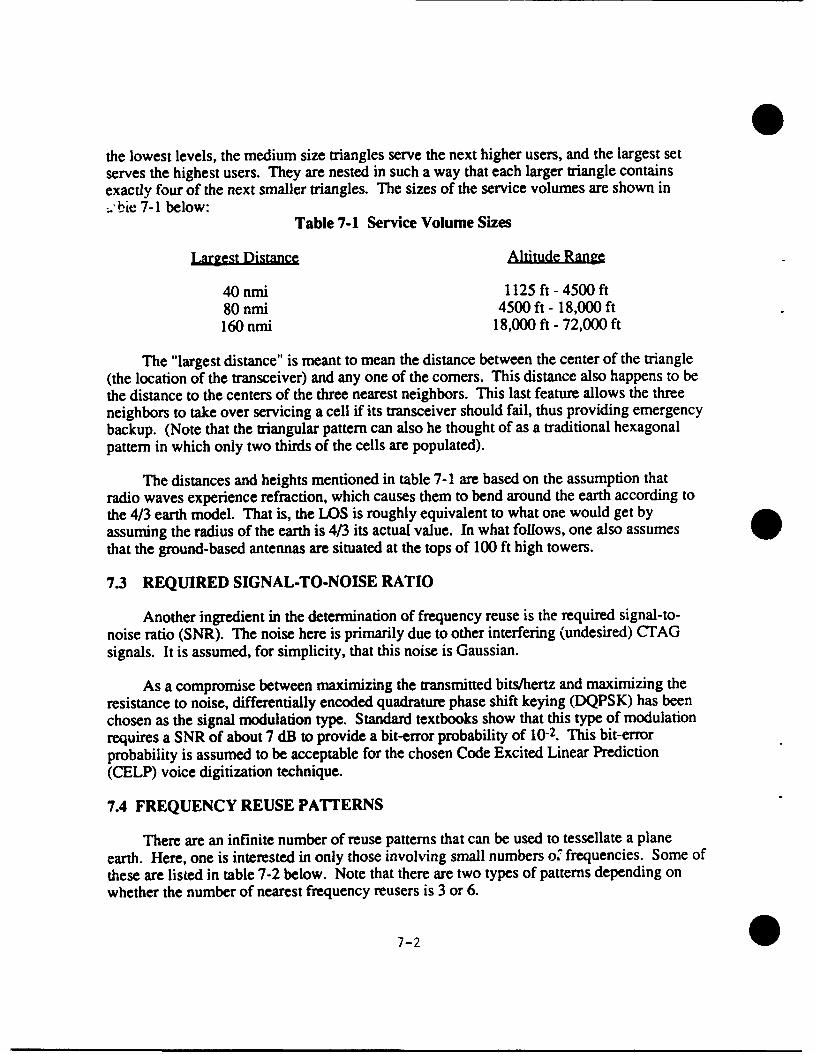
the lowest levels, the medium size triangles serve the next higher users, and the largest setserves the highest users. They are nested in such a way that each larger triangle containsexactly four of the next smaller triangles. The sizes of the service volumes are shown in"bie 7-1 below:
Table 7-1 Service Volume Sizes
Largst Distance Altitude..ang
40 nmi 1125 ft - 4500 ft80 nmi 4500 ft - 18,000 ft160 nmi 18,000 ft - 72,000 ft
The "largest distance" is meant to mean the distance between the center of the triangle(the location of the transceiver) and any one of the comers. This distance also happens to bethe distance to the centers of the three nearest neighbors. This last feature allows the threeneighbors to take over servicing a cell if its transceiver should fail, thus providing emergencybackup. (Note that the triangular pattern can also he thought of as a traditional hexagonalpattern in which only two thirds of the cells are populated).
The distances and heights mentioned in table 7-1 are based on the assumption thatradio waves experience refraction, which causes them to bend around the earth according tothe 4/3 earth model. That is, the LOS is roughly equivalent to what one would get byassuming the radius of the earth is 4/3 its actual value. In what follows, one also assumesthat the ground-based antennas are situated at the tops of 100 ft high towers.
7.3 REQUIRED SIGNAL-TO-NOISE RATIO
Another ingredient in the determination of frequency reuse is the required signal-to-noise ratio (SNR). The noise here is primarily due to other interfering (undesired) CTAGsignals. It is assumed, for simplicity, that this noise is Gaussian.
As a compromise between maximizing the transmitted bits/hertz and maximizing theresistance to noise, differentially encoded quadrature phase shift keying (DQPSK) has beenchosen as the signal modulation type. Standard textbooks show that this type of modulationrequires a SNR of about 7 dB to provide a bit-error probability of 10-2. This bit-errorprobability is assumed to be acceptable for the chosen Code Excited Linear Prediction(CELP) voice digitization technique.
7.4 FREQUENCY REUSE PATTERNS
There are an infinite number of reuse patterns that can be used to tessellate a planeearth. Here, one is interested in only those involving small numbers o. frequencies. Some ofthese are listed in table 7-2 below. Note that there are two types of patterns depending onwhether the number of nearest frequency reusers is 3 or 6.
7-2 0
S
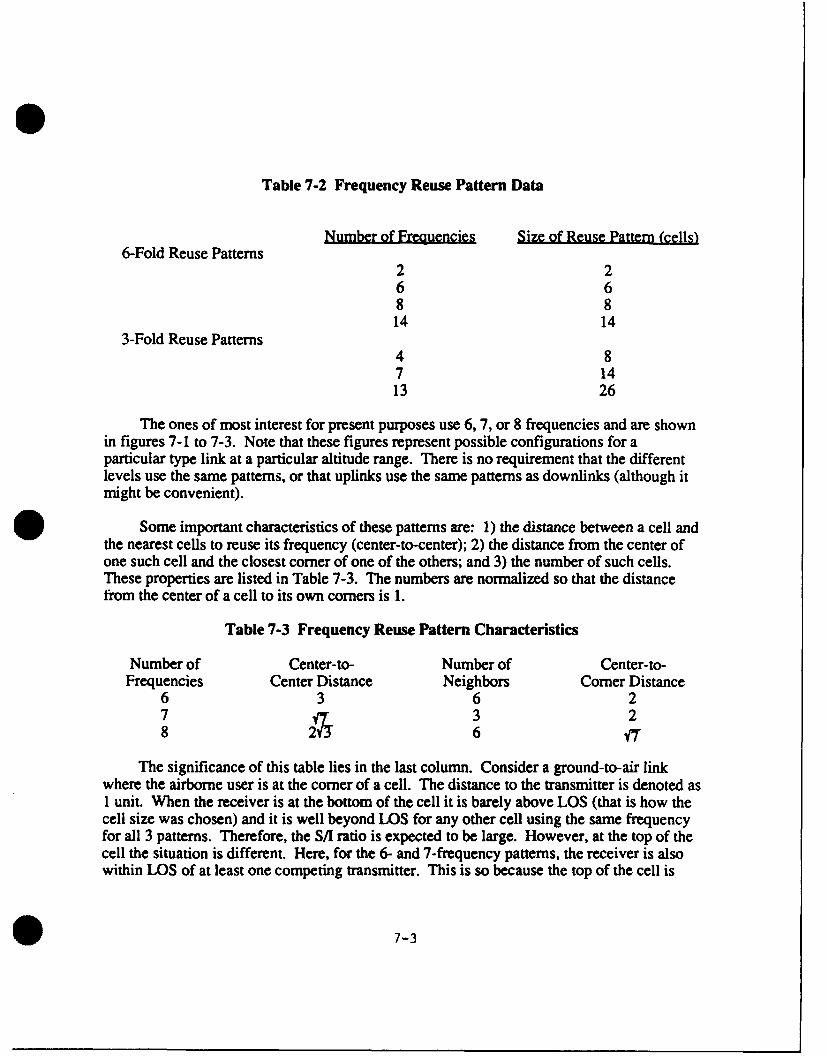
Table 7-2 Frequency Reuse Pattern Data
Number of Frequencies Size of Reuse Pattern (cells)6-Fold Reuse Patterns
2 26 68 814 14
3-Fold Reuse Patterns4 87 1413 26
The ones of most interest for present purposes use 6, 7, or 8 frequencies and are shownin figures 7-1 to 7-3. Note that these figures represent possible configurations for aparticular type link at a particular altitude range. There is no requirement that the differentlevels use the same patterns, or that uplinks use the same patterns as downlinks (although itmight be convenient).
* Some important characteristics of these patterns are: 1) the distance between a cell andthe nearest cells to reuse its frequency (center-to-center); 2) the distance from the center ofone such cell and the closest corner of one of the others; and 3) the number of such cells.These properties are listed in Table 7-3. The numbers are normalized so that the distancefrom the center of a cell to its own corners is 1.
Table 7-3 Frequency Reuse Pattern Characteristics
Number of Center-to- Number of Center-to-Frequencies Center Distance Neighbors Corner Distance
6 3 6 27 3 28 2%'" 6 17
The significance of this table lies in the last column. Consider a ground-to-air linkwhere the airborne user is at the corner of a cell. The distance to the transmitter is denoted as1 unit. When the receiver is at the bottom of the cell it is barely above LOS (that is how thecell size was chosen) and it is well beyond LOS for any other cell using the same frequencyfor all 3 patterns. Therefore, the S/I ratio is expected to be large. However, at the top of thecell the situation is different. Here, for the 6- and 7-frequency patterns, the receiver is alsowithin LOS of at least one competing transmitter. This is so because the top of the cell is
* 7-3
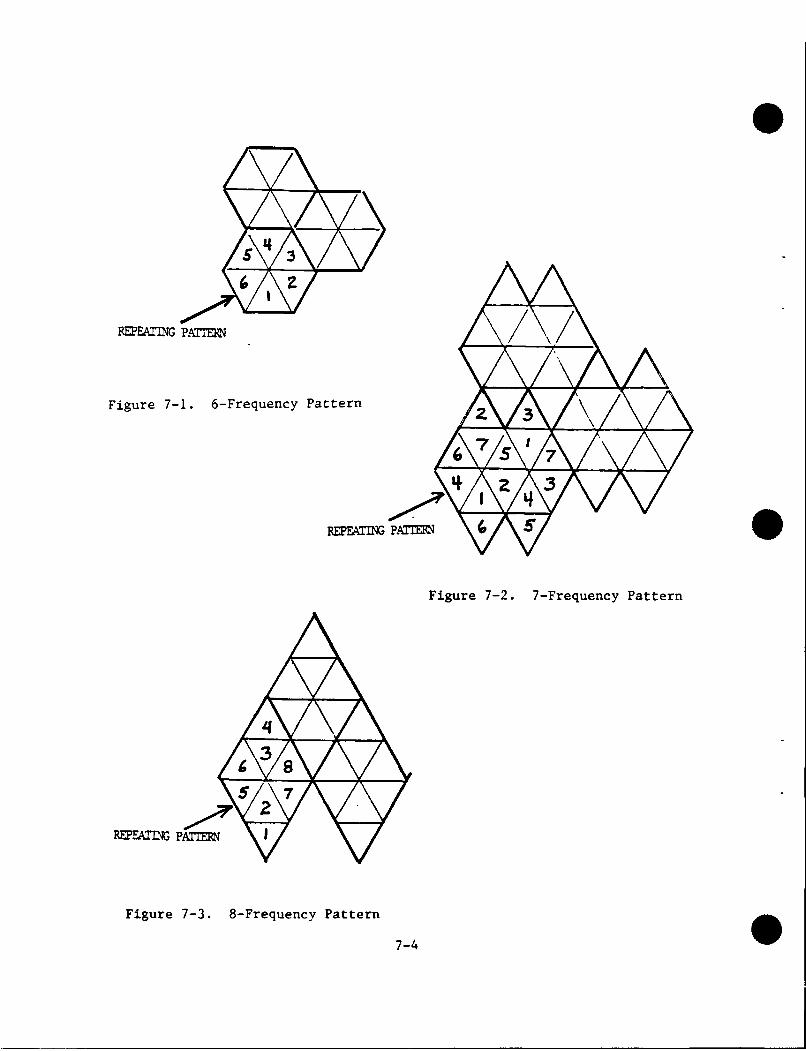
Figure 7-1. 6-Frequency Pattern
Figure 7-2. 7-Frequency Pattern
Figure 7-3. 8-Frequency Pattern7-
17-
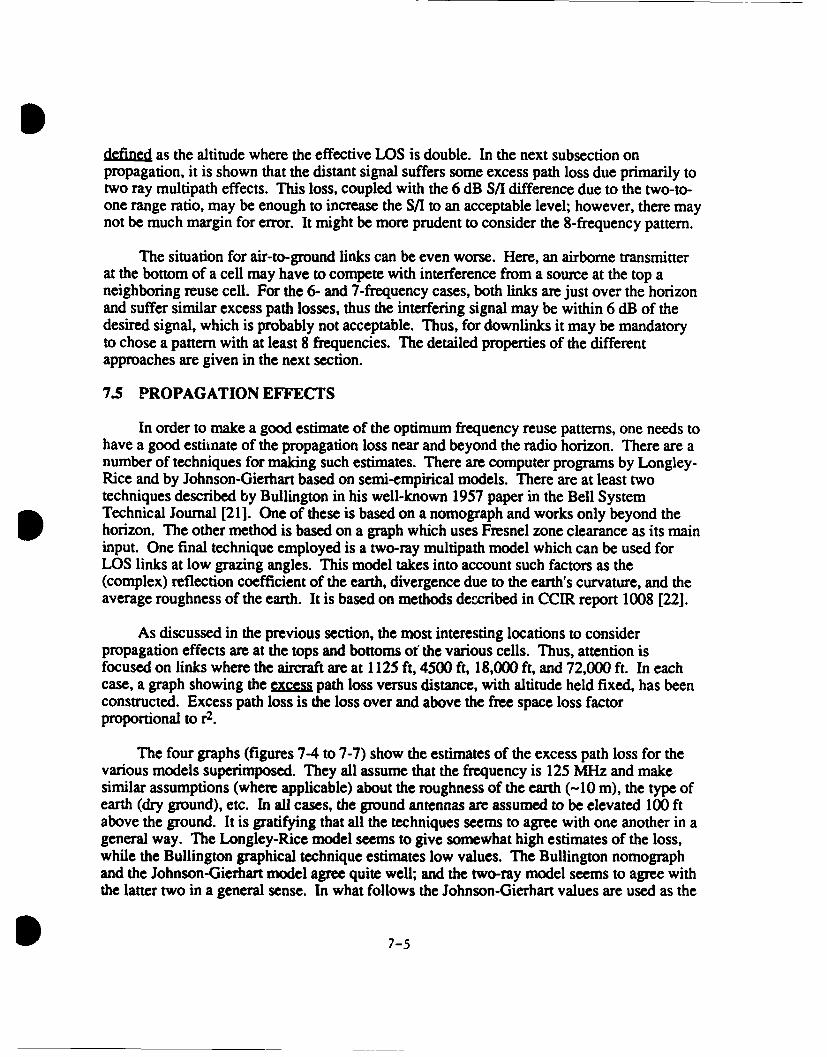
Sdefined as the altitude where the effective LOS is double. In the next subsection onpropagation, it is shown that the distant signal suffers some excess path loss due primarily totwo ray multipath effects. This loss, coupled with the 6 dB S/I difference due to the two-to-one range ratio, may be enough to increase the S/I to an acceptable level; however, there maynot be much margin for error. It might be more prudent to consider the 8-frequency pattern.
The situation for air-to-ground links can be even worse. Here, an airborne transmitterat the bottom of a cell may have to compete with interference from a source at the top aneighboring reuse cell. For the 6- and 7-frequency cases, both links are just over the horizonand suffer similar excess path losses, thus the interfering signal may be within 6 dB of thedesired signal, which is probably not acceptable. Thus, for downlinks it may be mandatoryto chose a pattern with at least 8 frequencies. The detailed properties of the differentapproaches are given in the next section.
7.5 PROPAGATION EFFECTS
In order to make a good estimate of the optimum frequency reuse patterns, one needs tohave a good estimate of the propagation loss near and beyond the radio horizon. There are anumber of techniques for making such estimates. There are computer programs by Longley-Rice and by Johnson-Gierhart based on semi-empirical models. There are at least twotechniques described by Bullington in his well-known 1957 paper in the Bell SystemTechnical Journal [21]. One of these is based on a nomograph and works only beyond thehorizon. The other method is based on a graph which uses Fresnel zone clearance as its maininput. One final technique employed is a two-ray multipath model which can be used forLOS links at low grazing angles. This model takes into account such factors as the(complex) reflection coefficient of the earth, divergence due to the earth's curvature, and theaverage roughness of the earth. It is based on methods described in CCIR report 1008 [22].
As discussed in the previous section, the most interesting locations to considerpropagation effects are at the tops and bottoms of the various cells. Thus, attention isfocused on links where the aircraft are at 1125 ft, 4500 ft, 18,000 ft, and 72,000 ft. In eachcase, a graph showing the excess path loss versus distance, with altitude held fixed, has beenconstructed. Excess path loss is the loss over and above the free space loss factorproportional to r2.
The four graphs (figures 7-4 to 7-7) show the estimates of the excess path loss for thevarious models superimposed. They all assume that the frequency is 125 MHz and makesimilar assumptions (where applicable) about the roughness of the earth (-10 m), the type ofearth (dry ground), etc. In all cases, the ground antennas are assumed to be elevated 100 ftabove the ground. It is gratifying that all the techniques seems to agree with one another in ageneral way. The Longley-Rice model seems to give somewhat high estimates of the loss,while the Bullington graphical technique estimates low values. The Bullington nomographand the Johnson-Gierhart model agree quite well; and the two-ray model seems to agree withthe latter two in a general sense. In what follows the Johnson-Gierhart values are used as the
5 7-5
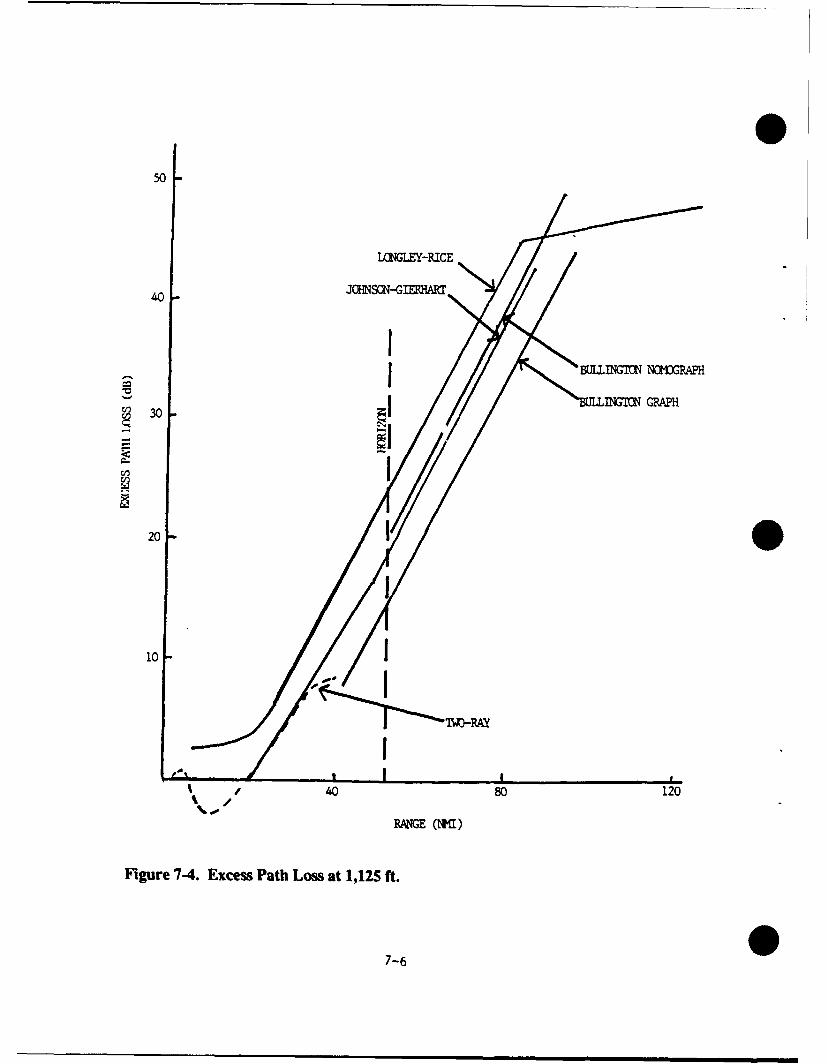
50
40
30 , 3
20
10
/40 80 120
RANIGE (M)
Figure 7-4. Excess Path Loss at 1,125 ft.
7-6
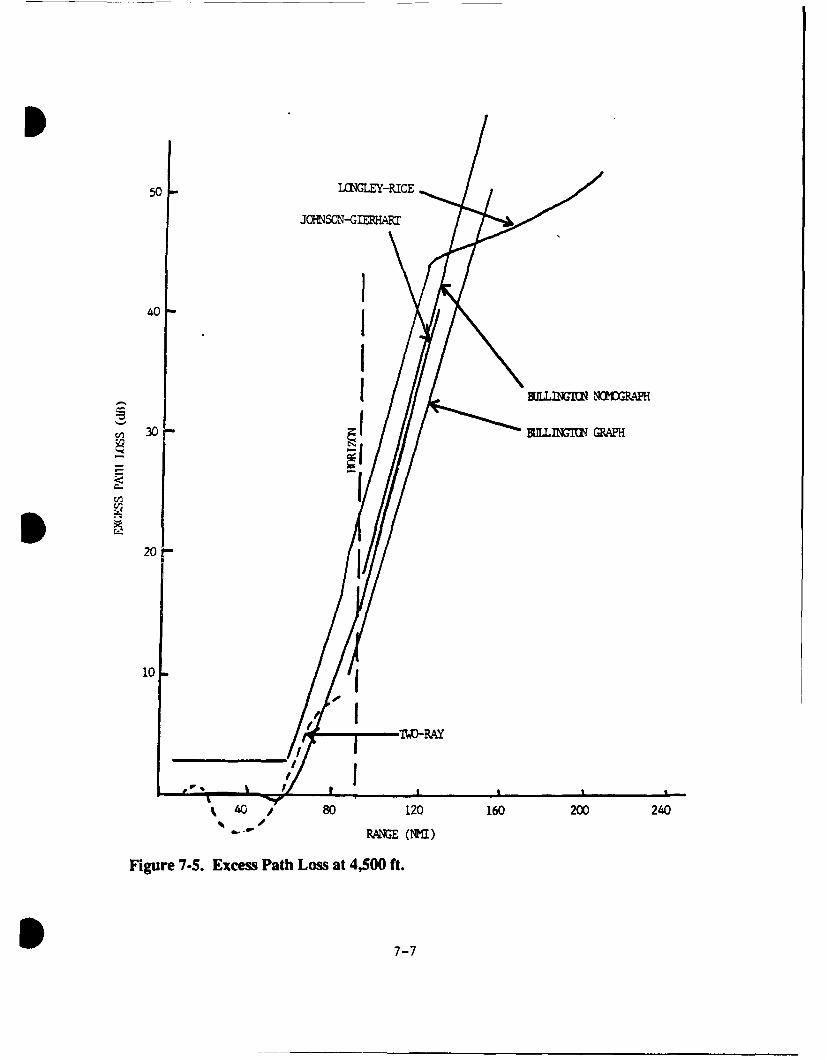
50 NLYRC
40
BUL MMCRI30 UTGRP
C-
20
10
TWORA
40 p 80 120 160 200 240
RAZE (Na)
Figure 7-5. Excess Path Loss at 4,500 ft.
7-7
50
BLLECM~t NOMOGRAPH
40 BMUbM GM
JOHNSL!N-EMHA~ I', 30
20
10
Figure 7-6. Excess Path Loss at 18,000 ft.
7-8
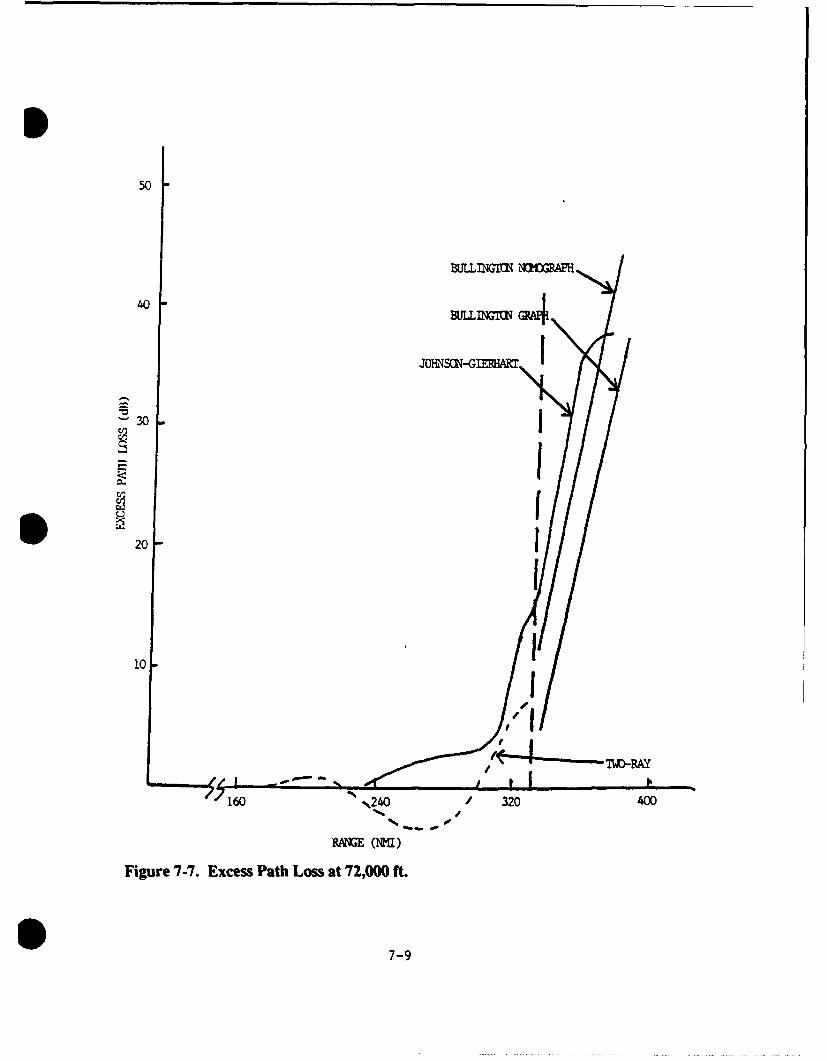
S
50
BULLNGTO bMICPAFP
40 BLM0 1
230
20
10
/ 1W3-RAY/S; -- " .", ,
160 N240 / 320 400
Figure 7-7. Excess Path Loss at 72,000 ft.
7-9
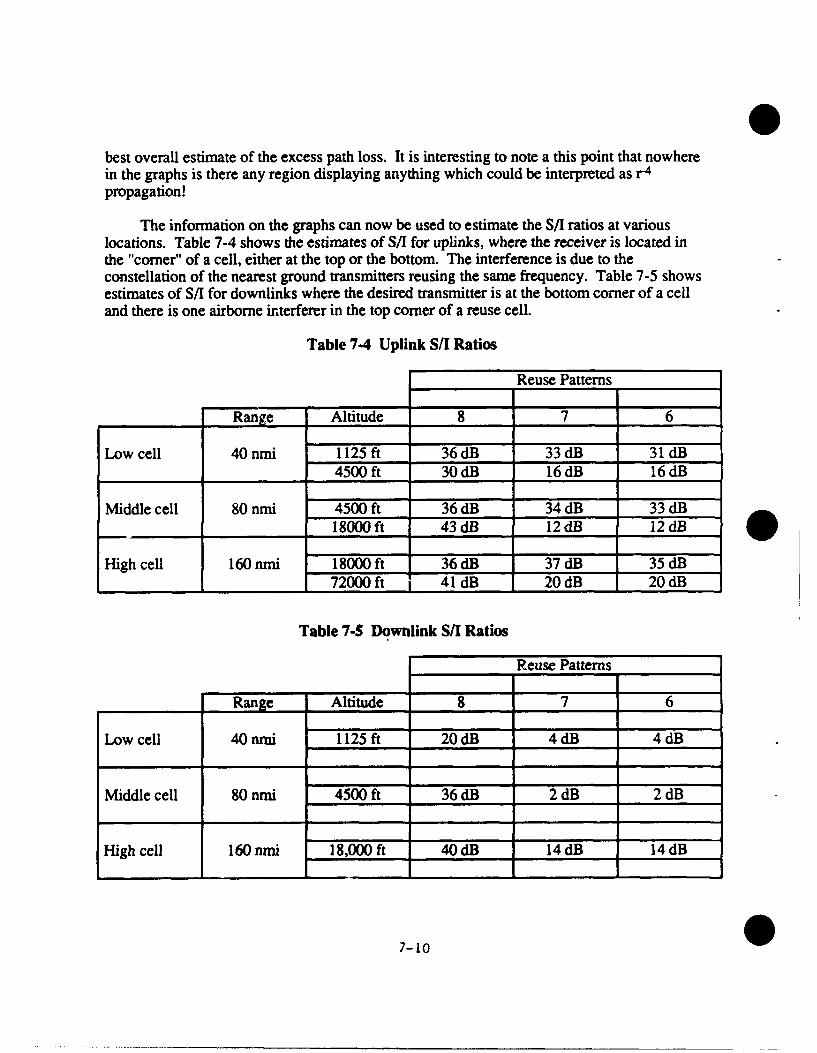
best overall estimate of the excess path loss. It is interesting to note a this point that nowherein the graphs is there any region displaying anything which could be interpreted as r-4
propagation!
The information on the graphs can now be used to estimate the S/I ratios at variouslocations. Table 7-4 shows the estimates of S/I for uplinks, where the receiver is located inthe "comer" of a cell, either at the top or the bottom. The interference is due to theconstellation of the nearest ground transmitters reusing the same frequency. Table 7-5 showsestimates of S/I for downlinks where the desired transmitter is at the bottom corner of a celland there is one airborne interferer in the top corner of a reuse cell.
Table 7.4 Uplink S/I Ratios
Reuse Patterns
Rang e Altitude 8 7 6
Low cell 40 nmi 1125 ft 36 dB 33 dB 31 dB4500 ft 30 dB 16 dB 16 dB
Middle cell 80 nmi 4500 ft 36 dB 34 dB 33 dB18000 ft 43 dB 12 dB 12 dB
High cell 160 nmi 18000 ft 36 dB 37 dB 35 dB72000 ft 41 dB 20 dB 20 dB
Table 7.5 Downlink S/I Ratios
Reuse Patterns
Range Altitude 8 7 6
Low cell 40 nmi 1125 ft 20 dB 4 dB 4 dB
Middle cell 80 nmi 4500 ft 36 dB 2 dB 2 dB
High cell 160 ni 18,000 ft 40 dB 14 dB 14 dB
7-10
One sees from these tables that the S/I ratios provided by the 8-frequency patterns areall very high with respect to the 7 dB required. On the other hand, the ratios provided by the6- and 7-frequency patterns are in some cases deficient. This is particularly true in the caseof the downlinks. Even for the uplinks the ratios can be as little as 12 dB or 16 dB at the topof the lower levels. While these ratios may seem high compared to the required 7 dB, theydo not provide much margin for the effects of irregular terrain, unusual propagation behavior,etc. Extra margin should also be provided to allow for the fact that in the real world antennascannot always be placed at the centers of a grid of perfect triangles. The slopes of the excessloss curves are quite steep and, as a result, losses can change by up to 5 dB due to a 10 nmichange in airborne position. A prudent person would probably chose the 8-frequencypatterns for both uplinks and downlinks at all three levels.
7.6 FREQUENCY MANAGEMENT
Having decided that the 8-frequency reuse patterns are to be used, one now investigateswhether or not one can allocate frequencies for use by CTAG in an environment wherefrequency usage has to be shared with other users (i.e., the old AM radios). As a minimum,four frequencies per cell must be provided, one each for up and down service links and for upand down voice links.
There must be 24 frequencies which are unique to CTAG for the 8 service channeluplinks at each of the three levels. These must be available so that airborne users canmonitor the quality of the links at each frequency anywhere within the system withoutinterference from other users.
One technique for allocating frequencies is the following. Assume that there are 720frequencies available; the exact number is not important. Divide these frequencies among thecells so that each of the 24 cell types has 30 frequencies associated with it. One of thesefrequencies must be one of the 24 CTAG-unique frequencies. The other 29 can be chosen bysome criterion such as good IMP properties, etc. If there were no other users of thefrequency band, all 29 frequencies could be used by CTAG. Due to use by AM radios, manyof the 29 possibilities in each cell will not be available in a particular geographic region. Allthat is required for a minimum CTAG network, however, is that in every cell at least 3 out ofthe 29 are available. One of these three will be assigned as the service downlink frequency,the other two will be assigned to the voice channels. To determine whether this is possiblewould require a survey of current frequency assignments.
If a CTAG network operated in this way, each cell would have to broadcast, in itsservice channel uplink, the identity of the frequencies of service channel downlink. (Thereare plenty of bits in the uplink message to do this.) In other words, the service up anddownlink frequencies would not be paired in any unique way. When, and if, AM radio usageis reduced so that fewer AM allocations are required, they can be shifted over to usage by theCTAG voice channels.
As a final note, we point out that it might be beneficial to set aside some extrafrequencies for service uplinks beyond the 24 already mentioned. A total of 30 might be agood number. The extra frequencies could be used to fill in coverage in difficult areas whereterrain or siting problems cause gaps.
7-11
7.7 SUMMARY
In this note it has been shown that it may be possible to implement a CTAG networkbased on frequency reuse patterns using 8 service frequencies at each of 3 levels. Themethod requires only 24 (or maybe 30 to be txtra prudent) unique CTAG-only frequencies.There is considerable latitude in distributing the remaining frequencies to cells. Thecalculations were based on a perfectly spaced triangular array of antenna sites; however, the8-frequency pattern approach could probably tolerate antenna replacement errors in the 5 to10 nmi range without much (if any) degradation in performance.
7-12
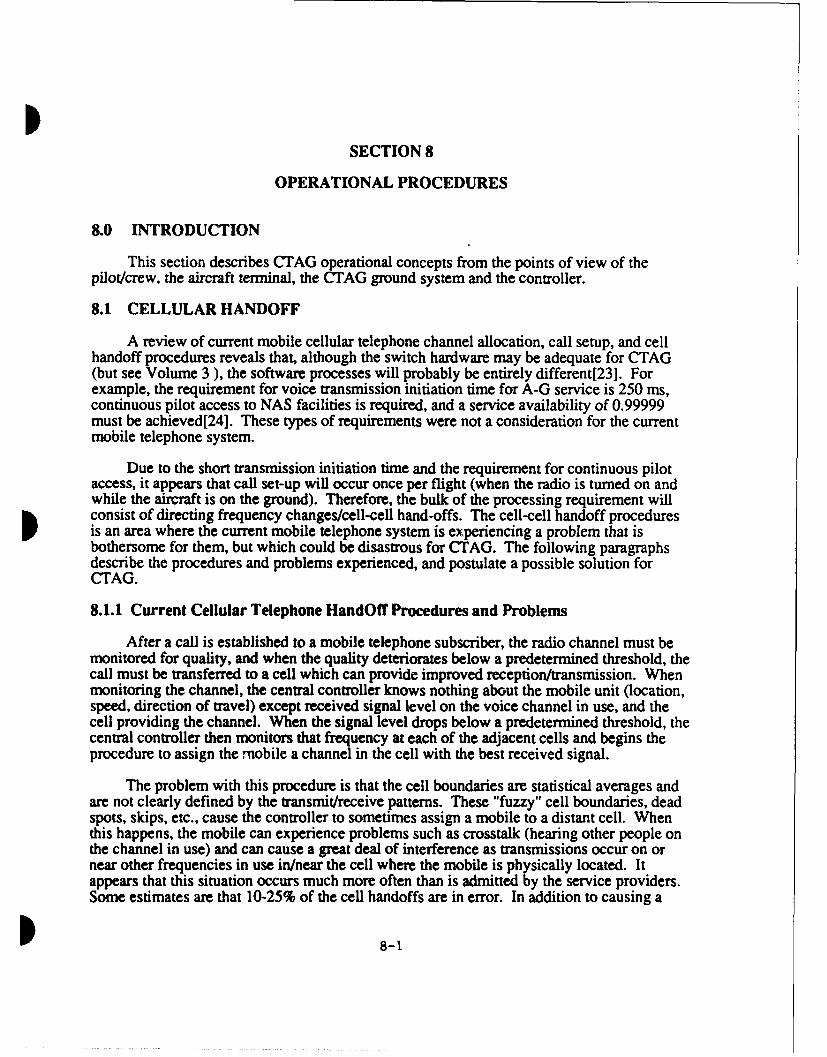
ISECTION 8
OPERATIONAL PROCEDURES
8.0 INTRODUCTION
This section describes CTAG operational concepts from the points of view of thepilot/crew, the aircraft terminal, the CTAG ground system and the controller.
8.1 CELLULAR HANDOFF
A review of current mobile cellular telephone channel allocation, call setup, and cellhandoff procedures reveals that, although the switch hardware may be adequate for CTAG(but see Volume 3 ), the software processes will probably be entirely different[231. Forexample, the requirement for voice transmission initiation time for A-G service is 250 ms,continuous pilot access to NAS facilities is required, and a service availability of 0.99999must be achieved[24]. These types of requirements were not a consideration for the currentmobile telephone system.
Due to the short transmission initiation time and the requirement for continuous pilotaccess, it appears that call set-up will occur once per flight (when the radio is turned on andwhile the aircraft is on the ground). Therefore, the bulk of the processing requirement willconsist of directing frequency changes/cell-cell hand-offs. The cell-cell handoff proceduresis an area where the current mobile telephone system is experiencing a problem that isbothersome for them, but which could be disastrous for CTAG. The following paragraphsdescribe the procedures and problems experienced, and postulate a possible solution forCTAG.
8.1.1 Current Cellular Telephone HandOff Procedures and Problems
After a call is established to a mobile telephone subscriber, the radio channel must bemonitored for quality, and when the quality deteriorates below a predetermined threshold, thecall must be transferred to a cell which can provide improved reception/transmission. Whenmonitoring the channel, the central controller knows nothing about the mobile unit (location,speed, direction of travel) except received signal level on the voice channel in use, and thecell providing the channel. When the signal level drops below a predetermined threshold, thecentral controller then monitors that frequency at each of the adjacent cells and begins theprocedure to assign the mobile a channel in the cell with the best received signal.
The problem with this procedure is that the cell boundaries are statistical averages andare not clearly defined by the transmit/receive patterns. These "fuzzy" cell boundaries, deadspots, skips, etc., cause the controller to sometimes assign a mobile to a distant cell. Whenthis happens, the mobile can experience problems such as crosstalk (hearing other people onthe channel in use) and can cause a great deal of interference as transmissions occur on ornear other frequencies in use in/near the cell where the mobile is physically located. Itappears that this situation occurs much more often than is admitted by the service providers.Some estimates are that 10-25% of the cell handoffs are in error. In addition to causing a
8-1
great deal of interference, these errors may also add a considerable processing burden to thecentral processor. Even though the actual cell switching action is very quick, several secondsof monitoring and processing may have occurred prior to the actual switch action. In mostinstances where a cell handoff error occurs, another handoff (hopefully to the "right" cell)will be required. Note that it is theoretically possible for a mobile traveling a fuzzy cellmargin between two transmitters to experience repeated handoffs between the two (measureddata for this effect has not yet been discovered). Proposals to cure this problem haveprimarily consisted of trying to determine the physical location of the mobile with respect tothe cells. The use of ranging information as well as signal strength for handoff decisions hasbeen considered, but as far as is known, has not been implemented.
8.1.2 CTAG Cell-Cell HandOff Concepts
It is apparent that CTAG cannot experience errors during cell hand-offs comparable tothose of the cellular telephone system. For exam.e, if a high flying aircraft were to beerroneously assigned to a low altitude cell, the aircraft could possibly "see" several other lowaltitude cells where the assigned frequency could be reused. Obviously, transmissions fromthe aircraft could cause considerable interference, which, in turn, could compromise flightsafety.
Any solution postulated for solving the CTAG cell-cell handoff problem, must ensurethat the correct decision is always made when assigning a new cell and frequency/channel.Note that there may be more than one "correct" decision. A "correct" decision is one thatcontinues to provide acceptable quality communications for the aircraft and does not causeunacceptable interference with other mobiles or cells -- "acceptable quality" and"unacceptable interference" will be defined later.
The postulated solution to always ensuring a correct decision is based on four majorassumptions: 1) dedicated service channels will be assigned to each cell and will always betransmitting; 2) the aircraft radio will periodically scan the service channels and will becapable of rank ordering the received signal based on quality (parameters to be determined);3) the CTAG Ground Master Switch (CGMS) (see Volume 3) will be provided aircraftlocation and altitude from ATC ground facilities; and 4) the cell site providing service to theaircraft will monitor the assigned voice channel and report degradation to the CGMS. Withinput of all these parameters, it appears that technically the CGMS could make the correctdecision all the time. However, the control algorithms should allow the decision to be madebased on inputs from the aircraft and cell site only (since a separate communications path,which could be interrupted, would be used to obtain the location data). Depending on signalparameters monitored and reported by the aircraft radio, it appears that the correct decisioncould be made most of the time. However, reporting aircraft location to the CGMS mayprovide other benefits such as allowing the CGMS to predict the next cell K-,nd-off locationwhich could lead to much shorter decision/set-up time.
It is obvious that this area will require considerable attention during the establishmentof an architecture and design for the CTAG system. Further thoughts on the ground systemdata flow are provided in [25]. It appears that modeling/simulation of the communicationsnetwork would be very helpful.
8-2
8.2 HOW DOES CTAG WORK?
This subsection responds to the question "How does CTAG work?"[26] by steppingthrough both the human interactions and the automatic information flow necessary forentering the system, cell handoff and controller handoff. The essential ideas presented in thefollowing figures, figures 8-1, 8-2, and 8-3 should be attributed to W. J. Wilson and J. L.Ramsey.
8.3 MESSAGE TRAFFIC REQUIREMENTS FOR ROUTINE CELLULARHANDOFF IN CTAG
This subsection addresses the messages that must be exchanged between variouscomponents of the proposed CTAG system during a routine cellular handoff [27]. By"routine" one means that the aircraft or "user" and its associated controller are alreadyparticipants in the system. Before the handoff they are connected to each other via threeelements: a cell and a ground switch associated with that cell which in turn will called the"old cell" and "old switch", respectively, and a second, not necessarily distinct ground switchcalled the "controller's switch." The old switch serves two functions: 1) it controls andmonitors the activity and parametric assignments of the cell(s) it serves; and 2) it transfersdata passing through its constituent cell(s) to other relevant switches. The controller's switchtransfers data going to or coming from the controller to other relevant switches. The switchesin the CTAG system are mutually interconnected through a ground-based communicationsnetwork. The cellular handoff procedure maintains connectivity between the same aircraftand controller, but via a different cell which will be called the "new cell", and a switch calledthe "new switch". The new switch may or may not be distinct from the old switch and/or thecontroller's switch.
The path through the cell and the switches that connect an aircraft with its controller iscalled a "voice/data circuit", or, more simply, a "circuit". In addition to the cell, old switch,and controller's switch, a circuit is also defined in terms of several cellular parameters. Twoof these cellular parameters are: 1) a frequency-pair assignment chosen from the set offrequency pairs allocated to the cell; and 2) a particular specification of the20 ms time slots used for uplink and downlink transmissions, chosen from the set of fivepossibilities available for periodic access times of 100 ms. (See section 9 for details of aTDMA design example alluded to here.) The frequency-pair/time slot assignment is calledthe "cellular channel" associated with the circuit. Finally, each circuit is given a "local ID"number ranging from 1 to 16 that is unique to each aircraft using the same cellular channel.A controller can thus access as many as 16 aircraft through the same cellular channel. Ifmore than 16 aircraft were to be connected to a given controller using the same cell, a secondcellular channel assignment would be required. The CTAG architecture allows a controllerto access all the aircraft under his jurisdiction via several cells concurrently: in fact,interoperability with the current ATC system requires the controller to be able tocommunicate with both cellular-equipped and current, non-equipped (VHF analog voice)users at the same time in a manner that is transparent to current users of the system.
S8-3
Entering the SystemAT AIR TRAFFIC
IN THE AIRCRAFT - THE PILOT THE TERMINAL CTAG SYSTEM CONTROL CENTER -THE CONTROLLER
1. Turns on the terminal
2. Enters Initializing Info such as
Flight Phase: TerminalTRACON [Enroute [
Flight ID #:(alpha/numeric)
Aircraft IDo: 3. Scans all cells and chooses"best" cell.
Present Controller "bstcll
4. Transmits entered data ondownlink service channel. S. Starts to set up a voice
channel on entered cell.Connects cell to controller,if not already connected.Transmits voice channeland local IDS assignment
6. Makes round-trip ranging on uplink service channal.
adjustment.
7. Entes voice channel.Acknowledges voice ,channel assignment by
responding on M/E portionof assigned voice channel, B. Receives aircraft response
and sends data informingcontroller of new entrant.New entrant ID E displayedat control center. 9. Acknowledges receipt
of new entrant.
10. Receives acknowledge-menL
11. Informs aircraft on WE*portion of uplink voice
12. Receives confirmation chann that connection tothat voice channel has controller Is completebeen establshed.
13. Is given an Indication suchas voice channel connectionIndicator light or a canned
message that voice channelhas been established.
*Malntnance/Emergency
Figure 8-1. Entering the System
8-4
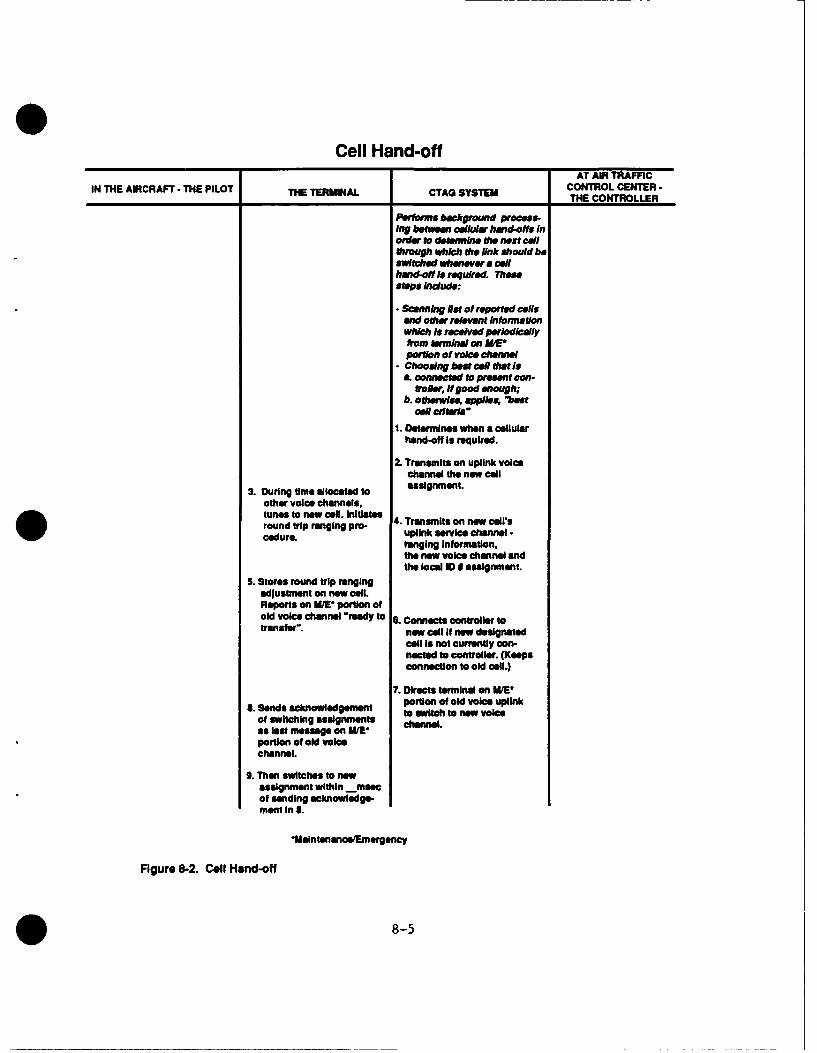
Cell Hand-offAT AIR TRAFFIC
INTEAIRCRAFT - THE PILOT TH EMNLCA YTMCONTROL CENTER -IN TE ~TERINALCTA SYTEMTHE CONTROLLER
Plorfonne background process-Ing b~hWe celkiwa hand-offs Inorder to deemine the next callthrough which Me. Unk should beswitched whenever a ceoghad-off Is required. Themestops Include.
*Scanning list of reported cellsand other relevant informationwhich is received periodical lyfrom, terminal on MIEportion of voice channel
-Choosing best cell that Isaconnected to present con-frollr; Ifgood enough;
b. otherwise, applies, "bestaml cultrls"
1. Oelonfmlnes when aicellularhand-off Is required.
2. Transmits on uplink voicechannel the new cell
3. During time allocated to assignment.other voice channels,tun"s to new cell. Initiates 4. Trarisits on now ceillsround trip ranging pr- upik cnelcedure.upiksrochne
5. Stores round trip rangingadjustment on new cell.Reports on M/E* portion ofold voice channel "ready to 6. Connects controller totransfer". new cell It new designated
cell Is not currently con-nected to controller. (Keepsconnection to old cell.)
7. Directs tarminad on M/E1*. Sd5 ck~Oded.~t portion of old voice uplinkS. Snds cknoledgment to ewitch to new voiceof switching assignments chane.
as last mesmge on MIE*portion of old voicechannel.
g. Then switches to newassignment within _msecof sending acknowledge-ment In S.
*Maintenance/Emorgency
Figure 8-2. Cell Hand-off
* 8-5
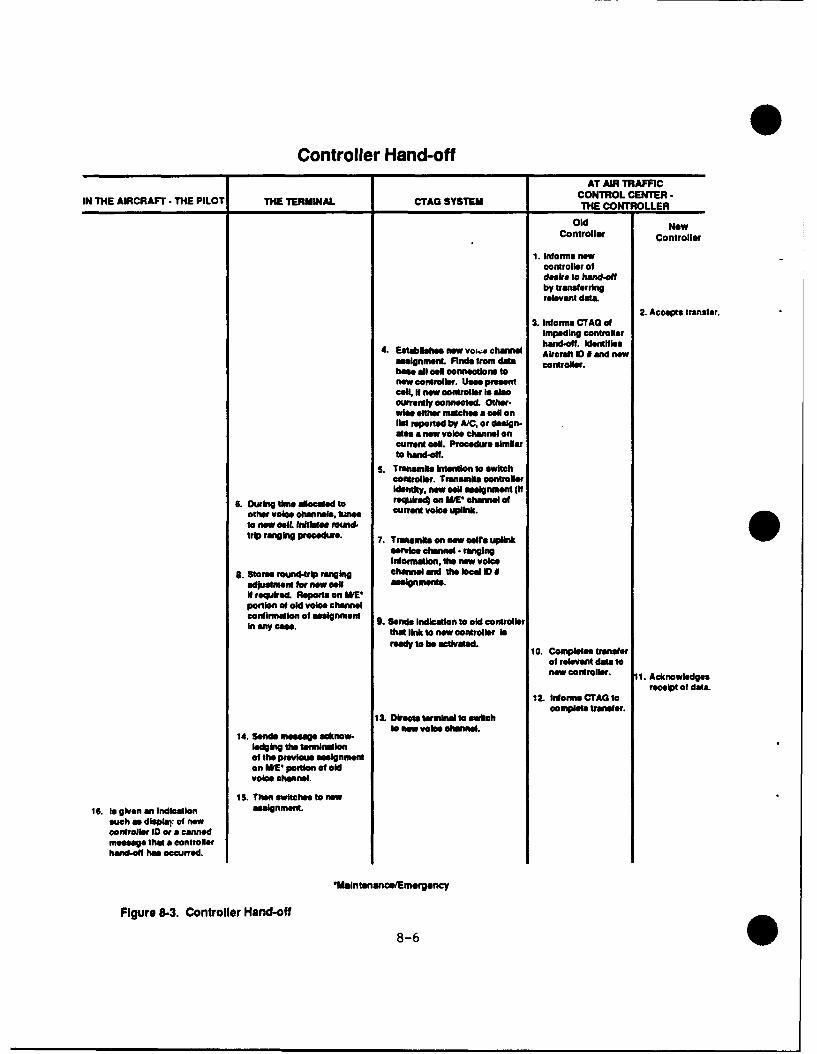
Controller Hand-offAT AIR TRAFFIC
IN THE AIRCRAFT.- THE PILOT THE TERMINAL CTAG SYSTEM TCONTROLLNER
Old NewController Controller
1. Informs newController ofdesir* to hand-offby transferring
2. Accepts transfer.2. Informs CTAG of
Impeding controller4. Esablih" nw vohand-off. Identifies4.~ ~ ~~ 6 Ea~~~e WVAchanne~l Aicraft ID #and new
assignment. Finds fraom data Cotrler.base all coel connectIons tonew controller. uses presentcall, if now controller is alsocurrently connected. other.wife either matches a call onlst reported by A/C, or design.ates a Mow voie channel oncurrent CON. Procedure Similarto hand-off.
s. Transmits Intention to swftchcontroller. Transmits controllerIdentify, MeW cell sealgnmsnt(I
6. During time allocated to roqkulrod on MV1 channel ofother voice channels, tunes current voice uplink.toM near cel Irge rouned.trip ranging procedure. 7. rnmt on noMw ce uplik i
service channel.- rangingInformation, the MeW voice
S. Stores rond ragn channel end the lowa N)adjustmfonir MeW call assignments.If rosired. Reports on W'portion of old voice channelcfInnto ous asin 9n . Sands Indication to old controller
In ay eee.that link to Mow controller isready to be stbvatad. 10. Copees transfer
of relevant data toMow controller. 11. Acknowledges
receipt of data.1L. Informs CTAG to
I& Drecttermnatt, Whcomplete transfer.
14. Sends message acknow- 0nw.if hitl"edIng the term~iton
of the Previous assignmenton WE* portion of oldvoles channel.
IS. Then switches to new16. Is given an Indication assignment.
such as display of Mowcontroller ID or a cannedmessage that a controllerhand-off hes occurred.
*Malntenancs/Emergency
Figure 8-3. Controller Hand-off
8-6
S
There are two principal reasons for making a routine cellular change. The first is thatthere is a hierarchy of cellular networks that correspond to whether the aircraft being servicedare flying at low, medium, or high altitudes. As an aircraft changes altitude, it may becomeappropriate for the CTAG system to reassign the connectivity between the aircraft and itsassociated controller from a cell in one hierarchy to a cell in an adjacent (in altitude)hierarchy. The second reason for making a change is that the aircraft is flying out of theservice region of the old cell or is experiencing poor communications quality due tointerference on his particular cellular channel assignment, and must make a cellular change inorder to maintain reliable communications. For either reason, at this point in the CTAGsystem design it has not yet been determined whether the cellular handoff process shouldordinarily be originated by the aircraft or by the ground switch. In order to minimize theamount of message traffic needed at the time of a cellular handoff, it would probably bepreferable for the ground switch to initiate handoffs whenever possible. Certainly, however,there would be situations (such as an inordinate amount of interference at the aircraft on theold cellular frequency) that would have to be recognized initially by the aircraft. Thecommunication requirements would, of course, depend on whether the aircraft or the switchfirst determined the need for making a cellular transition.
Figure 8-4 shows the steps involved in making a routine cellular handoff. First, arequest for a cellular handoff is initiated by either the aircraft or the old switch. The CTAGsystem then has to prepare a circuit for connecting the aircraft and the same controller insome new cell. The amount of message traffic required for this second step depends onwhether a tentative new cellular assignment has already been determined (probably by the
*old switch) or whether the designation of the new cell is made only after the cellular handoffrequest has been received. Following the definition of a new circuit assignment, the actualprocess of handing over the aircraft from the old cell to the new cell can take place. Thisthird step requires various messages to be exchanged between the aircraft and the old andnew cells as well as messages between the old and new switches if the two switches aredifferent. Finally, the system has to update various relevant data records regarding the newstatus of the system following the transition to the new circuit assignment.
The message traffic requirements associated with a routine cellular handoff can bemore readily estimated by separately considering each box shown in figure 8-4. Many ofthese requirements depend on the specific details of the handoff process for a particulartransition, such as whether it is the aircraft or the old switch than initiates the request for thecellular handoff, whether the aircraft or the switch is responsible for determining which cellshould be the new cell, what information is required to make that determination, how andwhen that information is communicated to the element that designates the new cell, whether atentative new cellular designation has been made prior to the request for a cellular handoff,and so forth. Nevertheless, one can outline some of the message traffic requirements on thebasis of certain reasonable assumptions, and can predict what changes in these requirementswould take place if the assumptions were to be changed.
*8-7
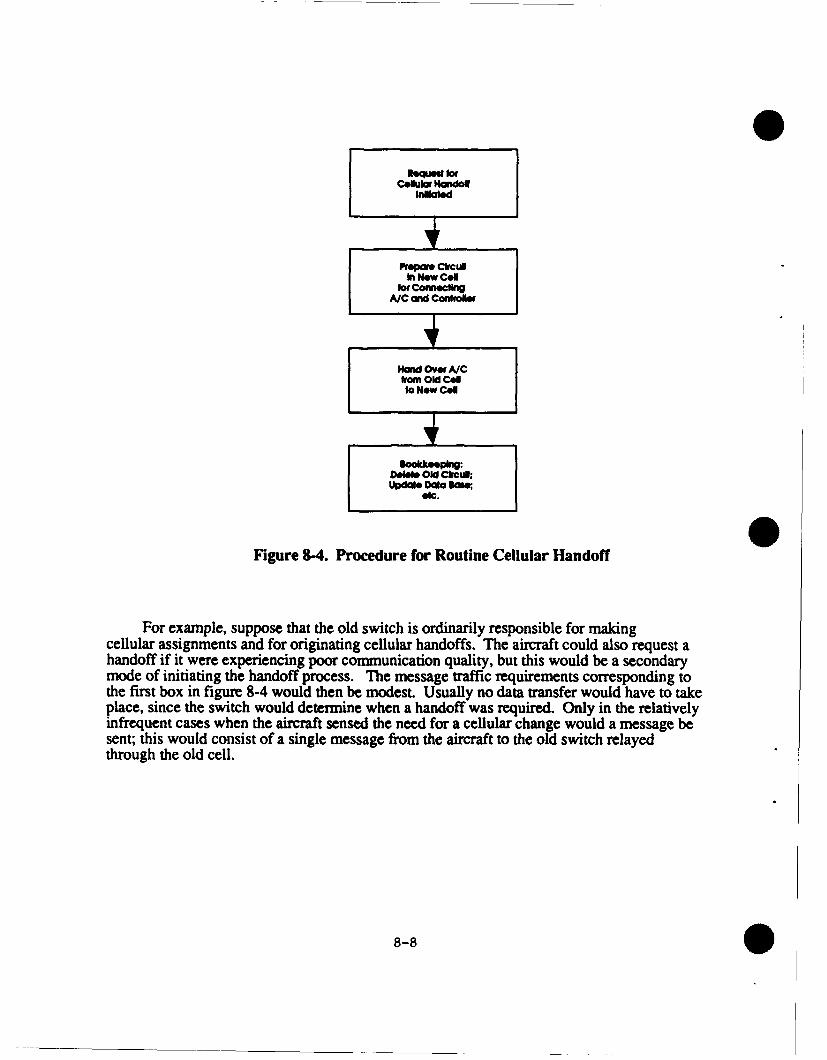
HeaOr A/Cofro1um Ol C
Ingaled
4Prepar CfCUIlIn New Coo
SookmelngA/C and Cordro~or
0.m. Old Codto NowCO
000Ol ClrmulUpdlate Dala lw
0Figure 8-4. Procedure for Routine Cellular Handoff
For example, suppose that the old switch is ordinarily responsible for makingcellular assignments and for originating cellular handoffs. The aircraft could also request ahandoff if it were experiencing poor communication quality, but this would be a secondarymode of initiating the handoff process. The message traffic requirements corresponding tothe first box in figure 8-4 would then be modest. Usually no data transfer would have to takeplace, since the switch would determine when a handoff was required. Only in the relativelyinfrequent cases when the aircraft sensed the need for a cellular change would a message besent; this would consist of a single message from the aircraft to the old switch relayedthrough the old cell.
8-8 0
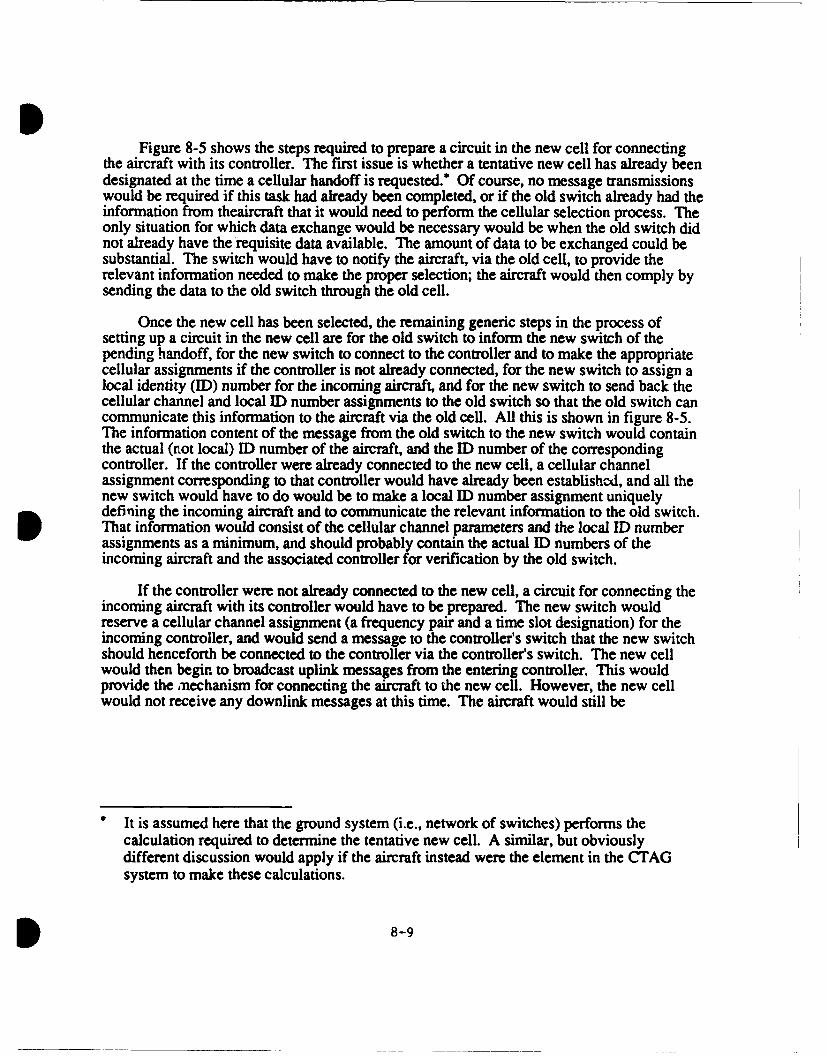
pFigure 8-5 shows the steps required to prepare a circuit in the new cell for connecting
the aircraft with its controller. The first issue is whether a tentative new cell has already beendesignated at the time a cellular handoff is requested.* Of course, no message transmissionswould be required if this task had already been completed, or if the old switch already had theinformation from theaircraft that it would need to perform the cellular selection process. Theonly situation for which data exchange would be necessary would be when the old switch didnot already have the requisite data available. The amount of data to be exchanged could besubstantial. The switch would have to notify the aircraft, via the old cell, to provide therelevant information needed to make the proper selection; the aircraft would then comply bysending the data to the old switch through the old cell.
Once the new cell has been selected, the remaining generic steps in the process ofsetting up a circuit in the new cell are for the old switch to inform the new switch of thepending handoff, for the new switch to connect to the controller and to make the appropriatecellular assignments if the controller is not already connected, for the new switch to assign alocal identity (ID) number for the incoming aircraft, and for the new switch to send back thecellular channel and local ID number assignments to the old switch so that the old switch cancommunicate this information to the aircraft via the old cell. All this is shown in figure 8-5.The information content of the message from the old switch to the new switch would containthe actual (not local) ID number of the aircraft, and the ID number of the correspondingcontroller. If the controller were already connected to the new cell, a cellular channelassignment corresponding to that controller would have already been established, and all thenew switch would have to do would be to make a local ID number assignment uniquelydefining the incoming aircraft and to communicate the relevant information to the old switch.That information would consist of the cellular channel parameters and the local ID numberassignments as a minimum, and should probably contain the actual ID numbers of theincoming aircraft and the associated controller for verification by the old switch.
If the controller were not already connected to the new cell, a circuit for connecting theincoming aircraft with its controller would have to be prepared. The new switch wouldreserve a cellular channel assignment (a frequency pair and a time slot designation) for theincoming controller, and would send a message to the controller's switch that the new switchshould henceforth be connected to the controller via the controller's switch. The new cellwould then begin to broadcast uplink messages from the entering controller. This wouldprovide the imechanism for connecting the aircraft to the new cell. However, the new cellwould not receive any downlink messages at this time. The aircraft would still be
It is assumed here that the ground system (i.e., network of switches) performs thecalculation required to determine the tentative new cell. A similar, but obviouslydifferent discussion would apply if the aircraft instead were the element in the CTAGsystem to make these calculations.
* 8-9
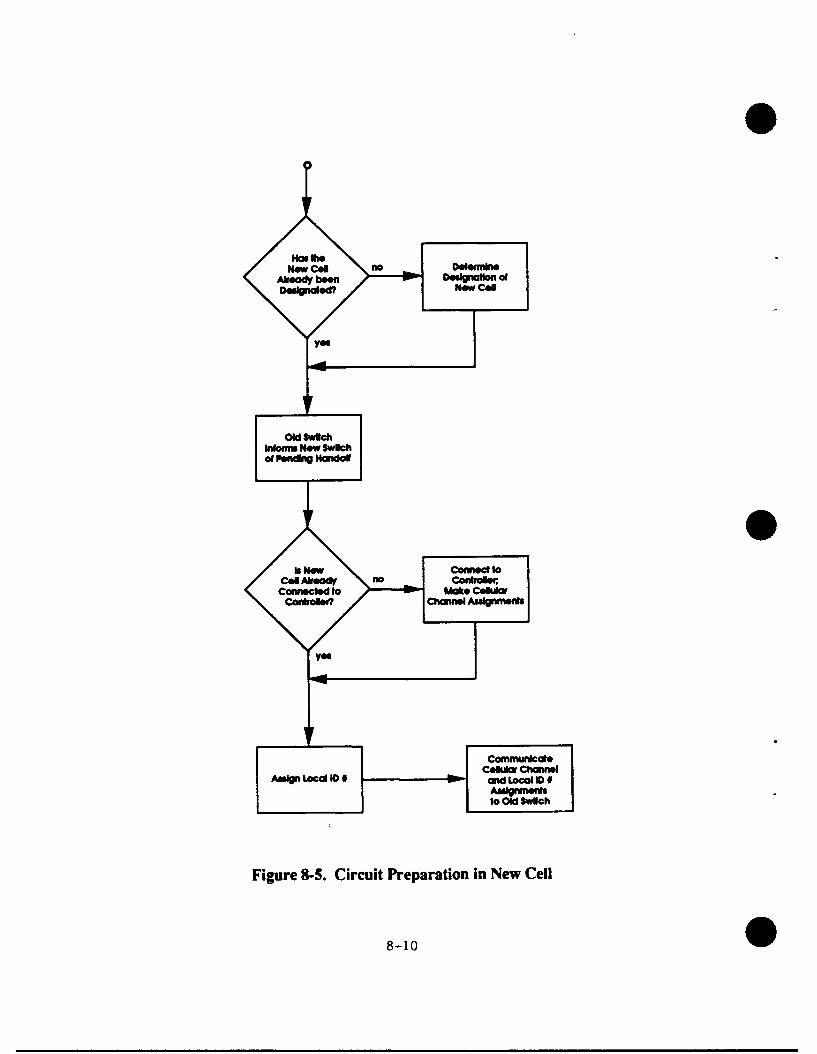
Has lheNOW con no Dele""Ins,
AlreadV been Desilptallon ofDuWdod? Now CON
YOG
do
IF
Old SwIlchWORM NOW swfthof ftndhV Hai
Is NOW Conned toCON Alrea* no Conkoller.Connected to lwk** Cellular
Cardrolled Channel AuWdneds
YOG
CommunicateCellular Channel
AmIgn Local ID # so-, W4 Local 10 0AnWvnwftto OW SwIch
Figure 8-S. Circuit Preparation in New Cell
8-10
transmitting its downlink messages through the old cell, and would continue to do so until thecellular handoff procedure had been completed at the aircraft. Only then would the new cellstart to receive downlink messages.
Once a circuit has been prepared in the new cell, the actual process for making thecellular transition at the aircraft can proceed. Figure 8-6 shows some of the details of thatprocess. Most of the steps in this process require some messages to be exchanged. First, theold switch directs the aircraft to transfer to the new cell via a message sent through the oldcell. That message includes, as a minimum, the cellular channel parameters and the local IDnumber assignments for the aircraft in the new cell, and, of course, either (or both) the localor actual ID number corresponding to the aircraft. The aircraft then sends a round trip timing(RTT) request message to the new cell via the service channel of the new cell. This step isnecessary in order for the aircraft to be able to adjust its message transmission timing relativeto the timing of the new cell, so that messages originating from the aircraft on the newvoice/data circuit will arrive at the new cell at the proper time. Included in the RTT request
Ol wthA/C Sens IT A/C Confntm Setu
d igure 8.re to due f ellP N sw C in/Swltch Comlafon toei threlA st u inommton to a I Canm Setup a f Old Swtch viaTransle to Nw Cl UIn n b inmtaoon in t w
Nw Cel Serrpce Cdbntrlnm tTT a RUly to A/C Vice/Da Channelin Old Cel
A/C Leaves Old Old Switch InfeommCell and Enle~s Caoiim's Switch
new-ircit etupparmetrs eceiedromthe aircaf we ore ee thelparar thatwere
in Now Cell
Figurt drn the stu proce ssu fr Transition at the Aircraft (A/C)
message is the relevant setup information: the actual ID number of the aircraft, and thecellular channel parameters and local ) number assignments corresponding to the new cell.The new cell responds by transmitting a RTT reply message on its service channel to theaircraft, indicating the time of arrival of the RTT request message, and confirming that thenew-circuit setup parameters received from the aircraft were indeed the parameters that wereassigned by the new switch during the setup process for the new cell. The aircraft then sendsa mnessage to the old switch, via the voice/data circuit in the old cell, indicating that thecellular handover process has been coordinated with the new cell, and that the aircraft will
henceforth communicate with its controller via the new cell. This message is the lastmessage that will be sent by the aircraft to the old cell. The aircraft will then adjust its timing
5 8-11
if necessary to be commensurate with the timing of the new cell, and will enter the newly-established circuit that uses the new cell. Meanwhile, the old switch will inform thecontroller's switch of the cellular handoff in order for the controller to be able to continue tocommunicate with the aircraft without perceptible interruption. The message must contain,as a minimum, the actual ID number of the aircraft, the identification of the new cell (or newswitch) to which the aircraft has been assigned, and the local ID number corresponding to thenew cellular assignment. It is not necessary to provide information regarding the newcellular channel assignments (frequency pairs/time slots), since that information is only usedby the new switch or new cell.
To fully complete the cellular handoff process, the data bases at the relevant switcheshave to be updated. Many of the steps involved in this bookkeeping function require nomessage exchange, since they are internal to the switches themselves. Data only has to betransmitted from one switch to another when that data is required for the proper functioningof the receiving switch.
For example, figure 8-7 shows the bookkeeping functions that take place at the oldswitch. First, of course, the aircraft is removed from its channel assignment in the old cell.This merely means that the local ID number corresponding to the aircraft is deleted from theassignment records at the old switch. Next, the switch determines whether any aircraft otherthan the departing aircraft are connected to the controller via the old cell. If there are, nofurther action is required; if not, however, the old switch sends a message to the controller'sswitch indicating that fact and informing the controller's switch that the cellular channelassignment for that controller at the old cell is being released. The next consideration iswhether the new cell is controlled by the same switch as the new cell. This situation mightoccur, perhaps, when a particular switch controls cells in two altitude-adjacent hierarchies. Ifso, the switch updates relevant entries in its local data bank concerning the connectivity ofthe aircraft and its associated controller, but this action requires no message transmissionbetween various elements of the CTAG system. However, if the new cell is controlled by adifferent switch, the old switch transfers relevant information concerning the aircraft from itsdata bank to the data bank in the new switch. This information might include a listing of thecells (service channels) currently visible to the aircraft, possibly also including an estimate ofthe communication quality expected on each of the visible service channels, or of thedistance of the aircraft to some or all of the visible service channels, and the informationmight further include identifying information such as the actual ID number of the aircraft, anancillary identifying ID number such as an airline flight number, or a reiteration of thecontroller to whom the aircraft is connected. Once this information has been sent to the newswitch, the old switch will then erase the information from its own data bank. This last step,of course, requires no message transfer.
8-12 0
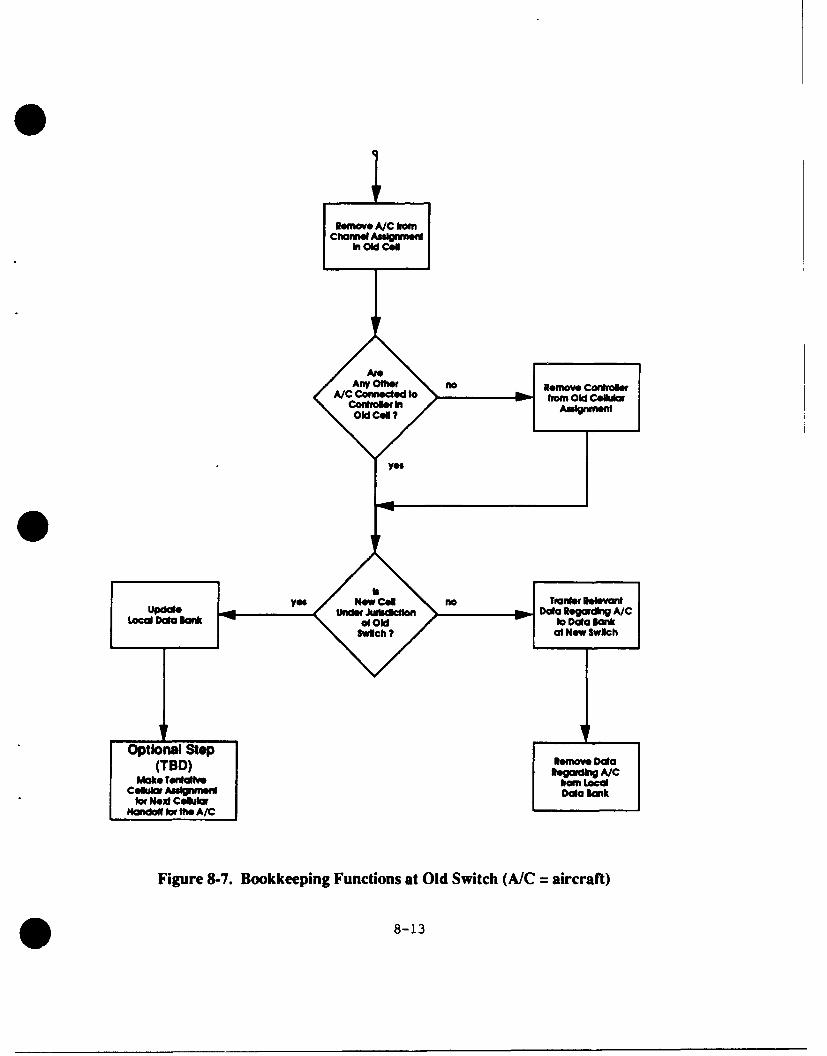
ChannelAU0lnm~V
ha~i N.d CC"ai
Handofl In Sw ff. A
Figure~~~~~~~~l 87BokepnFuCons atOdSic A/ ica
* 8-13
ISECTION 9
TDMA EXAMPLE DESIGN
9.0 INTRODUCTION
This section contains the results of a preliminary effort to define a TDMA solution. tothe CTAG problem. The ideas incorporated in this plan are due to J. L. Ramsey andW. J. Wilson [28].
9.1 ASSUMPTIONS
Before describing the architecture in detail certain basic assumptions that were madeare listed:
1. There are separate up and downlink frequencies in 25 kHz channels.
2. A/A connectively is achieved by ground relay and under the control of the airtraffic controller.
3. At most, M aircraft share a voice channel with a controller in a cell. M iscurrently assumed to be 16. Contention is eliminated through (enforced)discipline. A user who wishes to break in can activate a "call waiting" feature.There is also an emergency break-in feature.
4. Voice is digitized at 4.8 kbps (perhaps using the Code Excited Linear Prediction(CELP) [4] approach). It is ssued that the voice will be acceptable provided thebit error rate is less than 1%. No error correction coding is applied to the voicebits.
5. There are 24 service channels which may need to be monitored.
6. The modulation is assumed to be some form of quaternary signaling (perhapsAviation QPSK) using 20 kbaud, or 40 kb/s instantaneous data rate.
7. Data which is transferred in order to provide network maintenance, emergencyaccess, cell handover, etc., is protected with an r =1/2 rate code. A Golay (20,9)code is currently assumed but this is subject to change.
8. Synchronization and a start symbol are assumed to consume 1.5 ms pertransmission (i.e., 60 bits).
9. Knowledge of absolute time is unnecessary in the air and on the ground. When ina cell, an airborne radio slaves itself to the timing associated with that cell.Oscillators with frequency accuracy of 10-6 are assumed so as to keep frequencyoffsets comparable to the maximum Doppler shift.
10. Radios must be able to change frequencies and change from receive to transmit inat most 1 ms.
Most of these assumptions can be relaxed in one way or another, however, they apply to theparticular architecture described herein.
9.2 FRAME STRUCTURE
As shown in the figure 9-1 the basic unit of time is 100 ms. Each 100 ms period isdivided into five 20 ms time slots. A basic voice circuit consists of a frequency channel pairand an associated time slot pair. An airborne platform will typically transmit on a frequency(fl) in one slot per period and receive on a different frequency (f2) in the next time slot. Thetime allocated to the remaining three slots can be used to scan for other usable servicechannels.
The downlink voice time slot is divided into two subchannels: The maintenance/emergency channel (M/E), and the voice/data (V/D) channel. The M/E channel is used in a"round-robin" fashion by the 16 airborne users on the voice circuit. The V/D channel is usedby the current speaker (if any). Each downlink subchannel has its own sync and header,since different users may use the two subchannels.
The uplink voice time slot is also divided into M/E and V/D subchannels. However,the uplink is always transmitted by a single ground station so that separate syncs are notrequired. The uplink header contains ME information and a separate part associated with theV/D link.
The service circuit uplink has a 100% transmit duty factor. Each time slot contains async and an information portion in each time slot. Voice is never transmitted on the servicecircuits.
The service downlink consists of a sync, an information portion, and a substantial guardtime (4 ms). The guard time is to allow for a round trip propagation delay of 320 nmi (eachway).
9.3 KEY PROCEDURES
To allow the reader to appreciate the various features of the architecture workings of afew key procedures are described.
9.3.1 Net Entry
When an airborne radio enters a new cell it must first "check in" on the service channelassociated with that cell. How the cell is chosen will be described below. To check in theradio receives an uplink message on a service circuit and responds on the downlinkassociated with that circuit using the perceived timing associated with that cell (i.e., itstransmission will be delayed by a one-way propagation delay). The downlink message will
9-2
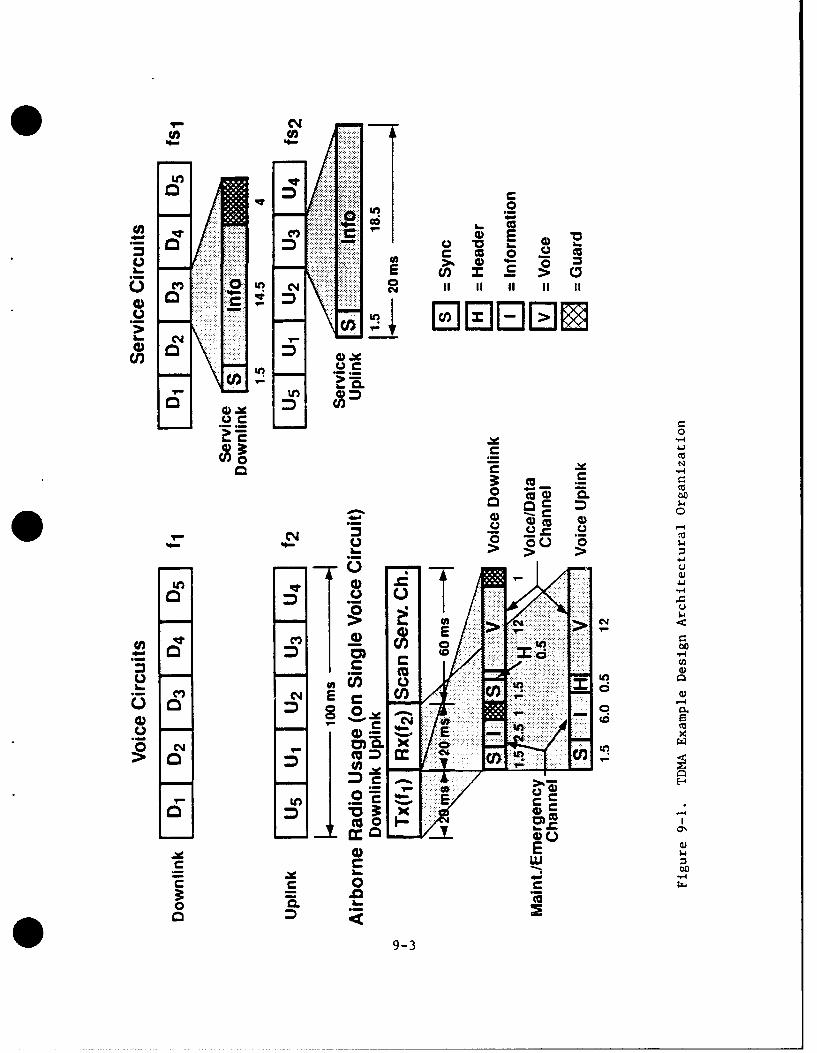
0
c co
044
0
-,4
oc
4) cc
0 4
* .>
Ul) Jd
:> CA -:4
CO ) r.2>~~
00
C.) C14 E~ cn)C) -
E
Cn . C E-w
_ C
9-3
contain information identifying the user (perhaps a 24 bit identifier used in Mode-S, tailnumber and/or flight number) and (if available) the "address" of the controller to whom he isconnected.
An uplink message will be returned to the new user. The voice circuit informationwill include
(1) uplink voice frequency(2) downlink voice frequency(3) voice time slot assignment(4) repeat of the user's ID information for verification(5) a temporary ID number (1 to 16)(6) time offset information.
The temporary ID number is a number from 1 to 16 which is assigned to the user for as longas it remains in a particular cell. On the ground this nibble of information will be associatedwith the more extensive user ID information which was originally transmitted.
The time offset information tells the user how "late" his message on the service channelwas at the ground station. The user must transmit "early" by a related amount when hetransmits on the voice circuit. Because his transmit slot comes before his receive slot thistransmit time shift will I= cause a conflict. The purpose of this offset is to ensure that thesignals from all users arrive at the ground receiver with no overlap (without having to allowfor excessively large guard times). Note that in the ViD downlink a generous I ms guardtime is allowed for time compensation errors.
9.3.2 Circuit Maintenance
When no V/D communication is taking place on a voice circuit there is a small amountof traffic required to maintain connectivity among all users. This occurs on the M/Esubchannel. Each airborne user is allocated the M/E subchannel in the voice downlinkchannel for one time interval out of 24 in which to report to the ground station. The intervalassignments are as shown in figure 9-2. The intervals labelled "E" are for emergency access.Recall that each interval is 100 ms so that each user reports every 2.4 s.
The M/E downlink information includes the followirg:
(1) message type (Maintenance or Emergency)(2) user ID, slot number (1 to 16)(3) request to talk (used for the "call waiting" feature)(4) increment/decrement time(5) channel quality information
The message type information indicates whether the user has declared an emergency.Emergency procedures are described in subsection 9.3.5. The user ID information isredundant since only one user at a time can use each M/E subchannel. The call waiting bit
9-4
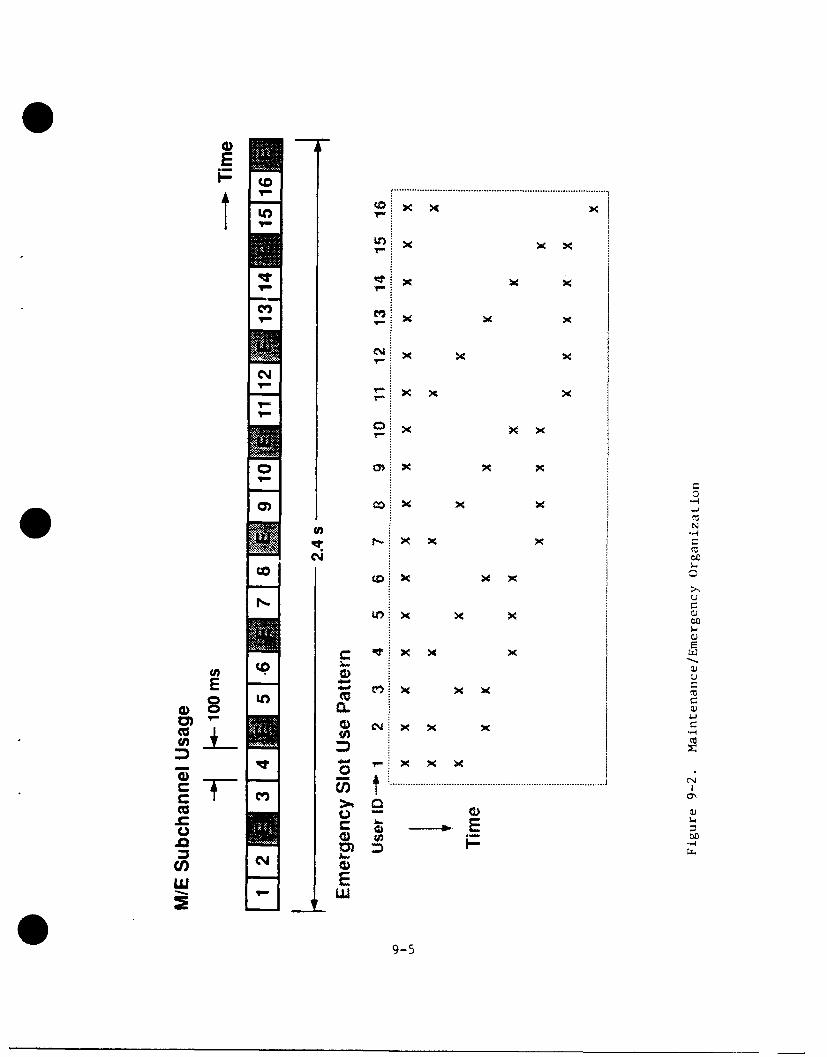
CV)
co x
C x x1ca
x
0C
C.LT.
cnx
LUU
9-5 a
can be used to alert the controller that another user wishes to use the downlink. Theincrement/decrement information indicates whether the user's transmit timing has beenadjusted since the previous update (see below for time adjustment description).
Finally, the channel quality information includes an estimate of the quality of the uplinkservice circuit as perceived by the airborne user. This estimate may, for instance, be basedon the number of errors corrected by the error correction code. The user may also indicate tothe ground the number of cells whose service channels are better than the current one.
The M/E uplink information includes the following:
(1) message type(2) user ID, slot number(3) talk/don't talk(4) increment/decrement(5) channel change information
If the uplink voice circuit is being used by the ground user (or to relay another airborne user'sspeech) the "don't talk" signal will be given. Under those conditions the user will notnormally be allowed to transmit in the V/D subchannel. If push-to-talk (PTF) is activated the"call waiting" signal will be activated in the next available M/E slot, and the controller can bemade aware of the existence of a potential speaker.
The increment/decrement message can be sent to each user at 2.4 s intervals to adjusttransmit timing so that messages arrive at the ground at the correct time. Note that time canprobably be measured to an accuracy of at least one fourth of a symbol, or about 10 pts.Whenever signal arrival times start to wander they can easily be corrected so that the 1 msguard time is very generous. Also, note that both the ground and the airborne radios canaccurately determine the range to each user since the original offset and the subsequentincrements and decrements can be remembered. Range accuracies of one or two milesshould be achievable.
The channel change information may simply be an indication to initiate channel (cell)change procedures on a service circuit. The decision to change could be based on the uplinkquality (and the known existence of better channels), downlink quality, and/or link range.
9.3.3. Voice Communications
Whenever an airborne user wishes to speak he simply waits for a period of silence andactivates PIT. His digitized voice will occupy the V/D subchannel of all subsequent slots inthe circuit. The ground station, upon receiving this signal, will relay the message to all otherusers. The ground radio will also change the "talk" indicator to the "don't talk" indicator onthe M/E subchannel for each the other users. Thus, the other users can monitor theconversation but cannot normally break in.
The ground controller always has complete control of the communication network. Ifhe should activate PTT, his message would replace that of the original airborne speaker; andthe previous speaker will also receive the "don't talk" indicator on the M/E channel.
9-6
If an airborne user wishes to speak while another is already talking he can activatePTT and a "call waiting" signal will be sent in his M/E time slot. This call waiting messagewill be put in a queue with any other call waiting messages and the controller will receivesome appropriate indication. Since the controller controls the network he may select a newuser to access the V/D subchannel.
Note that the V/D subchannel is fairly simple. Each 20 ms time slot contains a 1.5 mssync message, 0.5 ms header, and 12 ms of voice bits. The header is just 20 bits long. If a(20,9) Golay code is used, this is only 9 information bits.
These bits include:
(i) routine/emergency (1 bit)(2) user ID (4 bits)(3) voice/data (I bit)(4) undefined (2 bits)(5) parity check (1 bit).
The voice/data bit indicates whether the ensuing message is 4.8 kbps voice or coded data ofsome sort.
9.3.4. Cell Monitoring/Cell Handover
Every airborne user is always connected by a voice circuit to a particular cell site. As itflies from place to place the cell will have to change in order to maintain connectivity. Thisis accomplished by cell monitoring.
Suppose, for instance, that there are a total of 24 different uplink service channelfrequencies that blanket the entire service area using some appropriate frequency reusepattern. Every airborne user will monitor the activity on one of these channels during each100 ms time interval during the slots not allocated for transmitting or receiving on the voicecircuit. It will take 2.4 s to update all the channels. Note that the approximately 60 msavailable is more than enough to monitor two complete time slots during each interval nomatter what the time offset between the different cell site clocks.
The quality of each channel can be estimated, perhaps, by keeping track of the numberof errors corrected by the error correcting code. This measure is not dependent on knowingthe information which was actually sent. The quality of the service channel of the currently-occupied cell is rerorted to the ground station via the M/E subchannel, along with anindication of the number of other service channels deemed to be of better quality. Theground station can develop its own measure of link quality by monitoring the error correctionstatistics of the M/E downlink.
These two qualities, plus the known range of the airborne radio, can be combined bysome to be determined (TBD) algorithm to ascertain when a cell handover is imminent.When this is determined the uplink M/E is used to tell the user to dump its qualityinformation via a specified service circuit. The information downloaded includes a list of the
9-7
"best" quality service channels and their (numerical) qualities. (Alternately, this informationmight already be incorporated in the routine downlink M/E report). Using this informationthe ground station instructs (via the service circuit) the user to interrogate the two or threemost likely handover candidates. To interrogate, the user performs a round trip timingprocedure (see net entry) and measure the range to each site. This range is reported to theground station, which chooses the most appropriate new cell. In a final uplink servicemessage the identity of the new service channel and the time to switch over is revealed.
The entire handover procedure may take one or two seconds (from the time of theindication of channel degradation to the new channel indication). It is assumed that this isfast enough to track actual changes in the RF environment. Note that after the new cell isdetermined, but before the handover actually takes place, the ground connections will have tobe prepared so that there is no interruption in service. This might add one or more secoiids tothe total handover time.
9.3.5 Emergency Communications
When an airborne user feels it is warranted, he may declare an emergency by, forinstance, activating a special switch on his radio set. Then he simply activates PTT and themessage will be transmitted with a special emergency header. In addition, he will indicate anemergency in his allocated M/E slot and in a number of the special emergency slots (seefigure 9-2).
If no other user is "on the line" the emergency user captures the circuit and hisemergency status is made known to the controller. If someone is already speaking theexistence of an emergency will be indicated to the ground via the M/E subchannel. Theground radio can then remotely shut off all non-emergency traffic using the "don't talk"indication in the uplink M/E channel.
To guarantee that two emergency messages, which happen to originate at exactly thesame time, do not constantly conflict and prevent either from being received, there are twomechanisms provided. First, each such user has his own unique M/E subchannel slot.Secondly, each user will have a unique pattern of three emergency slots (based on IDnumber) which are guaranteed not to conflict more than twice. Thus, at least one user willalways get the circuit in times of emergency. Normally, emergency access time will be lessthan 300 ms if there is already a (nonemergency) user on the air and there is no multipleemergency situation. If no one is on the air, access time is less than 100 ms.
In case of multiple emergency messages there are a number of possible solutions. Onepossibility is to provide "emergency call waiting". Another possibility is to quickly assign anew voice circuit to the second emergency speaker. It is not clear to the study team how airtraffic controllers or pilots would like to resolve this issue.
The above is a rough outline of what appears to be a viable architecture for TDMACTAG. Many details have not been spelled out; however, there is enough information toelicit some feedback from the reader on the basic soundness of the concept and how thisexample design might be improved.
9-8
9.4 LINK SYNCHRONIZATION
In the above TDMA architecture, uplink and downlink messages are sent in 20 mstime slots. Each message consists of a synchronization (acquisition) preamble followed bythe information or data content of the message. Assuming both the sync and data portions ofthe message are transmitted using QPSK modulation at a 20 kbaud rate (corresponding to aninstantaneous 40 kb/s data rate in transmission), 60 bits, corresponding to 30 bauds, isdevoted to the sync preamble.
Given the signal to noise ratio (SNR) required to achieve some specified level ofperformance) such as a 10-2 binary error rate (BER) during the data portion of the message,one of the open questions was whether the 1.5 ms sync preamble is sufficiently long tosupport that same standard. This subsection addresses that question. It is shown that, for a1.5 ms preamble, the sync is approximately 9.5 dB stronger than the data [29]. A 1.0 mspreamble would therefore be about 7.7 dB stronger than the data. The resulting 0.5 ms mightmore usefully be redirected toward increasing the data content that can be communicated inCTAG messages.
To begin, consider the SNR required for acceptable communication performance inthe data portion of CTAG messages. We assume that a 10-2 BER is required in the dataportion of CTAG voice messages. Moreover, for the (20,9) Golay code proposed for the dataportion of CTAG data messages, a 10-2 BER yields a code word error probability of 0.4 x10⁻⁴. Figure 14-6 of reference [30] indicates that for an ideal differentially coherent detectorof QPSK, a SNR of about 8.0 dB (Eb/No of 11.0 dB) is required.
Next, consider the SNR required for the synchronization portion of CTAG messages. Adetection probability PD = 1 - 104 = 0.9999 is commensurate with a Golay code errorprobability of 104 in the data portion of CTAG data messages. If the preamble detector forCTAG messages were sampled at the 20 kHz baud rate over a 5 ms uncertainty period, 100samples would be taken. For a message false alarm rate of 10-5, a per sample false alarmrate pf = 10-7 is required. In reference [31] it is shown that for an idealized detector, a single-pulse SNR of 16.3 dB is required for PD = 0.9999 and pf = 10-7.Recall that a 1.5 ms syncpreamble consists of 30 bauds. If a baud SNR Ebj/No = 11.0 dB were required for acceptableCTAG performance in the data portion of CTAG messages, as indicated above, this wouldcorrespond to a single-pulse baud SNR of
25.8 dB = SNR (baud) + 10 log 1030 b = 11.0 dB + 14.8 dB (3)
for the synchronization portion of CTAG messages. This exceeds the required amount by9.5 dB. A 1.0 ms sync preamble, consisting of 20 bauds, would produce a single-pulse SNRexceeding the required amount by about 7.7 dB.
5 9-9
SECTION 10FDMA COMPARISON
10.0 INTRODUCTION
A TDMA system architecture for CTAG and the procedures required for net entry,circuit maintenance, cell monitoring, cell handover and emergency communications isdescribed in section 9. Those procedures, except for some minor modifications, could alsoapply to an FDMA architecture [32].
Modifying assumptions 6 and 8 of subsectin 9.1 by:
6'. Each voice and service channel is a separate 5 kHz signaling channel with an8 kb/s instantaneous data rate.
8'. Synchronization consumes 7.5 ms per transmission (60 bits), although as shown byRamsey in subsection 9.4, it can be considerably shortened.
As in TDMA, contention for a voice channel is eliminated except for the P7T disciplineamong the aircraft using the same transmission slot. Although the M aircraft sharing a voice"circuit" with a controller share a single FDM channel pair, the uplink voice channel carriesinformation directing which one of the M aircraft terminals is permitted to transmit on thedownlink voice channel.
A single FDM voice channel pair is used for all aircraft connected to a cell which aresharing a voice circuit with a controller. As shown in figure 10-1, the downlink channel isdivided into two TDM subchannels: the V/D subchannel and the MIE subchannel.
An airborne user is given a dedicated time slot assignment on the M/E channel which,using Wilson's M/E subchannel usage map, he can access under normal conditions every2.4 s and under emergency conditions every 300 ms. He uses these accesses to request fromthe controller use of the V/D subchannel (i.e., the voice circuit). The header portion of thevoice uplink identifies the airborne user permitted to use the V/D downlink.
In this architecture, like in the TDMA design, initial synchronization of the voicedownlink is achieved by monitoring the service channel uplink and maintained by monitoringthe voice channel uplink. No timing correction is needed since sufficient guard times (5 ms)to prevent adjacent time slot overlap is provided for both the M/E and V/D subchannels.
The uplink voice channel transmissions are continuous but are formatted to provide asynchronization preamble every 100 ms. Reception of the preamble is used to provide atiming marker for the downlink. The header contains M/E data to control use of thedownlink.
S10-1
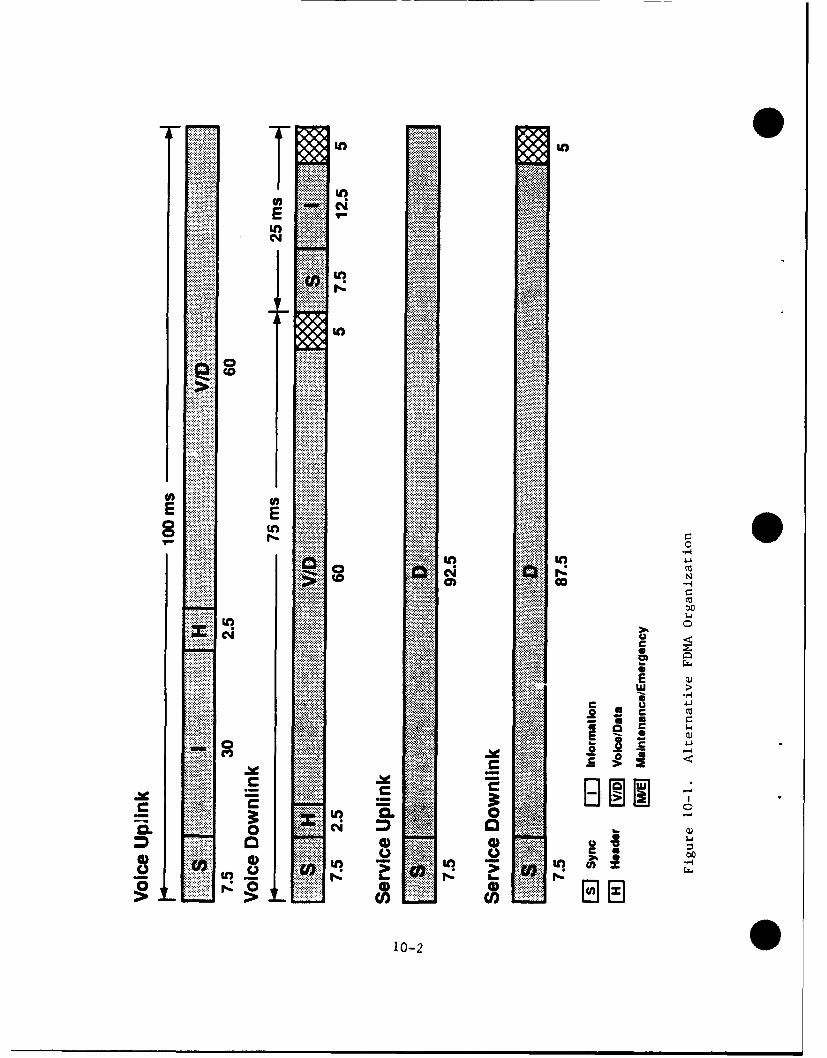
Lnn
inn
inC-4
LO CL
in 0
U)U
10-2
IThere is a single uplink and a single downlink service channel per cell which are shared
by all cell participants. The uplink service channel transmissions are continuous and containa synch portion, transmitted every 100 ms, and a data portion. The downlink channel timingis synchronized to the uplink but has an uncertainty proportional to the propagation distancebetween the cell and the airborne user. A 5 ms guard time prevents overlap of transmissionsfrom different airborne users in adjacent time slots.
The following question comes to mind -- are there any advantages of the FDMAarchitecture versus the TDMA architecture? Since this FDMA design parallels the TDMAdesign one would expect few differences. For the same system capacity the total bandwidthrequired is the same. The time to access a new cell would increase since there are 1/5th asmany accesses on the downlink service channel. However, one access every 100 ms seemssufficient. More importantly, access to the voice downlink is the same. Assuming bothdesigns use the same modulation and coding techniques, they both require the same EWINo,but the peak power required in the FDMA design would be 1/5th that required in TDMA.Another advantage of FDMA is that in that design the aircraft radios don't have tosynchronize as precisely (i.e., RTT) to their respective cells.
In the TDMA design, transmit and receive time slot assignments do not overlap.Therefore the radio is either transmitting or receiving, but never doing both simultaneously.In the FDMA design, the radio is simultaneously participating on a voice uplink channel(receiving) and a voice downlink channel (transmitting). In addition, the FDMA radio mustconcurrently monitor the quality of the service channels of nearby cells. As a result, theFDMA radi requires one transmitter, two receivers and either two or three synthesizersdepending cai whether the receiver scanning the service channels can share a commonsynthesizer with the transmitter. The TDMA design requires one transmitter, only onereceiver and only one common synthesizer.
m 10-3
LIST OF VOLUME 2 REFERENCES
g. Panter, P. F., Modulation, Noise, and Spectral Analysis, McGraw Hill, New York,1965.
10. Schwartz, M., Bennett, W. R., and Stein, S., Communication Systems andTechniques, McGraw Hill, New York, 1966.
11. Reed, T. A., "CRAG Airborne and Ground Radio Price Estimates," D093-M-603,Internal Memorandum, The MITRE Corporation, 27 August 1991.
12. Gilhousen, K. S., Jacobs, I. M., Padovani, R., Viterbi, A. J., Weaver, L. A., andWheatley, C. A., "On the Capacity of a Cellular CDMA System," Special Issue onDigital Celllular Technology, IEEE Trans. Vehicular Technol., May 1991.
13. Goodman, D. J., "Trends in Cellular and Cordless Communications," IEEECommunications Magazine, June 1991, pp. 31-40.
14. Taylor, J. T., and Omra, J. K., "Spread Spectrum Technology: A Solution to thePersonal Communications Services Frequency Allocation Dilemma," IEEECommunications Magazine, February 1991, pp. 48-5 1.
15. Casewell, I. E., "The Provision of GSM Cellular Radio Environments withinPassenger Aircraft Operating Over Europe," 5th Intern. Conf. Mobile Radio andPersonal Commun., Univ. of Warwick, Coventry, U.K., 11-14 December 1989.
16. Millar, R. I., Department D050, The MITRE Corporation, private communication.
17. Wickwire, K. H., "CTAG Message Generation," D095-M-490, internalmemorandum, The MITRE Corporation, 14 June 1991.
18. Millar, R. I., "Cell Structure and Frequency Reuse in Cellular-Trunked Air/Ground(CAG) Radio Communications," D050-M-050, internal memorandum, The MITRECorporation, 17 April 1991.
19. Wilson, W. J., "Solution to the CTAG Cellular Problem," D053-M- 1024, internalmemorandum, The MITRE Corporation, 23 May 1991.
20. Wilson, W. J., "CAG Frequency Reuse Patterns and Propagation Effects,"D053-M-1454, internal memorandum, The MITRE Corporation, 15 October 1991.
21. Bullington, K., "Radio Propagation Fundamentals", The Bell System TechnicalJournal, Vol. XXVI, No. 3, pp. 593-626, May 1957.
22. International Radio Consultative Committee (CCIR), "Reflections from the Surface ofthe Earth", Vol. V, REport 1008, pp. 89-95, 1986.
RE-1
LIST OF VOLUME 2 REFERENCES(Concluded)
23. Davis, R. W., "Cell Hand-Off Procedures for CTAG Radio Channels",D059-M-21 11, internal memorandum, The MITRE Corporation, 9 May 1991.
24. Jain, G. P., "FAA National Airspace System Architecture," Department F085briefing, The MITRE Corporation, 6 February 1991.
25. Leiter, M., "CTAG Ground System Data Flow," D053-M-1361, internalmemorandum, The MITRE Corporation, 16 August 1991.
26. Leiter, M., "How Does CTAG Work?," D053-M-1318, internal memorandum,The MITRE Corporation, 23 July 1991.
27. Ramsey, J. L., "Message Traffic Requirements for Routine Cellular Handoff inCTAG," D053-M-1276, internal memorandum, The MITRE Corporation,3 July 1991.
28. Wilson, W. J., "Rudiments of CTAG TDMA Architecture," D053-M-1218, internalmemorandum, The MITRE Corporation, 31 May 1991.
29. Ramsey, J. L., "The Relative Strenghts of the Sync and Data Portions of a ProspectiveCTAG Message Format," D053-M-1243, internal memorandum, The MITRECorporation, 13 June 1991.
30. Stein, S., and Jones, J. J., Modern Communication Principles, McGraw Hill, NewYork, 1967.
31. Robertson, G. H., "Normal Error Model Analysis Charts," published privately byauthor, Mountainside, New Jersey, May 1977.
32. Leiter, M., "Strawman FDMA Architecture," D053-M-1270, internal memorandum,The MITRE Corporation, 2 July 1991.
RE-2
APPENDIX 1
Briefing on Trellis Coded Modulation
by M. Leiter
S
S Al-i
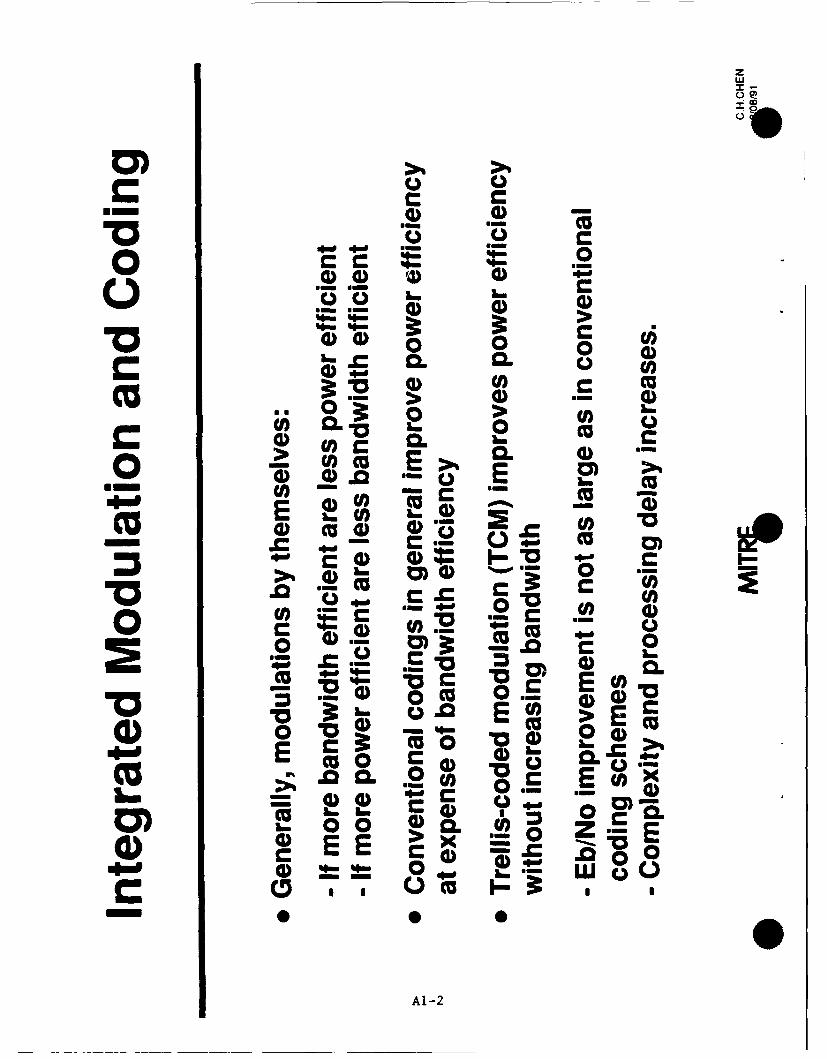
z
00
%lo >14 4) 0 0
'4- m 0
C.) m c *
*0 > U)00 0L 0 0c 0
CL 0> U)cc20 o~ c.
E) rm 00c COO 0j
6~ 00 E Ec~o o uC)>
E- " .EC'o.0 *.- 0- CL u 0E
4)u 0 0E00 Cu
0) 0 o 0
- Cu0
~.00..2o
7r
S 00C o o
mccE C.
0 m.
0- "0
,--
am
I- -= x9 0)
.00
A1-3
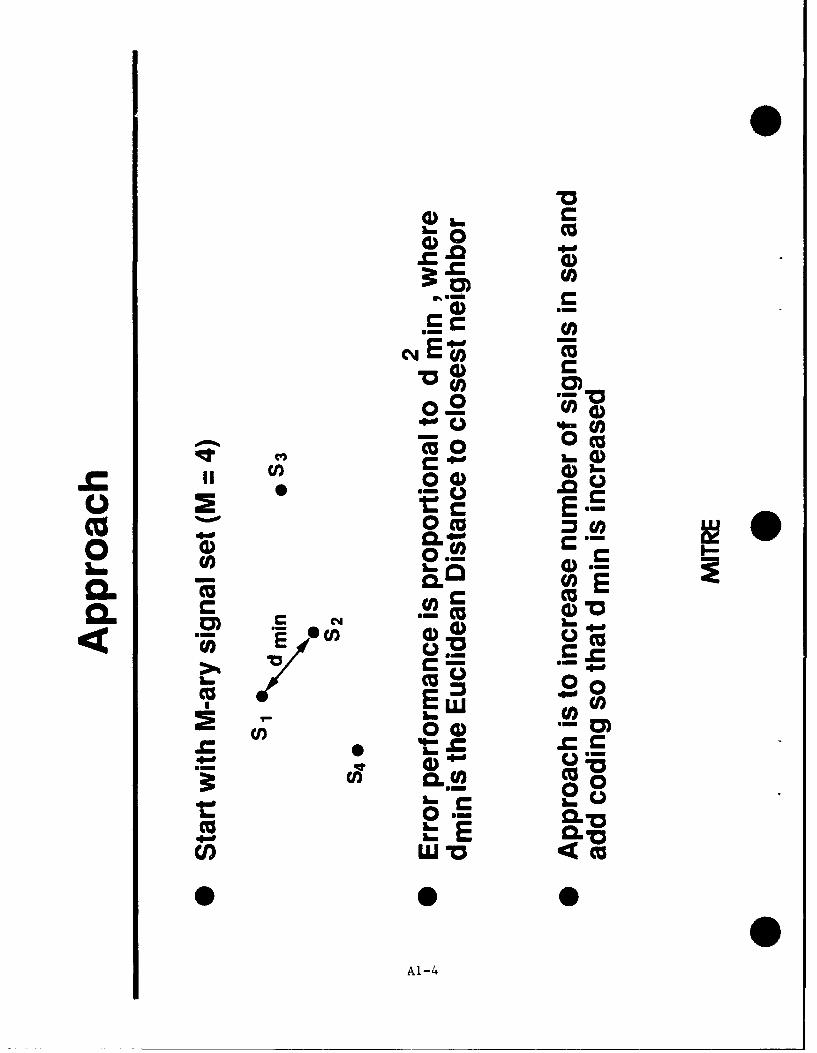
0-
0)
02m
,#oft 0 0r of1.
04)0 o* L
CE Owu
1Lon 0 1
0.-0... 000. L. r
L oC. 0 -
*04) '0)-
00
Al-4
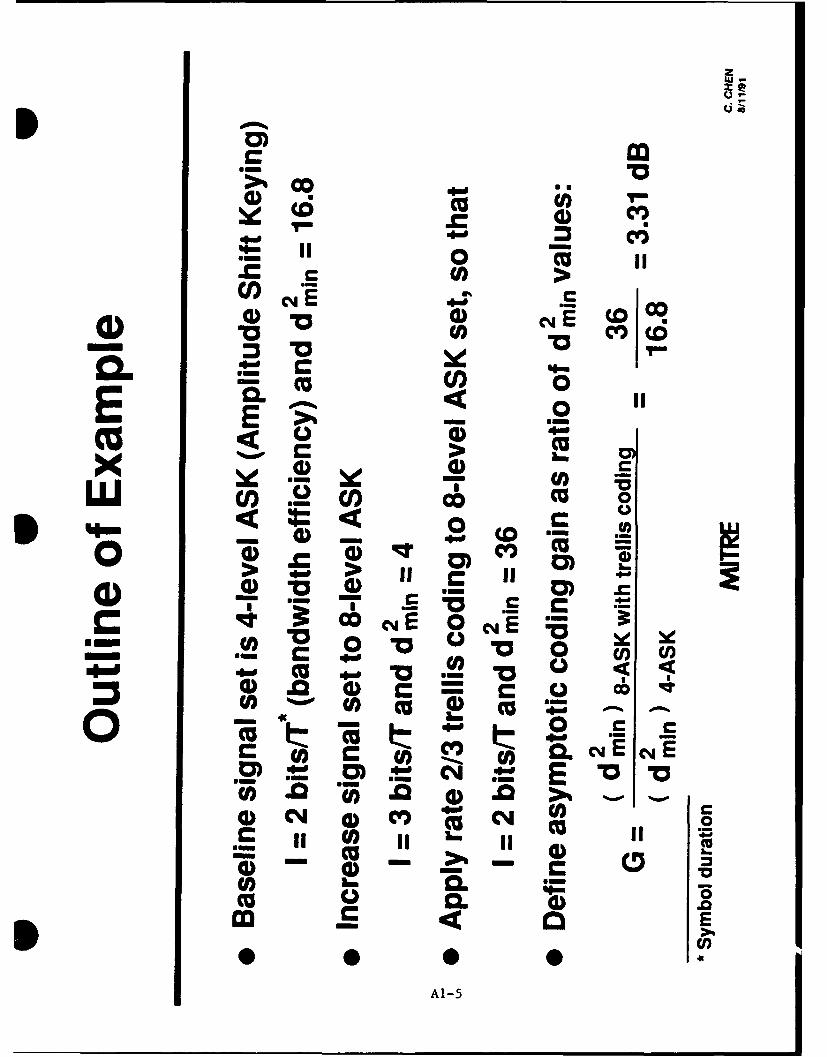
2
0'
U) >
m cn 0E E 0
,%mo * h. >/
E <C 0 oE-A
4)~C c n Cc> >
) 2 () ~
a ) 0 a) 0. SE
o.0 0.0.00 cbc
0 M~ U) Cc cuccc 0
0o 2=0 cm 0
4) CM 4) CO C ua)
CuLIIAI-5
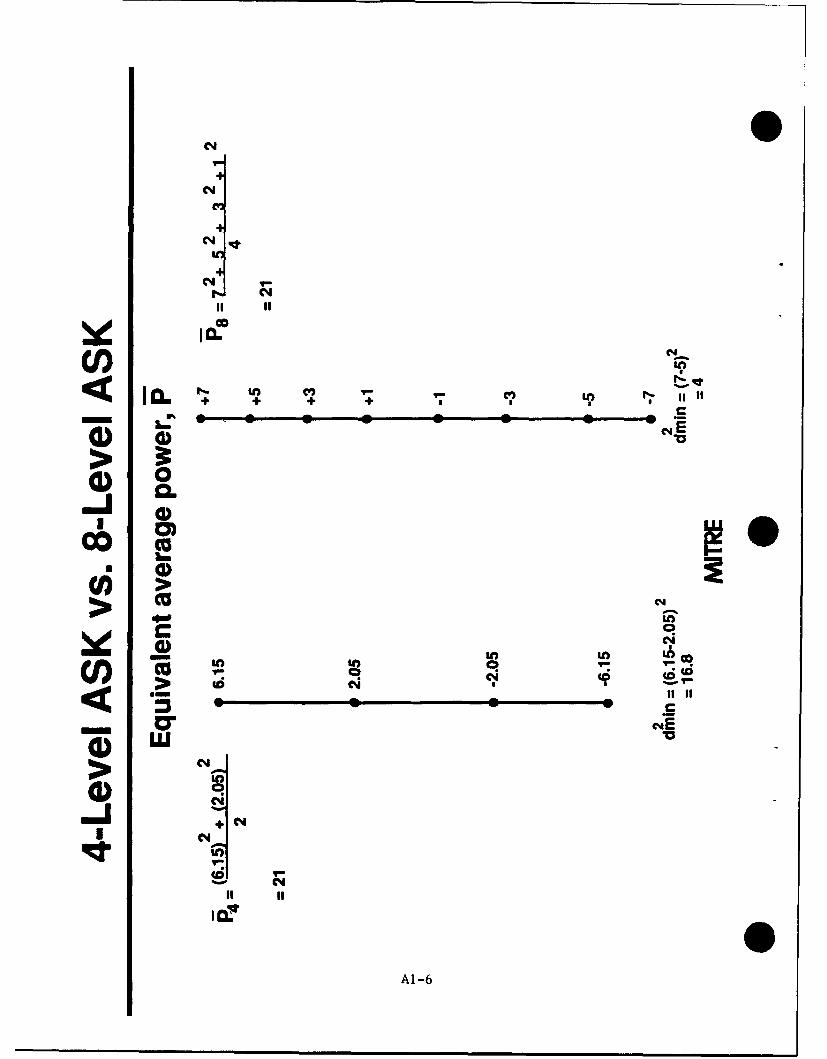
11CCIO
wG)V)
0004)
COO)
> C4
> 04
4) C4
IC +IC
C4
0. C
Nl-
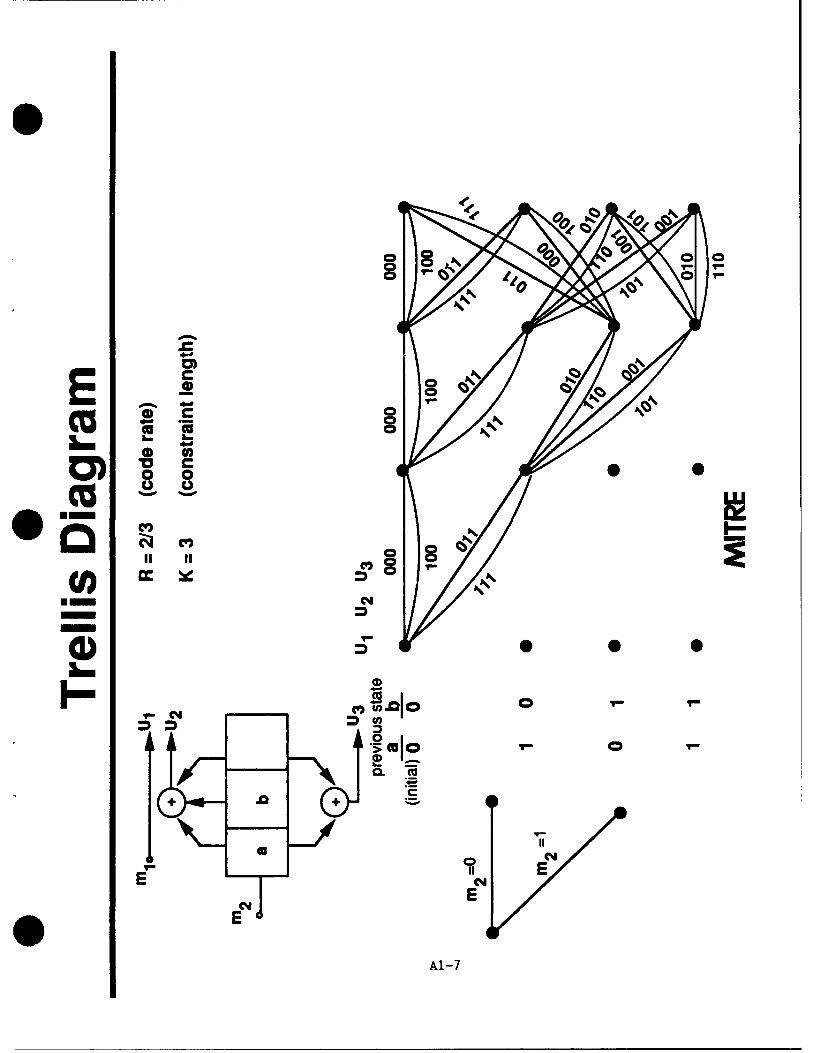
EAO) 0
C*
>u Cc 0oL m
U- E
III E 4
-l-
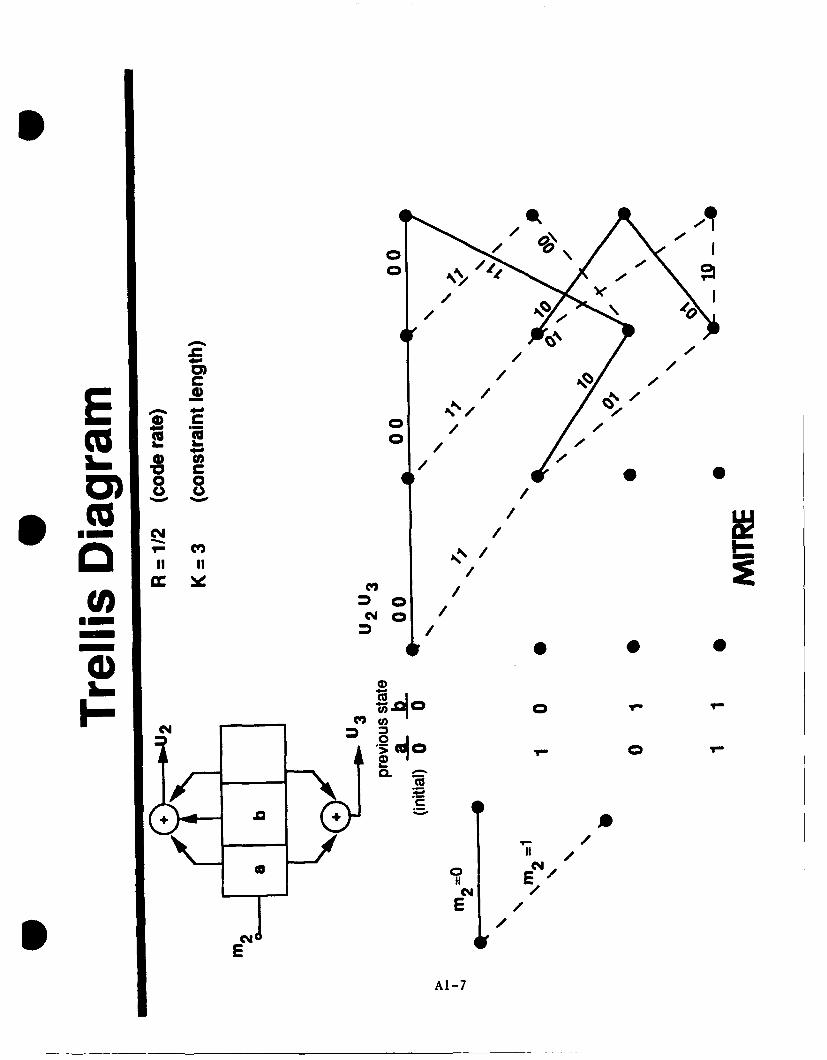
0) 0
0 0
C4E
m U- Cl4
E/
/I-
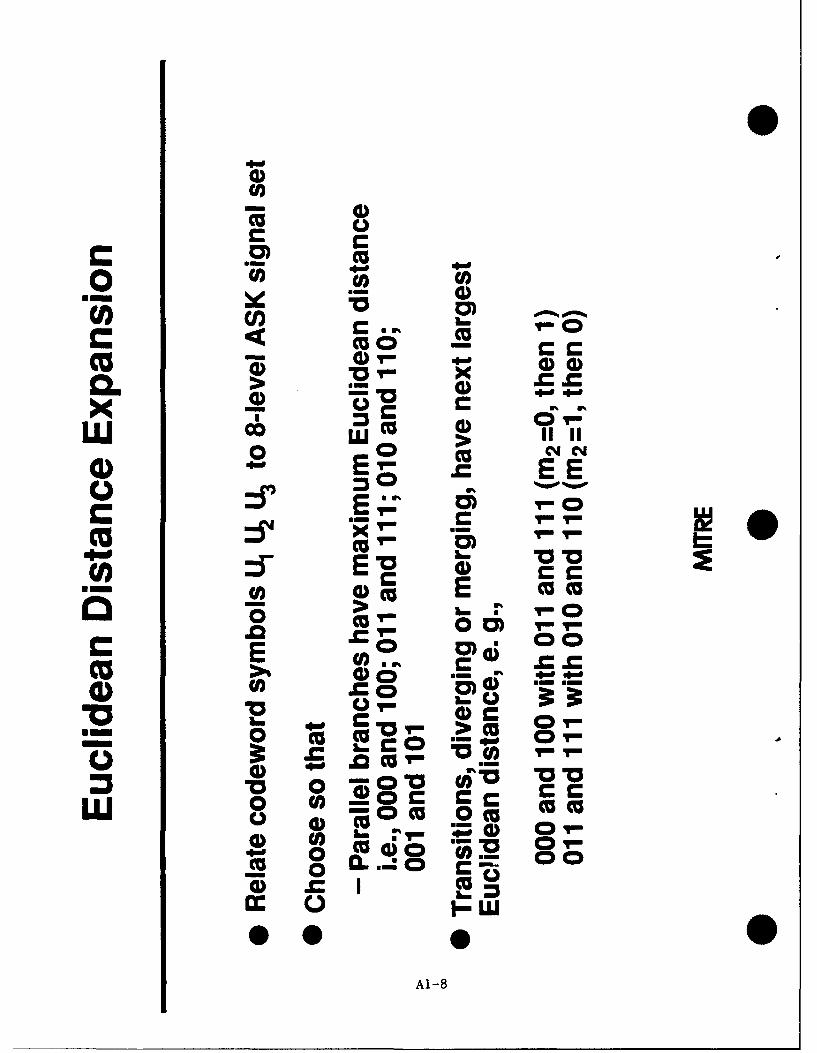
U)U
00 0 )0 RWk0,1tc 0 cc coo - x
0) ) o--x 7-0a
0 0 cc cmU~
4) E 00
wE EM 00m
>- a. v- -
0 4
15~ 0in *-m 0 0'
uml m0C 0 00
0 0 a. 4!
@0 0n
Al-8
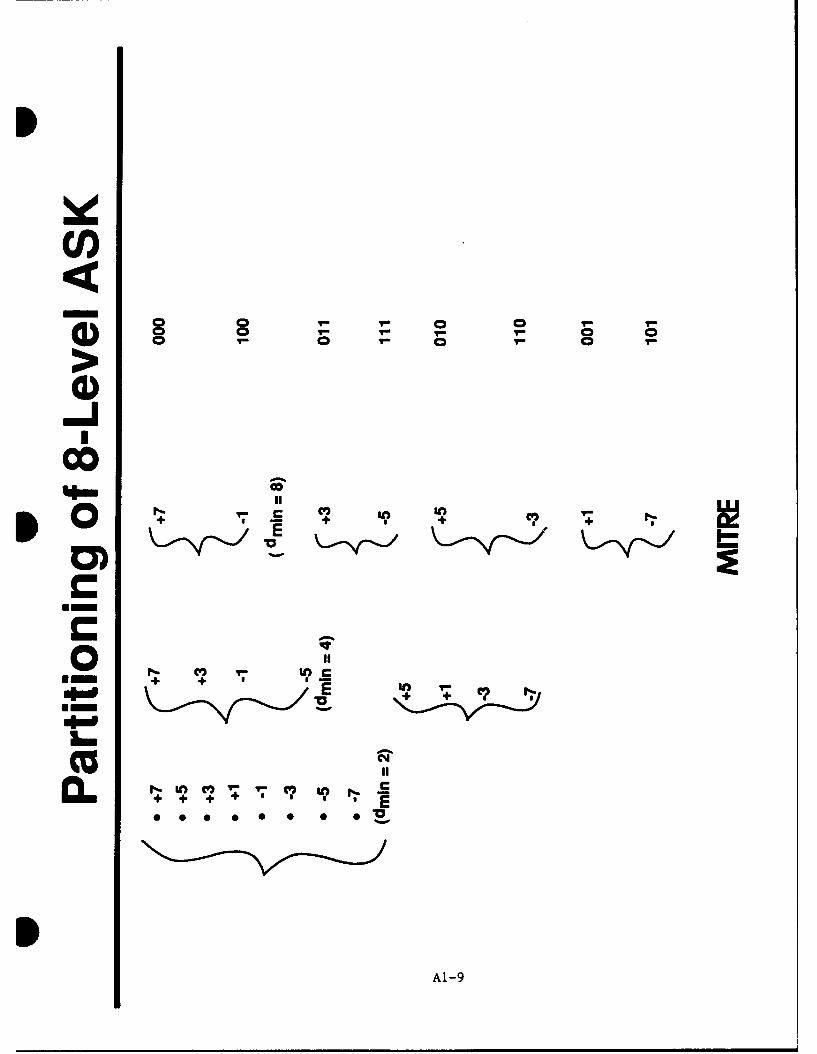
I
C/)
m8
coO)O
+AII
cc
0U-U
II ~ r InII co l -I I|
AI-9
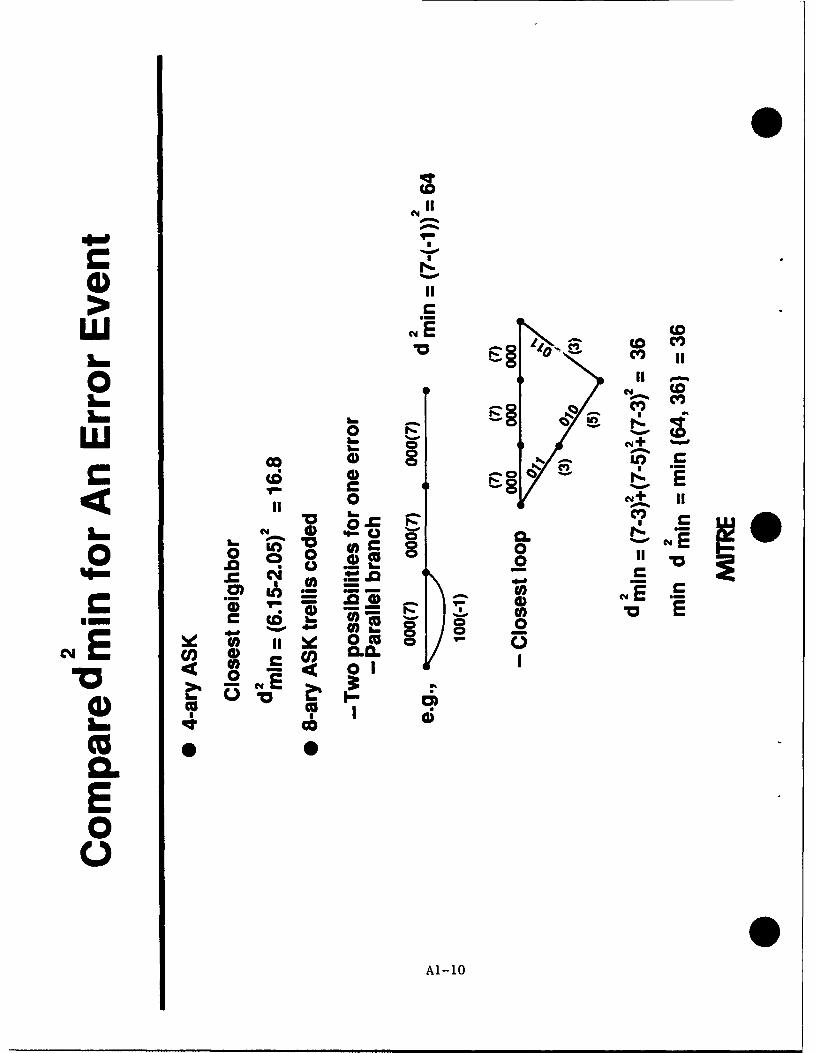
0 C4d
IZ
I
II
4_ Cc 00 cm
o 0
00
c19 E__r.CC
rolEO
0A0-1
~- Al -10
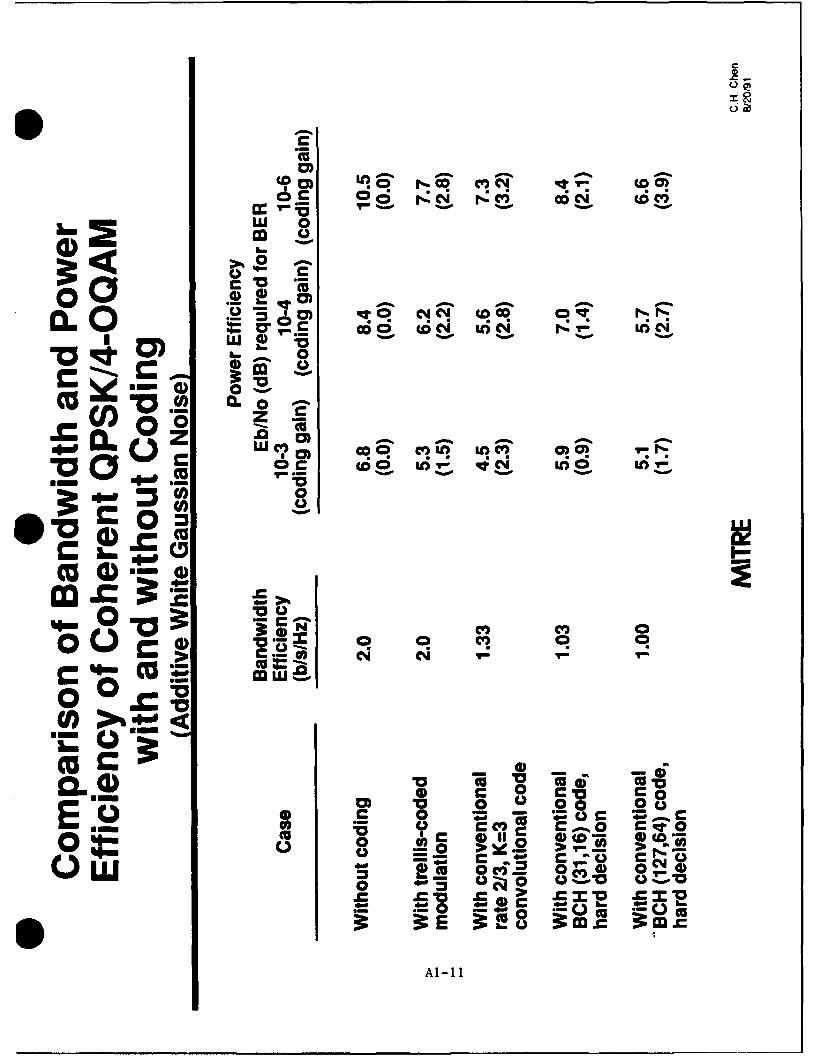
W Ui r- C Ci a
S .m coN ( Vc.
00 IleJ CD..
0L 0
00
~~inrif CO cfiq)
0 o"S0 m a
CU >%~
0c 00
So c= C 00 c~ CE~S U co 04
o = - EE rU c Z-00
- 0 C 0 b- em
Al-11
APPENDIX 2
Development Work Breakdown Structure
by T. A. Reed
* A2-1
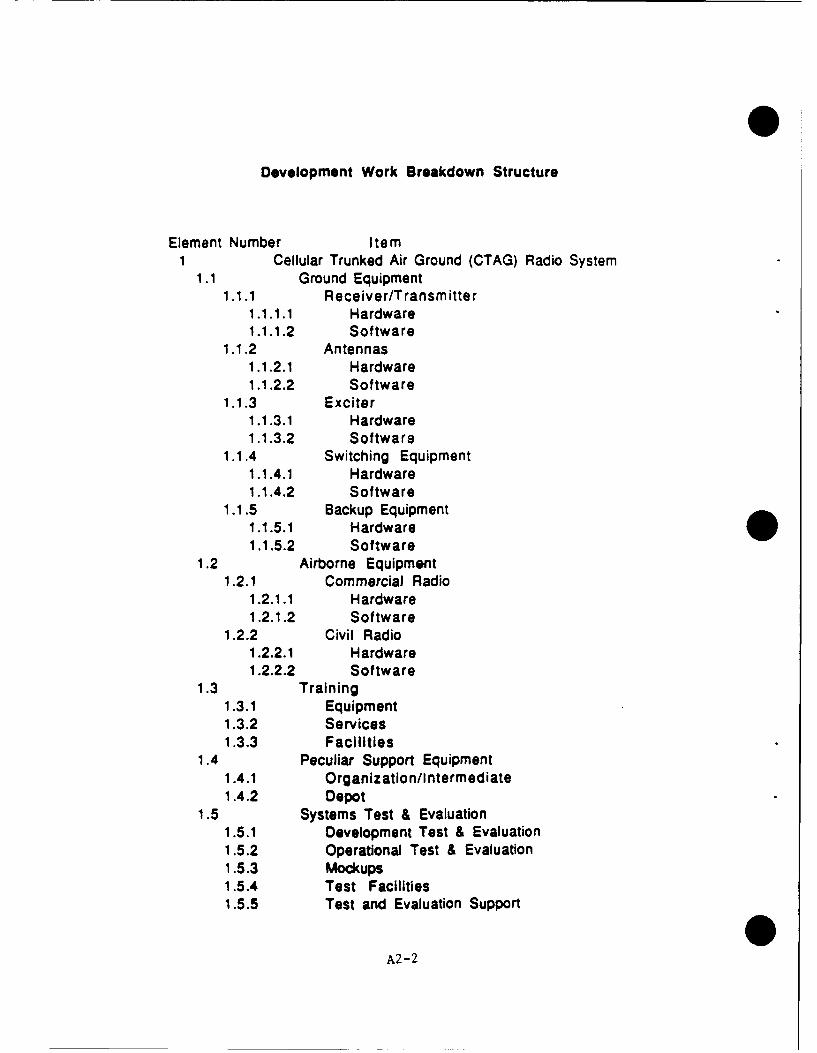
Development Work Breakdown Structure
Element Number ItemCellular Trunked Air Ground (CTAG) Radio System
1.1 Ground Equipment1.1.1 Receiver/Transmitter
1.1.1.1 Hardware1.1.1.2 Software
1.1.2 Antennas1.1.2.1 Hardware1.1.2.2 Software
1.1.3 Exciter1.1.3.1 Hardware1.1.3.2 Software
1.1.4 Switching Equipment1.1.4.1 Hardware1.1.4.2 Software
1.1.5 Backup Equipment1.1.5.1 Hardware1.1.5.2 Software
1.2 Airborne Equipment1.2.1 Commercial Radio
1.2.1.1 Hardware1.2.1.2 Software
1.2.2 Civil Radio1.2.2.1 Hardware1.2.2.2 Software
1.3 Training1.3.1 Equipment1.3.2 Services1.3.3 Facilities
1.4 Peculiar Support Equipment1.4.1 Organization/Intermediate1.4.2 Depot
1.5 Systems Test & Evaluation1.5.1 Development Test & Evaluation1.5.2 Operational Test & Evaluation1.5.3 Mockups1.5.4 Test Facilities1.5.5 Test and Evaluation Support
A2-2
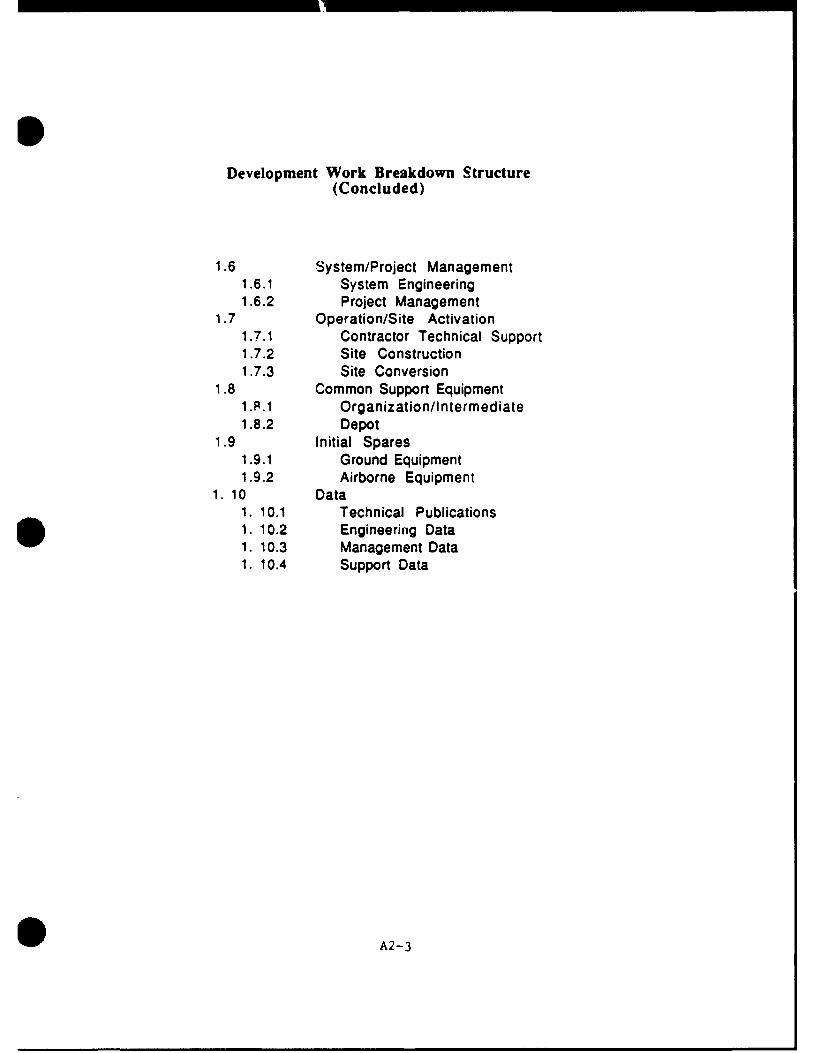
Development Work Breakdown Structure(Concluded)
1.6 System/Project Management1.6.1 System Engineering1.6.2 Project Management
1.7 Operation/Site Activation1.7.1 Contractor Technical Support1.7.2 Site Construction1.7.3 Site Conversion
1.8 Common Support Equipment1 .P.1 Organization/Intermediate1.8.2 Depot
1.9 Initial Spares1.9.1 Ground Equipment1.9.2 Airborne Equipment
1. 10 Data1. 10.1 Technical Publications1. 10.2 Engineering Data1. 10.3 Management Data1. 10.4 Support Data
S A2-3
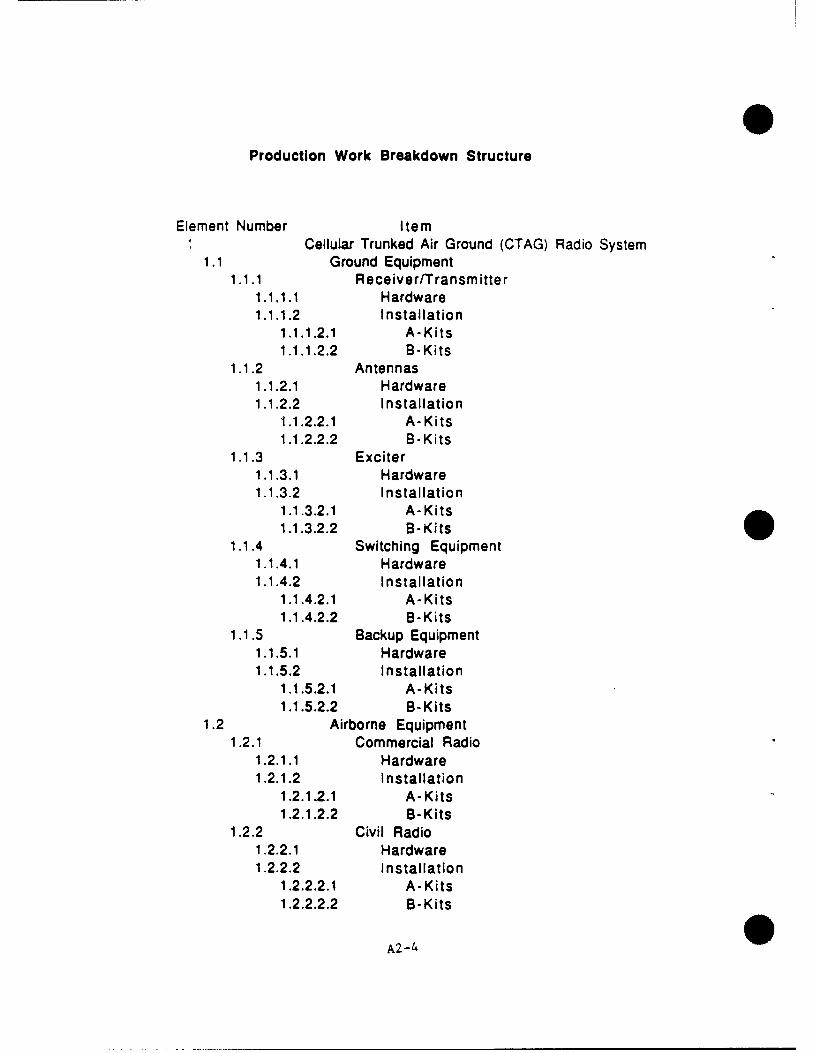
Production Work Breakdown Structure
Element Number ItemCellular Trunked Air Ground (CTAG) Radio System
1.1 Ground Equipment1.1 .1 Receiver/Transmitter
1.1.1.1 Hardware
1.1.1.2 Installation1.1.1.2.1 A-Kits1.1.1.2.2 B-Kits
1.1.2 Antennas1.1.2.1 Hardware1.1.2.2 Installation
1.1.2.2.1 A-Kits1.1.2.2.2 B-Kits
1.1.3 Exciter1.1.3.1 Hardware1.1.3.2 Installation
1.1.3.2.1 A-Kits1.1.3.2.2 B-Kits
1.1.4 Switching Equipment1.1.4.1 Hardware1.1.4.2 Installation
1.1.4.2.1 A-Kits1.1.4.2.2 B-Kits
1.1.5 Backup Equipment1.1.5.1 Hardware1.1.5.2 Installation
1.1.5.2.1 A-Kits1.1.5.2.2 B-Kits
1.2 Airborne Equipment1.2.1 Commercial Radio
1.2.1.1 Hardware1.2.1.2 Installation
1.2.1.2.1 A-Kits1.2.1.2.2 B-Kits
1.2.2 Civil Radio1.2.2.1 Hardware1.2.2.2 Installation
1.2.2.2.1 A-Kits1.2.2.2.2 B-Kits
A2- 4
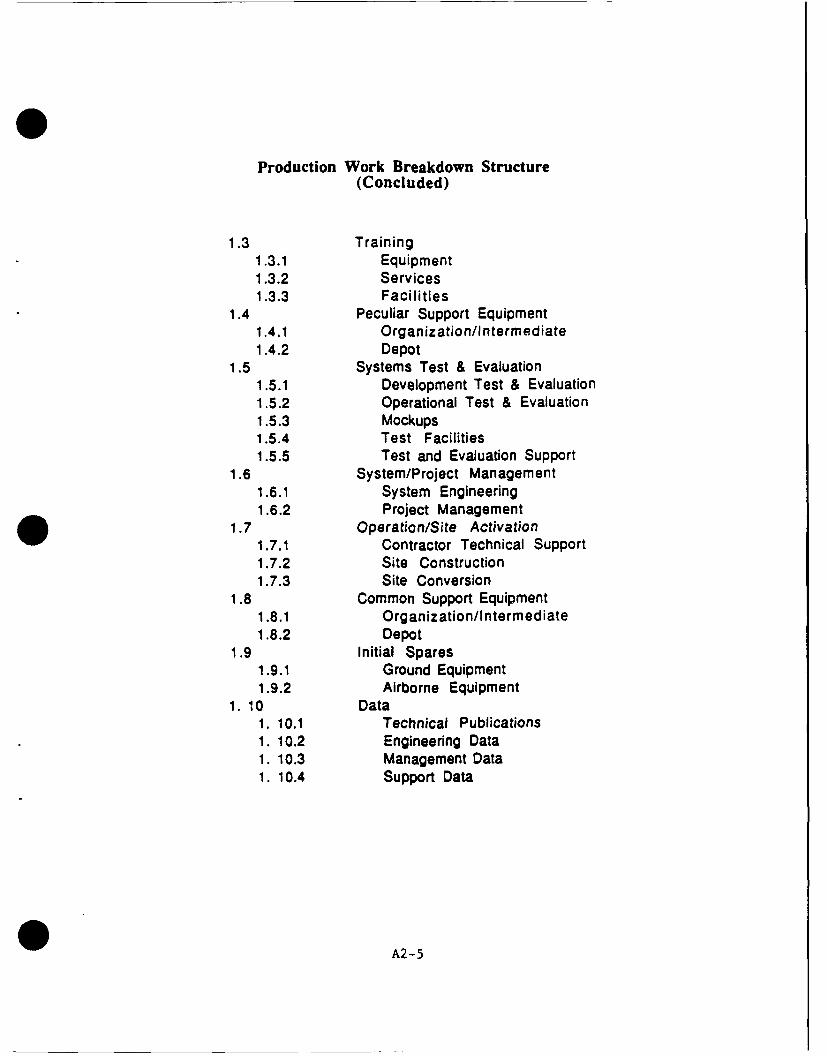
Production Work Breakdown Structure(Concluded)
1.3 Training1.3.1 Equipment1.3.2 Services1.3.3 Facilities
1.4 Peculiar Support Equipment1.4.1 Organization/Intermediate1.4.2 Depot
1.5 Systems Test & Evaluation1.5.1 Development Test & Evaluation1.5.2 Operational Test & Evaluation1.5.3 Mockups1.5.4 Test Facilities1.5.5 Test and Evaluation Support
1.6 System/Project Management1.6.1 System Engineering1.6.2 Project Management
1.7 Operation/Site Activation1.7.1 Contractor Technical Support1.7.2 Site Construction1.7.3 Site Conversion
1.8 Common Support Equipment1.8.1 Organization/I ntermediate1.8.2 Depot
1.9 Initial Spares1.9.1 Ground Equipment1.9.2 Airborne Equipment
1. 10 Data1. 10.1 Technical Publications1. 10.2 Engineering Data1. 10.3 Management Data1. 10.4 Support Data
A2-5
APPENDIX 3
Candidate Airborne Block Diagrams
by D. K. Snodgrass
AM-
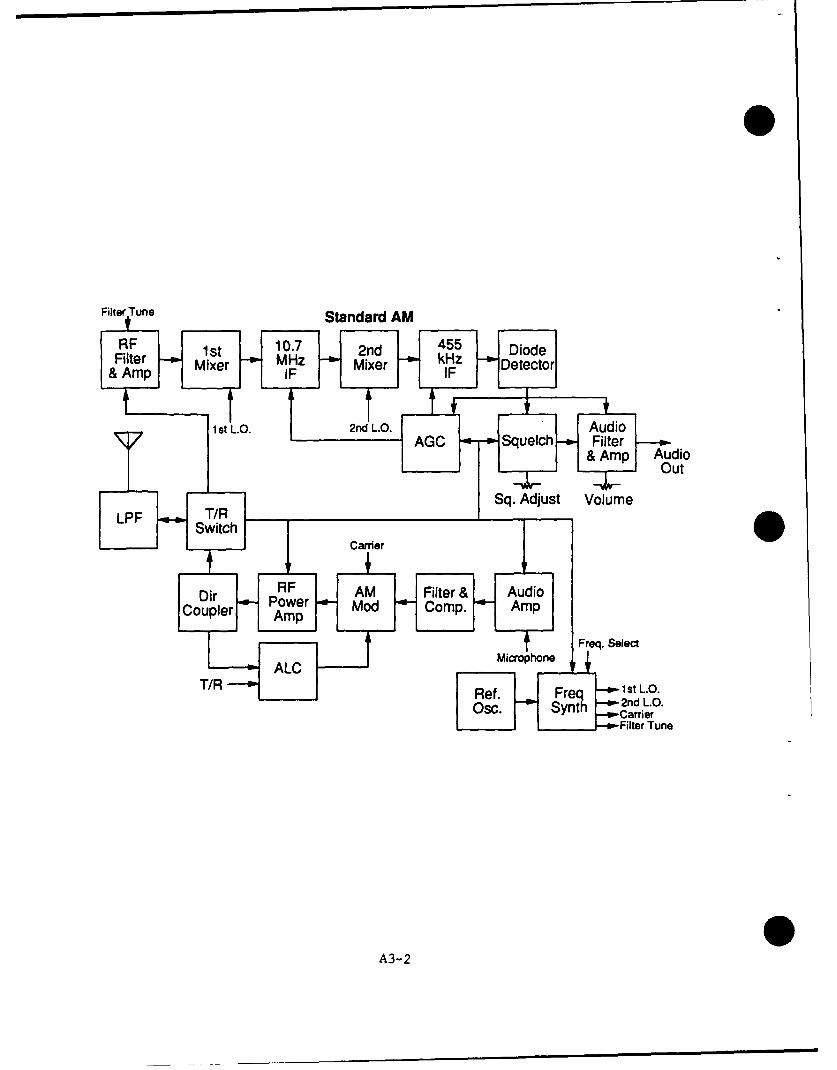
Filt~uneStandard AM
& Amp Audio
Sq. Adjust ele
LPF T/RS witc Synar2neLr
ir FIF ~A3 ile & Aui
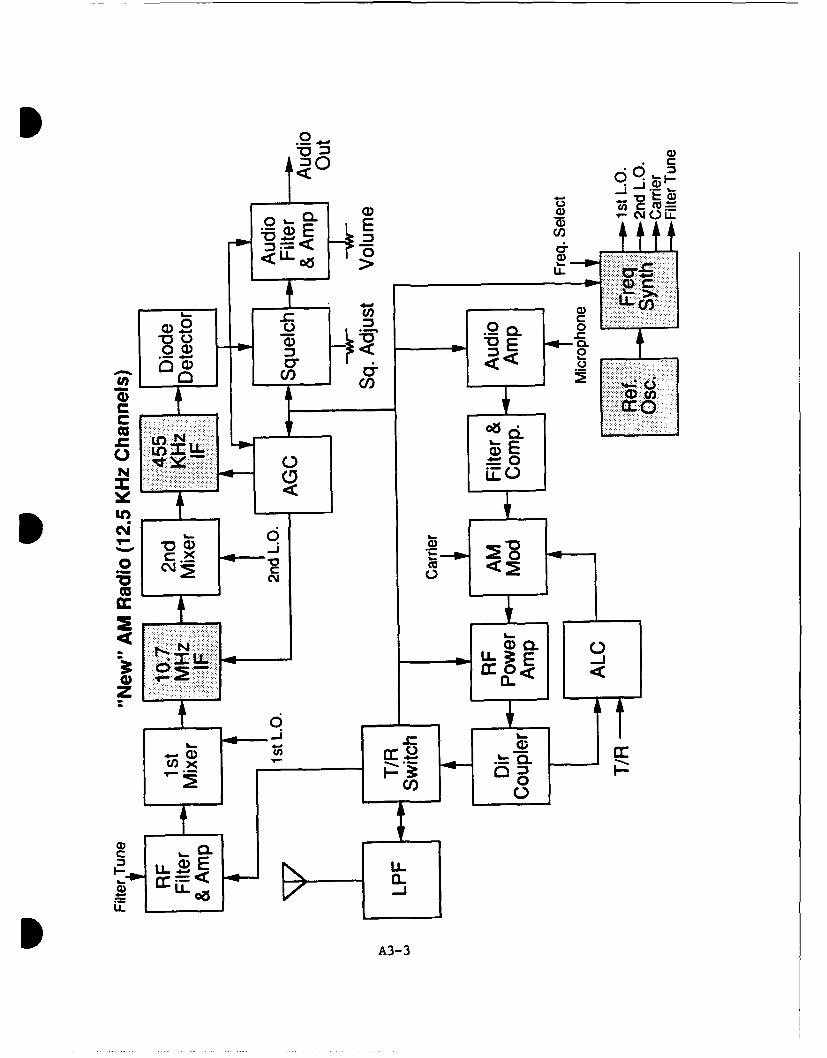
-aa)
< z1t>
*< <
1C/
aI
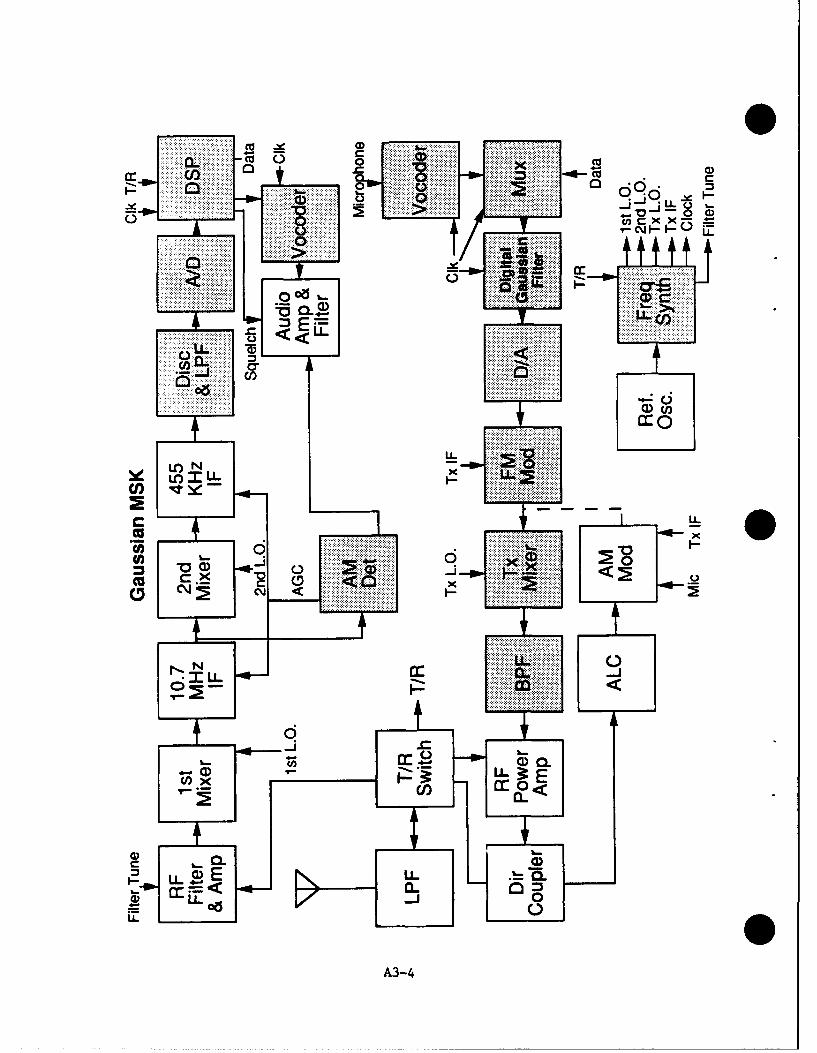
U) cc
........ LL '0 a
0CJI co
CLL
* Icno_~( I-
i ...- ..
LL-
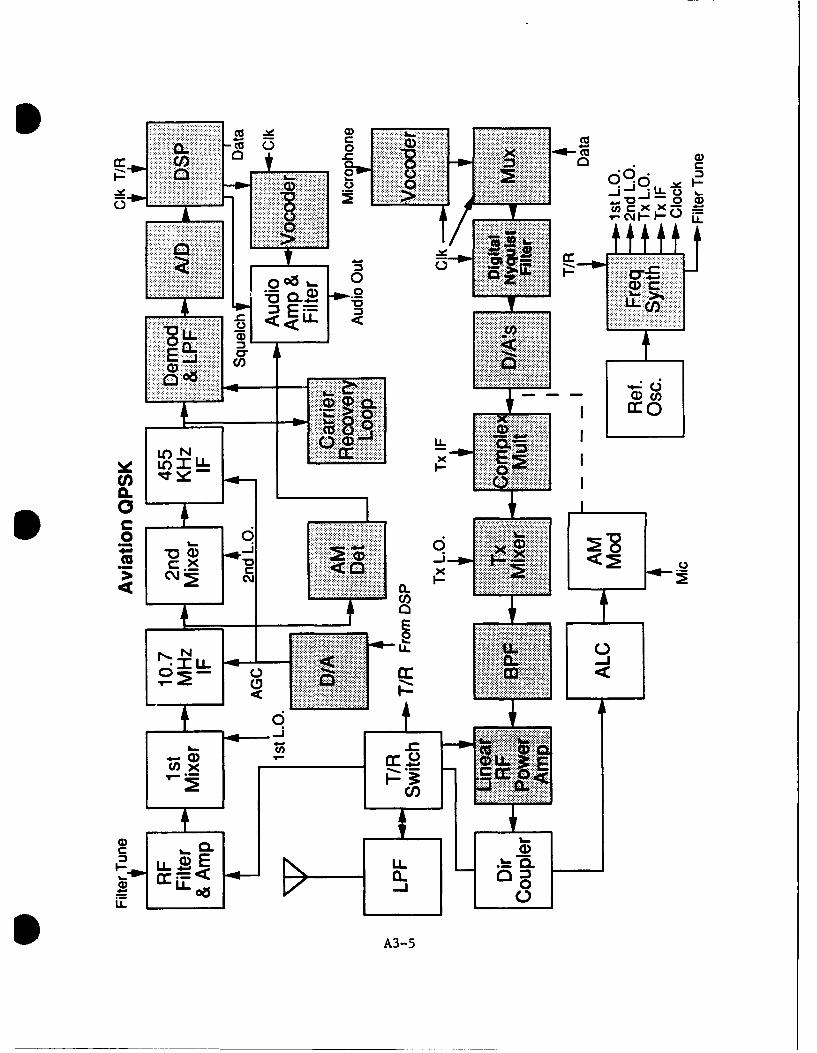
CL ....... caR-wL
LLLL
006 0
a,
S r
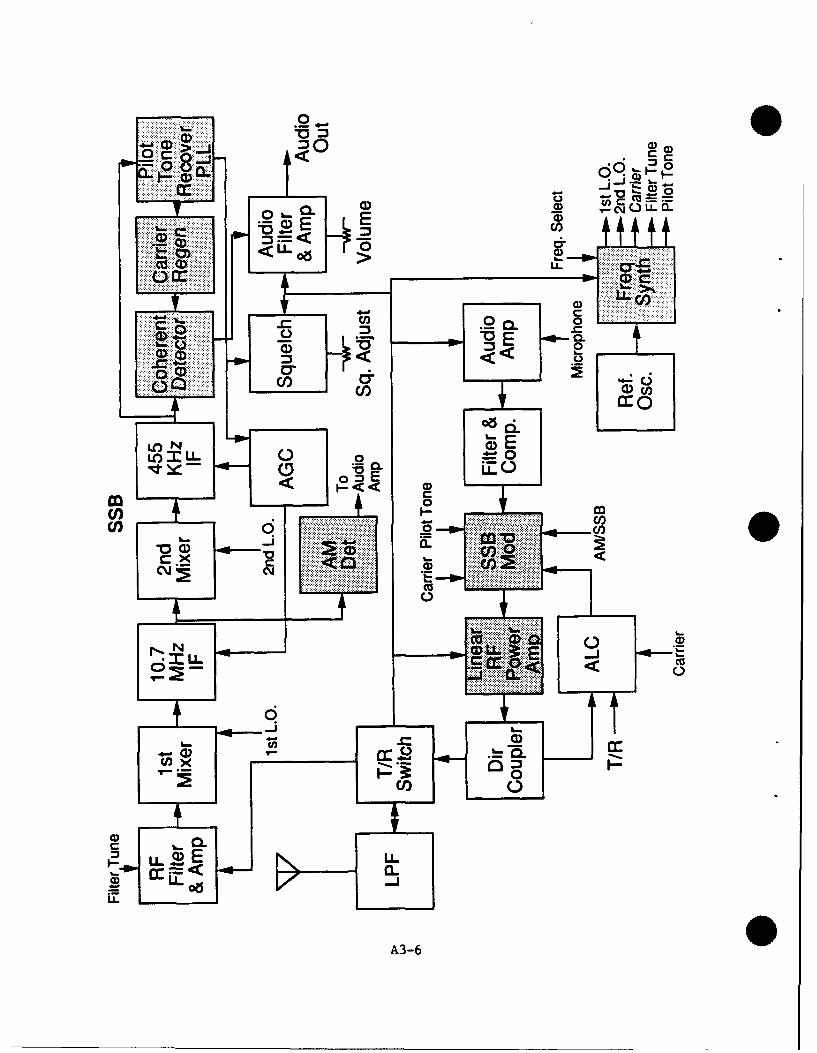
0 o4~
0 CLO.
< UU
*~LL LL
-0 0
(D. 75
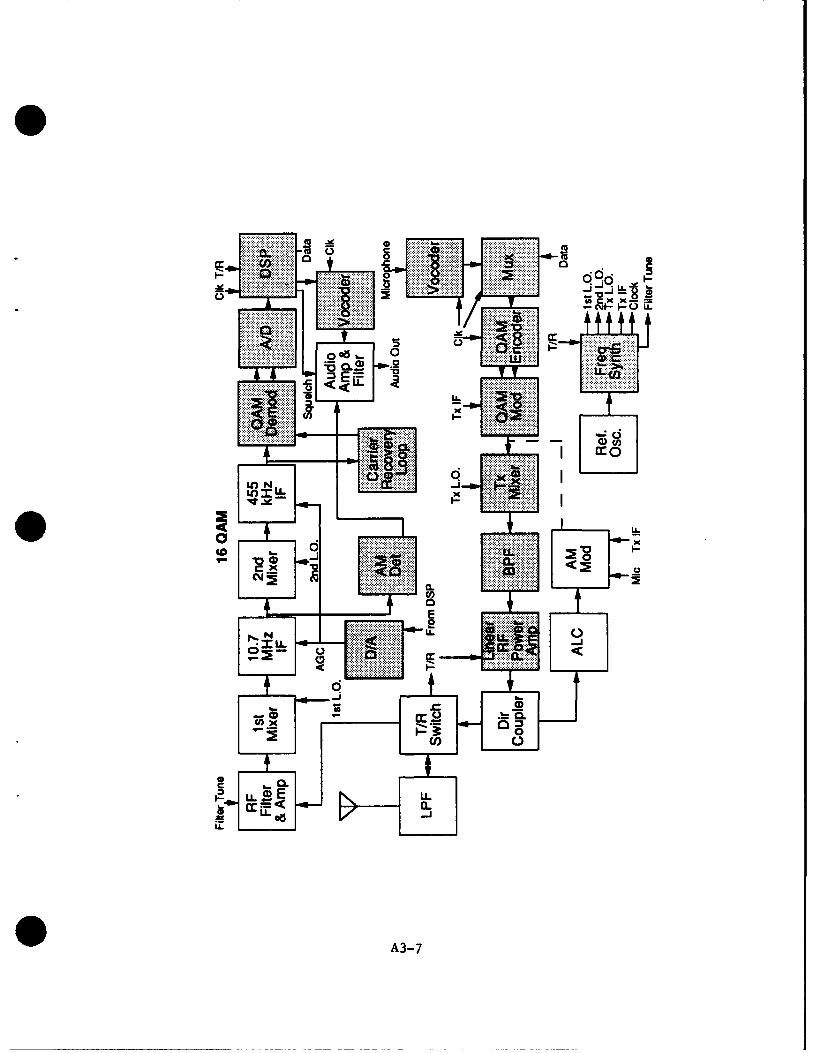
...... ...........
....... ........ ... ... ..................... ......x x_ .. ............ .................. ...................... I ...... ....................
C49 9 LL
X. LA.
006-:x ......a) .2
iL...................... U _ ............ ...
.................x X
LO NU_Lo
CD
CM X...........
P, LL.MLL
CD cc oh 06x p 3 on
0
CO
CL
LL Ecr
U_a.U.
LL
A3-7
APPENDIX 4
Block Diagrams Used in Cost Estimatesfor Ground Radios
by D. K. Snodgrass
A4-1
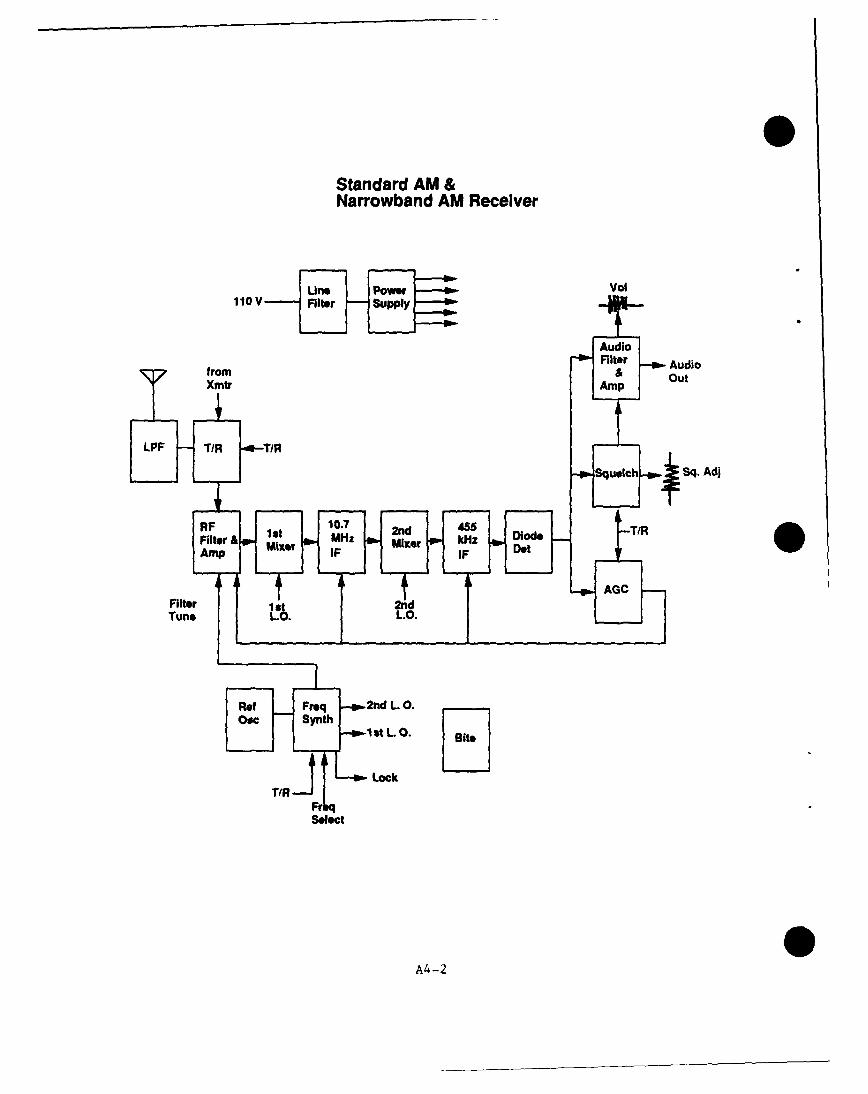
Standard AM &Narrowband AM Receiver
Uo POW Vol110 V-Fle-Spy 41,
AudioFilter Audio
frm& OutXmtr
Am
OPF - TIR TR _ .S ul h - q d
__L -- -0Filter 2n
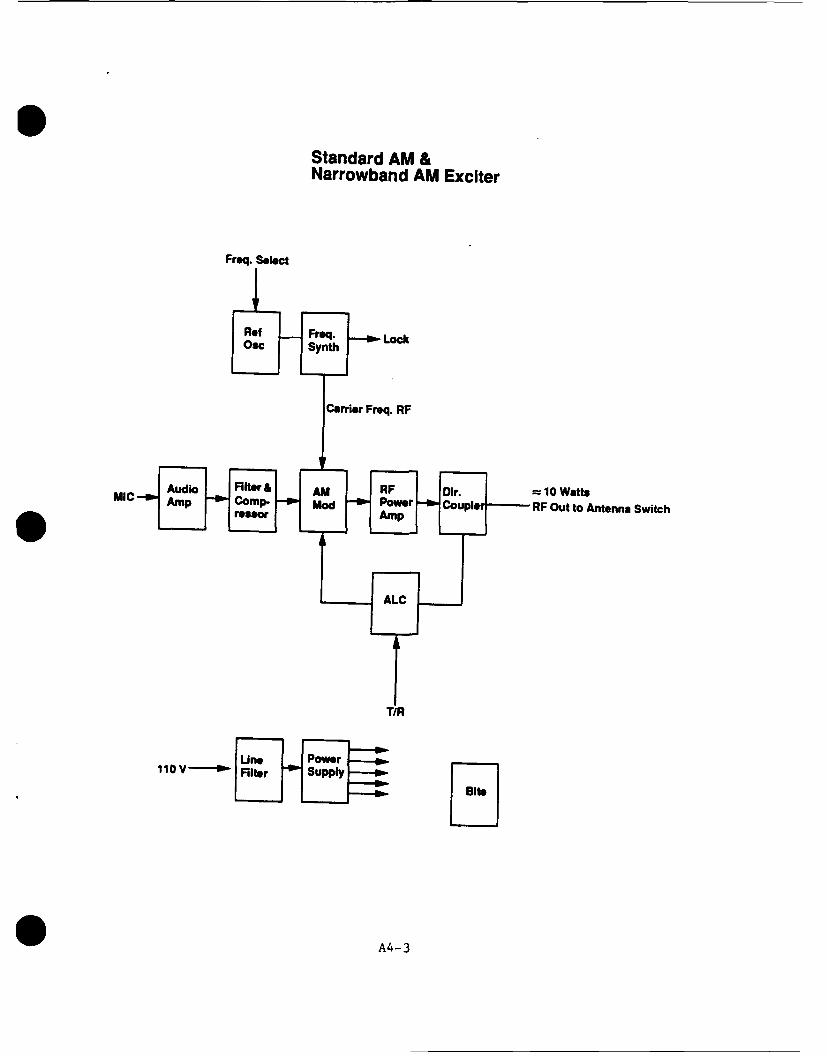
Standard AM &Narrowband AM Exciter
Freq. Select
Ref -Freq. -a LockQec Synth
Carrier Freq. RF
MIC Ap Comp. -o _Mo Power -,Coupler RF Out to Antenna Switch
Une Power110V* Filte SUF]
SA4 -3
New AM Radio 12.5 kHz Channel Spacing
Same block diagram as "old" AM radio.
10.7 MHz IF Filter and 455 kl-z 2nd IF filters nave narrower bandwidth and betterselectivity (more sections) to allow closer channel spacing.
Synthesizer operates with a 12.5 kHz reference and has better phase noisecharacteristics. Reference is more stable than old radio (- ± 5ppm). Second L.O. is alsorequired to be more stable - may have to be locked to references.
To be backward compatible with old system, a second AM detector may benecessary.
A4-4
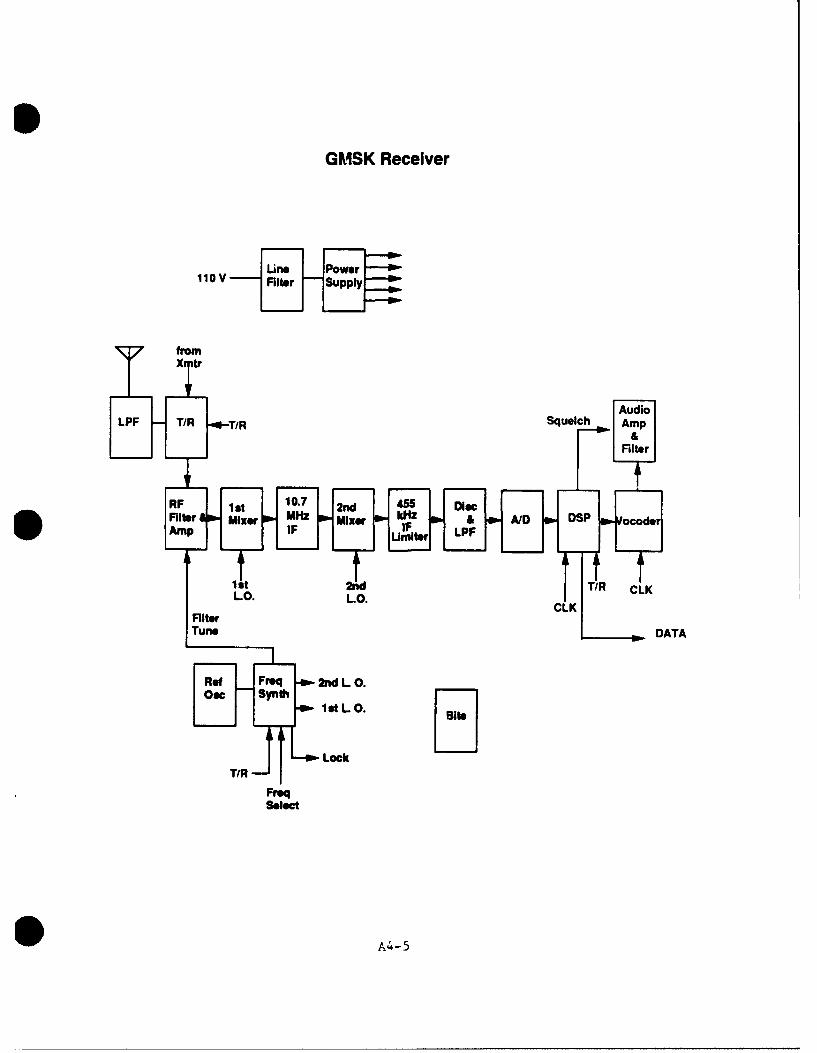
GMSK Receiver
Lie Power11i V Fitroupl
fromX t,
Audio
Filter Mie I1zW ie i AID DISP ocoder
LO. L.O.CLKK
Turw DATA
Rof Freq -s-2nd L. 0
le- t L 0. st
Lock
Freq
A4 -5
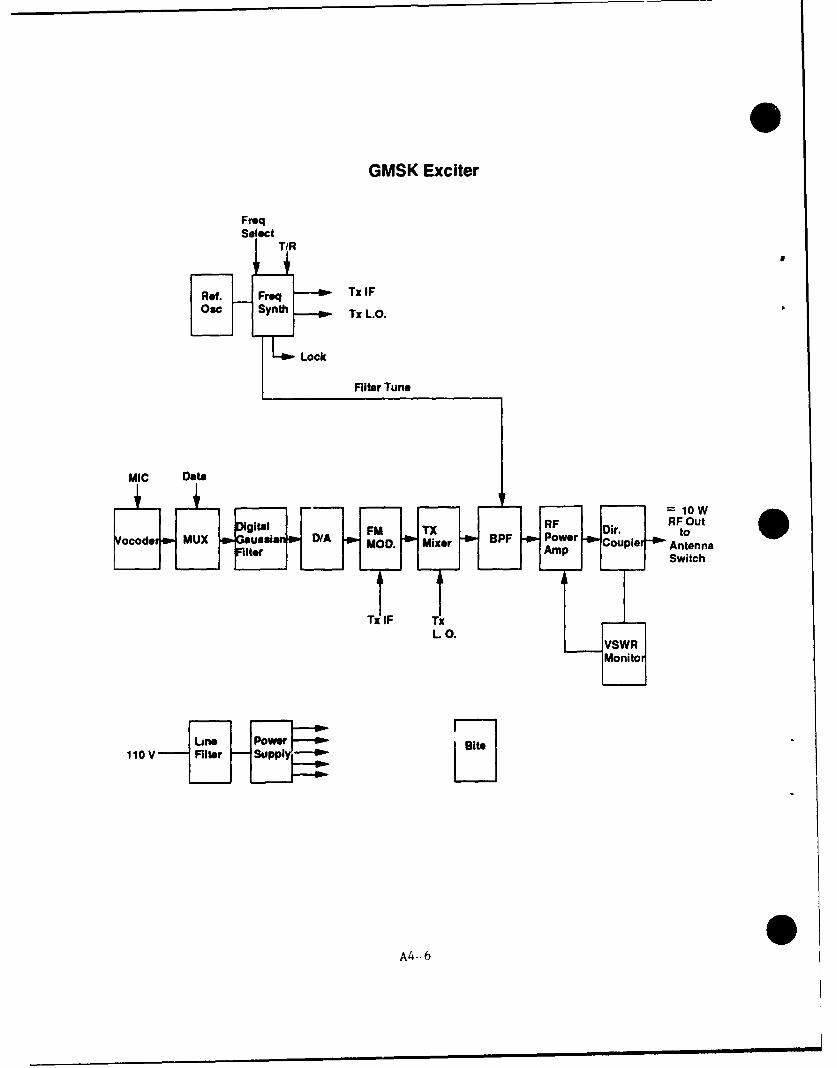
GMSK Exciter
FreqSelect
T/R
Ref. Freq Tx IFOswc Synth~ Tx L.O.
Lock
Filter Tune
ooe MUX uselana D/A -a.Moo. Mixer -w BPF -a.Power -,Coupler-Antnn
Switch
L 0.
Line Power
110OV Filter Supply ~
A4--6
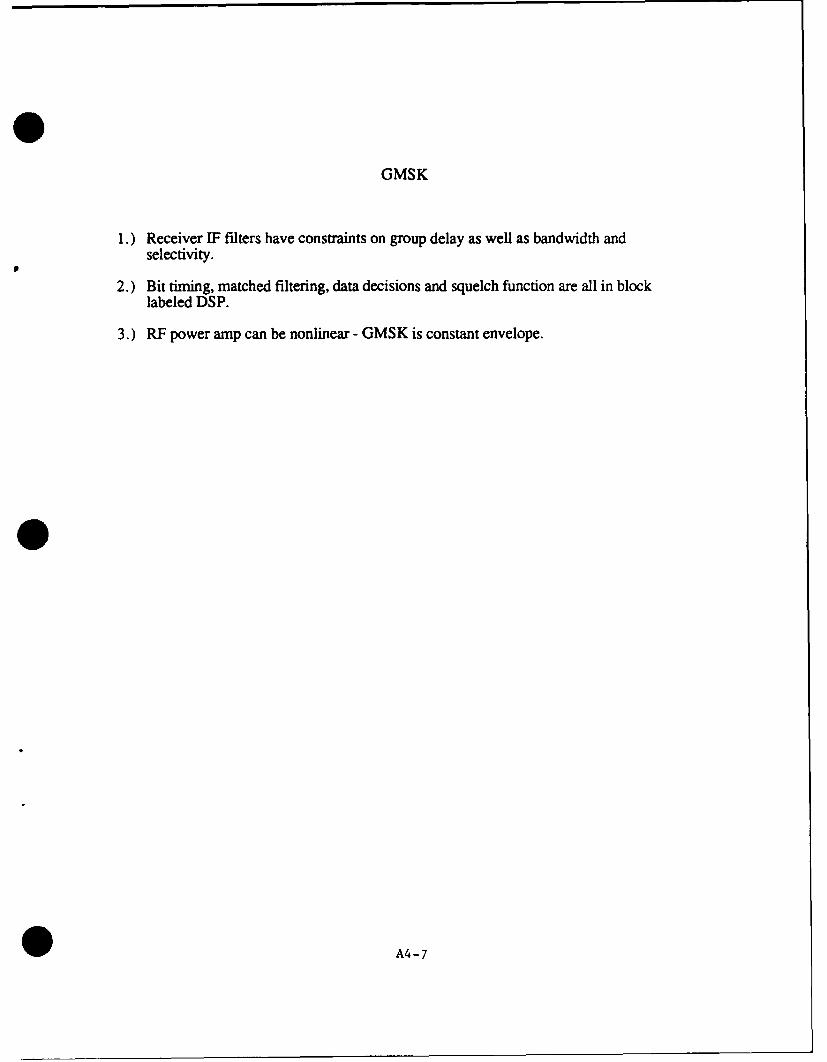
GMSK
1.) Receiver IF filters have constraints on group delay as well as bandwidth andselectivity.
2.) Bit timing, matched filtering, data decisions and squelch function are all in blocklabeled DSP.
3.) RF power amp can be nonlinear - GMSK is constant envelope.
A4-7
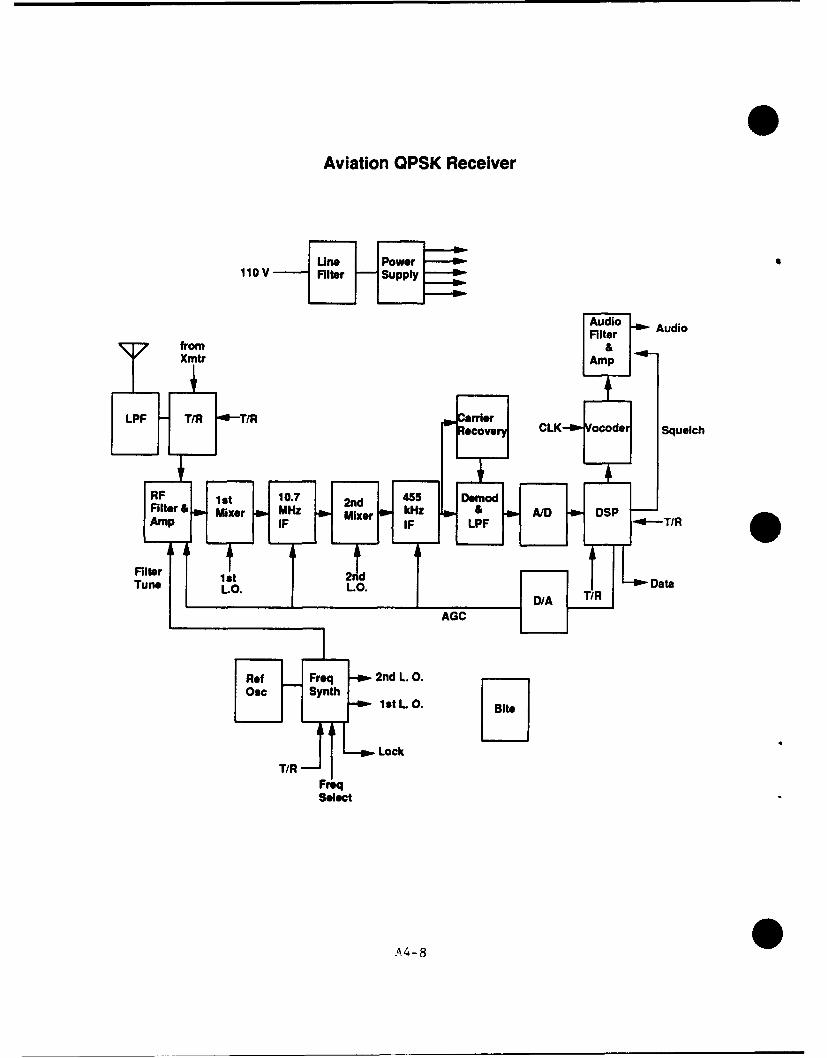
Aviation QPSK Receiver
ue Power11i VFitroupl
Audio -O-AudioFilter
from &Xmtr Amp
eoe CLK ocode Squelch
Amp IFIF LPFamT/R
Seet
A/ 4-8
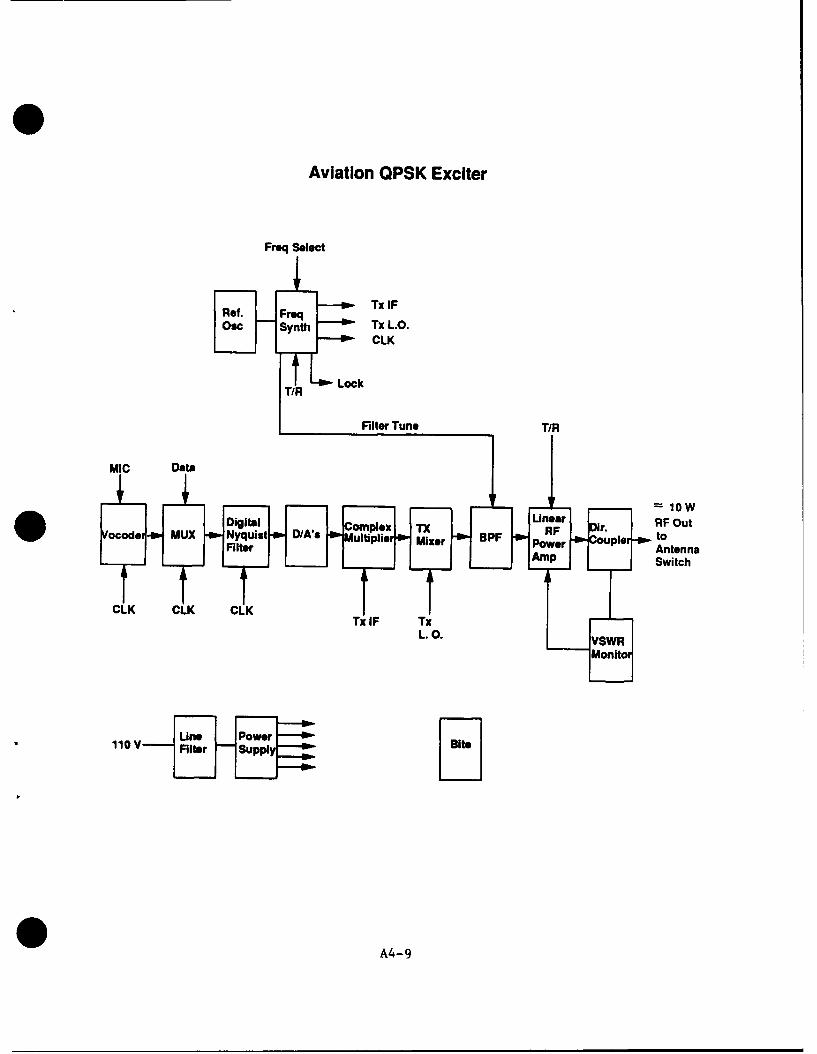
Aviation QPSK Exciter
Freq Select
Oso Synth Tx L.O.
LLockCLK
T/R Lc
FilterAntenna/
* iloy Suow
A4-a 9FOu
Aviation QPSK
1.) Receiver IF filters have constraints on group delay as well as bandwidth andselectivity.
2.) Bit timing, matched filtering, data decisions and squelch function are all in blocklabeled DSP.
3.) RF power amp must be fairly linear.
4.) Receiver linearity?
A4-10
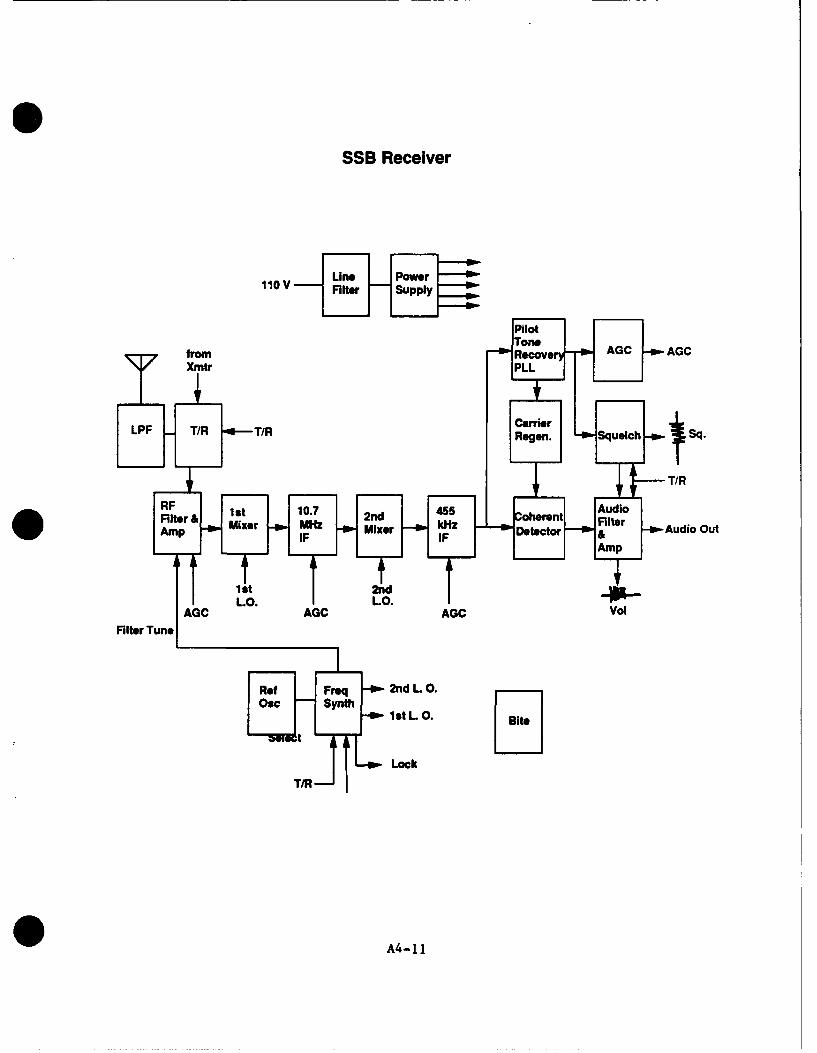
SSB Receiver
110V Fitr Spl
fromoe AGC AGC
*Flt 1. 5 Audio Ou
T LO.
OscA4 -11nt
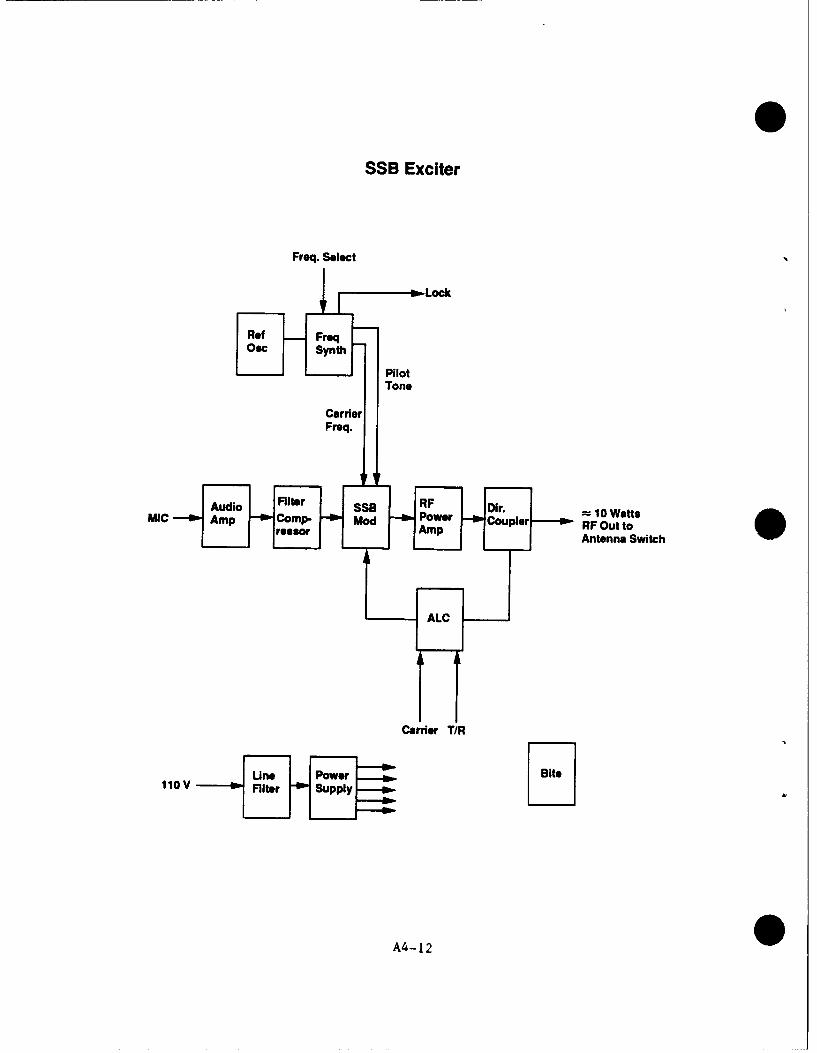
SSB Exciter
Freq. Select
Tone
A~efFreq.
Antnn Switc
owter RFit
ALCW
A4-12
SSB
1.) 10.7 and 455 kHz IF filters very narrow and with very sharp selectivity to achievechannel spacing.
2.) RF PA must be very linear - probably most stringent linearity requirements of allsystems considered.
3.) Pilot tone recovery and SSB modulation both relatively complex signal processors.
A4-13
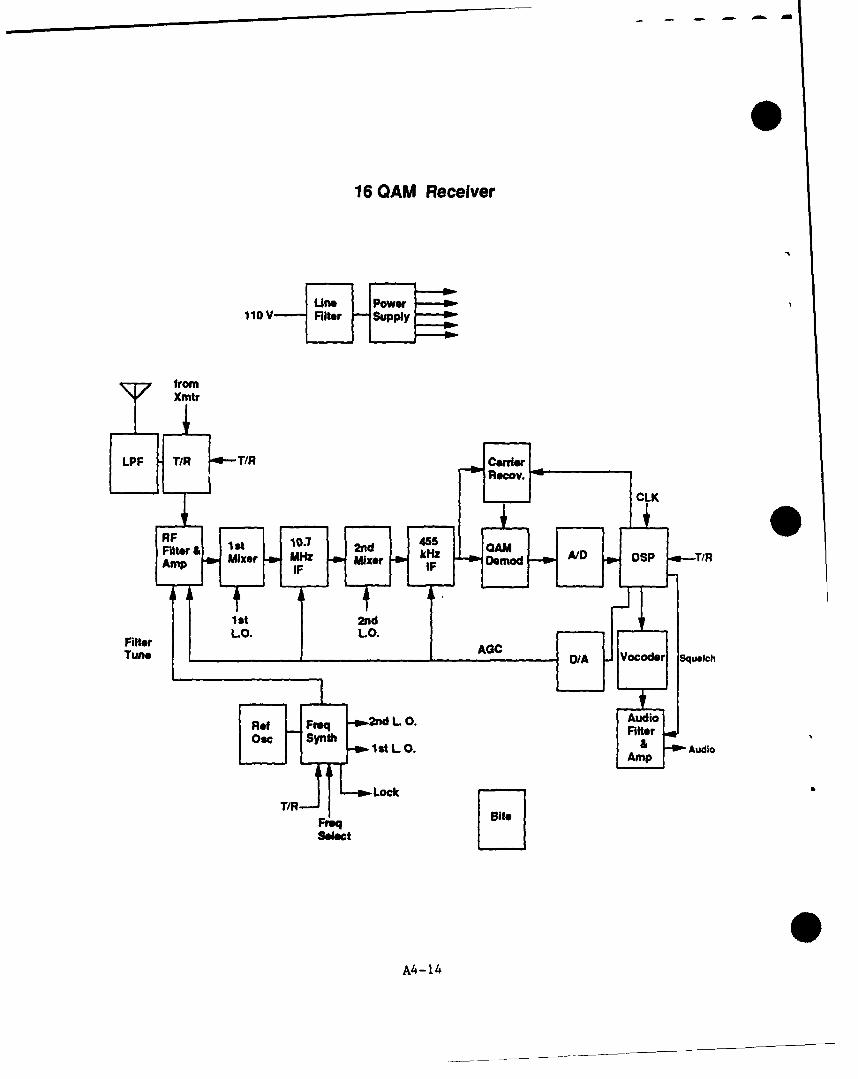
- - -As
16 QAM Receiver
Uns PowerI 10 V Fltr Spl
fromXmtr
Mixer MHz Mixe Dejmjd AID DSP T/R
Tune D/1AY coder Squelch
-*.end H .Aui
Rot ~ ~ A -14 ile
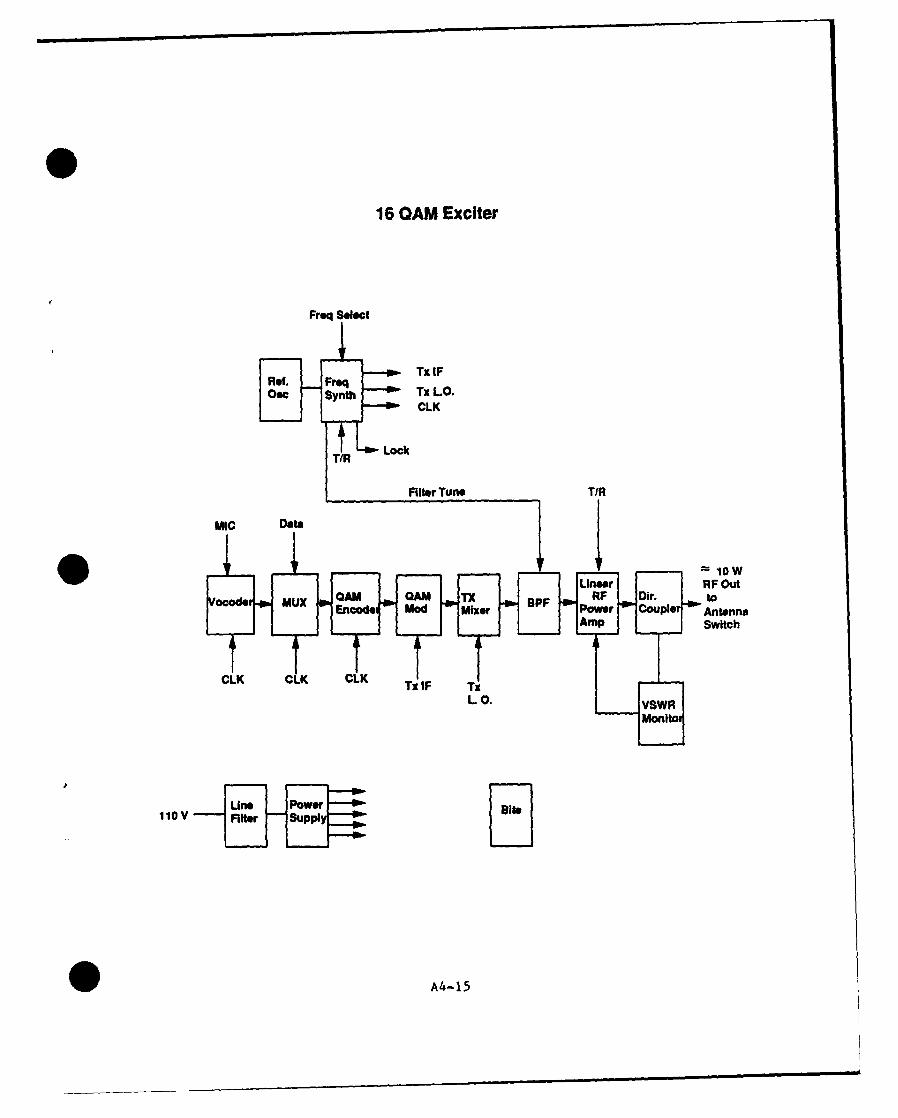
150OAM Exciter
Fr~q Select
Ref. FreqTxIOo Synth Tx LO.
CLK
T/R Lock
Filwer CTupl Antn
L L0.
R u
OA X F Dy. t
ocode ~ ~ A4 15 w P rCu
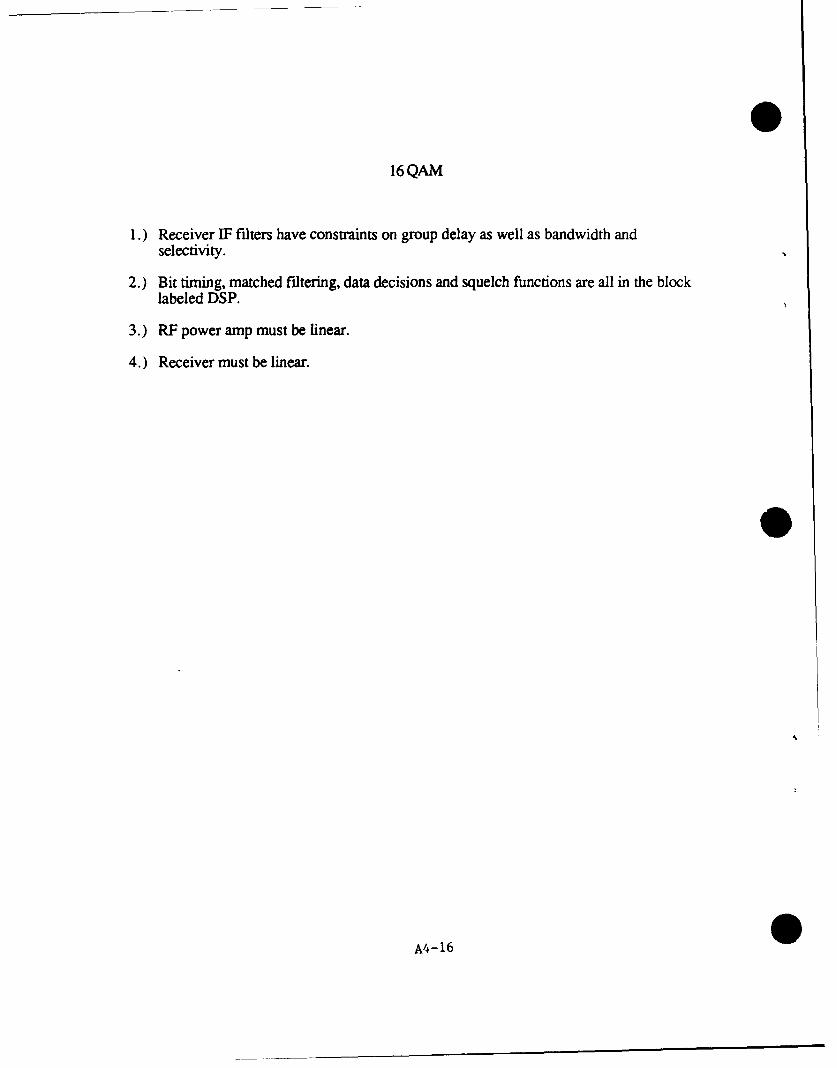
16QAM
1.) Receiver IF filters have constraints on group delay as well as bandwidth andselectivity.
2.) Bit timing, matched filtering, data decisions and squelch functions are all in the block
labeled DSP.
3.) RF power amp must be linear.
4.) Receiver must be linear.
A
A4 -16
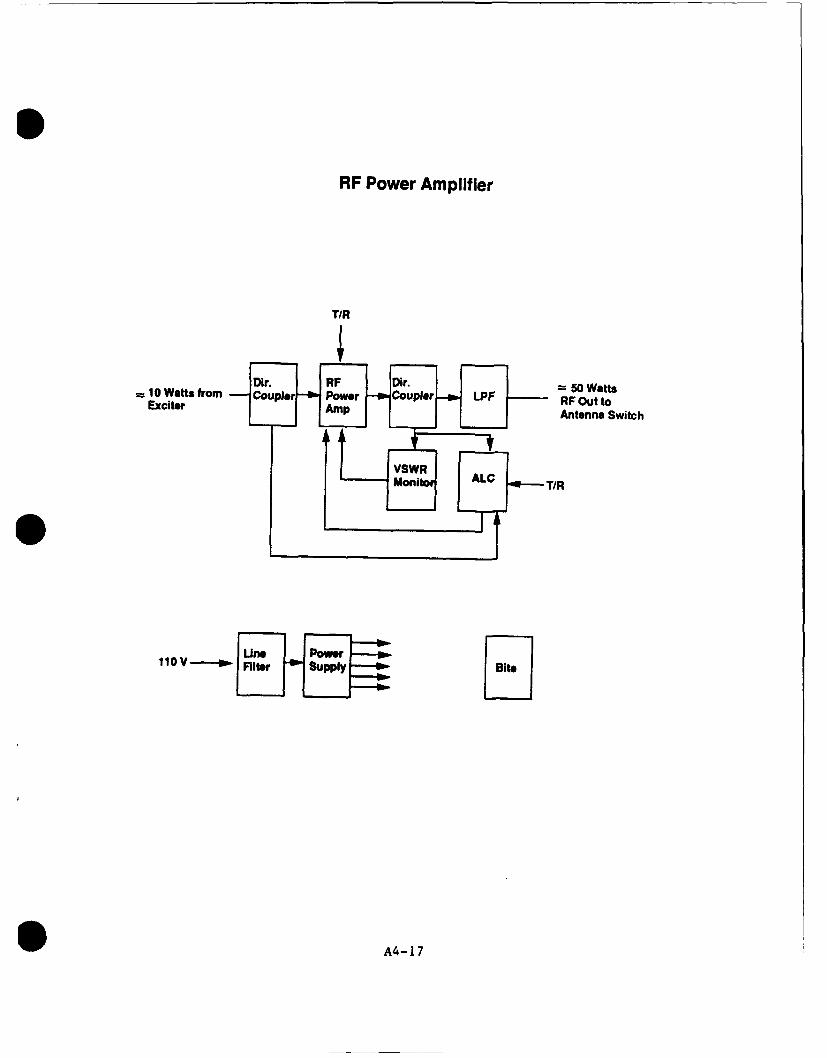
RIF Power Amplifier
T/R
10 Watts from Coupletr-O Power -4-Coupler -.. LPF RF Out toExciter ApAntenna Switch
Une Pwer110lt-er supl Bt
S41
VOLUMES 1 AND 2 GLOSSARY
A-A - Air - AirADS - Automatic Dependent SurveillanceACF - Area Control FacilityAFB - Air Force BaseA-G - Air - GroundALC - Automatic Level ControlAMSS - American Mobile Satellite ServiceAM - Analog ModulationA-QPSK - Aviation QPSKARTCC - Air Route Traffic Control CenterASK -- Amplitude Shift KeyingATC - Air Traffic ControlATN - Aeronautical Telecommunications NetworkAWGN - Additive White Gaussian Noise
BCH - Bose-Chaudhuri-HocquenhemBER - bit error rateBLOS - Beyond Line of SightBPSK - Binary Phase Shift Keying
CAASD - Center for Advanced Aviation System DevelopmentCDMA - Code Division Multiple AccessCELP - Code Excited Linear PredictorCGMS - CTAG Ground Master SwitchC/I - Carrier to InterferenceC/N - Carrier to NoiseCONUS - Contiguous United StatesCTAG - Cellular Trunked Air Ground
DS - Direct SequenceDSBTC - Double Side Band Transmitted CarrierDSBSC - Double Side Band Suppressed CarrierDSPN - Direct Sequence Pseudo Noise
EIRP - Effective Isotropic Radiated Power
FAA - Federal Aviation AdministrationFASTE - Freiman Analysis of Systems Techniques EquipmentFDM - Frequency Division MultiplexedFDMA - Frequency Division Multiple AccessFH - Frequency HoppingFM - Frequency ModulationFSK - Frequency Shift Keying
GL-1
VOLUMES 1 AND 2 GLOSSARY(Continued)
GA - General AviationG-G - Ground - GroundGMSK - Gaussian Minimum Shift Keying
lAW - In Accordance WithID - IdentityISO - International Standards Organization
LOS - Line of Sight
M/E - Message/EmergencyMSK - Minimum Shift KeyingMSR - MITRE Sponsored Research
NAS - National Airspace SystemNBFM - Narrow Band Frequency Modulation
OQAM - Offset Quadrature Amplitude Shift KeyingOSI - Open Systems InterconnectionOTS - Off the Shelf
PN - Pseudo NoisePSK - Phase Shift KeyingPSTN - Public Switched Telephone NetworkPTF - Push to Talk
QAM - Quadrature Amplitude ModulationQPSK - Quadrature Phase Shift Keying
RAPCON - Radar Approach ControlRCAG - Remote Control Air-GroundRCO - Remote Communications OutletRF - Radio FrequencyRTT - Round Trip TimingRx - Receiver
S/I - Signal to InterferenceS/N - Signal to NoiseSNR - Signal-to-Noise RatioSSB - Single Side Band
TBD - To Be DeterminedTCM - Trellis Coded Modulation
GL-2
VOLUMES 1 AND 2 GLOSSARY(Concluded)
TDM - Time Division MultiplexedTDMA - Time Division Multiple AccessTRACON - Terminal Radar Approach ControlTx - Transmitter
V/D - Voice/DataVSB - Vestigial Side Band
WBS - Work Breakdown Structure
SI
VOLUMES 1 AND 2 DISTRIBUTION LIST
A010 D090
R. D. Haggarty L. S. MetzgerC. J. WhitingD03
A030N. D. Hulkower
R. W. Jacobus R. A. Pomponi
D050 D095
R. A. McCown R. G. BlandR. I. Millar G. H. NaditchE. A. Palo K. WickwireE. N. SkoogD10W. J. WilsonD10
D053 T. A. Reed
C-H. Chen F010. C. H. HarrisM. Leiter J. J. FearnsidesJ. L. Ramsey R. M. Harris
D057 F040
A. J. Graff L. G. CuihaneA. S. Margulies R. A. RuckerB. E. White (10) F080
D059 R. BraffR. W. Davis D. J. ChadwickH. Gong A. A. ElSawyM. L. Kuras J.5S. MatfleyR. D. Sakamoto R. 3. RaveraG. R. Strohmeyer
DL-1I
VOLUMES 1 AND 2 DISTRIBUTION LIST(Concluded)
F085
L. del Cid (25)K. L. CrockerJ. E. DieudonneS. M. ElnoubiR. L. RichardsA. J. Steger
F087
J. C. Moody, Jr.
F088
C. A. Shively
M. J. Zeltser
DL- 2