Embed Size (px)
Citation preview
ADAMA Ltd. Full Content of the Third Quarter Report 2020
1
ADAMA LTD.
THIRD QUARTER REPORT 2020
ADAMA Ltd. (hereinafter referred to as “the Company”) is a global leader in crop protection,
providing solutions to farmers across the world to combat weeds, insects and disease.
ADAMA has one of the widest and most diverse portfolios of active ingredients in the world,
state-of-the art R&D, manufacturing and formulation facilities, together with a culture that
empowers our people in markets around the world to listen to farmers and ideate from the
field. This uniquely positions ADAMA to offer a vast array of distinctive mixtures, formulations
and high-quality differentiated products, delivering solutions that meet local farmer and
customer needs in over 100 countries globally.
Please see important additional information and further details included in the Annex.
October 2020
ADAMA Ltd. Full Content of the Third Quarter Report 2020
2
Section I - Important Notice
The Company’s Board of Directors, Board of Supervisors, directors, supervisors and
senior managers confirm that the content of the Report is true, accurate and complete
and contains no false statements, misleading presentations or material omissions,
and assume joint and several legal liability arising therefrom.
Ignacio Dominguez, the person leading the Company (President and Chief Executive
Officer) as well as its legal representative, and Aviram Lahav, the person leading the
accounting function (Chief Financial Officer & Deputy Chief Executive Officer), hereby
assert and confirm the truthfulness, accuracy and completeness of the Financial
Report.
All of the Company’s directors attended the board meeting for the review of this
Report.
This Report and its abstract have been prepared in both Chinese and English. Should
there be any discrepancy between the two versions, the Chinese version shall prevail.
ADAMA Ltd. Full Content of the Third Quarter Report 2020
3
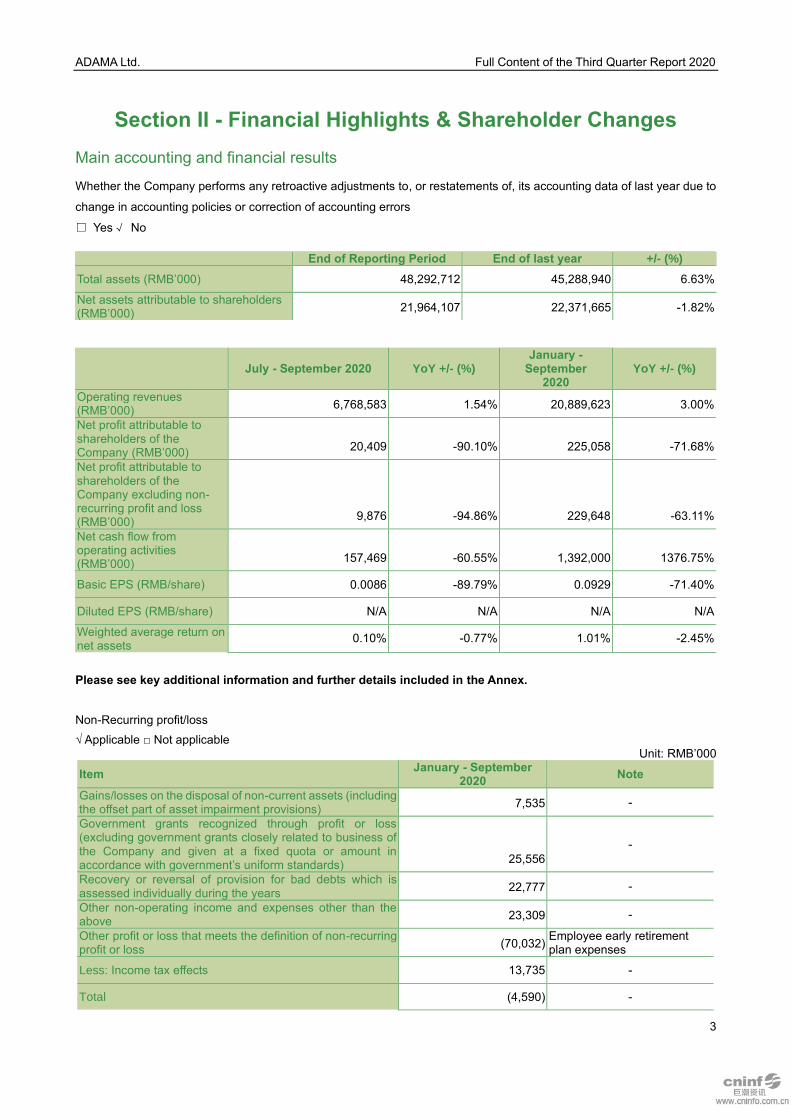
Section II - Financial Highlights & Shareholder Changes
Main accounting and financial results
Whether the Company performs any retroactive adjustments to, or restatements of, its accounting data of last year due to
change in accounting policies or correction of accounting errors
□ Yes√ No
End of Reporting Period End of last year +/- (%)
Total assets (RMB’000) 48,292,712 45,288,940 6.63%
Net assets attributable to shareholders (RMB’000)
21,964,107 22,371,665 -1.82%
July - September 2020 YoY +/- (%) January -
September 2020
YoY +/- (%)
Operating revenues (RMB’000)
6,768,583 1.54% 20,889,623 3.00%
Net profit attributable to shareholders of the Company (RMB’000)
20,409 -90.10% 225,058 -71.68%
Net profit attributable to shareholders of the Company excluding non-recurring profit and loss (RMB’000)
9,876 -94.86% 229,648 -63.11%
Net cash flow from operating activities (RMB’000)
157,469 -60.55% 1,392,000 1376.75%
Basic EPS (RMB/share) 0.0086 -89.79% 0.0929 -71.40%
Diluted EPS (RMB/share) N/A N/A N/A N/A
Weighted average return on net assets
0.10% -0.77% 1.01% -2.45%
Please see key additional information and further details included in the Annex.
Non-Recurring profit/loss
√ Applicable □ Not applicable Unit: RMB’000
Item January - September
2020 Note
Gains/losses on the disposal of non-current assets (including the offset part of asset impairment provisions)
7,535 -
Government grants recognized through profit or loss (excluding government grants closely related to business of the Company and given at a fixed quota or amount in accordance with government’s uniform standards)
25,556
-
Recovery or reversal of provision for bad debts which is assessed individually during the years
22,777 -
Other non-operating income and expenses other than the above
23,309 -
Other profit or loss that meets the definition of non-recurring profit or loss
(70,032) Employee early retirement plan expenses
Less: Income tax effects 13,735 -
Total (4,590) -
ADAMA Ltd. Full Content of the Third Quarter Report 2020
4
Explanation of why the Company classified an item as non-recurring profit/loss according to the definition in the First Explanatory Announcement on Information Disclosure for Companies Offering their Securities to the Public. Non-recurring Profit and Loss, and reclassified any non-recurring profit/loss items are given as examples in the said explanatory announcement to recurrent profit/loss
□ Applicable √ Not applicable
No such cases in the Reporting Period.
ADAMA Ltd. Full Content of the Third Quarter Report 2020
5
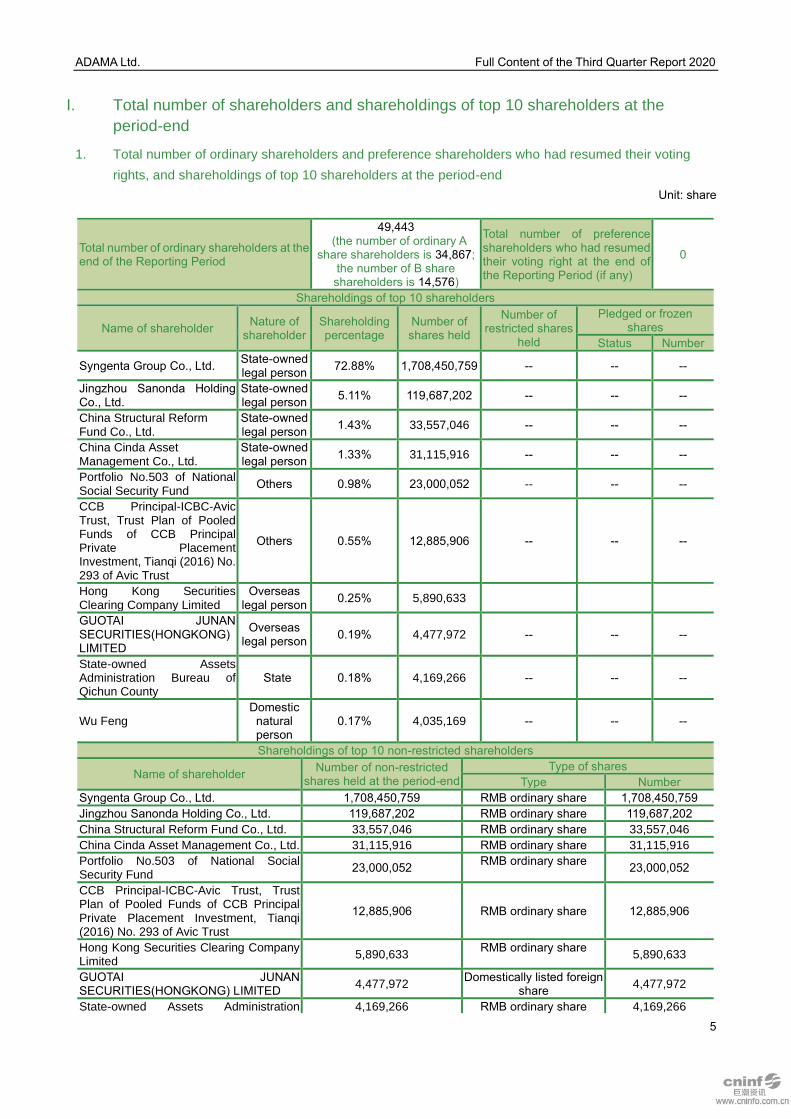
I. Total number of shareholders and shareholdings of top 10 shareholders at the
period-end
1. Total number of ordinary shareholders and preference shareholders who had resumed their voting
rights, and shareholdings of top 10 shareholders at the period-end
Unit: share
Total number of ordinary shareholders at the end of the Reporting Period
49,443 (the number of ordinary A
share shareholders is 34,867; the number of B share shareholders is 14,576)
Total number of preference shareholders who had resumed their voting right at the end of the Reporting Period (if any)
0
Shareholdings of top 10 shareholders
Name of shareholder Nature of
shareholder Shareholding percentage
Number of shares held
Number of restricted shares
held
Pledged or frozen shares
Status Number
Syngenta Group Co., Ltd. State-owned legal person
72.88% 1,708,450,759 -- -- --
Jingzhou Sanonda Holding Co., Ltd.
State-owned legal person
5.11% 119,687,202 -- -- --
China Structural Reform Fund Co., Ltd.
State-owned legal person
1.43% 33,557,046 -- -- --
China Cinda Asset Management Co., Ltd.
State-owned legal person
1.33% 31,115,916 -- -- --
Portfolio No.503 of National Social Security Fund
Others 0.98% 23,000,052 -- -- --
CCB Principal-ICBC-Avic Trust, Trust Plan of Pooled Funds of CCB Principal Private Placement Investment, Tianqi (2016) No. 293 of Avic Trust
Others 0.55% 12,885,906 -- -- --
Hong Kong Securities Clearing Company Limited
Overseas legal person
0.25% 5,890,633
GUOTAI JUNAN SECURITIES(HONGKONG) LIMITED
Overseas legal person
0.19% 4,477,972 -- -- --
State-owned Assets Administration Bureau of Qichun County
State 0.18% 4,169,266 -- -- --
Wu Feng Domestic
natural person
0.17% 4,035,169 -- -- --
Shareholdings of top 10 non-restricted shareholders
Name of shareholder Number of non-restricted
shares held at the period-end
Type of shares
Type Number
Syngenta Group Co., Ltd. 1,708,450,759 RMB ordinary share 1,708,450,759
Jingzhou Sanonda Holding Co., Ltd. 119,687,202 RMB ordinary share 119,687,202
China Structural Reform Fund Co., Ltd. 33,557,046 RMB ordinary share 33,557,046
China Cinda Asset Management Co., Ltd. 31,115,916 RMB ordinary share 31,115,916
Portfolio No.503 of National Social Security Fund
23,000,052 RMB ordinary share
23,000,052
CCB Principal-ICBC-Avic Trust, Trust Plan of Pooled Funds of CCB Principal Private Placement Investment, Tianqi (2016) No. 293 of Avic Trust
12,885,906 RMB ordinary share 12,885,906
Hong Kong Securities Clearing Company Limited
5,890,633 RMB ordinary share
5,890,633
GUOTAI JUNAN SECURITIES(HONGKONG) LIMITED
4,477,972 Domestically listed foreign
share 4,477,972
State-owned Assets Administration 4,169,266 RMB ordinary share 4,169,266
ADAMA Ltd. Full Content of the Third Quarter Report 2020
6
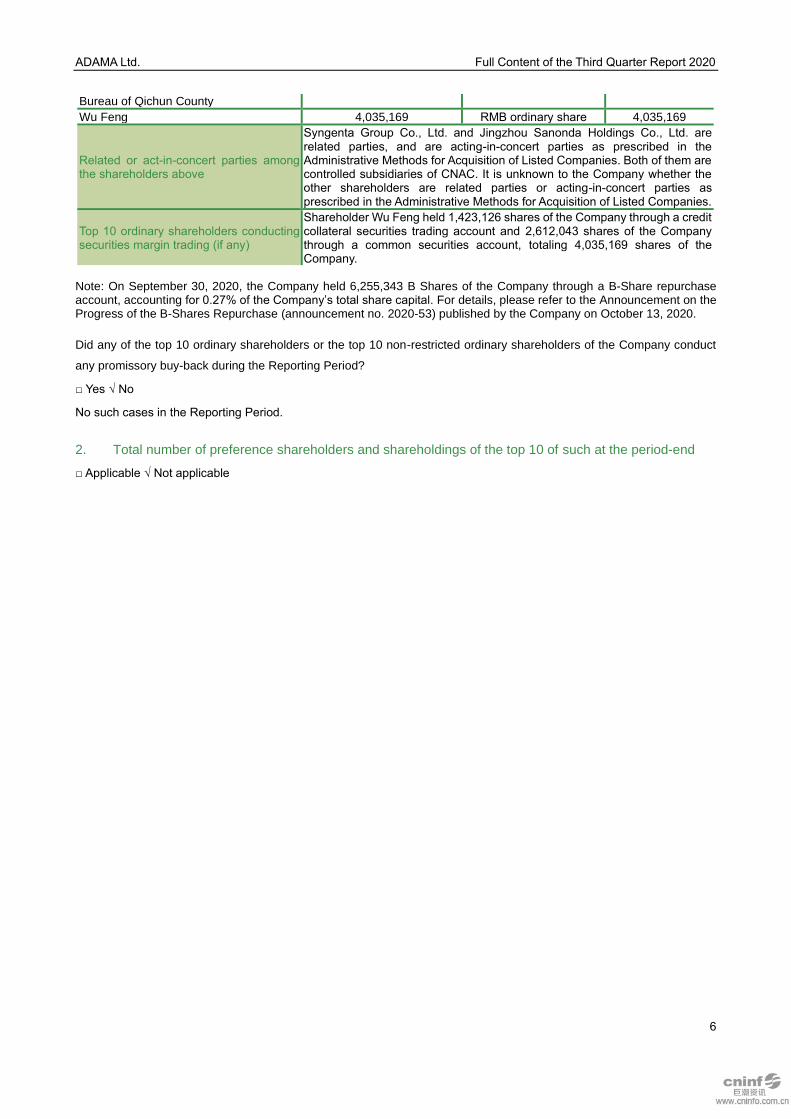
Bureau of Qichun County
Wu Feng 4,035,169 RMB ordinary share 4,035,169
Related or act-in-concert parties among the shareholders above
Syngenta Group Co., Ltd. and Jingzhou Sanonda Holdings Co., Ltd. are related parties, and are acting-in-concert parties as prescribed in the Administrative Methods for Acquisition of Listed Companies. Both of them are controlled subsidiaries of CNAC. It is unknown to the Company whether the other shareholders are related parties or acting-in-concert parties as prescribed in the Administrative Methods for Acquisition of Listed Companies.
Top 10 ordinary shareholders conducting securities margin trading (if any)
Shareholder Wu Feng held 1,423,126 shares of the Company through a credit collateral securities trading account and 2,612,043 shares of the Company through a common securities account, totaling 4,035,169 shares of the Company.
Note: On September 30, 2020, the Company held 6,255,343 B Shares of the Company through a B-Share repurchase account, accounting for 0.27% of the Company’s total share capital. For details, please refer to the Announcement on the Progress of the B-Shares Repurchase (announcement no. 2020-53) published by the Company on October 13, 2020.
Did any of the top 10 ordinary shareholders or the top 10 non-restricted ordinary shareholders of the Company conduct
any promissory buy-back during the Reporting Period?
□ Yes √ No
No such cases in the Reporting Period.
2. Total number of preference shareholders and shareholdings of the top 10 of such at the period-end
□ Applicable √ Not applicable
ADAMA Ltd. Full Content of the Third Quarter Report 2020
7
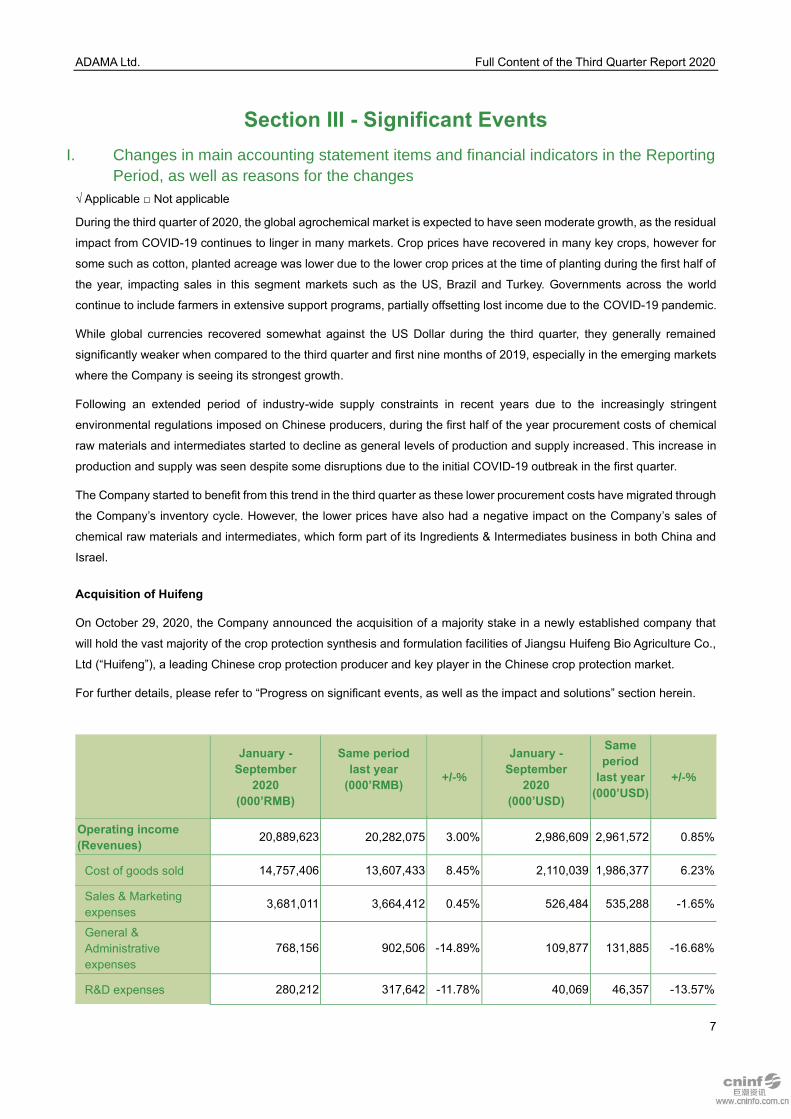
Section III - Significant Events
I. Changes in main accounting statement items and financial indicators in the Reporting
Period, as well as reasons for the changes
√ Applicable □ Not applicable
During the third quarter of 2020, the global agrochemical market is expected to have seen moderate growth, as the residual
impact from COVID-19 continues to linger in many markets. Crop prices have recovered in many key crops, however for
some such as cotton, planted acreage was lower due to the lower crop prices at the time of planting during the first half of
the year, impacting sales in this segment markets such as the US, Brazil and Turkey. Governments across the world
continue to include farmers in extensive support programs, partially offsetting lost income due to the COVID-19 pandemic.
While global currencies recovered somewhat against the US Dollar during the third quarter, they generally remained
significantly weaker when compared to the third quarter and first nine months of 2019, especially in the emerging markets
where the Company is seeing its strongest growth.
Following an extended period of industry-wide supply constraints in recent years due to the increasingly stringent
environmental regulations imposed on Chinese producers, during the first half of the year procurement costs of chemical
raw materials and intermediates started to decline as general levels of production and supply increased. This increase in
production and supply was seen despite some disruptions due to the initial COVID-19 outbreak in the first quarter.
The Company started to benefit from this trend in the third quarter as these lower procurement costs have migrated through
the Company’s inventory cycle. However, the lower prices have also had a negative impact on the Company’s sales of
chemical raw materials and intermediates, which form part of its Ingredients & Intermediates business in both China and
Israel.
Acquisition of Huifeng
On October 29, 2020, the Company announced the acquisition of a majority stake in a newly established company that
will hold the vast majority of the crop protection synthesis and formulation facilities of Jiangsu Huifeng Bio Agriculture Co.,
Ltd (“Huifeng”), a leading Chinese crop protection producer and key player in the Chinese crop protection market.
For further details, please refer to “Progress on significant events, as well as the impact and solutions” section herein.
January -
September
2020
(000’RMB)
Same period
last year
(000’RMB)
+/-%
January -
September
2020
(000’USD)
Same
period
last year
(000’USD)
+/-%
Operating income
(Revenues) 20,889,623 20,282,075 3.00% 2,986,609 2,961,572 0.85%
Cost of goods sold 14,757,406 13,607,433 8.45% 2,110,039 1,986,377 6.23%
Sales & Marketing
expenses 3,681,011 3,664,412 0.45% 526,484 535,288 -1.65%
General &
Administrative
expenses 768,156 902,506 -14.89% 109,877 131,885 16.68% -
R&D expenses 280,212 317,642 -11.78% 40,069 46,357 -13.57%
ADAMA Ltd. Full Content of the Third Quarter Report 2020
8
January -
September
2020
(000’RMB)
Same period
last year
(000’RMB)
+/-%
January -
September
2020
(000’USD)
Same
period
last year
(000’USD)
+/-%
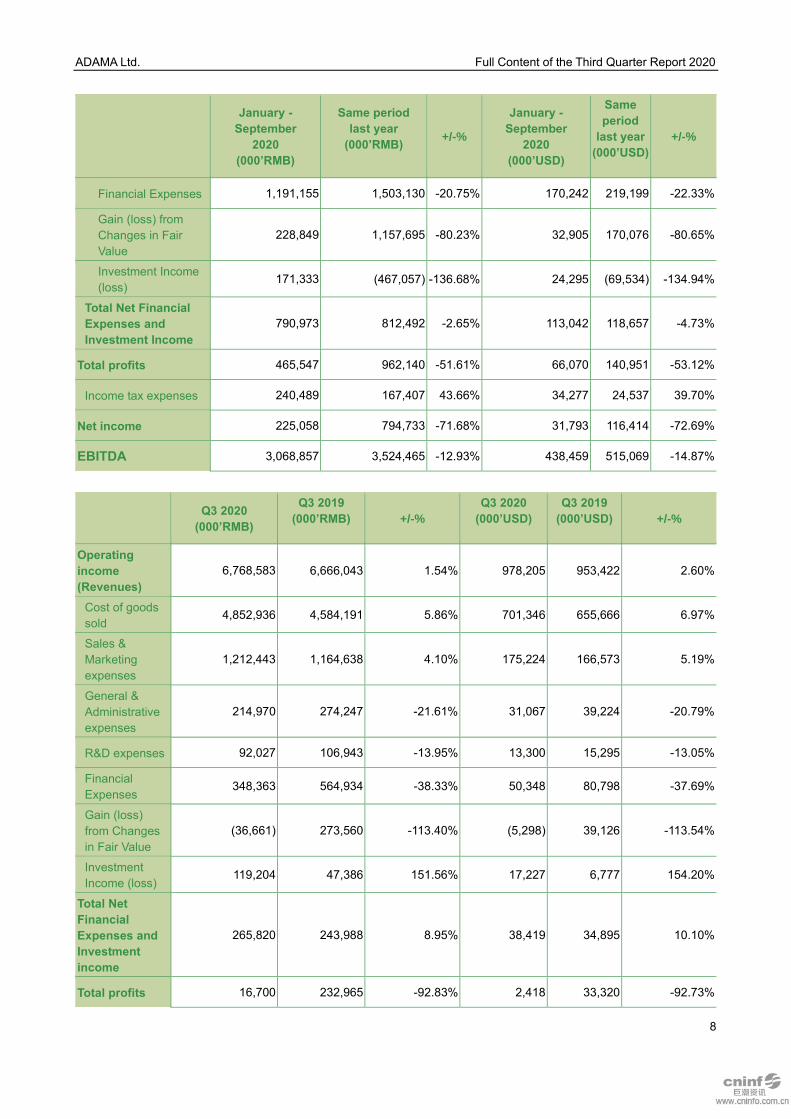
Financial Expenses 1,191,155 1,503,130 -20.75% 170,242 219,199 -22.33%
Gain (loss) from
Changes in Fair
Value
228,849 1,157,695 -80.23% 32,905 170,076 -80.65%
Investment Income
(loss) 171,333 (467,057) -136.68% 24,295 (69,534) -134.94%
Total Net Financial
Expenses and
Investment Income
790,973 812,492 -2.65% 113,042 118,657 -4.73%
Total profits 465,547 962,140 -51.61% 66,070 140,951 -53.12%
Income tax expenses 240,489 167,407 43.66% 34,277 24,537 39.70%
Net income 225,058 794,733 -71.68% 31,793 116,414 -72.69%
EBITDA 3,068,857 3,524,465 -12.93% 438,459 515,069 -14.87%
Q3 2020
(000’RMB)
Q3 2019
(000’RMB)
+/-% Q3 2020
(000’USD)
Q3 2019
(000’USD)
+/-%
Operating
income
(Revenues) 6,768,583 6,666,043 1.54% 978,205 953,422 2.60%
Cost of goods
sold 4,852,936 4,584,191 5.86% 701,346 655,666 6.97%
Sales &
Marketing
expenses 1,212,443 1,164,638 4.10% 175,224 166,573 5.19%
General &
Administrative
expenses 214,970 274,247 21.61% - 31,067 39,224 20.79% -
R&D expenses 92,027 106,943 -13.95% 13,300 15,295 -13.05%
Financial
Expenses 348,363 564,934 -38.33% 50,348 80,798 -37.69%
Gain (loss)
from Changes
in Fair Value
(36,661) 273,560 -113.40% (5,298) 39,126 -113.54%
Investment
Income (loss) 119,204 47,386 151.56% 17,227 6,777 154.20%
Total Net
Financial
Expenses and
Investment
income
265,820 243,988 8.95% 38,419 34,895 10.10%
Total profits 16,700 232,965 -92.83% 2,418 33,320 -92.73%
ADAMA Ltd. Full Content of the Third Quarter Report 2020
9
Q3 2020
(000’RMB)
Q3 2019
(000’RMB)
+/-% Q3 2020
(000’USD)
Q3 2019
(000’USD)
+/-%
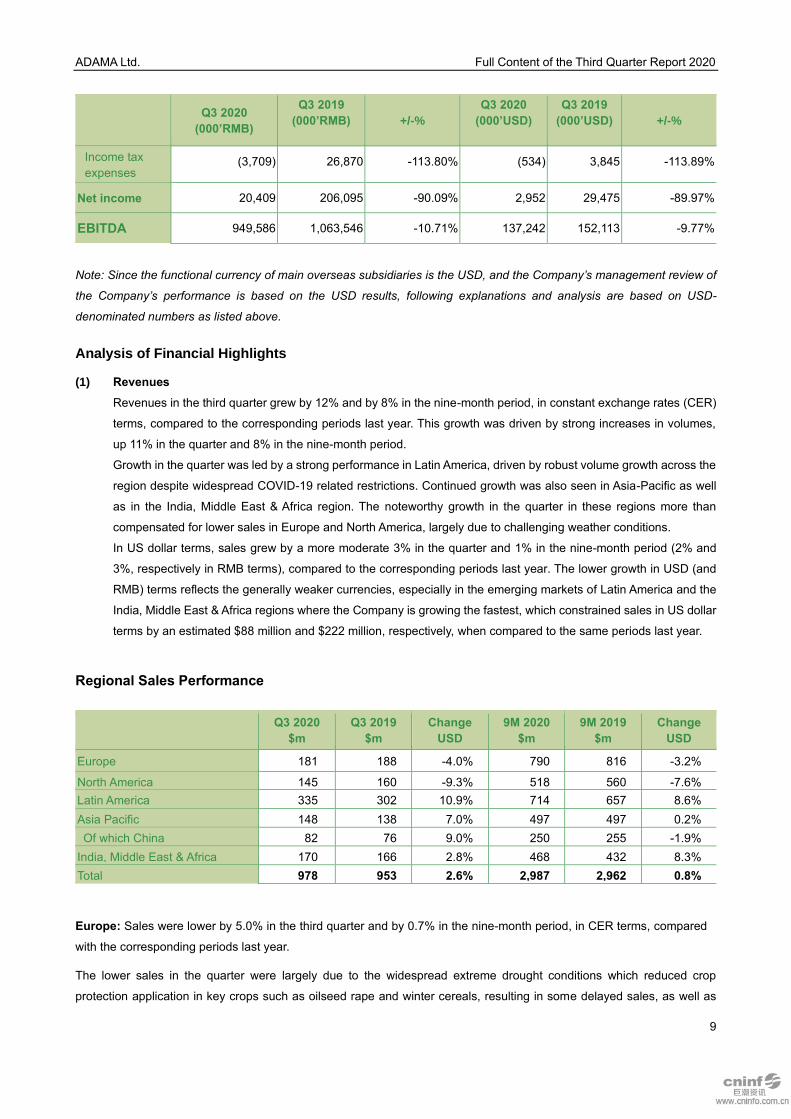
Income tax
expenses (3,709) 26,870 -113.80% (534) 3,845 -113.89%
Net income 20,409 206,095 -90.09% 2,952 29,475 -89.97%
EBITDA 949,586 1,063,546 -10.71% 137,242 152,113 -9.77%
Note: Since the functional currency of main overseas subsidiaries is the USD, and the Company’s management review of
the Company’s performance is based on the USD results, following explanations and analysis are based on USD-
denominated numbers as listed above.
Analysis of Financial Highlights
(1) Revenues
Revenues in the third quarter grew by 12% and by 8% in the nine-month period, in constant exchange rates (CER)
terms, compared to the corresponding periods last year. This growth was driven by strong increases in volumes,
up 11% in the quarter and 8% in the nine-month period.
Growth in the quarter was led by a strong performance in Latin America, driven by robust volume growth across the
region despite widespread COVID-19 related restrictions. Continued growth was also seen in Asia-Pacific as well
as in the India, Middle East & Africa region. The noteworthy growth in the quarter in these regions more than
compensated for lower sales in Europe and North America, largely due to challenging weather conditions.
In US dollar terms, sales grew by a more moderate 3% in the quarter and 1% in the nine-month period (2% and
3%, respectively in RMB terms), compared to the corresponding periods last year. The lower growth in USD (and
RMB) terms reflects the generally weaker currencies, especially in the emerging markets of Latin America and the
India, Middle East & Africa regions where the Company is growing the fastest, which constrained sales in US dollar
terms by an estimated $88 million and $222 million, respectively, when compared to the same periods last year.
Regional Sales Performance
Europe: Sales were lower by 5.0% in the third quarter and by 0.7% in the nine-month period, in CER terms, compared
with the corresponding periods last year.
The lower sales in the quarter were largely due to the widespread extreme drought conditions which reduced crop
protection application in key crops such as oilseed rape and winter cereals, resulting in some delayed sales, as well as
Q3 2020
$m Q3 2019
$m
Change
USD
9M 2020
$m
9M 2019
$m
Change
USD
Europe 181 188 -4.0% 790 816 -3.2%
North America 145 160 -9.3% 518 560 -7.6%
Latin America 335 302 10.9% 714 657 8.6%
Asia Pacific 148 138 7.0% 497 497 0.2%
Of which China 82 76 9.0% 250 255 -1.9%
India, Middle East & Africa 170 166 2.8% 468 432 8.3%
Total 978 953 2.6% 2,987 2,962 0.8%
ADAMA Ltd. Full Content of the Third Quarter Report 2020
10
high inventories in distribution channels. During the quarter, the Company completed the acquisition of the remaining 51%
of Alfa in Greece, bolstering its activities in this important market.
During the quarter, the Company obtained multiple new product registrations in the region, including COLT®, a herbicide
for the control of broadleaf weeds in winter cereals and pasture, and FOLPAN GOLD®, a systemic fungicide to combat
grapevine mildew, both registered in Bulgaria.
In US dollar terms, sales were lower by 4.0% in the quarter and by 3.2% in the nine-month period, compared to the
corresponding periods last year, reflecting the net impact of the relative strengthening of European currencies against
the US dollar in the quarter, contrasted with their relative weakness over the nine-month period.
North America: Sales were lower by 9.3% in the third quarter and by 7.1% in the nine-month period, in CER terms,
compared with the corresponding periods last year.
Crop protection sales were markedly lower, largely due to disruptive weather conditions in the US which saw windstorms
damage corn fields in the mid-west, fires raging in the orchards and vineyards of California and Oregon, and a heatwave
challenging cotton farmers in Texas already contending with reduced demand due to the COVID-19 impact on the apparel
industry, alongside low insect pressure impacting sales of insecticides. This was partially mitigated by the robust
performance of the Company’s Consumer and Professional Solutions business, which continues its strong recovery from
the COVID-19 related challenges seen earlier in the year.
The Company continued to expand its differentiated product offering in the region, following the earlier launches in Canada
of CUSTODIA®, a combination fungicide controlling a wide range of diseases in corn, soybeans and wheat, as well as
ORIUS®, a broad-spectrum fungicide for wheat, barley and oat crops.
In US dollar terms, sales were lower by 9.3% in the quarter and by 7.6% in the nine-month period, compared to the
corresponding periods last year, reflecting the moderate weakening of the Canadian Dollar seen in the first half of the
year.
Latin America: Sales grew by a robust 38.7% in the third quarter and by 32.7% in the nine-month period, in CER terms,
compared to the corresponding periods last year, driven by significant volume growth in key countries and continued price
increases to partially compensate for the material weakness of the currencies in the region, and despite widespread
COVID-19 related restrictions.
The Company saw significant volume growth in Brazil, driven by strong performances from its differentiated product
portfolio including flagship product CRONNOS®, the triple-action fungicide for soybean rust, GALIL®, a differentiated
combination insecticide and TRIVOR®, a dual-action insecticide for rapid and extended control of sucking pests, following
its successful 2019 launch.
Noteworthy performances were also recorded in Argentina, Colombia, Mexico and Paraguay, as well as in Peru, bolstered
by the Company’s recent acquisition in the country.
On October 14, 2020, the Company acquired a majority stake in FNV S.A., its key crop protection distributor in Paraguay,
strengthening the Company’s commercial presence in this important market and providing the Company with direct market
access, ensuring the sustainability and growth of its key distribution platform.
During the quarter, the Company obtained multiple new product registrations in the region, including ARADDO®, a complete
solution for the management of a wide range of glyphosate-resistant weeds in soybean, corn and wheat crops in Brazil.
In US dollar terms, sales in the region grew by 10.9% in the quarter and 8.6% in the nine month period, compared to the
corresponding periods last year, as the robust business growth was heavily impacted by weaker currencies in the region,
in particular the significant decline in the Brazilian Real against the US dollar.
ADAMA Ltd. Full Content of the Third Quarter Report 2020
11
Asia Pacific: Sales grew by 5.3% in the quarter and by 3.4% in the nine-month period, in CER terms, compared to the
corresponding periods last year, driven by continued volume growth.
In Asia-Pacific (outside of China), the Company saw strong performance from Australia and New Zealand, benefiting from
favorable weather, and more than offsetting challenging seasonal conditions in South East Asia.
During the quarter, the Company obtained multiple new product registrations in the region, including ULTRO® 900
(Carbetamide), a herbicide for the control of grasses in all pulse crops. This is a new active ingredient in Australia for
broadacre cropping, the country’s largest cropping segment.
In China, the Company delivered moderate growth in the quarter, with a strong performance from its branded, formulated
sales being partially offset by lower prices received for its raw materials and intermediates due to increased supply
generally from Chinese producers. The growth in the formulated products was supported by new product launches
including AN GUO XUAN®, a protective fungicide for tomatoes, and XIN TUO LONG®, an effective growth regulating
solution for cotton harvesting in the Xinjiang region.
In US dollar terms, sales in the region grew by 7.0% in the third quarter were flat over the nine-month period, compared
to the corresponding periods last year, reflecting the strengthening of the Chinese Renminbi against the US dollar in Q3,
contrasted with the generally weaker currencies over the nine month period.
India, Middle East and Africa: Sales grew by 7.5% in the quarter and by 14.2% in the nine-month period, in CER terms,
compared to the corresponding periods last year, driven by robust volume growth.
The growth in the region was driven mainly by a strong performance in India, which benefited from above-average monsoon
rains and good cropping conditions.
During the quarter, the Company continued to expand its hybrid product offering in the region, launching TRIGUS®, an
insecticide for use on sucking pests, in India.
In US dollar terms, sales in the region grew by 2.8% in the quarter and by 8.3% in the nine month period, compared to
the corresponding periods last year, reflecting the impact of softer currencies, most notably the Turkish Lira, the Indian
Rupee and the South African Rand.
(2) Gross Profit:
The third quarter saw the Company start to benefit from a marked drop in procurement costs which began earlier
in the year and which are now migrating through the Company’s inventory cycle. This was partially offset by
somewhat higher manufacturing costs related to the stronger Israel shekel. However, in both the third quarter and
nine-month periods, the strong volume growth and lower procurement costs were more than offset by the material
depreciation of global currencies, which constrained gross profit by an estimated $75 million and $184 million,
respectively.
(3) Operating Expenses:
Operating expenses include Sales and Marketing, General and Administration and R&D. Total operating expenses
in the third quarter were $220 million (22.5% of sales) and $676 million (22.6% of sales) in the nine-month period,
compared to $221 million (23.2% of sales) and $714 million (24.1% of sales) in the corresponding periods last year,
respectively. The Company continues to maintain tight control of its operating expenses, which were also naturally
constrained by the impact of COVID-19, and saw a marked decrease in expenses in both the quarter and nine-
month periods, despite the inclusion of recent acquisitions. Operating expenses in the 2020 periods also benefited
from the global currency weakness against the US dollar when compared to prior periods, while operating expenses
in the 2019 nine-month period were net of income related to expropriation of land recorded then.
ADAMA Ltd. Full Content of the Third Quarter Report 2020
12
In recent years, the Company recorded various one-time or non-cash or non-operational items affecting its reported
numbers, including as a result of mergers and acquisitions, which resulted in the inclusion within its operating
expenses of, mainly, the following items:
• Amortization of legacy Purchase Price Allocation (PPA) of 2011 acquisition of Adama Agricultural
Solutions Ltd., a wholly-owned subsidiary of the Company (hereinafter: “Solutions”) (non-cash): Under
PRC GAAP, since the first combined reporting in Q3 2017 following the combination, the Company has inherited
the historical “legacy” amortization charge that ChemChina previously was incurring in respect of its acquisition
of Solutions in 2011. This amortization is done in a linear manner on a quarterly basis, most of which will be fully
amortized by the end of 2020. Its reported financial impact (affecting the Sales & Marketing expenses) in both the
third quarter and the first nine months of 2020 is RMB 66 million (USD 10 million) and RMB 199 million (USD 29
million), net of tax, respectively, compared with RMB 66 million (USD 10 million) and RMB 195 million (USD 29
million) in the corresponding periods in 2019.
• Amortization of Transfer assets received and written-up due to 2017 ChemChina-Syngenta transaction
(non-cash): The proceeds from the Divestment of crop protection products in connection with the approval by
the EU Commission of the acquisition of Syngenta by ChemChina, net of taxes and transaction expenses, were
paid to Syngenta in return for the transfer of a portfolio of products in Europe of similar nature and economic value.
Since the products acquired from Syngenta are of the same nature, and with the same net economic value as
those divested, the Divestment and Transfer transactions had no net impact on the underlying economic
performance of the Company. Its reported financial impact (affecting the Sales & Marketing expenses) in both the
third quarter and the first nine months of 2020 is RMB 53 million (USD 8 million) and RMB 160 million (USD 23
million), net of tax, respectively, compared with RMB 54 million (USD 8 million) and RMB 188 million (USD 27
million) in the corresponding periods in 2019.
• Employee early retirement plan expenses: a one-time provision for the early retirement plan of employees at
the Company’s Israeli manufacturing facilities. Its reported financial impact (affecting the General & Administrative
expenses) in both the third quarter and the first nine months of 2020 is RMB 4.2 million (USD 0.6 million) and
RMB 70 million (USD 10 million), net of tax, respectively, most of which was recorded in the first quarter of 2020.
(4) Financial Expenses
“Financial Expenses” alone mainly reflect interest payments on corporate bonds and bank loans as well as foreign
exchange gains/losses on the bonds and other monetary assets and liabilities before the Company carries out any
hedging. The impact of Financial Expenses (before hedging) is RMB 1,191 million and RMB 348 million (USD 170
million and USD 50 million) for the three and first nine months of 2020, respectively, compared with RMB 1,503
million and RMB 565 million (USD 219 million and USD 81 million) for the corresponding periods in 2019.
Given the global nature of its operational activities and the composition of its assets and liabilities, the Company, in
the ordinary course of its business, uses foreign currency derivatives (forwards and options) to hedge the cash flow
risks associated with existing monetary assets and liabilities that may be affected by exchange rate fluctuations.
Net gains/losses from hedging of those positions, are recorded in “Gains/Losses from Changes in Fair Value”, and
are then transferred to “Investment Income” upon realization. The combined impact of the hedging transactions on
Gains/Losses from Changes in Fair Value and Investment Income is a net gain of RMB 324 million and RMB 21
million (USD 46 million and USD 3 million) in the three and first nine months of 2020, respectively, compared with
RMB 665 million and RMB 317 million (USD 97 million and USD 45 million) in the corresponding period in 2019.
In addition, Investment Income also mainly includes an amount of RMB 15 million (USD 2 million) in respect of
equity accounted investees in the first nine months of 2020 compared with RMB 23 million (USD 3 million) in the
corresponding period in 2019 and RMB 59 million (USD 9 million) capital gain from gaining control over an equity
ADAMA Ltd. Full Content of the Third Quarter Report 2020
13
investee, bringing the total Gains/Losses from Changes in Fair Value and Investment Income to RMB 400 million
(USD 57 million) in the first nine months of 2020 compared with RMB 691 million (USD 101 million) in the
corresponding period in 2019.
The aggregate of Financial Expenses, Gains/Losses from Changes in Fair Value and Investment Income
(hereinafter as “Total Net Financial Expenses and Investment Income”), which more comprehensively reflects the
financial expenses of the Company in supporting its main business and protecting its monetary assets/liabilities,
amounts to RMB 867 million and RMB 328 million (USD 124 million and USD 47 million) in the three and first nine
months of 2020, respectively, compared with RMB 838 million and RMB 248 million (USD 122 million and USD 35
million) in the corresponding period in 2019.
The higher financial expenses in the quarter were due to an increase in financing costs on the NIS-denominated,
CPI-linked bonds due to a higher CPI in Israel, as well as the effect on balance sheet positions of the strengthening
of the RMB when compared to 2019.
(5) Income Tax Expenses
The lower tax expenses in the quarter were driven by the lower operating income, while the comparative quarter in
2019 saw higher tax expenses due to the devaluation of the Brazilian Real in that quarter, which resulted in non-
cash tax expenses due to differences between the functional currency (US dollar) and tax currency (BRL) with
respect to the value of non-monetary assets. The higher tax expenses in the nine-month period are largely due to
the first-quarter impact of the weakening of the Brazilian Real against the US dollar, which resulted once again in
an increase in non-cash tax expenses.
Changes in main assets and liabilities
Unit: RMB’000
Assets and liabilities September 30,
2020
December
31, 2019
% change Explanation for any major change
Cash at bank and on
hand 5,733,413 4,348,588 31.85%
Additional loans mainly to support the relocation
projects
Accounts receivable 8,156,741 8,004,157 1.91% No Significant change
Inventories 11,109,614 9,932,654 11.85% No Significant change
Investment property 3,528 3,771 -6.44% No Significant change
Long term equity
investments 13,353 133,098 -89.97% Gaining control over an equity investee and
impairment of an equity investee.
Fixed assets 6,758,241 6,939,610 -2.61% No Significant change
Construction in progress 1,085,781 788,386 37.72%
Changes are mainly due to investments as part
of China relocation and CIP transferred to fixed
assets.
Short-term loans 2,026,051 2,009,882 0.80% No Significant change
Long-term loans 2,169,444 927,159 133.99% Additional loans mainly to support the relocation
and working capital
Financial assets at fair
value through profit or
loss 3,044 29,510 -89.68% Mainly as a result of realization of assets.
Derivative financial
assets 879,374 490,113 79.42% Revaluation and realization of derivatives.
Bills receivable 128,050 26,000 392.50% Increase from inclusion of a newly consolidated
company
ADAMA Ltd. Full Content of the Third Quarter Report 2020
14
Assets and liabilities September 30,
2020
December
31, 2019
% change Explanation for any major change
Other receivables 1,708,941 1,195,253 42.98% Mainly increase in receivables included in the
securitization program
Derivative financial
liabilities 1,004,517 691,475 45.27% Realization and revaluation of derivatives.
Other payables 1,468,951 1,049,594 39.95% Mainly increase in liabilities in respect of
securitization transaction
Contract liabilities 1,078,082 664,228 62.31% Seasonality increase mainly due to rebates
Other comprehensive
income 623,522 1,192,681 -47.72%
Mainly from strengthening of the RMB in
relation to the USD which decreased the
investment in ADAMA solutions
Treasury shares 28,200 - 100.00% Due to the B-Shares repurchase
II. Progress on significant events, as well as the impact and solutions
√ Applicable □ Not applicable
1. On July 13, 2020, Syngenta Group Co., Ltd., the controlling shareholder of the Company, timely completed
the performance compensation commitment related to the 2017 Major Assets Restructuring. For details,
please refer to the Announcement on the Completion of Buyback and Cancellation of the Compensation
Shares (announcement no. 2020-36) published by the Company on July 15, 2020 on www.cninfo.com.cn.
2. On October 28, 2020, the 27th Meeting of the 8th Session of the Board approved a Proposal on the Acquisition
of a 51% Equity Stake in Jiangsu Kelinong Agrochemical Co., Ltd. and an Additional 1% in Shanghai Dibai
Plant Protection Co., Ltd., and a Proposal on the Second Supplemental Agreement to the Equity Purchase
Agreement regarding the Company’s Acquisition of a 50% Equity Stake in Shanghai Dibai Plant Protection
Co., Ltd. Benefiting from the transactions under the above two proposals, the Company will enhance its
business both in China and globally. Globally, the Company will gain access to backward-integrated and
competitive positions in key molecules, which it intends to use to drive significant growth through its
worldwide market reach. In China, the Company will be able to ensure supply and competitive costing over
Huifeng’s wide portfolio of product registrations which complement the Company’s, and thereby will bolster
its position and offering in this key market. For details, please refer to the relevant announcements
(announcement no. 2020-59, 2020-60) published by the Company on October 29, 2020 on
www.cninfo.com.cn.
3. In accordance with the "Accounting Standards for Business Enterprises", the Company recorded an
impairment of RMB 116 million in the nine-month period. For details, please refer to the Announcement on
Assets Impairment in the nine-month period of 2020 (announcement no.2020-64) published by the
Company on October 30, 2020 on www.cninfo.com.cn.
Status of share buyback
√ Applicable □ Not applicable
In order to protect the Company’s value and shareholders’ interests, the 26th Meeting of the 8th Session of the Board
of Directors of the Company held on August 19, 2020 and the 3rd Interim Shareholders Meeting of the Company in
2020 held on September 7, 2020 approved the Repurchase Plan for Part of the Company’s Domestically Listed
Foreign Shares (B share). According to the Repurchase Plan, the Company intends to repurchase (and cancel) a
portion of its B-shares resulting in a corresponding reduction of the Company's registered capital. The upper limit
of the number of shares to be repurchased is 26,000,000 shares, with the lower limit being 13,000,000 shares, at
ADAMA Ltd. Full Content of the Third Quarter Report 2020
15
a price that shall not exceed 5.70 HKD/share, such that the total funds to be used for the repurchase shall not
exceed RMB 132.562 million (including foreign exchange fees, transaction fees and other related fees).
Within the period starting at September 16, 2020 and ending on September 30, 2020, the Company repurchased
6,255,343 B-Shares by means of centralized price bidding transactions through a B-Shares repurchase account,
which account for 0.27% of the Company’s total share capital. Within this period, the highest transaction price was
5.22 HKD/share, the lowest transaction price was 4.93 HKD/share, and the total amount paid amounted to HKD
31,835,349 (excluding transaction fees).
Whether the Company sold out the shares which were bought back by means of centralized price bidding
□ Applicable √ Not applicable
III. None completion of Commitments that should have been completed in the Reporting
Period by the Company, actual controller, shareholders, related parties, acquirer, and
other committed parties
□ Applicable √ Not applicable
No such cases in the Reporting Period.
IV. Investments on Finance Assets
1. Securities investment
□ Applicable √ Not applicable
No such cases in the Reporting Period.
ADAMA Ltd. Full Content of the Third Quarter Report 2020
16
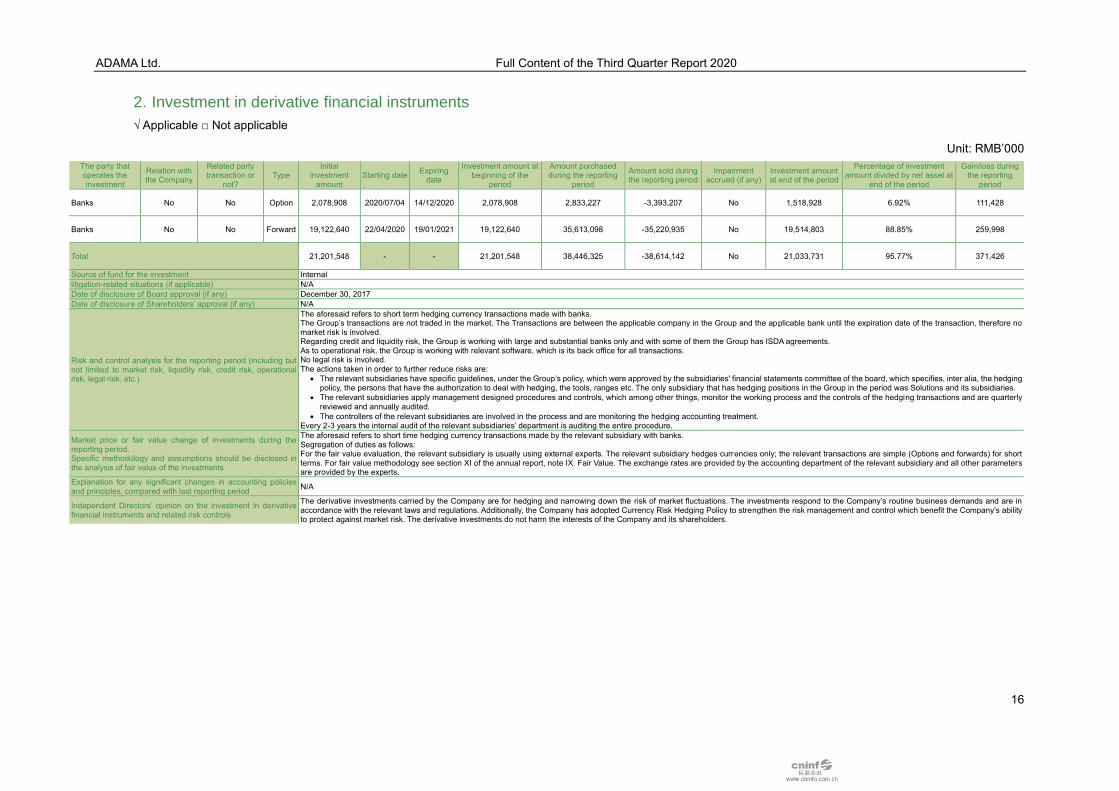
2. Investment in derivative financial instruments
√ Applicable □ Not applicable
Unit: RMB’000
The party that operates the investment
Relation with the Company
Related party transaction or
not? Type
Initial investment
amount Starting date
Expiring date
Investment amount at beginning of the
period
Amount purchased during the reporting
period
Amount sold during the reporting period
Impairment accrued (if any)
Investment amount at end of the period
Percentage of investment amount divided by net asset at
end of the period
Gain/loss during the reporting
period
Banks No No Option 2,078,908 04/07/2020 14/12/2020 2,078,908 2,833,227 -3,393,207 No 1,518,928 6.92% 111,428
Banks No No Forward 19,122,640 22/04/2020 19/01/2021 19,122,640 35,613,098 -35,220,935 No 19,514,803 88.85% 259,998
Total 21,201,548 - - 21,201,548 38,446,325 -38,614,142 No 21,033,731 95.77% 371,426
Source of fund for the investment Internal
litigation-related situations (if applicable) N/A
Date of disclosure of Board approval (if any) December 30, 2017
Date of disclosure of Shareholders’ approval (if any) N/A
Risk and control analysis for the reporting period (including but not limited to market risk, liquidity risk, credit risk, operational risk, legal risk, etc.)
The aforesaid refers to short term hedging currency transactions made with banks. The Group’s transactions are not traded in the market. The Transactions are between the applicable company in the Group and the applicable bank until the expiration date of the transaction, therefore no market risk is involved. Regarding credit and liquidity risk, the Group is working with large and substantial banks only and with some of them the Group has ISDA agreements. As to operational risk, the Group is working with relevant software, which is its back office for all transactions. No legal risk is involved. The actions taken in order to further reduce risks are:
• The relevant subsidiaries have specific guidelines, under the Group’s policy, which were approved by the subsidiaries' financial statements committee of the board, which specifies, inter alia, the hedging policy, the persons that have the authorization to deal with hedging, the tools, ranges etc. The only subsidiary that has hedging positions in the Group in the period was Solutions and its subsidiaries.
• The relevant subsidiaries apply management designed procedures and controls, which among other things, monitor the working process and the controls of the hedging transactions and are quarterly reviewed and annually audited.
• The controllers of the relevant subsidiaries are involved in the process and are monitoring the hedging accounting treatment. Every 2-3 years the internal audit of the relevant subsidiaries’ department is auditing the entire procedure.
Market price or fair value change of investments during the reporting period. Specific methodology and assumptions should be disclosed in the analysis of fair value of the investments
The aforesaid refers to short time hedging currency transactions made by the relevant subsidiary with banks. Segregation of duties as follows: For the fair value evaluation, the relevant subsidiary is usually using external experts. The relevant subsidiary hedges currencies only; the relevant transactions are simple (Options and forwards) for short terms. For fair value methodology see section XI of the annual report, note IX. Fair Value. The exchange rates are provided by the accounting department of the relevant subsidiary and all other parameters are provided by the experts.
Explanation for any significant changes in accounting policies and principles, compared with last reporting period
N/A
Independent Directors’ opinion on the investment in derivative financial instruments and related risk controls
The derivative investments carried by the Company are for hedging and narrowing down the risk of market fluctuations. The investments respond to the Company’s routine business demands and are in accordance with the relevant laws and regulations. Additionally, the Company has adopted Currency Risk Hedging Policy to strengthen the risk management and control which benefit the Company’s ability to protect against market risk. The derivative investments do not harm the interests of the Company and its shareholders.
ADAMA Ltd. Full Content of the Third Quarter Report 2020
17
V. Progress on the designated projects used the raised funds
√ Applicable □ Not applicable
With the approval of China Securities Regulatory Commission for the issuance of shares to China National
Agrochemical Co., Ltd. to acquire assets and raise supporting funds (CSRC Permits [2017] No.1096), the Company
issued 104,697,982 ordinary A shares in December 2017, at an issue price of RMB 14.90 per share, raising a total
amount of RMB1,559,999,931.80 (“Raised Funds”). After deducting the underwriting fees of RMB 28, 079,998.78,
the net amount received by the Company on 27 December 2017 was RMB 1, 531,919,933.02. Deloitte Touche
Tohmatsu Certified Public Accountant LLP verified the amount and issued a capital verification report (De Shi Bao
(Yan) Zi (17) No.00540).
As of the disclosure date of this Report, the Company has used RMB 400.08 million of the Raised Funds for the
acquisition of Anpon; RMB 131.03 million in the product development and registration project; RMB 59.13 million in
the fixed asset investment project; and RMB 127.13 million in the transaction cost, taxes and fees.
As of September 30, 2020, the balance of the Raised Funds is RMB 893,731,302.67. The Company intends to use
the above balance (including interest income, and subject to the bank settlement balance on the date of
transfer),with the approval of the shareholders meeting to be held on November 16, 2020, for the payment for the
51% equity stake in Shanghai Dibai Plant Protection Co., Ltd. and the 51% equity stake in Jiangsu Kelinong
Agrochemical Co., Ltd. from Jiangsu Huifeng Agrochemical Co., Ltd.
For details, please refer to the Announcement on the Use of the Raised Funds for the Acquisition of the 51% Equity
Stake in Jiangsu Kelinong Agrochemical Co., Ltd. as well as that in Shanghai Dibai Plant Protection Co., Ltd.
(announcement no. 2020-61), Announcement on the Termination of the Use of Raised Funds for Certain Designated
Projects(announcement no. 2020-26), Announcement on the Change of Certain Designated Projects
(announcement no. 2019-17) separately published by the Company on October 29, 2020, April 28, 2020, and March
21, 2019.
VI. Performance forecast for January-December 2020
Warning of possible loss or considerable YoY change in the accumulative net profit made during the period-
beginning to the end of the next reporting period, as well as the reasons:
□ Applicable √ Not applicable
VII. Significant contract in the routine business
□ Applicable √ Not applicable
VIII. Wealth management entrustment
□ Applicable √ Not applicable
No such cases in the Reporting Period.
IX. Illegal provision of guarantees for external parties
□ Applicable √ Not applicable
No such cases in the Reporting Period.
X. Inadequate use of Company’s capital by the controlling shareholder or its related
parties for non-operating purposes
□ Applicable √ Not applicable
ADAMA Ltd. Full Content of the Third Quarter Report 2020
18
No such cases in the Reporting Period.
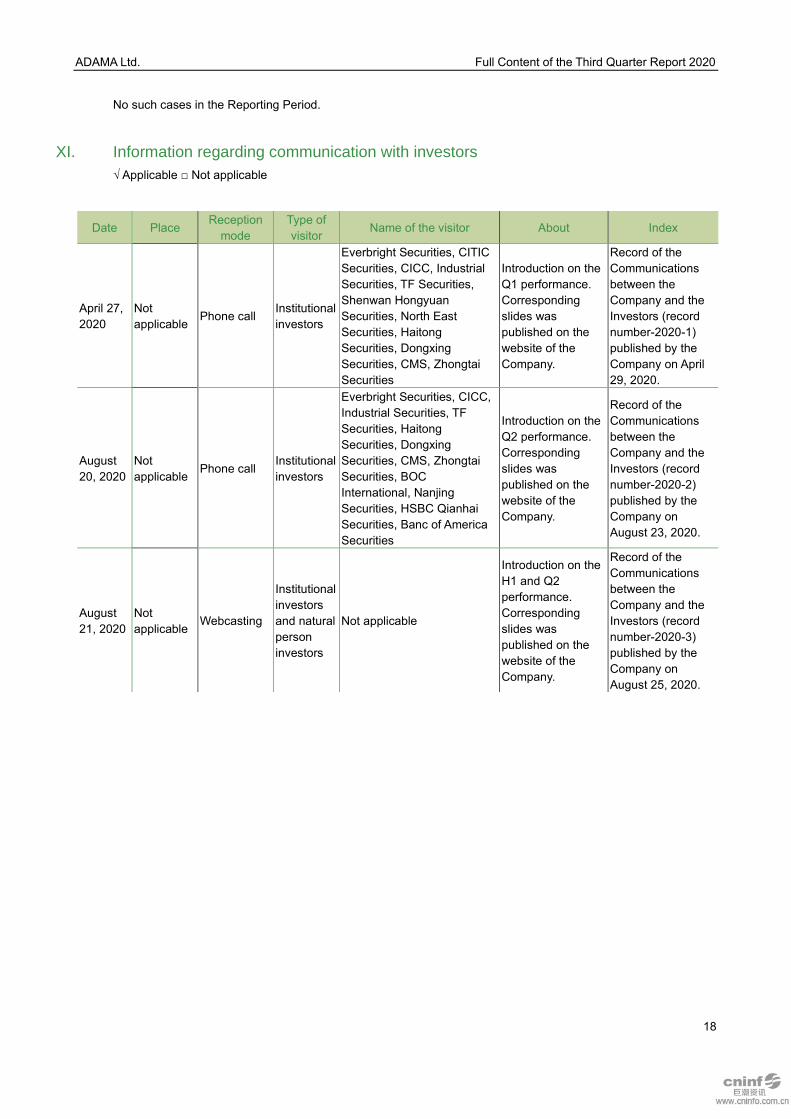
XI. Information regarding communication with investors
√ Applicable □ Not applicable
Date Place Reception
mode
Type of
visitor Name of the visitor About Index
April 27,
2020
Not
applicable Phone call
Institutional
investors
Everbright Securities, CITIC
Securities, CICC, Industrial
Securities, TF Securities,
Shenwan Hongyuan
Securities, North East
Securities, Haitong
Securities, Dongxing
Securities, CMS, Zhongtai
Securities
Introduction on the
Q1 performance.
Corresponding
slides was
published on the
website of the
Company.
Record of the
Communications
between the
Company and the
Investors (record
number-2020-1)
published by the
Company on April
29, 2020.
August
20, 2020
Not
applicable Phone call
Institutional
investors
Everbright Securities, CICC,
Industrial Securities, TF
Securities, Haitong
Securities, Dongxing
Securities, CMS, Zhongtai
Securities, BOC
International, Nanjing
Securities, HSBC Qianhai
Securities, Banc of America
Securities
Introduction on the
Q2 performance.
Corresponding
slides was
published on the
website of the
Company.
Record of the
Communications
between the
Company and the
Investors (record
number-2020-2)
published by the
Company on
August 23, 2020.
August
21, 2020
Not
applicable Webcasting
Institutional
investors
and natural
person
investors
Not applicable
Introduction on the
H1 and Q2
performance.
Corresponding
slides was
published on the
website of the
Company.
Record of the
Communications
between the
Company and the
Investors (record
number-2020-3)
published by the
Company on
August 25, 2020.
ADAMA Ltd. Full Content of the Third Quarter Report 2020
19
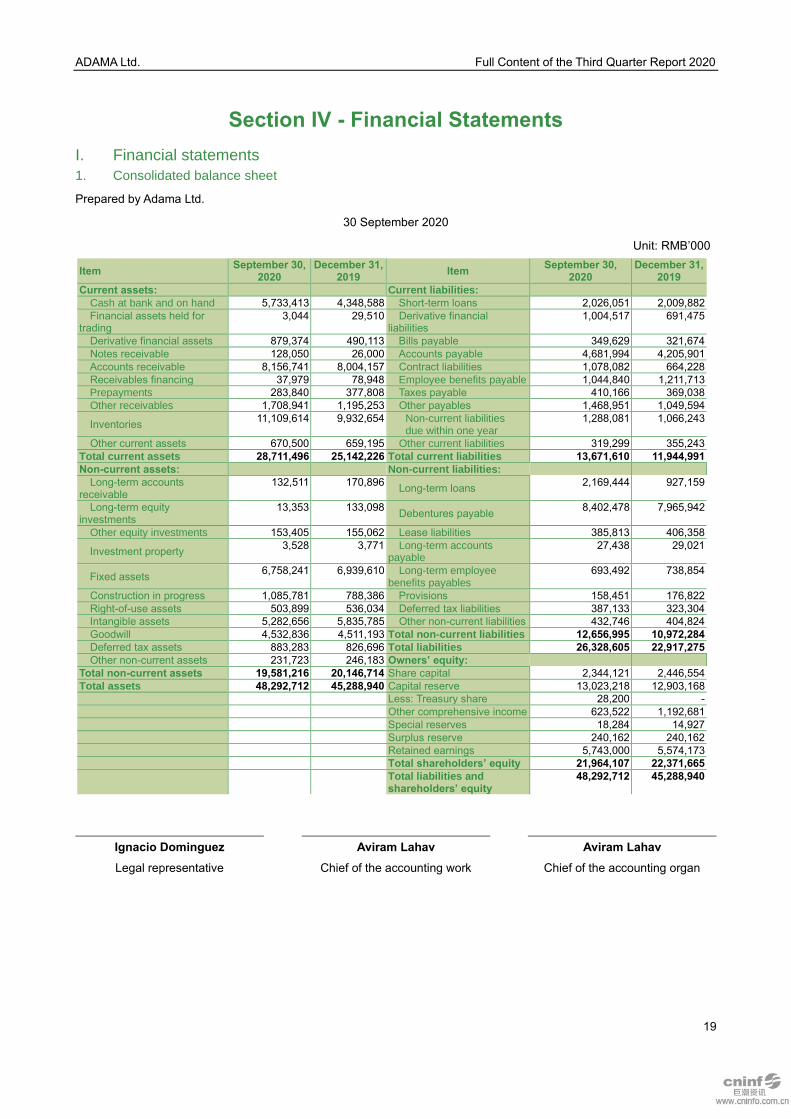
Section IV - Financial Statements
I. Financial statements
1. Consolidated balance sheet
Prepared by Adama Ltd.
30 September 2020
Unit: RMB’000
Item September 30,
2020 December 31,
2019 Item
September 30, 2020
December 31, 2019
Current assets: Current liabilities:
Cash at bank and on hand 5,733,413 4,348,588 Short-term loans 2,026,051 2,009,882
Financial assets held for trading
3,044 29,510 Derivative financial liabilities
1,004,517 691,475
Derivative financial assets 879,374 490,113 Bills payable 349,629 321,674
Notes receivable 128,050 26,000 Accounts payable 4,681,994 4,205,901
Accounts receivable 8,156,741 8,004,157 Contract liabilities 1,078,082 664,228
Receivables financing 37,979 78,948 Employee benefits payable 1,044,840 1,211,713
Prepayments 283,840 377,808 Taxes payable 410,166 369,038
Other receivables 1,708,941 1,195,253 Other payables 1,468,951 1,049,594
Inventories 11,109,614 9,932,654 Non-current liabilities
due within one year 1,288,081 1,066,243
Other current assets 670,500 659,195 Other current liabilities 319,299 355,243
Total current assets 28,711,496 25,142,226 Total current liabilities 13,671,610 11,944,991
Non-current assets: Non-current liabilities:
Long-term accounts receivable
132,511 170,896 Long-term loans
2,169,444 927,159
Long-term equity investments
13,353 133,098 Debentures payable
8,402,478 7,965,942
Other equity investments 153,405 155,062 Lease liabilities 385,813 406,358
Investment property 3,528 3,771 Long-term accounts
payable 27,438 29,021
Fixed assets 6,758,241 6,939,610 Long-term employee
benefits payables 693,492 738,854
Construction in progress 1,085,781 788,386 Provisions 158,451 176,822
Right-of-use assets 503,899 536,034 Deferred tax liabilities 387,133 323,304
Intangible assets 5,282,656 5,835,785 Other non-current liabilities 432,746 404,824
Goodwill 4,532,836 4,511,193 Total non-current liabilities 12,656,995 10,972,284
Deferred tax assets 883,283 826,696 Total liabilities 26,328,605 22,917,275
Other non-current assets 231,723 246,183 Owners’ equity:
Total non-current assets 19,581,216 20,146,714 Share capital 2,344,121 2,446,554
Total assets 48,292,712 45,288,940 Capital reserve 13,023,218 12,903,168
Less: Treasury share 28,200 -
Other comprehensive income 623,522 1,192,681
Special reserves 18,284 14,927
Surplus reserve 240,162 240,162
Retained earnings 5,743,000 5,574,173
Total shareholders’ equity 21,964,107 22,371,665
Total liabilities and shareholders’ equity
48,292,712 45,288,940
Ignacio Dominguez
Legal representative
Aviram Lahav
Chief of the accounting work
Aviram Lahav
Chief of the accounting organ
ADAMA Ltd. Full Content of the Third Quarter Report 2020
20
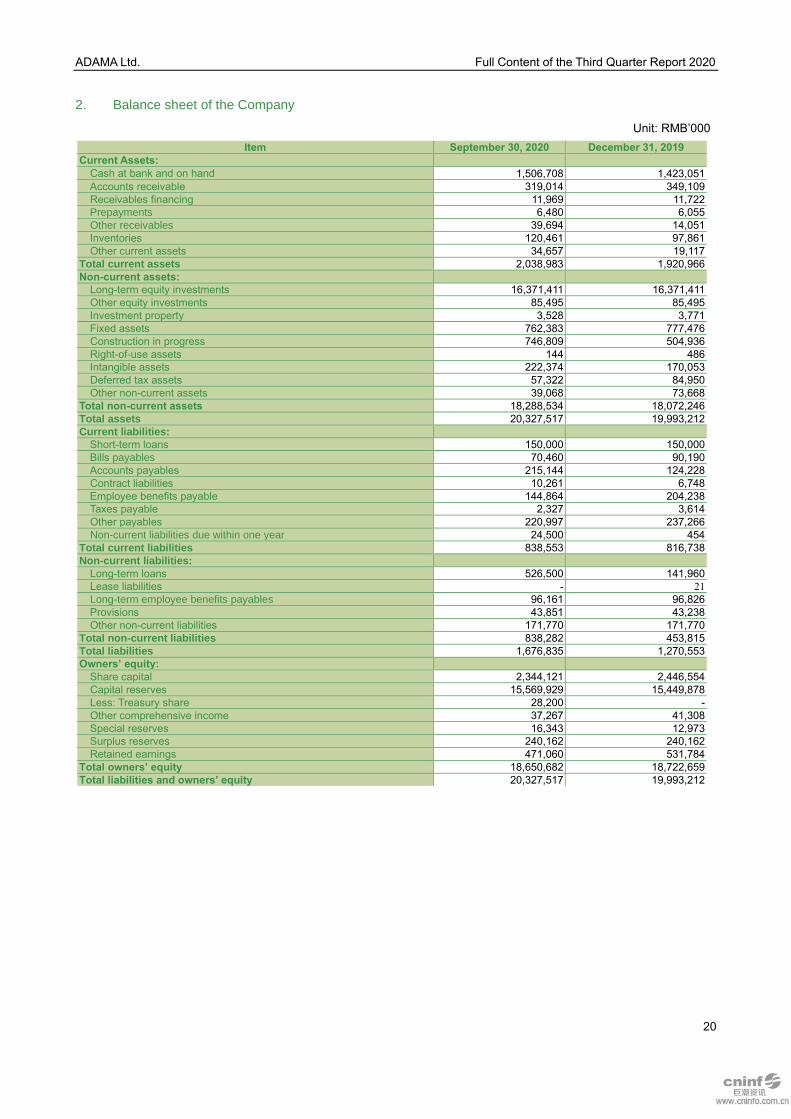
2. Balance sheet of the Company
Unit: RMB’000
Item September 30, 2020 December 31, 2019
Current Assets:
Cash at bank and on hand 1,506,708 1,423,051
Accounts receivable 319,014 349,109
Receivables financing 11,969 11,722
Prepayments 6,480 6,055
Other receivables 39,694 14,051
Inventories 120,461 97,861
Other current assets 34,657 19,117
Total current assets 2,038,983 1,920,966
Non-current assets:
Long-term equity investments 16,371,411 16,371,411
Other equity investments 85,495 85,495
Investment property 3,528 3,771
Fixed assets 762,383 777,476
Construction in progress 746,809 504,936
Right-of-use assets 144 486
Intangible assets 222,374 170,053
Deferred tax assets 57,322 84,950
Other non-current assets 39,068 73,668
Total non-current assets 18,288,534 18,072,246
Total assets 20,327,517 19,993,212
Current liabilities:
Short-term loans 150,000 150,000
Bills payables 70,460 90,190
Accounts payables 215,144 124,228
Contract liabilities 10,261 6,748
Employee benefits payable 144,864 204,238
Taxes payable 2,327 3,614
Other payables 220,997 237,266
Non-current liabilities due within one year 24,500 454
Total current liabilities 838,553 816,738
Non-current liabilities:
Long-term loans 526,500 141,960
Lease liabilities - 21
Long-term employee benefits payables 96,161 96,826
Provisions 43,851 43,238
Other non-current liabilities 171,770 171,770
Total non-current liabilities 838,282 453,815
Total liabilities 1,676,835 1,270,553
Owners’ equity:
Share capital 2,344,121 2,446,554
Capital reserves 15,569,929 15,449,878
Less: Treasury share 28,200 -
Other comprehensive income 37,267 41,308
Special reserves 16,343 12,973
Surplus reserves 240,162 240,162
Retained earnings 471,060 531,784
Total owners’ equity 18,650,682 18,722,659
Total liabilities and owners’ equity 20,327,517 19,993,212
ADAMA Ltd. Full Content of the Third Quarter Report 2020
21
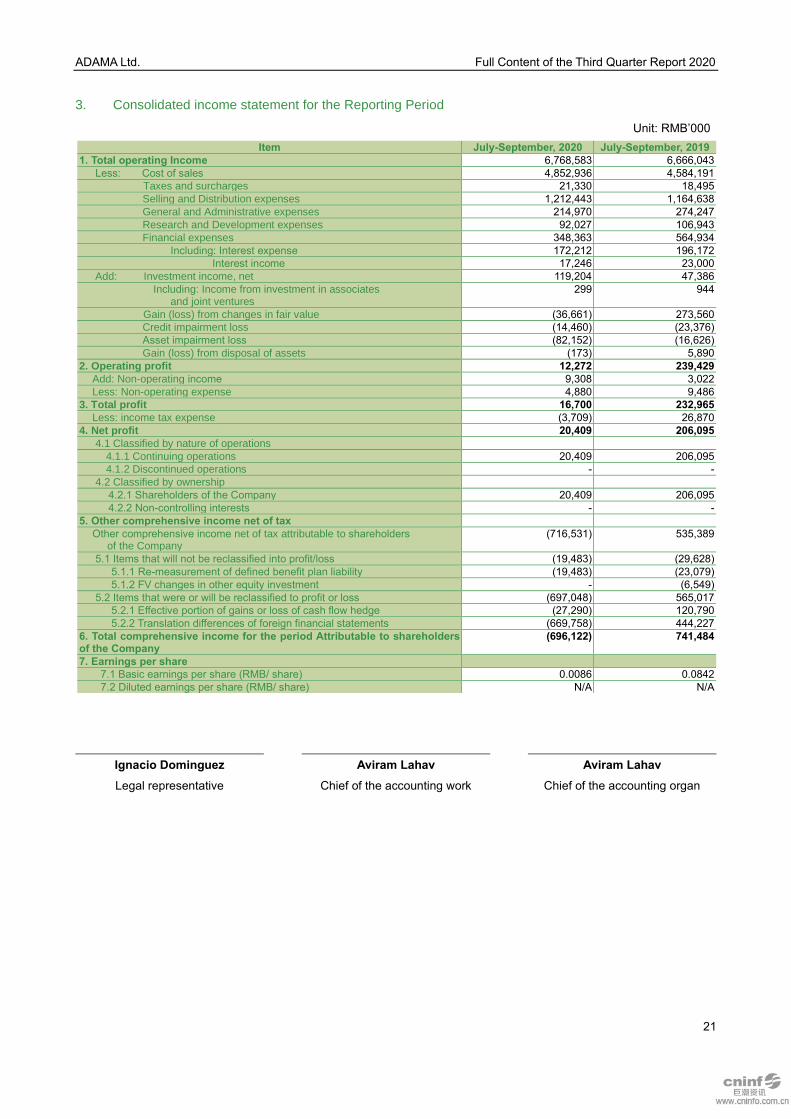
3. Consolidated income statement for the Reporting Period
Unit: RMB’000
Item July-September, 2020 July-September, 2019
1. Total operating Income 6,768,583 6,666,043
Less: Cost of sales 4,852,936 4,584,191
Taxes and surcharges 21,330 18,495
Selling and Distribution expenses 1,212,443 1,164,638
General and Administrative expenses 214,970 274,247
Research and Development expenses 92,027 106,943
Financial expenses 348,363 564,934
Including: Interest expense 172,212 196,172
Interest income 17,246 23,000
Add: Investment income, net 119,204 47,386
Including: Income from investment in associates and joint ventures
299 944
Gain (loss) from changes in fair value (36,661) 273,560
Credit impairment loss (14,460) (23,376)
Asset impairment loss (82,152) (16,626)
Gain (loss) from disposal of assets (173) 5,890
2. Operating profit 12,272 239,429
Add: Non-operating income 9,308 3,022
Less: Non-operating expense 4,880 9,486
3. Total profit 16,700 232,965
Less: income tax expense (3,709) 26,870
4. Net profit 20,409 206,095
4.1 Classified by nature of operations
4.1.1 Continuing operations 20,409 206,095
4.1.2 Discontinued operations - -
4.2 Classified by ownership
4.2.1 Shareholders of the Company 20,409 206,095
4.2.2 Non-controlling interests - -
5. Other comprehensive income net of tax
Other comprehensive income net of tax attributable to shareholders of the Company
(716,531) 535,389
5.1 Items that will not be reclassified into profit/loss (19,483) (29,628)
5.1.1 Re-measurement of defined benefit plan liability (19,483) (23,079)
5.1.2 FV changes in other equity investment - (6,549)
5.2 Items that were or will be reclassified to profit or loss (697,048) 565,017
5.2.1 Effective portion of gains or loss of cash flow hedge (27,290) 120,790
5.2.2 Translation differences of foreign financial statements (669,758) 444,227
6. Total comprehensive income for the period Attributable to shareholders of the Company
(696,122) 741,484
7. Earnings per share
7.1 Basic earnings per share (RMB/ share) 0.0086 0.0842
7.2 Diluted earnings per share (RMB/ share) N/A N/A
Ignacio Dominguez
Legal representative
Aviram Lahav
Chief of the accounting work
Aviram Lahav
Chief of the accounting organ
ADAMA Ltd. Full Content of the Third Quarter Report 2020
22
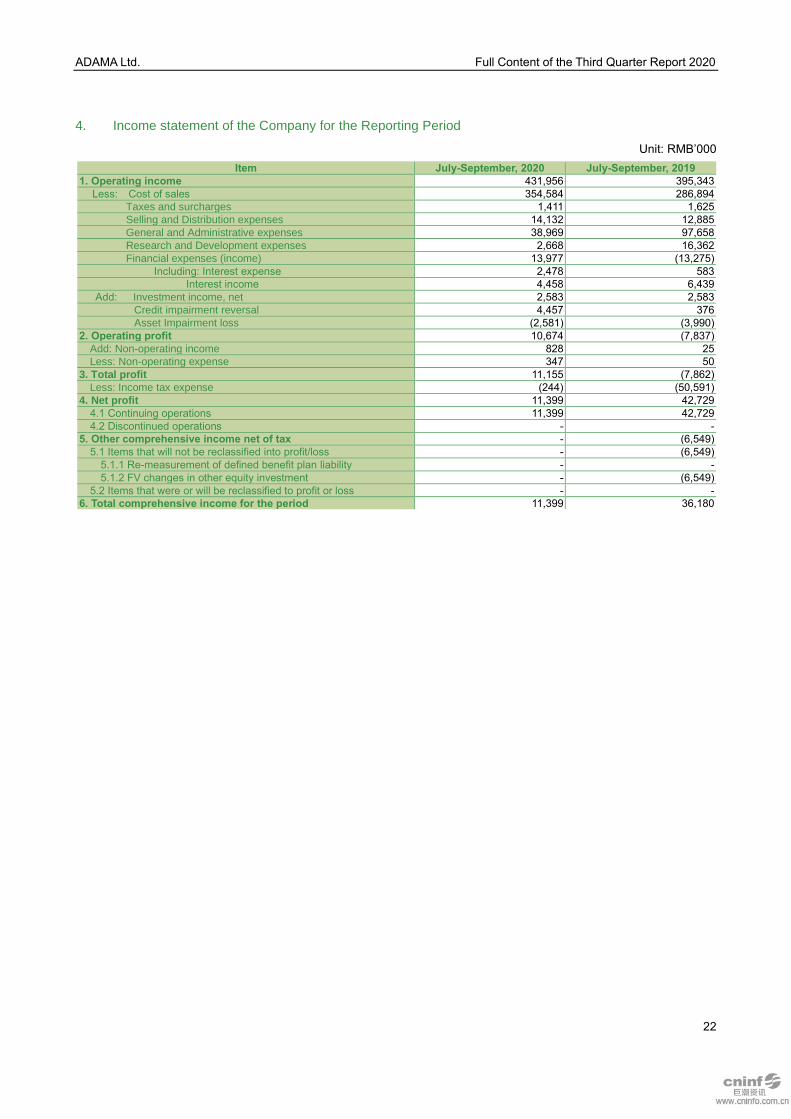
4. Income statement of the Company for the Reporting Period
Unit: RMB’000
Item July-September, 2020 July-September, 2019
1. Operating income 431,956 395,343
Less: Cost of sales 354,584 286,894
Taxes and surcharges 1,411 1,625
Selling and Distribution expenses 14,132 12,885
General and Administrative expenses 38,969 97,658
Research and Development expenses 2,668 16,362
Financial expenses (income) 13,977 (13,275)
Including: Interest expense 2,478 583
Interest income 4,458 6,439
Add: Investment income, net 2,583 2,583
Credit impairment reversal 4,457 376
Asset Impairment loss (2,581) (3,990)
2. Operating profit 10,674 (7,837)
Add: Non-operating income 828 25
Less: Non-operating expense 347 50
3. Total profit 11,155 (7,862)
Less: Income tax expense (244) (50,591)
4. Net profit 11,399 42,729
4.1 Continuing operations 11,399 42,729
4.2 Discontinued operations - -
5. Other comprehensive income net of tax - (6,549)
5.1 Items that will not be reclassified into profit/loss - (6,549)
5.1.1 Re-measurement of defined benefit plan liability - -
5.1.2 FV changes in other equity investment - (6,549)
5.2 Items that were or will be reclassified to profit or loss - -
6. Total comprehensive income for the period 11,399 36,180
ADAMA Ltd. Full Content of the Third Quarter Report 2020
23
5. Consolidated income statement for the period from the year-beginning to the end of the Reporting
Period
Unit: RMB’000
Item January-September, 2020 January-September, 2019
1. Total operating Income 20,889,623 20,282,075
Less: Cost of sales 14,757,406 13,607,433
Taxes and surcharges 67,447 64,721
Selling and Distribution expenses 3,681,011 3,664,412
General and Administrative expenses 768,156 902,506
Research and Development expenses 280,212 317,642
Financial expenses: 1,191,155 1,503,130
Including: Interest expense 522,253 521,310
Interest income 46,871 64,534
Add: Investment income (loss), net 171,333 (467,057)
Including: Income from investment in associates and joint ventures
14,691 22,668
Gain (loss) from changes in fair value 228,849 1,157,695
Credit impairment loss (8,871) (20,029)
Asset impairment loss (107,528) (40,435)
Gain from disposal of assets 7,521 121,404
2. Operating profit 435,540 973,809
Add: Non-operating income 48,328 13,833
Less: Non-operating expense 18,321 25,502
3. Total profit 465,547 962,140
Less: income tax expense 240,489 167,407
4. Net profit 225,058 794,733
4.1 Classified by nature of operations
4.1.1 Continuing operations 225,058 794,733
4.1.2 Discontinued operations - -
4.2 Classified by ownership
4.2.1 Shareholders of the Company 225,058 794,733
4.2.2 Non-controlling interests - -
5. Other comprehensive income net of tax
Other comprehensive income net of tax attributable to shareholders of the Company
(569,158) 421,918
5.1 Items that will not be reclassified into profit/loss 19,890 (34,045)
5.1.1 Re-measurement of defined benefit plan liability 19,890 (37,057)
5.1.2 FV changes in other equity investment - 3,012
5.2 Items that were or will be reclassified to profit or loss (589,048) 455,963
5.2.1 Effective portion of gains or loss of cash flow hedge (105,575) (31,203)
5.2.2 Translation differences of foreign financial statements (483,473) 487,166
6. Total comprehensive income for the period Attributable to shareholders of the Company
(344,100) 1,216,651
7. Earnings per share
7.1 Basic earnings per share (RMB/ share) 0.0929 0.3248
7.2 Diluted earnings per share (RMB/ share) N/A N/A
Ignacio Dominguez
Legal representative
Aviram Lahav
Chief of the accounting work
Aviram Lahav
Chief of the accounting organ
ADAMA Ltd. Full Content of the Third Quarter Report 2020
24
6. Income statement of the Company for the period from the year-beginning to the end of the Reporting
Period
Unit: RMB’000
Item January-September, 2020 January-September, 2019
1. Operating income 1,105,602 1,130,769
Less: Cost of sale 891,898 805,455
Taxes and surcharges 4,232 10,535
Selling and Distribution expenses 31,204 55,939
General and Administrative expenses 172,307 288,608
Research and Development expenses 7,227 40,826
Financial expenses : 9,151 (14,529)
Including: Interest expense 5,621 2,642
Interest income 12,965 20,772
Add: Investment income (loss), net 2,583 2,583
Credit impairment loss 3,783 (1,257)
Asset Impairment loss (5,445) (4,262)
Gain from disposal of assets 101 -
2. Operating profit (9,395) (59,001)
Add: Non-operating income 6,425 4,455
Less: Non-operating expense 767 1,946
3. Total profit (3,737) (56,492)
Less: Income tax expense 27,628 (61,432)
4. Net profit (31,365) 4,940
4.1 Continuing operations (31,365) 4,940
4.2 Discontinued operations - -
5. Other comprehensive income net of tax (4,041) (1,499)
5.1 Items that will not be reclassified into profit/loss (4,041) (1,499)
5.1.1 Re-measurement of defined benefit plan liability (4,041) (1,499)
5.2 Items that were or will be reclassified to profit or loss - -
6. Total comprehensive income for the period (35,406) 3,441
ADAMA Ltd. Full Content of the Third Quarter Report 2020
25
7. Consolidated cash flow statement for the period from the year-beginning to the end of the Reporting
Period
Unit: RMB’000
Item January-September, 2020 January-September, 2019
1. Cash flows from operating activities:
Cash received from sale of goods and rendering of services 19,666,330 18,678,554
Refund of taxes and surcharges 156,475 50,825
Cash received relating to other operating activities 653,446 385,343
Sub-total of cash inflows from operating activities 20,476,251 19,114,722
Cash paid for goods and services 13,839,037 13,819,496
Cash paid to and on behalf of employees 2,751,086 2,589,280
Payments of taxes and surcharges 289,260 579,208
Cash paid relating to other operating activities 2,204,868 2,032,477
Sub-total of cash outflows from operating activities 19,084,251 19,020,461
Net cash flows from operating activities 1,392,000 94,261
2. Cash flows from investing activities:
Cash received from disposal of investments 27,994 20,173
Cash received from returns of investments 54,304 7,763
Net cash received from disposal of fixed assets, intangible assets and other long-term assets
17,615 182,089
Cash received from other investing activities 2,673 59,687
Sub-total of cash inflows from investing activities 102,586 269,712
Cash paid to acquire fixed assets, intangible assets and other long-term assets
1,301,309 1,090,047
Cash paid for acquisition of investments 51,435 -
Net cash paid to acquire subsidiaries or other business units 96,207 826,805
Cash paid for other investing activities 47,739 15,177
Sub-total of cash outflows from investing activities 1,496,690 1,932,029
Net cash flows from investing activities (1,394,104) (1,662,317)
3. Cash flows from financing activities:
Cash received from borrowings 3,852,354 2,668,024
Cash received relating to other financing activities 74,843 132,216
Sub-total of cash inflows from financing activities 3,927,197 2,800,240
Cash repayment of borrowings 1,671,913 1,483,578
Cash payment for dividends, profit distributions or interest 411,063 706,890
Including: dividends paid to non-controlling interest 26,176 29,209
Cash paid relating to other financing activities 320,160 894,617
Sub-total of cash outflows from financing activities 2,403,136 3,085,085
Net cash flows from financing activities 1,524,061 (284,845)
4. Effect of foreign exchange rate changes on cash and cash Equivalents
(147,850) 61,806
5. Net increase (decrease) in cash and cash equivalents 1,374,107 (1,791,095)
Add: Cash and cash equivalents at the beginning of the period 4,319,907 6,346,196
6. Cash and cash equivalents at the end of the period 5,694,014 4,555,101
ADAMA Ltd. Full Content of the Third Quarter Report 2020
26
8. Cash flow statement of the Company for the period from the year-beginning to the end of the
Reporting Period
Unit: RMB’000
Item January-September, 2020 January-September, 2019
1. Cash flows from operating activities:
Cash received from sale of goods and rendering of services 1,043,838 1,357,646
Refund of taxes and surcharges 55,557 25,691
Cash received relating to other operating activities 21,070 26,770
Sub-total of cash inflows from operating activities 1,120,465 1,410,107
Cash paid for goods and services 764,441 843,164
Cash paid to and on behalf of employees 163,232 138,028
Payments of taxes and surcharges 7,211 76,174
Cash paid relating to other operating activities 140,369 133,914
Sub-total of cash outflows from operating activities 1,075,253 1,191,280
Net cash flows from operating activities 45,212 218,827
2. Cash flows from investing activities:
Cash received from returns of investments 2,583 4,391
Net cash received from disposal of fixed assets, intangible assets and other long-term assets 114 -
Sub-total of cash inflows from investing activities 2,697 4,391
Cash paid for acquisition of investments - 415,000
Cash paid to acquire fixed assets, intangible assets and other long-term assets 311,234 214,548
Sub-total of cash outflows from investing activities 311,234 629,548
Net cash flows from investing activities (308,537) (625,157)
3. Cash flows from financing activities:
Cash received from borrowings 601,500 190,000
Cash received relating to other financing activities 5,919 39,886
Sub-total of cash inflows from financing activities 607,419 229,886
Cash repayment of borrowings 192,500 92,000
Cash payment for dividends, profit distributions or interest 25,221 240,028
Cash paid relating to other financing activities 28,400 8,836
Sub-total of cash outflows from financing activities 246,121 340,864
Net cash flows from financing activities 361,298 (110,978)
4. Effect of foreign exchange rate changes on cash and cash Equivalents (8,397) (184)
5. Net increase (decrease) in cash and cash equivalents 89,576 (517,492)
Add: cash and cash equivalents at the beginning of the period 1,395,994 2,005,313
6. Cash and cash equivalents at the end of the period 1,485,570 1,487,821
ADAMA Ltd. Full Content of the Third Quarter Report 2020
27
II. Adjustments of the financial statements
1. Opening balance adjustments due to adoption of new accounting standards for financial instruments,
revenue and leases
□ Applicable √ Not applicable
2. Retrospective adjustments due to adoption of new accounting standards for financial instruments,
revenue and leases
□ Applicable √ Not applicable
III. Auditor’s report
Is this Report audited?
□ Yes √ No
This Report is unaudited.
ADAMA Ltd.
October 29, 2020