Embed Size (px)
Citation preview
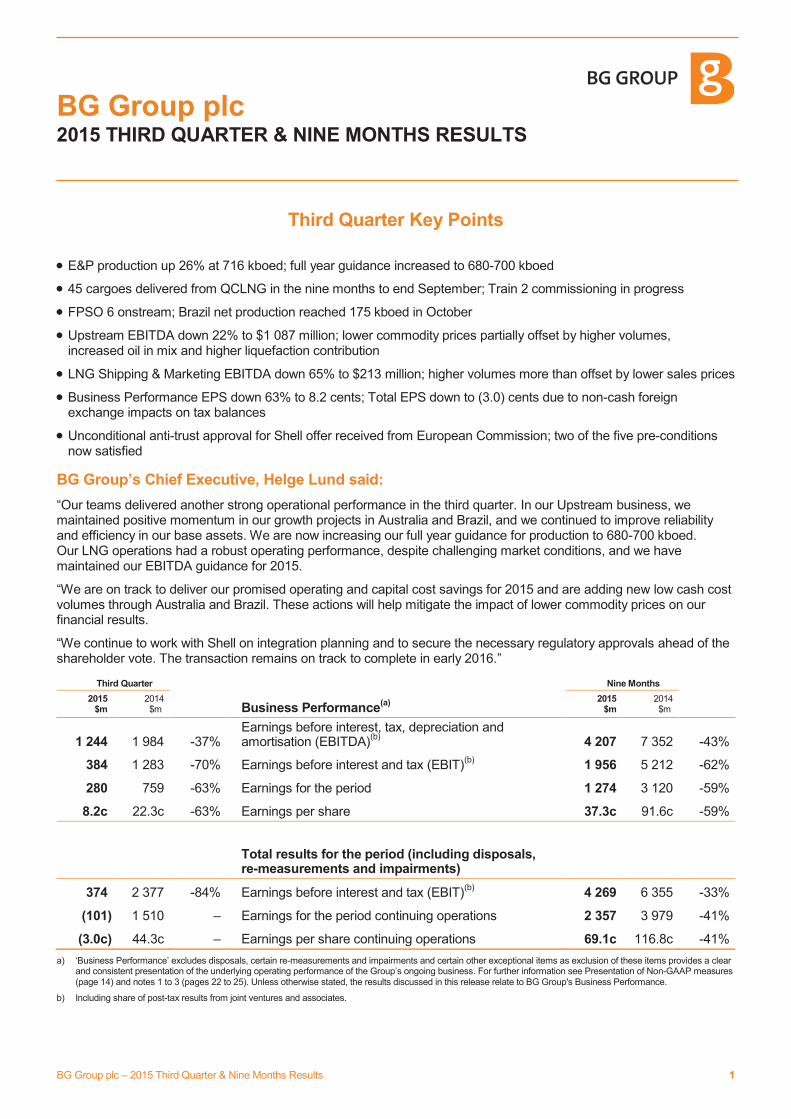
BG Group plc
2015 THIRD QUARTER & NINE MONTHS RESULTS
BG Group plc – 2015 Third Quarter & Nine Months Results 1
Third Quarter Key Points
· E&P production up 26% at 716 kboed; full year guidance increased to 680-700 kboed
· 45 cargoes delivered from QCLNG in the nine months to end September; Train 2 commissioning in progress
· FPSO 6 onstream; Brazil net production reached 175 kboed in October
· Upstream EBITDA down 22% to $1 087 million; lower commodity prices partially offset by higher volumes, increased oil in mix and higher liquefaction contribution
· LNG Shipping & Marketing EBITDA down 65% to $213 million; higher volumes more than offset by lower sales prices
· Business Performance EPS down 63% to 8.2 cents; Total EPS down to (3.0) cents due to non-cash foreign exchange impacts on tax balances
· Unconditional anti-trust approval for Shell offer received from European Commission; two of the five pre-conditions now satisfied
BG Group’s Chief Executive, Helge Lund said:
“Our teams delivered another strong operational performance in the third quarter. In our Upstream business, we maintained positive momentum in our growth projects in Australia and Brazil, and we continued to improve reliability and efficiency in our base assets. We are now increasing our full year guidance for production to 680-700 kboed. Our LNG operations had a robust operating performance, despite challenging market conditions, and we have maintained our EBITDA guidance for 2015.
“We are on track to deliver our promised operating and capital cost savings for 2015 and are adding new low cash cost volumes through Australia and Brazil. These actions will help mitigate the impact of lower commodity prices on our financial results.
“We continue to work with Shell on integration planning and to secure the necessary regulatory approvals ahead of the shareholder vote. The transaction remains on track to complete in early 2016.”
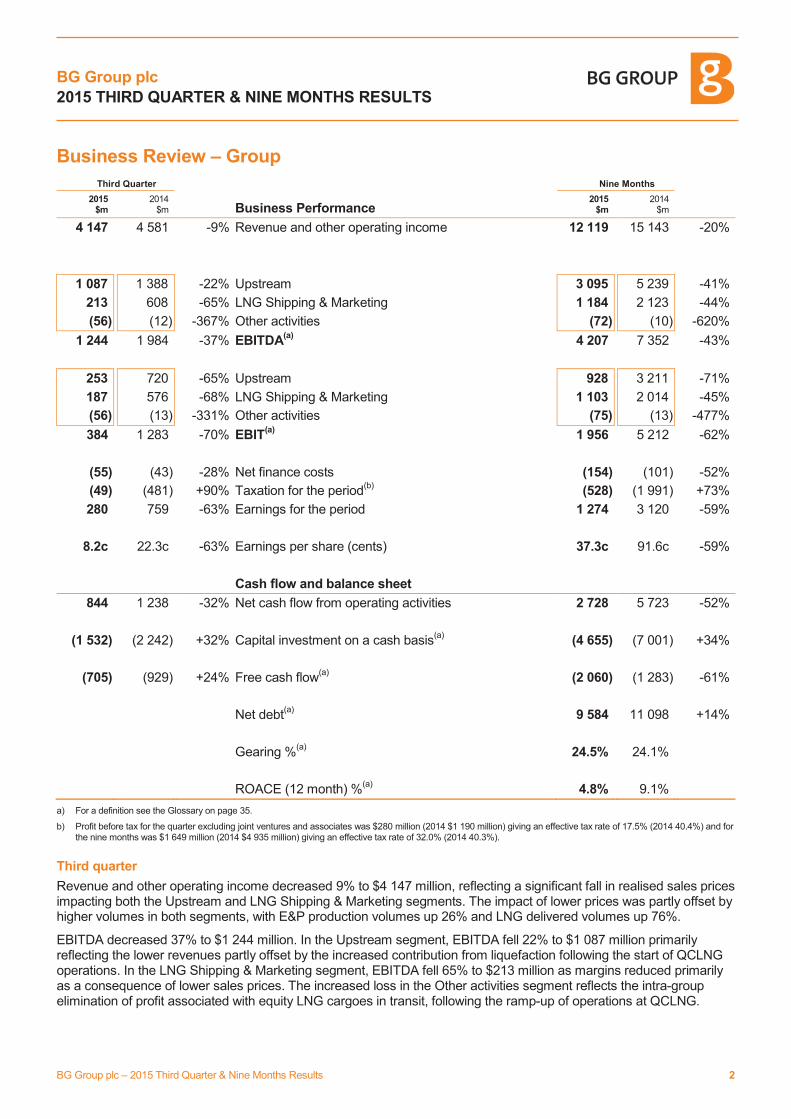
Third Quarter Nine Months
2015 $m
2014 $m Business Performance
(a)
2015 $m
2014 $m
1 244 1 984 -37% Earnings before interest, tax, depreciation and amortisation (EBITDA)
(b) 4 207 7 352 -43%
384 1 283 -70% Earnings before interest and tax (EBIT)(b)
1 956 5 212 -62%
280 759 -63% Earnings for the period 1 274 3 120 -59%
8.2c 22.3c -63% Earnings per share 37.3c 91.6c -59%
Total results for the period (including disposals, re-measurements and impairments)
374 2 377 -84% Earnings before interest and tax (EBIT)(b)
4 269 6 355 -33%
(101) 1 510 – Earnings for the period continuing operations 2 357 3 979 -41%
(3.0c) 44.3c – Earnings per share continuing operations 69.1c 116.8c -41%
a) ‘Business Performance’ excludes disposals, certain re-measurements and impairments and certain other exceptional items as exclusion of these items provides a clear and consistent presentation of the underlying operating performance of the Group’s ongoing business. For further information see Presentation of Non-GAAP measures (page 14) and notes 1 to 3 (pages 22 to 25). Unless otherwise stated, the results discussed in this release relate to BG Group's Business Performance.
b) Including share of post-tax results from joint ventures and associates.
BG Group plc
2015 THIRD QUARTER & NINE MONTHS RESULTS
BG Group plc – 2015 Third Quarter & Nine Months Results 2
Business Review – Group
Third Quarter Nine Months
2015 $m
2014 $m Business Performance
2015 $m
2014 $m
4 147 4 581 -9% Revenue and other operating income 12 119 15 143 -20%
1 087 1 388 -22% Upstream 3 095 5 239 -41%
213 608 -65% LNG Shipping & Marketing 1 184 2 123 -44%
(56) (12) -367% Other activities (72) (10) -620%
1 244 1 984 -37% EBITDA(a)
4 207 7 352 -43%
253 720 -65% Upstream 928 3 211 -71%
187 576 -68% LNG Shipping & Marketing 1 103 2 014 -45%
(56) (13) -331% Other activities (75) (13) -477%
384 1 283 -70% EBIT(a)
1 956 5 212 -62%
(55) (43) -28% Net finance costs (154) (101) -52%
(49) (481) +90% Taxation for the period(b)
(528) (1 991) +73%
280 759 -63% Earnings for the period 1 274 3 120 -59%
8.2c 22.3c -63% Earnings per share (cents) 37.3c 91.6c -59%
Cash flow and balance sheet
844 1 238 -32% Net cash flow from operating activities 2 728 5 723 -52%
(1 532) (2 242) +32% Capital investment on a cash basis(a)
(4 655) (7 001) +34%
(705) (929) +24% Free cash flow(a)
(2 060) (1 283) -61%
Net debt(a)
9 584 11 098 +14%
Gearing %(a)
24.5% 24.1%
ROACE (12 month) %(a)
4.8% 9.1%
a) For a definition see the Glossary on page 35.
b) Profit before tax for the quarter excluding joint ventures and associates was $280 million (2014 $1 190 million) giving an effective tax rate of 17.5% (2014 40.4%) and for the nine months was $1 649 million (2014 $4 935 million) giving an effective tax rate of 32.0% (2014 40.3%).
Third quarter
Revenue and other operating income decreased 9% to $4 147 million, reflecting a significant fall in realised sales prices impacting both the Upstream and LNG Shipping & Marketing segments. The impact of lower prices was partly offset by higher volumes in both segments, with E&P production volumes up 26% and LNG delivered volumes up 76%.
EBITDA decreased 37% to $1 244 million. In the Upstream segment, EBITDA fell 22% to $1 087 million primarily reflecting the lower revenues partly offset by the increased contribution from liquefaction following the start of QCLNG operations. In the LNG Shipping & Marketing segment, EBITDA fell 65% to $213 million as margins reduced primarily as a consequence of lower sales prices. The increased loss in the Other activities segment reflects the intra-group elimination of profit associated with equity LNG cargoes in transit, following the ramp-up of operations at QCLNG.
BG Group plc
2015 THIRD QUARTER & NINE MONTHS RESULTS
BG Group plc – 2015 Third Quarter & Nine Months Results 3
Business Review – Group continued
Third quarter continued
EBIT decreased by $899 million to $384 million, reflecting the reduced EBITDA and higher DD&A charges primarily as a result of increased E&P production and the start-up of QCLNG.
Net finance costs of $55 million included foreign exchange gains of $48 million (2014 net finance costs of $43 million included realised foreign exchange hedge gains of $24 million and other foreign exchange losses of $29 million). Excluding the impact of foreign exchange, net finance costs increased by $65 million to $103 million, reflecting the reduction in the amount of interest on borrowings that can be capitalised against assets under construction following the start-up of QCLNG.
The tax charge for the quarter reduced to $49 million. This reflects the lower profit before tax and the year-to-date impact of a reduction in the Group’s estimated 2015 full year effective tax rate (excluding BG Group’s share of joint ventures and associates’ results and tax) to 32.0%, from previous guidance of 35%. In the current low commodity price environment, the full year rate remains sensitive to movements in the Group’s profits by jurisdiction, but is currently expected to outturn in the range 30-35%.
Group earnings of $280 million and EPS of 8.2 cents both decreased 63%, with the reduction in EBIT only partially offset by the reduction in the Group’s effective tax rate.
Net cash flow from operating activities decreased by $394 million as a result of lower Business Performance EBIT, partly offset by lower tax payments.
Capital investment on a cash basis was 32% lower at $1 532 million and was entirely in the Upstream segment, consisting of $1 358 million on development and other activities, and $174 million on exploration. The development spend was concentrated primarily in Brazil ($687 million) and Australia ($292 million).
Free cash flow improved by $224 million to a $705 million outflow, reflecting a $710 million reduction in capital investment, partly offset by the $394 million decrease in net cash flow from operating activities.
Nine months
Revenue and other operating income decreased 20% to $12 119 million, reflecting a significant fall in realised sales prices impacting both the Upstream and LNG Shipping & Marketing segments. The impact of lower prices was partly offset by weather-related gains in North America in the LNG Shipping & Marketing segment and higher volumes in both segments, with E&P production volumes up 15% and LNG delivered volumes up 48%.
EBITDA decreased 43% to $4 207 million. In the Upstream segment, EBITDA fell 41% to $3 095 million primarily reflecting the lower revenues, partly offset by the increased liquefaction contribution from QCLNG. In the LNG Shipping & Marketing segment, EBITDA fell 44% to $1 184 million as margins reduced through a combination of lower sales prices and a greater proportion of relatively lower margin spot cargoes. The EBITDA loss reported in Other activities increased to $72 million, reflecting the intra-group elimination of profit associated with equity LNG cargoes in transit.
EBIT decreased by $3 256 million to $1 956 million, reflecting the reduction in EBITDA and higher DD&A charges, which resulted from higher E&P production volumes and the start-up of QCLNG.
Net finance costs of $154 million included foreign exchange gains of $27 million (2014 net finance costs of $101 million included realised foreign exchange hedge gains of $41 million and other foreign exchange losses of $25 million). Excluding the impact of foreign exchange, net finance costs increased by $64 million to $181 million primarily reflecting the reduction in the amount of interest on borrowings that can be capitalised.
The tax charge for the nine months reduced to $528 million and reflects the lower profit before tax and the reduction in the Group’s estimated 2015 full year effective tax rate (excluding BG Group’s share of joint ventures and associates’ results and tax) to 32.0% (2014 40.3%).
Group earnings of $1 274 million and EPS of 37.3 cents both decreased 59%, with the reduction in EBIT only partially offset by the reduction in the Group’s effective tax rate.
Net cash flow from operating activities decreased by $2 995 million as a result of lower Business Performance EBIT and a working capital cash outflow, offset by lower tax payments.
Capital investment on a cash basis was 34% lower at $4 655 million and was entirely in the Upstream segment, consisting of $4 185 million on development and other activities, and $470 million on exploration. The development spend was concentrated primarily in Brazil ($1 951 million) and Australia ($988 million).
BG Group plc
2015 THIRD QUARTER & NINE MONTHS RESULTS
BG Group plc – 2015 Third Quarter & Nine Months Results 4
Business Review – Group continued
Nine months continued
Free cash flow worsened by $777 million to a $2 060 million outflow, primarily reflecting the decrease in net cash flow from operating activities, partly offset by the lower capital investment. The total cash inflow for the nine months was $969 million, including $4 597 million gross proceeds from the disposal of the QCLNG pipeline.
Net debt of $9 584 million fell by $1 514 million as a result of the QCLNG pipeline disposal, and gearing remained broadly flat at 24.5%. Return on average capital employed reduced to 4.8%, reflecting the lower Business Performance results.
Total Results (including disposals, re-measurements and impairments)
Third quarter
Total earnings for the third quarter of 2015 were a loss of $101 million (loss of 3.0 cents per share) and included a post-tax loss of $381 million in respect of disposals, re-measurements and impairments primarily as a result of a $344 million net charge reflecting the impact of foreign exchange movements on deferred and current tax balances, especially in Brazil and Australia, resulting from the appreciation of the US Dollar. Total earnings in the third quarter of 2014 were $1 510 million (44.3 cents per share) and included a post-tax gain of $751 million in respect of disposals, re-measurements and impairments, of which $771 million was a gain arising from the disposal of the Central Area Transmission System (CATS) gas pipeline in the UK.
Nine months
Total earnings for the nine months of 2015 were $2 357 million (69.1 cents per share) and included a post-tax gain of $1 083 million in respect of disposals, re-measurements and impairments primarily associated with the $1 650 million gain on sale of the QCLNG pipeline, partially offset by a $708 million net charge reflecting the impact of foreign exchange movements on deferred and current tax balances, especially in Brazil and Australia. Total earnings for the nine months of 2014 were $3 979 million (116.8 cents per share) and included a post-tax gain of $859 million in respect of disposals, re-measurements and impairments, of which $771 million was a gain arising from the disposal of the CATS gas pipeline in the UK, and $170 million was a gain arising from the sale of six LNG vessels.
For further information see Presentation of Non-GAAP measures (page 14) and notes 1 to 3 (pages 22 to 25).
BG Group plc
2015 THIRD QUARTER & NINE MONTHS RESULTS
BG Group plc – 2015 Third Quarter & Nine Months Results 5
Recommended cash and share offer for BG Group plc by Royal Dutch Shell plc
On 8 April, the Boards of Royal Dutch Shell plc (Shell) and BG Group plc announced that they had reached agreement on the terms of a recommended cash and share offer to be made by Shell for the entire issued and to be issued share capital of BG Group plc.
Under the terms of the Combination, which will be subject to certain pre-conditions and conditions, BG Group plc shareholders will be entitled to receive, for each BG Group plc share, 383 pence in cash and 0.4454 Shell B Shares.
Please refer to the Rule 2.7 announcement at www.bg-group.com/shelloffer for further details.
Anti-trust regulatory clearance for the transaction was received from the European Commission in September. Together with the Brazilian Conselho Administrativo de Defesa Econômica (CADE) approval, which was received in July, this means that two of the five pre-conditions in relation to the Combination have been satisfied.
In September, the Australian Competition and Consumer Commission (ACCC) published a Statement of Issues seeking further information and views on the proposed transaction.
The transaction is expected to complete in early 2016.
Third quarter business highlights
Overview
E&P production was 716 thousand barrels of oil equivalent per day (kboed), up 26% from the third quarter of 2014. Growth in the third quarter was driven by Australia, Brazil and Norway. Volumes in Australia almost trebled to 98 kboed and in Brazil, almost doubled to 158 kboed. In Norway, Knarr continued to ramp up, producing 13 kboed in the quarter. This growth was partially offset by the expected decline in Egypt, down 12 kboed to 43 kboed. The Group’s performance in the third quarter was ahead of the guidance provided at the second quarter as a result of FPSO 6 coming onstream ahead of schedule and better than expected uptime across the Santos Basin; certain shutdowns rescheduled into the fourth quarter; and better operating efficiency across a number of assets.
The LNG Shipping & Marketing segment delivered 75 cargoes (4.8 million tonnes) in the quarter, 31 more cargoes than the third quarter of 2014 (2.1 million additional tonnes). Increased supply was driven by 25 cargoes from QCLNG and six additional spot cargoes. Of the 75 cargoes (2014 44), 54 were supplied to Asian markets (2014 33). The Group delivered its first ever cargoes to Egypt and Pakistan during the quarter.
Australia
QCLNG Train 1 has been running at plateau. Train 2 commenced operations in July and commissioning is progressing, ahead of the start of commercial operations. In the third quarter, a total of 27 cargoes were produced across both trains, making a total of 52 since the start of 2015. During the third quarter, 25 cargoes were delivered to customers.
E&P production in Australia has continued to ramp-up according to plan, achieving its highest level in a single day of around 118 kboed in October and averaging 98 kboed for the quarter, net to BG Group. During the quarter, less than 20% of the gas supplied to QCLNG was from third-party gas contracts, in line with expectations during the ramp-phase.
The integrated project remains on track to reach plateau production in mid-2016.
Brazil
In October, BG Group achieved record net production from the Santos Basin, reaching 175 kboed. Across the Santos Basin, BG Group has 23 wells in production which are flowing at an average rate of 27 kbopd (gross).
In the quarter, gross production from FPSO 4 (Cidade de Ilhabela) has averaged 86 kbopd with three producer wells and one injector well and FPSO 5 (Cidade de Mangaratiba) has averaged 127 kbopd from four producer and four injector wells. Plateau production from these FPSOs is expected during the fourth quarter.
In July, the 150 kbopd Cidade de Itaguaí (FPSO 6) for Iracema North started up and currently has two producer wells connected, and has been producing at rates of 61 kbopd. Final integration works on FPSO 7 continue in the Brasa shipyard in Brazil, while FPSO 8 is currently en route from China and is expected to arrive at Brasa in the coming weeks for final integration works. Integration works continue on FPSO 9 in Singapore. FPSOs 7 to 9 are all due onstream in 2016.
BG Group plc
2015 THIRD QUARTER & NINE MONTHS RESULTS
BG Group plc – 2015 Third Quarter & Nine Months Results 6
Third quarter business highlights continued
Brazil continued
For all replicant FPSOs, the consortium continues to closely monitor developments, including any potential impacts of the Lava Jato investigation, establishing and implementing mitigation plans where necessary.
In April 2015, Petrobras issued its final audited 2014 financial statements which included a write-off in respect of overpayments on the acquisition of property, plant and equipment incorrectly capitalised according to testimony obtained as part of the Lava Jato investigations. The impact of this write-off on BG Group’s various interests remains unknown.
Egypt
At the end of the third quarter, the amount owed by the Egyptian government was $1.1 billion, with $0.9 billion overdue. Discussions continue with the Egyptian government regarding potential future gas development programmes, subject to the negotiation of a higher domestic gas price and resolution of the outstanding receivables.
Thailand
In the third quarter, first gas was achieved from the first two Greater Bongkot South Phase 4C wellhead platforms. The remaining platform is due onstream in the first quarter of 2016.
Trinidad and Tobago
During the quarter, BG Group has revised downwards its proved and probable reserves in Trinidad and Tobago. This revision follows the start-up of the Starfish field in December 2014 where production has been lower than anticipated with only one development well now on production, and at the Dolphin field where decline rates have been higher than expected.
Canada
In September, BG Group acquired three non-operated positions offshore Newfoundland with equity stakes of 10% in blocks EL1125 and EL1126, and 25% in block EL1123. A first well is expected to be drilled in EL1123 later this year.
USA
In August, the Lake Charles LNG project received its Final Environmental Impact Statement from the Federal Energy Regulatory Commission (FERC), a key regulatory milestone for the three-train, 15 mtpa liquefaction project in Louisiana. FERC authorisation for Lake Charles LNG, the last major regulatory hurdle, is expected in November.
2015 outlook
BG Group has increased its outlook for 2015 E&P production volumes to 680 - 700 kboed, excluding any changes to the portfolio. This reflects the strong operational performance to date and the reduced duration of planned shutdowns in the second half of the year. In the fourth quarter, the Group expects continued growth in Brazil and Australia to be partly offset by a number of planned shutdowns and the continued expected decline in Egypt.
LNG Shipping & Marketing EBITDA guidance remains in the range of $1.3 - 1.5 billion for 2015 based on mid-October forward commodity price curves, with an expected outturn around the middle of the range (see page 31 for further details). Supply volumes are still expected to be slightly lower than 2014, excluding the purchase of spot cargoes and the impact of new volumes from QCLNG. As previously disclosed, the majority of the contribution from QCLNG will be reported in the Upstream segment of the business.
With cash capital expenditure of $4.7 billion in the first nine months of the year, 2015 will be significantly lower than 2014, as projects complete and the Group reacts to a lower oil price environment. Capital expenditure on a cash basis is now expected to be around 30% lower than 2014 at around $6.5 billion.
In the current low commodity price environment, the Group’s 2015 full year effective tax rate, excluding BG Group’s share of joint ventures and associates’ results and tax, remains sensitive to movements in the Group’s profits by jurisdiction, but is now expected to outturn in the range 30 - 35%.
The Group’s 2015 cost and efficiency programme is progressing well, with the emphasis on lifting, organisation and infrastructure cost savings, and remains on track to deliver at least the $300 million target savings for 2015.
BG Group’s sensitivity to a $1 per barrel movement in the oil price is still expected to be between $60 - 70 million at an earnings level and between $70 - 80 million on post-tax operating cash flow, both on an annualised basis for 2015 only.

BG Group plc
2015 THIRD QUARTER & NINE MONTHS RESULTS
BG Group plc – 2015 Third Quarter & Nine Months Results 7
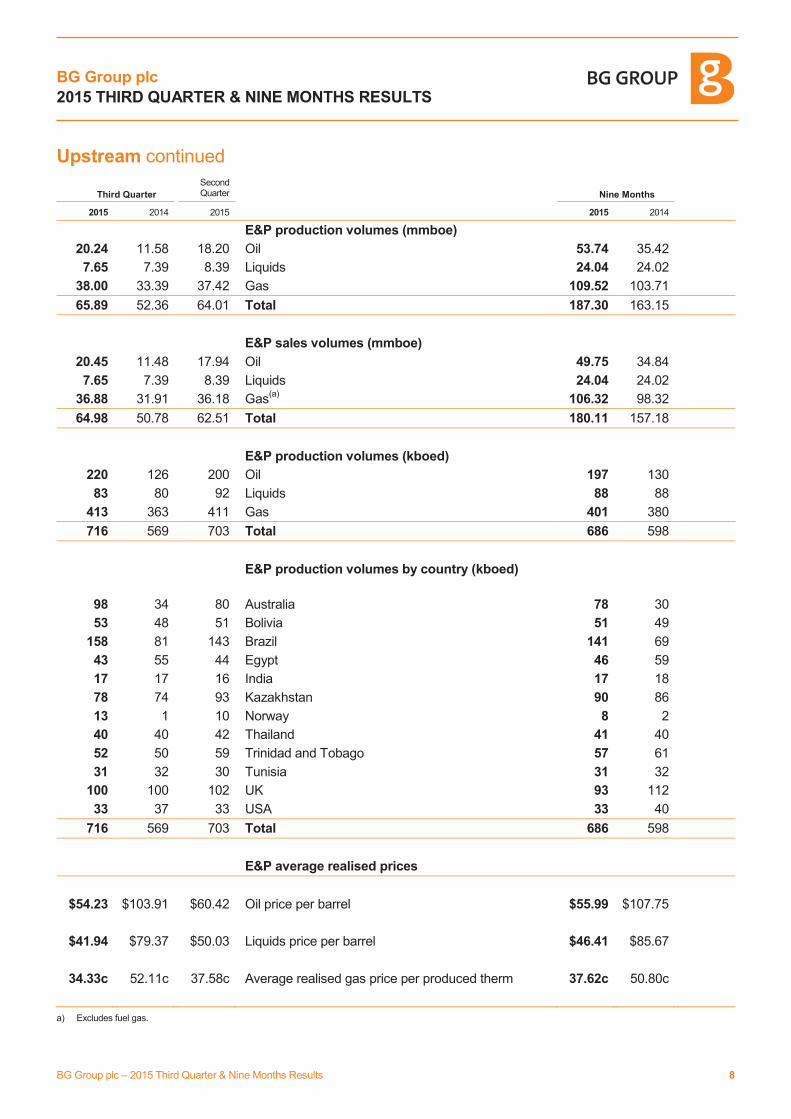
Upstream
Third Quarter Nine Months
2015 $m
2014 $m Business Performance
2015 $m
2014 $m
65.89 52.36 +26% E&P production volumes (mmboe) 187.30 163.15 +15%
2 258 2 770 -18% E&P 6 501 8 975 -28%
382 112 +241% Liquefaction 708 328 +116%
2 640 2 882 -8% Upstream revenue and other operating income 7 209 9 303 -23%
(559) (465) -20% Lifting costs (1 586) (1 365) -16%
(371) (436) +15% Royalties and other operating costs (1 088) (1 204) +10%
(930) (901) -3% E&P operating costs (2 674) (2 569) -4%
(326) (276) -18% Other E&P costs (637) (802) +21%
20 2 +900% JV and associates (post-tax) 46 10 +360%
1 022 1 595 -36% E&P EBITDA before exploration charge 3 236 5 614 -42%
(119) (235) +49% Exploration charge (391) (513) +24%
903 1 360 -34% E&P EBITDA 2 845 5 101 -44%
(210) (107) -96% Liquefaction operating costs (502) (319) -57%
20 43 -53% JV and associates (post-tax) 82 140 -41%
(8) (20) +60% Business development (38) (11) -245%
184 28 +557% Liquefaction EBITDA 250 138 +81%
1 087 1 388 -22% Upstream EBITDA 3 095 5 239 -41%
(738) (614) -20% E&P DD&A (1 907) (1 866) -2%
(51) – – Liquefaction DD&A (117) – –
(45) (54) +17% Sundry depreciation (143) (162) +12%
253 720 -65% Upstream EBIT 928 3 211 -71%
1 532 2 242 +32% Capital investment on a cash basis 4 655 6 988 +33%
Third Quarter Second Quarter Nine Months
2015 $/boe
2014 $/boe
2015 $/boe E&P unit costs and margins
2015 $/boe
2014 $/boe
34.27 52.91 37.08 Revenue and other operating income 34.71 55.01
(8.48) (8.88) (8.27) Lifting costs (8.47) (8.36)
(5.63) (8.33) (6.03) Royalties and other operating costs (5.81) (7.38)
(14.11) (17.21) (14.30) E&P operating costs (14.28) (15.74)
(4.95) (5.28) (3.76) Other E&P costs (3.40) (4.92)
0.30 0.04 0.16 JV and associates (post-tax) 0.25 0.06
15.51 30.46 19.18 E&P EBITDA margin(a)
17.28 34.41
(11.20) (11.72) (9.87) DD&A (10.18) (11.44)
4.31 18.74 9.31 E&P EBIT margin(a)
7.10 22.97
(30.26) (34.21) (27.93) E&P unit costs (27.86) (32.10)
a) Margins calculated on the basis of E&P EBIT or EBITDA before exploration charge, based on E&P production volumes. Additional operating and financial data is given on page 33.
BG Group plc
2015 THIRD QUARTER & NINE MONTHS RESULTS
BG Group plc – 2015 Third Quarter & Nine Months Results 8
Upstream continued
Third Quarter Second Quarter Nine Months
2015 2014 2015 2015 2014
E&P production volumes (mmboe)
20.24 11.58 18.20 Oil 53.74 35.42
7.65 7.39 8.39 Liquids 24.04 24.02
38.00 33.39 37.42 Gas 109.52 103.71
65.89 52.36 64.01 Total 187.30 163.15
E&P sales volumes (mmboe)
20.45 11.48 17.94 Oil 49.75 34.84
7.65 7.39 8.39 Liquids 24.04 24.02
36.88 31.91 36.18 Gas(a)
106.32 98.32
64.98 50.78 62.51 Total 180.11 157.18
E&P production volumes (kboed)
220 126 200 Oil 197 130
83 80 92 Liquids 88 88
413 363 411 Gas 401 380
716 569 703 Total 686 598
E&P production volumes by country (kboed)
98 34 80 Australia 78
30
53 48 51 Bolivia 51 49
158 81 143 Brazil 141 69
43 55 44 Egypt 46 59
17 17 16 India 17 18
78 74 93 Kazakhstan 90 86
13 1 10 Norway 8 2
40 40 42 Thailand 41 40
52 50 59 Trinidad and Tobago 57 61
31 32 30 Tunisia 31 32
100 100 102 UK 93 112
33 37 33 USA 33 40
716 569 703 Total 686 598
E&P average realised prices
$54.23 $103.91 $60.42 Oil price per barrel $55.99 $107.75
$41.94 $79.37 $50.03 Liquids price per barrel $46.41 $85.67
34.33c 52.11c 37.58c Average realised gas price per produced therm 37.62c 50.80c
a) Excludes fuel gas.
BG Group plc
2015 THIRD QUARTER & NINE MONTHS RESULTS
BG Group plc – 2015 Third Quarter & Nine Months Results 9
Upstream continued
Third quarter
E&P production volumes increased 26% reflecting the ramp-up in Brazil, Australia and Norway, partly offset by lower production in Egypt.
Revenue and other operating income decreased 8% to $2 640 million, reflecting significantly lower commodity prices, partly offset by higher volumes and an improved product mix with additional oil, primarily from Brazil.
E&P EBITDA before exploration was 36% lower at $1 022 million, primarily reflecting the decrease in revenue. Lifting costs increased 20% to $559 million following the ramp-up of production in Brazil and Australia. Operating costs increased 3% to $930 million as the increase in lifting costs was partly offset by a 15% fall in Royalties and other operating costs, reflecting lower commodity prices. Other E&P costs increased 18% to $326 million as a result of higher Brazil oil shipping costs, as well as net foreign exchange losses on certain working capital balances in Brazil as a result of the devaluation of the Brazilian Real.
E&P DD&A increased 20% to $738 million, as the impact of higher production volumes was partly offset by favourable changes in the mix of fields.
The Group’s average realised oil price decreased 48% to $54.23 per barrel, the liquids price decreased 47% to $41.94 per barrel, and the gas price per produced therm decreased 34% to 34.33 cents, reflecting reductions in market prices. As a result, unit revenues reduced $18.64 per boe to $34.27 per boe.
Unit operating expenditure decreased to $14.11 per boe (2014 $17.21 per boe), mainly due to a reduction in royalty costs per boe reflecting the lower commodity prices. Lifting costs per boe also decreased slightly as a result of the overall increase in production volumes, combined with changes in the mix of producing fields. Other E&P unit costs decreased to $4.95 per boe (2014 $5.28 per boe).
Consequently, the Group’s unit E&P EBITDA margin was $14.95 per boe lower at $15.51 per boe.
The unit DD&A charge decreased to $11.20 per boe (2014 $11.72 per boe) as a result of changes in the production mix, with lower production from higher rate fields in the UK and increased production from lower rate fields in Brazil and Australia. This was partially offset by an increased rate in Trinidad and Tobago following reserves revisions.
The E&P EBIT margin was $14.43 per boe lower at $4.31 per boe.
The exploration charge of $119 million decreased 49%, due to lower well write-off costs and reduced seismic activities. Gross exploration expenditure was marginally lower at $300 million and included spend in Trinidad and Tobago ($84 million), Canada ($74 million), the UK ($39 million) and Australia ($15 million).
Liquefaction EBITDA increased $156 million to $184 million, reflecting the first full quarter of commercial operations at QCLNG Train 1 and common facilities following the first commercial cargo delivery date (FCDD), partially offset by a small loss for the first quarter of operations at Train 2 due to lower initial tariffs charged to the E&P businesses prior to FCDD. The positive contribution from QCLNG was partly offset by lower volumes and prices at Atlantic LNG.
Capital investment on a cash basis of $1 532 million consisted of $1 358 million on development and other activities, and $174 million on exploration. The development spend was concentrated primarily on projects in Brazil ($687 million) and Australia ($292 million), together with investments in Tunisia ($60 million), Kazakhstan ($59 million) and the UK ($54 million).
Nine months
Production volumes increased 15% primarily as a result of the ramp-up in Brazil, Australia and Norway, partly offset by lower production in the UK and Egypt.
Revenue and other operating income decreased 23% to $7 209 million, reflecting significantly lower commodity prices, partly offset by higher volumes and an improved product mix with additional oil, particularly from Brazil.
E&P EBITDA before exploration was 42% lower at $3 236 million, reflecting the decrease in revenue and higher lifting costs, partially offset by lower royalties and Other E&P costs. Lifting costs increased 16% to $1 586 million, reflecting the ramp-up of production in Brazil and Australia. Royalty and other operating costs decreased 10% following the lower commodity prices. Other E&P costs decreased 21% to $637 million, including the impacts in Brazil of movements in the volume of oil held in stock, with around 6.5 mmboe of oil in stock at the end of the quarter. Other E&P costs in 2014 also included the elimination of profit associated with the Lula and Iara extended well tests.
BG Group plc
2015 THIRD QUARTER & NINE MONTHS RESULTS
BG Group plc – 2015 Third Quarter & Nine Months Results 10
Upstream continued
Nine months continued
E&P DD&A increased 2% to $1 907 million, reflecting the higher production volumes, partly offset by favourable changes in the mix of fields and the effect of impairments recorded in 2014.
The Group’s average realised oil price decreased 48% to $55.99 per barrel, the liquids price decreased 46% to $46.41 per barrel and the gas price per produced therm decreased 26% to 37.62 cents, reflecting lower market prices. As a result, unit revenues reduced $20.30 per boe to $34.71 per boe.
Unit operating expenditure decreased to $14.28 per boe (2014 $15.74 per boe), as higher lifting costs per boe were more than offset by lower royalties per boe. Lifting costs were adversely impacted by the shut-ins and planned asset integrity programme in the UK in the first quarter, and the ramp-up of production in Brazil and Australia. Lower commodity prices led to a decrease in royalty costs, although this was partly offset by an increased proportion of production from royalty paying fields, principally in Brazil. Other E&P unit costs decreased to $3.40 per boe (2014 $4.92 per boe) due to the impacts in Brazil of the timing of oil liftings and eliminations of profit on oil sales from extended well tests in 2014.
Consequently, the Group’s unit E&P EBITDA margin was $17.13 per boe lower at $17.28 per boe.
The unit DD&A charge decreased to $10.18 per boe (2014 $11.44 per boe) as a result of a change in the mix of production, with lower production from higher rate fields in the UK and increased production from lower rate fields in Brazil and Australia.
The E&P EBIT margin was $15.87 per boe lower at $7.10 per boe.
The exploration charge decreased 24% to $391 million primarily as a result of reduced seismic activities. Gross exploration expenditure decreased 20% to $730 million and included spend in Trinidad and Tobago ($195 million), the UK ($104 million), Australia ($102 million) and Canada ($74 million).
Liquefaction EBITDA increased $112 million to $250 million, with the start of production from QCLNG partly offset by Egyptian LNG, with no cargoes lifted in 2015, and lower prices and volumes at Atlantic LNG.
Capital investment on a cash basis of $4 655 million consisted of $4 185 million on development and other activities, and $470 million on exploration. The development spend was concentrated primarily on projects in Brazil ($1 951 million) and Australia ($988 million), together with investments in the UK ($241 million), Kazakhstan ($178 million), Tunisia ($146 million), Trinidad and Tobago ($137 million) and Egypt ($108 million).
BG Group plc
2015 THIRD QUARTER & NINE MONTHS RESULTS
BG Group plc – 2015 Third Quarter & Nine Months Results 11
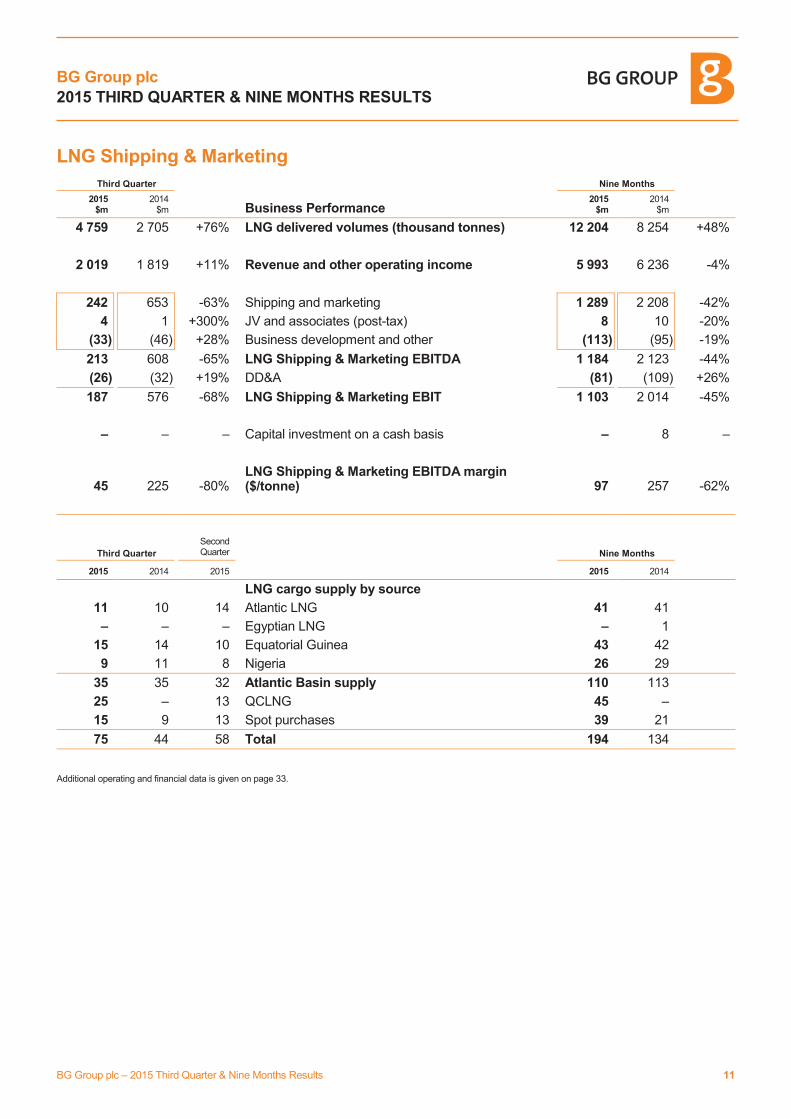
LNG Shipping & Marketing
Third Quarter Nine Months
2015 $m
2014 $m Business Performance
2015 $m
2014 $m
4 759 2 705 +76% LNG delivered volumes (thousand tonnes) 12 204 8 254 +48%
2 019 1 819 +11% Revenue and other operating income 5 993 6 236 -4%
242 653 -63% Shipping and marketing 1 289 2 208 -42%
4 1 +300% JV and associates (post-tax) 8 10 -20%
(33) (46) +28% Business development and other (113) (95) -19%
213 608 -65% LNG Shipping & Marketing EBITDA 1 184 2 123 -44%
(26) (32) +19% DD&A (81) (109) +26%
187 576 -68% LNG Shipping & Marketing EBIT 1 103 2 014 -45%
– – – Capital investment on a cash basis – 8 –
45 225 -80% LNG Shipping & Marketing EBITDA margin ($/tonne) 97 257 -62%
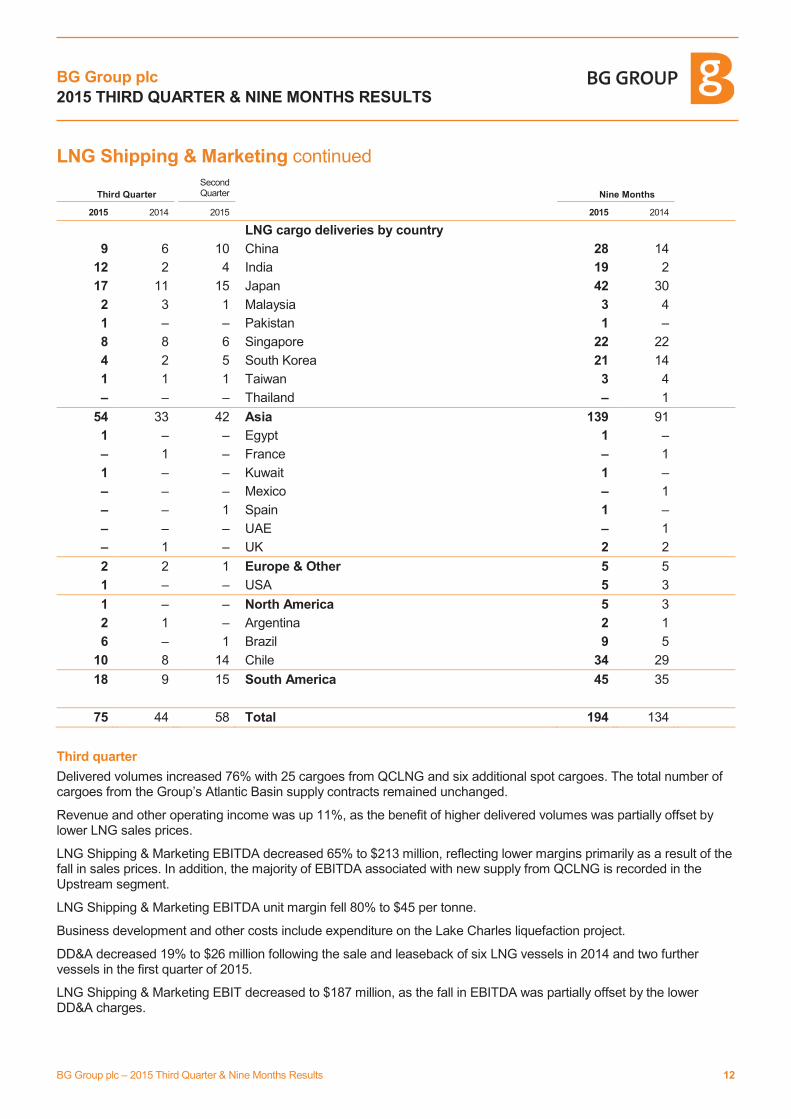
Third Quarter Second Quarter Nine Months
2015 2014 2015 2015 2014
LNG cargo supply by source
11 10 14 Atlantic LNG 41 41
– – – Egyptian LNG – 1
15 14 10 Equatorial Guinea 43 42
9 11 8 Nigeria 26 29
35 35 32 Atlantic Basin supply 110 113
25 – 13 QCLNG 45 –
15 9 13 Spot purchases 39 21
75 44 58 Total 194 134
Additional operating and financial data is given on page 33.
BG Group plc
2015 THIRD QUARTER & NINE MONTHS RESULTS
BG Group plc – 2015 Third Quarter & Nine Months Results 12
LNG Shipping & Marketing continued
Third Quarter Second Quarter Nine Months
2015 2014 2015 2015 2014
LNG cargo deliveries by country
9 6 10 China 28 14
12 2 4 India 19 2
17 11 15 Japan 42 30
2 3 1 Malaysia 3 4
1 – – Pakistan 1 –
8 8 6 Singapore 22 22
4 2 5 South Korea 21 14
1 1 1 Taiwan 3 4
– – – Thailand – 1
54 33 42 Asia 139 91
1 – – Egypt 1 –
– 1 – France – 1
1 – – Kuwait 1 –
– – – Mexico – 1
– – 1 Spain 1 –
– – – UAE – 1
– 1 – UK 2 2
2 2 1 Europe & Other 5 5
1 – – USA 5 3
1 – – North America 5 3
2 1 – Argentina 2 1
6 – 1 Brazil 9 5
10 8 14 Chile 34 29
18 9 15 South America 45 35
75 44 58 Total 194 134
Third quarter
Delivered volumes increased 76% with 25 cargoes from QCLNG and six additional spot cargoes. The total number of cargoes from the Group’s Atlantic Basin supply contracts remained unchanged.
Revenue and other operating income was up 11%, as the benefit of higher delivered volumes was partially offset by lower LNG sales prices.
LNG Shipping & Marketing EBITDA decreased 65% to $213 million, reflecting lower margins primarily as a result of the fall in sales prices. In addition, the majority of EBITDA associated with new supply from QCLNG is recorded in the Upstream segment.
LNG Shipping & Marketing EBITDA unit margin fell 80% to $45 per tonne.
Business development and other costs include expenditure on the Lake Charles liquefaction project.
DD&A decreased 19% to $26 million following the sale and leaseback of six LNG vessels in 2014 and two further vessels in the first quarter of 2015.
LNG Shipping & Marketing EBIT decreased to $187 million, as the fall in EBITDA was partially offset by the lower DD&A charges.
BG Group plc
2015 THIRD QUARTER & NINE MONTHS RESULTS
BG Group plc – 2015 Third Quarter & Nine Months Results 13
LNG Shipping & Marketing continued
Nine months
Delivered volumes increased 48% with 45 cargoes from QCLNG and 18 additional spot cargoes, partially offset by three fewer cargoes from the Group’s Atlantic Basin supply contracts.
Revenue and other operating income was down 4% as a result of lower LNG sales prices, partially offset by the higher delivered volumes and weather-related gains in the Group’s North American gas marketing business due to particularly cold weather in the first quarter of 2015.
LNG Shipping & Marketing EBITDA decreased 44% to $1 184 million, reflecting lower margins primarily as a result of the fall in sales prices combined with a greater proportion of relatively lower margin spot cargoes. The majority of EBITDA associated with new supply from QCLNG is recorded in the Upstream segment.
LNG Shipping & Marketing EBITDA unit margin fell 62% to $97 per tonne.
Business development and other costs include expenditure on the Lake Charles liquefaction project.
DD&A decreased 26% to $81 million following the sale and leaseback of six LNG vessels during 2014 and two further vessels in the first quarter of 2015.
LNG Shipping & Marketing EBIT decreased to $1 103 million, as the fall in EBITDA was partially offset by the lower DD&A charges.
BG Group plc
2015 THIRD QUARTER & NINE MONTHS RESULTS
BG Group plc – 2015 Third Quarter & Nine Months Results 14
Presentation of Non-GAAP measures
Business Performance ‘Business Performance’ excludes discontinued operations and disposals, certain re-measurements and impairments and certain other exceptional items (see below) as exclusion of these items provides a clear and consistent presentation of the underlying operating performance of the Group’s ongoing business.
BG Group uses commodity instruments to manage price exposures associated with its marketing and optimisation activity. This activity enables the Group to take advantage of commodity price movements. It is considered more appropriate to include both unrealised and realised gains and losses arising from the mark-to-market of derivatives associated with this activity in Business Performance.
Disposals, certain re-measurements and impairments BG Group’s commercial arrangements for marketing gas include the use of gas sales contracts. Whilst the activity surrounding these contracts involves the physical delivery of gas, certain gas sales contracts are classified as derivatives under the rules of IAS 39 ‘Financial Instruments: Recognition and Measurement’ and are required to be measured at fair value at the balance sheet date. Unrealised gains and losses on these contracts reflect the comparison between current market gas prices and the actual prices to be realised under the gas sales contract and are disclosed separately as disposals, re-measurements and impairments.
BG Group also uses commodity instruments to manage certain price exposures in respect of optimising the timing and location of its physical gas, LNG and oil sales commitments. These instruments are also required to be measured at fair value at the balance sheet date under IAS 39, and where practical have been designated as formal hedges. However, IAS 39 does not always allow the matching of fair values to the economically hedged value of the related commodity, resulting in unrealised movements in fair value being recorded in the income statement. These movements in fair value, together with any unrealised gains and losses associated with discontinued hedge accounting relationships that continue to represent economic hedges, are disclosed separately as disposals, re-measurements and impairments.
BG Group also uses financial instruments, including derivatives, to manage foreign exchange and interest rate exposure. These instruments are required to be recognised at fair value or amortised cost on the balance sheet in accordance with IAS 39. Most of these instruments have been designated either as hedges of foreign exchange movements associated with the Group’s net investments in foreign operations, or as hedges of interest rate risk. Where these instruments represent economic hedges but cannot be designated as hedges under IAS 39, unrealised movements in fair value, together with foreign exchange movements associated with the underlying borrowings and certain intercompany balances, are recorded in the income statement and disclosed separately as disposals, re-measurements and impairments.
Realised gains and losses relating to the instruments referred to above are included in Business Performance. This presentation best reflects the underlying performance of the business since it distinguishes between the temporary timing differences associated with re-measurements under IAS 39 rules and actual realised gains and losses.
BG Group has also separately identified profits and losses associated with the disposal of non-current assets, impairments of non-current assets and certain other exceptional items, including taxation, as they require separate disclosure in order to provide a clearer understanding of the results for the period.
For a reconciliation between the Total Results and Business Performance and details of disposals, re-measurements and impairments, see the consolidated income statement (page 16), note 2 (page 23) and note 3 (page 25).
Earnings Before Interest, Tax, Depreciation and Amortisation (EBITDA) BG Group presents EBITDA as a key performance indicator, consistent with an increased focus on delivering earnings and cash flow growth. EBITDA includes the post-tax results of joint ventures and associates.
Net borrowings or funds and Return On Average Capital Employed (ROACE) BG Group provides a reconciliation of net borrowings and an analysis of the amounts included within net borrowings as this is an important liquidity measure for the Group. ROACE represents Business Performance earnings over the past 12 months, excluding net finance costs/income on net borrowings, as a percentage of average capital employed over the past 12 months.
BG Group plc
2015 THIRD QUARTER & NINE MONTHS RESULTS
BG Group plc – 2015 Third Quarter & Nine Months Results 15
Legal Notice
Certain statements included in these results contain forward-looking information concerning BG Group’s strategy, operations, financial performance or condition, outlook, growth opportunities or circumstances in the countries, sectors or markets in which BG Group operates, or the recommended cash and share offer by Royal Dutch Shell plc for BG Group announced on 8 April 2015. By their nature, forward-looking statements involve uncertainty because they depend on future circumstances, and relate to events, not all of which are within BG Group’s control or can be predicted by BG Group. Although BG Group believes that the expectations and opinions reflected in such forward-looking statements are reasonable, no assurance can be given that such expectations and opinions will prove to have been correct. Actual results and market conditions could differ materially from those set out in the forward-looking statements. For a detailed analysis of the factors that may affect our business, financial performance or results of operations, we urge you to look at the ‘Principal risks and uncertainties’ included in BG Group plc’s Annual Report and Accounts 2014. No part of these results constitutes, or shall be taken to constitute, an invitation or inducement to invest in BG Group plc or any other entity, and must not be relied upon in any way in connection with any investment decision. BG Group undertakes no obligation to update any forward-looking statements, whether as a result of new information, future events or otherwise, except to the extent legally required.
BG Group plc
2015 THIRD QUARTER & NINE MONTHS RESULTS
BG Group plc – 2015 Third Quarter & Nine Months Results 16
Consolidated Income Statement
Third Quarter 2015 2014
Notes
Business Perform-
ance(a)
$m
Disposals, re-measure-
ments and impairments
(Note 2)(a)
$m
Total Result
$m
Business Perform-
ance(a)
$m
Disposals, re-measure-
ments and impairments
(Note 2)(a)
$m
Total Result
$m
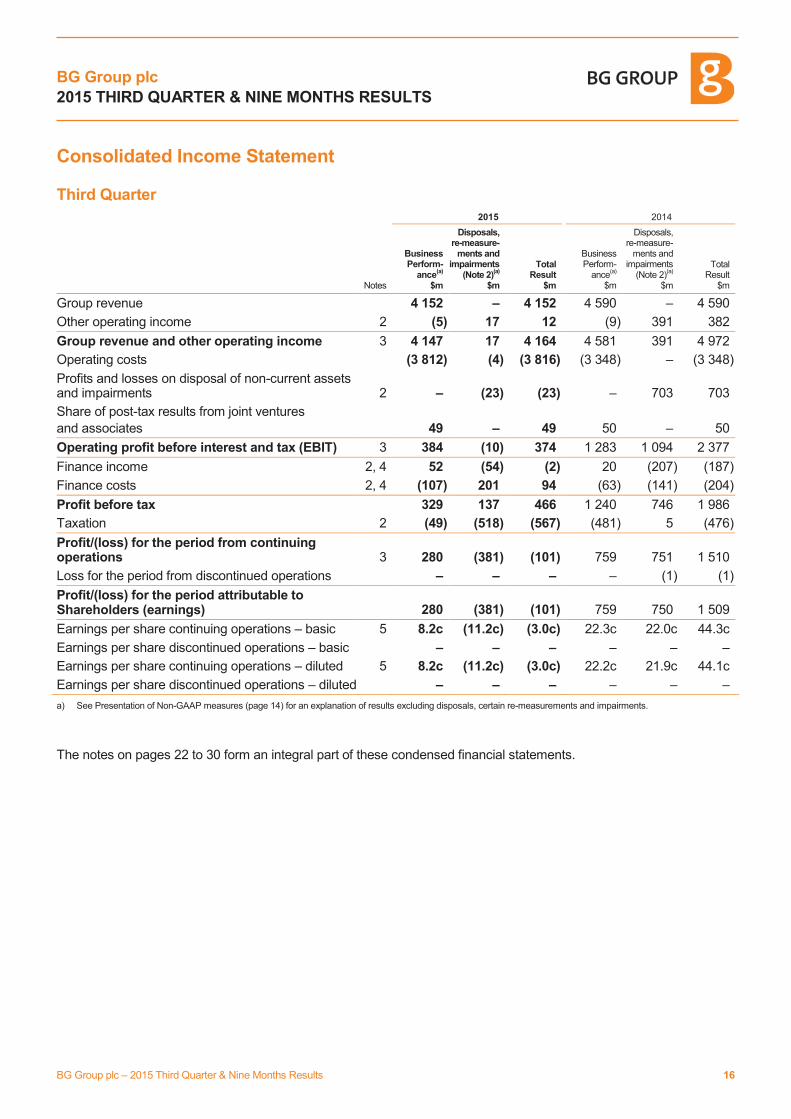
Group revenue 4 152 – 4 152 4 590 – 4 590
Other operating income 2 (5) 17 12 (9) 391 382
Group revenue and other operating income 3 4 147 17 4 164 4 581 391 4 972
Operating costs (3 812) (4) (3 816) (3 348) – (3 348)
Profits and losses on disposal of non-current assets and impairments 2 – (23) (23) – 703 703
Share of post-tax results from joint ventures
and associates 49 – 49 50 – 50
Operating profit before interest and tax (EBIT) 3 384 (10) 374 1 283 1 094 2 377
Finance income 2, 4 52 (54) (2) 20 (207) (187)
Finance costs 2, 4 (107) 201 94 (63) (141) (204)
Profit before tax 329 137 466 1 240 746 1 986
Taxation 2 (49) (518) (567) (481) 5 (476)
Profit/(loss) for the period from continuing operations 3 280 (381) (101) 759 751 1 510
Loss for the period from discontinued operations – – – – (1) (1)
Profit/(loss) for the period attributable to Shareholders (earnings) 280 (381) (101) 759 750 1 509
Earnings per share continuing operations – basic 5 8.2c (11.2c) (3.0c) 22.3c 22.0c 44.3c
Earnings per share discontinued operations – basic – – – – – –
Earnings per share continuing operations – diluted 5 8.2c (11.2c) (3.0c) 22.2c 21.9c 44.1c
Earnings per share discontinued operations – diluted – – – – – –
a) See Presentation of Non-GAAP measures (page 14) for an explanation of results excluding disposals, certain re-measurements and impairments.
The notes on pages 22 to 30 form an integral part of these condensed financial statements.
BG Group plc
2015 THIRD QUARTER & NINE MONTHS RESULTS
BG Group plc – 2015 Third Quarter & Nine Months Results 17
Consolidated Income Statement
Nine Months 2015 2014
Notes
Business Perform-
ance(a)
$m
Disposals, re-measure-
ments and impairments
(Note 2)(a)
$m
Total Result
$m
Business Perform-
ance(a)
$m
Disposals, re-measure-
ments and impairments
(Note 2)(a)
$m
Total Result
$m
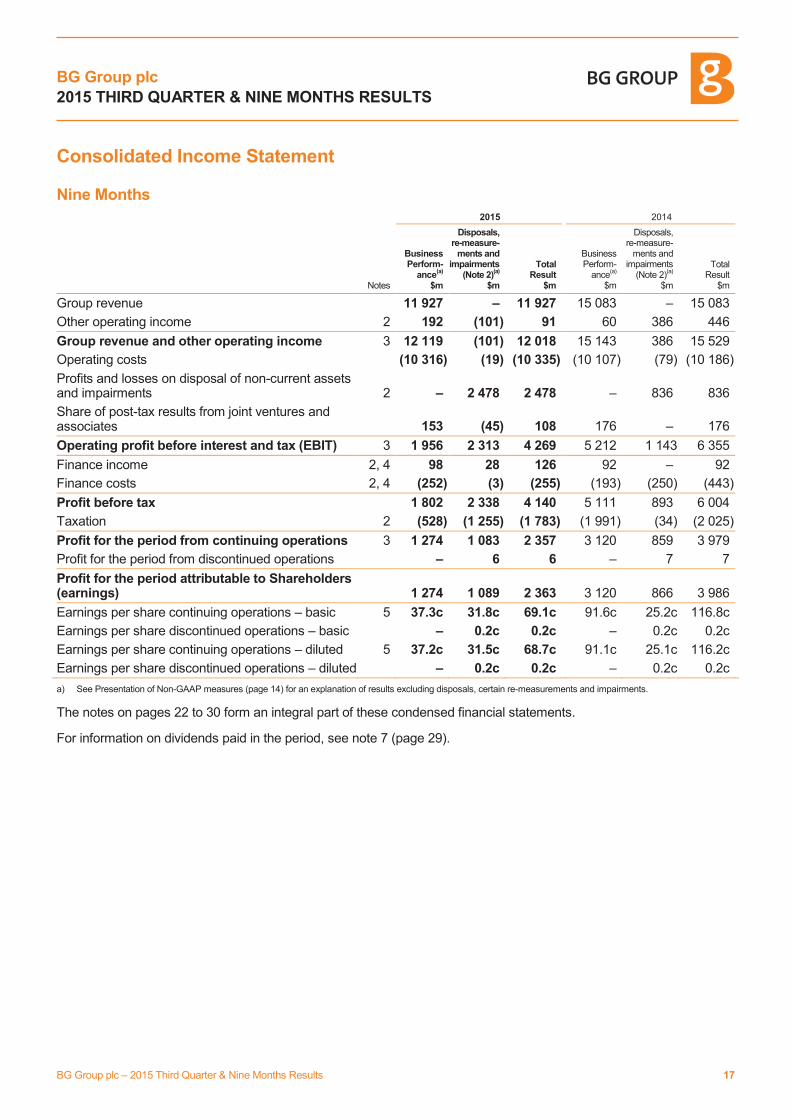
Group revenue 11 927 – 11 927 15 083 – 15 083
Other operating income 2 192 (101) 91 60 386 446
Group revenue and other operating income 3 12 119 (101) 12 018 15 143 386 15 529
Operating costs (10 316) (19) (10 335) (10 107) (79) (10 186)
Profits and losses on disposal of non-current assets and impairments 2 – 2 478 2 478 – 836 836
Share of post-tax results from joint ventures and associates 153 (45) 108 176 – 176
Operating profit before interest and tax (EBIT) 3 1 956 2 313 4 269 5 212 1 143 6 355
Finance income 2, 4 98 28 126 92 – 92
Finance costs 2, 4 (252) (3) (255) (193) (250) (443)
Profit before tax 1 802 2 338 4 140 5 111 893 6 004
Taxation 2 (528) (1 255) (1 783) (1 991) (34) (2 025)
Profit for the period from continuing operations 3 1 274 1 083 2 357 3 120 859 3 979
Profit for the period from discontinued operations – 6 6 – 7 7
Profit for the period attributable to Shareholders (earnings) 1 274 1 089 2 363 3 120 866 3 986
Earnings per share continuing operations – basic 5 37.3c 31.8c 69.1c 91.6c 25.2c 116.8c
Earnings per share discontinued operations – basic – 0.2c 0.2c – 0.2c 0.2c
Earnings per share continuing operations – diluted 5 37.2c 31.5c 68.7c 91.1c 25.1c 116.2c
Earnings per share discontinued operations – diluted – 0.2c 0.2c – 0.2c 0.2c
a) See Presentation of Non-GAAP measures (page 14) for an explanation of results excluding disposals, certain re-measurements and impairments.
The notes on pages 22 to 30 form an integral part of these condensed financial statements.
For information on dividends paid in the period, see note 7 (page 29).
BG Group plc
2015 THIRD QUARTER & NINE MONTHS RESULTS
BG Group plc – 2015 Third Quarter & Nine Months Results 18
Consolidated Statement of Comprehensive Income
Third Quarter Nine Months
2015 $m
2014 $m
2015 $m
2014 $m
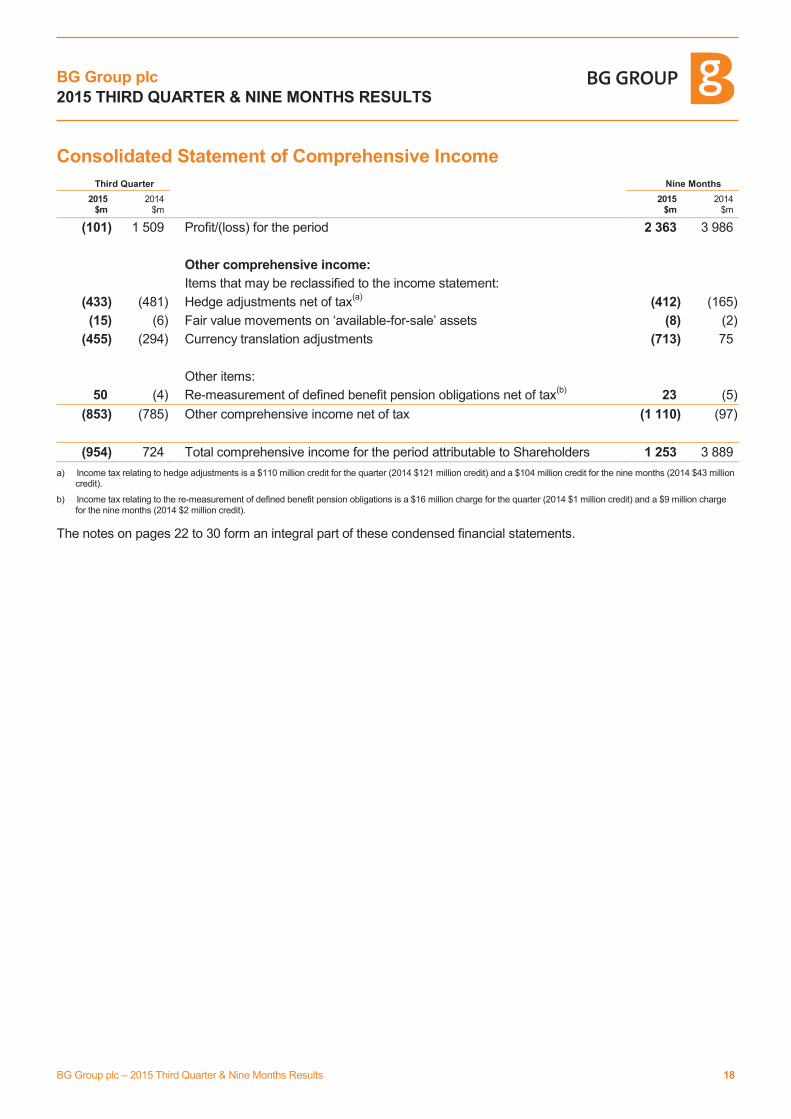
(101) 1 509 Profit/(loss) for the period 2 363 3 986
Other comprehensive income:
Items that may be reclassified to the income statement:
(433) (481) Hedge adjustments net of tax(a)
(412) (165)
(15) (6) Fair value movements on ‘available-for-sale’ assets (8) (2)
(455) (294) Currency translation adjustments (713) 75
Other items:
50 (4) Re-measurement of defined benefit pension obligations net of tax(b)
23 (5)
(853) (785) Other comprehensive income net of tax (1 110) (97)
(954) 724 Total comprehensive income for the period attributable to Shareholders 1 253 3 889
a) Income tax relating to hedge adjustments is a $110 million credit for the quarter (2014 $121 million credit) and a $104 million credit for the nine months (2014 $43 million credit).
b) Income tax relating to the re-measurement of defined benefit pension obligations is a $16 million charge for the quarter (2014 $1 million credit) and a $9 million charge for the nine months (2014 $2 million credit).
The notes on pages 22 to 30 form an integral part of these condensed financial statements.
BG Group plc
2015 THIRD QUARTER & NINE MONTHS RESULTS
BG Group plc – 2015 Third Quarter & Nine Months Results 19
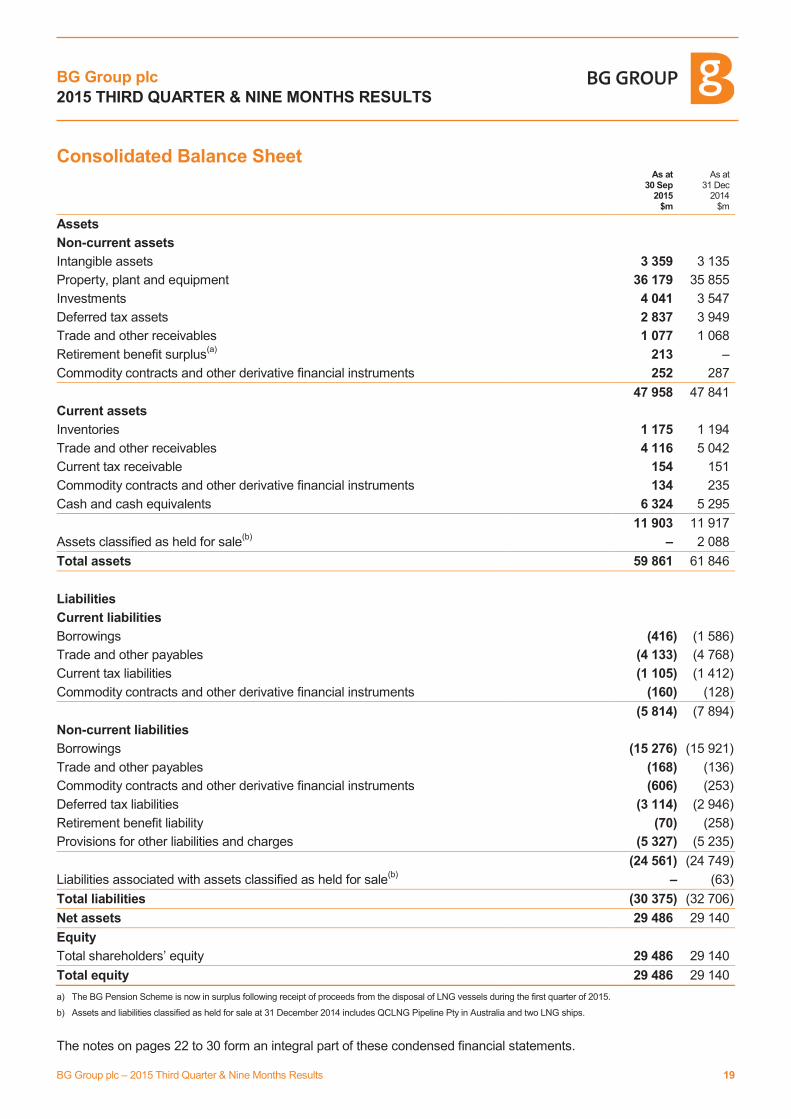
Consolidated Balance Sheet
As at 30 Sep
2015 $m
As at 31 Dec
2014 $m
Assets
Non-current assets
Intangible assets 3 359 3 135
Property, plant and equipment 36 179 35 855
Investments 4 041 3 547
Deferred tax assets 2 837 3 949
Trade and other receivables 1 077 1 068
Retirement benefit surplus(a)
213 –
Commodity contracts and other derivative financial instruments 252 287
47 958 47 841
Current assets
Inventories 1 175 1 194
Trade and other receivables 4 116 5 042
Current tax receivable 154 151
Commodity contracts and other derivative financial instruments 134 235
Cash and cash equivalents 6 324 5 295
11 903 11 917
Assets classified as held for sale(b)
– 2 088
Total assets 59 861 61 846
Liabilities
Current liabilities
Borrowings (416) (1 586)
Trade and other payables (4 133) (4 768)
Current tax liabilities (1 105) (1 412)
Commodity contracts and other derivative financial instruments (160) (128)
(5 814) (7 894)
Non-current liabilities
Borrowings (15 276) (15 921)
Trade and other payables (168) (136)
Commodity contracts and other derivative financial instruments (606) (253)
Deferred tax liabilities (3 114) (2 946)
Retirement benefit liability (70) (258)
Provisions for other liabilities and charges (5 327) (5 235)
(24 561) (24 749)
Liabilities associated with assets classified as held for sale(b)
– (63)
Total liabilities (30 375) (32 706)
Net assets 29 486 29 140
Equity
Total shareholders’ equity 29 486 29 140
Total equity 29 486 29 140
a) The BG Pension Scheme is now in surplus following receipt of proceeds from the disposal of LNG vessels during the first quarter of 2015.
b) Assets and liabilities classified as held for sale at 31 December 2014 includes QCLNG Pipeline Pty in Australia and two LNG ships.
The notes on pages 22 to 30 form an integral part of these condensed financial statements.
BG Group plc
2015 THIRD QUARTER & NINE MONTHS RESULTS
BG Group plc – 2015 Third Quarter & Nine Months Results 20
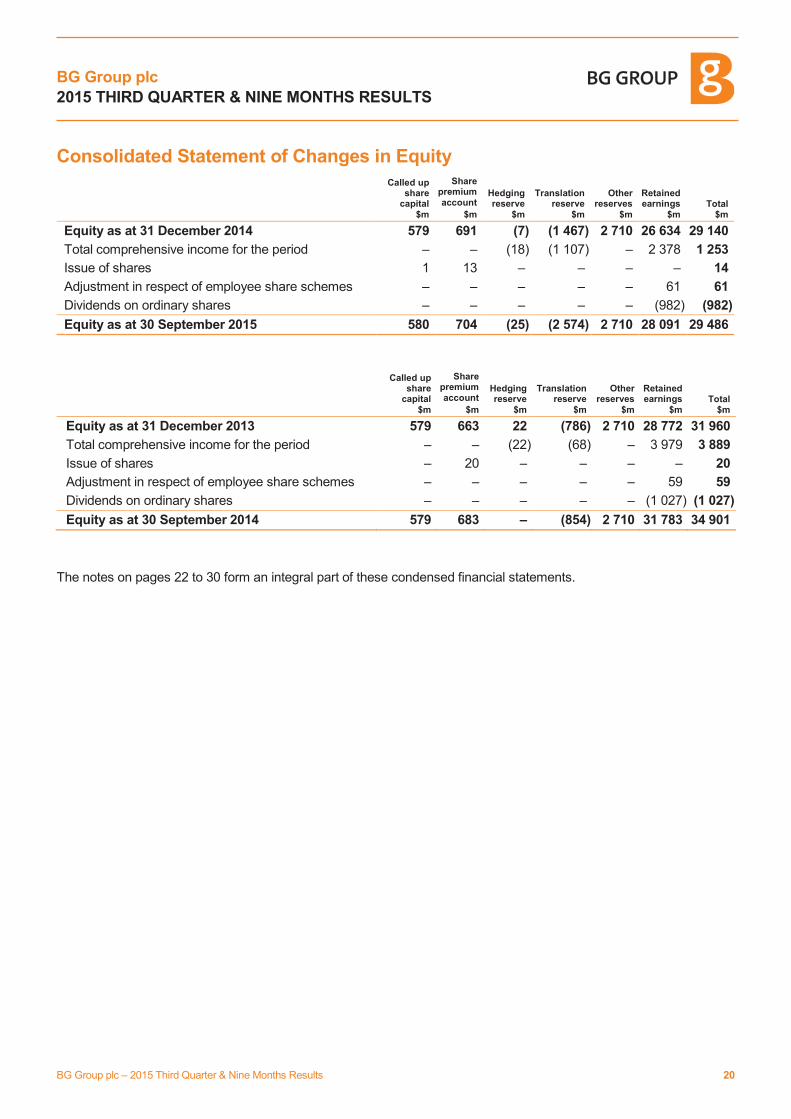
Consolidated Statement of Changes in Equity
Called up share
capital $m
Share premium account
$m
Hedging reserve
$m
Translation reserve
$m
Other reserves
$m
Retained earnings
$m Total
$m
Equity as at 31 December 2014 579 691 (7) (1 467) 2 710 26 634 29 140
Total comprehensive income for the period – – (18) (1 107) – 2 378 1 253
Issue of shares 1 13 – – – – 14
Adjustment in respect of employee share schemes – – – – – 61 61
Dividends on ordinary shares – – – – – (982) (982)
Equity as at 30 September 2015 580 704 (25) (2 574) 2 710 28 091 29 486
Called up share
capital $m
Share premium account
$m
Hedging reserve
$m
Translation reserve
$m
Other reserves
$m
Retained earnings
$m Total
$m
Equity as at 31 December 2013 579 663 22 (786) 2 710 28 772 31 960
Total comprehensive income for the period – – (22) (68) – 3 979 3 889
Issue of shares – 20 – – – – 20
Adjustment in respect of employee share schemes – – – – – 59 59
Dividends on ordinary shares – – – – – (1 027) (1 027)
Equity as at 30 September 2014 579 683 – (854) 2 710 31 783 34 901
The notes on pages 22 to 30 form an integral part of these condensed financial statements.
BG Group plc
2015 THIRD QUARTER & NINE MONTHS RESULTS
BG Group plc – 2015 Third Quarter & Nine Months Results 21
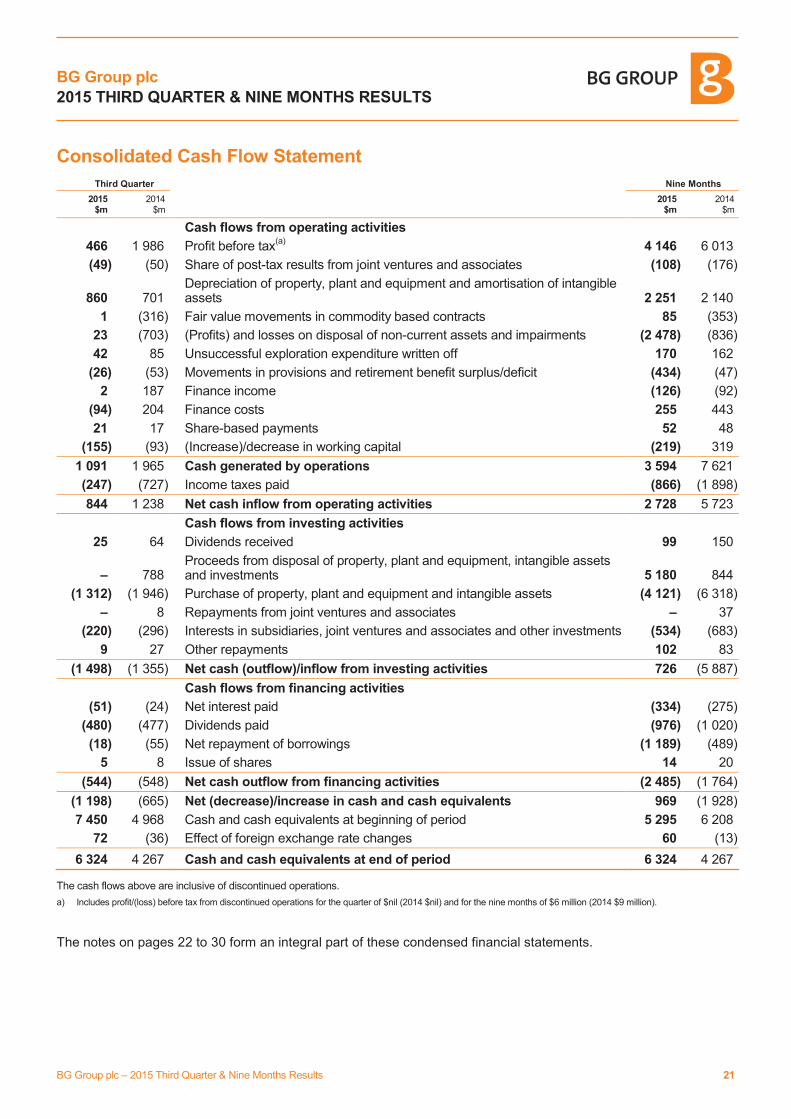
Consolidated Cash Flow Statement
Third Quarter Nine Months
2015 $m
2014 $m
2015 $m
2014 $m
Cash flows from operating activities
466 1 986 Profit before tax(a)
4 146 6 013
(49) (50) Share of post-tax results from joint ventures and associates (108) (176)
860 701 Depreciation of property, plant and equipment and amortisation of intangible assets 2 251 2 140
1 (316) Fair value movements in commodity based contracts 85 (353)
23 (703) (Profits) and losses on disposal of non-current assets and impairments (2 478) (836)
42 85 Unsuccessful exploration expenditure written off 170 162
(26) (53) Movements in provisions and retirement benefit surplus/deficit (434) (47)
2 187 Finance income (126) (92)
(94) 204 Finance costs 255 443
21 17 Share-based payments 52 48
(155) (93) (Increase)/decrease in working capital (219) 319
1 091 1 965 Cash generated by operations 3 594 7 621
(247) (727) Income taxes paid (866) (1 898)
844 1 238 Net cash inflow from operating activities 2 728 5 723
Cash flows from investing activities
25 64 Dividends received 99 150
– 788 Proceeds from disposal of property, plant and equipment, intangible assets and investments 5 180 844
(1 312) (1 946) Purchase of property, plant and equipment and intangible assets (4 121) (6 318)
– 8 Repayments from joint ventures and associates – 37
(220) (296) Interests in subsidiaries, joint ventures and associates and other investments (534) (683)
9 27 Other repayments 102 83
(1 498) (1 355) Net cash (outflow)/inflow from investing activities 726 (5 887)
Cash flows from financing activities
(51) (24) Net interest paid (334) (275)
(480) (477) Dividends paid (976) (1 020)
(18) (55) Net repayment of borrowings (1 189) (489)
5 8 Issue of shares 14 20
(544) (548) Net cash outflow from financing activities (2 485) (1 764)
(1 198) (665) Net (decrease)/increase in cash and cash equivalents 969 (1 928)
7 450 4 968 Cash and cash equivalents at beginning of period 5 295 6 208
72 (36) Effect of foreign exchange rate changes 60 (13)
6 324 4 267 Cash and cash equivalents at end of period 6 324 4 267 The cash flows above are inclusive of discontinued operations.
a) Includes profit/(loss) before tax from discontinued operations for the quarter of $nil (2014 $nil) and for the nine months of $6 million (2014 $9 million).
The notes on pages 22 to 30 form an integral part of these condensed financial statements.

BG Group plc
2015 THIRD QUARTER & NINE MONTHS RESULTS
BG Group plc – 2015 Third Quarter & Nine Months Results 22
Notes
1. Basis of preparation
These results, approved by the Board on 29 October 2015, are the condensed financial statements (‘the financial statements’) of BG Group plc for the quarter ended and the nine months ended 30 September 2015. The financial statements do not comprise statutory accounts within the meaning of Section 434 of the Companies Act 2006, and should be read in conjunction with the Annual Report and Accounts for the year ended 31 December 2014 which have been prepared in accordance with IFRS as adopted by the EU. The latest statutory accounts delivered to the registrar were for the year ended 31 December 2014 which were audited by Ernst & Young LLP and on which the Auditors’ Report was unqualified and did not contain statements under Sections 498(2) or 498(3) of the Companies Act 2006. These financial statements have been prepared in accordance with IAS 34 ‘Interim Financial Reporting’ as adopted by the EU and the accounting policies, methods of computation and presentation as set out in the Annual Report and Accounts 2014.
The preparation of the financial statements requires management to make estimates and assumptions that affect the reported amount of revenues, expenses, assets and liabilities at the date of the financial statements. If in the future such estimates and assumptions, which are based on management’s best judgement at the date of the financial statements, deviate from the actual circumstances, the original estimates and assumptions will be modified as appropriate in the period in which the circumstances change.
Presentation of results
The presentation of BG Group’s results separately identifies the effect of:
· The re-measurement of certain financial instruments; and
· Profits and losses on the disposal and impairment of non-current assets and businesses and certain other exceptional items.
These items, which are detailed in note 2 to the financial statements (page 23), are excluded from Business Performance in order to provide readers with a clear and consistent presentation of the underlying operating performance of the Group’s ongoing businesses.
BG Group plc
2015 THIRD QUARTER & NINE MONTHS RESULTS
BG Group plc – 2015 Third Quarter & Nine Months Results 23
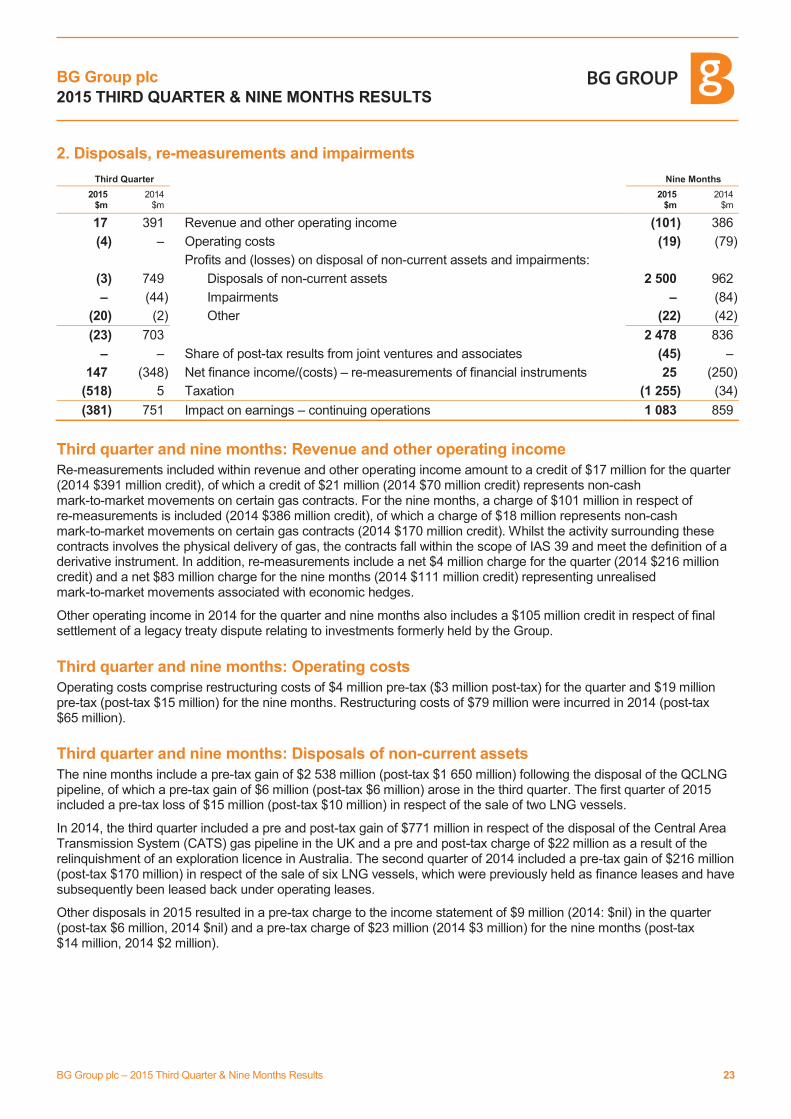
2. Disposals, re-measurements and impairments
Third Quarter Nine Months
2015 $m
2014 $m
2015 $m
2014 $m
17 391 Revenue and other operating income (101) 386
(4) – Operating costs (19) (79)
Profits and (losses) on disposal of non-current assets and impairments:
(3) 749 Disposals of non-current assets 2 500 962
– (44) Impairments – (84)
(20) (2) Other (22) (42)
(23) 703 2 478 836
– – Share of post-tax results from joint ventures and associates (45) –
147 (348) Net finance income/(costs) – re-measurements of financial instruments 25 (250)
(518) 5 Taxation (1 255) (34)
(381) 751 Impact on earnings – continuing operations 1 083 859
Third quarter and nine months: Revenue and other operating income
Re-measurements included within revenue and other operating income amount to a credit of $17 million for the quarter (2014 $391 million credit), of which a credit of $21 million (2014 $70 million credit) represents non-cash mark-to-market movements on certain gas contracts. For the nine months, a charge of $101 million in respect of re-measurements is included (2014 $386 million credit), of which a charge of $18 million represents non-cash mark-to-market movements on certain gas contracts (2014 $170 million credit). Whilst the activity surrounding these contracts involves the physical delivery of gas, the contracts fall within the scope of IAS 39 and meet the definition of a derivative instrument. In addition, re-measurements include a net $4 million charge for the quarter (2014 $216 million credit) and a net $83 million charge for the nine months (2014 $111 million credit) representing unrealised mark-to-market movements associated with economic hedges.
Other operating income in 2014 for the quarter and nine months also includes a $105 million credit in respect of final settlement of a legacy treaty dispute relating to investments formerly held by the Group.
Third quarter and nine months: Operating costs
Operating costs comprise restructuring costs of $4 million pre-tax ($3 million post-tax) for the quarter and $19 million pre-tax (post-tax $15 million) for the nine months. Restructuring costs of $79 million were incurred in 2014 (post-tax $65 million).
Third quarter and nine months: Disposals of non-current assets
The nine months include a pre-tax gain of $2 538 million (post-tax $1 650 million) following the disposal of the QCLNG pipeline, of which a pre-tax gain of $6 million (post-tax $6 million) arose in the third quarter. The first quarter of 2015 included a pre-tax loss of $15 million (post-tax $10 million) in respect of the sale of two LNG vessels.
In 2014, the third quarter included a pre and post-tax gain of $771 million in respect of the disposal of the Central Area Transmission System (CATS) gas pipeline in the UK and a pre and post-tax charge of $22 million as a result of the relinquishment of an exploration licence in Australia. The second quarter of 2014 included a pre-tax gain of $216 million (post-tax $170 million) in respect of the sale of six LNG vessels, which were previously held as finance leases and have subsequently been leased back under operating leases.
Other disposals in 2015 resulted in a pre-tax charge to the income statement of $9 million (2014: $nil) in the quarter (post-tax $6 million, 2014 $nil) and a pre-tax charge of $23 million (2014 $3 million) for the nine months (post-tax $14 million, 2014 $2 million).
BG Group plc
2015 THIRD QUARTER & NINE MONTHS RESULTS
BG Group plc – 2015 Third Quarter & Nine Months Results 24
2. Disposals, re-measurements and impairments continued
Third quarter and nine months: Impairments
In 2014, the third quarter included a pre-tax charge of $44 million (post-tax $27 million) and the nine months included a pre-tax charge of $84 million (post-tax $11 million gain) following the impairment of certain E&P assets.
Third quarter and nine months: Other
Other disposals in 2015 resulted in a pre-tax charge of $20 million (2014 $2 million) in the third quarter (post-tax $18 million, 2014 $3 million) and a pre-tax charge of $22 million (2014 $42 million) in the nine months (post-tax $24 million, 2014 $37 million).
Third quarter and nine months: Share of post-tax results from joint ventures and associates
In the second quarter of 2015, a pre and post-tax charge of $5 million was recognised, being the Group’s share of a write-off of assets under construction in Brazil following the bankruptcy of a contractor. In the first quarter of 2015, a pre and post-tax charge of $40 million was recognised, being the Group’s share of an impairment charge recognised by a joint venture entity.
Third quarter and nine months: Net finance income/(costs)
Re-measurements presented in net finance income/(costs) include net foreign exchange movements on the associated borrowings and certain intercompany balances, offset by mark-to-market movements on certain derivatives used to hedge foreign exchange and interest rate risk. In addition, re-measurements include $8 million charge (2014 $34 million charge) in the third quarter and $15 million charge in the nine months (2014 $3 million charge) relating to derivatives partially hedging the Group’s Brazilian Real and Australian Dollar foreign exchange exposure that do not qualify for hedge accounting under IAS 39.
Taxation
The third quarter of 2015 included a net taxation charge of $518 million. This comprised a net charge of $344 million related to changes in deferred tax arising from the retranslation of the Group’s tax bases, especially in Brazil and Australia, partly offset by a current tax credit in relation to foreign exchange losses on intra-Group lending, both due to the appreciation of the US Dollar, and $174 million relating to disposals, re-measurements and impairments.
The nine months of 2015 included a net taxation charge of $1 255 million. This comprised a charge of $912 million relating to disposals, re-measurements and impairments, primarily associated with the disposal of the QCLNG pipeline; a net charge of $708 million reflecting the impact of foreign exchange movements on deferred and current tax balances; and a $365 million credit relating to the revision of deferred tax balances as at 1 January 2015 due to changes in UK North Sea taxation rates.
BG Group plc
2015 THIRD QUARTER & NINE MONTHS RESULTS
BG Group plc – 2015 Third Quarter & Nine Months Results 25
3. Segmental analysis
Profit for the period Business
Performance
Disposals, re-measurements and impairments Total Result Analysed by operating segment
Third Quarter 2015
$m 2014
$m 2015
$m 2014
$m 2015
$m 2014
$m
Group revenue(a)
Upstream 2 659 2 912 – – 2 659 2 912
LNG Shipping & Marketing 2 005 1 798 – – 2 005 1 798
Other activities 1 2 – – 1 2
Less: intra-group sales (513) (122) – – (513) (122)
Group revenue 4 152 4 590 – – 4 152 4 590
Other operating income(b)
(5) (9) 17 391 12 382
Group revenue and other operating income 4 147 4 581 17 391 4 164 4 972
EBITDA
Upstream 1 087 1 388 17 923 1 104 2 311
LNG Shipping & Marketing 213 608 (26) 66 187 674
Other activities (56) (12) (1) 105 (57) 93
1 244 1 984 (10) 1 094 1 234 3 078
DD&A
Upstream (834) (668) – – (834) (668)
LNG Shipping & Marketing (26) (32) – – (26) (32)
Other activities – (1) – – – (1)
(860) (701) – – (860) (701)
EBIT
Upstream 253 720 17 923 270 1 643
LNG Shipping & Marketing 187 576 (26) 66 161 642
Other activities (56) (13) (1) 105 (57) 92
384 1 283 (10) 1 094 374 2 377
Net finance (costs)/income and taxation
Finance income 52 20 (54) (207) (2) (187)
Finance costs (107) (63) 201 (141) 94 (204)
Taxation (49) (481) (518) 5 (567) (476)
(104) (524) (371) (343) (475) (867)
Profit for the period from continuing operations attributable to Shareholders (earnings) 280 759 (381) 751 (101) 1 510
a) External sales are attributable to segments as follows: Upstream $2 147 million (2014 $2 792 million), LNG Shipping & Marketing $2 004 million (2014 $1 796 million) and Other $1 million (2014 $2 million). Intra-group sales are attributable to segments as follows: Upstream $512 million (2014 $120 million) and LNG Shipping & Marketing $1 million (2014 $2 million).
b) Business Performance Other operating income is attributable to segments as follows: Upstream $(19) million (2014 $(30) million) and LNG Shipping & Marketing $14 million (2014 $21 million).
BG Group plc
2015 THIRD QUARTER & NINE MONTHS RESULTS
BG Group plc – 2015 Third Quarter & Nine Months Results 26
3. Segmental analysis continued
Business Performance
Disposals, re-measurements and impairments Total Result
Nine Months 2015
$m 2014
$m 2015
$m 2014
$m 2015
$m 2014
$m
Group revenue(a)
Upstream 7 200 9 333 – – 7 200 9 333
LNG Shipping & Marketing 5 810 6 146 – – 5 810 6 146
Other activities 3 6 – – 3 6
Less: intra-group sales (1 086) (402) – – (1 086) (402)
Group revenue 11 927 15 083 – – 11 927 15 083
Other operating income(b)
192 60 (101) 386 91 446
Group revenue and other operating income 12 119 15 143 (101) 386 12 018 15 529
EBITDA
Upstream 3 095 5 239 2 463 793 5 558 6 032
LNG Shipping & Marketing 1 184 2 123 (156) 251 1 028 2 374
Other activities (72) (10) 6 99 (66) 89
4 207 7 352 2 313 1 143 6 520 8 495
DD&A
Upstream (2 167) (2 028) – – (2 167) (2 028)
LNG Shipping & Marketing (81) (109) – – (81) (109)
Other activities (3) (3) – – (3) (3)
(2 251) (2 140) – – (2 251) (2 140)
EBIT
Upstream 928 3 211 2 463 793 3 391 4 004
LNG Shipping & Marketing 1 103 2 014 (156) 251 947 2 265
Other activities (75) (13) 6 99 (69) 86
1 956 5 212 2 313 1 143 4 269 6 355
Net finance (costs)/income and taxation
Finance income 98 92 28 – 126 92
Finance costs (252) (193) (3) (250) (255) (443)
Taxation (528) (1 991) (1 255) (34) (1 783) (2 025)
(682) (2 092) (1 230) (284) (1 912) (2 376)
Profit for the period from continuing operations attributable to Shareholders (earnings) 1 274 3 120 1 083 859 2 357 3 979
a) External sales are attributable to segments as follows: Upstream $6 117 million (2014 $8 934 million), LNG Shipping & Marketing $5 807 million (2014 $6 143 million) and Other $3 million (2014 $6 million). Intra-group sales are attributable to segments as follows: Upstream $1 083 million (2014 $399 million) and LNG Shipping & Marketing $3 million (2014 $3 million).
b) Business Performance Other operating income is attributable to segments as follows: Upstream $9 million (2014 $(30) million) and LNG Shipping & Marketing $183 million (2014 $90 million).

BG Group plc
2015 THIRD QUARTER & NINE MONTHS RESULTS
BG Group plc – 2015 Third Quarter & Nine Months Results 27
4. Net finance (costs)/income
Third Quarter Nine Months
2015 $m
2014 $m
2015 $m
2014 $m
(126) (135) Interest payable(a)
(416) (400)
(22) (20) Interest on obligations under finance leases (68) (69)
74 132 Interest capitalised 332 390
(33) (40) Unwinding of discount(b)
(100) (114)
201 (141) Disposals, re-measurements and impairments(c)
(3) (250)
94 (204) Finance costs (255) (443)
52 20 Interest receivable(a)
98 92
(54) (207) Disposals, re-measurements and impairments(c)
28 –
(2) (187) Finance income 126 92
92 (391) Net finance (costs)/income (129) (351)
a) In 2015, interest payable includes foreign exchange gains of $21 million for the quarter and foreign exchange gains of $nil for the nine months. In 2015, interest receivable includes foreign exchange gains of $27 million for the quarter and for the nine months. In 2014, interest receivable includes foreign exchange losses of $5 million for the quarter and foreign exchange gains of $16 million for the nine months.
b) Relates to the unwinding of the discount on provisions and retirement benefit schemes.
c) Net finance (costs)/income in disposals, re-measurements and impairments for the quarter of $147 million (2014 $(348) million) and for the nine months of $25 million (2014 $(250) million) is included in note 2 (page 23) and principally reflects foreign exchange movements on certain borrowings, partly offset by mark-to-market movements on certain derivatives used to hedge foreign exchange and interest rate risk.
5. Earnings per ordinary share – continuing operations
Third Quarter Nine Months
2015 2014 2015 2014
$m
cents per share $m
cents per share
$m
cents per share $m
cents per share
280 8.2 759 22.3
Earnings – continuing operations excluding disposals, re-measurements and impairments 1 274 37.3 3 120 91.6
(381) (11.2) 751 22.0 Disposals, re-measurements and impairments (after tax) 1 083 31.8 859 25.2
(101) (3.0) 1 510 44.3 Earnings – continuing operations 2 357 69.1 3 979 116.8
Third quarter
The basic earnings per share calculation is based on the weighted average number of shares in issue of 3 414 million for the quarter.
The earnings figure used to calculate diluted earnings per ordinary share is the same as that used to calculate earnings per ordinary share given above, divided by 3 414 million for the quarter, being the weighted average number of ordinary shares in issue during the period. Potentially issuable ordinary shares have been excluded from the diluted earnings per ordinary share calculation, as their inclusion would decrease the loss per ordinary share for the quarter.
Nine months
The basic earnings per share calculation is based on the weighted average number of shares in issue of 3 413 million for the nine months.
The earnings figure used to calculate diluted earnings per ordinary share is the same as that used to calculate earnings per ordinary share given above, divided by 3 429 million for the nine months, being the weighted average number of ordinary shares in issue during the period as adjusted for dilutive equity instruments.
BG Group plc
2015 THIRD QUARTER & NINE MONTHS RESULTS
BG Group plc – 2015 Third Quarter & Nine Months Results 28
6. Reconciliation of net borrowings(a) – Nine Months $m
Net borrowings as at 31 December 2014 (11 998)
Net increase in cash and cash equivalents 969
Cash outflow from changes in borrowings 1 189
Foreign exchange and other re-measurements 256
Net borrowings as at 30 September 2015 (9 584)
As at 30 September 2015, BG Group's share of the net borrowings in joint ventures and associates amounted to approximately $0.3 billion, including BG Group shareholder loans of approximately $0.4 billion. These net borrowings are included in BG Group's share of the net assets in joint ventures and associates which are consolidated in BG Group's accounts.
a) Net borrowings are defined on page 35.
Net borrowings comprise:
As at 30 Sep
2015
$m
As at 31 Dec
2014
$m
Amounts receivable/(due) within one year
Cash and cash equivalents 6 324 5 295
Trade and other receivables(a)
27 –
Borrowings (416) (1 586)
Commodity contracts and other derivative financial instruments (27) 6
5 908 3 715
Amounts receivable/(due) after more than one year
Borrowings (15 276) (15 921)
Trade and other receivables(a)
145 172
Commodity contracts and other derivative financial instruments (361) 36
(15 492) (15 713)
Net borrowings (9 584) (11 998)
a) Represents a finance lease receivable of $172 million (2014 $172 million) included within current and non-current trade and other receivables on the balance sheet.
Liquidity and Capital Resources – as at 30 September 2015
The Group’s principal borrowing entities are BG Energy Holdings Limited and certain wholly owned subsidiary undertakings, the majority of whose borrowings are guaranteed by BG Energy Holdings Limited (collectively BGEH).
BGEH had a $4.0 billion US Commercial Paper Programme and a $2.0 billion Euro Commercial Paper Programme, both of which were unutilised. BGEH also had a $15.0 billion Euro Medium Term Note Programme, of which $7.0 billion was unutilised.
BGEH also had aggregate undrawn committed revolving bank borrowing facilities of $7.25 billion, of which $5.04 billion expires in 2017 and $2.21 billion expires in 2019. BGEH also had a credit facility provided by an export credit agency, of which $1.7 billion was undrawn.
Furthermore, BGEH had uncommitted borrowing facilities including multicurrency lines, overdraft facilities of £45 million and credit facilities of $20 million, all of which were unutilised.
BG Group plc
2015 THIRD QUARTER & NINE MONTHS RESULTS
BG Group plc – 2015 Third Quarter & Nine Months Results 29
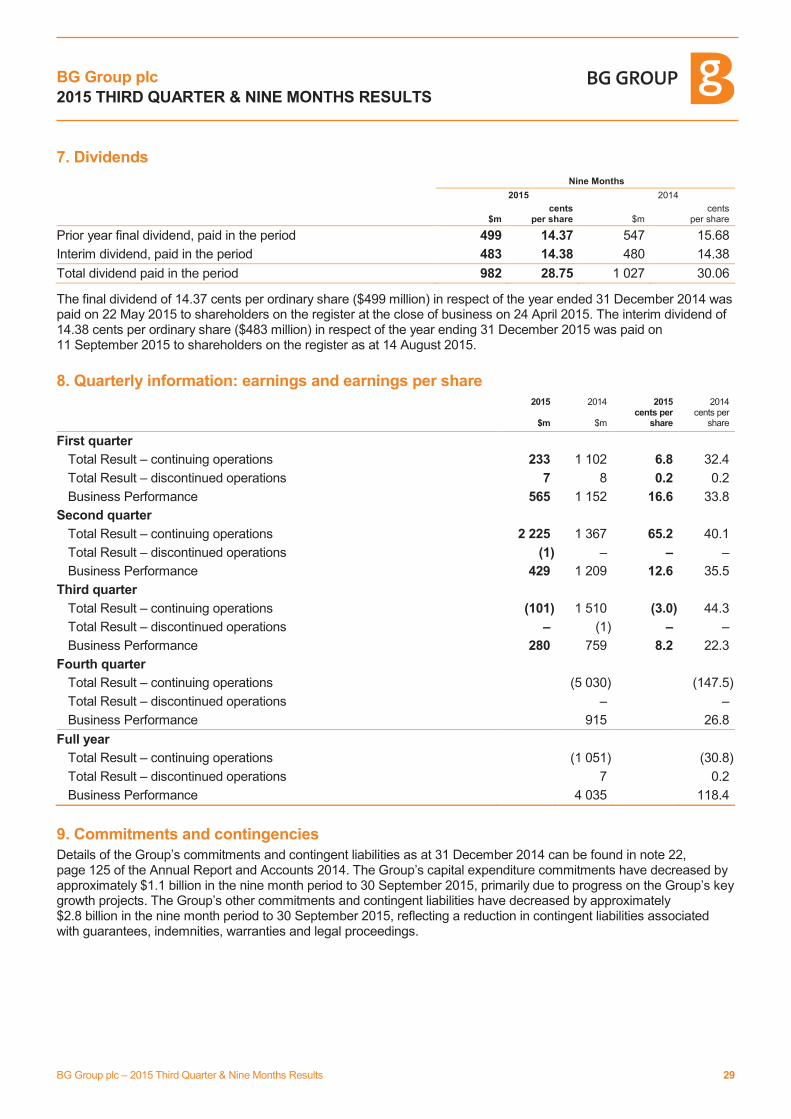
7. Dividends Nine Months
2015 2014
$m cents
per share $m cents
per share
Prior year final dividend, paid in the period 499 14.37 547 15.68
Interim dividend, paid in the period 483 14.38 480 14.38
Total dividend paid in the period 982 28.75 1 027 30.06
The final dividend of 14.37 cents per ordinary share ($499 million) in respect of the year ended 31 December 2014 was paid on 22 May 2015 to shareholders on the register at the close of business on 24 April 2015. The interim dividend of 14.38 cents per ordinary share ($483 million) in respect of the year ending 31 December 2015 was paid on 11 September 2015 to shareholders on the register as at 14 August 2015.
8. Quarterly information: earnings and earnings per share
2015
$m
2014
$m
2015 cents per
share
2014 cents per
share
First quarter
Total Result – continuing operations 233 1 102 6.8 32.4
Total Result – discontinued operations 7 8 0.2 0.2
Business Performance 565 1 152 16.6 33.8
Second quarter
Total Result – continuing operations 2 225 1 367 65.2 40.1
Total Result – discontinued operations (1) – – –
Business Performance 429 1 209 12.6 35.5
Third quarter
Total Result – continuing operations (101) 1 510 (3.0) 44.3
Total Result – discontinued operations – (1) – –
Business Performance 280 759 8.2 22.3
Fourth quarter
Total Result – continuing operations (5 030) (147.5)
Total Result – discontinued operations – –
Business Performance 915 26.8
Full year
Total Result – continuing operations (1 051) (30.8)
Total Result – discontinued operations 7 0.2
Business Performance 4 035 118.4
9. Commitments and contingencies
Details of the Group’s commitments and contingent liabilities as at 31 December 2014 can be found in note 22, page 125 of the Annual Report and Accounts 2014. The Group’s capital expenditure commitments have decreased by approximately $1.1 billion in the nine month period to 30 September 2015, primarily due to progress on the Group’s key growth projects. The Group’s other commitments and contingent liabilities have decreased by approximately $2.8 billion in the nine month period to 30 September 2015, reflecting a reduction in contingent liabilities associated with guarantees, indemnities, warranties and legal proceedings.
BG Group plc
2015 THIRD QUARTER & NINE MONTHS RESULTS
BG Group plc – 2015 Third Quarter & Nine Months Results 30
10. Related party transactions
The Group provides goods and services to, and receives goods and services from, its joint ventures and associates. In addition, the Group provides financing to some of these parties by way of loans. Details of related party transactions for the year ended 31 December 2014 can be found in note 23, page 126 of the Annual Report and Accounts 2014. There have been no material changes in these relationships in the nine month period to 30 September 2015. No related party transactions have taken place in the first nine months of the current financial year that have materially affected the financial position or the performance of the Group during that period.
BG Group plc
2015 THIRD QUARTER & NINE MONTHS RESULTS
BG Group plc – 2015 Third Quarter & Nine Months Results 31
BG Group LNG Shipping & Marketing Profit Forecast
Profit forecast of the LNG Shipping & Marketing segment Business Performance(a)
EBITDA(b)
of BG Group for the 2015 financial year
General The following statement, which is contained in the 2015 outlook commentary on page 6 of this results statement, constitutes a profit forecast (LNG Segment Profit Forecast) for the year ending 31 December 2015 for the purposes of Rule 28 of the Takeover Code (the Code):
“LNG Shipping & Marketing EBITDA guidance remains in the range of $1.3 - 1.5 billion for 2015 based on mid-October forward commodity price curves, with an expected outturn around the middle of the range.”
Basis of preparation The LNG Segment Profit Forecast is based on:
· the unaudited condensed financial statements of BG Group plc for the nine months ended 30 September 2015;
· the projected financial performance of the Group consistent with BG Group’s business plan for the remaining
three months of 2015; and
· BG Group remaining an independent entity throughout 2015.
The LNG Segment Profit Forecast has been prepared on a basis consistent with the BG Group accounting policies which are in accordance with IFRS as adopted in the EU and are those which BG Group expects to be used in preparing the BG Group 2015 Annual Report and Accounts. These policies are consistent with those used in the preparation of the BG Group 2014 Annual Report and Accounts.
The BG Group Directors have provided their best estimate (on the basis set out above and the assumptions set out below) of the LNG Shipping & Marketing segment Business Performance EBITDA for 2015 based on forward commodity price curves as at 12 October 2015.
Assumptions BG Group’s Directors have prepared the LNG Segment Profit Forecast on the basis of the following assumptions for the year ending 31 December 2015: Factors outside the influence or control of the BG Group directors:
· There will be no change to the current prevailing global macroeconomic and political conditions, particularly in
the regions where BG Group sources and delivers LNG.
· There will be no material changes to the conditions of the markets in which BG Group operates or to the
behaviour of competitors in those markets.
· There will be no change in commodity prices from the forward commodity price curves as at
12 October 2015 that were used to prepare the forecast, particularly oil, US and UK natural gas and LNG
prices.
· The main exchange rates and inflation in BG Group’s principal markets will remain materially unchanged from
the current prevailing rates.
· There will be no material adverse or beneficial events which will have a significant impact on BG Group’s
financial performance.
· There will be no material changes in the legislation or regulatory requirements impacting on BG Group’s
operations or its accounting policies.
a) ‘Business Performance’ excludes disposals, certain re-measurements and impairments and certain other exceptional items as exclusion of these items provides a clear and consistent presentation of the underlying operating performance of the Group’s ongoing business. For further information see Presentation of Non-GAAP measures (page 14) and notes 1 to 3 (pages 22 to 25).
b) EBITDA is defined as Earnings before interest, tax, depreciation and amortisation, including post-tax results of joint ventures and associates.
BG Group plc
2015 THIRD QUARTER & NINE MONTHS RESULTS
BG Group plc – 2015 Third Quarter & Nine Months Results 32
BG Group LNG Shipping & Marketing Profit Forecast continued Assumptions continued
Factors outside the influence or control of the BG Group directors continued
· The recommended cash and share offer for BG Group by Royal Dutch Shell does not complete during 2015
and has no impact on BG Group’s 2015 results.
· There will be no material adverse LNG supply disruptions.
· No significant additional LNG supply becomes available to BG Group.
· Commodity trading conditions will be in line with past experiences.
Factors within the influence or control of the BG Group directors:
· BG Group does not carry out any acquisitions or disposals, or enter into, terminate or vary any joint venture,
which is material in the context of the LNG Segment Profit Forecast.
· Profits generated by managing the flexibility of the LNG portfolio will be in line with past experiences.
· There will be no material changes to contractual terms with suppliers or customers.
· There will be no changes to the expected level of spend on Business Development projects in the
LNG Shipping & Marketing segment.
· BG Group delivers the commissioning, ramp-up and start of commercial operations of QCLNG Train 2 to plan.
· BG Group’s anticipated cost savings will be delivered.
· There will be no change in the current key management within BG Group’s LNG Shipping & Marketing
business.
Directors’ confirmation The BG Group Directors have considered the LNG Segment Profit Forecast and confirm that it has been properly compiled on the basis of the assumptions stated above and that the basis of the accounting used is consistent with BG Group’s accounting policies.
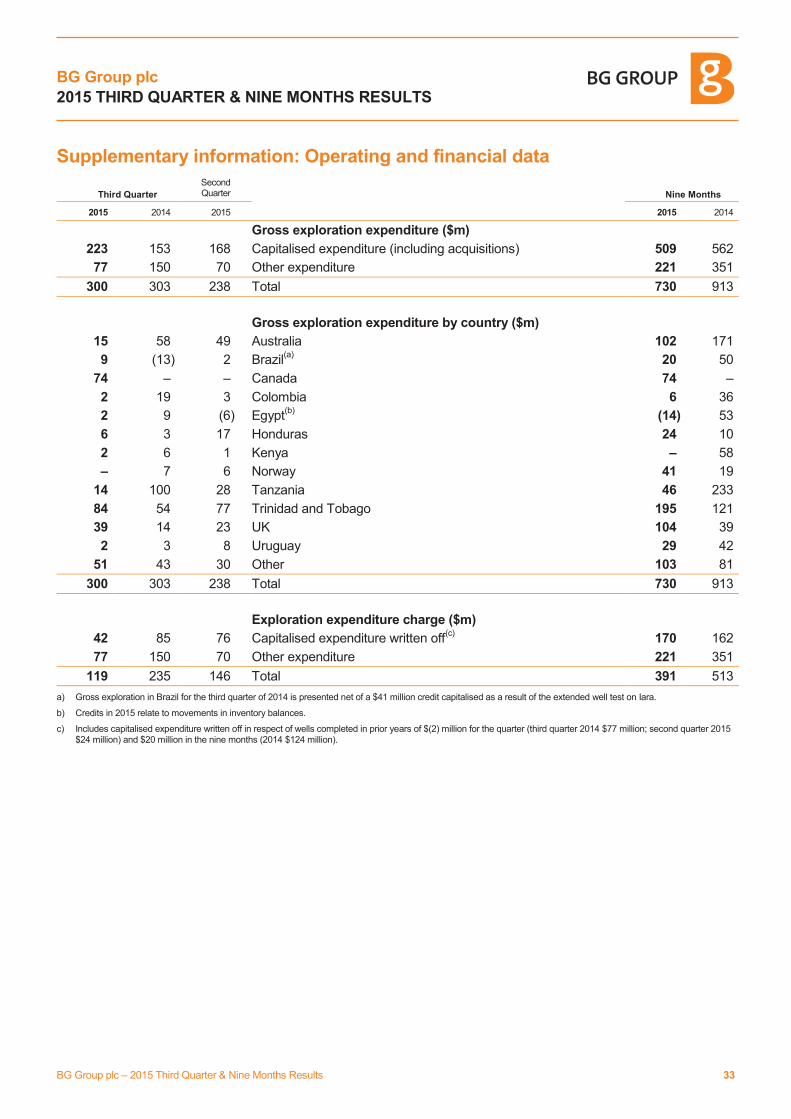
BG Group plc
2015 THIRD QUARTER & NINE MONTHS RESULTS
BG Group plc – 2015 Third Quarter & Nine Months Results 33
Supplementary information: Operating and financial data
Third Quarter
Second Quarter Nine Months
2015 2014 2015 2015 2014
Gross exploration expenditure ($m)
223 153 168 Capitalised expenditure (including acquisitions) 509 562
77 150 70 Other expenditure 221 351
300 303 238 Total 730 913
Gross exploration expenditure by country ($m)
15 58 49 Australia 102 171
9 (13) 2 Brazil(a)
20 50
74 – – Canada 74 –
2 19 3 Colombia 6 36
2 9 (6) Egypt(b)
(14) 53
6 3 17 Honduras 24 10
2 6 1 Kenya – 58
– 7 6 Norway 41 19
14 100 28 Tanzania 46 233
84 54 77 Trinidad and Tobago 195 121
39 14 23 UK 104 39
2 3 8 Uruguay 29 42
51 43 30 Other 103 81
300 303 238 Total 730 913
Exploration expenditure charge ($m)
42 85 76 Capitalised expenditure written off(c)
170 162
77 150 70 Other expenditure 221 351
119 235 146 Total 391 513
a) Gross exploration in Brazil for the third quarter of 2014 is presented net of a $41 million credit capitalised as a result of the extended well test on Iara.
b) Credits in 2015 relate to movements in inventory balances.
c) Includes capitalised expenditure written off in respect of wells completed in prior years of $(2) million for the quarter (third quarter 2014 $77 million; second quarter 2015 $24 million) and $20 million in the nine months (2014 $124 million).
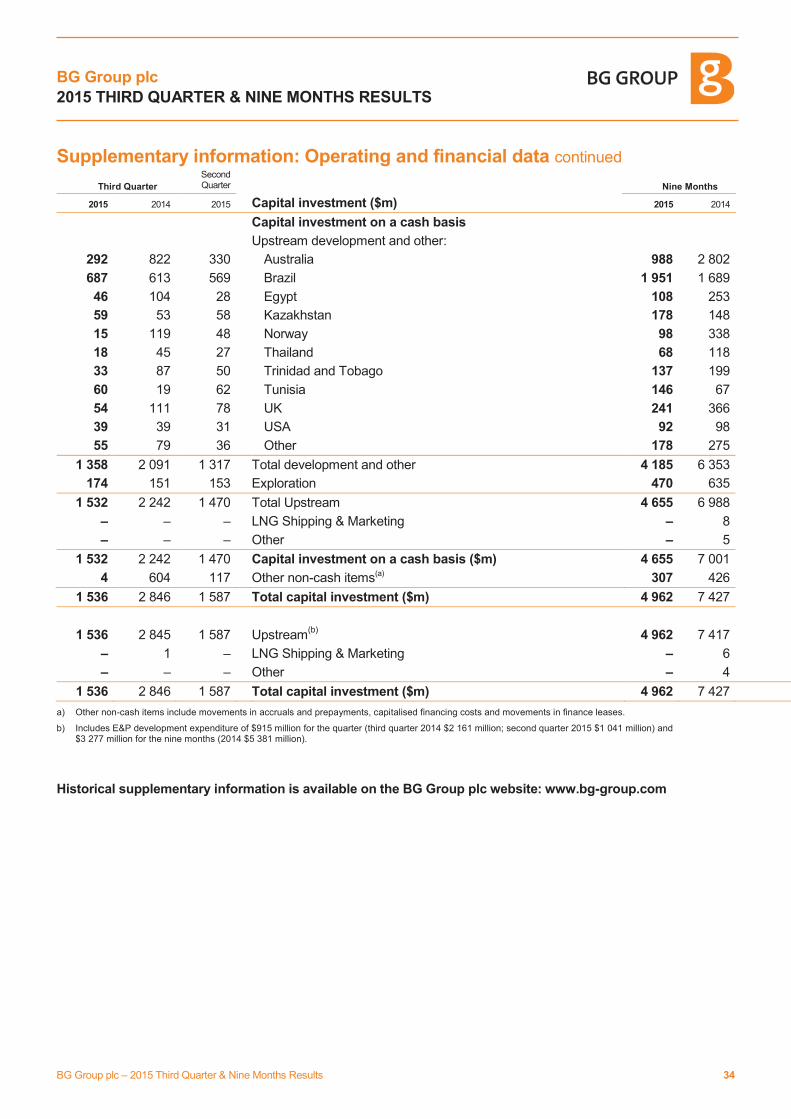
BG Group plc
2015 THIRD QUARTER & NINE MONTHS RESULTS
BG Group plc – 2015 Third Quarter & Nine Months Results 34
Supplementary information: Operating and financial data continued
Third Quarter
Second Quarter Nine Months
2015 2014 2015 Capital investment ($m) 2015 2014
Capital investment on a cash basis
Upstream development and other:
292 822 330 Australia 988 2 802
687 613 569 Brazil 1 951 1 689
46 104 28 Egypt 108 253
59 53 58 Kazakhstan 178 148
15 119 48 Norway 98 338
18 45 27 Thailand 68 118
33 87 50 Trinidad and Tobago 137 199
60 19 62 Tunisia 146 67
54 111 78 UK 241 366
39 39 31 USA 92 98
55 79 36 Other 178 275
1 358 2 091 1 317 Total development and other 4 185 6 353
174 151 153 Exploration 470 635
1 532 2 242 1 470 Total Upstream 4 655 6 988
– – – LNG Shipping & Marketing – 8
– – – Other – 5
1 532 2 242 1 470 Capital investment on a cash basis ($m) 4 655 7 001
4 604 117 Other non-cash items(a) 307 426
1 536 2 846 1 587 Total capital investment ($m) 4 962 7 427
1 536 2 845 1 587 Upstream(b)
4 962 7 417
– 1 – LNG Shipping & Marketing – 6
– – – Other – 4
1 536 2 846 1 587 Total capital investment ($m) 4 962 7 427
a) Other non-cash items include movements in accruals and prepayments, capitalised financing costs and movements in finance leases. b) Includes E&P development expenditure of $915 million for the quarter (third quarter 2014 $2 161 million; second quarter 2015 $1 041 million) and
$3 277 million for the nine months (2014 $5 381 million).
Historical supplementary information is available on the BG Group plc website: www.bg-group.com
BG Group plc
2015 THIRD QUARTER & NINE MONTHS RESULTS
BG Group plc – 2015 Third Quarter & Nine Months Results 35
Glossary
In BG Group’s results some or all of the following definitions are used:
bcf billion cubic feet
bcfd billion cubic feet per day
Boe barrels of oil equivalent
boed barrels of oil equivalent per day
bopd barrels of oil per day
Total capital investment
Expenditure on property, plant and equipment, other intangible assets and investments, including business combinations
Capital investment on a
cash basis
Cash flows on purchase of property, plant and equipment and intangible assets, loans to joint ventures and associates, and investments in subsidiaries, joint ventures and associates
Combination the proposed acquisition of the entire issued and to be issued share capital of BG Group plc by Royal Dutch Shell plc announced 8 April 2015, as described in the Rule 2.7 document available at www.bg-group.com/shelloffer
Delivered volumes Comprise all LNG volumes discharged in a given period, excluding LNG utilised by the ships
EBIT Earnings before interest and tax, including post-tax results of joint ventures and associates
EBITDA Earnings before interest, tax, depreciation and amortisation, including post-tax results of
joint ventures and associates
E&P Exploration and production
E&P EBIT/ EBITDA margin E&P EBIT/EBITDA before exploration charge divided by net production for the period
DD&A Depreciation, depletion and amortisation
FPSO Floating production, storage and offloading (vessel)
Free cash flow Net cash flow from operating activities, less net interest paid and capital investment on a
cash basis, plus dividends from joint ventures and associates and other loan repayments
Gearing
Ratio of net borrowings to total shareholders’ funds (excluding balances associated with commodity financial instruments and related deferred tax) plus net borrowings
IAS International Accounting Standard
IFRS International Financial Reporting Standard
kboed thousand barrels of oil equivalent per day
LNG Liquefied Natural Gas
LNG Shipping & Marketing LNG shipping, marketing and interests in regasification businesses
m Million
mmboe million barrels of oil equivalent
mmbtu million british thermal units
mmscfd million standard cubic feet per day
mtpa million tonnes per annum
Net debt / Net borrowings
Comprise cash, current asset investments, finance lease liabilities/assets, currency and interest rate derivative financial instruments and short and long-term borrowings. Excludes net borrowings in respect of assets classified as held for sale
PSC production sharing contract
ROACE Return on average capital employed. Represents Business Performance earnings over the past 12 months, excluding net finance costs/income on net borrowings, as a percentage of average capital employed over the past 12 months
tcf trillion cubic feet
Unit operating expenditure per boe
Calculated by dividing production and other operating costs (royalties) by the net production for the period. This measure does not include the impact of depreciation and amortisation costs and exploration costs as they are not considered to be costs associated with the operation of producing assets
Unit lifting costs per boe Calculated by excluding royalty, tariff and insurance costs from ‘unit operating expenditure’
as defined above
Upstream Exploration & Production and LNG liquefaction businesses
BG Group plc
2015 THIRD QUARTER & NINE MONTHS RESULTS
BG Group plc – 2015 Third Quarter & Nine Months Results 36
Enquiries
Enquiries relating to BG Group's results, business and financial position should be made to:
General enquiries about shareholder matters should be made to:
Mark Lidiard 0118 929 2079 Equiniti Limited Aspect House Spencer Road Lancing West Sussex BN99 6DA
Siobhán Andrews 0118 929 3171
Ian Wood 0118 929 3829
Investor Relations Department BG Group plc Thames Valley Park Drive Reading Berkshire RG6 1PT
email: [email protected]
Tel: 0371 384 2064 Online: via https://help.shareview.co.uk
(From here, you will be able to email your query securely)
Media Enquiries:
Lachlan Johnston
0118 929 2942
Kim Blomley 0118 938 6568
Toby Bates 0118 929 2246
High resolution images are available at www.flickr.com/bggroup
BG Group is listed on the US over-the-counter market OTCQX International Premier. Enquiries relating to ADRs should be made to:
JP Morgan Chase Bank, N.A PO Box 64504 St Paul MN 55164-0504 USA
Tel: +1 651 453 2128 www.adr.com
Financial Calendar
Announcement of 2015 fourth quarter and full year results 5 February 2016
BG Group plc website: www.bg-group.com
Registered office
100 Thames Valley Park Drive, Reading, RG6 1PT
Registered in England No. 3690065