Embed Size (px)
Citation preview

Keyword(s): Abstract:
©
Adaptive User Profiles
Elke Michlmayr, Steve Cayzer
HP LaboratoriesHPL-2008-201
adaptive, user profile, folksonomy, tagging, delicious, personalization
A major opportunity for collaborative knowledge management is the construction of user models which canbe exploited to provide relevant, personalized, and context-sensitive information delivery. Yet traditionalapproaches to user profiles rely on explicit, brittle models that go out of date very quickly, lack relevance,and have few natural connections to related models. In this chapter the authors show how it is possible tocreate adaptive user profiles without any explicit input at all. Rather, leveraging implicit behaviour onsocial information networks, the authors can create profiles that are both adaptive and socially connective.Such profiles can help provide personalized access to enterprise resources and help identify other peoplewith related interests.
External Posting Date: November 21, 2008 [Fulltext] Approved for External PublicationInternal Posting Date: November 21, 2008 [Fulltext]
To be published in the book: Collaboration & Social Information & Access: Techniques for Approached User Modelling
Copyright Collaboration & Social Information & Access: Techniques for Approached User Modelling, IGI Publishing.
�
Chapter IVAdaptive User Profiles
Steve CayzerHewlett-Packard Laboratories, UK
Elke MichlmayrVienna University of Technology, Austria
Copyright © 2009, IGI Global, distributing in print or electronic forms without written permission of IGI Global is prohibited.
AbstrAct
A major opportunity for collaborative knowledge management is the construction of user models which can be exploited to provide relevant, personalized, and context-sensitive information delivery. Yet tra-ditional approaches to user profiles rely on explicit, brittle models that go out of date very quickly, lack relevance, and have few natural connections to related models. In this chapter the authors show how it is possible to create adaptive user profiles without any explicit input at all. Rather, leveraging implicit behaviour on social information networks, the authors can create profiles that are both adaptive and socially connective. Such profiles can help provide personalized access to enterprise resources and help identify other people with related interests.
IntroductIon
There are many ways to deal with the challenges of collaborative knowledge management and dis-covery within enterprises. This chapter focuses on personalized, adaptive approaches, leveraging user behaviour on social information systems.
A major challenge for enterprise information systems is presenting the information that us-
ers want in a way that makes sense to them. In traditional approaches to information filtering, the user has to explicitly create his or her profile, and manually keep the profile up to date. Can we take advantage of the popularity of collaborative tagging systems, such as delicious.com or flickr.com, and use the recorded tagging behaviour to construct implicit, yet realistic and dynamic user profiles?

�
Adaptive User Profiles
The use of profiles for personalization is not new, but such systems typically rely on an explicit, manually entered user profile. This imposes a burden on the user, both at initial creation time, and more importantly over time as the user’s skills and interests change, so the profile has to be updated. Typically, the created user profiles go out of date, fast.
Of course, this problem has been well under-stood for decades and much research has focused on the possibility of creating implicit user profiles. Put simply, such approaches attempt to ‘look over the user’s shoulder’ so to speak, and create a profile out of normal behaviour. The advantage with these approaches is that the mined profile should evolve simply and naturally with ongoing changes in user behaviour patterns.
There are some drawbacks with these ap-proaches. It is, for example, difficult to mine accurate user profiles from observed behaviour. Another problem is dealing with the changing nature of user interests. How can one distinguish between long term characteristics (as for example defined by a user’s profession), medium term interests (such as ruby or agile_management for software engineers), and transient foci of attention (this year’s holiday planning, news articles)? How does one choose the right level of ‘forgetfulness’ in the user’s profile? A more subtle problem is that implicit user profiles are not examinable, or scrutable. Without some control over their profiles, users are likely to become distrustful of systems that use these profiles, particularly if they make egregious errors. While users do not want to spend excessive time doing ‘profile gardening’, they would like the facility to exam-ine and tweak the profiles to correct errors or to proactively direct the system. A related issue is that of privacy: certainly on the public Internet, users are increasingly wary of the amount of information that is being gathered without their explicit consent
So we are in a situation where we would like to generate realistic, dynamic user profiles which
are scrutable and privacy preserving. Where can we find such profiles? This chapter is primarily concerned with collaborative tagging systems, but this is just one possibility. Many of the principles discussed in this chapter are equally applicable to any system that a user interacts with on a regular basis. The use of folders in email, web browsing and document management is one possibility. User queries, both on the intra/internet and to enterprise systems, are another. Communities of interest, such as forums and mailing lists, provide yet another rich source of user behaviour to observe and to mine.
The basic operation of collaborative tagging systems is very simple. Users annotate a resource of interest, often a web page, with an arbitrary number of free text tags. These tags, personal or communal, can be used to browse a community’s resources, both documents and people. The popu-larity of such systems provides a useful store of personally identifiable user behaviour which can be used to create implicit user profiles. In this chapter we will survey related work on user pro-files. Then, taking collaborative tagging systems as an exemplar of a source from which we can construct user profiles, we will present
1. algorithms for creating such profiles 2. approaches to profile analysis and evalua-
tion3. methods for dynamic visualization of the
generated profiles4. a discussion of the potentials of using such
profiles for personalized access to enterprise data sources.
User Profiles
Both academia (Gauch et al, 2007) and enterprises (Karat et al, 2003) have experimented with user profiles for personalization. Indeed, user profiling is a prominent feature of many modern content management systems like Microsoft Office Share-point Server1. The trouble with such systems,
�
Adaptive User Profiles
as we mentioned above, is that they rely on an explicit, static, manually entered user profile. In this section, we explain the need for user profiles to be implicit, dynamic and scrutable.
Implicit user profiles are created by looking over the shoulder of a user performing their usual tasks (Goecks & Shavlik, 2000). Such tasks can include email, document management or web browsing (Middleton et al, 2001). By removing the obligation of a user to manually create a pro-file, data collection is easier and the risk of ‘data entry fatigue’, or inaccurate profiling, is reduced. Most work to date has focused on collecting terms from visited web pages (Godoy & Amandi, 2005; Kim & Chan, 2008) rather than tags applied by a user. Algorithmically, both sources of data can be treated similarly but the effect may be rather different, as one is author-supplied metadata and the other annotations from the reader.
Even gathered implicitly, a user profile is prone to go out of date as users’ interests change over time. Dynamic user profiles are those which update as the user task is changed. Godoy & Amandi (2005) present such an approach using a hierarchical organization of users’ interests, while Nanas et al (2004) use a more graph-like representation. In both works an artificial change of task context is employed: we show in this chapter how this approach can be applied to real life user behaviour over time.
It is possible to use sophisticated machine learning techniques to produce ‘black box’ pro-files (Pazzani & Billsus, 1997). However, such profiles can be frustrating for the users, who are unable to examine, let alone control, the profile. The term scrutable has been proposed to describe profiles that can be examined and understood by a user (Kay, 2006). Such profiles allow a user to nominate an area of interest that may not have yet shown up in his/her profile (a new area of research perhaps). Profile errors can be corrected, and parts of the profile can be hidden so that user privacy is respected.
Collaborative Tagging Systems
Collaborative tagging systems provide interfaces for annotating bookmarks with free-text key-words. The basic operation of such systems is very simple. Users annotate a resource of interest (often a web page) with an arbitrary number of free text tags. Usually there is some browser button (bookmarklet) utility to make this process very lightweight. Often the bookmarklet will provide tag suggestions based on your previous tags and others’ tags for this resource. Once this is done, one can browse the user community’s bookmarked resources by an arbitrary combination of tags and/or users. Usually, these queries can be persisted and published as an RSS/Atom2 feed. Often, users are allowed to mark bookmarks as private so that they are not visible to such queries.
Perhaps the best well known collaborative tagging system is delicious.com (formerly known as del.icio.us). It has proved extremely popular, quickly growing to 1 million users in 20063 and then 3 million in 20074. Alternatives abound, both on the public Internet and on corporate intranets. Within Hewlett-Packard there are at least three such systems, each exhibiting different charac-teristics and capabilities. The first, ‘bookmarks’, shares most of the characteristics above but also ties bookmarks into an organisation structure (so one can ask, for example, ‘show me all bookmarks for Jim’s work group’). The second, ‘Labbies’, provides ‘tiny’ URLs (drastically shortened but still unique URL aliases) which can be used to identify that bookmark in other resources about that bookmark, such as email discussions. It is also privacy preserving in that bookmarks are anonymous. The third, [email protected], is an ex-perimental KM system. Every person in HP has a me@hp page, which is populated by default with basic data from the LDAP directory. How-ever, users may enrich this profile with free text descriptions, photos and tags which describe their interests. Thus rather than tagging documents or
�
Adaptive User Profiles
web pages, tags are applied to people and hence represent communities of interest.
The simplicity and the immediate usefulness of collaborative tagging systems have attracted a high number of users. As increasingly bookmark collections have lifespans of years, these data sources contain fine-grained information about a user’s changing interests over time; a valuable resource that we should be able to leverage. Unlike many other profile learning mechanisms, which rely on relevance feed-back from the user, using tagging metadata does not require any additional user input. Moreover, since tagging data is time-based, it allows us to create user profiles that dynamically adapt to drifts in users’ interests.
We should note in passing that the community dynamics of collaborative tagging systems are fascinating and have been well studied (Golder & Huberman, 2006). However such dynamics are not the primary focus of discussion here, as instead we focus on the changes in an individual’s tagging behaviour over time.
crEAtInG IMPLIcIt usEr ProFILEs FroM coLLAborAtIVE tAGGInG sYstEMs
How can we take advantage of the popularity of collaborative tagging systems, and use the recorded tagging behaviour to construct implicit, yet realistic and dynamic user profiles? Here we take a user-centric perspective, focusing on those tags which have been employed by a single user. Tagging data can be treated as a continuous stream of information about a user’s interests which can be used for creating a rich user profile.
In fact, there is a fascinating interplay between community and individual effects. Individuals are free to choose their own tags; however many choose tags that are popular in the community. Indeed, systems like flickr and delicious positively encourage this behaviour by recommending tags to their users. Some tags will nevertheless be unique to a particular user. In a small sample taken by (Byde et al, 2007) about one third of all tagged URLs had completely unique tags. We believe it would be inappropriate for a user profile to treat such tags, or indeed atypical uses of existing tags, as outliers.
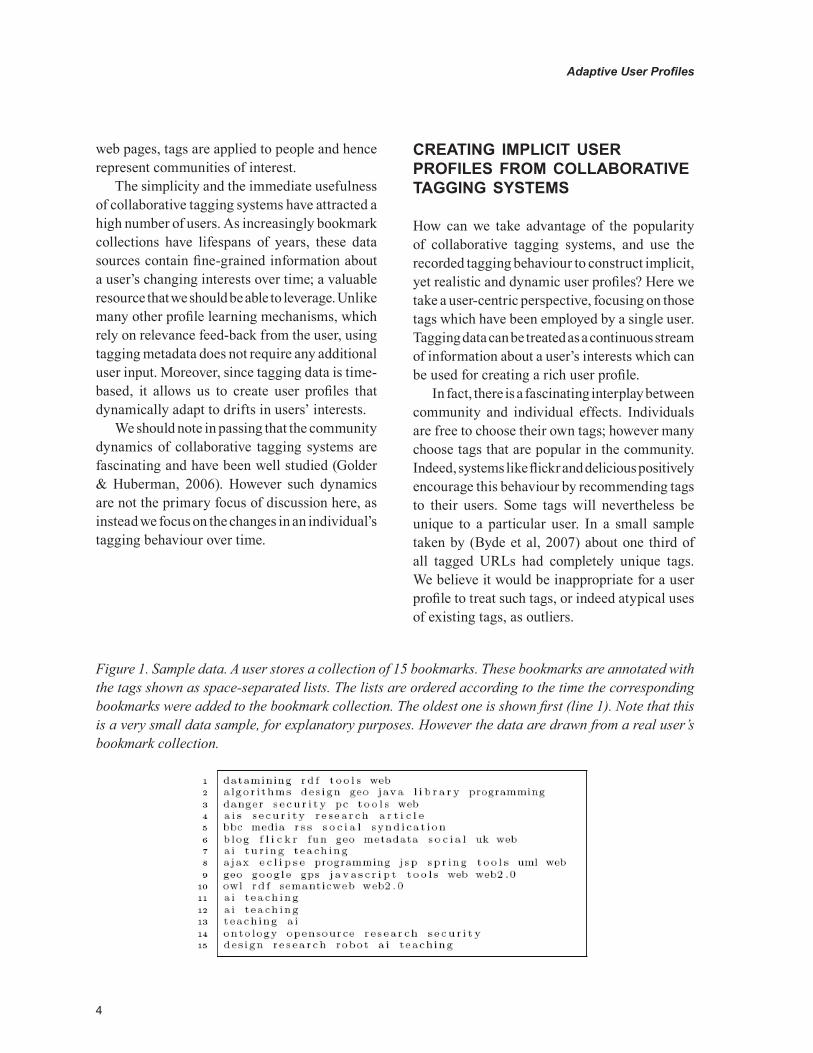
Figure 1. Sample data. A user stores a collection of 15 bookmarks. These bookmarks are annotated with the tags shown as space-separated lists. The lists are ordered according to the time the corresponding bookmarks were added to the bookmark collection. The oldest one is shown first (line 1). Note that this is a very small data sample, for explanatory purposes. However the data are drawn from a real user’s bookmark collection.

�
Adaptive User Profiles
There are more subtle dynamics at work when considering connections between tags. Co-tagging behaviour can be guided by tag recommendation mechanisms, but frequent and repeated co-tagging, particularly in the absence of recommendation clues, indicates a connection between those tags in the user’s mind. To an in-dividual user, these deviations from community norms may be tremendously important in defining their particular niche interest and perspective. It is these personal, perhaps idiosyncratic choices that we seek to exploit in this chapter, while acknowledging that such choices will depend at least in part on social cues (Golder & Huberman, 2006; Mika, 2005).
What is it, then, that we want to extract from a user’s tagging activity? Clearly the tags them-selves are important, and their relative importance to the user. We also want to capture the relation-ships that exist between tags. Finally we need to make use of the temporal dynamics implicit in tagging activity over a sustained period.
We present a ‘toy’ example for illustrative purposes. Consider a user’s bookmark collection consisting of a user defined number of bookmarks. Each bookmark in the collection is composed of a title, a description, a URL, a date, and a set of tags. Some sample data is shown in Figure 1.
For creating the profile, we focus on the tags and their temporal ordering by increasing date.
We will use the sample data to illustrate three different methods for profile construction: a naive approach; an approach based on co-occurrence; and an adaptive approach.
Naive Approach
Perhaps the simplest method of analysis is to count the occurrence of tags. The result of this computation is a list of tags which is ranked ac-cording to tag popularity. For the sample data in Figure 1, the ranked tag list is shown in Table 1. It reveals that most tags have been used only once, and that there are only a few tags which were used most frequently. The user profile can then be created by selecting the top k most popular tags from the ranked list. If we select the top 3 tags, for example, the resulting user profile consists of the tags: web, ai, teaching.
The benefit of this method is that it is very simple, and hence fast. However, it has some drawbacks. One major problem is that those tags which are used most often tend not to be very specific (e.g., the tag web is a very general one). Moreover, although the tagging data includes information about the relationships between those tags, these relationships are not included in the user profile.
Table 1. List of tags ranked by their number of occurrence
�
Adaptive User Profiles
Despite its simplicity and limitations, this naïve method is commonly and popularly employed in the form of a tag cloud. This is a visualization method in which all tags a user has employed so far are listed alphabetically and the font size of a tag is set according to how often it has been used so far.
Co-Occurrence Approach
The resulting profile is more specific if we focus not only on which tags have been used, but rather on which tags have been used in combination. This can be achieved by relying on the co-oc-currence technique known from Social Network Analysis (Wasserman & Faust, 1994). If two tags are used in combination (co-occur) by a certain user for annotating a certain bookmark, there is some kind of semantic relationship between them. The more often two tags are used in com-bination, the more intense this relationship is. This can be represented by a graph with labeled nodes and undirected weighted edges in which nodes correspond to tags and edges correspond to the relationship between tags. Each time a new tag is used, a new node for this tag is added to the graph. Each time a new combination of tags
is used, a new edge with weight 1 between the corresponding nodes is created in the graph. If two tags co-occur again, the weight for the cor-responding edge is increased by 1.
Co-occurrence techniques have been em-ployed for diverse purposes. First and foremost, the folksonomy providers often use it for com-puting related tags. Moreover, co-occurrence is also used in knowledge discovery from databases (Chen & Lynch, 1992), for extracting light-weight ontologies from tagging data (Mika, 2005), or for tag recommendation (Byde et al., 2007; Xu et al, 2006). The approach described in this section is different in that it uses co-occurrence at a smaller scale; for a single bookmark collection. Therefore the relationships between the tags are not the result of a community-driven process, but are created by a single user. Hence, the relationships between the tags might not make sense to anyone except the user who created them. However, in the case of user profile creation this is acceptable and even desirable, because for this task we need to find out about how the interests of a user are connected to each other, no matter how unorthodox these connections might be.
The co-occurrence graph is created by parsing the tags for all items in the bookmark collection
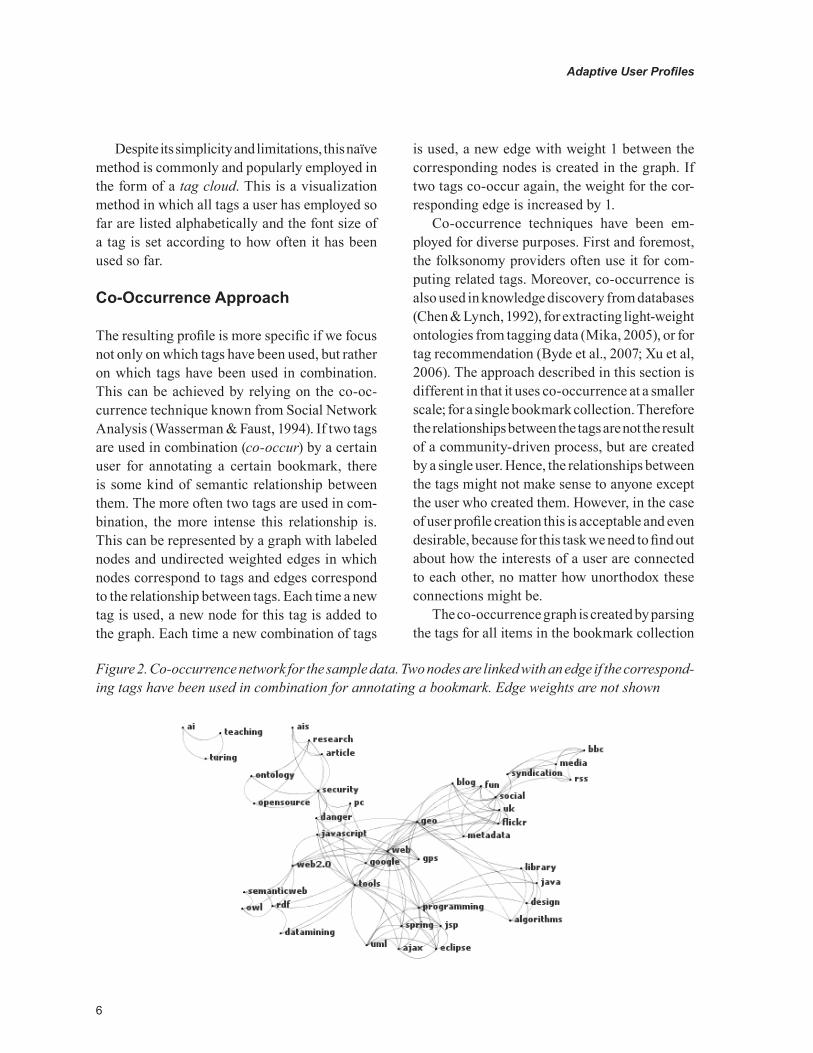
Figure 2. Co-occurrence network for the sample data. Two nodes are linked with an edge if the correspond-ing tags have been used in combination for annotating a bookmark. Edge weights are not shown
�
Adaptive User Profiles
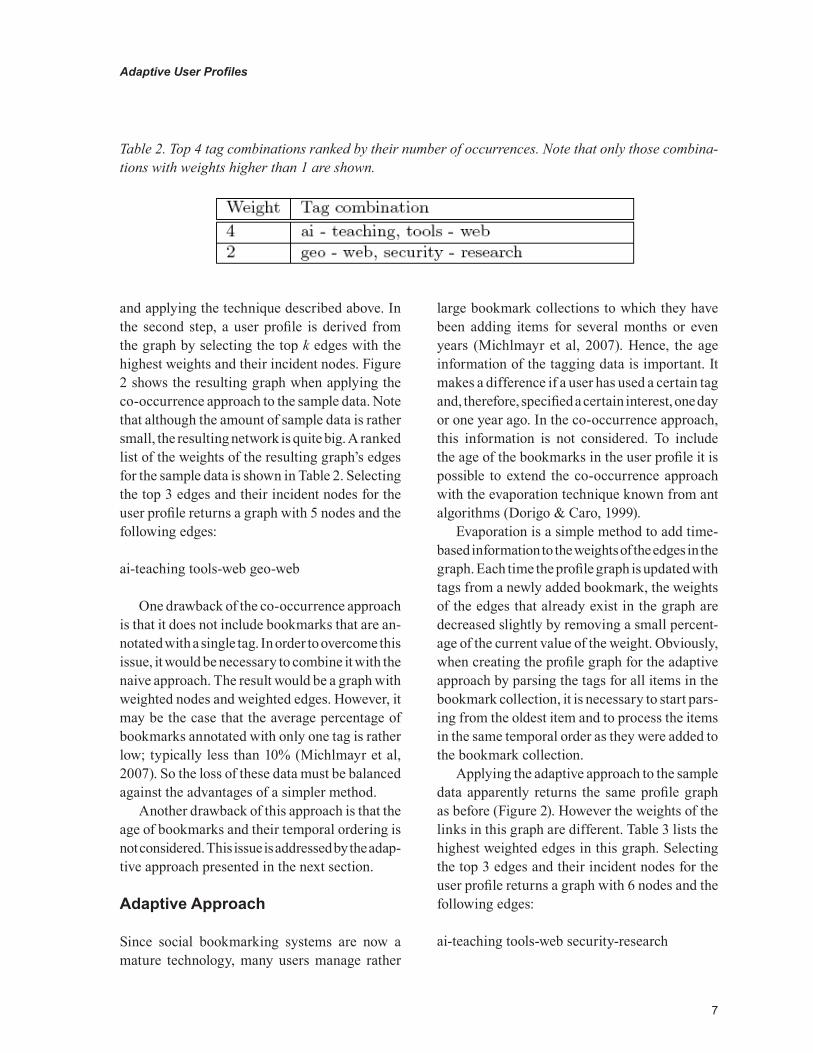
and applying the technique described above. In the second step, a user profile is derived from the graph by selecting the top k edges with the highest weights and their incident nodes. Figure 2 shows the resulting graph when applying the co-occurrence approach to the sample data. Note that although the amount of sample data is rather small, the resulting network is quite big. A ranked list of the weights of the resulting graph’s edges for the sample data is shown in Table 2. Selecting the top 3 edges and their incident nodes for the user profile returns a graph with 5 nodes and the following edges:
ai-teaching tools-web geo-web
One drawback of the co-occurrence approach is that it does not include bookmarks that are an-notated with a single tag. In order to overcome this issue, it would be necessary to combine it with the naive approach. The result would be a graph with weighted nodes and weighted edges. However, it may be the case that the average percentage of bookmarks annotated with only one tag is rather low; typically less than 10% (Michlmayr et al, 2007). So the loss of these data must be balanced against the advantages of a simpler method.
Another drawback of this approach is that the age of bookmarks and their temporal ordering is not considered. This issue is addressed by the adap-tive approach presented in the next section.
Adaptive Approach
Since social bookmarking systems are now a mature technology, many users manage rather
large bookmark collections to which they have been adding items for several months or even years (Michlmayr et al, 2007). Hence, the age information of the tagging data is important. It makes a difference if a user has used a certain tag and, therefore, specified a certain interest, one day or one year ago. In the co-occurrence approach, this information is not considered. To include the age of the bookmarks in the user profile it is possible to extend the co-occurrence approach with the evaporation technique known from ant algorithms (Dorigo & Caro, 1999).
Evaporation is a simple method to add time-based information to the weights of the edges in the graph. Each time the profile graph is updated with tags from a newly added bookmark, the weights of the edges that already exist in the graph are decreased slightly by removing a small percent-age of the current value of the weight. Obviously, when creating the profile graph for the adaptive approach by parsing the tags for all items in the bookmark collection, it is necessary to start pars-ing from the oldest item and to process the items in the same temporal order as they were added to the bookmark collection.
Applying the adaptive approach to the sample data apparently returns the same profile graph as before (Figure 2). However the weights of the links in this graph are different. Table 3 lists the highest weighted edges in this graph. Selecting the top 3 edges and their incident nodes for the user profile returns a graph with 6 nodes and the following edges:
ai-teaching tools-web security-research
Table 2. Top 4 tag combinations ranked by their number of occurrences. Note that only those combina-tions with weights higher than 1 are shown.

�
Adaptive User Profiles
The difference between this user profile and the one returned by the co-occurrence approach shows the effect of using evaporation for profile creation. The combinations geo-web and security-research co-occur the same number of times in the sample data. In the co-occurrence approach, a random selection of one of them was made for inclusion in the profile. With the adaptive approach it is possible to detect that the latter combination has been used at a later point in time and can therefore be considered as currently more important to the user.
In summary, the naïve approach just looks at tags which it treats as weighted nodes in a edge-less graph; the co-occurrence approach includes weighted edges whose weight monotonically increases; and the adaptive approach uses evapora-tion to increase the contrast of more recently used connections. The differences are summarized in Table 4.
The Add-A-Tag Algorithm
Now we formally define a possible implementa-tion of the adaptive algorithm described above.
The high level pseudocode is followed by formal mathematical descriptions of each step. The algo-rithm includes both creation of the profile graph, and extraction of a user profile from it.
initialize profile to an empty graph (a)for each bookmark in collection perform evaporation (b) apply reinforcement (c)extract user profile from graph (d)
(a) Initialize the profile graph
The profile graph is ( )EVG ,= where { }nvvV 1= is the set of vertices (which correspond to tags) and { }meeE 1= is the set of edges, each of which connects two vertices with a certain weight:
{ }xjix wvve ,,= (1)
We initialize G to an empty graph and V and E to empty sets.
Table 3. Top 4 tag combinations for the adaptive approach with parameters α = 1.0, β = 1.0, ρ = 0.01 (see text for details). Again only those combinations with weights higher than 1 are shown
Method Naïve Co-occurrence Adaptive
Weighted Nodes Yes No No
Weighted Edges No Yes Yes
Evaporation No No Yes
Table 4. Comparison of naïve, co-occurrence and adaptive approaches, showing how each creates a graph (nodes connected by edges) with different characteristics

�
Adaptive User Profiles
(b) Perform evaporation
In this step, the existing information in the graph is changed by applying the evaporation formula shown in equation 2 to every edge Eex ∈
( ) { })1(,,1 +=+ twvvte xjix (2) where
( ) { })(,, twvvte xjix = (3)
and
( ) ( ) ( )twtwtw xxx r−=+1 (4)
where ρ ∈ [0, 1] is a constant and ( )tw x is the weight of edge xe at time t
Thus, each edge weight is decreased by the evaporation coefficient ρ.
(c) Apply reinforcement
In the next step, the tags from the bookmarked item are added to the graph. Let the tags to be added form a set { }kttT 1= For every combination
jiTtTttt jiji <∈∈ ,,: , the following procedure is executed:
1. If Vti ∉ then it is added to V2. If Vt j ∉ then jt is added to V3. If { } Ewtte xjix ∈= ,, then xe is updated ac-
cording to the following equation:
e t 1 t ,t ,w ( t 1)x i j x (5) where w t 1 w tx x β (6) and 0 < β and β ∈ R (7)
4. If e t ,t ,w Ex i j x then xe is added to E with wx = α where
0 < α and α ∈ R (8)
So each possible tag combination in the current bookmark’s tags either causes a new edge to be added to the graph (with weight a ) or increases the weight of an existing edge (by weight b ).
The procedure described above (steps (b) and (c): evaporation followed by reinforcement) is executed each time the user adds a bookmark item to the bookmark collection.
(d) Extract the user profile from the graph
Once the graph contains all the required book-marks, extraction of the user profile from the profile graph can proceed as follows:
1. Create a ordered set sE from E where sE contains all edges { }xjix wvve ,,= in E in decreasing order of weight xw .
2. Create set kE by extracting the top k ele-ments from set sE , where kandk<0 is a natural number.
3. Create graph kG which is defined thus:
{ }
kj
ki
kxjix
kkk
VvandVv
EwvvetsEVG
∈∈
∈=∀=
,
,,,..),(
Thus the user profile contains the top k tag combinations from the graph; more formally, kGcontains all the edges from kE and all the vertices which are incident to one of these edges.
The size of the user profile kG is determined by the value chosen for parameter k .
Evaluation of Profile Algorithms
Many statistical analyses use large bookmark data sets scraped or otherwise collected from systems like delicious.com. Since we deal with user-related data, privacy concerns arise. Therefore, permis-sion should be sought before collecting this data and using it for analysis. Although this is likely to result in a small test set, useful information

�0
Adaptive User Profiles
can nevertheless be gleaned, as explained in the case study below.
Evaluating the adaptive aspects of the user profile creation mechanism can be achieved by computing the user profile of user u at two different times, and measuring the difference (distance) between these two user profiles. If we use the graph based profile approach detailed in the last section, we are hampered by the fact that measuring the distance between two graphs is a difficult and only partly solved issue (Buckley & Harary, 1990). However, we can simplify the problem by mapping the graphs onto a simpler structure which only contains the information we need for the comparison. Using a set of edges in decreasing weight order would be a good ap-proach, because several methods for comparing ordered sets exist. Therefore, we suggest the Kendall τ coefficient (Abdi, 2007). It is a standard measure for comparing ordered sets that includes rank correlation.
We define a metric dist(S1, S2) for the distance between two sets S1 and S2 based on the Kendall τ coefficient as shown in Equations 2a to 2c in such a way that it obeys the rules for metrics: positiveness, reflexivity, symmetry, and triangle inequality. The result values for dist(S1, S2) are in the range of 0 (if S1 and S2 are ranked in exactly the same order) to +1 (if the ranking of S1 can be obtained by reversing S2).
)1(),(2
),( 2121 −∗
∗=
nnss
ssdistt , (2a)
where
(2b)( s ,s ) ( s ,s )1 2 i, j 1 2i, j P,i j
τ τ
and
0if i. j areinthe sameorder in s and s( s ,s )1otherwise
1i, j 1 2τ
(2c)
In Equation 2a, variable n is the size of the sets. Equation 2b compares pairs of distinct elements in S1 and S2. Equation 2c counts discordant pairs. We need to make one pre processing modifica-tion to our tag lists, since Kendall τ is applicable only for sets which have the same members and are consequently of the same size. Thus new tags (which appear in S2 but not S1) and discarded tags (tags in S1 which don’t appear in S2) could be problematic. We can deal with such tags in one of two ways. We could simply discard tags used in only one of the compared profiles (an intersection-based approach). Or we could take a union-based approach by appending new tags to the end of S1 and discarded tags to the end of S2.
Case Study
This section is drawn from work described in (Michlmayr et al 2007). The authors used a test set consisting of six users’ bookmark collections for both evaluation experiments and a user study (see next section). It consists of three small (user 1, 2 and 3), two medium (user 4 and 6) and one large bookmark collection (user 5). The owners of the bookmark collections included in the test set were personally known to at least one of the authors of this paper, and were explicitly asked for permission to retrieve and evaluate their personal tagging data.
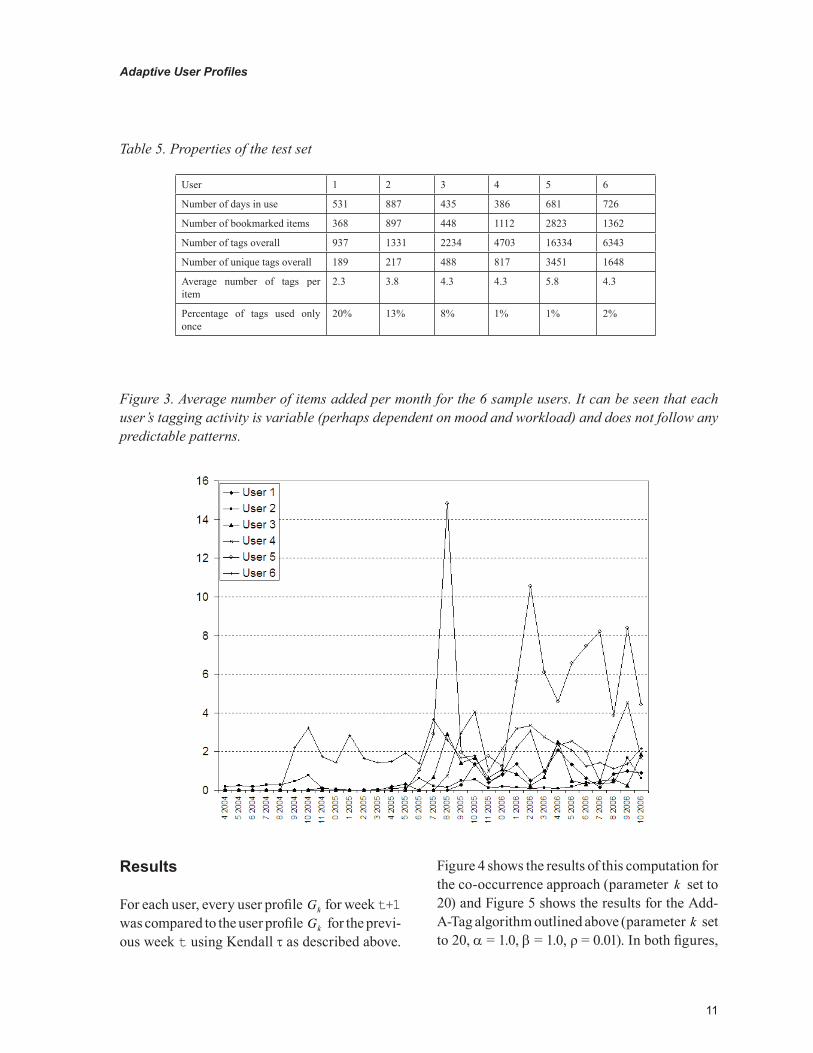
Table 5 shows the basic properties of the six bookmark collections in the test set. It can be seen that the bookmark collections varied in number of days of use, number of items, number of tags, number of unique tags, and average number of tags per item. No proportional relationship between any of these figures could be found. In addition, as shown in Figure 3, the users’ activity patterns were unpredictable. Some users maintained a reasonably constant level of activity, whereas others exhibited a bursty pattern.
��
Adaptive User Profiles
User 1 2 3 4 5 6
Number of days in use 531 887 435 386 681 726
Number of bookmarked items 368 897 448 1112 2823 1362
Number of tags overall 937 1331 2234 4703 16334 6343
Number of unique tags overall 189 217 488 817 3451 1648
Average number of tags per item
2.3 3.8 4.3 4.3 5.8 4.3
Percentage of tags used only once
20% 13% 8% 1% 1% 2%
Table 5. Properties of the test set
Figure 3. Average number of items added per month for the 6 sample users. It can be seen that each user’s tagging activity is variable (perhaps dependent on mood and workload) and does not follow any predictable patterns.
Results
For each user, every user profile kG for week t+1 was compared to the user profile kG for the previ-ous week t using Kendall τ as described above.
Figure 4 shows the results of this computation for the co-occurrence approach (parameter k set to 20) and Figure 5 shows the results for the Add-A-Tag algorithm outlined above (parameter k set to 20, α = 1.0, β = 1.0, ρ = 0.01). In both figures,

��
Adaptive User Profiles
Figure 4. Degree of change in user profile plotted against week of activity using co-occurrence approach (ρ = 0, k = 20)
Figure 5. Degree of change in user profile (using dist metric defined in equation 2) plotted against week of activity using Add-A-Tag algorithm (α = 1.0, β= 1.0, ρ = 0.01, k = 20)
��
Adaptive User Profiles
the data points show the metric values, and trend lines of type moving average with period 6 show the performance of the metric values over time for the different users.
Figure 4 shows the co-occurence approach, and it can be seen that in general the degree of change in the user profiles decreases over time. The profiles gradually stabilize (dist tends to zero) so that by week 100 there is little change. Although the users are specifying new tag combinations when adding bookmarks to their collections, the most often used tag combinations are too dominant and prevent newly arising tag combinations from being included in the profile.
When comparing these results to those of the Add-A-Tag approach (Figure 5), one can see that the profiles remain dynamic (dist stays high) even after prolonged usage. In fact, the degree of change in the user profile in the Add-A-Tag ap-proach starts off higher than in the co-occurrence approach, and remains similar for every time span. This provides evidence that the Add-A-Tag approach meets its goal of adapting the profile to the interests of the user over time.
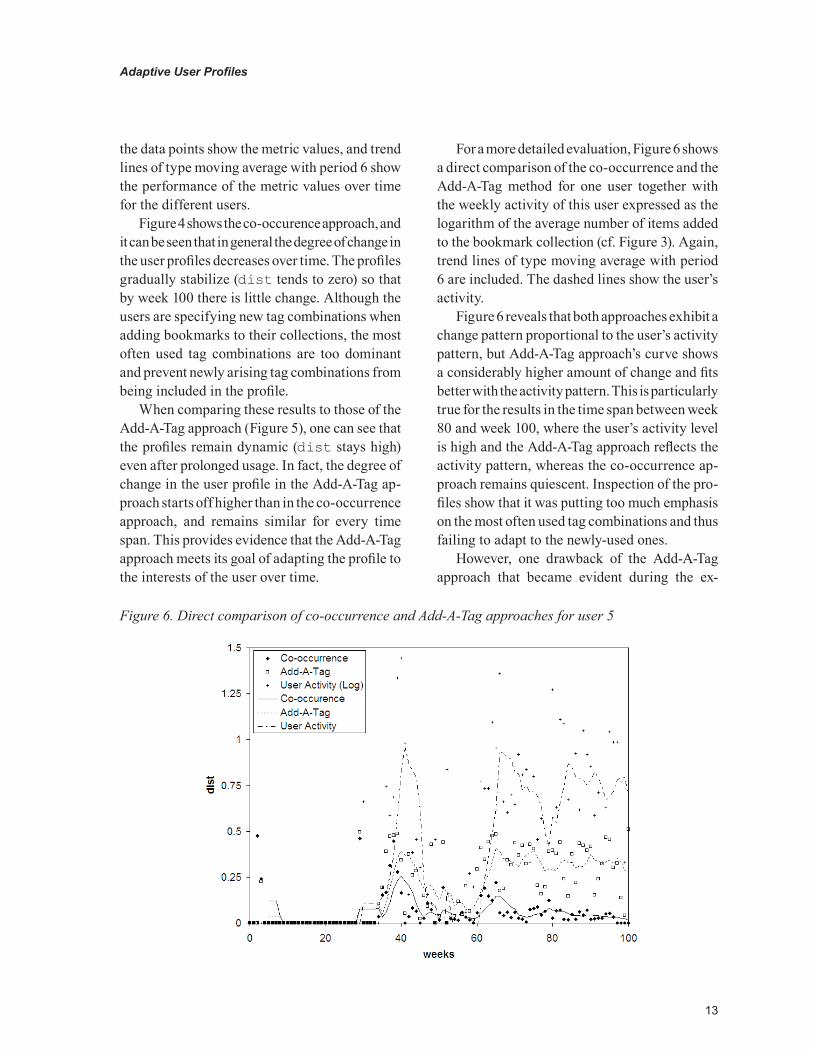
For a more detailed evaluation, Figure 6 shows a direct comparison of the co-occurrence and the Add-A-Tag method for one user together with the weekly activity of this user expressed as the logarithm of the average number of items added to the bookmark collection (cf. Figure 3). Again, trend lines of type moving average with period 6 are included. The dashed lines show the user’s activity.
Figure 6 reveals that both approaches exhibit a change pattern proportional to the user’s activity pattern, but Add-A-Tag approach’s curve shows a considerably higher amount of change and fits better with the activity pattern. This is particularly true for the results in the time span between week 80 and week 100, where the user’s activity level is high and the Add-A-Tag approach reflects the activity pattern, whereas the co-occurrence ap-proach remains quiescent. Inspection of the pro-files show that it was putting too much emphasis on the most often used tag combinations and thus failing to adapt to the newly-used ones.
However, one drawback of the Add-A-Tag approach that became evident during the ex-
Figure 6. Direct comparison of co-occurrence and Add-A-Tag approaches for user 5

��
Adaptive User Profiles
periments is that the value for the evaporation coefficient (parameter ρ) needs to be chosen very carefully. The higher the value for this parameter, the more emphasis is put on those items that were added to the bookmark collection recently. Choosing a value in the range between 0.01 and 0.05 gives reasonable results where the propor-tion between newly used tag combinations and often-used tag combinations is balanced. Setting the value higher than 0.05 places the emphasis on newly-used tag combinations.
From the results presented so far, it would appear that Add-A-Tag is a plausible method for generating an adaptive user profile. In the next section we show how we can effectively visualize such profiles.
ProFILE VIsuALIZAtIon
Kay (2006) argues that profiles should be scru-table, that is, amenable to examination by the user: understandable, controllable and privacy preserv-ing. The first step in making profiles scrutable is to allow the user to visualize them, and to present them in an understandable way.
There is much interest in representing tag clouds in a more intuitive manner (Hassan-Mon-tero & Herrero-Solana, 2006), but here we need a different visualization to show the network structure of the profile and its evolution over time. One approach is to show nodes as dots labeled with their corresponding tags, connected by edges which represent tag co-occurrence. The edge weight can be indicated by length; the higher the weight, the shorter the length of the edge. There are two basic approaches possible for visualizing dynamic graphs. In the first approach, all nodes and edges that will be included in the profile at a certain point in time need to be known in ad-vance. In the next step, a graph layout algorithm can be applied for calculating the positions of all the nodes and edges. Another approach is to use an iteration-based graph visualization algorithm
that incrementally optimizes the layout of the different graph states.
The first approach allows us to choose a good representation for a certain point in time (e.g., the most recent profile). During the animation those nodes that are currently included in the profile are set to visible while all the others are set to invisible. The benefit of this approach is that the nodes do not move, they simply appear or disappear as user activity changes over time. However, the drawback is that while the layout algorithm creates a visually pleasing layout for the complete graph, the layouts of the different graph states shown over time are not optimized and tend to look quite ugly (Michlmayr et al, 2007). Nevertheless, this is an approach worth consider-ing if the dynamic aspects are less important than ensuring that the most up to date profile has an intuitive visualization.
The second approach allows a simpler and more intuitive dynamic visualization, which makes it easier to track the profile evolution over time. In (Michlmayr et al, 2007) this approach is used to show nodes “bubbling up”. Tags enter the screen from the bottom and continuously move towards the top. If a tag is included in the user profile at one point of time, but not included in the next state, it vanishes from the screen.
Using this approach, the nodes are shown as dots and labeled with their corresponding tags. They enter the screen from the bottom on a ran-domly chosen horizontal position, and bubble up. For the naïve approach, nothing more is needed, but for co-occurrence based approaches, it is also necessary to visualize the edges between the nodes. One approach is a spring embedder layout algorithm (Fruchterman & Reingold, 1991), in which the nodes repel or attract each other depending on the edges between them and on the weight of these edges. The lengths of the edges between the nodes thus correspond to the edge’s weights; the higher the weight, the shorter the length of the edge. A minimum and a maxi-mum length for the edges should be defined in

��
Adaptive User Profiles
order to prevent node labels being printed on top of each other, and to avoid nodes being too far away from each other.
The “bubbling up” metaphor and spring em-bedding work together. If a tag A that newly ap-pears at the bottom of the screen has a connection to a tag B that is already shown on the screen, the spring embedder algorithm will cause tag B to move down on the screen and tag A to move up at the same time. Tag A and tag B will move towards each other until the edge between them has a length according to its weight.
A screen shot of Michlmayr’s visualization tool is shown in Figure 7. The screen is divided into a main part and a control panel at the bottom of the screen. The control panel contains radio buttons which allow the user to select one of the profile creation methods and a button to start or pause the
visualization. After starting a visualization, the user profile is presented as an animation over time. The bottom panel shows a date and the main part of the screen shows the state of the user profile at this date. A button allows the user to pause and resume the animation. The tool was implemented as a Java applet, and the graph visualization is based on the JUNG framework5
The vertical positions of the profile’s com-ponents divide themselves into active and not active as well as into long-term, mid-term, and short-term interests of a user. The subgraphs at the centre of the screen, for example research and travel in Figure 7, are those that change over time, because as new nodes connect to the sub graph, this older tags are pulled down again. They refer to long- and midterm interests of a user that are currently active. By contrast, those subgraphs
Figure 7. Visualization of a user profile. The user (name obscured here) can select a profile creation method using one of the radio buttons (here labeled Method A/B/C). The animation can be started or paused using the large button at the bottom right.
��
Adaptive User Profiles
that do not change but are still included in the profile move to the top of the screen, such as ants-conferences, refer to long-term interests of a user that are currently not active. The third category comprises tags that move in from the bottom and vanish shortly after, such as uk-cornwall, which refer to the short-term interests of a user.
In (Michlmayr et al, 2007) a small user study was conducted in order to get feedback about user’s acceptance of profile creation and visual-ization methods. Six users were provided with the visualization tool just described, and verbally interviewed using a questionnaire. The names of the three profile creation methods were not mentioned in order not to influence the results of the user study. In general, the system provoked a positive response similar to the one described by (Golder & Huberman, 2006) in their study of visualizing users’ email archives. A subsequent comment we have received about this tool (pers. comm.) is that “It’s like looking at your mind”. Both being able to view the relationships between the tags and the trends over time were recognized and appreciated. However, the users’ preferences for the different methods turned out to be quite diverse. Two users ranked the co-occurrence ap-proach first, whereas two of them preferred the Add-A-Tag approach, one of them ranked both of them equally, and one favored the naive approach. This may have been down to the visualization algorithm rather than the profile creation method: “there was too much movement and too many changes on the screen, and the edges between them were detracting from the tags”. The authors conclude that the preferred method of user profile creation is a very individual choice.
Therefore we conclude that the user should be able to choose and configure his or her profile creation algorithm and visualization method. The popularity of the co-occurrence method shows that users value the long-term tag relationships in their profile; however they also appreciated that Add-A-Tag adapts better to recent changes. Allowing users to select the balance of long-term
and short-term interests would provide control without over-burdening the user.
APPLIcAtIon oF usEr ProFILEs
In the previous section we have described methods for building and visualizing a rich and dynamic user profile. To what use can we put it?
If the person knows what he or she is look-ing for, e.g., when performing a targeted search, knowing the user’s additional interests outside the immediate search context could be used to predict the user’s intention for ambiguous que-ries. Certainly this mode of personalized search seems to be of increasing importance to the major vendors, like Google6. Knowing the user’s interests becomes more important if the person does not know what he or she is looking for, e.g., when browsing the Web for no specific purpose. Perhaps the most obvious approach is to use the profile for accessing web resources in the same manner as tag clouds. Extipicious7 is a prototype interface that uses a delicious.com tag cloud to access both bookmarks and photographs.
Other web browsing tasks are enabled by this approach. Sugiyama et al (2004) describe how user profiles can be used to modify query results. An alternative would be to use the profile directly, showing it in the browser’s sidebar or as part of the Web page: similar to a navigation menu. When a tag occurs in the Web page at which the user is currently looking, the tag could be highlighted in the profile, and clicking on the tag could result in scrolling automatically to the position on the page at which the tag occurs. Another possibility is to highlight the terms in the Web page that are matched by tags in the profile, in the same manner as search strings are highlighted when viewing the Google cache of a search result. To improve the recall, stemming (Porter, 1980) could be used in combination with string matching.
User profiles can also be applied to social net-works, which represent a community of people and
��
Adaptive User Profiles
their connections. Using such networks to find an expert, or a colleague, or a community of interest, is a well known problem (Adamic & Adar 2005, Leskovec et al. 2007). User profiles allow such searches to be personalized and hence provide context dependent help, even when the searcher is not part of the network themselves.
In this section we will choose one example to study in more depth: the use of such profiles for personalized access to enterprise information systems. We use the HP Technical Reports8 as an example for such a data source (Michlmayr & Cayzer, 2007). The social network me@hp (de-scribed earlier) is also integrated with the system and made searchable via the user profile.
This example simplifies matters because us-ers are typically not interested in their dynamic, historic profile for information access: rather they need the most up to date ‘snapshot’. Indeed, visualizing the relationships between the tags and the time-based aspects at the same time might be counterproductive, cognitively overloading users. So here we focus on visualizing the relationships between the tags in the profile at a fixed point in time.
Enterprise data sources are often annotated with metadata, such as title, author(s), date of publication, number of pages, abstract, and key-words. So the user profile can be matched, not only to the content of the data source, but also to its metadata. Technical or structural metadata, such as number of pages, resolution of a photograph, or date of publication, are generally not helpful for matching, but can be exploited for additional navigational options in the interface. Descriptive metadata on the other hand, including keywords, tags, subject indicators and geographical infor-mation, can be profitably used to match content against a user profile. Full text or abbreviated (e.g. title, abstract) content can also be used, although such approaches tend to carry computational expense (Byde et al, 2007).
In our example the user profile tags are simply compared to technical report keywords. Since tags
are most commonly in lower-case letters, whereas keywords are usually in capitalized letters, the matching was performed in a case-insensitive way. Simple stemming (Porter, 1980) was also used. In general, this resulted in a partial overlap between the user’s profile and the technical report content. Coverage can be extended consider-ably by using related keywords and authors as explained below.
The user interface layout is shown and an-notated in Figure 8. The top left shows a repre-sentation of the profile. The user can select a tag from the profile to show only those resources in the main screen on the right that match with the selected tag. However, the data source will also contain content for which no corresponding tags are included in the profile. Such content would be therefore inaccessible using only the profile for navigation. This could be avoided by offering additional navigation options to the user, such as a simple query interface. Alternatively, provid-ing additional context enables better coverage of the data source. Figure 8 illustrates that using 2 navigation panels. The first shows a list of related keywords, each of which co-occurs with the se-lected keyword. Co-occurrence in this case means that the keywords in question are both attached to a single technical report. These related keywords are likely to cover between them many techni-cal reports, including those which do not have any keyword matching a user’s tags. The second navigation panel is similar, but this time shows all authors that have used the selected keyword to mark up one or more of their technical reports. Again, the union of all technical reports authored by one of these people is likely to include those that would not be covered by the profile alone.
The user profile can also be used to link enter-prise information systems together; to integrate data relevant to a particular user from a number of sources. Figure 8 shows a [community] section in which the ‘self-tagging’ system [email protected] (described earlier) is used to recommend people, not necessarily technical report authors, who have

��
Adaptive User Profiles
‘self tagged’ with the selected term. This provides a collaborative aspect to the search; linking the user to a context sensitive community of interest. Since [email protected] is an internal system, this sec-tion has been left unpopulated in the screenshots for reasons of privacy.
The question of profile representation can be addressed from two viewpoints. One of them is the profile-centric viewpoint which focuses on visualizing the structure of the profile. For visualizing the relationships between the tags in the profile, a spring embedder layout algorithm is used to position related tags next to each other. The font size of each tag reflects the relative im-portance, i.e. number of uses of that tag, just as in a tag cloud. As explained above, the dynamic
aspects are not exploited in this interface. In fact, after some initial user feedback, the co-occur-rence links have also been removed as they lead to some confusion.
It is also necessary to take a data-centric viewpoint by adapting the profile to the data that is available. The profile may contain tags for which there is no corresponding content, and such tags should be removed from the profile. For the remaining tags, an optional possibility would be to print the number of resources that exist next to the tag name, as in faceted browsing. The problem with this option is that combining font sizes (for relative importance of tags) and numbers (for number of resources) can be mis-leading to users.
Figure 8. Interface layout. The top left shows the profile. The main screen (right) shows the resources that match with the tag from the profile selected by the user. The bottom left allows the user to navigate via related authors and keywords, and shows a community of interest related to the current search (sec-tion not populated for reasons of privacy)
��
Adaptive User Profiles
It should be clear that Figure 8 does not present the last word in profile visualization. There are many open issues and areas of research includ-ing: alternatives to graph based visualization (e.g., hierarchies); representation of dynamic aspects; scrutability and control; adaptation to content. These themes will be discussed in the next section.
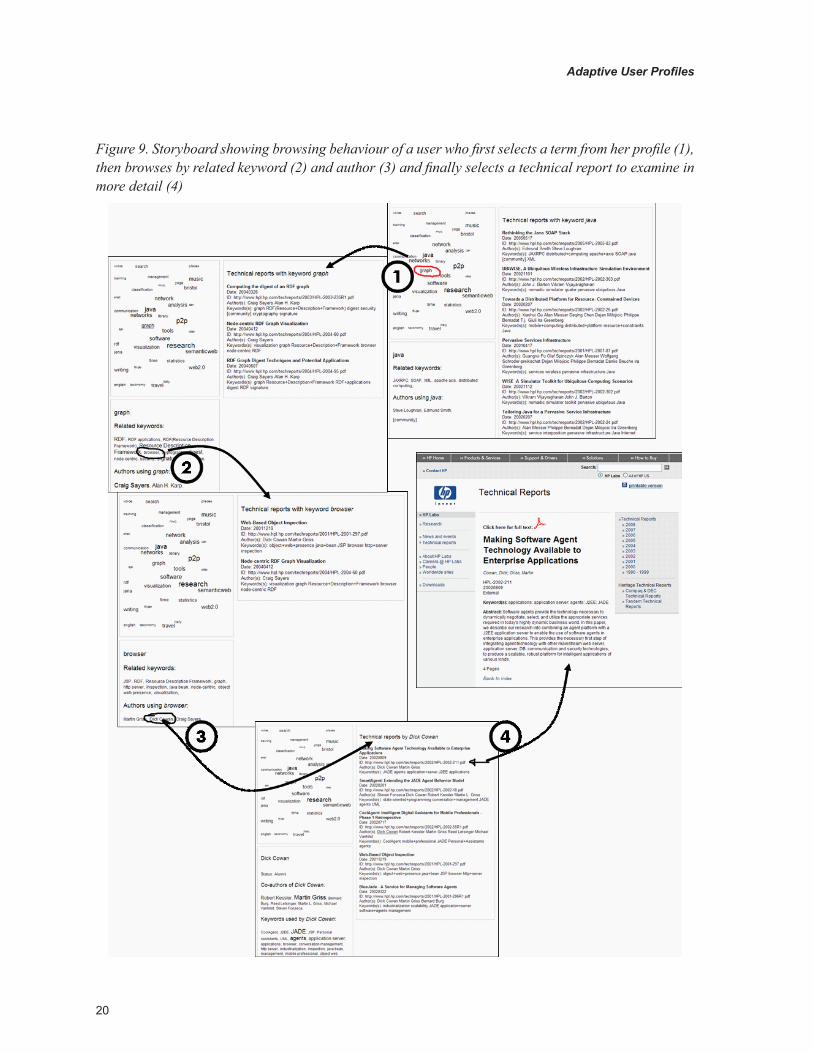
Figure 9 shows an ‘storyboard’ illustrating how a user might navigate through the system. This user is interested in techniques for enterprise information management. Firstly, they click on the tag ‘graph’ from their user profile because graph based user profiles is their current research interest. A list of relevant technical reports is displayed, and one of the keywords (not contained in the user’s profile) is ‘browser’. Clicking on this yields a second set of technical reports. The researcher knows Dick Cowan, so browses to see what else this author has published. Finding a technical report on agent technology, our user clicks on the link to get access to this research. This illustrative story shows how the system integrates personal and collaborative aspects in order to provide a richer and more context sensi-tive search experience.
FuturE trEnds
As collaborative knowledge management systems grow, we expect that personalized access will become increasingly important. Users need to be able to view a large and complex information space in a way that makes sense to them. We have outlined such an approach here. However it is likely that improvements will be needed in profile representation, editing and in interface design. We have already talked about gathering user profile information from a range of systems, such as email, browsing, file activity, newsgroups and so on. There is clearly a research challenge in merging the information from these different sources. The data needed to populate the profile
will need to be gathered implicitly, as a side ef-fect of work the user is already doing. However it is essential that the user has some ownership of the profile, and is able to inspect, change, correct and tweak the profile to better match his or her needs (Ahn et al, 2007): the twin requirements of scrutability and privacy must be met.
We also foresee improvements in profile inter-face design. Graph based profiles are not always intuitive, and users may need an alternative. A hierarchy, for example, would have advantages of simplicity and familiarity. Multiple inheritance issues, such as a tag having two parents, do not preclude such a representation; as such a tag would simply appear at two places in the hierarchy. We tested this possibility using an approach loosely similar to the one of Heymann and Garcia-Molina (2006), who used centrality measures to derive a taxonomy from tagging data based on the en-tirety of a collaborative tagging system’s data. Two steps were executed for every subgraph. First, the node with the highest betweenness centrality was determined as the root node of the tree. Second, Prim’s algorithm (Prim, 1957) was used for computing the maximum spanning tree based on the weights. However, this approach is not well suited for profile representation of the type we are interested in. One problem is that the resulting tree can be quite unbalanced, which gives an unsatisfying browsing experience. In addition, nodes that frequently co-occur often belong conceptually together and should exist at the same hierarchy level. For one user the tags “semantic” and “web” were used to represent a composite tag ‘semantic web’. The spanning tree approach forces these tags to exist at different levels which was confusing for this user.
But the spectrum of layout algorithms is far from exhausted; given the utility of such profiles to the user it seems this would be a promising direction for future work. The current trend is tag based clustering. Chapter “Analyzing Communal Tag Relationships for Enhanced Navigation and User Modeling” examines this topic in more detail.
�0
Adaptive User Profiles
Figure 9. Storyboard showing browsing behaviour of a user who first selects a term from her profile (1), then browses by related keyword (2) and author (3) and finally selects a technical report to examine in more detail (4)

��
Adaptive User Profiles
We also draw the reader’s attention to the work of Begelman et al (2006), and to the more recent promising approach of Kim & Chan (2008), who split a co-occurrence graph into clusters, and ar-range the clusters hierarchically.
The matching of profiles to information sources has to date been achieved using simple mechanisms, such as string matching in combi-nation with stemming and case conversion. This could be enhanced by backing the comparison algorithm with a thesaurus such as WordNet, which would link tags with synonym keywords. Tools like ZigTag9 and EntityDescriber10 are pro-viding facilities to link tags with such structured knowledge bases. Another possibility would be to use a data-centric approach, such as cluster-ing, to find implicit relationships between tags or technical report keywords. Although we have already shown clusters of user interest in generated profiles, such clusters are subjective. It would be possible to apply any formal clustering algorithm that can be applied to weighted graphs (Brandes et al, 2003; Begelman et al, 2006). Again, this mechanism would allow a tag to be matched to a larger number of possible keywords.
The time varying nature of a profile is also important. Evaporation, as described here, pro-vides a simple and effective way of applying such changes. Alternative approaches can be found in the literature, for example imposing a maximum/minimum weight (Stützle & Hoos, 2000). In any case, the user needs to be kept informed, and we have shown in this chapter how one can visualize these profile changes over time. Incorporating these changes into an effec-tive interface over knowledge sources remains a research challenge.
Finally, there needs to be a balance between personal, idiosyncratic profiles and those repre-senting shared topics in a community of interest. Too far to one extreme, and we lose the possibility of collaboration: too far to the other, and we have removed the advantages of personalization.
concLusIon
In this chapter we have described techniques for building a profile from a user’s browsing behav-iour. It does not seem adequate to take account of tag frequency alone as co-occurrence information is needed to make the profiles make sense to the user. User profiles demonstrably adapt over time and it is possible to derive appropriate metrics to measure this change. Mechanisms like evapora-tion can be used to deal with transient and changing interests. Visualization of the generated profiles is not straightforward but seems genuinely useful.
Profiles can also be used to access other infor-mation sources in a way that makes sense to the user. We have shown an example where tag profile information guides access to both documents (HP Labs technical reports) and communities ([email protected]). However the principles are much more generic and can be applied to collaborative knowledge management systems in general. Much work remains to be done – in profile gathering, data integration, visualization, privacy control and interface design.
AcKnoWLEdGMEnt
We would like to thank Mark Butler and Edwin Simpson for discussion and feedback on this chapter.
rEFErEncEs
Abdi, H. (2007). Kendall rank correlation. In N. Salkind (Ed.), Encyclopedia of Measurement and Statistics (pp 508-510). Thousand Oaks, CA: Sage
Adamic, L., & Adar, E. (2005). How to Search a Social Network. Social Networks, 27(3), 187-203

��
Adaptive User Profiles
Ahn J., Brusilovsky, P., Grady, J., He, D., & Syn, S. Y. (2007). Open User Profiles for Adaptive News Systems: Help or Harm? In Proceedings of the 16th International World Wide Web Con-ference (WWW2007), Banff, Alberta, Canada, May 2007.
Begelman, G., Keller, P. & Smadja, F. (2006). Automated Tag Clustering: Improving Search and Exploration in the Tag Space. World Wide Web Conference 2006, Edinburgh, UK. Retrieved 23 February 2008, from http://www.pui.ch/phred/automated_tag_clustering/
Brandes, U., Gaertler, M., & Wagner, D. (2003). Experiments on graph clustering algorithms. Lecture Notes in Computer Science, Di Battista and U. Zwick (Eds.) 2832, 568-579. Retrieved 23 February 2008, from http://citeseer.ist.psu.edu/brandes03experiments.html
Buckley, F., & Harary, F. (1990) Distance in graphs. Reading, MA: Addison-Wesley.
Byde, A., Wan, H., & Cayzer, S. (2007). Person-alized Tag Recommendations via Social Net-work and Content-based Similarity Metrics. In Proceedings of the International Conference on Weblogs and Social Media (ICWSM’07). Boulder, Colorado.
Chen, H., & Lynch, K. J. (1992). Automatic Con-struction of Networks of Concepts Characterizing Document Databases. IEEE Transactions on Systems, Man and Cybernetics, 22(5):885-902.
Dorigo, M., & Caro, G. D. (1999). The Ant Colony Optimization Meta-Heuristic. New Ideas in Op-timization, (pp 11-32), McGraw-Hill.
Gauch, S., Speretta, M., Chandamouli, A., & Mi-carelli, A. (2007). User Profiles for Personalized Information Access. In Brusilovsky, P., Kobsa, A., and Nejdl, W. (Eds.), The Adaptive Web, (pp. 54-89), Springer LCNS 4321.
Goecks, J. and Shavlik, J. (2000). Learning users’ interests by unobtrusively observing their normal
behavior. In Proceedings of the 5th international Conference on Intelligent User interfaces (New Orleans, Louisiana, United States, January 09 - 12, 2000). IUI ‘00. ACM, New York, NY, 129-132.
Godoy, D., & Amandi, A. (2005). User Profiling for Web Page Filtering. IEEE Internet Comput-ing 9 (4) 56-64.
Golder, S., & Huberman, B. A. (2006). Usage patterns of Collaborative Tagging Systems, Journal of Information Science, 32(2), 198-208. Retrieved 25 January 2007, from http://www.hpl.hp.com/research/idl/papers/tags/tags.pdf
Hassan-Montero, Y. & Herrero-Solana, V. (2006). Improving Tag-Clouds as Visual Information Retrieval Interfaces. International Conference on Multidisciplinary Information Sciences and Technologies, Merida, Spain. Retrieved 15 Feb-ruary 2008, from http://www.nosolousabilidad.com/hassan/improving_tagclouds.pdf
Karat, C. M., Brodie, C., Karat, J., Vergo, J., & Alpert, S. R. (2003). Personalizing the user experi-ence on ibm.com. IBM Systems Journal, 42(4).
Kay, J. (2006). Scrutable Adaptation: Because We Can and Must. AH 2006: 11-19.
Kim, H., & Chan, P. K. (2008). Learning implicit user interest hierarchy for context in personal-ization. Applied Intelligence, 28, 2(Apr. 2008), 153-166.
Leskovec, J., Krause, A., Guestrin, C., Faloutsos, C., VanBriesen, J., & Glance, N. (2007). Cost-effective Outbreak Detection in Networks. In: Proceedings of the 13th ACM SIGKDD Interna-tional Conference on Knowledge Discovery and Data Mining, (pp. 420-429), San Jose, California, USA.
Michlmayr, E., & Cayzer, S. (2007). Learning User Profiles from Tagging Data and Leveraging them for Personal(ized) Information Access. In: Proceedings of the Workshop on Tagging and Metadata for Social Information Organization,

��
Adaptive User Profiles
16th International World Wide Web Conference (WWW2007), Banff, Alberta, Canada.
Michlmayr, E., Cayzer, S., & Shabajee, P. (2007). Adaptive User Profiles for Enterprise Information Access, HP Labs Technical Report HPL-2007-7. Retrieved 24 January 2008, from http://www.hpl.hp.com/techreports/2007/HPL-2007-72.pdf
Middleton, S. E., De Roure, D. C., & Shadbolt, N. R. (2001). Capturing knowledge of user pref-erences: ontologies in recommender systems. In Proceedings of the 1st international Conference on Knowledge Capture (Victoria, British Colum-bia, Canada, October 22 - 23, 2001). K-CAP ‘01. ACM, New York, NY, 100-107. DOI= http://doi.acm.org/10.1145/500737.500755
Mika, P. (2005). Ontologies are us: A unified model of social networks and semantics. Y. Gil, E. Motta, R. V. Benjamins & M. Musen (Eds.), Proceedings of the Fourth International Semantic Web Conference, Heidelberg, Germany: Springer. Retrieved 25 January 2008, from http://www.cs.vu.nl/~pmika/research/papers/ISWC-folk-sonomy.pdf
Nanas, N., Uren, V., & de Roeck, A. (2004). Exploiting Term Dependencies for Multi-Topic Information Filtering with a Single User Profile. Lecture Notes in Computer Science, 3025: 400-409
Pazzani, M., & Billsus, D. (1997). Learning and Revising User Profiles: The identification of interesting web sites, Machine Learning, 27, 313-331.
Porter, M. F. (1980). An algorithm for suffix strip-ping, Program, 14(3) pp 130−137.
Prim, R. C. (1957). Shortest connection networks and some generalizations. Bell System Technical Journal, 36.
Stützle, T., & Hoos, H. (2000) MAX-MIN Ant System. Journal of Future Generation Computer Systems, 16, 889 – 914.
Sugiyama, K., Hatano, K., and Yoshikawa, M. (2004). Adaptive web search based on user pro-file constructed without any effort from users. In Proceedings of the 13th International Conference on World Wide Web (New York, NY, USA, May 17 - 20, 2004). WWW ‘04. ACM, New York, NY, 675-684.
Wasserman, S., & Faust, K. (1994). Social Network Analysis. Cambridge, UK: Cambridge University Press.
Xu, Z., Mao, F. J., & Su, D. (2006). Towards the Semantic Web: Collaboration Tag Suggestions. In Proceedings of the Collaborative Web Tag-ging Workshop, World Wide Web Conference (WWW 2006).
EndnotEs
1 http://office.microsoft.com/en-us/share-pointserver/
2 RSS stands for ‘really simple syndica-tion’ (RSS2.0: http://cyber.law.harvard.edu/rss/rss.html) or ‘RDF site summary’ (RSS1.0: http://web.resource.org/rss/1.0/). It is a machine readable syndication format for websites, blogs, newsfeeds and so on. Atom (http://tools.ietf.org/html/rfc4287) is a similar but newer standard.
3 http://www.techcrunch.com/2006/09/25/de-licious-reports-1-million-users-post-yahoo-growth-tops-all-of-digg/
4 http://www.techcrunch.com/2007/09/06/ex-clusive-screen-shots-and-feature-overview-of-delicious-20-preview/
5 http://jung.sourceforge.net 6 http://www.google.com/preferences 7 http://kevan.org/extispicious.cgi 8 http://www.hpl.hp.com/techreports 9 http://www.zigtag.com/10 http://www.entitydescriber.org/