Embed Size (px)
Citation preview

Addendum No. 7 to Master Field Sampling Plan for Chemical Data Gap Investigation Phase 3 Soil Chemical Sampling at Area IV Santa Susana Field Laboratory Ventura County, California Subarea 8 Prepared for:
Department of Energy Energy Technology and Engineering Center P.O. Box 10300 Canoga Park, California 91309 Prepared by:
CDM Federal Programs Corporation (CDM Smith) 555 17th Street, Suite 1200 Denver, Colorado 80202 Prepared under:
US Department of Energy EM Consolidated Business Center Contract DE-EM0001128 CDM Smith Task Order DE-DT0003515 August 2013 Revision 1


Table of Contents
Introduction ................................................................................................................. 1
Purpose of FSP Addendum ....................................................................................... 2
Sample Analytes ......................................................................................................... 3
Field Locating Soil Sample Locations ..................................................................... 3
Surface Soil Sampling ................................................................................................ 4
Subsurface Soil Sampling ......................................................................................... 4
Test Pit Sampling ........................................................................................................ 4
Sampling of Locations with Sustained Instrument Readings, Odor, or Staining ......................................................................................................................... 5
Decontamination of Sampling Equipment ............................................................ 5
Sample Handling, Recording, and Shipment ....................................................... 5
Instrument Calibration and Maintenance ............................................................. 6
Laboratory Sample Preparation (Homogenization) ............................................. 6
Schedule ........................................................................................................................ 6
References .................................................................................................................... 6
Figure 1 – Area IV and Northern Buffer Zone Subarea Designation Attachment 1 – Subarea 8 Phase 3 Data Gap Analysis Technical Memorandum, Santa Susana Field Laboratory, Ventura County, California (MWH Americas, Inc.)
Tables within Attachment 1 Relevant to the Field Sampling Plan Addendum Table 1 – Subarea 8 Phase 3 Proposed Soil Sample Locations
Figures within Attachment 1 Relevant to the Field Sampling Plan Addendum
Figure 1 – Subarea 8 Proposed Soil Matrix Sampling Locations
Attachment 2 – Table F Field Tracker, Subarea 8
i Addendum No. 7 to Phase 3 Master WP and FSP for Subarea 8

ii Addendum No. 7 to Phase 3 Master WP and FSP for Subarea 8
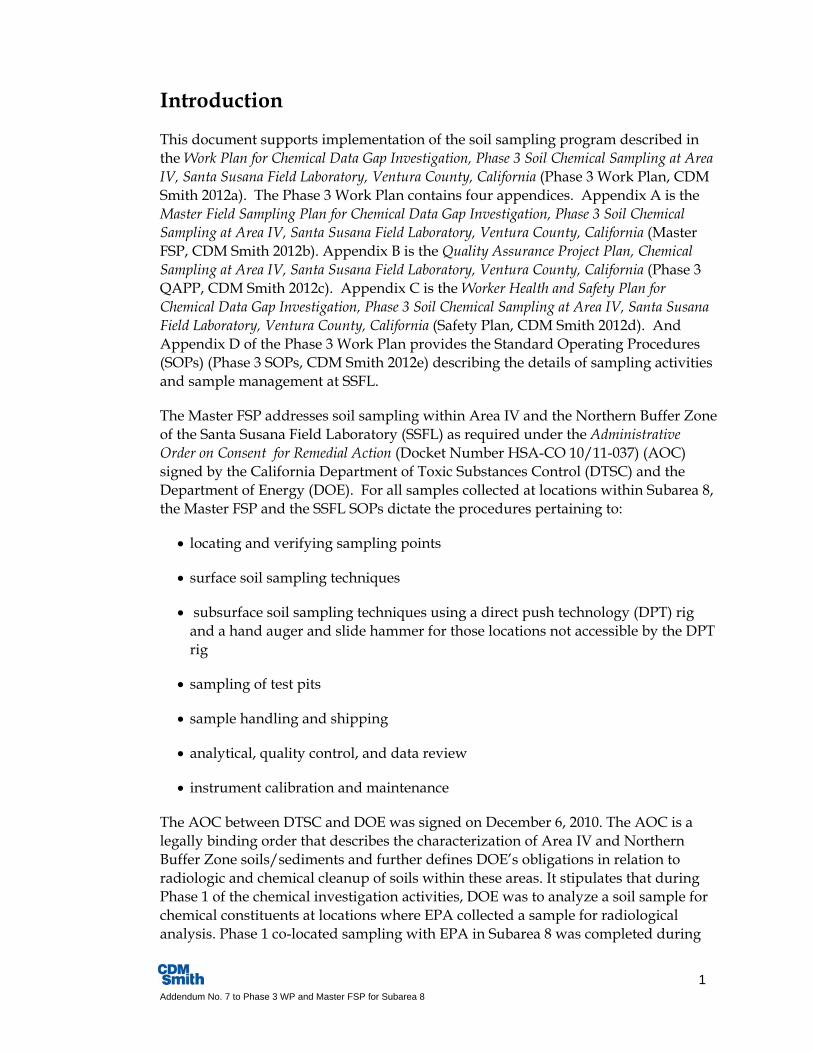
Introduction
This document supports implementation of the soil sampling program described in the Work Plan for Chemical Data Gap Investigation, Phase 3 Soil Chemical Sampling at Area IV, Santa Susana Field Laboratory, Ventura County, California (Phase 3 Work Plan, CDM Smith 2012a). The Phase 3 Work Plan contains four appendices. Appendix A is the Master Field Sampling Plan for Chemical Data Gap Investigation, Phase 3 Soil Chemical Sampling at Area IV, Santa Susana Field Laboratory, Ventura County, California (Master FSP, CDM Smith 2012b). Appendix B is the Quality Assurance Project Plan, Chemical Sampling at Area IV, Santa Susana Field Laboratory, Ventura County, California (Phase 3 QAPP, CDM Smith 2012c). Appendix C is the Worker Health and Safety Plan for Chemical Data Gap Investigation, Phase 3 Soil Chemical Sampling at Area IV, Santa Susana Field Laboratory, Ventura County, California (Safety Plan, CDM Smith 2012d). And Appendix D of the Phase 3 Work Plan provides the Standard Operating Procedures (SOPs) (Phase 3 SOPs, CDM Smith 2012e) describing the details of sampling activities and sample management at SSFL.
The Master FSP addresses soil sampling within Area IV and the Northern Buffer Zone of the Santa Susana Field Laboratory (SSFL) as required under the Administrative Order on Consent for Remedial Action (Docket Number HSA-CO 10/11-037) (AOC) signed by the California Department of Toxic Substances Control (DTSC) and the Department of Energy (DOE). For all samples collected at locations within Subarea 8, the Master FSP and the SSFL SOPs dictate the procedures pertaining to:
• locating and verifying sampling points
• surface soil sampling techniques
• subsurface soil sampling techniques using a direct push technology (DPT) rig and a hand auger and slide hammer for those locations not accessible by the DPT rig
• sampling of test pits
• sample handling and shipping
• analytical, quality control, and data review
• instrument calibration and maintenance
The AOC between DTSC and DOE was signed on December 6, 2010. The AOC is a legally binding order that describes the characterization of Area IV and Northern Buffer Zone soils/sediments and further defines DOE’s obligations in relation to radiologic and chemical cleanup of soils within these areas. It stipulates that during Phase 1 of the chemical investigation activities, DOE was to analyze a soil sample for chemical constituents at locations where EPA collected a sample for radiological analysis. Phase 1 co-located sampling with EPA in Subarea 8 was completed during
1 Addendum No. 7 to Phase 3 WP and Master FSP for Subarea 8
2 Addendum No. 7 to Phase 3 WP and Master FSP for Subarea 8
two EPA sampling periods. Soil and sediment samples were collected with EPA within Subarea 8 North during April, May, and June, 2011. Soil and sediment samples were collected within Subarea 8 South September to early December, 2011. Phase 2 (random co-located sampling with EPA in the Northern Buffer Zone) was conducted in March and April 2011.
Phase 3 of the AOC is the data gap analysis, which includes an assessment of data adequacy using the data collected under the Resource Conservation and Recovery Act (RCRA) Facility Investigation (RFI) program, the results of co-located soil samples collected during Phase 1 of the AOC, and multiple lines of evidence as described in the Phase 3 Work Plan (CDM 2012a). The purpose of the data gap analysis is to identify additional soil chemical data needed to support the Soil Remedial Action Implementation Plan for Area IV. The sampling that will be performed under this FSP Addendum is based on the results of the data gap analysis.
The Phase 3 sampling within Subarea 8 is governed by the Phase 3 Work Plan and its elements including the Master FSP, the QAPP, Safety Plan, and the Phase 3 SSFL SOPs. These documents are incorporated into this FSP Addendum by reference.
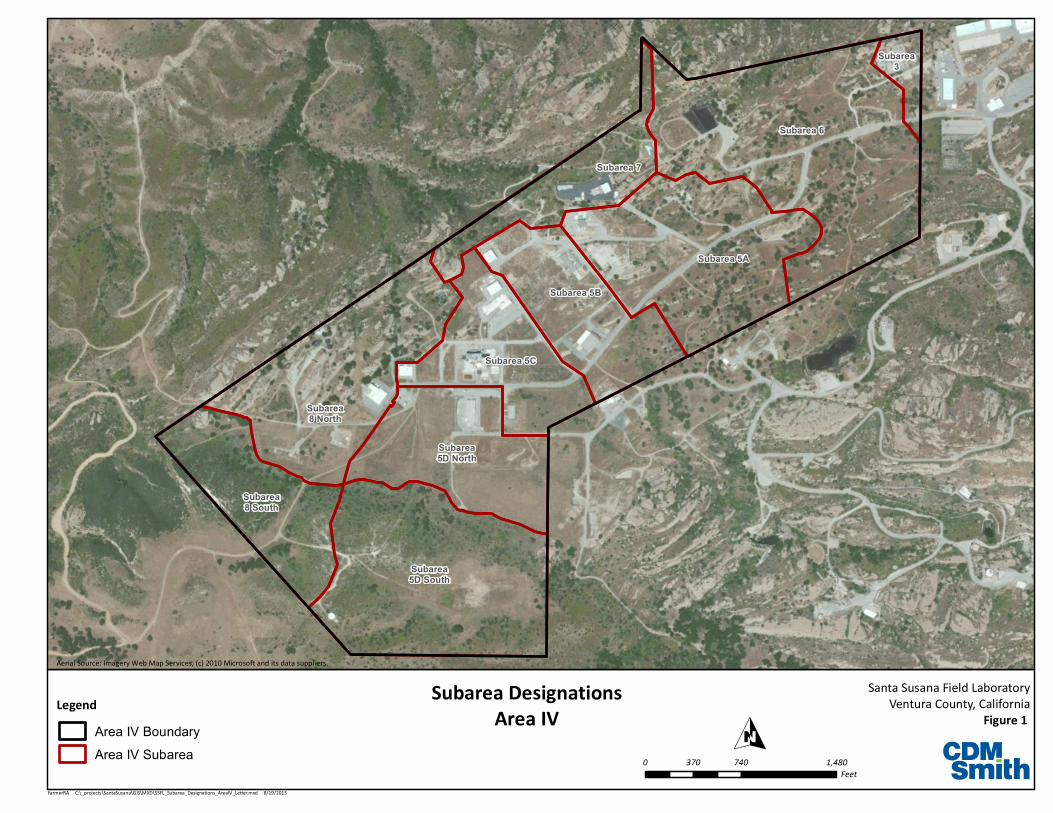
Purpose of FSP Addendum This FSP Addendum addresses Phase 3 sampling in Subarea 8. Figure 1 of this document illustrates the location of Subarea 8 within Area IV of SSFL. The rationale for sample location and chemical analytes is provided in the document Subarea 8 Phase 3 Data Gap Analysis Technical Memorandum, Santa Susana Field Laboratory, Ventura County, California (MWH 20131) (Subarea 8 Data Gap TM). The Subarea 8 Data Gap TM is included as Attachment 1 to this FSP Addendum. It illustrates the proposed sample locations and includes Table 1, which provides the sampling rationale for each location. Figures 1 and 2 of the Subarea 8 Data Gap TM (MWH 2013) provide the proposed soil sample locations in Subarea 8. Soil sample locations were identified during data gap analysis as well as from public comments received during the recent Subarea 8 Data Gap Investigation public meeting. Attachment 2 (Table F Subarea 8 Field Tracker) to this Subarea 8 FSP Addendum provides additional information beyond the rationale in Table 1 of the Subarea 8 Data Gap TM for sample locations that target specific field conditions. These include natural drainage pathways, edge of fill material, addressing subsurface anomalies (potential buried materials), and potential releases from lined man-made drainages. Information on specific field conditions and sample locations will be necessary as part of sample point staking and soil collection.
For Subarea 8, surface and subsurface soil samples will be collected. For surface soil samples, only the top 6-inches of soil (surface soil) will be collected. The majority of sample locations will involve collection of subsurface samples. A direct push
1 MWH prepared this Technical Memorandum under contract with The Boeing Company, which is under direct contract with DOE. Through this contractual relationship and under the regulatory oversight of DTSC, MWH has represented DOE in conducting the Chemical Data Gap Analysis and in the preparation of this Technical Memorandum.
technology (DPT) rig will be used to sample subsurface soil at all locations except those inaccessible due to terrain constraints. Borings located in areas inaccessible to the DPT rig will be sampled using a hand auger and slide hammer as described in Phase 3 SSFL SOP 3. All borings will be drilled to the target depth specified in Table 1 of the Subarea 8 Data Gap TM. The cores will be visually inspected and monitored with field instruments for the presence of contamination, including discoloration, debris, and fill. Soil samples will be targeted where contamination is evident.
CDM Smith will be responsible for all aspects of the field sampling program under Phase 3 of the AOC. This includes locating in the field the sample locations selected during the data gap investigation and that were initially generated and displayed electronically using Geographic Information System (GIS) coordinates. The GIS coordinates are downloaded into a Geographic Positioning System (GPS) unit for physically locating the samples in the field. SSFL SOP 1 provides the process for verifying that the sample locations initially identified by GIS review reflect the targeted feature described in Table 1 and are consistent with the GPS coordinates generated in the field. If necessary the sample location will be adjusted in the field so that the targeted feature is sampled. Adjusted and all final sample location coordinates will be provided back to the GIS managers so that the GIS database can be updated.
CDM Smith will be responsible for the physical collection of all samples per the procedures and controls specified in the Master FSP. CDM Smith personnel will be responsible for the sample container preparation, sample handling and documentation, sample shipment, laboratory coordination, chemical analyses of the samples, and chemical data review. Soil samples collected by CDM Smith will be analyzed for chemical analytes identified in Table 1 of the Subarea 8 Data Gap TM (MWH 2013). Analytical methods and quality control criteria to be used are stipulated in Table 8-3 (Quality Control Objectives for Analytical Methods) of the QAPP (CDM Smith 2012c) and Table 6-1 (Analytical Methods, Containers, Preservatives, and Holding Times) of the Master FSP (CDM Smith 2012b).
Table 1 of the Subarea 8 Data Gap TM also identifies proposed target depths for sample collection. Samples will also be collected from depth intervals (until refusal) that exhibit evidence of staining, odor, debris, or photoionization detector (PID) readings above background.
This FSP Addendum only addresses the collection of surface soil and subsurface soil to the bedrock interface using hand augers and the DPT rig. The digging of trenches or test pits, soil sampling of open excavations, and sampling of soil gas or other media will be addressed in future sampling plans.
Sample Analytes Table 1 of the Subarea 8 Data Gap TM (MWH 2013) provides the chemical analyses (analytes) for each sample proposed for collection under this FSP Addendum and the
3 Addendum No. 7 to Phase 3 WP and Master FSP for Subarea 8
respective rationale for sample location and chemical analyses. The chemical analyses by location were identified through the data gap investigation process.
Field Locating Soil Sample Locations CDM Smith will be responsible for determining the precise position of soil sample locations in the field in accordance with SSFL SOP 1. At the same time, each sample location will also be cleared for buried utilities, and assessing the presence of cultural and biological resources for their protection.
Surface Soil Sampling Surface soil samples will be collected at each location as proposed in Table 1. Surface soil samples will be collected in accordance with SSFL SOP 2. A slide hammer with stainless steel sleeve will be used to collect the soil sample to be analyzed for semi-volatile organic compounds and polychlorinated biphenyls. Volatile organic compounds and total petroleum hydrocarbon samples will be collected using Encore samplers. Soil for all other sample analytes will be place in one or more glass jars.
Subsurface Soil Sampling Subsurface soil samples will be collected primarily through the use of a DPT rig. SSFL SOP 4 describes the DPT sampling procedures. Sampling will be conducted through the use of 5-foot long acetate sleeves placed within the DPT sampling tool. All cores will be screened using a PID instrument for volatiles and a Micro R gamma detection instrument and a dual phosphor alpha/beta detection instrument (SSFL SOPs 6 and 7, respectively). Soil samples will be collected at the depths specified in Table 1 of the Subarea 8 Data Gap TM (MWH 2013) and/or at locations where instrument readings, soil staining, or evidence of debris is observed.
To determine depth of contamination at locations where prior data indicates contamination at the surface but depth has not been defined, the core will be divided into one-foot long samples and with the sample depth intervals identified in Table 1 prepared for shipment to the laboratory. Table 1 also identifies the chemical analyses proposed for each depth interval.
There will be proposed sampling locations that the DPT rig will not be able to access. At those locations, subsurface samples will be collected using a hand auger to access the sample depth and a slide hammer sampler with stainless steel sleeves will be used to collect the actual sample. SSFL SOP 3 describes the hand auger sampling procedure.
The soil logging of all surface and subsurface samples will be conducted following SSFL SOP 9.
4 Addendum No. 7 to Phase 3 WP and Master FSP for Subarea 8
Sampling of Locations with Sustained Instrument Readings, Odor, or Staining For any locations where PID instrument readings remain above measured background readings, there is an odor, or the soil appears to be stained with hydrocarbons, samples will be collected at the sample depth interval and analyzed for VOCs, 1,4-dioxane, and total petroleum hydrocarbons-gasoline range organics (TPH-GRO) using Encore samplers, in addition to the target analytes specified in Table 1 of the Subarea 8 Data Gap TM. Any sustained instrument readings above background (PID, Micro R gamma detection, and dual phosphor alpha/beta detection instruments) will be immediately reported to DOE by the CDM Smith Field Team Leader and DOE will contact Boeing with this information in accordance with the Worker Health and Safety Plan requirements. The monitoring instruments will be operated per SSFL SOPs 6 (volatile organics) and 7 (radiation).
Decontamination of Sampling Equipment Equipment that comes in contact with sample material will be decontaminated per SSFL SOP 12. Investigation derived waste will be handled per SSFL SOP 13.
Sample Handling, Recording, and Shipment SSFL SOPs 10 and 11 describe the sample custody, handling, information recording, preservation, and shipping procedures. Any photographic documentation of sampling activities will be performed per SSFL SOP 15.
Instrument Calibration and Maintenance All instruments used to screen samples for volatile organics and radioactivity will be calibrated and maintained per SSFL SOP 16.
Laboratory Sample Preparation (Homogenization) Soil samples intended for chemical analyses of non-volatile and non-semivolatile constituents (e.g. metals, PCBs, and dioxins) will be homogenized by the analytical laboratory in the laboratory in accordance with SSFL SOP 17.
Schedule Soil sampling activities under this FSP Addendum will most likely start the week of June 24, 2013, following DTSC approval of this Subarea 8 FSP Addendum, with the locating and staking of proposed sample locations and utilities clearance. Because sampling will start during migratory bird nesting season, additional biological monitoring will be required. Surface soil sampling will start July 8, and subsurface soil borings (hand-auger and DPT) will start by July 15. It is anticipated that 40 surface samples, 32 shallow hand auger samples, and 32 DPT boring samples will be collected each week.
5 Addendum No. 7 to Phase 3 WP and Master FSP for Subarea 8
6 Addendum No. 7 to Phase 3 WP and Master FSP for Subarea 8
References
CDM Smith. 2012a. Work Plan for Chemical Data Gap Investigation, Phase 3 Soil Chemical Sampling at Area IV, Santa Susana Field Laboratory, Ventura County, California. April.
CDM Smith. 2012b. Master Field Sampling Plan for Chemical Data Gap Investigation, Phase 3 Soil Chemical Sampling at Area IV, Santa Susana Field Laboratory, Ventura County, California. April.
CDM Smith. 2012c. Quality Assurance Project Plan for Chemical Data Gap Investigation,
Phase 3 Soil Chemical Sampling at Area IV, Santa Susana Field Laboratory, Ventura County, California. April.
CDM Smith. 2012d. Worker Health and Safety Plan for Chemical Data Gap Investigation,
Phase 3 Soil Chemical Sampling at Area IV, Santa Susana Field Laboratory, Ventura County, California. April.
CDM Smith. 2012e. Standard Operating Procedures. MWH 2013. Subarea 8 Phase 3 Data Gap Analysis Technical Memorandum Santa Susana
Field Laboratory, Ventura County, California. June.
Subarea8 North
Subarea5D South
Subarea 5A
Subarea 6
Subarea3
Subarea 5C
Subarea 5B
Subarea 7
Subarea8 South
Subarea5D North
FarmerRA C:\_projects\SantaSusana\GIS\MXD\SSFL_Subarea_Designations_AreaIV_Letter.mxd 8/19/2013
0 740 1,480370Feet
Santa Susana Field LaboratoryVentura County, California
Figure 1 Legend
Area IV BoundaryArea IV Subarea
Subarea DesignationsArea IV
O
Aerial Source: Imagery Web Map Services, (c) 2010 Microsoft and its data suppliers.
Attachment 1 Subarea 8 Phase 3 Data Gap Analysis Technical Memorandum, Santa Susana
Field Laboratory, Ventura County, (MWH 2013)
SUBAREA 8 PHASE 3 DATA GAP ANALYSIS
TECHNICAL MEMORANDUM
SANTA SUSANA FIELD LABORATORY
VENTURA COUNTY, CALIFORNIA
Prepared For:
THE UNITED STATES DEPARTMENT OF ENERGY
Prepared By:
MWH Americas, Inc.
618 Michillinda Ave, Suite 200
Arcadia, CA 91007
August 2013
Subarea 8 Phase 3 Data Gap Analysis
Technical Memorandum
Santa Susana Field Laboratory, Ventura County, California August 2013
i
TABLE OF CONTENTS
Section No. Page No.
1.0 INTRODUCTION ............................................................................................................1
2.0 DATA GAP ANALYSIS PROCESS ................................................................................1
2.1 Comparison of Previous Sampling Data to Screening Criteria ...........................................3
2.2 Evaluation of Migration Pathways.....................................................................................4
2.3 Historic and Site Survey Information Reviews ..................................................................5
2.4 Data Gap Analysis Process Summary ................................................................................6
3.0 SUBAREA 8 DATA GAP ANALYSIS ............................................................................8
4.0 REFERENCES ............................................................................................................... 10
TABLES
Table No.
1 Subarea 8 Phase 3 Proposed Soil Matrix Sample Locations
2 Subarea 8 Phase 3 Proposed Soil Vapor Sample Locations
3 Subarea 8 Phase 3 Proposed Sample Locations for Future Collection
4 Subarea 8 Data Gap Checklist
FIGURES
Figure No.
1 Subarea 8 North Phase 3 Proposed Soil Matrix Sampling Locations
2 Subarea 8 South Phase 3 Proposed Soil Matrix Sampling Locations
3 Subarea 8 Phase 3 Proposed Soil Vapor Sampling Locations
ATTACHMENTS
Attachment No.
1 DTSC Chemical Look-Up Table, June 2013
Subarea 8 Phase 3 Data Gap Analysis
Technical Memorandum
Santa Susana Field Laboratory, Ventura County, California August 2013
ii
ACRONYMS AND ABBREVIATIONS
AOC Administrative Order on Consent
BTV background threshold value
DOE Department of Energy
DQO Data Quality Objective
DTSC Department of Toxic Substances Control
EPA Environmental Protection Agency
ESADA Empire State Atomic Development Authority
FSDF Former Sodium Disposal Facility
GIS geographic information system
HGL Hydrogeologic, Inc.
HSA historical site assessment
ISL interim screening level
LUT Look-Up Table
MFSP Master Field Sampling Plan
MRL method reporting limit
MWH MWH Americas, Inc.
NDMA n-nitrosodimethylamine
NBZ Northern Buffer Zone
PAH polyaromatic hydrocarbon
PCB polycyclic biphenyls
RCRA Resource Conservation and Recovery Act
RFI RCRA Facility Investigation
SSFL Santa Susana Field Laboratory
TM technical memorandum
TPH total petroleum hydrocarbon
VOC volatile organic compound
Subarea 8 Phase 3 Data Gap Analysis
Technical Memorandum
Santa Susana Field Laboratory, Ventura County, California August 2013
1
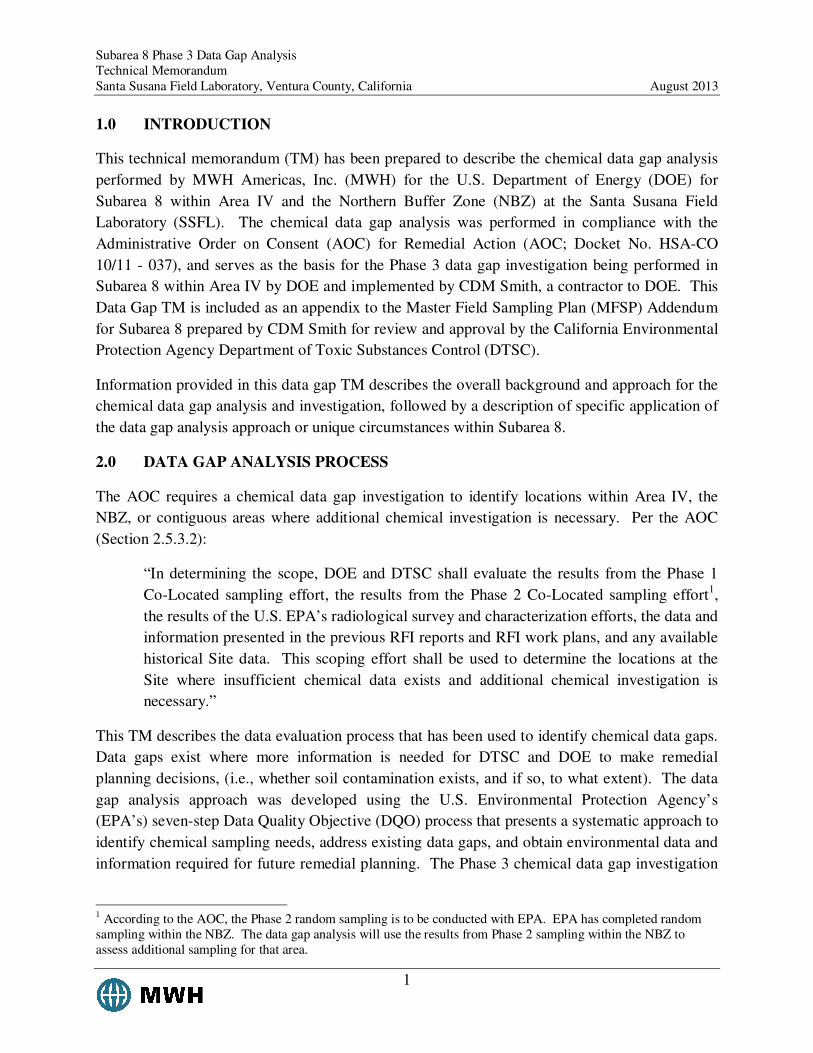
1.0 INTRODUCTION
This technical memorandum (TM) has been prepared to describe the chemical data gap analysis
performed by MWH Americas, Inc. (MWH) for the U.S. Department of Energy (DOE) for
Subarea 8 within Area IV and the Northern Buffer Zone (NBZ) at the Santa Susana Field
Laboratory (SSFL). The chemical data gap analysis was performed in compliance with the
Administrative Order on Consent (AOC) for Remedial Action (AOC; Docket No. HSA-CO
10/11 - 037), and serves as the basis for the Phase 3 data gap investigation being performed in
Subarea 8 within Area IV by DOE and implemented by CDM Smith, a contractor to DOE. This
Data Gap TM is included as an appendix to the Master Field Sampling Plan (MFSP) Addendum
for Subarea 8 prepared by CDM Smith for review and approval by the California Environmental
Protection Agency Department of Toxic Substances Control (DTSC).
Information provided in this data gap TM describes the overall background and approach for the
chemical data gap analysis and investigation, followed by a description of specific application of
the data gap analysis approach or unique circumstances within Subarea 8.
2.0 DATA GAP ANALYSIS PROCESS
The AOC requires a chemical data gap investigation to identify locations within Area IV, the
NBZ, or contiguous areas where additional chemical investigation is necessary. Per the AOC
(Section 2.5.3.2):
“In determining the scope, DOE and DTSC shall evaluate the results from the Phase 1
Co-Located sampling effort, the results from the Phase 2 Co-Located sampling effort1,
the results of the U.S. EPA’s radiological survey and characterization efforts, the data and
information presented in the previous RFI reports and RFI work plans, and any available
historical Site data. This scoping effort shall be used to determine the locations at the
Site where insufficient chemical data exists and additional chemical investigation is
necessary.”
This TM describes the data evaluation process that has been used to identify chemical data gaps.
Data gaps exist where more information is needed for DTSC and DOE to make remedial
planning decisions, (i.e., whether soil contamination exists, and if so, to what extent). The data
gap analysis approach was developed using the U.S. Environmental Protection Agency’s
(EPA’s) seven-step Data Quality Objective (DQO) process that presents a systematic approach to
identify chemical sampling needs, address existing data gaps, and obtain environmental data and
information required for future remedial planning. The Phase 3 chemical data gap investigation
1 According to the AOC, the Phase 2 random sampling is to be conducted with EPA. EPA has completed random
sampling within the NBZ. The data gap analysis will use the results from Phase 2 sampling within the NBZ to
assess additional sampling for that area.
Subarea 8 Phase 3 Data Gap Analysis
Technical Memorandum
Santa Susana Field Laboratory, Ventura County, California August 2013
2
DQOs are the framework for the analysis described in this TM and are presented in Section 4.0
of the MFSP (CDM Smith, 2012b).
The Phase 3 data gap analysis is an iterative process. In data gap evaluations for prior Subareas
(5C, 5B, 5A, 6/3, and 7), data were compared with the interim screening levels (ISLs) developed
for evaluation of available data (see Master Phase 3 Work Plan Table 2-1, CDM Smith, 2012a)
since DTSC had not yet established Chemical Look-Up Table (LUT) values. The ISLs were
developed jointly by DTSC and DOE, and reflect the 2005 background soil concentrations for
metals and dioxins, and analytical reporting limits for chemicals not having a background value.
In June 2013, DTSC issued the revised Chemical LUT values for the chemicals most frequently
detected within Area IV, including all background constituents and additional chemicals of
interest to DTSC. DTSC indicated that a second part of the Chemical LUT will be issued during
summer 2013, and would reflect required Method Reporting Limits (MRLs) for the remaining
chemicals being investigated at the site. Since the DTSC Chemical LUT values are now
available for the most frequently detected chemicals in Area IV, and because these values
provide the AOC standard for remediation, the newly issued LUT values have been used in the
data gap analysis for Subarea 8, and will also be applied for Subareas 5D and the NBZ. Since
the second part of the Look-Up Table has not yet been issued by DTSC, MRLs achievable by
several analytical laboratories, similar to or lower than the ISL MRLs, were used in the Subarea
8 data gap analysis as the comparison values for the remaining chemicals. The remaining LUT
values based on MRLs will be used in future subarea data gap analyses after they are issued by
DTSC.
At the completion of the first round of Phase 3 data gap analysis of all Area IV subareas,
DTSC’s Chemical Look-Up Table values and EPA’s final radionuclide sampling results will be
used for data screening and identification of any remaining chemical data gaps. Ultimately, all
available previous chemical data, including prior Resource Conservation and Recovery Act
(RCRA) Facility Investigation (RFI) results and Phase 1, 2, and 3 chemical data, will be
evaluated using DTSC’s Look-Up Table values per the AOC and summarized in the Final
Chemical Data Summary Report.
This data gap analysis is based on prior RFI data, the Phase 1 co-located sample results, and
historical information on activities within Area IV, and considers results from EPA’s
radiological investigation activities (e.g., radionuclide sampling results, gamma surveys,
geophysical surveys, aerial photograph interpretations).
The data gap analysis identifies where additional information is needed for remedial planning by:
Subarea 8 Phase 3 Data Gap Analysis
Technical Memorandum
Santa Susana Field Laboratory, Ventura County, California August 2013
3
• Comparing existing soil sampling results to LUT criteria to identify additional sample
locations needed to define the extent of contamination (based on criteria exceedance)
and/or gradients in chemical concentrations away from a potential source;
• Evaluating migration pathways to ensure that samples are collected where contamination
may have migrated via natural or anthropogenic processes; and
• Evaluating historical documents and site survey information to identify potential release
areas that may not have been adequately characterized.
Each of these evaluation steps are described below.
2.1 COMPARISON OF PREVIOUS SAMPLING DATA TO SCREENING CRITERIA
To determine future chemical sampling needs (to be implemented under the Master Phase 3
Work Plan and MFSP), validated soil chemistry results are compared with LUT values. The
LUT values are based on either 2012 soil background threshold values (BTVs) or analytical
MRLs for chemicals that do not have established BTVs. The LUT values currently being used
for the data gap analysis are dated June 2013, and are posted on DTSC’s SSFL web site and
provided herein as Attachment A.
This data comparison is conducted to answer several questions:
• Are the data adequate to define the extent of soil contamination? (i.e., what is the areal
extent? How deep does contamination go?)
• Where are additional data needed to address areal and depth extent?
• What types of chemical data are needed at each location?
The soil chemical results within the analytical database are “filterable,” meaning each individual
soil chemical result can be selectively evaluated or results can be collectively reviewed for each
prior sample point. The analytical database incorporates data files for soil chemical data
collected under the RFI and co-located sampling programs. A geographic information system
(GIS) is used to spatially display the sampling results. To display the data, the sampling results
are compared with the LUT values for all chemicals analyzed at each sample location using a
computer algorithm. The algorithm calculates the ratio of the soil concentration to the LUT
value. The GIS is then used to display the maximum comparison value (i.e., ‘ratio’) at a
sampling location, so that the highest result relative to the LUT is displayed. The GIS uses a
color-coded system to display the soil concentration relative to the LUT value. For example, soil
concentrations that are at or below the LUT value are displayed as a green symbol. Locations
where the soil concentration exceeds the LUT are displayed as yellow, orange, magenta, or red,
depending on the degree of exceedance of the LUT value. Maps displaying the sampling results
Subarea 8 Phase 3 Data Gap Analysis
Technical Memorandum
Santa Susana Field Laboratory, Ventura County, California August 2013
4
as color-coded symbols are included in this Data Gap Analysis TM (Figures 1 and 2) to help
display this evaluation step in the context of proposed sampling locations.
The data gap analysis includes review of sampling results for combined chemicals, individual
chemical groups (e.g. volatile organic compounds [VOCs], polyaromatic hydrocarbons [PAHs],
polycyclic biphenyls [PCBs], etc.), and individual chemicals (e.g., barium, perchlorate).
Sampling results in the database are ‘filtered’ to determine which chemicals are above LUT
values, their depth of occurrence, and which chemicals are co-located. This allows for effective
evaluation and selection of step-out sample locations and analytical suites for assessing the
extent and/or distribution of chemicals that exceed their respective LUT values. In some cases,
sampling to address elevated reporting limits in historical data is not proposed in all areas of
Subarea 8 in this TM. In areas where other data gaps have been identified, sampling for elevated
reporting limits is also proposed as needed. In other areas, data gap evaluation for elevated
reporting limits in historical data will be addressed in the context of all recent sampling results
after collection of the samples as proposed in this TM.
The GIS display of the LUT-compared sampling results is used to evaluate potential sampling
locations. In areas where detected concentrations exceed LUT values, previous sampling data
are evaluated to determine if the lateral or vertical extent of the exceedance is limited by other
sampling results below LUT values or other features at the site (e.g., bedrock). If not, then
additional sampling is proposed in that area. Conversely, in some areas existing sampling results
are adequate to support remedial planning. A review of the distribution of results along with
other lines of evidence (described below) is used to identify where additional sampling is
needed.
Some locations with elevated concentrations (now recognized as significant exceedances of LUT
values) have been identified by DOE and DTSC as soil “clearly contaminated areas.” These are
areas most likely requiring remediation based on the existing elevated sampling results, and are
displayed in GIS and on maps in this TM with pink shading. The data gap analysis for these
areas considers whether sufficient information is available to determine the lateral and vertical
extent of contamination. In many cases, more data are needed to determine a volume of soil to
be remediated for use in remedial planning, and additional sampling is proposed in these areas.
2.2 EVALUATION OF MIGRATION PATHWAYS
Migration pathways are the means by which chemicals can move in the environment, including
surface water transport, downward movement to subsurface soil, or air/wind dispersion.
Migration pathways are evaluated to answer several questions:
• Where could potentially contaminated soil migrate via surface water flow?
Subarea 8 Phase 3 Data Gap Analysis
Technical Memorandum
Santa Susana Field Laboratory, Ventura County, California August 2013
5
• Where could contaminants migrate in subsurface soils? Could groundwater be affected
by the soil contamination?
• Were chemicals potentially released into the air, dispersed by wind and deposited in
surrounding areas at concentrations exceeding LUT values?
The topographic and surface water flow data in the GIS is used to identify surface water
pathways from potential contamination sources. Prior data for those pathways will be evaluated
as to the adequacy for addressing contaminant migration. If additional data are needed to define
the extent of chemicals moved by surface water, downward migration in the subsurface, or to
assess air dispersion, sampling locations are proposed for the migration pathways.
This data gap analysis identifies previous soil sampling locations or features where there may be
outstanding groundwater investigation program data needs. At these features, the data gap
analysis is evaluating the adequacy of existing soil sampling results to assess potential migration
of contaminants to groundwater, and proposing additional soil sampling to the top of bedrock if
gaps are identified.
2.3 HISTORIC AND SITE SURVEY INFORMATION REVIEWS
The data gap analysis also addresses potential sources of contamination not covered by prior
sampling events. Historical survey and site operational information for Area IV is represented in
GIS and viewed in context of previous sampling results. Historical and site survey information
will be used to answer two questions:
• Are there any potential chemical use/release features that have not been sampled?
• If a potential chemical use area has already been sampled (but not for all chemicals
potentially used), are additional samples/analyses needed to complete characterization?
A checklist has been developed that is reviewed along with the chemical data to ensure that
features not covered by RFI or Phase 1 co-located sampling are addressed. The checklist
includes the results of the historical site assessment (HSA) conducted by Sapere (2005), site
operational and aerial photographic information recently compiled for the RFI, and the recent
HSA completed by EPA (Hydrogeologic, Inc. [HGL], 2012). The “lines of evidence” reviewed
as part of the checklist are published in the Master Phase 3 Work Plan Table 2-2, and provided
herein (Table 3) for how they were applied in Subarea 8.
Site information includes various site features or survey information that is displayed in GIS
using a common coordinate system (similar to latitude and longitude). Tanks, buildings, leach
fields, geophysical survey results, historical aerial photos, storage areas, debris/disposal areas,
identified chemical use areas, and surface water flow paths are examples of site
information/features used to identify potential data gaps and proposed sampling locations. Site
Subarea 8 Phase 3 Data Gap Analysis
Technical Memorandum
Santa Susana Field Laboratory, Ventura County, California August 2013
6
information is shown as layers in GIS that can be displayed individually or combined with
sampling results. The site information features, compiled from historical documents, aerial
photo review, and site surveys are evaluated using existing data to assess the completeness of
characterization. If gaps are identified (e.g., a storage area not previously sampled), sampling is
proposed with the analytical suites developed based on surrounding site operational uses and
existing sample result exceedances.
In addition to site historical use or survey information, soil borings and trench logs are reviewed
to identify relevant soil conditions (e.g., debris, staining, bedrock depth) since unique soil
characteristics may also guide proposed sampling intervals. For example, sampling may be
proposed both within and below stained horizons, or in another case, both within fill materials
and below fill materials in underlying native soils. In both of these cases, sampling is needed
below a potential contamination zone to identify how far contamination has migrated downward.
Data gaps associated with some historical operational use features are not addressed in this TM
but will be included in future documents. Historical operational use features not addressed in
this plan include the Area IV sewer system, the natural gas pipelines within Area IV, and
features within existing Area IV buildings. Data gaps associated with the sewer system and
natural gas pipelines are being evaluated for these systems as a whole, and will be addressed in a
separate technical memorandum. Where applicable, sampling is proposed in this TM where
sewer pipelines leave former or existing buildings since these are considered site-specific
sampling features. Data gaps associated with existing buildings are being evaluated as part of
this process, but sampling requirements within or below existing buildings will be detailed in
forthcoming demolition plans since that work will proceed under a different schedule and
process.
2.4 DATA GAP ANALYSIS PROCESS SUMMARY
A systematic process that incorporates the evaluation components discussed in Sections 2.1
through 2.3 is being used during data gap analysis to ensure available information from multiple
sources is considered during data gap review. Thus, combining data gap recommendations from
the three evaluation components (data screening evaluations, migration pathway evaluations, and
historical document/site survey reviews), sampling is proposed for the evaluated subarea.
The outcome of the data gap analysis process is the identification of soil sampling requirements
for Phase 3, including rationale for Phase 3 samples, their locations, depths, and proposed
analytical suites. Both soil and soil vapor sampling for chemicals in Phase 3 are proposed in this
TM (‘soil’ sampling is often referred to as ‘soil matrix’ sampling to distinguish it from soil vapor
sampling). Soil matrix and soil vapor media provide different types of chemical data for
remedial planning purposes. Soil vapor sampling is preferred to assess the potential release of
solvents, which contain VOCs. Since VOCs are highly volatile, they are generally best
Subarea 8 Phase 3 Data Gap Analysis
Technical Memorandum
Santa Susana Field Laboratory, Ventura County, California August 2013
7
evaluated in soil vapor samples, not soil matrix. Therefore, soil vapor sampling is proposed in
this TM to evaluate locations where solvents may have been used, stored, or released, or to
step-out around previous detections of VOCs above LUT values. Soil vapor sampling is also
proposed to provide VOC data over larger areas to evaluate potential solvent release locations
when historical operations are uncertain (e.g., large storage areas), or to assess vapor transport
from an underlying groundwater plume.
The analytical parameters proposed for step-out or step-down sampling locations are based both
on what the prior data indicate are chemicals of potential concern for the location, in conjunction
with data needs identified based on review of migration pathways and other lines of evidence.
Proposed sample spacing is based on the types of operations and releases, the magnitude and
gradients of nearby sampling results, and site conditions (e.g., depth of soil, proximity of
bedrock outcrops). Generally, samples are located with a 25 to 100 foot spacing laterally, and at
0.5-, 5-, and 10-foot depth intervals vertically. In many cases the deepest samples will be placed
on ‘hold’ by the laboratory, and analyzed if elevated results are detected in the shallower
samples. In special cases, sampling is proposed at shallower depths (e.g., 2 feet) to assess
potentially more limited downward migration of large organic molecules like PCBs, dioxins, or
PAHs.
The data gap analysis also identifies additional investigation techniques for some areas to aid in
selection of sampling locations. The additional investigation techniques can include trenching or
test pit excavation to observe soil conditions prior to sampling, or geophysical surveying of areas
to identify targeted features, such as pipelines, underground storage tanks, or fill areas. In some
cases, field reconnaissance or mapping is needed to refine proposed sampling locations, such as
along drainages. The sampling rationales included in this TM specify these additional
investigative techniques where applicable.
The data gap analysis can identify future sampling locations outside of the subarea being
evaluated. These future locations are displayed with pink ‘+’ symbols on Figures 1 and 2. In
some cases, the samples are located outside of Area IV and will require additional surveys and
coordination prior to sampling. In other cases, the proposed samples are within another subarea,
and will be included in the corresponding Subarea Data Gap Analysis TM.
The information presented in this TM, along with supporting GIS and analytical information, is
reviewed with DTSC during the data gap process and with interested stakeholders at the end of
the data gap process. Input received from DTSC during review and from the public during
meetings is incorporated into the proposed sampling included in this TM.
Subarea 8 Phase 3 Data Gap Analysis
Technical Memorandum
Santa Susana Field Laboratory, Ventura County, California August 2013
8
3.0 SUBAREA 8 DATA GAP ANALYSIS
The data gap analysis for Subarea 8 was performed following the process outlined above and
using the DQOs presented in Section 4 of the MFSP (CDM Smith, 2012b). The proposed
sampling for this subarea is presented in Tables 1 (Soil Matrix), 2 (Soil Vapor), and 3 (Future)
and Figures 1 (Soil Matrix in Subarea 8 North), 2 (Soil Matrix in Subarea 8 South), and 3 (Soil
Vapor). Table 4 presents the lines of evidence evaluation summary for this subarea, with
checkmarks indicating what information resulted in proposed data gap samples.
As part of the Subarea 8 data gap analysis, some areas were identified where the DQOs were
uniquely applied, or where specific sampling approaches have been recommended. These are
briefly described below. More detailed, sample-specific rationales for these (and all) areas are
provided in Tables 1 through 3.
• At representative geophysical anomaly locations, investigation using test pits or
trenches is proposed to evaluate potential subsurface features associated with each
anomaly and to inspect soil conditions prior to collecting a soil sample (e.g., 8_DG-544
and 8_DG-547).
• Sampling to address potential impacts beneath lined drainages is proposed by targeting
sediment sample locations with results above LUT values. Samples will be collected
beneath the drainage lining, with the deepest sample collected above bedrock to assess
potential lateral migration along bedrock (e.g., 8_DG-553 and 8_DG-569).
• Adjacent to and outside of the Former Sodium Disposal Facility (FSDF) 2000 Interim
Measure excavation boundary, sampling is proposed to characterize native soil for
PAHs, n-nitrosodimethylamine (NDMA), phthalates, dioxins, metals, hexavalent
chromium, perchlorate, total petroleum hydrocarbon (TPH), PCBs, and biphenyls.
Samples will be collected down to bedrock to evaluate potential lateral migration along
bedrock (e.g., 8_DG-506, 8_DG-507, and 8_DG-508).
• Potential air dispersion impacts related to burning and treatment activities at the former
FSDF Ponds is addressed by sampling undeveloped hillsides and downgradient
drainages away from the former ponds in the prevailing wind direction to the northwest
(the southeastern direction is predominantly developed with high sampling density
already proposed) and toward the southwest due to periodic ‘Santa Ana’ wind
conditions. Six soil sample locations associated with Subarea 8 are proposed to assess
this migration pathway (8_DG-521, 8_DG-601, and future sample locations 8_DG-619
through 8_DG-622). Additional sampling to address this pathway will also be proposed
in the NBZ Subarea.
• Potential air dispersion impacts related to burning activities at the Building 4100 Trench
is addressed by sampling proposed on undeveloped hillsides away from the Building
Subarea 8 Phase 3 Data Gap Analysis
Technical Memorandum
Santa Susana Field Laboratory, Ventura County, California August 2013
9
4100 Trench in the prevailing wind direction to the northwest (the southeastern
direction is predominantly developed with high sampling density already proposed).
Five soil sample locations associated with Subarea 8 are proposed to assess this
migration pathway (e.g., 8_DG-585, 8_DG-588, 8_DG-589, 8_DG-591, and 8_DG-
592). Additional sampling to address this pathway will be proposed in the NBZ
Subarea during the associated data gap analysis. Sampling was not proposed as part of
this TM since existing data in the NBZ is pending validation and will affect sample
placement.
• East of the Building 4056 Landfill, lateral step-out sampling is proposed to define the
extent of fill (e.g., 8_DG-594, 8_DG-596, and 8_DG-597).
• At the Building 4056 Excavation Pit, additional sampling is not proposed since
sufficient sampling has been performed for remedial planning purposes.
• At a former septic tank identified on a facility drawing near Building 4009,
investigation using a trench is proposed to address uncertainty regarding location and
sampling is proposed to characterize soil beneath the potential former septic tank
(i.e., 8_DG-577).
• Adjacent to the former location of UT-4 near Building 4009, investigation using a
trench is proposed to locate the former UT-4 vault and collect a sample of native soil at
a depth just below the bottom of the vault (i.e., 8_DG-579).
• At the Building 4009 Leach Field, sufficient previous sampling was conducted within
the leach fields to characterize soil conditions to the top of bedrock, so no additional
sampling is proposed within the footprints of these features. However, lateral sampling
is proposed to the north and east of this leach field (i.e., 8_DG-582 and 8_DG-583).
• On the hilltop east of the Empire State Atomic Development Authority (ESADA) area,
sampling of the white, caliche-like mineralization is proposed to assess the chemical
composition of this material since it may be related to soil sampling results in the
vicinity or downslope of this feature (i.e., 8_DG-604 and 8_DG-605).
• Sampling to address potential impacts to groundwater is proposed at several locations
(listed below and shown on Figure 3). Proposed sampling at these locations includes
vertical sampling to top of bedrock (including VOC analysis in the deepest samples
collected) and soil vapor sampling. In addition, further evaluation by the groundwater
team is recommended for mobile chemicals detected in soil in the vicinity of these
features, including VOCs, perchlorate, hexavalent chromium, and/or NDMA. The
potential features/locations identified in Subarea 8 are:
o FSDF Disposal/Treatment Area, including former Upper and Lower Ponds, and
Concrete Pool Area
Subarea 8 Phase 3 Data Gap Analysis
Technical Memorandum
Santa Susana Field Laboratory, Ventura County, California August 2013
10
o Building 4009 Sodium Graphite and Organic Modulated Reactor Vaults, and
Former Waste Hold-up Tanks (UT-4 and UT-5)
o Building 4009 Former Fuel Oil Underground Storage Tank (UT-3)
o Building 4009 Leach Field
o Building 4056 Excavation Pit
4.0 REFERENCES
CDM Smith. 2012a. Work Plan for Chemical Data Gap Investigation, Phase 3 Chemical
Sampling at Area IV, Santa Susana Field Laboratory, Ventura County, California. April.
CDM Smith. 2012b. Master Field Sampling Plan for Chemical Data Gap Investigation Sampling
at Area IV, Santa Susana Field Laboratory, Ventura County, California. April.
Hydrogeologic, Inc. (HGL) 2012. Draft Final Historic Site Assessment Santa Susana Field
Laboratory Site Area IV Radiological Study, Ventura County, California.

TABLES
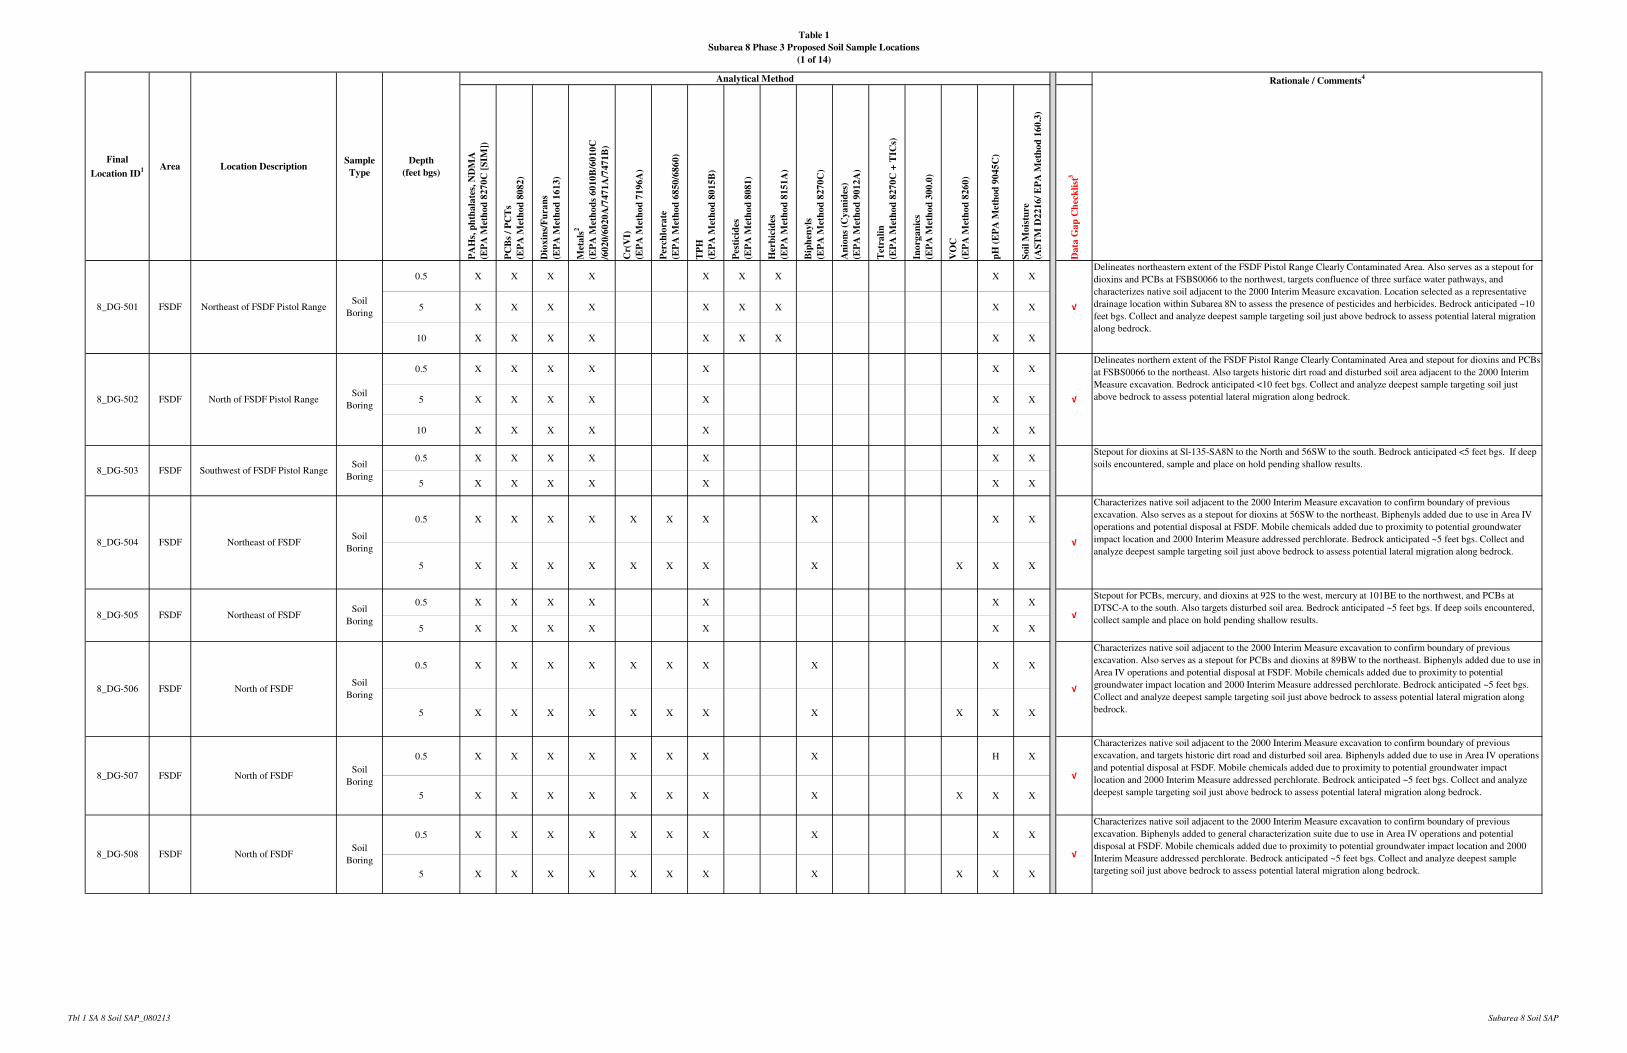
Table 1
Subarea 8 Phase 3 Proposed Soil Sample Locations
(1 of 14)
PA
Hs,
ph
tha
late
s, N
DM
A
(EP
A M
eth
od
82
70
C [
SIM
])
PC
Bs
/ P
CT
s
(EP
A M
eth
od
80
82
)
Dio
xin
s/F
ura
ns
(EP
A M
eth
od
16
13
)
Met
als
2
(EP
A M
eth
od
s 6
01
0B
/60
10
C
/60
20
/60
20
A/7
47
1A
/74
71
B)
Cr(
VI)
(EP
A M
eth
od
71
96
A)
Per
chlo
rate
(EP
A M
eth
od
68
50
/68
60
)
TP
H
(EP
A M
eth
od
80
15
B)
Pes
tici
des
(EP
A M
eth
od
80
81
)
Her
bic
ides
(EP
A M
eth
od
81
51
A)
Bip
hen
yls
(EP
A M
eth
od
82
70
C)
An
ion
s (C
ya
nid
es)
(EP
A M
eth
od
90
12
A)
Tet
rali
n
(EP
A M
eth
od
82
70
C +
TIC
s)
Ino
rga
nic
s
(EP
A M
eth
od
30
0.0
)
VO
C
(EP
A M
eth
od
82
60
)
pH
(E
PA
Met
ho
d 9
04
5C
)
So
il M
ois
ture
(AS
TM
D2
21
6/
EP
A M
eth
od
16
0.3
)
Da
ta G
ap
Ch
eck
list
3
0.5 X X X X X X X X X
5 X X X X X X X X X
10 X X X X X X X X X
0.5 X X X X X X X
5 X X X X X X X
10 X X X X X X X
0.5 X X X X X X X
5 X X X X X X X
0.5 X X X X X X X X X X
5 X X X X X X X X X X X
0.5 X X X X X X X
5 X X X X X X X
0.5 X X X X X X X X X X
5 X X X X X X X X X X X
0.5 X X X X X X X X H X
5 X X X X X X X X X X X
0.5 X X X X X X X X X X
5 X X X X X X X X X X X
Rationale / Comments4
Characterizes native soil adjacent to the 2000 Interim Measure excavation to confirm boundary of previous
excavation. Also serves as a stepout for PCBs and dioxins at 89BW to the northeast. Biphenyls added due to use in
Area IV operations and potential disposal at FSDF. Mobile chemicals added due to proximity to potential
groundwater impact location and 2000 Interim Measure addressed perchlorate. Bedrock anticipated ~5 feet bgs.
Collect and analyze deepest sample targeting soil just above bedrock to assess potential lateral migration along
bedrock.
Characterizes native soil adjacent to the 2000 Interim Measure excavation to confirm boundary of previous
excavation, and targets historic dirt road and disturbed soil area. Biphenyls added due to use in Area IV operations
and potential disposal at FSDF. Mobile chemicals added due to proximity to potential groundwater impact
location and 2000 Interim Measure addressed perchlorate. Bedrock anticipated ~5 feet bgs. Collect and analyze
deepest sample targeting soil just above bedrock to assess potential lateral migration along bedrock.
Stepout for dioxins at Sl-135-SA8N to the North and 56SW to the south. Bedrock anticipated <5 feet bgs. If deep
soils encountered, sample and place on hold pending shallow results.
Stepout for PCBs, mercury, and dioxins at 92S to the west, mercury at 101BE to the northwest, and PCBs at
DTSC-A to the south. Also targets disturbed soil area. Bedrock anticipated ~5 feet bgs. If deep soils encountered,
collect sample and place on hold pending shallow results.
8_DG-501 FSDF Northeast of FSDF Pistol RangeSoil
Boring√
Final
Location ID1 Area Location Description
Sample
Type
Depth
(feet bgs)
Analytical Method
8_DG-507 FSDF North of FSDFSoil
Boring
8_DG-506 FSDF North of FSDFSoil
Boring
8_DG-502 FSDF North of FSDF Pistol RangeSoil
Boring√
8_DG-505 FSDF Northeast of FSDFSoil
Boring√
8_DG-503 FSDF Southwest of FSDF Pistol RangeSoil
Boring
8_DG-504 FSDF Northeast of FSDFSoil
Boring√
√
√
8_DG-508 FSDF North of FSDFSoil
Boring√
Delineates northeastern extent of the FSDF Pistol Range Clearly Contaminated Area. Also serves as a stepout for
dioxins and PCBs at FSBS0066 to the northwest, targets confluence of three surface water pathways, and
characterizes native soil adjacent to the 2000 Interim Measure excavation. Location selected as a representative
drainage location within Subarea 8N to assess the presence of pesticides and herbicides. Bedrock anticipated ~10
feet bgs. Collect and analyze deepest sample targeting soil just above bedrock to assess potential lateral migration
along bedrock.
Delineates northern extent of the FSDF Pistol Range Clearly Contaminated Area and stepout for dioxins and PCBs
at FSBS0066 to the northeast. Also targets historic dirt road and disturbed soil area adjacent to the 2000 Interim
Measure excavation. Bedrock anticipated <10 feet bgs. Collect and analyze deepest sample targeting soil just
above bedrock to assess potential lateral migration along bedrock.
Characterizes native soil adjacent to the 2000 Interim Measure excavation to confirm boundary of previous
excavation. Biphenyls added to general characterization suite due to use in Area IV operations and potential
disposal at FSDF. Mobile chemicals added due to proximity to potential groundwater impact location and 2000
Interim Measure addressed perchlorate. Bedrock anticipated ~5 feet bgs. Collect and analyze deepest sample
targeting soil just above bedrock to assess potential lateral migration along bedrock.
Characterizes native soil adjacent to the 2000 Interim Measure excavation to confirm boundary of previous
excavation. Also serves as a stepout for dioxins at 56SW to the northeast. Biphenyls added due to use in Area IV
operations and potential disposal at FSDF. Mobile chemicals added due to proximity to potential groundwater
impact location and 2000 Interim Measure addressed perchlorate. Bedrock anticipated ~5 feet bgs. Collect and
analyze deepest sample targeting soil just above bedrock to assess potential lateral migration along bedrock.
Tbl 1 SA 8 Soil SAP_080213 Subarea 8 Soil SAP
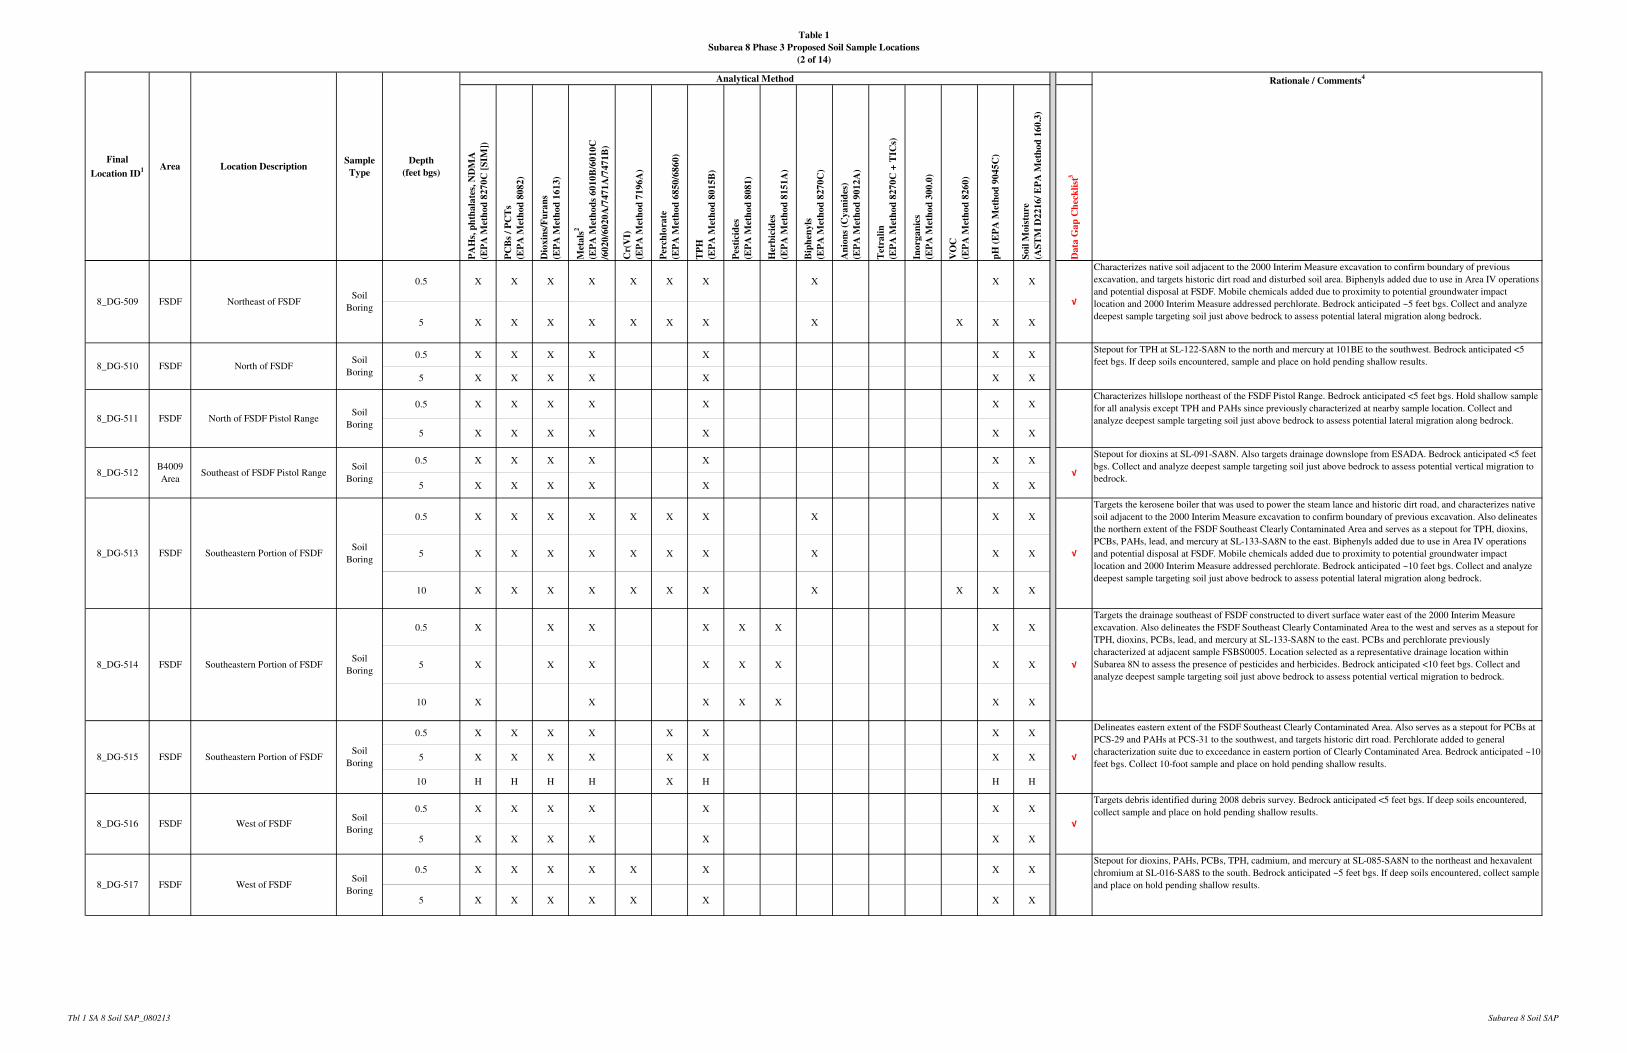
Table 1
Subarea 8 Phase 3 Proposed Soil Sample Locations
(2 of 14)
PA
Hs,
ph
tha
late
s, N
DM
A
(EP
A M
eth
od
82
70
C [
SIM
])
PC
Bs
/ P
CT
s
(EP
A M
eth
od
80
82
)
Dio
xin
s/F
ura
ns
(EP
A M
eth
od
16
13
)
Met
als
2
(EP
A M
eth
od
s 6
01
0B
/60
10
C
/60
20
/60
20
A/7
47
1A
/74
71
B)
Cr(
VI)
(EP
A M
eth
od
71
96
A)
Per
chlo
rate
(EP
A M
eth
od
68
50
/68
60
)
TP
H
(EP
A M
eth
od
80
15
B)
Pes
tici
des
(EP
A M
eth
od
80
81
)
Her
bic
ides
(EP
A M
eth
od
81
51
A)
Bip
hen
yls
(EP
A M
eth
od
82
70
C)
An
ion
s (C
ya
nid
es)
(EP
A M
eth
od
90
12
A)
Tet
rali
n
(EP
A M
eth
od
82
70
C +
TIC
s)
Ino
rga
nic
s
(EP
A M
eth
od
30
0.0
)
VO
C
(EP
A M
eth
od
82
60
)
pH
(E
PA
Met
ho
d 9
04
5C
)
So
il M
ois
ture
(AS
TM
D2
21
6/
EP
A M
eth
od
16
0.3
)
Da
ta G
ap
Ch
eck
list
3
Rationale / Comments4
Final
Location ID1 Area Location Description
Sample
Type
Depth
(feet bgs)
Analytical Method
0.5 X X X X X X X X X X
5 X X X X X X X X X X X
0.5 X X X X X X X
5 X X X X X X X
0.5 X X X X X X X
5 X X X X X X X
0.5 X X X X X X X
5 X X X X X X X
0.5 X X X X X X X X X X
5 X X X X X X X X X X
10 X X X X X X X X X X X
0.5 X X X X X X X X
5 X X X X X X X X
10 X X X X X X X
0.5 X X X X X X X X
5 X X X X X X X X
10 H H H H X H H H
0.5 X X X X X X X
5 X X X X X X X
0.5 X X X X X X X X
5 X X X X X X X X
Stepout for dioxins at SL-091-SA8N. Also targets drainage downslope from ESADA. Bedrock anticipated <5 feet
bgs. Collect and analyze deepest sample targeting soil just above bedrock to assess potential vertical migration to
bedrock.
Targets the kerosene boiler that was used to power the steam lance and historic dirt road, and characterizes native
soil adjacent to the 2000 Interim Measure excavation to confirm boundary of previous excavation. Also delineates
the northern extent of the FSDF Southeast Clearly Contaminated Area and serves as a stepout for TPH, dioxins,
PCBs, PAHs, lead, and mercury at SL-133-SA8N to the east. Biphenyls added due to use in Area IV operations
and potential disposal at FSDF. Mobile chemicals added due to proximity to potential groundwater impact
location and 2000 Interim Measure addressed perchlorate. Bedrock anticipated ~10 feet bgs. Collect and analyze
deepest sample targeting soil just above bedrock to assess potential lateral migration along bedrock.
Targets the drainage southeast of FSDF constructed to divert surface water east of the 2000 Interim Measure
excavation. Also delineates the FSDF Southeast Clearly Contaminated Area to the west and serves as a stepout for
TPH, dioxins, PCBs, lead, and mercury at SL-133-SA8N to the east. PCBs and perchlorate previously
characterized at adjacent sample FSBS0005. Location selected as a representative drainage location within
Subarea 8N to assess the presence of pesticides and herbicides. Bedrock anticipated <10 feet bgs. Collect and
analyze deepest sample targeting soil just above bedrock to assess potential vertical migration to bedrock.
8_DG-515 FSDF Southeastern Portion of FSDFSoil
Boring√
Delineates eastern extent of the FSDF Southeast Clearly Contaminated Area. Also serves as a stepout for PCBs at
PCS-29 and PAHs at PCS-31 to the southwest, and targets historic dirt road. Perchlorate added to general
characterization suite due to exceedance in eastern portion of Clearly Contaminated Area. Bedrock anticipated ~10
feet bgs. Collect 10-foot sample and place on hold pending shallow results.
FSDF North of FSDF Pistol RangeSoil
Boring8_DG-511
8_DG-510
8_DG-516
8_DG-514 FSDF Southeastern Portion of FSDF
8_DG-517 FSDF West of FSDFSoil
Boring
FSDF West of FSDFSoil
Boring√
8_DG-512B4009
AreaSoutheast of FSDF Pistol Range
Soil
Boring√
8_DG-513 FSDF Southeastern Portion of FSDFSoil
Boring√
8_DG-509 FSDF Northeast of FSDFSoil
Boring√
Soil
Boring√
Targets debris identified during 2008 debris survey. Bedrock anticipated <5 feet bgs. If deep soils encountered,
collect sample and place on hold pending shallow results.
FSDF North of FSDFSoil
Boring
Stepout for TPH at SL-122-SA8N to the north and mercury at 101BE to the southwest. Bedrock anticipated <5
feet bgs. If deep soils encountered, sample and place on hold pending shallow results.
Stepout for dioxins, PAHs, PCBs, TPH, cadmium, and mercury at SL-085-SA8N to the northeast and hexavalent
chromium at SL-016-SA8S to the south. Bedrock anticipated ~5 feet bgs. If deep soils encountered, collect sample
and place on hold pending shallow results.
Characterizes hillslope northeast of the FSDF Pistol Range. Bedrock anticipated <5 feet bgs. Hold shallow sample
for all analysis except TPH and PAHs since previously characterized at nearby sample location. Collect and
analyze deepest sample targeting soil just above bedrock to assess potential lateral migration along bedrock.
Characterizes native soil adjacent to the 2000 Interim Measure excavation to confirm boundary of previous
excavation, and targets historic dirt road and disturbed soil area. Biphenyls added due to use in Area IV operations
and potential disposal at FSDF. Mobile chemicals added due to proximity to potential groundwater impact
location and 2000 Interim Measure addressed perchlorate. Bedrock anticipated ~5 feet bgs. Collect and analyze
deepest sample targeting soil just above bedrock to assess potential lateral migration along bedrock.
Tbl 1 SA 8 Soil SAP_080213 Subarea 8 Soil SAP
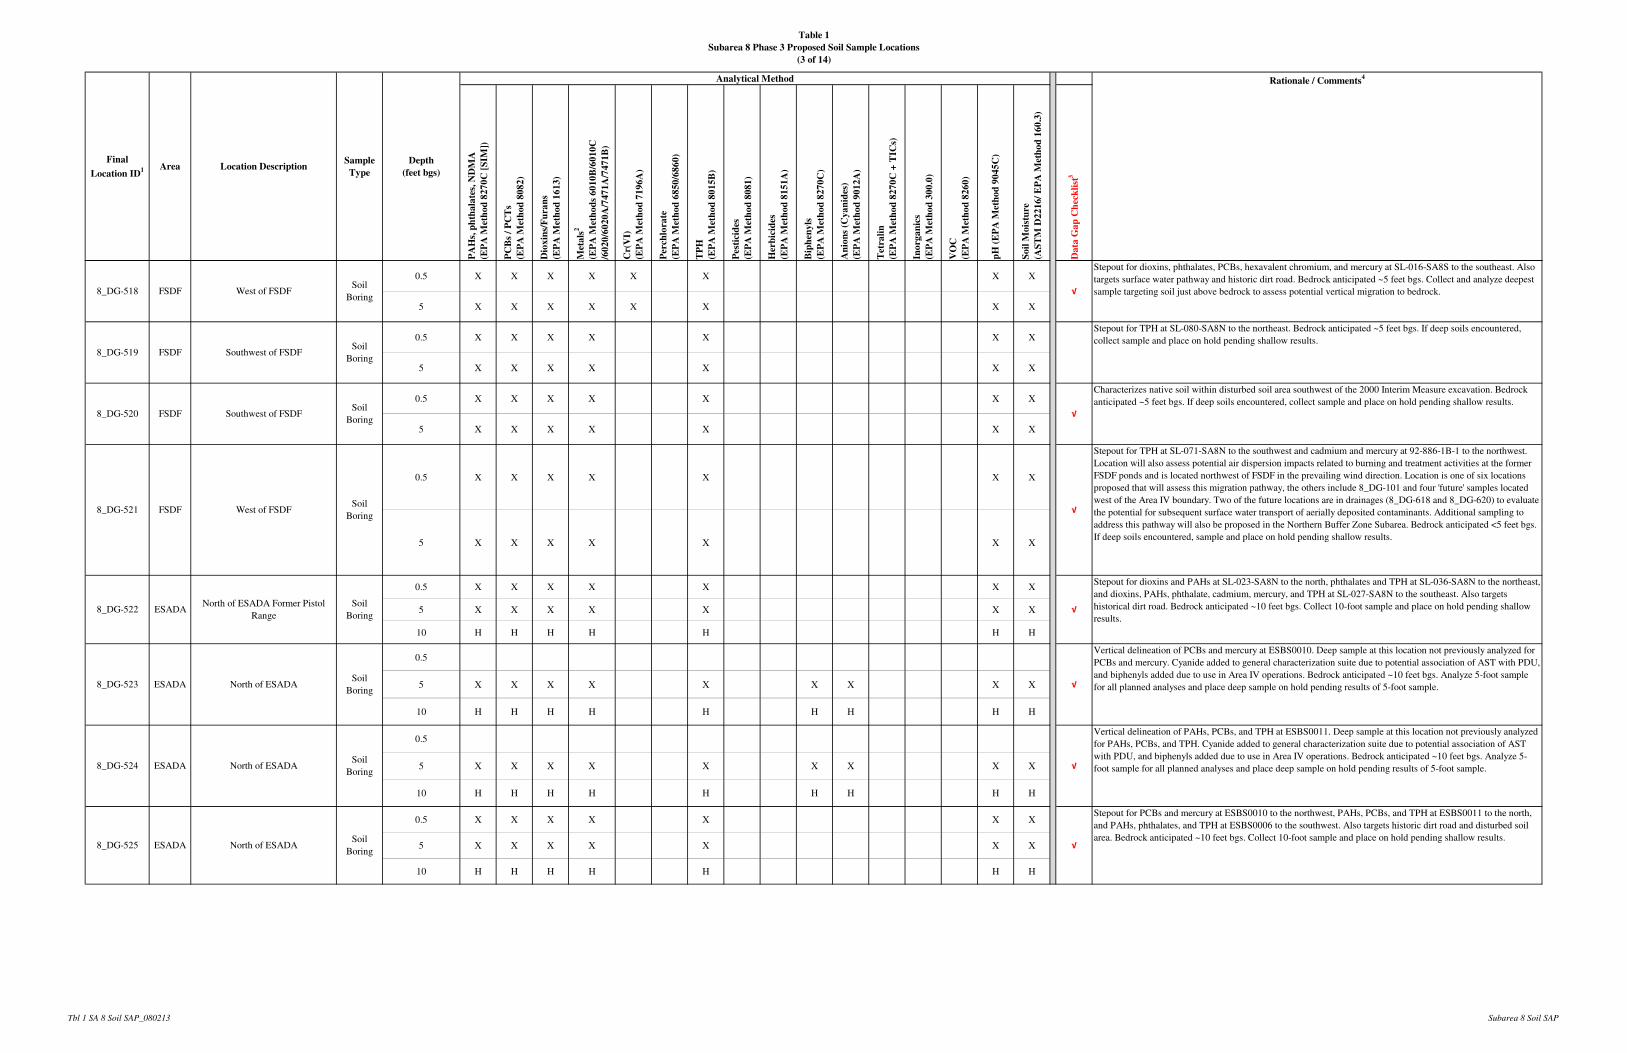
Table 1
Subarea 8 Phase 3 Proposed Soil Sample Locations
(3 of 14)
PA
Hs,
ph
tha
late
s, N
DM
A
(EP
A M
eth
od
82
70
C [
SIM
])
PC
Bs
/ P
CT
s
(EP
A M
eth
od
80
82
)
Dio
xin
s/F
ura
ns
(EP
A M
eth
od
16
13
)
Met
als
2
(EP
A M
eth
od
s 6
01
0B
/60
10
C
/60
20
/60
20
A/7
47
1A
/74
71
B)
Cr(
VI)
(EP
A M
eth
od
71
96
A)
Per
chlo
rate
(EP
A M
eth
od
68
50
/68
60
)
TP
H
(EP
A M
eth
od
80
15
B)
Pes
tici
des
(EP
A M
eth
od
80
81
)
Her
bic
ides
(EP
A M
eth
od
81
51
A)
Bip
hen
yls
(EP
A M
eth
od
82
70
C)
An
ion
s (C
ya
nid
es)
(EP
A M
eth
od
90
12
A)
Tet
rali
n
(EP
A M
eth
od
82
70
C +
TIC
s)
Ino
rga
nic
s
(EP
A M
eth
od
30
0.0
)
VO
C
(EP
A M
eth
od
82
60
)
pH
(E
PA
Met
ho
d 9
04
5C
)
So
il M
ois
ture
(AS
TM
D2
21
6/
EP
A M
eth
od
16
0.3
)
Da
ta G
ap
Ch
eck
list
3
Rationale / Comments4
Final
Location ID1 Area Location Description
Sample
Type
Depth
(feet bgs)
Analytical Method
0.5 X X X X X X X X
5 X X X X X X X X
0.5 X X X X X X X
5 X X X X X X X
0.5 X X X X X X X
5 X X X X X X X
0.5 X X X X X X X
5 X X X X X X X
0.5 X X X X X X X
5 X X X X X X X
10 H H H H H H H
0.5
5 X X X X X X X X X
10 H H H H H H H H H
0.5
5 X X X X X X X X X
10 H H H H H H H H H
0.5 X X X X X X X
5 X X X X X X X
10 H H H H H H H
√8_DG-524 ESADA North of ESADASoil
Boring
√
8_DG-522 ESADANorth of ESADA Former Pistol
Range
Soil
Boring√
8_DG-523 ESADA North of ESADASoil
Boring√
8_DG-519 FSDF Southwest of FSDFSoil
Boring
8_DG-518 FSDF West of FSDFSoil
Boring
8_DG-521 FSDF West of FSDFSoil
Boring
8_DG-525 ESADA North of ESADASoil
Boring
√
√
8_DG-520 FSDF Southwest of FSDFSoil
Boring√
Stepout for dioxins, phthalates, PCBs, hexavalent chromium, and mercury at SL-016-SA8S to the southeast. Also
targets surface water pathway and historic dirt road. Bedrock anticipated ~5 feet bgs. Collect and analyze deepest
sample targeting soil just above bedrock to assess potential vertical migration to bedrock.
Stepout for PCBs and mercury at ESBS0010 to the northwest, PAHs, PCBs, and TPH at ESBS0011 to the north,
and PAHs, phthalates, and TPH at ESBS0006 to the southwest. Also targets historic dirt road and disturbed soil
area. Bedrock anticipated ~10 feet bgs. Collect 10-foot sample and place on hold pending shallow results.
Stepout for TPH at SL-080-SA8N to the northeast. Bedrock anticipated ~5 feet bgs. If deep soils encountered,
collect sample and place on hold pending shallow results.
Characterizes native soil within disturbed soil area southwest of the 2000 Interim Measure excavation. Bedrock
anticipated ~5 feet bgs. If deep soils encountered, collect sample and place on hold pending shallow results.
Stepout for dioxins and PAHs at SL-023-SA8N to the north, phthalates and TPH at SL-036-SA8N to the northeast,
and dioxins, PAHs, phthalate, cadmium, mercury, and TPH at SL-027-SA8N to the southeast. Also targets
historical dirt road. Bedrock anticipated ~10 feet bgs. Collect 10-foot sample and place on hold pending shallow
results.
Vertical delineation of PCBs and mercury at ESBS0010. Deep sample at this location not previously analyzed for
PCBs and mercury. Cyanide added to general characterization suite due to potential association of AST with PDU,
and biphenyls added due to use in Area IV operations. Bedrock anticipated ~10 feet bgs. Analyze 5-foot sample
for all planned analyses and place deep sample on hold pending results of 5-foot sample.
Vertical delineation of PAHs, PCBs, and TPH at ESBS0011. Deep sample at this location not previously analyzed
for PAHs, PCBs, and TPH. Cyanide added to general characterization suite due to potential association of AST
with PDU, and biphenyls added due to use in Area IV operations. Bedrock anticipated ~10 feet bgs. Analyze 5-
foot sample for all planned analyses and place deep sample on hold pending results of 5-foot sample.
Stepout for TPH at SL-071-SA8N to the southwest and cadmium and mercury at 92-886-1B-1 to the northwest.
Location will also assess potential air dispersion impacts related to burning and treatment activities at the former
FSDF ponds and is located northwest of FSDF in the prevailing wind direction. Location is one of six locations
proposed that will assess this migration pathway, the others include 8_DG-101 and four 'future' samples located
west of the Area IV boundary. Two of the future locations are in drainages (8_DG-618 and 8_DG-620) to evaluate
the potential for subsequent surface water transport of aerially deposited contaminants. Additional sampling to
address this pathway will also be proposed in the Northern Buffer Zone Subarea. Bedrock anticipated <5 feet bgs.
If deep soils encountered, sample and place on hold pending shallow results.
Tbl 1 SA 8 Soil SAP_080213 Subarea 8 Soil SAP
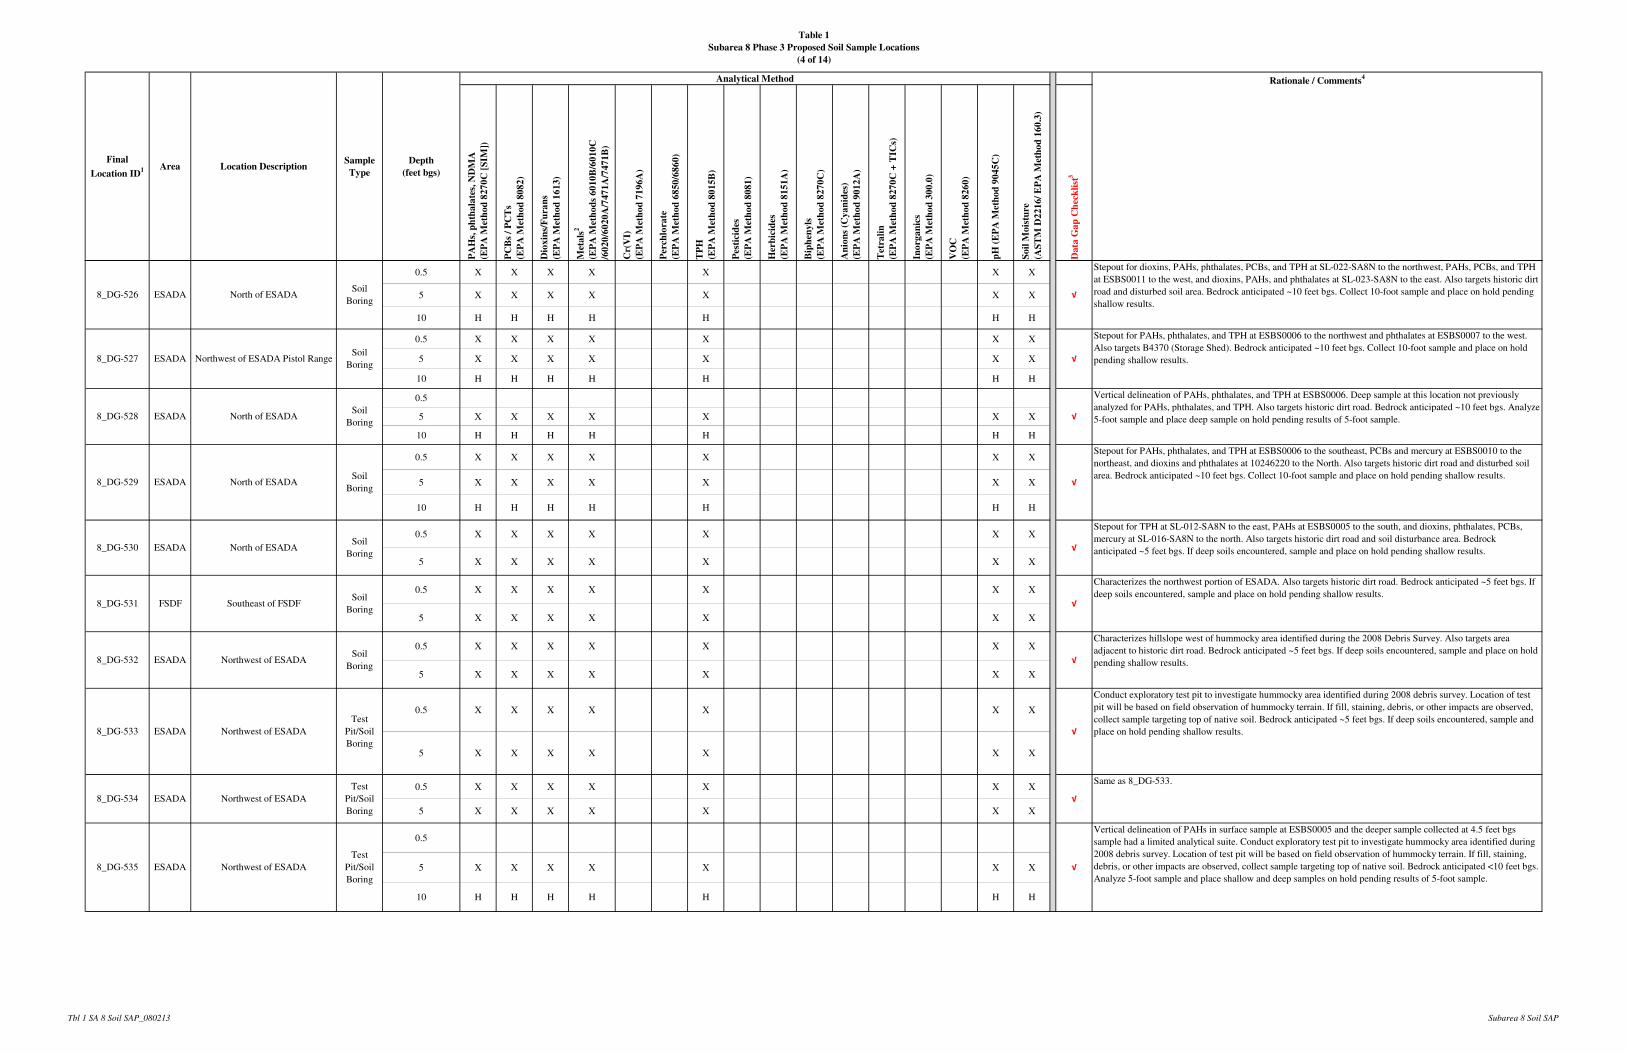
Table 1
Subarea 8 Phase 3 Proposed Soil Sample Locations
(4 of 14)
PA
Hs,
ph
tha
late
s, N
DM
A
(EP
A M
eth
od
82
70
C [
SIM
])
PC
Bs
/ P
CT
s
(EP
A M
eth
od
80
82
)
Dio
xin
s/F
ura
ns
(EP
A M
eth
od
16
13
)
Met
als
2
(EP
A M
eth
od
s 6
01
0B
/60
10
C
/60
20
/60
20
A/7
47
1A
/74
71
B)
Cr(
VI)
(EP
A M
eth
od
71
96
A)
Per
chlo
rate
(EP
A M
eth
od
68
50
/68
60
)
TP
H
(EP
A M
eth
od
80
15
B)
Pes
tici
des
(EP
A M
eth
od
80
81
)
Her
bic
ides
(EP
A M
eth
od
81
51
A)
Bip
hen
yls
(EP
A M
eth
od
82
70
C)
An
ion
s (C
ya
nid
es)
(EP
A M
eth
od
90
12
A)
Tet
rali
n
(EP
A M
eth
od
82
70
C +
TIC
s)
Ino
rga
nic
s
(EP
A M
eth
od
30
0.0
)
VO
C
(EP
A M
eth
od
82
60
)
pH
(E
PA
Met
ho
d 9
04
5C
)
So
il M
ois
ture
(AS
TM
D2
21
6/
EP
A M
eth
od
16
0.3
)
Da
ta G
ap
Ch
eck
list
3
Rationale / Comments4
Final
Location ID1 Area Location Description
Sample
Type
Depth
(feet bgs)
Analytical Method
0.5 X X X X X X X
5 X X X X X X X
10 H H H H H H H
0.5 X X X X X X X
5 X X X X X X X
10 H H H H H H H
0.5
5 X X X X X X X
10 H H H H H H H
0.5 X X X X X X X
5 X X X X X X X
10 H H H H H H H
0.5 X X X X X X X
5 X X X X X X X
0.5 X X X X X X X
5 X X X X X X X
0.5 X X X X X X X
5 X X X X X X X
0.5 X X X X X X X
5 X X X X X X X
0.5 X X X X X X X
5 X X X X X X X
0.5
5 X X X X X X X
10 H H H H H H H
Soil
Boring√
√
8_DG-528 ESADA North of ESADA
North of ESADASoil
Boring√
8_DG-530 North of ESADASoil
Boring√
8_DG-535 ESADA Northwest of ESADA
Test
Pit/Soil
Boring
√
8_DG-531 FSDF Southeast of FSDFSoil
Boring
8_DG-527
8_DG-532 ESADA Northwest of ESADASoil
Boring
8_DG-526 ESADA
√
√
8_DG-534 ESADA Northwest of ESADA
Test
Pit/Soil
Boring
Soil
Boring√
√
8_DG-529 ESADA North of ESADASoil
Boring
√
ESADA
8_DG-533 ESADA Northwest of ESADA
Test
Pit/Soil
Boring
ESADA Northwest of ESADA Pistol Range
Characterizes the northwest portion of ESADA. Also targets historic dirt road. Bedrock anticipated ~5 feet bgs. If
deep soils encountered, sample and place on hold pending shallow results.
Stepout for dioxins, PAHs, phthalates, PCBs, and TPH at SL-022-SA8N to the northwest, PAHs, PCBs, and TPH
at ESBS0011 to the west, and dioxins, PAHs, and phthalates at SL-023-SA8N to the east. Also targets historic dirt
road and disturbed soil area. Bedrock anticipated ~10 feet bgs. Collect 10-foot sample and place on hold pending
shallow results.
Stepout for PAHs, phthalates, and TPH at ESBS0006 to the northwest and phthalates at ESBS0007 to the west.
Also targets B4370 (Storage Shed). Bedrock anticipated ~10 feet bgs. Collect 10-foot sample and place on hold
pending shallow results.
Stepout for TPH at SL-012-SA8N to the east, PAHs at ESBS0005 to the south, and dioxins, phthalates, PCBs,
mercury at SL-016-SA8N to the north. Also targets historic dirt road and soil disturbance area. Bedrock
anticipated ~5 feet bgs. If deep soils encountered, sample and place on hold pending shallow results.
Stepout for PAHs, phthalates, and TPH at ESBS0006 to the southeast, PCBs and mercury at ESBS0010 to the
northeast, and dioxins and phthalates at 10246220 to the North. Also targets historic dirt road and disturbed soil
area. Bedrock anticipated ~10 feet bgs. Collect 10-foot sample and place on hold pending shallow results.
Vertical delineation of PAHs, phthalates, and TPH at ESBS0006. Deep sample at this location not previously
analyzed for PAHs, phthalates, and TPH. Also targets historic dirt road. Bedrock anticipated ~10 feet bgs. Analyze
5-foot sample and place deep sample on hold pending results of 5-foot sample.
Same as 8_DG-533.
Conduct exploratory test pit to investigate hummocky area identified during 2008 debris survey. Location of test
pit will be based on field observation of hummocky terrain. If fill, staining, debris, or other impacts are observed,
collect sample targeting top of native soil. Bedrock anticipated ~5 feet bgs. If deep soils encountered, sample and
place on hold pending shallow results.
Characterizes hillslope west of hummocky area identified during the 2008 Debris Survey. Also targets area
adjacent to historic dirt road. Bedrock anticipated ~5 feet bgs. If deep soils encountered, sample and place on hold
pending shallow results.
Vertical delineation of PAHs in surface sample at ESBS0005 and the deeper sample collected at 4.5 feet bgs
sample had a limited analytical suite. Conduct exploratory test pit to investigate hummocky area identified during
2008 debris survey. Location of test pit will be based on field observation of hummocky terrain. If fill, staining,
debris, or other impacts are observed, collect sample targeting top of native soil. Bedrock anticipated <10 feet bgs.
Analyze 5-foot sample and place shallow and deep samples on hold pending results of 5-foot sample.
Tbl 1 SA 8 Soil SAP_080213 Subarea 8 Soil SAP
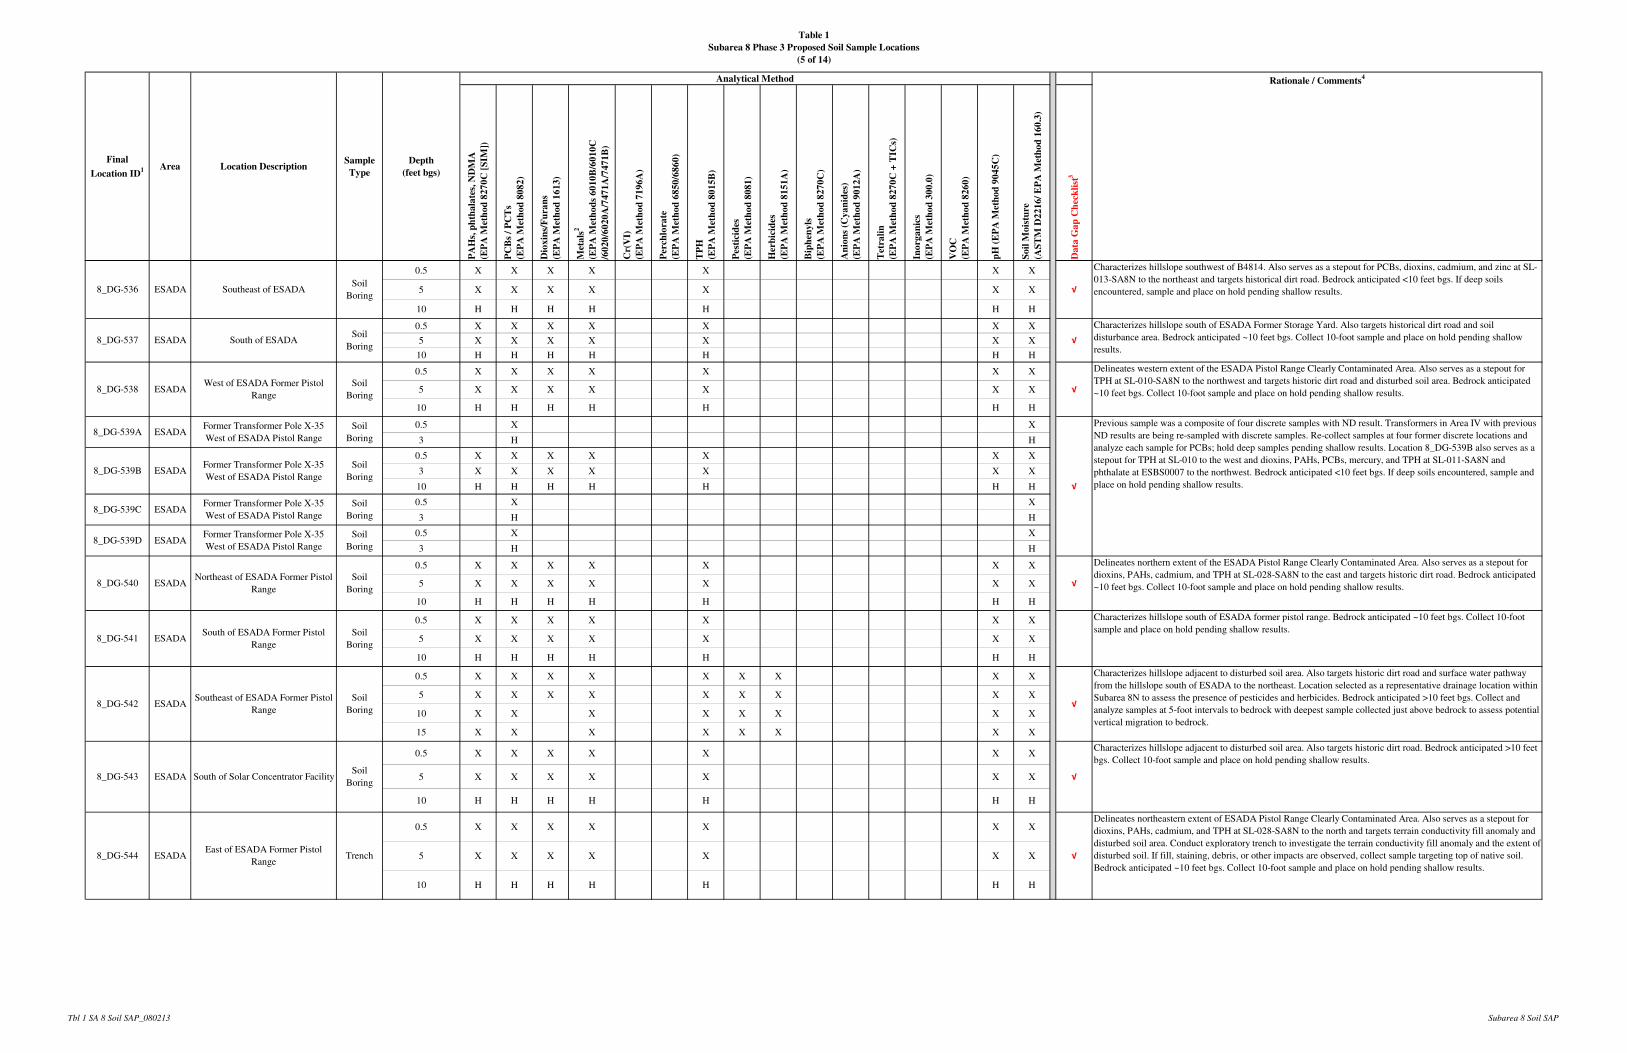
Table 1
Subarea 8 Phase 3 Proposed Soil Sample Locations
(5 of 14)
PA
Hs,
ph
tha
late
s, N
DM
A
(EP
A M
eth
od
82
70
C [
SIM
])
PC
Bs
/ P
CT
s
(EP
A M
eth
od
80
82
)
Dio
xin
s/F
ura
ns
(EP
A M
eth
od
16
13
)
Met
als
2
(EP
A M
eth
od
s 6
01
0B
/60
10
C
/60
20
/60
20
A/7
47
1A
/74
71
B)
Cr(
VI)
(EP
A M
eth
od
71
96
A)
Per
chlo
rate
(EP
A M
eth
od
68
50
/68
60
)
TP
H
(EP
A M
eth
od
80
15
B)
Pes
tici
des
(EP
A M
eth
od
80
81
)
Her
bic
ides
(EP
A M
eth
od
81
51
A)
Bip
hen
yls
(EP
A M
eth
od
82
70
C)
An
ion
s (C
ya
nid
es)
(EP
A M
eth
od
90
12
A)
Tet
rali
n
(EP
A M
eth
od
82
70
C +
TIC
s)
Ino
rga
nic
s
(EP
A M
eth
od
30
0.0
)
VO
C
(EP
A M
eth
od
82
60
)
pH
(E
PA
Met
ho
d 9
04
5C
)
So
il M
ois
ture
(AS
TM
D2
21
6/
EP
A M
eth
od
16
0.3
)
Da
ta G
ap
Ch
eck
list
3
Rationale / Comments4
Final
Location ID1 Area Location Description
Sample
Type
Depth
(feet bgs)
Analytical Method
0.5 X X X X X X X
5 X X X X X X X
10 H H H H H H H
0.5 X X X X X X X
5 X X X X X X X
10 H H H H H H H
0.5 X X X X X X X
5 X X X X X X X
10 H H H H H H H
0.5 X X
3 H H
0.5 X X X X X X X
3 X X X X X X X
10 H H H H H H H
0.5 X X
3 H H
0.5 X X
3 H H
0.5 X X X X X X X
5 X X X X X X X
10 H H H H H H H
0.5 X X X X X X X
5 X X X X X X X
10 H H H H H H H
0.5 X X X X X X X X X
5 X X X X X X X X X
10 X X X X X X X X
15 X X X X X X X X
0.5 X X X X X X X
5 X X X X X X X
10 H H H H H H H
0.5 X X X X X X X
5 X X X X X X X
10 H H H H H H H
8_DG-544 ESADAEast of ESADA Former Pistol
RangeTrench √
8_DG-540 ESADANortheast of ESADA Former Pistol
Range
Soil
Boring√
8_DG-542 ESADASoutheast of ESADA Former Pistol
Range
Soil
Boring√
√
8_DG-539D
8_DG-541 ESADASouth of ESADA Former Pistol
Range
Soil
Boring
8_DG-538 ESADAWest of ESADA Former Pistol
Range
Soil
Boring
8_DG-539B ESADA
Former Transformer Pole X-35
West of ESADA Pistol Range
Soil
Boring
Soil
Boring
8_DG-539A ESADAFormer Transformer Pole X-35
West of ESADA Pistol Range
Soil
Boring
ESADA
8_DG-537 ESADA South of ESADA
√
8_DG-539C ESADA
Soil
Boring√
Former Transformer Pole X-35
West of ESADA Pistol Range
Former Transformer Pole X-35
West of ESADA Pistol Range
Soil
Boring
8_DG-536 ESADA Southeast of ESADASoil
Boring√
Characterizes hillslope southwest of B4814. Also serves as a stepout for PCBs, dioxins, cadmium, and zinc at SL-
013-SA8N to the northeast and targets historical dirt road. Bedrock anticipated <10 feet bgs. If deep soils
encountered, sample and place on hold pending shallow results.
Characterizes hillslope south of ESADA Former Storage Yard. Also targets historical dirt road and soil
disturbance area. Bedrock anticipated ~10 feet bgs. Collect 10-foot sample and place on hold pending shallow
results.
Delineates western extent of the ESADA Pistol Range Clearly Contaminated Area. Also serves as a stepout for
TPH at SL-010-SA8N to the northwest and targets historic dirt road and disturbed soil area. Bedrock anticipated
~10 feet bgs. Collect 10-foot sample and place on hold pending shallow results.
Delineates northern extent of the ESADA Pistol Range Clearly Contaminated Area. Also serves as a stepout for
dioxins, PAHs, cadmium, and TPH at SL-028-SA8N to the east and targets historic dirt road. Bedrock anticipated
~10 feet bgs. Collect 10-foot sample and place on hold pending shallow results.
Delineates northeastern extent of ESADA Pistol Range Clearly Contaminated Area. Also serves as a stepout for
dioxins, PAHs, cadmium, and TPH at SL-028-SA8N to the north and targets terrain conductivity fill anomaly and
disturbed soil area. Conduct exploratory trench to investigate the terrain conductivity fill anomaly and the extent of
disturbed soil. If fill, staining, debris, or other impacts are observed, collect sample targeting top of native soil.
Bedrock anticipated ~10 feet bgs. Collect 10-foot sample and place on hold pending shallow results.
Previous sample was a composite of four discrete samples with ND result. Transformers in Area IV with previous
ND results are being re-sampled with discrete samples. Re-collect samples at four former discrete locations and
analyze each sample for PCBs; hold deep samples pending shallow results. Location 8_DG-539B also serves as a
stepout for TPH at SL-010 to the west and dioxins, PAHs, PCBs, mercury, and TPH at SL-011-SA8N and
phthalate at ESBS0007 to the northwest. Bedrock anticipated <10 feet bgs. If deep soils encountered, sample and
place on hold pending shallow results.
Characterizes hillslope adjacent to disturbed soil area. Also targets historic dirt road and surface water pathway
from the hillslope south of ESADA to the northeast. Location selected as a representative drainage location within
Subarea 8N to assess the presence of pesticides and herbicides. Bedrock anticipated >10 feet bgs. Collect and
analyze samples at 5-foot intervals to bedrock with deepest sample collected just above bedrock to assess potential
vertical migration to bedrock.
Characterizes hillslope south of ESADA former pistol range. Bedrock anticipated ~10 feet bgs. Collect 10-foot
sample and place on hold pending shallow results.
√
Characterizes hillslope adjacent to disturbed soil area. Also targets historic dirt road. Bedrock anticipated >10 feet
bgs. Collect 10-foot sample and place on hold pending shallow results.
8_DG-543 ESADA South of Solar Concentrator FacilitySoil
Boring
Tbl 1 SA 8 Soil SAP_080213 Subarea 8 Soil SAP
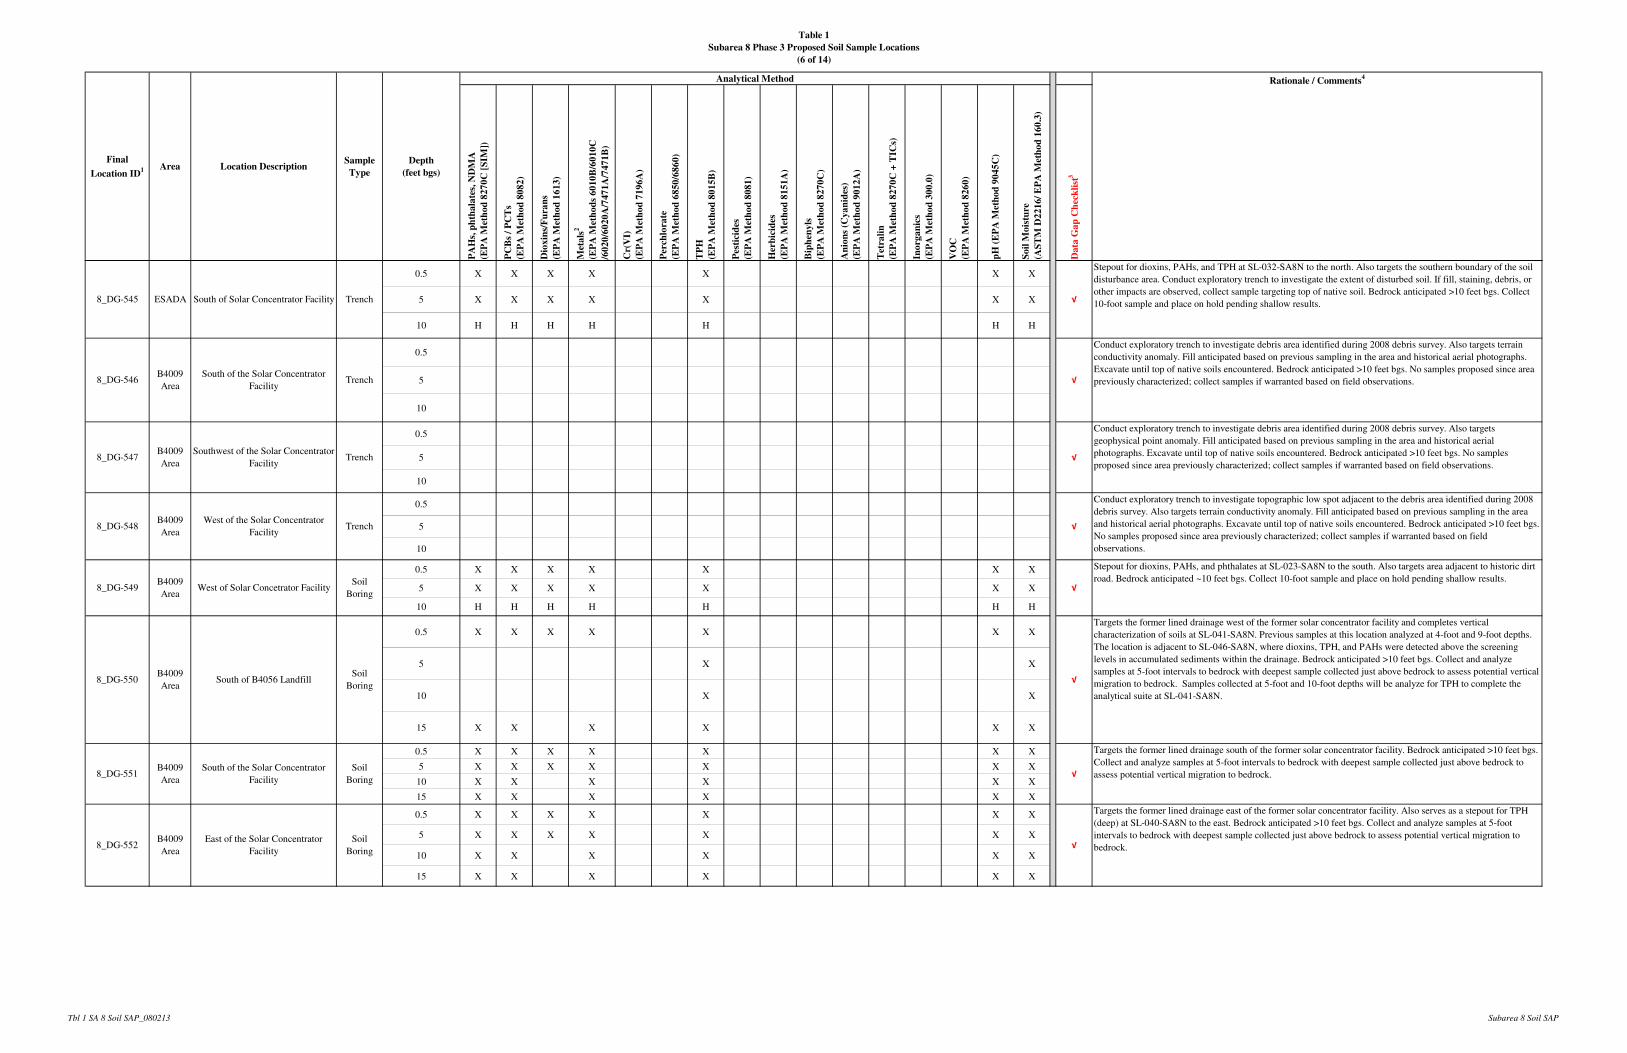
Table 1
Subarea 8 Phase 3 Proposed Soil Sample Locations
(6 of 14)
PA
Hs,
ph
tha
late
s, N
DM
A
(EP
A M
eth
od
82
70
C [
SIM
])
PC
Bs
/ P
CT
s
(EP
A M
eth
od
80
82
)
Dio
xin
s/F
ura
ns
(EP
A M
eth
od
16
13
)
Met
als
2
(EP
A M
eth
od
s 6
01
0B
/60
10
C
/60
20
/60
20
A/7
47
1A
/74
71
B)
Cr(
VI)
(EP
A M
eth
od
71
96
A)
Per
chlo
rate
(EP
A M
eth
od
68
50
/68
60
)
TP
H
(EP
A M
eth
od
80
15
B)
Pes
tici
des
(EP
A M
eth
od
80
81
)
Her
bic
ides
(EP
A M
eth
od
81
51
A)
Bip
hen
yls
(EP
A M
eth
od
82
70
C)
An
ion
s (C
ya
nid
es)
(EP
A M
eth
od
90
12
A)
Tet
rali
n
(EP
A M
eth
od
82
70
C +
TIC
s)
Ino
rga
nic
s
(EP
A M
eth
od
30
0.0
)
VO
C
(EP
A M
eth
od
82
60
)
pH
(E
PA
Met
ho
d 9
04
5C
)
So
il M
ois
ture
(AS
TM
D2
21
6/
EP
A M
eth
od
16
0.3
)
Da
ta G
ap
Ch
eck
list
3
Rationale / Comments4
Final
Location ID1 Area Location Description
Sample
Type
Depth
(feet bgs)
Analytical Method
0.5 X X X X X X X
5 X X X X X X X
10 H H H H H H H
0.5
5
10
0.5
5
10
0.5
5
10
0.5 X X X X X X X
5 X X X X X X X
10 H H H H H H H
0.5 X X X X X X X
5 X X
10 X X
15 X X X X X X
0.5 X X X X X X X
5 X X X X X X X
10 X X X X X X
15 X X X X X X
0.5 X X X X X X X
5 X X X X X X X
10 X X X X X X
15 X X X X X X
B4009
Area
Southwest of the Solar Concentrator
FacilityTrench √
South of the Solar Concentrator
Facility
West of Solar Concetrator FacilitySoil
Boring√
√
√
√
Conduct exploratory trench to investigate topographic low spot adjacent to the debris area identified during 2008
debris survey. Also targets terrain conductivity anomaly. Fill anticipated based on previous sampling in the area
and historical aerial photographs. Excavate until top of native soils encountered. Bedrock anticipated >10 feet bgs.
No samples proposed since area previously characterized; collect samples if warranted based on field
observations.
B4009
Area
West of the Solar Concentrator
FacilityTrench √
B4009
Area
8_DG-547
8_DG-552
8_DG-549
8_DG-548
8_DG-551
8_DG-546B4009
Area
South of the Solar Concentrator
FacilityTrench √
Stepout for dioxins, PAHs, and TPH at SL-032-SA8N to the north. Also targets the southern boundary of the soil
disturbance area. Conduct exploratory trench to investigate the extent of disturbed soil. If fill, staining, debris, or
other impacts are observed, collect sample targeting top of native soil. Bedrock anticipated >10 feet bgs. Collect
10-foot sample and place on hold pending shallow results.
Conduct exploratory trench to investigate debris area identified during 2008 debris survey. Also targets terrain
conductivity anomaly. Fill anticipated based on previous sampling in the area and historical aerial photographs.
Excavate until top of native soils encountered. Bedrock anticipated >10 feet bgs. No samples proposed since area
previously characterized; collect samples if warranted based on field observations.
Conduct exploratory trench to investigate debris area identified during 2008 debris survey. Also targets
geophysical point anomaly. Fill anticipated based on previous sampling in the area and historical aerial
photographs. Excavate until top of native soils encountered. Bedrock anticipated >10 feet bgs. No samples
proposed since area previously characterized; collect samples if warranted based on field observations.
Stepout for dioxins, PAHs, and phthalates at SL-023-SA8N to the south. Also targets area adjacent to historic dirt
road. Bedrock anticipated ~10 feet bgs. Collect 10-foot sample and place on hold pending shallow results.
√
Targets the former lined drainage west of the former solar concentrator facility and completes vertical
characterization of soils at SL-041-SA8N. Previous samples at this location analyzed at 4-foot and 9-foot depths.
The location is adjacent to SL-046-SA8N, where dioxins, TPH, and PAHs were detected above the screening
levels in accumulated sediments within the drainage. Bedrock anticipated >10 feet bgs. Collect and analyze
samples at 5-foot intervals to bedrock with deepest sample collected just above bedrock to assess potential vertical
migration to bedrock. Samples collected at 5-foot and 10-foot depths will be analyze for TPH to complete the
analytical suite at SL-041-SA8N.
8_DG-550
Targets the former lined drainage south of the former solar concentrator facility. Bedrock anticipated >10 feet bgs.
Collect and analyze samples at 5-foot intervals to bedrock with deepest sample collected just above bedrock to
assess potential vertical migration to bedrock.
Targets the former lined drainage east of the former solar concentrator facility. Also serves as a stepout for TPH
(deep) at SL-040-SA8N to the east. Bedrock anticipated >10 feet bgs. Collect and analyze samples at 5-foot
intervals to bedrock with deepest sample collected just above bedrock to assess potential vertical migration to
bedrock.
B4009
AreaSouth of B4056 Landfill
Soil
Boring
8_DG-545 ESADA South of Solar Concentrator Facility Trench
B4009
Area
Soil
Boring
B4009
Area
East of the Solar Concentrator
Facility
Soil
Boring
Tbl 1 SA 8 Soil SAP_080213 Subarea 8 Soil SAP
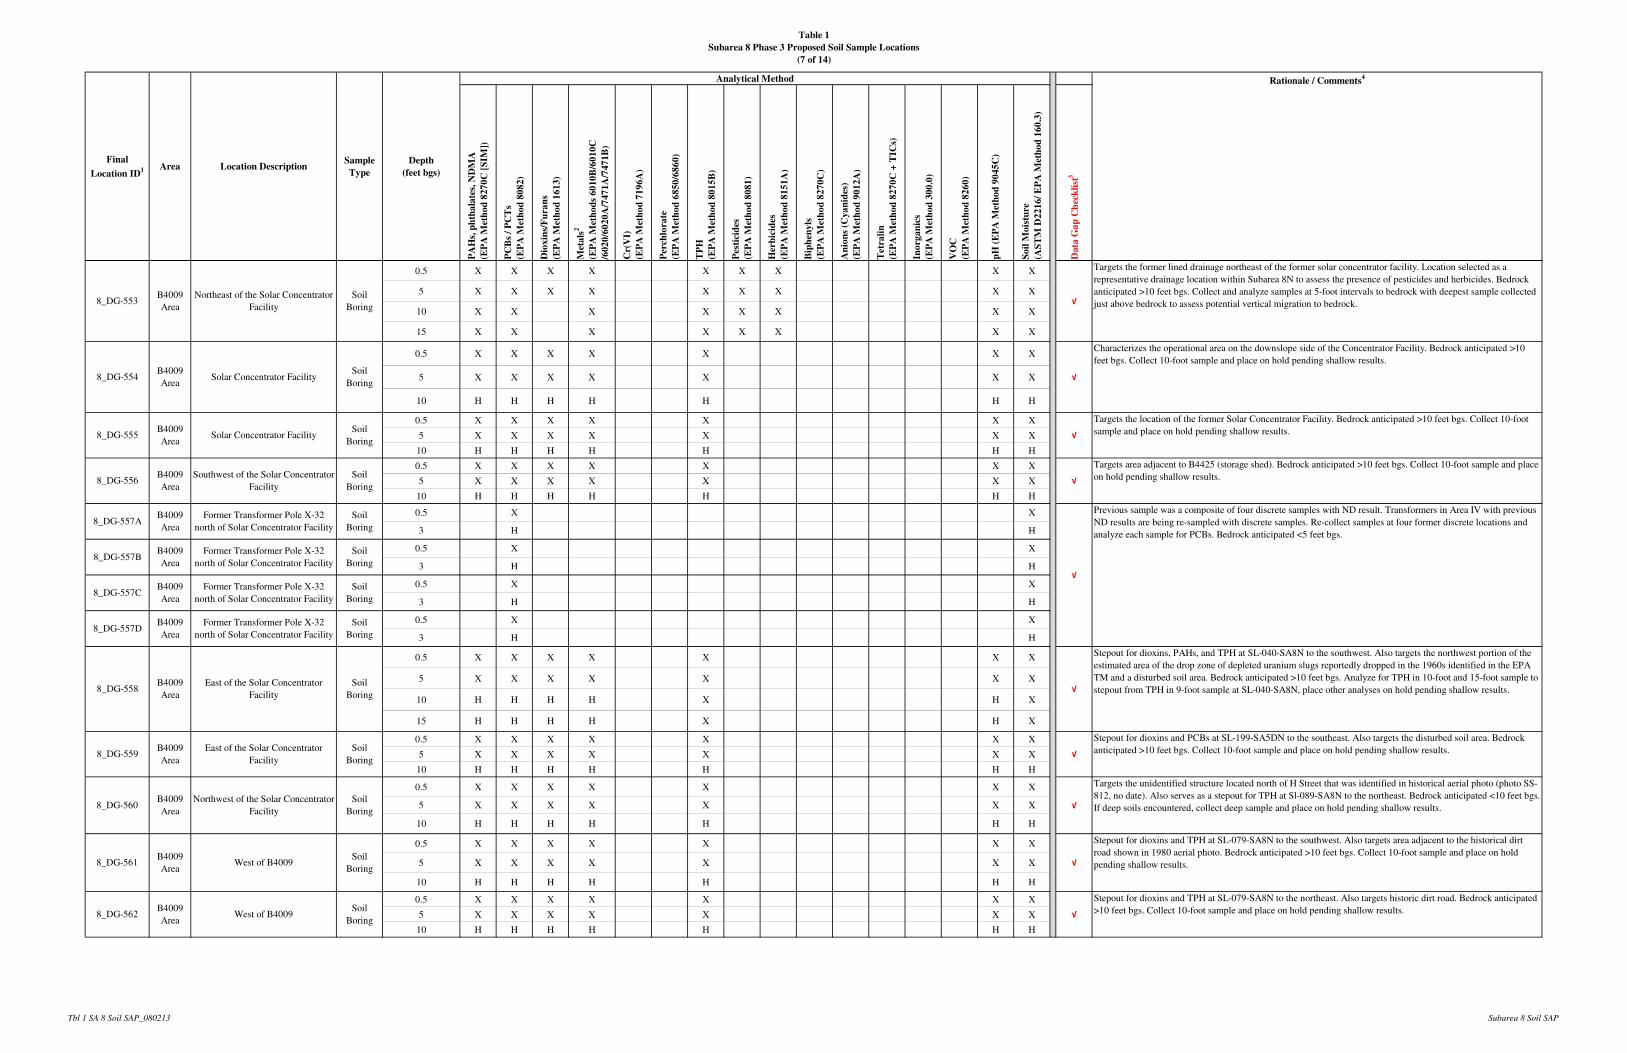
Table 1
Subarea 8 Phase 3 Proposed Soil Sample Locations
(7 of 14)
PA
Hs,
ph
tha
late
s, N
DM
A
(EP
A M
eth
od
82
70
C [
SIM
])
PC
Bs
/ P
CT
s
(EP
A M
eth
od
80
82
)
Dio
xin
s/F
ura
ns
(EP
A M
eth
od
16
13
)
Met
als
2
(EP
A M
eth
od
s 6
01
0B
/60
10
C
/60
20
/60
20
A/7
47
1A
/74
71
B)
Cr(
VI)
(EP
A M
eth
od
71
96
A)
Per
chlo
rate
(EP
A M
eth
od
68
50
/68
60
)
TP
H
(EP
A M
eth
od
80
15
B)
Pes
tici
des
(EP
A M
eth
od
80
81
)
Her
bic
ides
(EP
A M
eth
od
81
51
A)
Bip
hen
yls
(EP
A M
eth
od
82
70
C)
An
ion
s (C
ya
nid
es)
(EP
A M
eth
od
90
12
A)
Tet
rali
n
(EP
A M
eth
od
82
70
C +
TIC
s)
Ino
rga
nic
s
(EP
A M
eth
od
30
0.0
)
VO
C
(EP
A M
eth
od
82
60
)
pH
(E
PA
Met
ho
d 9
04
5C
)
So
il M
ois
ture
(AS
TM
D2
21
6/
EP
A M
eth
od
16
0.3
)
Da
ta G
ap
Ch
eck
list
3
Rationale / Comments4
Final
Location ID1 Area Location Description
Sample
Type
Depth
(feet bgs)
Analytical Method
0.5 X X X X X X X X X
5 X X X X X X X X X
10 X X X X X X X X
15 X X X X X X X X
0.5 X X X X X X X
5 X X X X X X X
10 H H H H H H H
0.5 X X X X X X X
5 X X X X X X X
10 H H H H H H H
0.5 X X X X X X X
5 X X X X X X X
10 H H H H H H H
0.5 X X
3 H H
0.5 X X
3 H H
0.5 X X
3 H H
0.5 X X
3 H H
0.5 X X X X X X X
5 X X X X X X X
10 H H H H X H X
15 H H H H X H X
0.5 X X X X X X X
5 X X X X X X X
10 H H H H H H H
0.5 X X X X X X X
5 X X X X X X X
10 H H H H H H H
0.5 X X X X X X X
5 X X X X X X X
10 H H H H H H H
0.5 X X X X X X X
5 X X X X X X X
10 H H H H H H H
8_DG-557AB4009
Area
Northeast of the Solar Concentrator
Facility
Soil
Boring
8_DG-557CB4009
Area
Former Transformer Pole X-32
north of Solar Concentrator Facility
Soil
Boring
Former Transformer Pole X-32
north of Solar Concentrator Facility
Soil
Boring
8_DG-557BB4009
Area
B4009
Area
8_DG-555
8_DG-557DB4009
Area
Former Transformer Pole X-32
north of Solar Concentrator Facility
East of the Solar Concentrator
Facility
Soil
Boring√
Soil
Boring√
Soil
Boring
West of B4009
8_DG-553
8_DG-556
8_DG-562B4009
Area
8_DG-559B4009
Area
8_DG-560B4009
Area
8_DG-558
B4009
Area
B4009
Area
East of the Solar Concentrator
Facility
Soil
Boring√
West of B4009Soil
Boring√
B4009
AreaSolar Concentrator Facility
Soil
Boring√
Southwest of the Solar Concentrator
Facility
Soil
Boring√
√
Northwest of the Solar Concentrator
Facility
Soil
Boring√
Former Transformer Pole X-32
north of Solar Concentrator Facility
Soil
Boring
Stepout for dioxins and TPH at SL-079-SA8N to the southwest. Also targets area adjacent to the historical dirt
road shown in 1980 aerial photo. Bedrock anticipated >10 feet bgs. Collect 10-foot sample and place on hold
pending shallow results.
Stepout for dioxins and TPH at SL-079-SA8N to the northeast. Also targets historic dirt road. Bedrock anticipated
>10 feet bgs. Collect 10-foot sample and place on hold pending shallow results.
8_DG-561B4009
Area
Stepout for dioxins, PAHs, and TPH at SL-040-SA8N to the southwest. Also targets the northwest portion of the
estimated area of the drop zone of depleted uranium slugs reportedly dropped in the 1960s identified in the EPA
TM and a disturbed soil area. Bedrock anticipated >10 feet bgs. Analyze for TPH in 10-foot and 15-foot sample to
stepout from TPH in 9-foot sample at SL-040-SA8N, place other analyses on hold pending shallow results.
Previous sample was a composite of four discrete samples with ND result. Transformers in Area IV with previous
ND results are being re-sampled with discrete samples. Re-collect samples at four former discrete locations and
analyze each sample for PCBs. Bedrock anticipated <5 feet bgs.
Stepout for dioxins and PCBs at SL-199-SA5DN to the southeast. Also targets the disturbed soil area. Bedrock
anticipated >10 feet bgs. Collect 10-foot sample and place on hold pending shallow results.
Targets the unidentified structure located north of H Street that was identified in historical aerial photo (photo SS-
812, no date). Also serves as a stepout for TPH at Sl-089-SA8N to the northeast. Bedrock anticipated <10 feet bgs.
If deep soils encountered, collect deep sample and place on hold pending shallow results.
Targets the location of the former Solar Concentrator Facility. Bedrock anticipated >10 feet bgs. Collect 10-foot
sample and place on hold pending shallow results.
Targets area adjacent to B4425 (storage shed). Bedrock anticipated >10 feet bgs. Collect 10-foot sample and place
on hold pending shallow results.
8_DG-554B4009
AreaSolar Concentrator Facility
Soil
Boring√
Characterizes the operational area on the downslope side of the Concentrator Facility. Bedrock anticipated >10
feet bgs. Collect 10-foot sample and place on hold pending shallow results.
√
Targets the former lined drainage northeast of the former solar concentrator facility. Location selected as a
representative drainage location within Subarea 8N to assess the presence of pesticides and herbicides. Bedrock
anticipated >10 feet bgs. Collect and analyze samples at 5-foot intervals to bedrock with deepest sample collected
just above bedrock to assess potential vertical migration to bedrock.
Tbl 1 SA 8 Soil SAP_080213 Subarea 8 Soil SAP
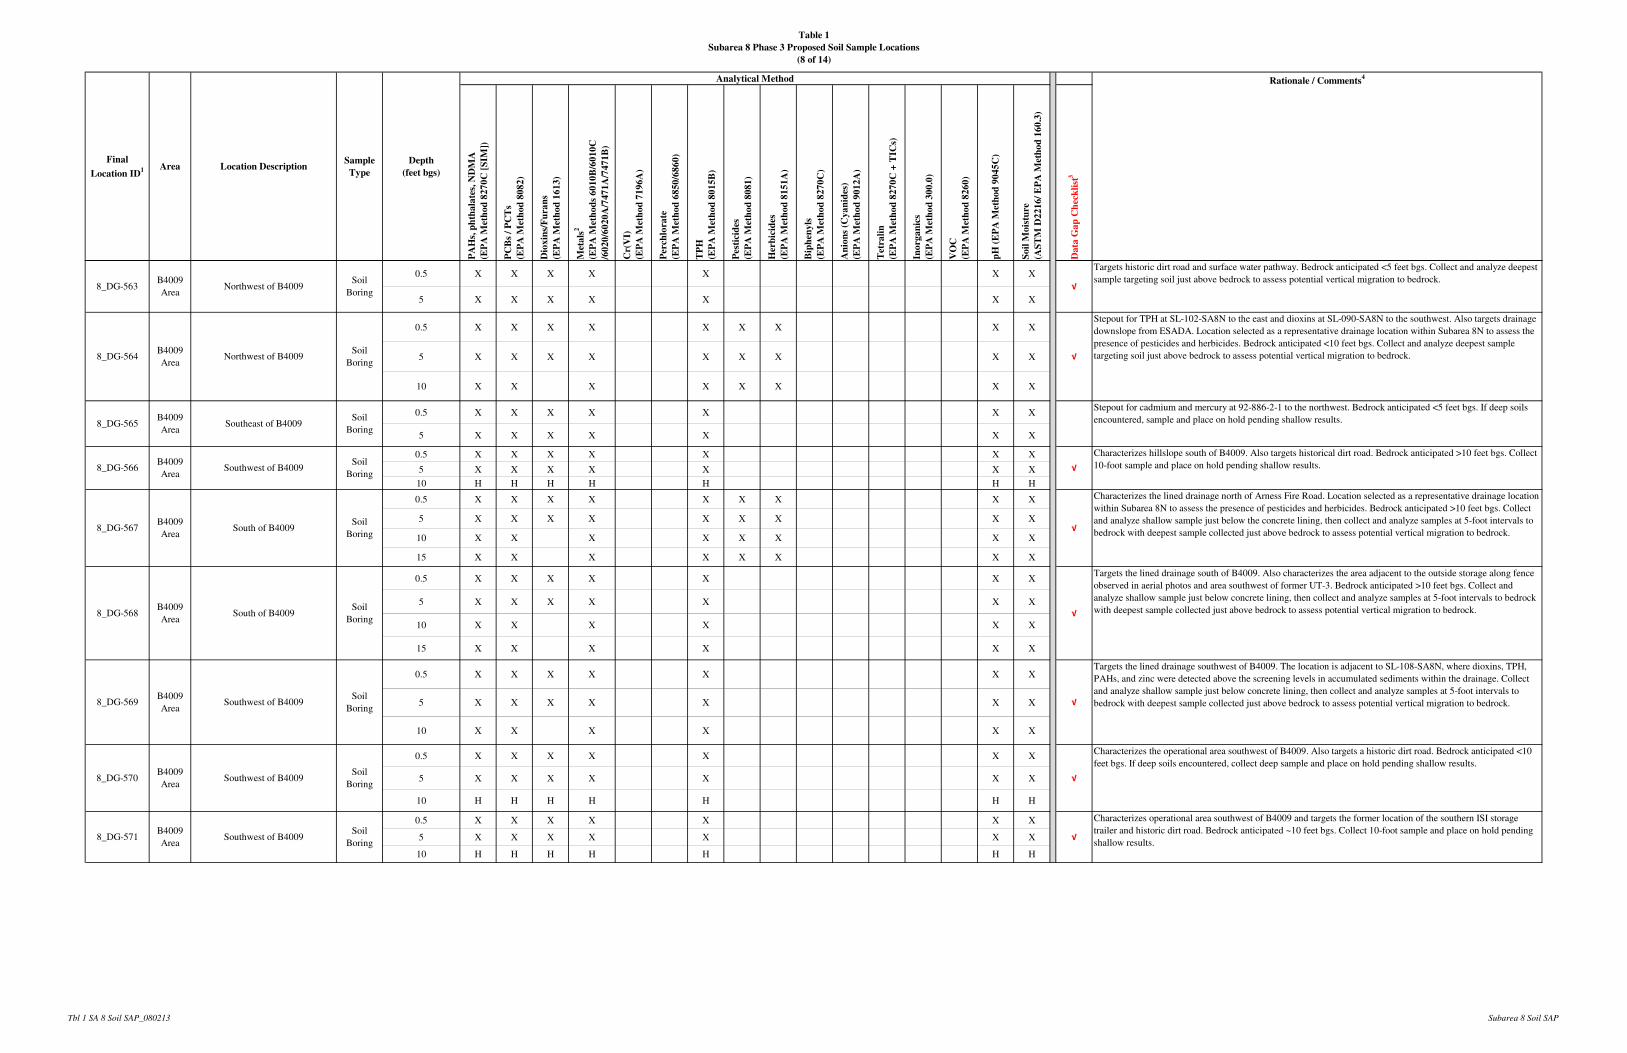
Table 1
Subarea 8 Phase 3 Proposed Soil Sample Locations
(8 of 14)
PA
Hs,
ph
tha
late
s, N
DM
A
(EP
A M
eth
od
82
70
C [
SIM
])
PC
Bs
/ P
CT
s
(EP
A M
eth
od
80
82
)
Dio
xin
s/F
ura
ns
(EP
A M
eth
od
16
13
)
Met
als
2
(EP
A M
eth
od
s 6
01
0B
/60
10
C
/60
20
/60
20
A/7
47
1A
/74
71
B)
Cr(
VI)
(EP
A M
eth
od
71
96
A)
Per
chlo
rate
(EP
A M
eth
od
68
50
/68
60
)
TP
H
(EP
A M
eth
od
80
15
B)
Pes
tici
des
(EP
A M
eth
od
80
81
)
Her
bic
ides
(EP
A M
eth
od
81
51
A)
Bip
hen
yls
(EP
A M
eth
od
82
70
C)
An
ion
s (C
ya
nid
es)
(EP
A M
eth
od
90
12
A)
Tet
rali
n
(EP
A M
eth
od
82
70
C +
TIC
s)
Ino
rga
nic
s
(EP
A M
eth
od
30
0.0
)
VO
C
(EP
A M
eth
od
82
60
)
pH
(E
PA
Met
ho
d 9
04
5C
)
So
il M
ois
ture
(AS
TM
D2
21
6/
EP
A M
eth
od
16
0.3
)
Da
ta G
ap
Ch
eck
list
3
Rationale / Comments4
Final
Location ID1 Area Location Description
Sample
Type
Depth
(feet bgs)
Analytical Method
0.5 X X X X X X X
5 X X X X X X X
0.5 X X X X X X X X X
5 X X X X X X X X X
10 X X X X X X X X
0.5 X X X X X X X
5 X X X X X X X
0.5 X X X X X X X
5 X X X X X X X
10 H H H H H H H
0.5 X X X X X X X X X
5 X X X X X X X X X
10 X X X X X X X X
15 X X X X X X X X
0.5 X X X X X X X
5 X X X X X X X
10 X X X X X X
15 X X X X X X
0.5 X X X X X X X
5 X X X X X X X
10 X X X X X X
0.5 X X X X X X X
5 X X X X X X X
10 H H H H H H H
0.5 X X X X X X X
5 X X X X X X X
10 H H H H H H H
South of B4009 Soil
Boring√
8_DG-569B4009
Area
8_DG-567B4009
Area
8_DG-563B4009
Area
8_DG-571B4009
Area
Southwest of B4009 Soil
Boring√
Southwest of B4009Soil
Boring√
South of B4009Soil
Boring√
Soil
Boring√
Northwest of B4009Soil
Boring√
Northwest of B4009
Southwest of B4009Soil
Boring√
Soil
Boring√
8_DG-565B4009
AreaSoutheast of B4009
Soil
Boring
8_DG-564B4009
Area
Stepout for TPH at SL-102-SA8N to the east and dioxins at SL-090-SA8N to the southwest. Also targets drainage
downslope from ESADA. Location selected as a representative drainage location within Subarea 8N to assess the
presence of pesticides and herbicides. Bedrock anticipated <10 feet bgs. Collect and analyze deepest sample
targeting soil just above bedrock to assess potential vertical migration to bedrock.
8_DG-568
8_DG-566B4009
AreaSouthwest of B4009
Targets the lined drainage southwest of B4009. The location is adjacent to SL-108-SA8N, where dioxins, TPH,
PAHs, and zinc were detected above the screening levels in accumulated sediments within the drainage. Collect
and analyze shallow sample just below concrete lining, then collect and analyze samples at 5-foot intervals to
bedrock with deepest sample collected just above bedrock to assess potential vertical migration to bedrock.
Stepout for cadmium and mercury at 92-886-2-1 to the northwest. Bedrock anticipated <5 feet bgs. If deep soils
encountered, sample and place on hold pending shallow results.
Targets historic dirt road and surface water pathway. Bedrock anticipated <5 feet bgs. Collect and analyze deepest
sample targeting soil just above bedrock to assess potential vertical migration to bedrock.
Characterizes hillslope south of B4009. Also targets historical dirt road. Bedrock anticipated >10 feet bgs. Collect
10-foot sample and place on hold pending shallow results.
Targets the lined drainage south of B4009. Also characterizes the area adjacent to the outside storage along fence
observed in aerial photos and area southwest of former UT-3. Bedrock anticipated >10 feet bgs. Collect and
analyze shallow sample just below concrete lining, then collect and analyze samples at 5-foot intervals to bedrock
with deepest sample collected just above bedrock to assess potential vertical migration to bedrock.
Characterizes the lined drainage north of Arness Fire Road. Location selected as a representative drainage location
within Subarea 8N to assess the presence of pesticides and herbicides. Bedrock anticipated >10 feet bgs. Collect
and analyze shallow sample just below the concrete lining, then collect and analyze samples at 5-foot intervals to
bedrock with deepest sample collected just above bedrock to assess potential vertical migration to bedrock.
B4009
Area
8_DG-570B4009
Area
Characterizes operational area southwest of B4009 and targets the former location of the southern ISI storage
trailer and historic dirt road. Bedrock anticipated ~10 feet bgs. Collect 10-foot sample and place on hold pending
shallow results.
Characterizes the operational area southwest of B4009. Also targets a historic dirt road. Bedrock anticipated <10
feet bgs. If deep soils encountered, collect deep sample and place on hold pending shallow results.
Tbl 1 SA 8 Soil SAP_080213 Subarea 8 Soil SAP
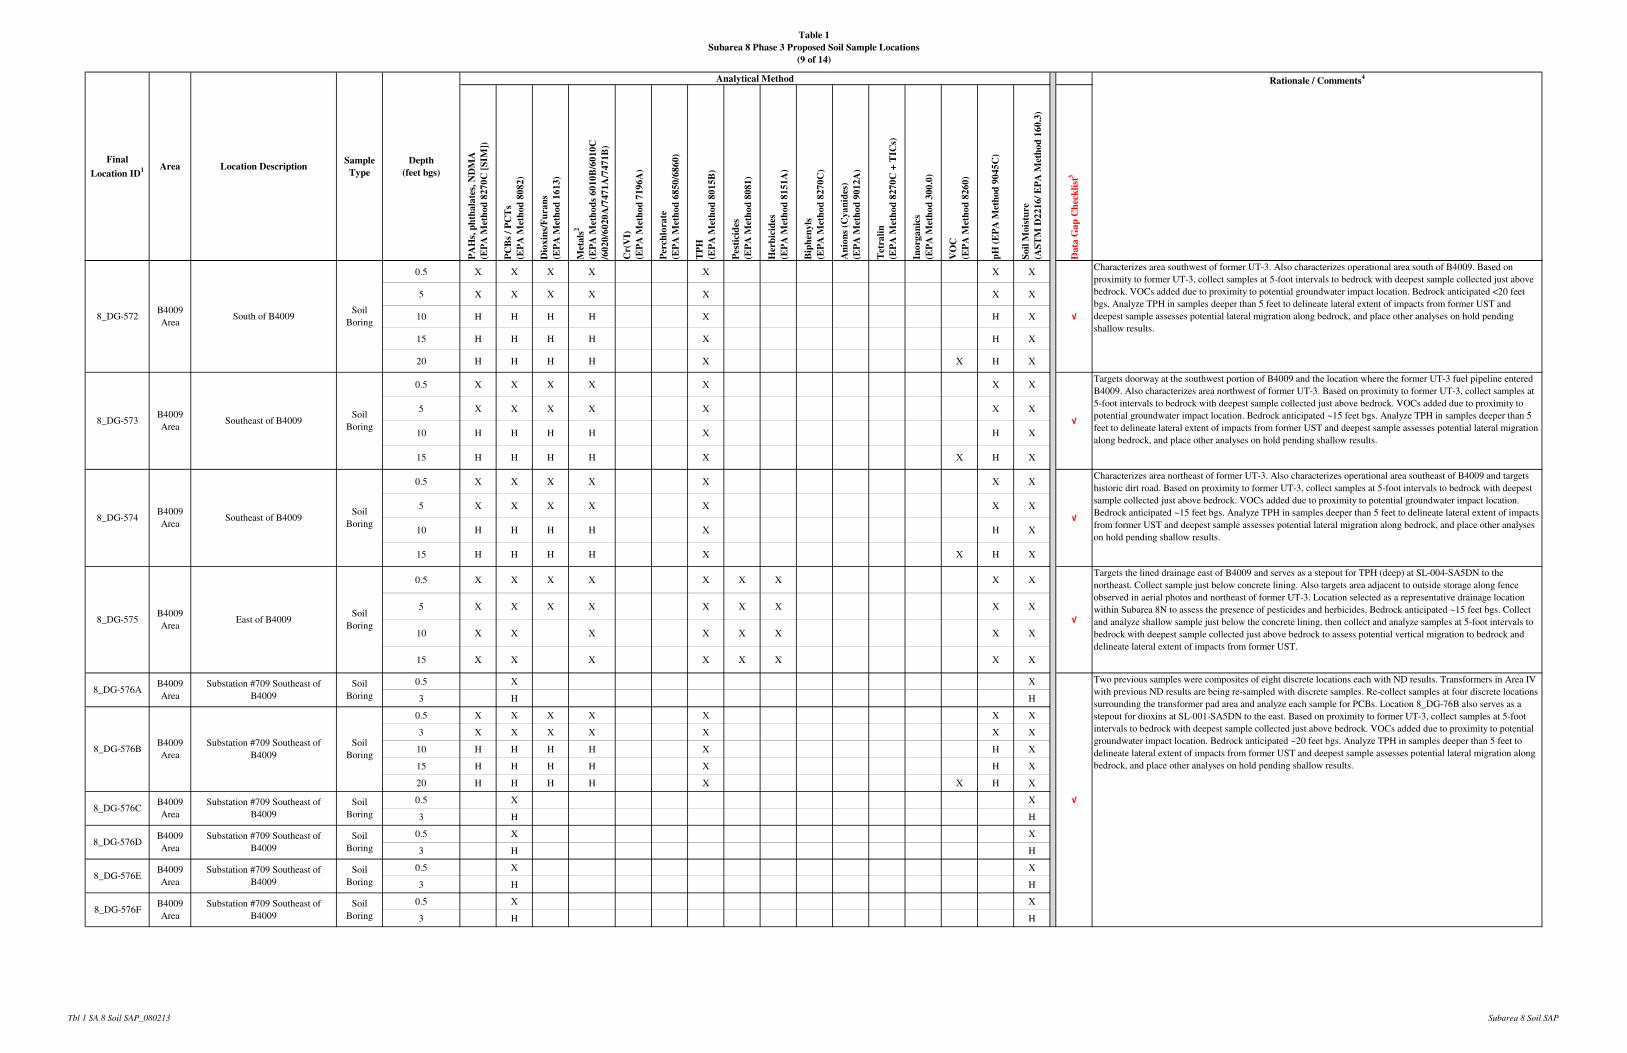
Table 1
Subarea 8 Phase 3 Proposed Soil Sample Locations
(9 of 14)
PA
Hs,
ph
tha
late
s, N
DM
A
(EP
A M
eth
od
82
70
C [
SIM
])
PC
Bs
/ P
CT
s
(EP
A M
eth
od
80
82
)
Dio
xin
s/F
ura
ns
(EP
A M
eth
od
16
13
)
Met
als
2
(EP
A M
eth
od
s 6
01
0B
/60
10
C
/60
20
/60
20
A/7
47
1A
/74
71
B)
Cr(
VI)
(EP
A M
eth
od
71
96
A)
Per
chlo
rate
(EP
A M
eth
od
68
50
/68
60
)
TP
H
(EP
A M
eth
od
80
15
B)
Pes
tici
des
(EP
A M
eth
od
80
81
)
Her
bic
ides
(EP
A M
eth
od
81
51
A)
Bip
hen
yls
(EP
A M
eth
od
82
70
C)
An
ion
s (C
ya
nid
es)
(EP
A M
eth
od
90
12
A)
Tet
rali
n
(EP
A M
eth
od
82
70
C +
TIC
s)
Ino
rga
nic
s
(EP
A M
eth
od
30
0.0
)
VO
C
(EP
A M
eth
od
82
60
)
pH
(E
PA
Met
ho
d 9
04
5C
)
So
il M
ois
ture
(AS
TM
D2
21
6/
EP
A M
eth
od
16
0.3
)
Da
ta G
ap
Ch
eck
list
3
Rationale / Comments4
Final
Location ID1 Area Location Description
Sample
Type
Depth
(feet bgs)
Analytical Method
0.5 X X X X X X X
5 X X X X X X X
10 H H H H X H X
15 H H H H X H X
20 H H H H X X H X
0.5 X X X X X X X
5 X X X X X X X
10 H H H H X H X
15 H H H H X X H X
0.5 X X X X X X X
5 X X X X X X X
10 H H H H X H X
15 H H H H X X H X
0.5 X X X X X X X X X
5 X X X X X X X X X
10 X X X X X X X X
15 X X X X X X X X
0.5 X X
3 H H
0.5 X X X X X X X
3 X X X X X X X
10 H H H H X H X
15 H H H H X H X
20 H H H H X X H X
0.5 X X
3 H H
0.5 X X
3 H H
0.5 X X
3 H H
0.5 X X
3 H H
B4009
Area
Substation #709 Southeast of
B4009
Soil
Boring
8_DG-576D
8_DG-576EB4009
Area
Substation #709 Southeast of
B4009
Soil
Boring
Soil
Boring
Soil
Boring
B4009
Area
Substation #709 Southeast of
B4009
Soil
Boring
Targets doorway at the southwest portion of B4009 and the location where the former UT-3 fuel pipeline entered
B4009. Also characterizes area northwest of former UT-3. Based on proximity to former UT-3, collect samples at
5-foot intervals to bedrock with deepest sample collected just above bedrock. VOCs added due to proximity to
potential groundwater impact location. Bedrock anticipated ~15 feet bgs. Analyze TPH in samples deeper than 5
feet to delineate lateral extent of impacts from former UST and deepest sample assesses potential lateral migration
along bedrock, and place other analyses on hold pending shallow results.
B4009
Area
B4009
Area
8_DG-572B4009
Area
B4009
Area
8_DG-576A
8_DG-576B
8_DG-576F
8_DG-576CSubstation #709 Southeast of
B4009
South of B4009Soil
Boring√
Southeast of B4009
Southeast of B4009Soil
Boring√
Substation #709 Southeast of
B4009
8_DG-575B4009
AreaEast of B4009
Soil
Boring√
8_DG-573
8_DG-574Soil
Boring√
Targets the lined drainage east of B4009 and serves as a stepout for TPH (deep) at SL-004-SA5DN to the
northeast. Collect sample just below concrete lining. Also targets area adjacent to outside storage along fence
observed in aerial photos and northeast of former UT-3. Location selected as a representative drainage location
within Subarea 8N to assess the presence of pesticides and herbicides. Bedrock anticipated ~15 feet bgs. Collect
and analyze shallow sample just below the concrete lining, then collect and analyze samples at 5-foot intervals to
bedrock with deepest sample collected just above bedrock to assess potential vertical migration to bedrock and
delineate lateral extent of impacts from former UST.
Characterizes area northeast of former UT-3. Also characterizes operational area southeast of B4009 and targets
historic dirt road. Based on proximity to former UT-3, collect samples at 5-foot intervals to bedrock with deepest
sample collected just above bedrock. VOCs added due to proximity to potential groundwater impact location.
Bedrock anticipated ~15 feet bgs. Analyze TPH in samples deeper than 5 feet to delineate lateral extent of impacts
from former UST and deepest sample assesses potential lateral migration along bedrock, and place other analyses
on hold pending shallow results.
Characterizes area southwest of former UT-3. Also characterizes operational area south of B4009. Based on
proximity to former UT-3, collect samples at 5-foot intervals to bedrock with deepest sample collected just above
bedrock. VOCs added due to proximity to potential groundwater impact location. Bedrock anticipated <20 feet
bgs. Analyze TPH in samples deeper than 5 feet to delineate lateral extent of impacts from former UST and
deepest sample assesses potential lateral migration along bedrock, and place other analyses on hold pending
shallow results.
Two previous samples were composites of eight discrete locations each with ND results. Transformers in Area IV
with previous ND results are being re-sampled with discrete samples. Re-collect samples at four discrete locations
surrounding the transformer pad area and analyze each sample for PCBs. Location 8_DG-76B also serves as a
stepout for dioxins at SL-001-SA5DN to the east. Based on proximity to former UT-3, collect samples at 5-foot
intervals to bedrock with deepest sample collected just above bedrock. VOCs added due to proximity to potential
groundwater impact location. Bedrock anticipated ~20 feet bgs. Analyze TPH in samples deeper than 5 feet to
delineate lateral extent of impacts from former UST and deepest sample assesses potential lateral migration along
bedrock, and place other analyses on hold pending shallow results.
√
B4009
Area
Substation #709 Southeast of
B4009
Soil
Boring
B4009
Area
Tbl 1 SA 8 Soil SAP_080213 Subarea 8 Soil SAP
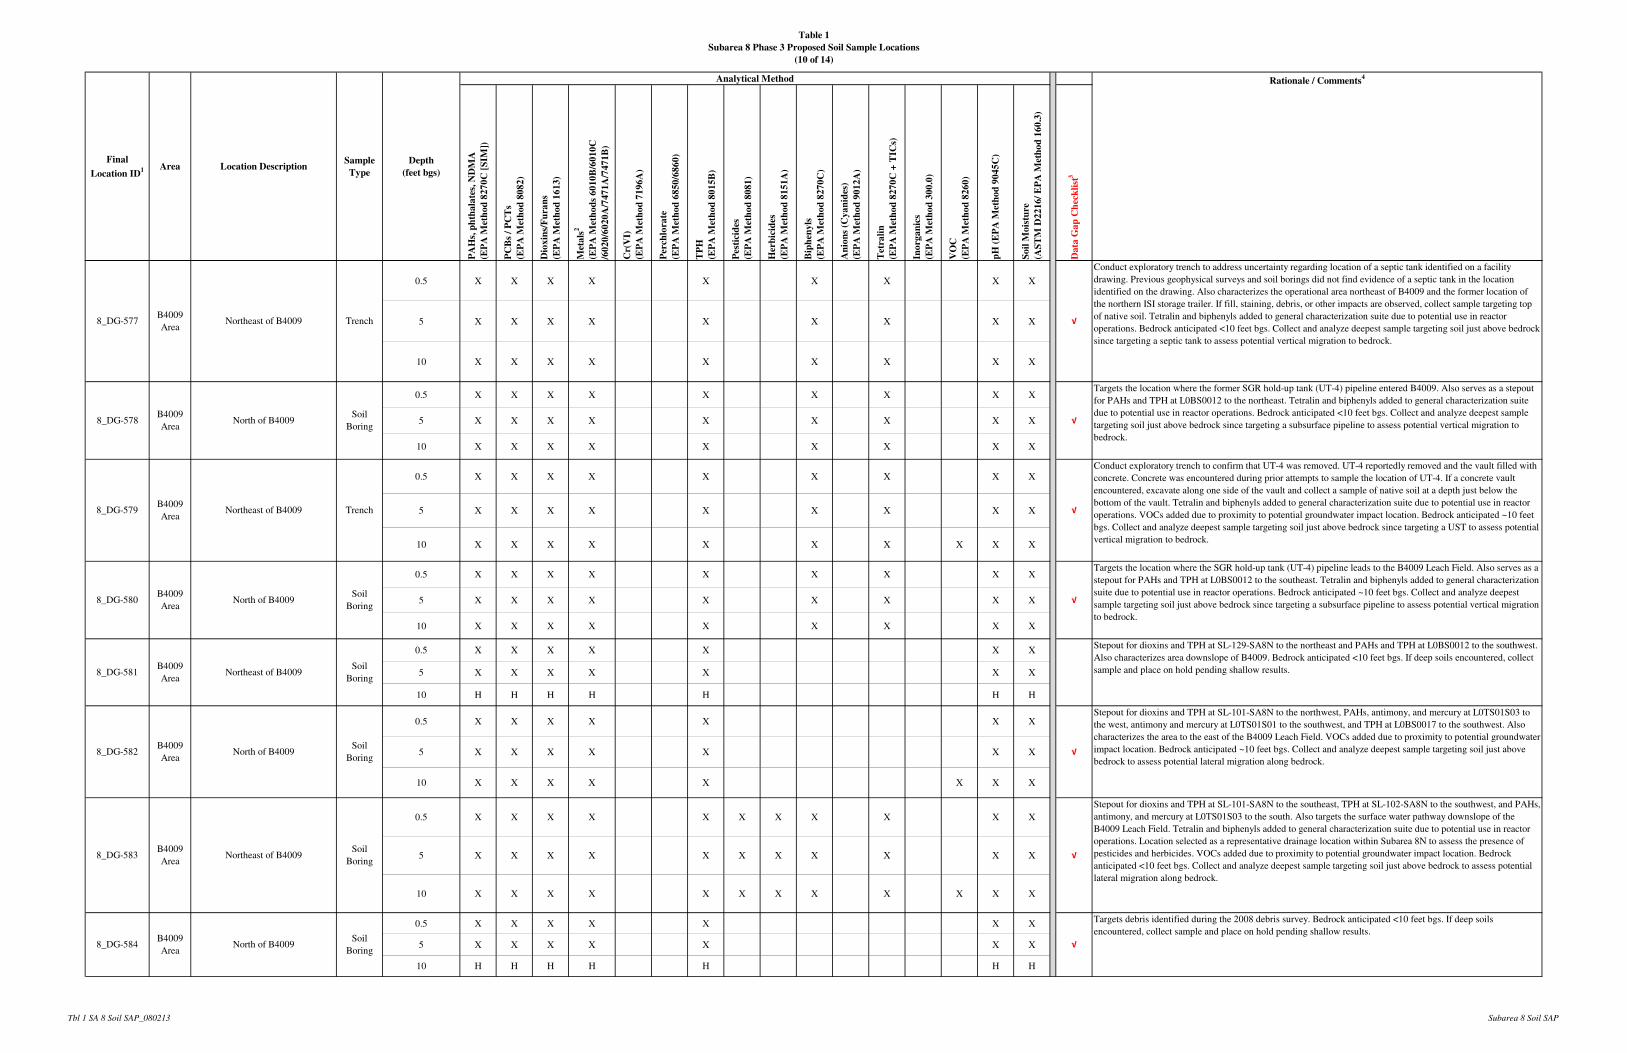
Table 1
Subarea 8 Phase 3 Proposed Soil Sample Locations
(10 of 14)
PA
Hs,
ph
tha
late
s, N
DM
A
(EP
A M
eth
od
82
70
C [
SIM
])
PC
Bs
/ P
CT
s
(EP
A M
eth
od
80
82
)
Dio
xin
s/F
ura
ns
(EP
A M
eth
od
16
13
)
Met
als
2
(EP
A M
eth
od
s 6
01
0B
/60
10
C
/60
20
/60
20
A/7
47
1A
/74
71
B)
Cr(
VI)
(EP
A M
eth
od
71
96
A)
Per
chlo
rate
(EP
A M
eth
od
68
50
/68
60
)
TP
H
(EP
A M
eth
od
80
15
B)
Pes
tici
des
(EP
A M
eth
od
80
81
)
Her
bic
ides
(EP
A M
eth
od
81
51
A)
Bip
hen
yls
(EP
A M
eth
od
82
70
C)
An
ion
s (C
ya
nid
es)
(EP
A M
eth
od
90
12
A)
Tet
rali
n
(EP
A M
eth
od
82
70
C +
TIC
s)
Ino
rga
nic
s
(EP
A M
eth
od
30
0.0
)
VO
C
(EP
A M
eth
od
82
60
)
pH
(E
PA
Met
ho
d 9
04
5C
)
So
il M
ois
ture
(AS
TM
D2
21
6/
EP
A M
eth
od
16
0.3
)
Da
ta G
ap
Ch
eck
list
3
Rationale / Comments4
Final
Location ID1 Area Location Description
Sample
Type
Depth
(feet bgs)
Analytical Method
0.5 X X X X X X X X X
5 X X X X X X X X X
10 X X X X X X X X X
0.5 X X X X X X X X X
5 X X X X X X X X X
10 X X X X X X X X X
0.5 X X X X X X X X X
5 X X X X X X X X X
10 X X X X X X X X X X
0.5 X X X X X X X X X
5 X X X X X X X X X
10 X X X X X X X X X
0.5 X X X X X X X
5 X X X X X X X
10 H H H H H H H
0.5 X X X X X X X
5 X X X X X X X
10 X X X X X X X X
0.5 X X X X X X X X X X X
5 X X X X X X X X X X X
10 X X X X X X X X X X X X
0.5 X X X X X X X
5 X X X X X X X
10 H H H H H H H
8_DG-577B4009
AreaNortheast of B4009 Trench √
Conduct exploratory trench to address uncertainty regarding location of a septic tank identified on a facility
drawing. Previous geophysical surveys and soil borings did not find evidence of a septic tank in the location
identified on the drawing. Also characterizes the operational area northeast of B4009 and the former location of
the northern ISI storage trailer. If fill, staining, debris, or other impacts are observed, collect sample targeting top
of native soil. Tetralin and biphenyls added to general characterization suite due to potential use in reactor
operations. Bedrock anticipated <10 feet bgs. Collect and analyze deepest sample targeting soil just above bedrock
since targeting a septic tank to assess potential vertical migration to bedrock.
8_DG-578B4009
Area
8_DG-579B4009
Area
√
8_DG-583B4009
AreaNortheast of B4009
Soil
Boring√
Stepout for dioxins and TPH at SL-101-SA8N to the southeast, TPH at SL-102-SA8N to the southwest, and PAHs,
antimony, and mercury at L0TS01S03 to the south. Also targets the surface water pathway downslope of the
B4009 Leach Field. Tetralin and biphenyls added to general characterization suite due to potential use in reactor
operations. Location selected as a representative drainage location within Subarea 8N to assess the presence of
pesticides and herbicides. VOCs added due to proximity to potential groundwater impact location. Bedrock
anticipated <10 feet bgs. Collect and analyze deepest sample targeting soil just above bedrock to assess potential
lateral migration along bedrock.
√
8_DG-580B4009
AreaNorth of B4009
8_DG-582B4009
AreaNorth of B4009
Soil
Boring√
Soil
Boring√
Stepout for dioxins and TPH at SL-101-SA8N to the northwest, PAHs, antimony, and mercury at L0TS01S03 to
the west, antimony and mercury at L0TS01S01 to the southwest, and TPH at L0BS0017 to the southwest. Also
characterizes the area to the east of the B4009 Leach Field. VOCs added due to proximity to potential groundwater
impact location. Bedrock anticipated ~10 feet bgs. Collect and analyze deepest sample targeting soil just above
bedrock to assess potential lateral migration along bedrock.
8_DG-581B4009
Area
Conduct exploratory trench to confirm that UT-4 was removed. UT-4 reportedly removed and the vault filled with
concrete. Concrete was encountered during prior attempts to sample the location of UT-4. If a concrete vault
encountered, excavate along one side of the vault and collect a sample of native soil at a depth just below the
bottom of the vault. Tetralin and biphenyls added to general characterization suite due to potential use in reactor
operations. VOCs added due to proximity to potential groundwater impact location. Bedrock anticipated ~10 feet
bgs. Collect and analyze deepest sample targeting soil just above bedrock since targeting a UST to assess potential
vertical migration to bedrock.
Targets the location where the former SGR hold-up tank (UT-4) pipeline entered B4009. Also serves as a stepout
for PAHs and TPH at L0BS0012 to the northeast. Tetralin and biphenyls added to general characterization suite
due to potential use in reactor operations. Bedrock anticipated <10 feet bgs. Collect and analyze deepest sample
targeting soil just above bedrock since targeting a subsurface pipeline to assess potential vertical migration to
bedrock.
Targets the location where the SGR hold-up tank (UT-4) pipeline leads to the B4009 Leach Field. Also serves as a
stepout for PAHs and TPH at L0BS0012 to the southeast. Tetralin and biphenyls added to general characterization
suite due to potential use in reactor operations. Bedrock anticipated ~10 feet bgs. Collect and analyze deepest
sample targeting soil just above bedrock since targeting a subsurface pipeline to assess potential vertical migration
to bedrock.
Stepout for dioxins and TPH at SL-129-SA8N to the northeast and PAHs and TPH at L0BS0012 to the southwest.
Also characterizes area downslope of B4009. Bedrock anticipated <10 feet bgs. If deep soils encountered, collect
sample and place on hold pending shallow results.
Targets debris identified during the 2008 debris survey. Bedrock anticipated <10 feet bgs. If deep soils
encountered, collect sample and place on hold pending shallow results.
Northeast of B4009 Trench √
8_DG-584B4009
AreaNorth of B4009
Soil
Boring
Northeast of B4009Soil
Boring
North of B4009Soil
Boring
Tbl 1 SA 8 Soil SAP_080213 Subarea 8 Soil SAP
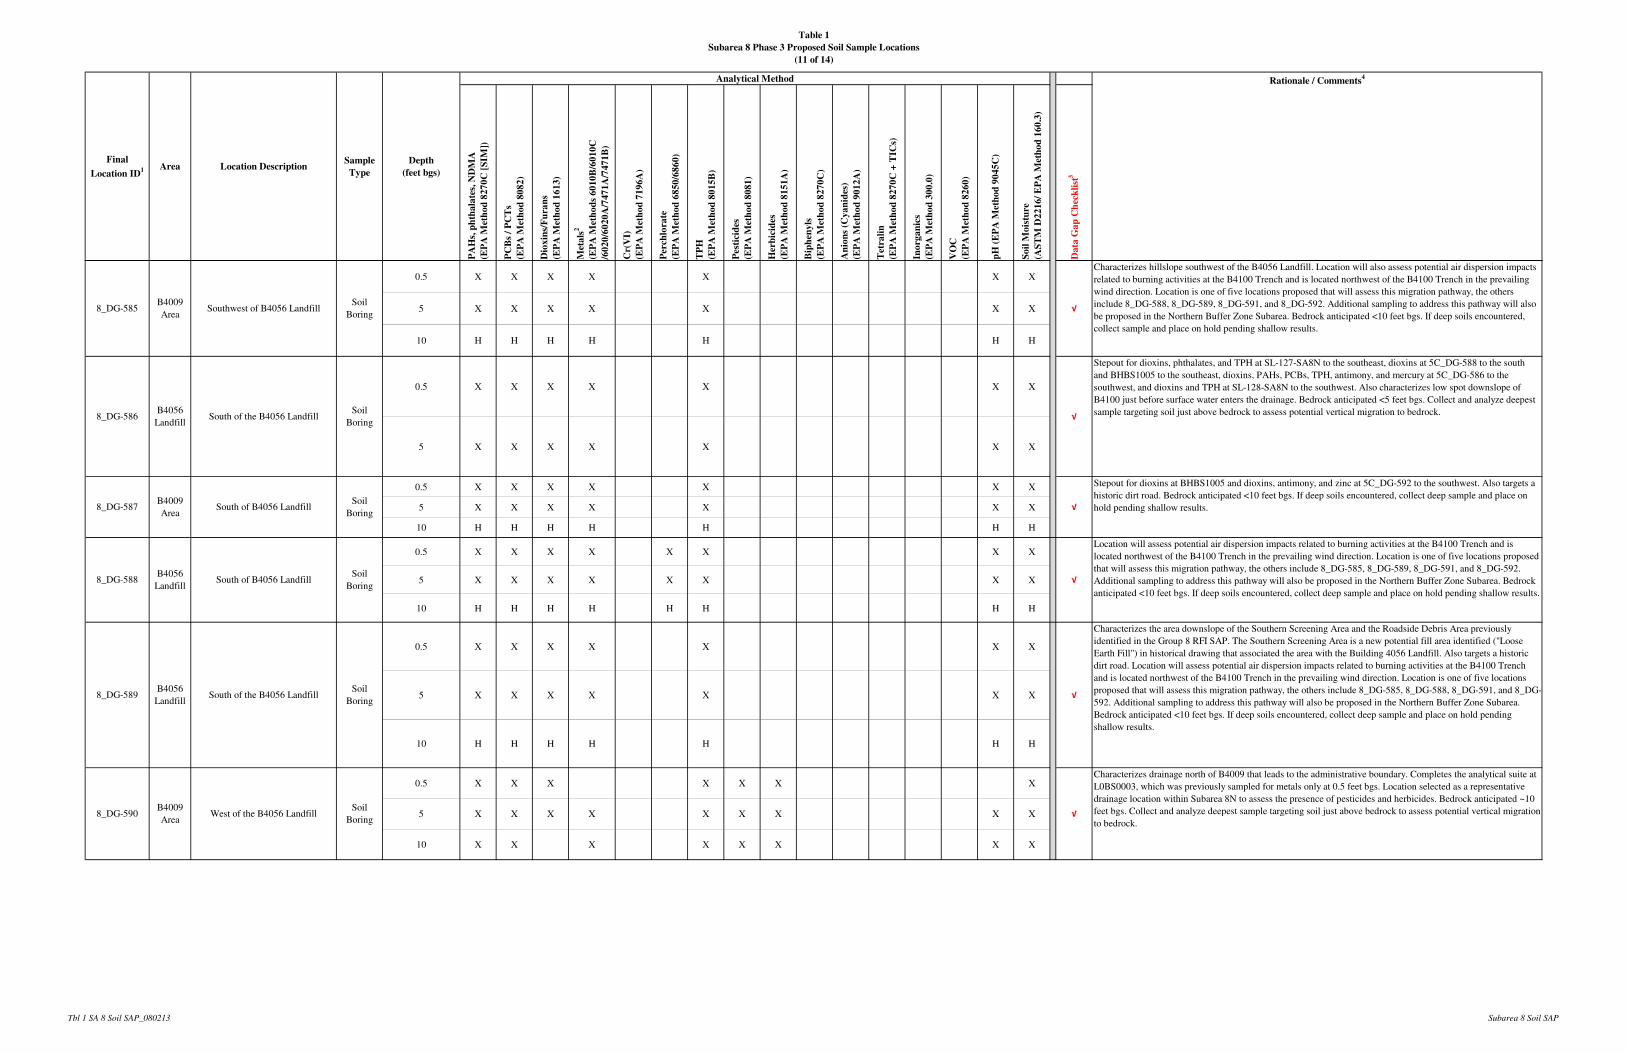
Table 1
Subarea 8 Phase 3 Proposed Soil Sample Locations
(11 of 14)
PA
Hs,
ph
tha
late
s, N
DM
A
(EP
A M
eth
od
82
70
C [
SIM
])
PC
Bs
/ P
CT
s
(EP
A M
eth
od
80
82
)
Dio
xin
s/F
ura
ns
(EP
A M
eth
od
16
13
)
Met
als
2
(EP
A M
eth
od
s 6
01
0B
/60
10
C
/60
20
/60
20
A/7
47
1A
/74
71
B)
Cr(
VI)
(EP
A M
eth
od
71
96
A)
Per
chlo
rate
(EP
A M
eth
od
68
50
/68
60
)
TP
H
(EP
A M
eth
od
80
15
B)
Pes
tici
des
(EP
A M
eth
od
80
81
)
Her
bic
ides
(EP
A M
eth
od
81
51
A)
Bip
hen
yls
(EP
A M
eth
od
82
70
C)
An
ion
s (C
ya
nid
es)
(EP
A M
eth
od
90
12
A)
Tet
rali
n
(EP
A M
eth
od
82
70
C +
TIC
s)
Ino
rga
nic
s
(EP
A M
eth
od
30
0.0
)
VO
C
(EP
A M
eth
od
82
60
)
pH
(E
PA
Met
ho
d 9
04
5C
)
So
il M
ois
ture
(AS
TM
D2
21
6/
EP
A M
eth
od
16
0.3
)
Da
ta G
ap
Ch
eck
list
3
Rationale / Comments4
Final
Location ID1 Area Location Description
Sample
Type
Depth
(feet bgs)
Analytical Method
0.5 X X X X X X X
5 X X X X X X X
10 H H H H H H H
0.5 X X X X X X X
5 X X X X X X X
0.5 X X X X X X X
5 X X X X X X X
10 H H H H H H H
0.5 X X X X X X X X
5 X X X X X X X X
10 H H H H H H H H
0.5 X X X X X X X
5 X X X X X X X
10 H H H H H H H
0.5 X X X X X X X
5 X X X X X X X X X
10 X X X X X X X X
8_DG-588B4056
LandfillSouth of B4056 Landfill
Soil
Boring√
Location will assess potential air dispersion impacts related to burning activities at the B4100 Trench and is
located northwest of the B4100 Trench in the prevailing wind direction. Location is one of five locations proposed
that will assess this migration pathway, the others include 8_DG-585, 8_DG-589, 8_DG-591, and 8_DG-592.
Additional sampling to address this pathway will also be proposed in the Northern Buffer Zone Subarea. Bedrock
anticipated <10 feet bgs. If deep soils encountered, collect deep sample and place on hold pending shallow results.
√
√
√
Characterizes hillslope southwest of the B4056 Landfill. Location will also assess potential air dispersion impacts
related to burning activities at the B4100 Trench and is located northwest of the B4100 Trench in the prevailing
wind direction. Location is one of five locations proposed that will assess this migration pathway, the others
include 8_DG-588, 8_DG-589, 8_DG-591, and 8_DG-592. Additional sampling to address this pathway will also
be proposed in the Northern Buffer Zone Subarea. Bedrock anticipated <10 feet bgs. If deep soils encountered,
collect sample and place on hold pending shallow results.
Stepout for dioxins, phthalates, and TPH at SL-127-SA8N to the southeast, dioxins at 5C_DG-588 to the south
and BHBS1005 to the southeast, dioxins, PAHs, PCBs, TPH, antimony, and mercury at 5C_DG-586 to the
southwest, and dioxins and TPH at SL-128-SA8N to the southwest. Also characterizes low spot downslope of
B4100 just before surface water enters the drainage. Bedrock anticipated <5 feet bgs. Collect and analyze deepest
sample targeting soil just above bedrock to assess potential vertical migration to bedrock.
Stepout for dioxins at BHBS1005 and dioxins, antimony, and zinc at 5C_DG-592 to the southwest. Also targets a
historic dirt road. Bedrock anticipated <10 feet bgs. If deep soils encountered, collect deep sample and place on
hold pending shallow results.
8_DG-586B4056
LandfillSouth of the B4056 Landfill
Soil
Boring
8_DG-587B4009
AreaSouth of B4056 Landfill
Soil
Boring
Characterizes drainage north of B4009 that leads to the administrative boundary. Completes the analytical suite at
L0BS0003, which was previously sampled for metals only at 0.5 feet bgs. Location selected as a representative
drainage location within Subarea 8N to assess the presence of pesticides and herbicides. Bedrock anticipated ~10
feet bgs. Collect and analyze deepest sample targeting soil just above bedrock to assess potential vertical migration
to bedrock.√
8_DG-589B4056
LandfillSouth of the B4056 Landfill
Soil
Boring
8_DG-590B4009
AreaWest of the B4056 Landfill
Soil
Boring
Characterizes the area downslope of the Southern Screening Area and the Roadside Debris Area previously
identified in the Group 8 RFI SAP. The Southern Screening Area is a new potential fill area identified ("Loose
Earth Fill") in historical drawing that associated the area with the Building 4056 Landfill. Also targets a historic
dirt road. Location will assess potential air dispersion impacts related to burning activities at the B4100 Trench
and is located northwest of the B4100 Trench in the prevailing wind direction. Location is one of five locations
proposed that will assess this migration pathway, the others include 8_DG-585, 8_DG-588, 8_DG-591, and 8_DG-
592. Additional sampling to address this pathway will also be proposed in the Northern Buffer Zone Subarea.
Bedrock anticipated <10 feet bgs. If deep soils encountered, collect deep sample and place on hold pending
shallow results.
√
8_DG-585B4009
AreaSouthwest of B4056 Landfill
Soil
Boring
Tbl 1 SA 8 Soil SAP_080213 Subarea 8 Soil SAP
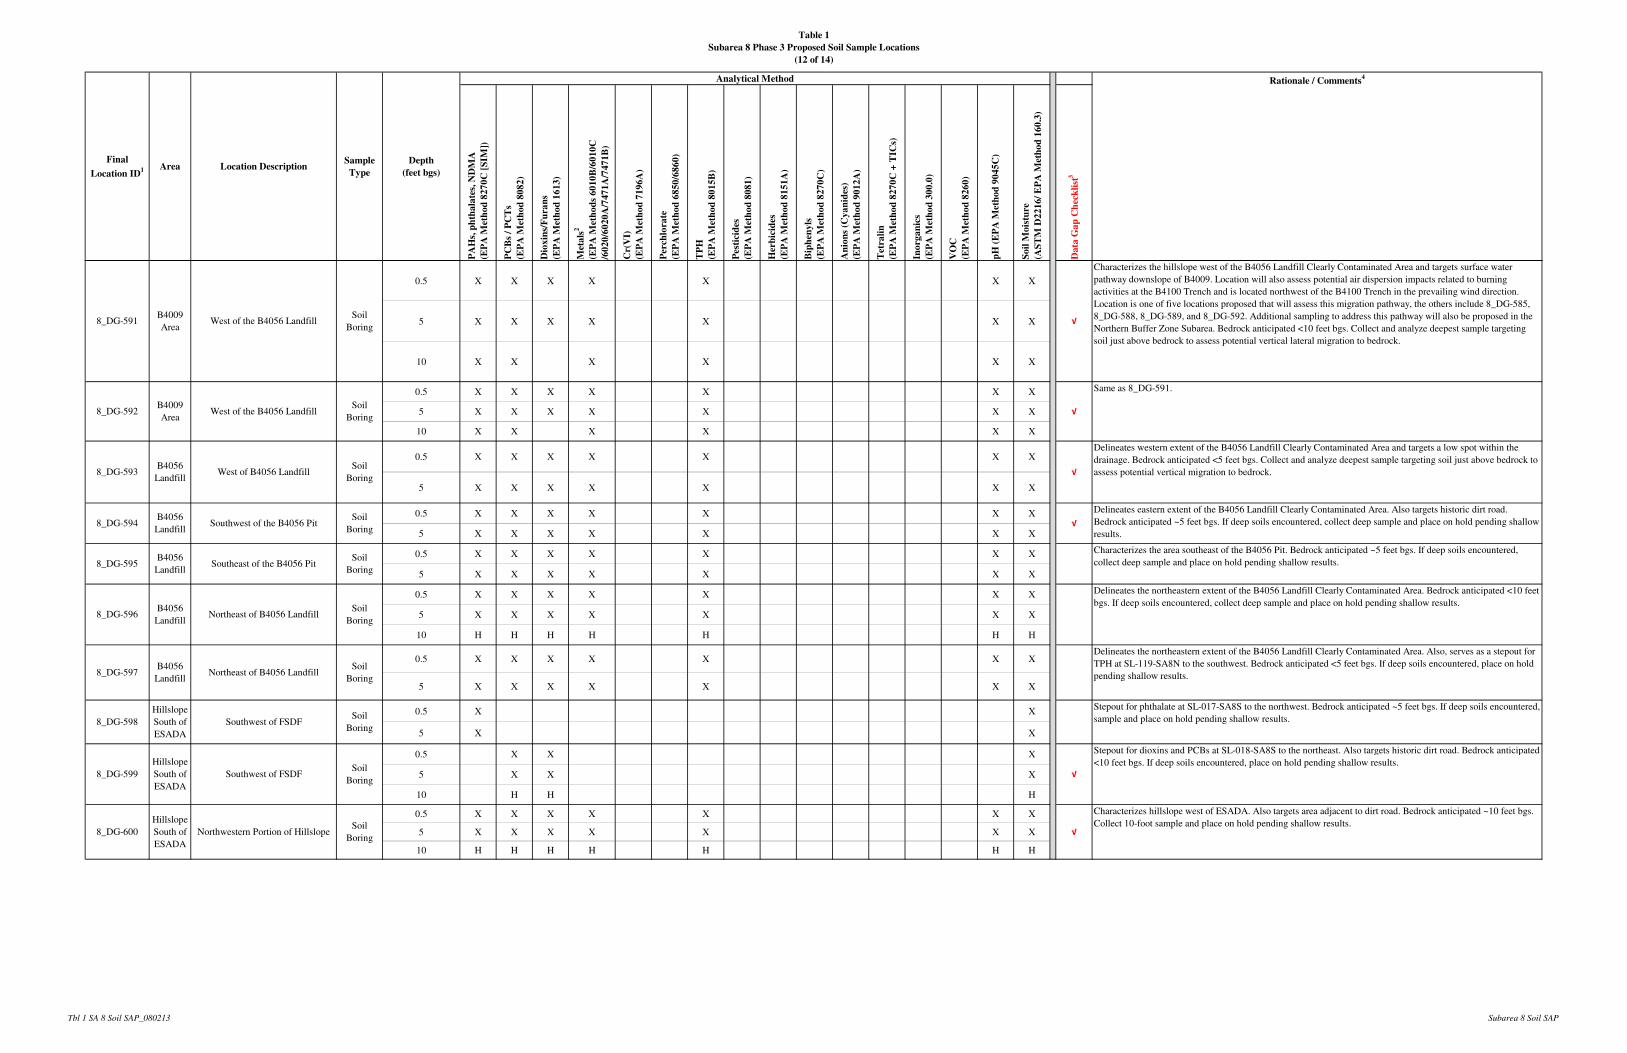
Table 1
Subarea 8 Phase 3 Proposed Soil Sample Locations
(12 of 14)
PA
Hs,
ph
tha
late
s, N
DM
A
(EP
A M
eth
od
82
70
C [
SIM
])
PC
Bs
/ P
CT
s
(EP
A M
eth
od
80
82
)
Dio
xin
s/F
ura
ns
(EP
A M
eth
od
16
13
)
Met
als
2
(EP
A M
eth
od
s 6
01
0B
/60
10
C
/60
20
/60
20
A/7
47
1A
/74
71
B)
Cr(
VI)
(EP
A M
eth
od
71
96
A)
Per
chlo
rate
(EP
A M
eth
od
68
50
/68
60
)
TP
H
(EP
A M
eth
od
80
15
B)
Pes
tici
des
(EP
A M
eth
od
80
81
)
Her
bic
ides
(EP
A M
eth
od
81
51
A)
Bip
hen
yls
(EP
A M
eth
od
82
70
C)
An
ion
s (C
ya
nid
es)
(EP
A M
eth
od
90
12
A)
Tet
rali
n
(EP
A M
eth
od
82
70
C +
TIC
s)
Ino
rga
nic
s
(EP
A M
eth
od
30
0.0
)
VO
C
(EP
A M
eth
od
82
60
)
pH
(E
PA
Met
ho
d 9
04
5C
)
So
il M
ois
ture
(AS
TM
D2
21
6/
EP
A M
eth
od
16
0.3
)
Da
ta G
ap
Ch
eck
list
3
Rationale / Comments4
Final
Location ID1 Area Location Description
Sample
Type
Depth
(feet bgs)
Analytical Method
0.5 X X X X X X X
5 X X X X X X X
10 X X X X X X
0.5 X X X X X X X
5 X X X X X X X
10 X X X X X X
0.5 X X X X X X X
5 X X X X X X X
0.5 X X X X X X X
5 X X X X X X X
0.5 X X X X X X X
5 X X X X X X X
0.5 X X X X X X X
5 X X X X X X X
10 H H H H H H H
0.5 X X X X X X X
5 X X X X X X X
0.5 X X
5 X X
0.5 X X X
5 X X X
10 H H H
0.5 X X X X X X X
5 X X X X X X X
10 H H H H H H H
Characterizes the hillslope west of the B4056 Landfill Clearly Contaminated Area and targets surface water
pathway downslope of B4009. Location will also assess potential air dispersion impacts related to burning
activities at the B4100 Trench and is located northwest of the B4100 Trench in the prevailing wind direction.
Location is one of five locations proposed that will assess this migration pathway, the others include 8_DG-585,
8_DG-588, 8_DG-589, and 8_DG-592. Additional sampling to address this pathway will also be proposed in the
Northern Buffer Zone Subarea. Bedrock anticipated <10 feet bgs. Collect and analyze deepest sample targeting
soil just above bedrock to assess potential vertical lateral migration to bedrock.
√8_DG-591B4009
AreaWest of the B4056 Landfill
Soil
Boring
Delineates western extent of the B4056 Landfill Clearly Contaminated Area and targets a low spot within the
drainage. Bedrock anticipated <5 feet bgs. Collect and analyze deepest sample targeting soil just above bedrock to
assess potential vertical migration to bedrock.
Delineates eastern extent of the B4056 Landfill Clearly Contaminated Area. Also targets historic dirt road.
Bedrock anticipated ~5 feet bgs. If deep soils encountered, collect deep sample and place on hold pending shallow
results.
Characterizes the area southeast of the B4056 Pit. Bedrock anticipated ~5 feet bgs. If deep soils encountered,
collect deep sample and place on hold pending shallow results.
√
√
8_DG-592B4009
AreaWest of the B4056 Landfill
Soil
Boring
8_DG-593B4056
LandfillWest of B4056 Landfill
Soil
Boring
Same as 8_DG-591.
√
8_DG-594B4056
LandfillSouthwest of the B4056 Pit
Soil
Boring
8_DG-595B4056
LandfillSoutheast of the B4056 Pit
Soil
Boring
Soil
Boring
Stepout for phthalate at SL-017-SA8S to the northwest. Bedrock anticipated ~5 feet bgs. If deep soils encountered,
sample and place on hold pending shallow results.
Stepout for dioxins and PCBs at SL-018-SA8S to the northeast. Also targets historic dirt road. Bedrock anticipated
<10 feet bgs. If deep soils encountered, place on hold pending shallow results.
√
8_DG-596B4056
LandfillNortheast of B4056 Landfill
Soil
Boring
8_DG-597B4056
LandfillNortheast of B4056 Landfill
Soil
Boring
Delineates the northeastern extent of the B4056 Landfill Clearly Contaminated Area. Bedrock anticipated <10 feet
bgs. If deep soils encountered, collect deep sample and place on hold pending shallow results.
Delineates the northeastern extent of the B4056 Landfill Clearly Contaminated Area. Also, serves as a stepout for
TPH at SL-119-SA8N to the southwest. Bedrock anticipated <5 feet bgs. If deep soils encountered, place on hold
pending shallow results.
8_DG-600
Hillslope
South of
ESADA
Northwestern Portion of HillslopeSoil
Boring
Characterizes hillslope west of ESADA. Also targets area adjacent to dirt road. Bedrock anticipated ~10 feet bgs.
Collect 10-foot sample and place on hold pending shallow results.√
8_DG-598
Hillslope
South of
ESADA
Southwest of FSDFSoil
Boring
8_DG-599
Hillslope
South of
ESADA
Southwest of FSDF
Tbl 1 SA 8 Soil SAP_080213 Subarea 8 Soil SAP
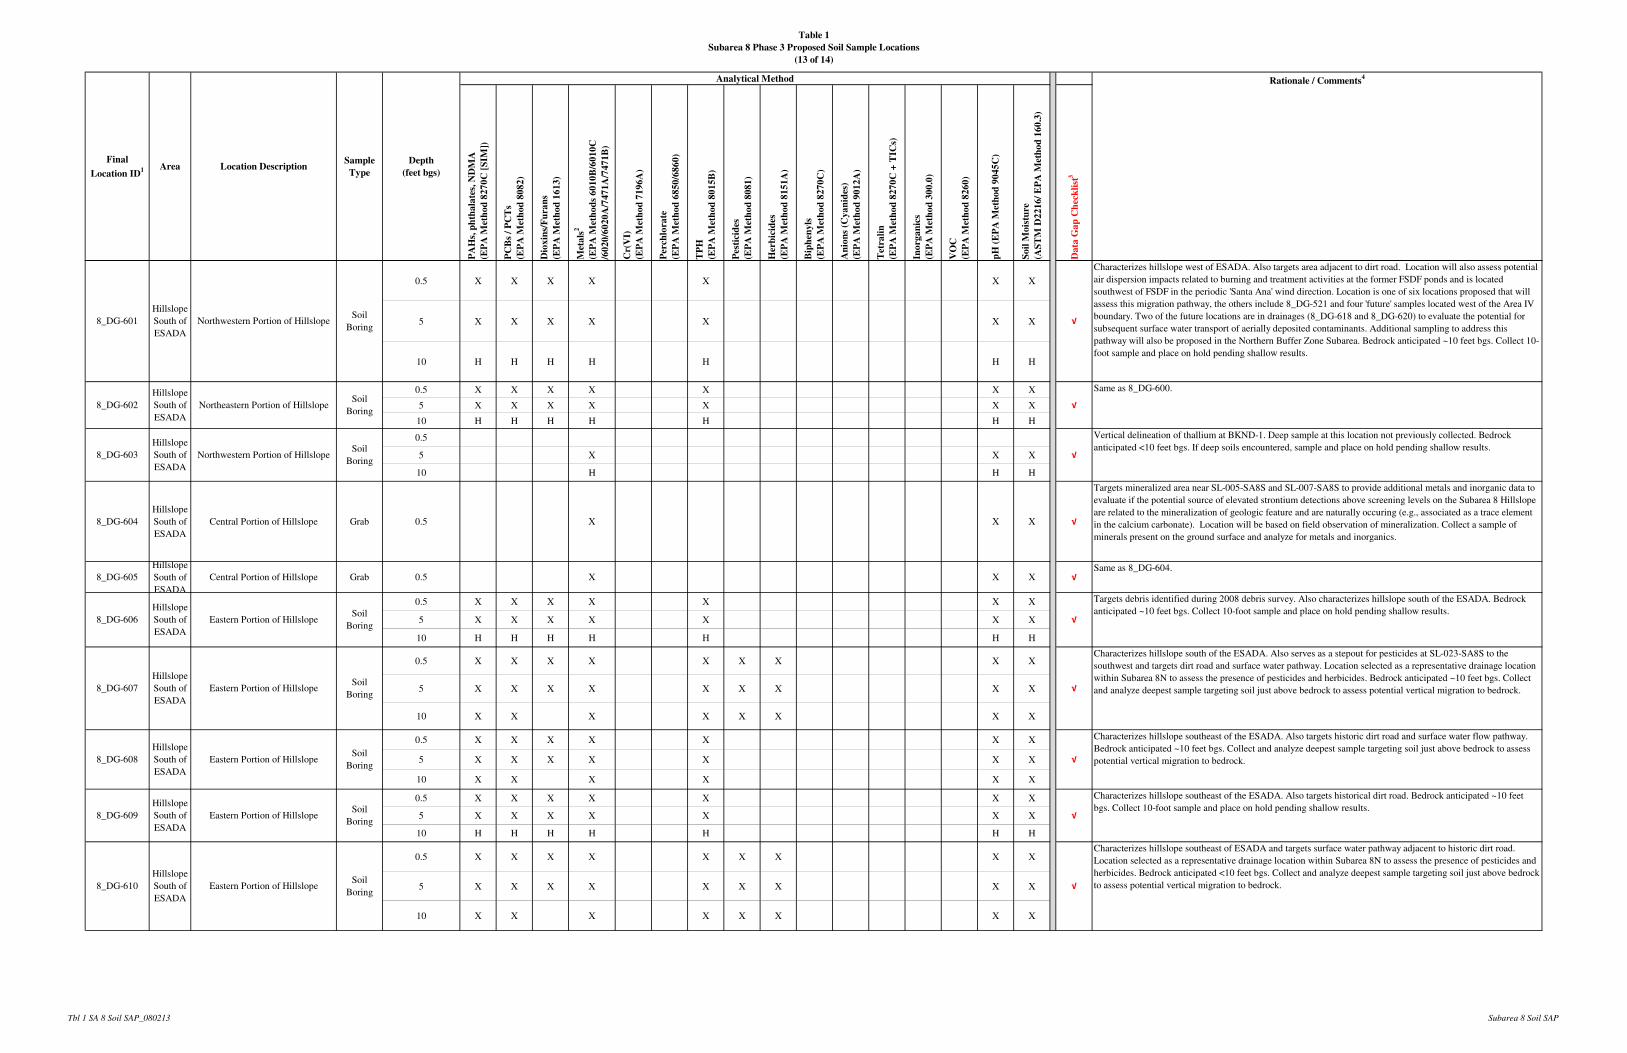
Table 1
Subarea 8 Phase 3 Proposed Soil Sample Locations
(13 of 14)
PA
Hs,
ph
tha
late
s, N
DM
A
(EP
A M
eth
od
82
70
C [
SIM
])
PC
Bs
/ P
CT
s
(EP
A M
eth
od
80
82
)
Dio
xin
s/F
ura
ns
(EP
A M
eth
od
16
13
)
Met
als
2
(EP
A M
eth
od
s 6
01
0B
/60
10
C
/60
20
/60
20
A/7
47
1A
/74
71
B)
Cr(
VI)
(EP
A M
eth
od
71
96
A)
Per
chlo
rate
(EP
A M
eth
od
68
50
/68
60
)
TP
H
(EP
A M
eth
od
80
15
B)
Pes
tici
des
(EP
A M
eth
od
80
81
)
Her
bic
ides
(EP
A M
eth
od
81
51
A)
Bip
hen
yls
(EP
A M
eth
od
82
70
C)
An
ion
s (C
ya
nid
es)
(EP
A M
eth
od
90
12
A)
Tet
rali
n
(EP
A M
eth
od
82
70
C +
TIC
s)
Ino
rga
nic
s
(EP
A M
eth
od
30
0.0
)
VO
C
(EP
A M
eth
od
82
60
)
pH
(E
PA
Met
ho
d 9
04
5C
)
So
il M
ois
ture
(AS
TM
D2
21
6/
EP
A M
eth
od
16
0.3
)
Da
ta G
ap
Ch
eck
list
3
Rationale / Comments4
Final
Location ID1 Area Location Description
Sample
Type
Depth
(feet bgs)
Analytical Method
0.5 X X X X X X X
5 X X X X X X X
10 H H H H H H H
0.5 X X X X X X X
5 X X X X X X X
10 H H H H H H H
0.5
5 X X X
10 H H H
8_DG-604
Hillslope
South of
ESADA
Central Portion of Hillslope Grab 0.5 X X X √
Targets mineralized area near SL-005-SA8S and SL-007-SA8S to provide additional metals and inorganic data to
evaluate if the potential source of elevated strontium detections above screening levels on the Subarea 8 Hillslope
are related to the mineralization of geologic feature and are naturally occuring (e.g., associated as a trace element
in the calcium carbonate). Location will be based on field observation of mineralization. Collect a sample of
minerals present on the ground surface and analyze for metals and inorganics.
8_DG-605
Hillslope
South of
ESADA
Central Portion of Hillslope Grab 0.5 X X X √
Same as 8_DG-604.
0.5 X X X X X X X
5 X X X X X X X
10 H H H H H H H
0.5 X X X X X X X X X
5 X X X X X X X X X
10 X X X X X X X X
0.5 X X X X X X X
5 X X X X X X X
10 X X X X X X
0.5 X X X X X X X
5 X X X X X X X
10 H H H H H H H
0.5 X X X X X X X X X
5 X X X X X X X X X
10 X X X X X X X X
√
√
Characterizes hillslope west of ESADA. Also targets area adjacent to dirt road. Location will also assess potential
air dispersion impacts related to burning and treatment activities at the former FSDF ponds and is located
southwest of FSDF in the periodic 'Santa Ana' wind direction. Location is one of six locations proposed that will
assess this migration pathway, the others include 8_DG-521 and four 'future' samples located west of the Area IV
boundary. Two of the future locations are in drainages (8_DG-618 and 8_DG-620) to evaluate the potential for
subsequent surface water transport of aerially deposited contaminants. Additional sampling to address this
pathway will also be proposed in the Northern Buffer Zone Subarea. Bedrock anticipated ~10 feet bgs. Collect 10-
foot sample and place on hold pending shallow results.
Same as 8_DG-600.
Vertical delineation of thallium at BKND-1. Deep sample at this location not previously collected. Bedrock
anticipated <10 feet bgs. If deep soils encountered, sample and place on hold pending shallow results.
8_DG-601
Hillslope
South of
ESADA
Northwestern Portion of HillslopeSoil
Boring√
Targets debris identified during 2008 debris survey. Also characterizes hillslope south of the ESADA. Bedrock
anticipated ~10 feet bgs. Collect 10-foot sample and place on hold pending shallow results.
Characterizes hillslope south of the ESADA. Also serves as a stepout for pesticides at SL-023-SA8S to the
southwest and targets dirt road and surface water pathway. Location selected as a representative drainage location
within Subarea 8N to assess the presence of pesticides and herbicides. Bedrock anticipated ~10 feet bgs. Collect
and analyze deepest sample targeting soil just above bedrock to assess potential vertical migration to bedrock.
√
√
8_DG-602
Hillslope
South of
ESADA
Northeastern Portion of HillslopeSoil
Boring
8_DG-603
Hillslope
South of
ESADA
Northwestern Portion of HillslopeSoil
Boring
√
8_DG-606
Hillslope
South of
ESADA
Eastern Portion of HillslopeSoil
Boring
8_DG-607
Hillslope
South of
ESADA
Eastern Portion of HillslopeSoil
Boring
8_DG-608
Hillslope
South of
ESADA
Eastern Portion of HillslopeSoil
Boring
8_DG-609
Hillslope
South of
ESADA
Eastern Portion of HillslopeSoil
Boring
8_DG-610
Hillslope
South of
ESADA
Eastern Portion of HillslopeSoil
Boring
Characterizes hillslope southeast of the ESADA. Also targets historic dirt road and surface water flow pathway.
Bedrock anticipated ~10 feet bgs. Collect and analyze deepest sample targeting soil just above bedrock to assess
potential vertical migration to bedrock.
Characterizes hillslope southeast of the ESADA. Also targets historical dirt road. Bedrock anticipated ~10 feet
bgs. Collect 10-foot sample and place on hold pending shallow results.
√
Characterizes hillslope southeast of ESADA and targets surface water pathway adjacent to historic dirt road.
Location selected as a representative drainage location within Subarea 8N to assess the presence of pesticides and
herbicides. Bedrock anticipated <10 feet bgs. Collect and analyze deepest sample targeting soil just above bedrock
to assess potential vertical migration to bedrock.√
Tbl 1 SA 8 Soil SAP_080213 Subarea 8 Soil SAP
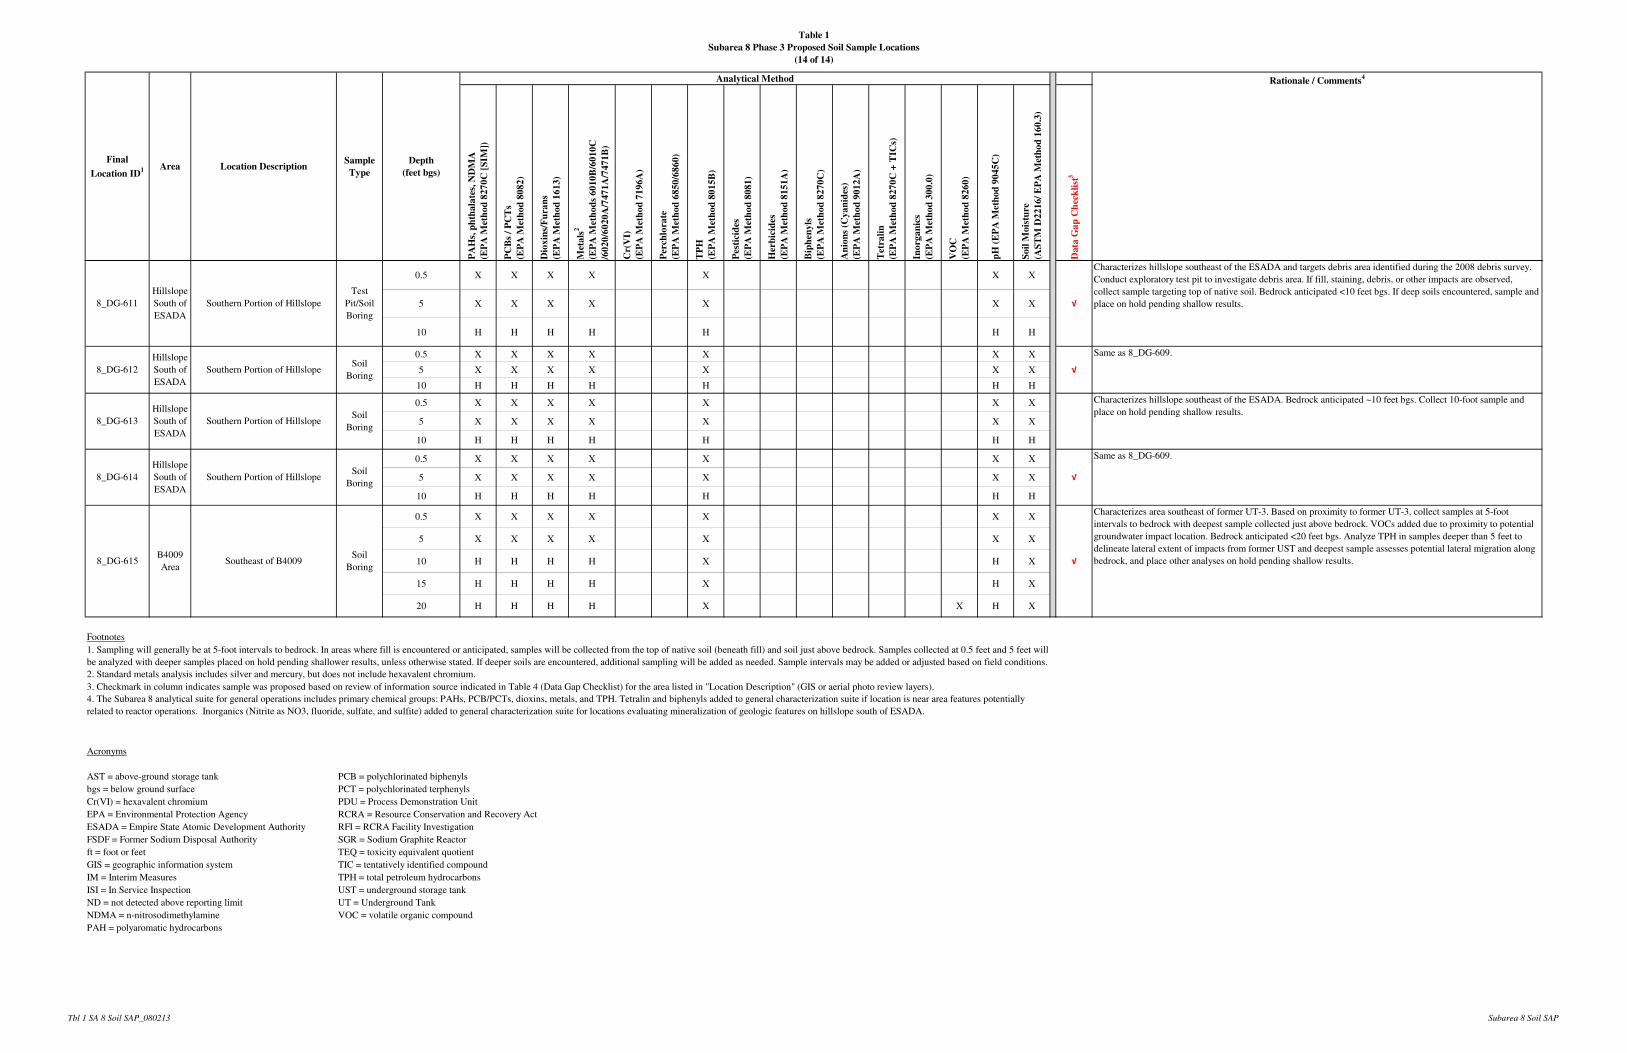
Table 1
Subarea 8 Phase 3 Proposed Soil Sample Locations
(14 of 14)
PA
Hs,
ph
tha
late
s, N
DM
A
(EP
A M
eth
od
82
70
C [
SIM
])
PC
Bs
/ P
CT
s
(EP
A M
eth
od
80
82
)
Dio
xin
s/F
ura
ns
(EP
A M
eth
od
16
13
)
Met
als
2
(EP
A M
eth
od
s 6
01
0B
/60
10
C
/60
20
/60
20
A/7
47
1A
/74
71
B)
Cr(
VI)
(EP
A M
eth
od
71
96
A)
Per
chlo
rate
(EP
A M
eth
od
68
50
/68
60
)
TP
H
(EP
A M
eth
od
80
15
B)
Pes
tici
des
(EP
A M
eth
od
80
81
)
Her
bic
ides
(EP
A M
eth
od
81
51
A)
Bip
hen
yls
(EP
A M
eth
od
82
70
C)
An
ion
s (C
ya
nid
es)
(EP
A M
eth
od
90
12
A)
Tet
rali
n
(EP
A M
eth
od
82
70
C +
TIC
s)
Ino
rga
nic
s
(EP
A M
eth
od
30
0.0
)
VO
C
(EP
A M
eth
od
82
60
)
pH
(E
PA
Met
ho
d 9
04
5C
)
So
il M
ois
ture
(AS
TM
D2
21
6/
EP
A M
eth
od
16
0.3
)
Da
ta G
ap
Ch
eck
list
3
Rationale / Comments4
Final
Location ID1 Area Location Description
Sample
Type
Depth
(feet bgs)
Analytical Method
0.5 X X X X X X X
5 X X X X X X X
10 H H H H H H H
0.5 X X X X X X X
5 X X X X X X X
10 H H H H H H H
0.5 X X X X X X X
5 X X X X X X X
10 H H H H H H H
0.5 X X X X X X X
5 X X X X X X X
10 H H H H H H H
0.5 X X X X X X X
5 X X X X X X X
10 H H H H X H X
15 H H H H X H X
20 H H H H X X H X
Footnotes
2. Standard metals analysis includes silver and mercury, but does not include hexavalent chromium.
3. Checkmark in column indicates sample was proposed based on review of information source indicated in Table 4 (Data Gap Checklist) for the area listed in "Location Description" (GIS or aerial photo review layers).
Acronyms
AST = above-ground storage tank PCB = polychlorinated biphenyls
bgs = below ground surface PCT = polychlorinated terphenyls
Cr(VI) = hexavalent chromium PDU = Process Demonstration Unit
EPA = Environmental Protection Agency RCRA = Resource Conservation and Recovery Act
ESADA = Empire State Atomic Development Authority RFI = RCRA Facility Investigation
FSDF = Former Sodium Disposal Authority SGR = Sodium Graphite Reactor
ft = foot or feet TEQ = toxicity equivalent quotient
GIS = geographic information system TIC = tentatively identified compound
IM = Interim Measures TPH = total petroleum hydrocarbons
ISI = In Service Inspection UST = underground storage tank
ND = not detected above reporting limit UT = Underground Tank
NDMA = n-nitrosodimethylamine VOC = volatile organic compound
PAH = polyaromatic hydrocarbons
4. The Subarea 8 analytical suite for general operations includes primary chemical groups: PAHs, PCB/PCTs, dioxins, metals, and TPH. Tetralin and biphenyls added to general characterization suite if location is near area features potentially
related to reactor operations. Inorganics (Nitrite as NO3, fluoride, sulfate, and sulfite) added to general characterization suite for locations evaluating mineralization of geologic features on hillslope south of ESADA.
1. Sampling will generally be at 5-foot intervals to bedrock. In areas where fill is encountered or anticipated, samples will be collected from the top of native soil (beneath fill) and soil just above bedrock. Samples collected at 0.5 feet and 5 feet will
be analyzed with deeper samples placed on hold pending shallower results, unless otherwise stated. If deeper soils are encountered, additional sampling will be added as needed. Sample intervals may be added or adjusted based on field conditions.
Same as 8_DG-609.
√
8_DG-613
Hillslope
South of
ESADA
Southern Portion of HillslopeSoil
Boring
8_DG-611
Hillslope
South of
ESADA
Southern Portion of Hillslope
Test
Pit/Soil
Boring
8_DG-612
8_DG-615B4009
AreaSoutheast of B4009
Soil
Boring√
Characterizes area southeast of former UT-3. Based on proximity to former UT-3, collect samples at 5-foot
intervals to bedrock with deepest sample collected just above bedrock. VOCs added due to proximity to potential
groundwater impact location. Bedrock anticipated <20 feet bgs. Analyze TPH in samples deeper than 5 feet to
delineate lateral extent of impacts from former UST and deepest sample assesses potential lateral migration along
bedrock, and place other analyses on hold pending shallow results.
8_DG-614
Hillslope
South of
ESADA
Southern Portion of HillslopeSoil
Boring
Characterizes hillslope southeast of the ESADA. Bedrock anticipated ~10 feet bgs. Collect 10-foot sample and
place on hold pending shallow results.
√
Characterizes hillslope southeast of the ESADA and targets debris area identified during the 2008 debris survey.
Conduct exploratory test pit to investigate debris area. If fill, staining, debris, or other impacts are observed,
collect sample targeting top of native soil. Bedrock anticipated <10 feet bgs. If deep soils encountered, sample and
place on hold pending shallow results.√
Hillslope
South of
ESADA
Southern Portion of HillslopeSoil
Boring
Same as 8_DG-609.
Tbl 1 SA 8 Soil SAP_080213 Subarea 8 Soil SAP
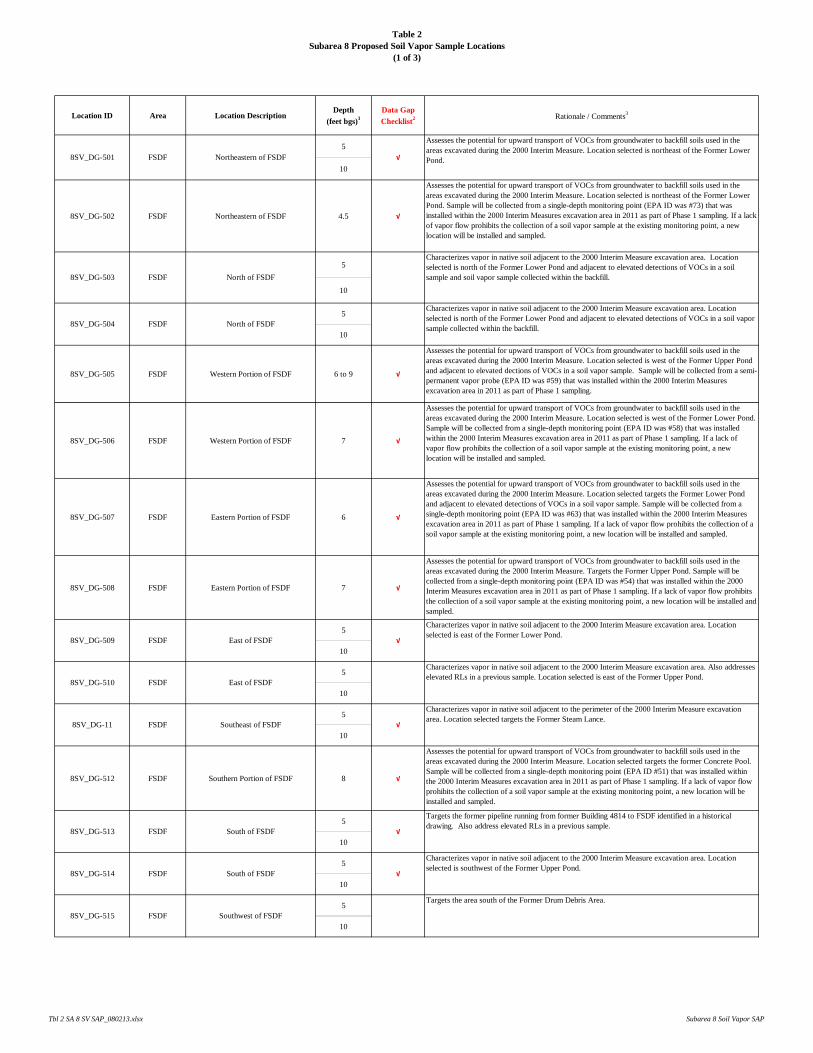
Table 2Subarea 8 Proposed Soil Vapor Sample Locations
(1 of 3)
Location ID Area Location Description Depth
(feet bgs)1Data Gap Checklist2 Rationale / Comments3
5
10
8SV_DG-502 FSDF Northeastern of FSDF 4.5 √
Assesses the potential for upward transport of VOCs from groundwater to backfill soils used in the areas excavated during the 2000 Interim Measure. Location selected is northeast of the Former Lower Pond. Sample will be collected from a single-depth monitoring point (EPA ID was #73) that was installed within the 2000 Interim Measures excavation area in 2011 as part of Phase 1 sampling. If a lack of vapor flow prohibits the collection of a soil vapor sample at the existing monitoring point, a new location will be installed and sampled.
5
10
5
10
8SV_DG-505 FSDF Western Portion of FSDF 6 to 9 √
Assesses the potential for upward transport of VOCs from groundwater to backfill soils used in the areas excavated during the 2000 Interim Measure. Location selected is west of the Former Upper Pond and adjacent to elevated dections of VOCs in a soil vapor sample. Sample will be collected from a semi-permanent vapor probe (EPA ID was #59) that was installed within the 2000 Interim Measures excavation area in 2011 as part of Phase 1 sampling.
8SV_DG-506 FSDF Western Portion of FSDF 7 √
Assesses the potential for upward transport of VOCs from groundwater to backfill soils used in the areas excavated during the 2000 Interim Measure. Location selected is west of the Former Lower Pond. Sample will be collected from a single-depth monitoring point (EPA ID was #58) that was installed within the 2000 Interim Measures excavation area in 2011 as part of Phase 1 sampling. If a lack of vapor flow prohibits the collection of a soil vapor sample at the existing monitoring point, a new location will be installed and sampled.
8SV_DG-507 FSDF Eastern Portion of FSDF 6 √
Assesses the potential for upward transport of VOCs from groundwater to backfill soils used in the areas excavated during the 2000 Interim Measure. Location selected targets the Former Lower Pond and adjacent to elevated detections of VOCs in a soil vapor sample. Sample will be collected from a single-depth monitoring point (EPA ID was #63) that was installed within the 2000 Interim Measures excavation area in 2011 as part of Phase 1 sampling. If a lack of vapor flow prohibits the collection of a soil vapor sample at the existing monitoring point, a new location will be installed and sampled.
8SV_DG-508 FSDF Eastern Portion of FSDF 7 √
Assesses the potential for upward transport of VOCs from groundwater to backfill soils used in the areas excavated during the 2000 Interim Measure. Targets the Former Upper Pond. Sample will be collected from a single-depth monitoring point (EPA ID was #54) that was installed within the 2000 Interim Measures excavation area in 2011 as part of Phase 1 sampling. If a lack of vapor flow prohibits the collection of a soil vapor sample at the existing monitoring point, a new location will be installed and sampled.
5
10
5
10
5
10
8SV_DG-512 FSDF Southern Portion of FSDF 8 √
Assesses the potential for upward transport of VOCs from groundwater to backfill soils used in the areas excavated during the 2000 Interim Measure. Location selected targets the former Concrete Pool. Sample will be collected from a single-depth monitoring point (EPA ID #51) that was installed within the 2000 Interim Measures excavation area in 2011 as part of Phase 1 sampling. If a lack of vapor flow prohibits the collection of a soil vapor sample at the existing monitoring point, a new location will be installed and sampled.
5
10
5
10
5
108SV_DG-515 FSDF Southwest of FSDF
Targets the area south of the Former Drum Debris Area.
8SV_DG-514 FSDF South of FSDF √
Characterizes vapor in native soil adjacent to the 2000 Interim Measure excavation area. Location selected is southwest of the Former Upper Pond.
8SV_DG-513
8SV_DG-11 FSDF Southeast of FSDF √
Characterizes vapor in native soil adjacent to the perimeter of the 2000 Interim Measure excavation area. Location selected targets the Former Steam Lance.
8SV_DG-510 FSDF East of FSDF
8SV_DG-504 FSDF North of FSDF
Characterizes vapor in native soil adjacent to the 2000 Interim Measure excavation area. Location selected is east of the Former Lower Pond.
8SV_DG-509 FSDF East of FSDF √
Characterizes vapor in native soil adjacent to the 2000 Interim Measure excavation area. Location selected is north of the Former Lower Pond and adjacent to elevated detections of VOCs in a soil vapor sample collected within the backfill.
8SV_DG-503 FSDF North of FSDF
Characterizes vapor in native soil adjacent to the 2000 Interim Measure excavation area. Location selected is north of the Former Lower Pond and adjacent to elevated detections of VOCs in a soil sample and soil vapor sample collected within the backfill.
Characterizes vapor in native soil adjacent to the 2000 Interim Measure excavation area. Also addresses elevated RLs in a previous sample. Location selected is east of the Former Upper Pond.
FSDF South of FSDF √
Targets the former pipeline running from former Building 4814 to FSDF identified in a historical drawing. Also address elevated RLs in a previous sample.
8SV_DG-501 FSDF Northeastern of FSDF √
Assesses the potential for upward transport of VOCs from groundwater to backfill soils used in the areas excavated during the 2000 Interim Measure. Location selected is northeast of the Former Lower Pond.
Tbl 2 SA 8 SV SAP_080213.xlsx Subarea 8 Soil Vapor SAP
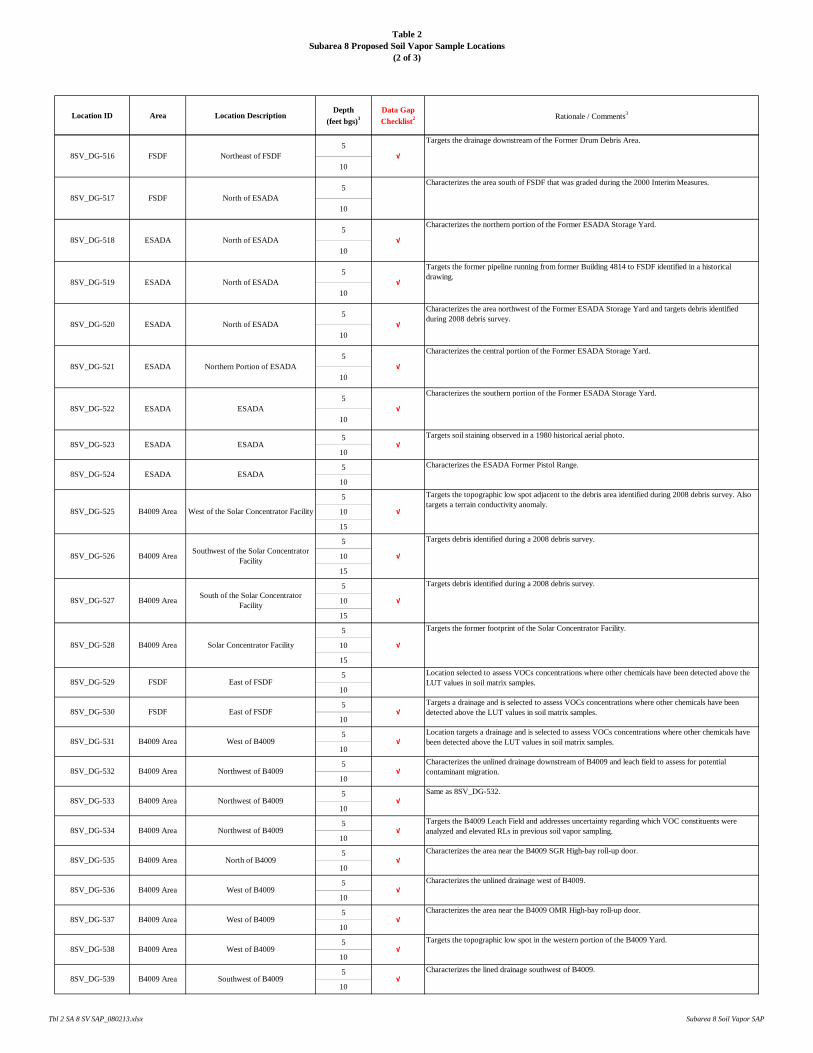
Table 2Subarea 8 Proposed Soil Vapor Sample Locations
(2 of 3)
Location ID Area Location Description Depth
(feet bgs)1Data Gap Checklist2 Rationale / Comments3
5
10
5
10
5
10
5
10
5
10
5
10
5
10
5
10
5
10
5
10
15
5
10
15
5
10
15
5
10
15
5
10
5
10
5
10
5
10
5
10
5
10
5
10
5
10
5
10
5
10
5
10
8SV_DG-521 ESADA Northern Portion of ESADA √
Characterizes the central portion of the Former ESADA Storage Yard.
8SV_DG-522 ESADA ESADA √
Characterizes the southern portion of the Former ESADA Storage Yard.
8SV_DG-519 ESADA North of ESADA √
Targets the former pipeline running from former Building 4814 to FSDF identified in a historical drawing.
8SV_DG-520 ESADA North of ESADA √
Characterizes the area northwest of the Former ESADA Storage Yard and targets debris identified during 2008 debris survey.
8SV_DG-517 FSDF North of ESADA
Characterizes the area south of FSDF that was graded during the 2000 Interim Measures.
8SV_DG-518 ESADA North of ESADA √
Characterizes the northern portion of the Former ESADA Storage Yard.
8SV_DG-516 FSDF Northeast of FSDF √
Targets the drainage downstream of the Former Drum Debris Area.
Characterizes the unlined drainage downstream of B4009 and leach field to assess for potential contaminant migration.8SV_DG-532 B4009 Area Northwest of B4009 √
Targets a drainage and is selected to assess VOCs concentrations where other chemicals have been detected above the LUT values in soil matrix samples.
8SV_DG-531 B4009 Area West of B4009 √Location targets a drainage and is selected to assess VOCs concentrations where other chemicals have been detected above the LUT values in soil matrix samples.
8SV_DG-530 FSDF East of FSDF √
Targets the former footprint of the Solar Concentrator Facility.
8SV_DG-529 FSDF East of FSDFLocation selected to assess VOCs concentrations where other chemicals have been detected above the LUT values in soil matrix samples.
8SV_DG-528 B4009 Area Solar Concentrator Facility √
Targets debris identified during a 2008 debris survey.
8SV_DG-527 B4009 AreaSouth of the Solar Concentrator
Facility√
Targets debris identified during a 2008 debris survey.
8SV_DG-526 B4009 AreaSouthwest of the Solar Concentrator
Facility√
Characterizes the ESADA Former Pistol Range.
8SV_DG-525 B4009 Area West of the Solar Concentrator Facility √
Targets the topographic low spot adjacent to the debris area identified during 2008 debris survey. Also targets a terrain conductivity anomaly.
8SV_DG-524 ESADA ESADA
8SV_DG-523 ESADA ESADA √Targets soil staining observed in a 1980 historical aerial photo.
Characterizes the lined drainage southwest of B4009.8SV_DG-539 B4009 Area Southwest of B4009 √
8SV_DG-538 B4009 Area West of B4009 √Targets the topographic low spot in the western portion of the B4009 Yard.
8SV_DG-537 B4009 Area West of B4009 √
B4009 Area West of B4009 √Characterizes the unlined drainage west of B4009.
8SV_DG-535 B4009 Area
Characterizes the area near the B4009 OMR High-bay roll-up door.
8SV_DG-533 B4009 Area Northwest of B4009 √Same as 8SV_DG-532.
8SV_DG-534 B4009 Area Northwest of B4009 √Targets the B4009 Leach Field and addresses uncertainty regarding which VOC constituents were analyzed and elevated RLs in previous soil vapor sampling.
North of B4009 √Characterizes the area near the B4009 SGR High-bay roll-up door.
8SV_DG-536
Tbl 2 SA 8 SV SAP_080213.xlsx Subarea 8 Soil Vapor SAP
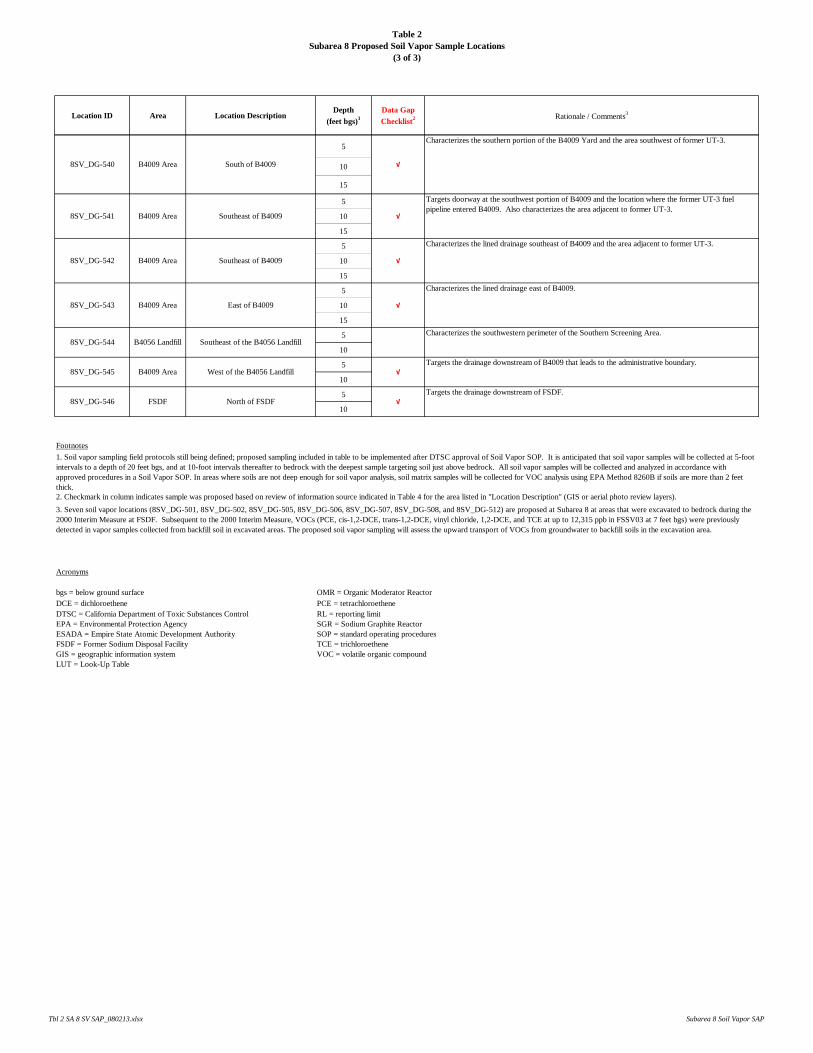
Table 2Subarea 8 Proposed Soil Vapor Sample Locations
(3 of 3)
Location ID Area Location Description Depth
(feet bgs)1Data Gap Checklist2 Rationale / Comments3
5
10
15
5
10
15
5
10
15
5
10
15
5
10
5
10
5
10
Footnotes
2. Checkmark in column indicates sample was proposed based on review of information source indicated in Table 4 for the area listed in "Location Description" (GIS or aerial photo review layers).
Acronyms
bgs = below ground surface OMR = Organic Moderator ReactorDCE = dichloroethene PCE = tetrachloroetheneDTSC = California Department of Toxic Substances Control RL = reporting limitEPA = Environmental Protection Agency SGR = Sodium Graphite ReactorESADA = Empire State Atomic Development Authority SOP = standard operating proceduresFSDF = Former Sodium Disposal Facility TCE = trichloroetheneGIS = geographic information system VOC = volatile organic compoundLUT = Look-Up Table
8SV_DG-545 B4009 Area West of the B4056 Landfill √Targets the drainage downstream of B4009 that leads to the administrative boundary.
8SV_DG-544 B4056 Landfill Southeast of the B4056 LandfillCharacterizes the southwestern perimeter of the Southern Screening Area.
3. Seven soil vapor locations (8SV_DG-501, 8SV_DG-502, 8SV_DG-505, 8SV_DG-506, 8SV_DG-507, 8SV_DG-508, and 8SV_DG-512) are proposed at Subarea 8 at areas that were excavated to bedrock during the 2000 Interim Measure at FSDF. Subsequent to the 2000 Interim Measure, VOCs (PCE, cis-1,2-DCE, trans-1,2-DCE, vinyl chloride, 1,2-DCE, and TCE at up to 12,315 ppb in FSSV03 at 7 feet bgs) were previously detected in vapor samples collected from backfill soil in excavated areas. The proposed soil vapor sampling will assess the upward transport of VOCs from groundwater to backfill soils in the excavation area.
Characterizes the lined drainage east of B4009.
8SV_DG-546 FSDF North of FSDF √Targets the drainage downstream of FSDF.
8SV_DG-543 B4009 Area East of B4009 √
Targets doorway at the southwest portion of B4009 and the location where the former UT-3 fuel pipeline entered B4009. Also characterizes the area adjacent to former UT-3.
8SV_DG-542 B4009 Area Southeast of B4009 √
Characterizes the lined drainage southeast of B4009 and the area adjacent to former UT-3.
8SV_DG-541 B4009 Area Southeast of B4009 √
8SV_DG-540 B4009 Area South of B4009 √
Characterizes the southern portion of the B4009 Yard and the area southwest of former UT-3.
1. Soil vapor sampling field protocols still being defined; proposed sampling included in table to be implemented after DTSC approval of Soil Vapor SOP. It is anticipated that soil vapor samples will be collected at 5-foot intervals to a depth of 20 feet bgs, and at 10-foot intervals thereafter to bedrock with the deepest sample targeting soil just above bedrock. All soil vapor samples will be collected and analyzed in accordance with approved procedures in a Soil Vapor SOP. In areas where soils are not deep enough for soil vapor analysis, soil matrix samples will be collected for VOC analysis using EPA Method 8260B if soils are more than 2 feet thick.
Tbl 2 SA 8 SV SAP_080213.xlsx Subarea 8 Soil Vapor SAP
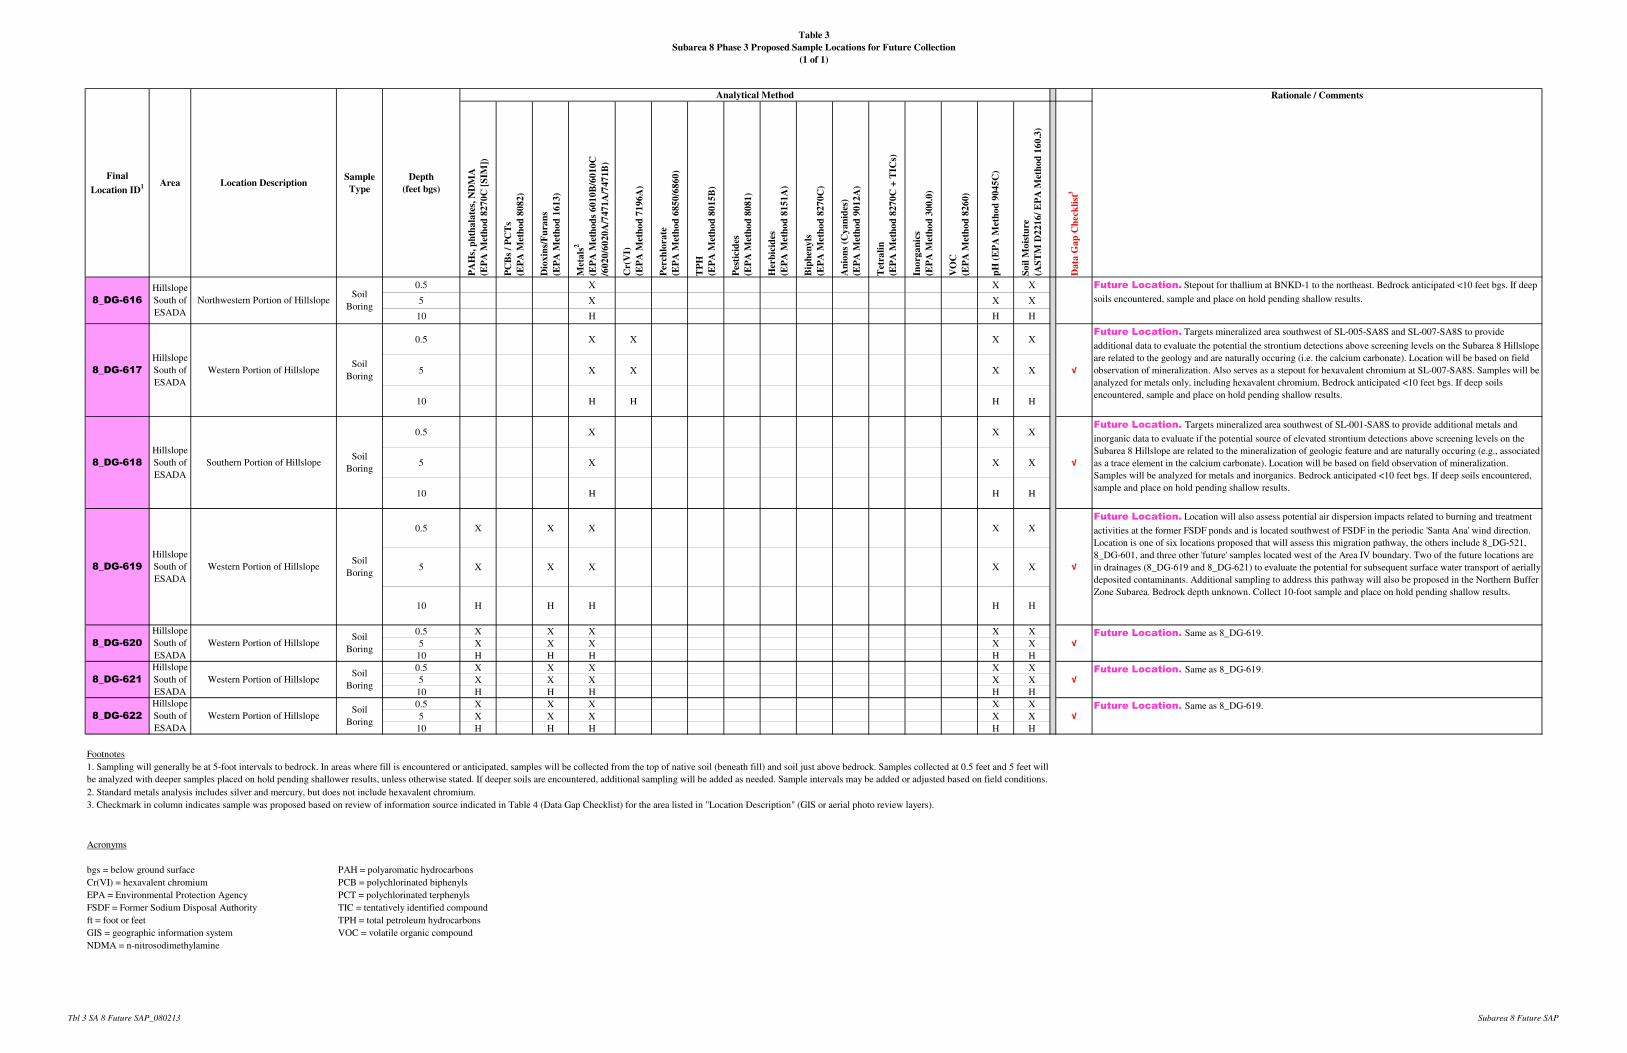
Table 3
Subarea 8 Phase 3 Proposed Sample Locations for Future Collection
(1 of 1)
PA
Hs,
ph
tha
late
s, N
DM
A
(EP
A M
eth
od
82
70
C [
SIM
])
PC
Bs
/ P
CT
s
(EP
A M
eth
od
80
82
)
Dio
xin
s/F
ura
ns
(EP
A M
eth
od
16
13
)
Met
als
2
(EP
A M
eth
od
s 6
01
0B
/60
10
C
/60
20
/60
20
A/7
47
1A
/74
71
B)
Cr(
VI)
(EP
A M
eth
od
71
96
A)
Per
chlo
rate
(EP
A M
eth
od
68
50
/68
60
)
TP
H
(EP
A M
eth
od
80
15
B)
Pes
tici
des
(EP
A M
eth
od
80
81
)
Her
bic
ides
(EP
A M
eth
od
81
51
A)
Bip
hen
yls
(EP
A M
eth
od
82
70
C)
An
ion
s (C
ya
nid
es)
(EP
A M
eth
od
90
12
A)
Tet
rali
n
(EP
A M
eth
od
82
70
C +
TIC
s)
Ino
rga
nic
s
(EP
A M
eth
od
30
0.0
)
VO
C
(EP
A M
eth
od
82
60
)
pH
(E
PA
Met
ho
d 9
04
5C
)
So
il M
ois
ture
(AS
TM
D2
21
6/
EP
A M
eth
od
16
0.3
)
Da
ta G
ap
Ch
eck
list
3
0.5 X X X
5 X X X
10 H H H
0.5 X X X X
5 X X X X
10 H H H H
0.5 X X X
5 X X X
10 H H H
0.5 X X X X X
5 X X X X X
10 H H H H H
0.5 X X X X X
5 X X X X X
10 H H H H H
0.5 X X X X X
5 X X X X X
10 H H H H H
0.5 X X X X X
5 X X X X X
10 H H H H H
Footnotes
2. Standard metals analysis includes silver and mercury, but does not include hexavalent chromium.
3. Checkmark in column indicates sample was proposed based on review of information source indicated in Table 4 (Data Gap Checklist) for the area listed in "Location Description" (GIS or aerial photo review layers).
Acronyms
bgs = below ground surface PAH = polyaromatic hydrocarbons
Cr(VI) = hexavalent chromium PCB = polychlorinated biphenyls
EPA = Environmental Protection Agency PCT = polychlorinated terphenyls
FSDF = Former Sodium Disposal Authority TIC = tentatively identified compound
ft = foot or feet TPH = total petroleum hydrocarbons
GIS = geographic information system VOC = volatile organic compound
NDMA = n-nitrosodimethylamine
√
Future Location. Location will also assess potential air dispersion impacts related to burning and treatment
activities at the former FSDF ponds and is located southwest of FSDF in the periodic 'Santa Ana' wind direction.
Location is one of six locations proposed that will assess this migration pathway, the others include 8_DG-521,
8_DG-601, and three other 'future' samples located west of the Area IV boundary. Two of the future locations are
in drainages (8_DG-619 and 8_DG-621) to evaluate the potential for subsequent surface water transport of aerially
deposited contaminants. Additional sampling to address this pathway will also be proposed in the Northern Buffer
Zone Subarea. Bedrock depth unknown. Collect 10-foot sample and place on hold pending shallow results.
8_DG-620
Hillslope
South of
ESADA
Western Portion of HillslopeSoil
Boring√
Future Location. Same as 8_DG-619.
8_DG-619
Hillslope
South of
ESADA
Western Portion of HillslopeSoil
Boring
√
Future Location. Targets mineralized area southwest of SL-005-SA8S and SL-007-SA8S to provide
additional data to evaluate the potential the strontium detections above screening levels on the Subarea 8 Hillslope
are related to the geology and are naturally occuring (i.e. the calcium carbonate). Location will be based on field
observation of mineralization. Also serves as a stepout for hexavalent chromium at SL-007-SA8S. Samples will be
analyzed for metals only, including hexavalent chromium. Bedrock anticipated <10 feet bgs. If deep soils
encountered, sample and place on hold pending shallow results.
8_DG-618
Hillslope
South of
ESADA
Southern Portion of HillslopeSoil
Boring√
Future Location. Targets mineralized area southwest of SL-001-SA8S to provide additional metals and
inorganic data to evaluate if the potential source of elevated strontium detections above screening levels on the
Subarea 8 Hillslope are related to the mineralization of geologic feature and are naturally occuring (e.g., associated
as a trace element in the calcium carbonate). Location will be based on field observation of mineralization.
Samples will be analyzed for metals and inorganics. Bedrock anticipated <10 feet bgs. If deep soils encountered,
sample and place on hold pending shallow results.
8_DG-617
Hillslope
South of
ESADA
Western Portion of HillslopeSoil
Boring
√
1. Sampling will generally be at 5-foot intervals to bedrock. In areas where fill is encountered or anticipated, samples will be collected from the top of native soil (beneath fill) and soil just above bedrock. Samples collected at 0.5 feet and 5 feet will
be analyzed with deeper samples placed on hold pending shallower results, unless otherwise stated. If deeper soils are encountered, additional sampling will be added as needed. Sample intervals may be added or adjusted based on field conditions.
Future Location. Same as 8_DG-619.
8_DG-622
Hillslope
South of
ESADA
Western Portion of HillslopeSoil
Boring√
Future Location. Same as 8_DG-619.
8_DG-621
Hillslope
South of
ESADA
Western Portion of HillslopeSoil
Boring
8_DG-616
Hillslope
South of
ESADA
Northwestern Portion of HillslopeSoil
Boring
Future Location. Stepout for thallium at BNKD-1 to the northeast. Bedrock anticipated <10 feet bgs. If deep
soils encountered, sample and place on hold pending shallow results.
Rationale / Comments
Final
Location ID1 Area Location Description
Sample
Type
Depth
(feet bgs)
Analytical Method
Tbl 3 SA 8 Future SAP_080213 Subarea 8 Future SAP
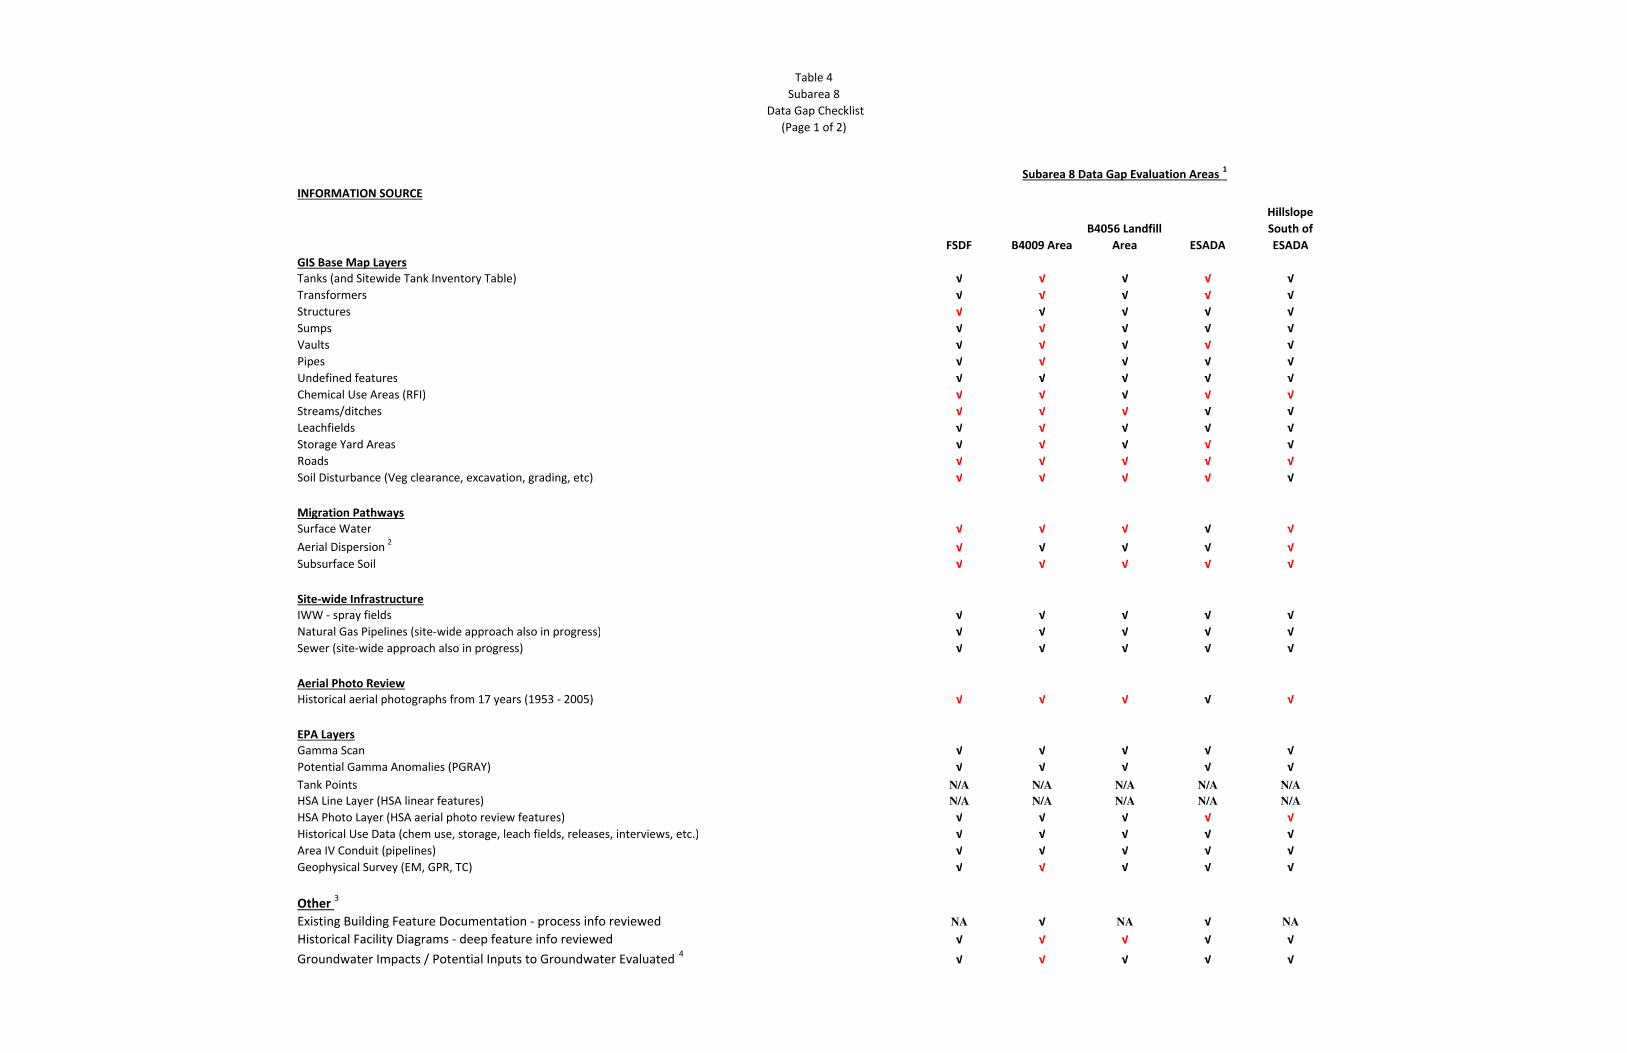
Table 4
Subarea 8
Data Gap Checklist
(Page 1 of 2)
INFORMATION SOURCE
FSDF B4009 Area
B4056 Landfill
Area ESADA
Hillslope
South of
ESADA
GIS Base Map Layers
Tanks (and Sitewide Tank Inventory Table) √ √ √ √ √
Transformers √ √ √ √ √
Structures √ √ √ √ √
Sumps √ √ √ √ √
Vaults √ √ √ √ √
Pipes √ √ √ √ √
Undefined features √ √ √ √ √
Chemical Use Areas (RFI) √ √ √ √ √
Streams/ditches √ √ √ √ √
Leachfields √ √ √ √ √
Storage Yard Areas √ √ √ √ √
Roads √ √ √ √ √
Soil Disturbance (Veg clearance, excavation, grading, etc) √ √ √ √ √
Migration Pathways
Surface Water √ √ √ √ √
Aerial Dispersion 2
√ √ √ √ √
Subsurface Soil √ √ √ √ √
Site-wide Infrastructure
IWW - spray fields √ √ √ √ √
Natural Gas Pipelines (site-wide approach also in progress) √ √ √ √ √
Sewer (site-wide approach also in progress) √ √ √ √ √
Aerial Photo Review
Historical aerial photographs from 17 years (1953 - 2005) √ √ √ √ √
EPA Layers
Gamma Scan √ √ √ √ √
Potential Gamma Anomalies (PGRAY) √ √ √ √ √
Tank Points N/A N/A N/A N/A N/A
HSA Line Layer (HSA linear features) N/A N/A N/A N/A N/A
HSA Photo Layer (HSA aerial photo review features) √ √ √ √ √
Historical Use Data (chem use, storage, leach fields, releases, interviews, etc.) √ √ √ √ √
Area IV Conduit (pipelines) √ √ √ √ √
Geophysical Survey (EM, GPR, TC) √ √ √ √ √
Other 3
Existing Building Feature Documentation - process info reviewed NA √ NA √ NA
Historical Facility Diagrams - deep feature info reviewed √ √ √ √ √
Groundwater Impacts / Potential Inputs to Groundwater Evaluated 4
√ √ √ √ √
Subarea 8 Data Gap Evaluation Areas 1
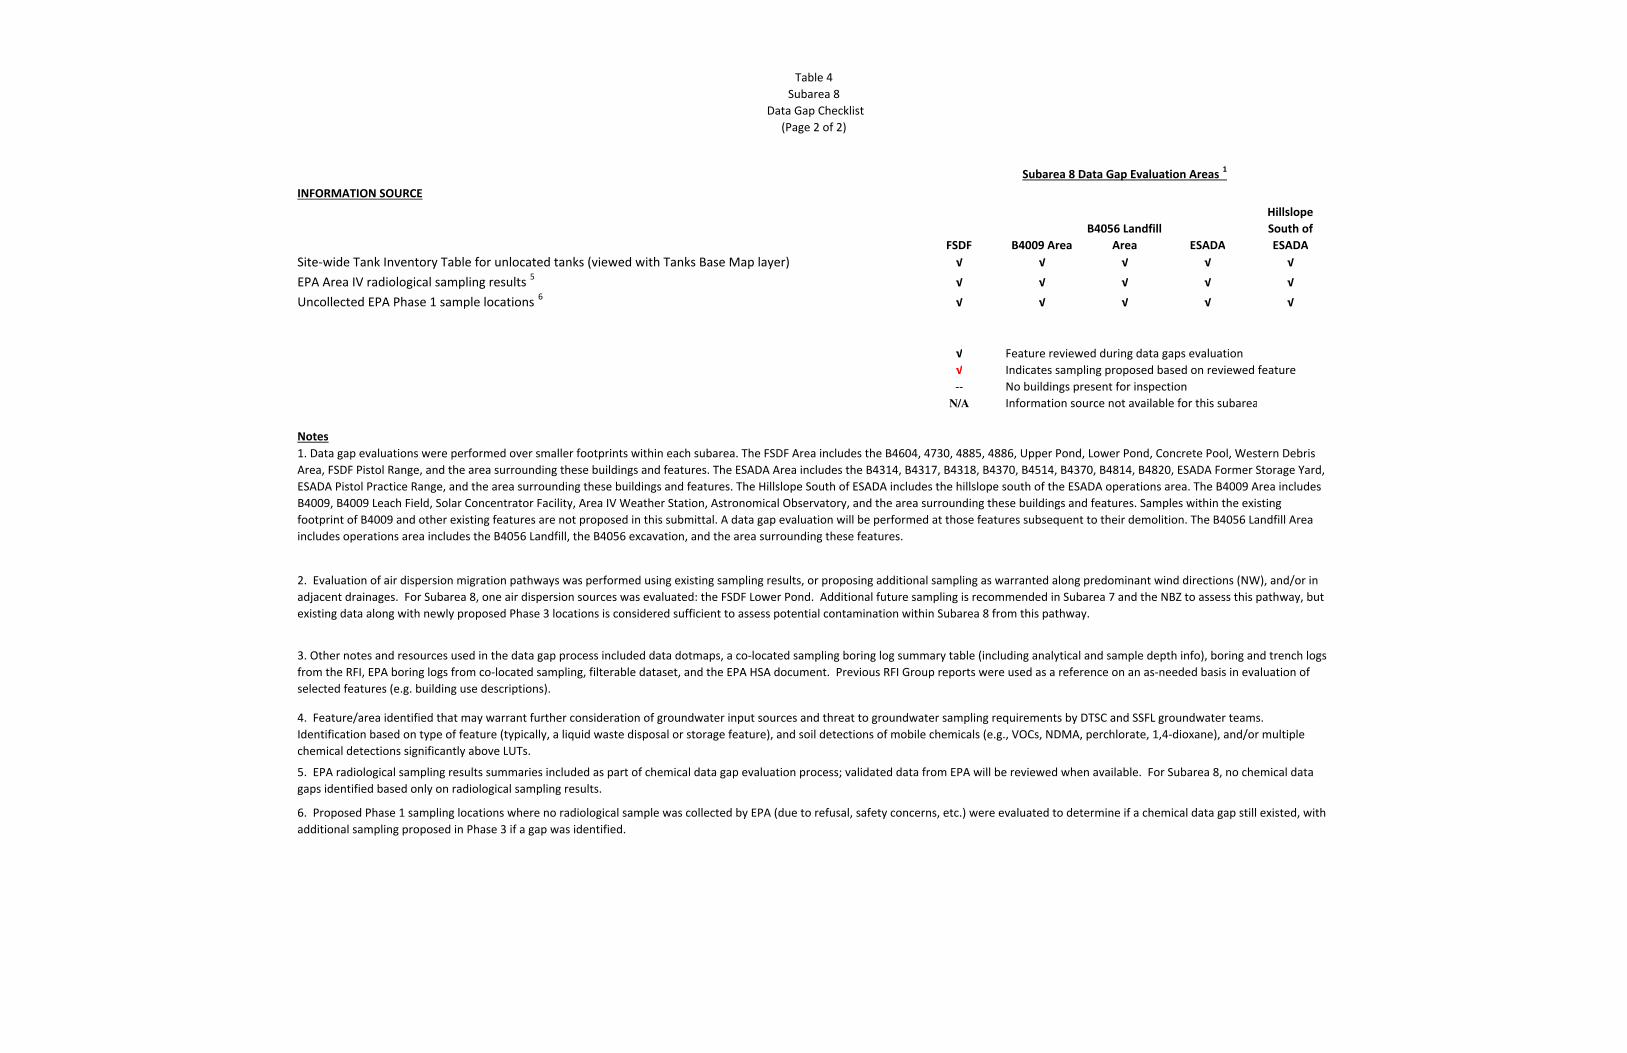
Table 4
Subarea 8
Data Gap Checklist
(Page 2 of 2)
INFORMATION SOURCE
FSDF B4009 Area
B4056 Landfill
Area ESADA
Hillslope
South of
ESADA
Subarea 8 Data Gap Evaluation Areas 1
Site-wide Tank Inventory Table for unlocated tanks (viewed with Tanks Base Map layer) √ √ √ √ √
EPA Area IV radiological sampling results 5
√ √ √ √ √
Uncollected EPA Phase 1 sample locations 6
√ √ √ √ √
√ Feature reviewed during data gaps evaluation
√ Indicates sampling proposed based on reviewed feature
-- No buildings present for inspection
N/A Information source not available for this subarea
Notes
6. Proposed Phase 1 sampling locations where no radiological sample was collected by EPA (due to refusal, safety concerns, etc.) were evaluated to determine if a chemical data gap still existed, with
additional sampling proposed in Phase 3 if a gap was identified.
2. Evaluation of air dispersion migration pathways was performed using existing sampling results, or proposing additional sampling as warranted along predominant wind directions (NW), and/or in
adjacent drainages. For Subarea 8, one air dispersion sources was evaluated: the FSDF Lower Pond. Additional future sampling is recommended in Subarea 7 and the NBZ to assess this pathway, but
existing data along with newly proposed Phase 3 locations is considered sufficient to assess potential contamination within Subarea 8 from this pathway.
1. Data gap evaluations were performed over smaller footprints within each subarea. The FSDF Area includes the B4604, 4730, 4885, 4886, Upper Pond, Lower Pond, Concrete Pool, Western Debris
Area, FSDF Pistol Range, and the area surrounding these buildings and features. The ESADA Area includes the B4314, B4317, B4318, B4370, B4514, B4370, B4814, B4820, ESADA Former Storage Yard,
ESADA Pistol Practice Range, and the area surrounding these buildings and features. The Hillslope South of ESADA includes the hillslope south of the ESADA operations area. The B4009 Area includes
B4009, B4009 Leach Field, Solar Concentrator Facility, Area IV Weather Station, Astronomical Observatory, and the area surrounding these buildings and features. Samples within the existing
footprint of B4009 and other existing features are not proposed in this submittal. A data gap evaluation will be performed at those features subsequent to their demolition. The B4056 Landfill Area
includes operations area includes the B4056 Landfill, the B4056 excavation, and the area surrounding these features.
3. Other notes and resources used in the data gap process included data dotmaps, a co-located sampling boring log summary table (including analytical and sample depth info), boring and trench logs
from the RFI, EPA boring logs from co-located sampling, filterable dataset, and the EPA HSA document. Previous RFI Group reports were used as a reference on an as-needed basis in evaluation of
selected features (e.g. building use descriptions).
5. EPA radiological sampling results summaries included as part of chemical data gap evaluation process; validated data from EPA will be reviewed when available. For Subarea 8, no chemical data
gaps identified based only on radiological sampling results.
4. Feature/area identified that may warrant further consideration of groundwater input sources and threat to groundwater sampling requirements by DTSC and SSFL groundwater teams.
Identification based on type of feature (typically, a liquid waste disposal or storage feature), and soil detections of mobile chemicals (e.g., VOCs, NDMA, perchlorate, 1,4-dioxane), and/or multiple
chemical detections significantly above LUTs.

FIGURES
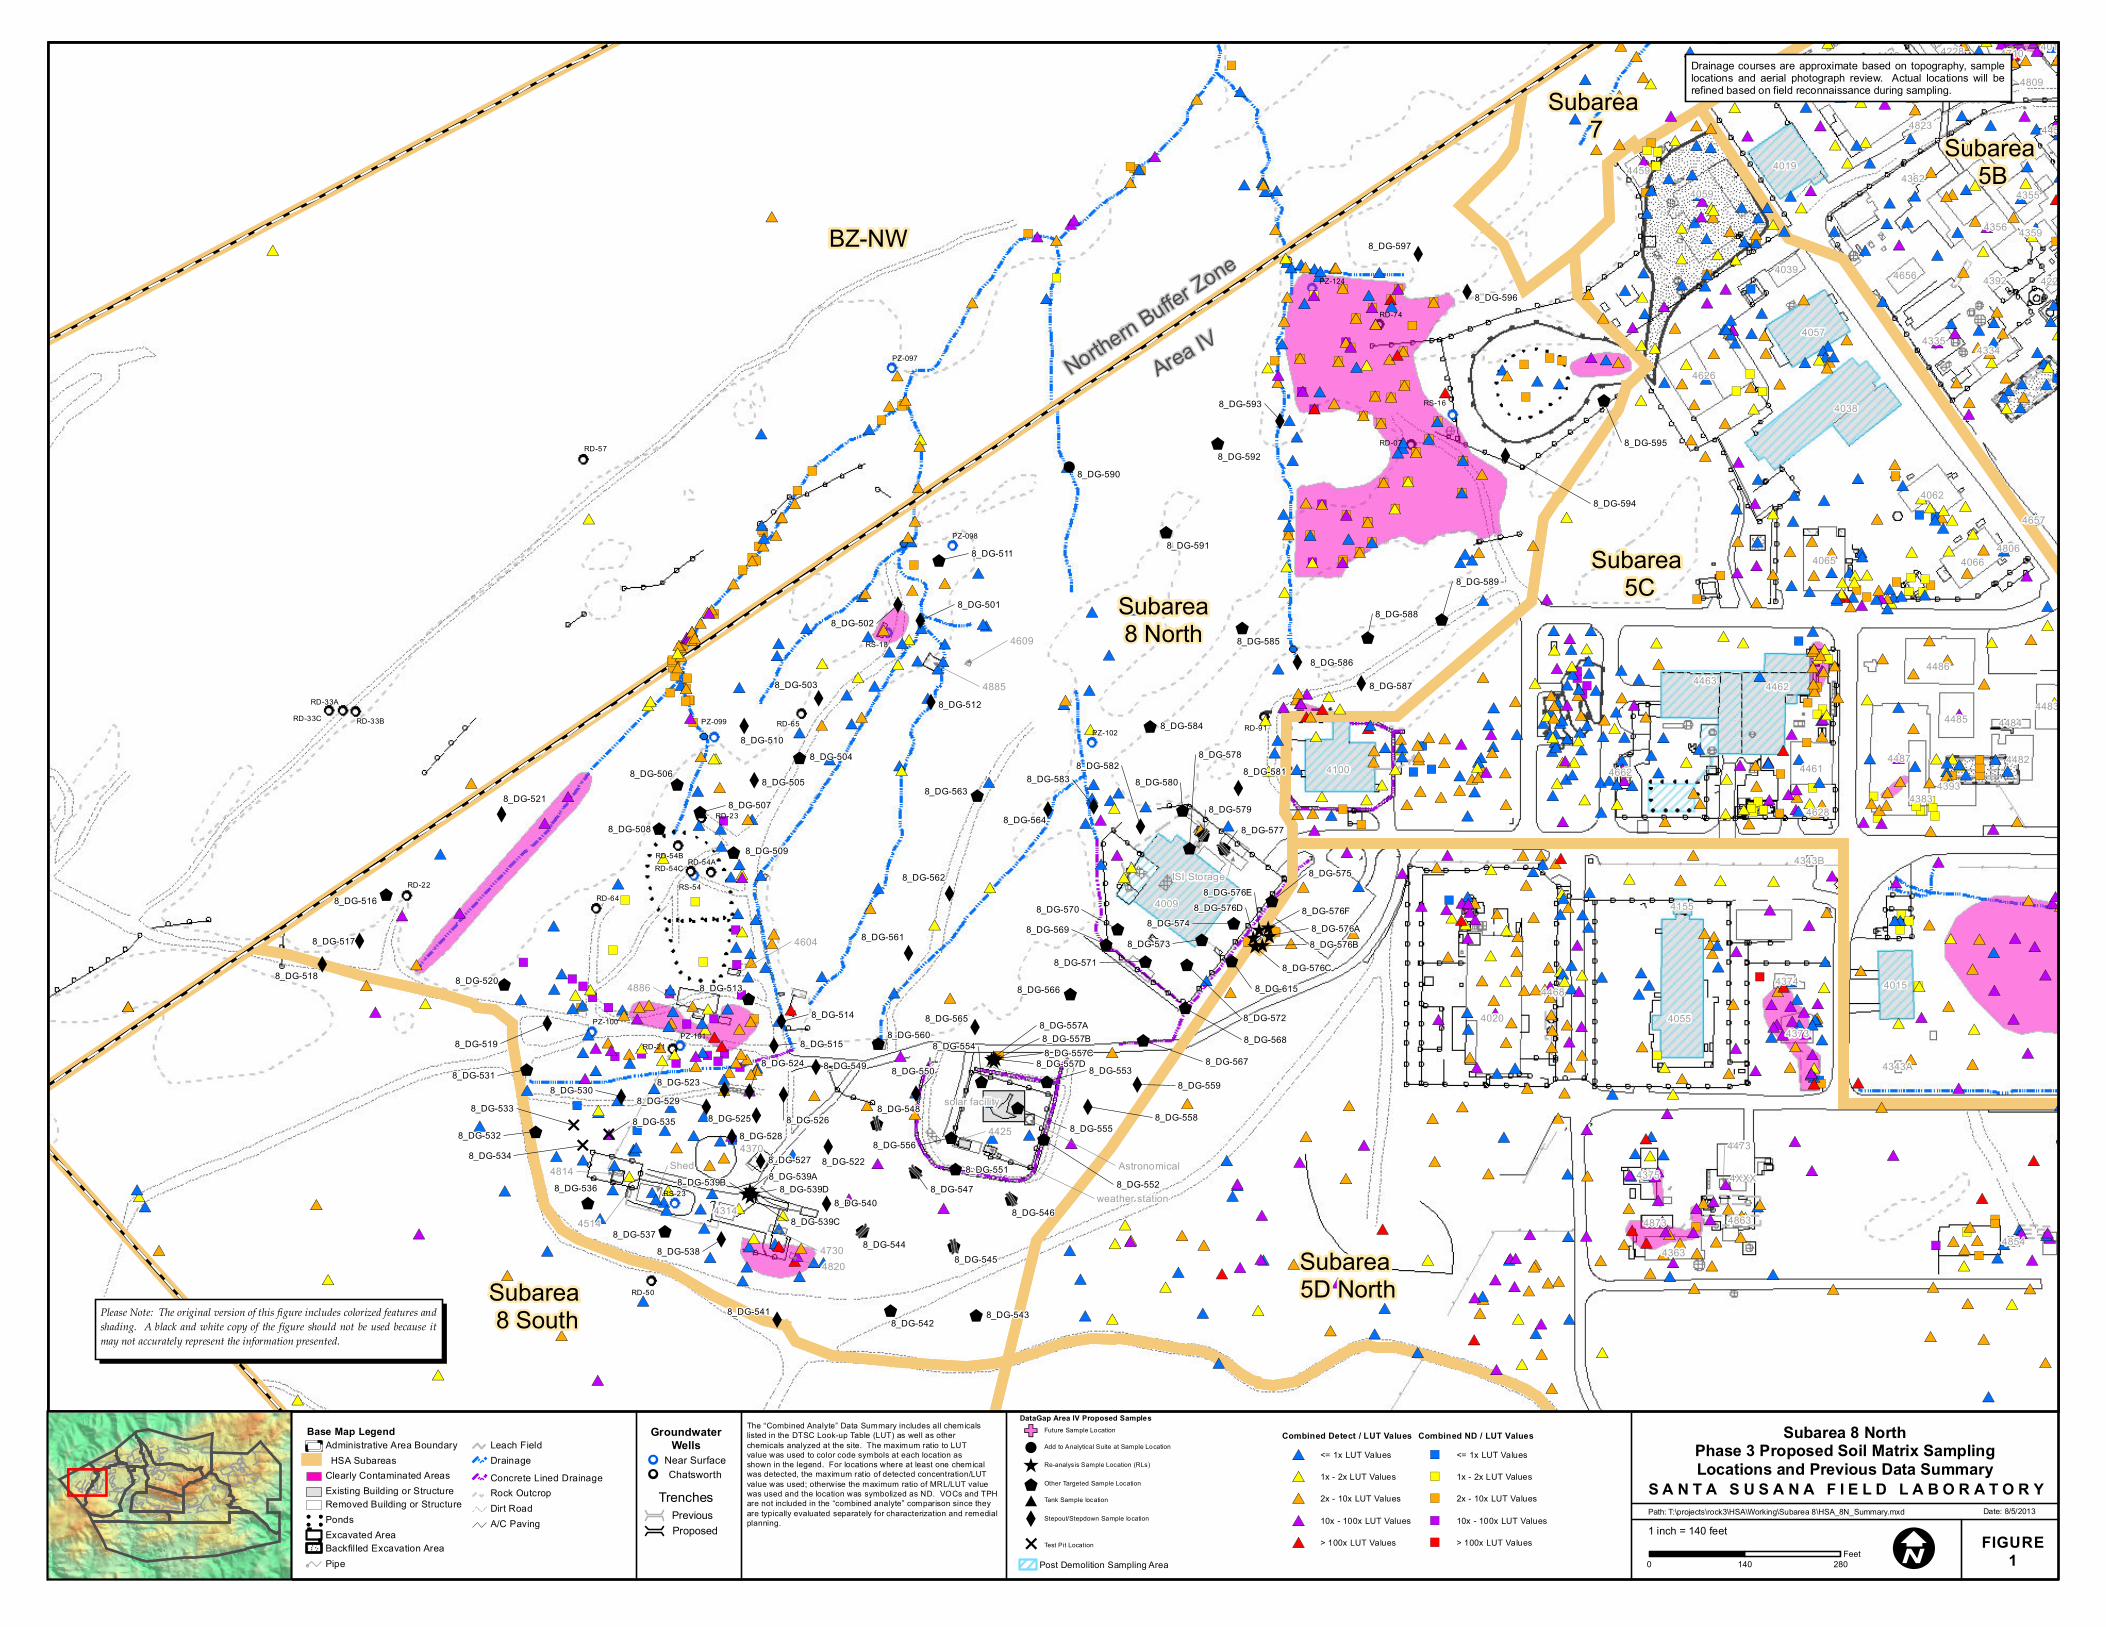
1 inch = 140 feet
")
")")
")
")
")
")")
")")
")
")
")
")")")
")")
")")")
")
")
")")
")
")
") ")
")
")
")
")
")
") ")
")
")
")
")
")
")
")
")
")
")
") ")
")")
")
")
")")
")
")
")
")
")
")
")
")")
")
")")
")")")
")
")
")
")
")
")")
")
")")
")
")")
")")
")")
")")")
")
")
")
")
")
")
")")
")
")")
")
")
")
")
")
")")
")
")
")
")
")")")
")
")") ")")")
")")
")
")
")
")
")
")")
")
")")
")")
")
")
")
") ")
")
") ")
")
")
")
")
")
")
")
")
")
")")
")
")
")
")
")
")
")
")")
")
")")")
") ")
")
")
")")
") ")
")")")")
")")")")") ")")
")
")
")")
")
")")
")") ")")")
")
")
")
")
#*#*#*#*
#*#*#*#*
#*#*#*#*#*
#*
#*
#*
#*#*
#*
#*
#*
#*
#*
#*
#*
#*
#*
#*
#*
#*
#*
#*
#*
#*
#*
#*
#*
#*
#*
#*
#*
#*#*#*#*
#*
#*
#*
#*#*
#*#*
#*
#*#*
#*
#*
#*
#*
#*
#*
#*
#*
#*
#*#*
#*#*
#*#*
#*
#*#*
#*
#*
#*
#*
#*
#*
#*
#*
#* #*
#*
#*
#*#*#*
#*
#*#*
#*
#*
#*
#*
#*
#*
#*
#*
#*#*
#*#*
#*
#*
#*#*
#*#*
#*#*#*
#* #*
#*#*
#*
#*
#*
#*#*
#*#*
#* #*
#*
#*
#*
#*
#*
#*
#*
#*
#*
#*#*#*#*
#*#*
#*
#*
#*
#*
#*
#*
#*
#*
#*
#*#* #*
#*
#*#*
#*#*
#*#*
#*#*#*
#*
#*#*
#*#*#*
#*
#*#*#*
#*#*#*#*
#*
#*
#*
#*#*
#*#*#*
#*
#*#*
#*
#*
#*
#*#*
#*
#*
#*
#*#*#*
#*
#*
#*
#* #*
#*#* #*
#*
#*
#*
#*
#*
#*
#*
#*
#*
#*
#*#*
#*#* #*
#*#*
#*
#* #*
#*
#*
#*
#*#*
#*#*
#*
#*
#*
#*
#*
#*
#*
#*
#*
#* #*#*
#*
#*
#*#*
#*
#*
#*
#*
#*#*
#*
#*
#*
#*
#*
#*
#*
#*
#*
#*
#*#*
#*
#*#*
#*
#*
#*
#* #*
#*#*
#*
#*
#*
#*#*
#* #*
#*
#*
#*
#*
#*
#*
#*
#* #*
#*
#*
#*#*#*#*#*
#*#*
#*#*
#*
#*#*
#*
#* #*#*
#*
#*
#*
#*
#*
#*
#*
#*
#*
#*
#*
#*#*
#*
#*#*
#*#*
#*#*
#*#*
#*#*#*
#*#*
#*#*
#*#*#* #*
#*
#*
#*
#* #*
#*#*
#*
#*
#*
#*
#*
#*#*
#*
#*#*#*
#*
#*
#*
#* #*
#*
#*
#*
#*#* #*#*#*#*
#*
#* #*
#* #*#*#*#*#*#*
#*
#*#*#*
#* #*#*
#*
#*
#*
#*
#*
#*
#*
#*
#*#*
#* #*
#*#*
#*
#* #*
#*#*
#*
#*#*#*
#*
#*
#*
#*
#*#*
#*
#*
#*
#*
#*
#*
#*
#*#*
#*#*
#* #*
#*
#*#*#*
#*
#*
#*
#*
#*
#*
#*
#*
#*
#*
#*
#*
#*
#*
#*#*#*
#*
#*#*
#*
#*
#*
#*
#*#*
#*
#*
#*
#*
#*
#*
#*
#*
#*
#*
#*
#*
#*
#*
#*
#*
#*
#*
#*
#*
#*
#*
#*
#*
#*
#*
#*
#*
#*
#*
#*
#*
#*
#*
#*
#*
#*
#*
#*
#*
#*
#*
#*
#*
#*
#*
#*
#*
#*
#*
#*
#*
#*
#*
#*
#*
#*
#*
#*
#*
#*
#*
#*
#*
#*
#*#*
#*
#*
#*
#*
#*
#*
#*
#* #*#*
#*
#*
#*
#*
#*
#*
#*
#*
#*
#*
#*
#*
#*
#*
#*
#*
#*
#*
#*
#*
#*
#*
#*
#*
#*
#*
#*
#*#*
#*
#*
#*
#*
#*
#*
#*
#*
#*
#*
#*
#*
#*
#*
#*
#*
#*
#*
#*
#*
#*
#*
#*
#*
#*#*
#* #*
#*
#*#*
#*
#*#* #*
#* #*#*
#* #*#*
#*
#*
#*
#*
#*
#*#*
#*
#*#*
#*
#*
#*
#*
#*
#*
#*
#*
#*
#*
#*
#*
#*
#*
#*
#*
#*
#*
#*
#*
#*
#*#*
#*#*
#*
#*
#*
#*
#*
#*
#*
#*
#*
#*
#*
#*#*
#*
#*
#*
#*
#*#*
#*
#*
#*
#*
#*
#*#*
#*
#*
#*
#*
#*
#*
#*
#*
#*
#*
#*
#*#*
#*
#*
#*
#*
#*
#*
#*
#*#*
#*
#*#*
#*
#* #*#*#*
#*
#*
#*
#*#*
#*#*#*#*
#*#*#*#*
#*#*#*#*#*
#*#*#* #*#*#*
#*
#*
#*
#*#*
#*
#*
#*
#*
#*
#* #*
#*#*
#*#*
#*
#*#*#*
#*
#*#*
#*
#* #*
#*#*
#*#*
#*
#* #*
#*
#*
#*
#*
#*
#*
#*
#*
#*
#*
#*
#*
#*#*
#*
#*
#*
#* #*#*
#*#*#*
#*#*#*
#*
#*#*
#*
#*
#*
#*
#*#*
#*
#*
#*
#*
#*#*
#*#*
#*
#*
#*
#*#*
#*#*
#*
#*
#*
#*
#*#*
#*
#*#*
#*
#*
#*
#*
#*
#*#*
#*
#*
#*#* #*
#*
#*#*
#*
#*#*#*#*
#*#*
#*
#*
#*
#*
#*
#*
#*
#*
#*
#*
#*#*
#*#*
#*
#*
#* #*#*
#*#* #*
#*
#*#*#*#*#*
#*
#*
#* #*#* #*
#*#*#*
#*#*#*
#*
#*
#*
#* #*
#*
#*#*#*#*#*#*#*
#*#*#*
#*#*
#*
#*
#*
#*#*
#*#*
#*
#*#*
#*#*
#* #*
#*
#*
#*
#*
#* #* #*
#*
#*#*
#* #*#*
#*
#*#*#* #*#*
#* #*#*#*#*
#* #*#*
#*#*
#*
#*
#*#*#* #*
#*
#*
#*
#*#*#*#*#*
#*#*#*
#*#*
#*
#* #* #*
#*#*#*#*
#*
#* #*
#*
#*
#*
#* #*
#*
#*
#*#*#*#*#* #*#*#*
#* #*#*
#*#*#*#*
#*#*
#* #*#*
#*
#*#*
#*#*
#*
#*
#*
#*
#*
#*#*
#*#*#*#*#*
#*#*
#* #*#*
#*
#*#*
#*
#*#*
#*
#*
#* #*#*
#*
#*#*
#*#*
#*
#*
#*
#*
#*
#*
#*
#*
#*#*#*
#*#*#*
#*#* #*#*
#*
#*
#*#*
#*#*
#*
#*#*
#*#*
#*
#*
#*
#*#*
#*
#*
#*
#*
#*#*
#*
#*
#*#*
#*
#*
#*
#*
#*
#*
#*
#*
#*
#*
#*#*
#*
#*#*
#*
#*
#*
#*
#*
#*#*
#*
#*
#*
#*
#*#*
#*#*
#*
#*
#*
#*
#*
#*
#*
#*
#*
#*
#*
#*
#*
#*
#*
#*
#*
#*
#*#*
#*
#*
#*
#*
#*
#*
#*#*
#*
#*
#*
#*
#*
#*
#*
#*
#*#*#*
#*#*
#*
#*
#*
#*
#*
#*
#*
#*#*#*
#* #*
#*
#*
#*
#*
#* #*
#*
#*
#* #*
#*
#*#*
#*
#*
#*
#*
#* #*
#*
#*
#*
#*
#*#*#*#*
#*
#*
#* #*
#*
#*
#*
#*
#*
#*#*#*
#*
#*#* #*#*#*
#*#*
#*
#*
#*
#*
#*#*
#*
#*
#*
#*
#*#*
#*
#*
#*#*
#*
#*#*#*
#*
#*
#*
#* #*#*
#*
#*
#* #*
#*
#* #*
#*
#*#*
#*#*
#*
#*#*
#* #*#*
#*
#*
#*
#* #*
#* #*
#* #*#*
#*
#*#*
#*#*#*
#*#*
#*#*
#*#*#*
#* #*#*
#* #* #*#*#*
#*#*
#*
#*
#* #*#*#*
#* #* #*#*#*
#*#*#*#*#*
#*
#*
#*
#*#*#*#*
#*#*#*#*#*
#*
#*#*
#*
#*
#*
$
XX
$
$
X
X
XX
$
X
X
X$
$
X
X
X
X
$
EE$
$^̂̂̂
X
X
X
X
$
X X
XE
X
$$
$
$
^̂̂̂
$
$$
$
$
X
$
X
$
$X
X
X
$
$$
$
X
$
$
X
$
$
$
^^̂̂
$
$
$X
X XX
$
$
!
$
$
X
$
X
$
X
X
X
$
$
$
$
$
$
$
X
X
X
$
X$
^̂$
8_DG-513
8_DG-514
8_DG-515
8_DG-520
8_DG-509
8_DG-517
8_DG-521
8_DG-5018_DG-502
8_DG-511
8_DG-503
8_DG-510
8_DG-5058_DG-506
8_DG-507
8_DG-519
8_DG-526
8_DG-527
8_DG-529
8_DG-531
8_DG-534
8_DG-533
8_DG-532
8_DG-5368_DG-539A8_DG-539B
8_DG-539C
8_DG-539D
8_DG-522
8_DG-540
8_DG-538
8_DG-541
8_DG-537
8_DG-5238_DG-524
8_DG-5288_DG-535
8_DG-549
8_DG-5448_DG-545
8_DG-542
8_DG-547
8_DG-557A8_DG-557B8_DG-557C
8_DG-557D
8_DG-5558_DG-556
8_DG-548
8_DG-553
8_DG-551
8_DG-558
8_DG-546
8_DG-559
8_DG-552
8_DG-567
8_DG-565
8_DG-562
8_DG-561
8_DG-563
8_DG-566
8_DG-568
8_DG-569
8_DG-530
8_DG-574
8_DG-572
8_DG-512
8_DG-5738_DG-571
8_DG-577
8_DG-576D8_DG-576A
8_DG-576F8_DG-576E
8_DG-575
8_DG-578
8_DG-5808_DG-582
8_DG-564
8_DG-583 8_DG-581
8_DG-584
8_DG-585
8_DG-5908_DG-592
8_DG-591
8_DG-586
8_DG-589
8_DG-594
8_DG-595
8_DG-596
8_DG-597
8_DG-593
8_DG-543
8_DG-579
8_DG-560
8_DG-588
8_DG-570
8_DG-504
8_DG-508
8_DG-518
8_DG-525
8_DG-587
8_DG-516
8_DG-550
8_DG-554
8_DG-576B
8_DG-576C8_DG-615
PZ-102
PZ-098
PZ-097
PZ-099
PZ-100PZ-101
PZ-124
RD-90
RD-91
RD-88
RD-97
RS-54
RD-21
RD-22
RD-23
RD-50
RD-54ARD-54BRD-54C
RD-07
RS-16
RS-18
RS-23
RD-64
RD-65
RD-33A
RD-33BRD-33C
RD-57
RD-74
RS-27
PZ-108
PZ-121
PZ-122
RD-93
4055
4015
4057
4463
4155
4019
4038
4462
4626
4486
4483
4310
4662
4854
4468
4373
47104228
4335
4485 4484
44824461
4343B
4809
4806
4823
4020
4010
4375 4XXX
4473
4863
4363
44594059
4362
4873
4392
4413
4013
4457
4334
4062
40664065
4359
4039
4356
4656 4226
48084012
4355
4657
4628
4343A
41004487
43834393
4374
weather station
4609
Astronomical4814
47304820
4514
4009
solar facility
4886
4885
4604
ISI Storage
4425
Shed4370
4314
Please Note: The original version of this figure includes colorized features andshading. A black and white copy of the figure should not be used because itmay not accurately represent the information presented.
Base Map LegendAdministrative Area BoundaryHSA Subareas
Clearly Contaminated AreasExisting Building or StructureRemoved Building or Structure
ââââââ ââ PondsExcavated AreaBackfilled Excavation Area
!! Pipe
Leach FieldDrainageConcrete Lined DrainageRock OutcropDirt RoadA/C Paving
GroundwaterWells
!! Near Surface!! Chatsworth
I
Subarea 8 NorthPhase 3 Proposed Soil Matrix SamplingLocations and Previous Data Summary
S A N T A S U S A N A F I E L D L A B O R A T O R Y
FIGURE1
Path: T:\projects\rock3\HSA\Working\Subarea 8\HSA_8N_Summary.mxd Date: 8/5/2013
Post Demolition Sampling Area 0 140 280Feet
Drainage courses are approximate based on topography, samplelocations and aerial photograph review. Actual locations will berefined based on field reconnaissance during sampling.
Trenches
ProposedPrevious
Northern Buffer Zone
Area IV
DataGap Area IV Proposed SamplesGF Future Sample Location
! Add to Analytical Suite at Sample Location
^ Re-analysis Sample Location (RLs)
$ Other Targeted Sample Location
# Tank Sample location
X Stepout/Stepdown Sample location
E Test Pit Location
Subarea 8 South
Subarea8 North
Subarea 5D North
BZ-NW
Subarea 7
Subarea 5C
Subarea 5B
The “Combined Analyte” Data Summary includes all chemicals listed in the DTSC Look-up Table (LUT) as well as other chemicals analyzed at the site. The maximum ratio to LUT value was used to color code symbols at each location as shown in the legend. For locations where at least one chemical was detected, the maximum ratio of detected concentration/LUT value was used; otherwise the maximum ratio of MRL/LUT value was used and the location was symbolized as ND. VOCs and TPH are not included in the “combined analyte” comparison since they are typically evaluated separately for characterization and remedial planning.
Combined Detect / LUT Values
#* <= 1x LUT Values
#* 1x - 2x LUT Values
#* 2x - 10x LUT Values
#* 10x - 100x LUT Values
#* > 100x LUT Values
Combined ND / LUT Values") <= 1x LUT Values
") 1x - 2x LUT Values
") 2x - 10x LUT Values
") 10x - 100x LUT Values
") > 100x LUT Values
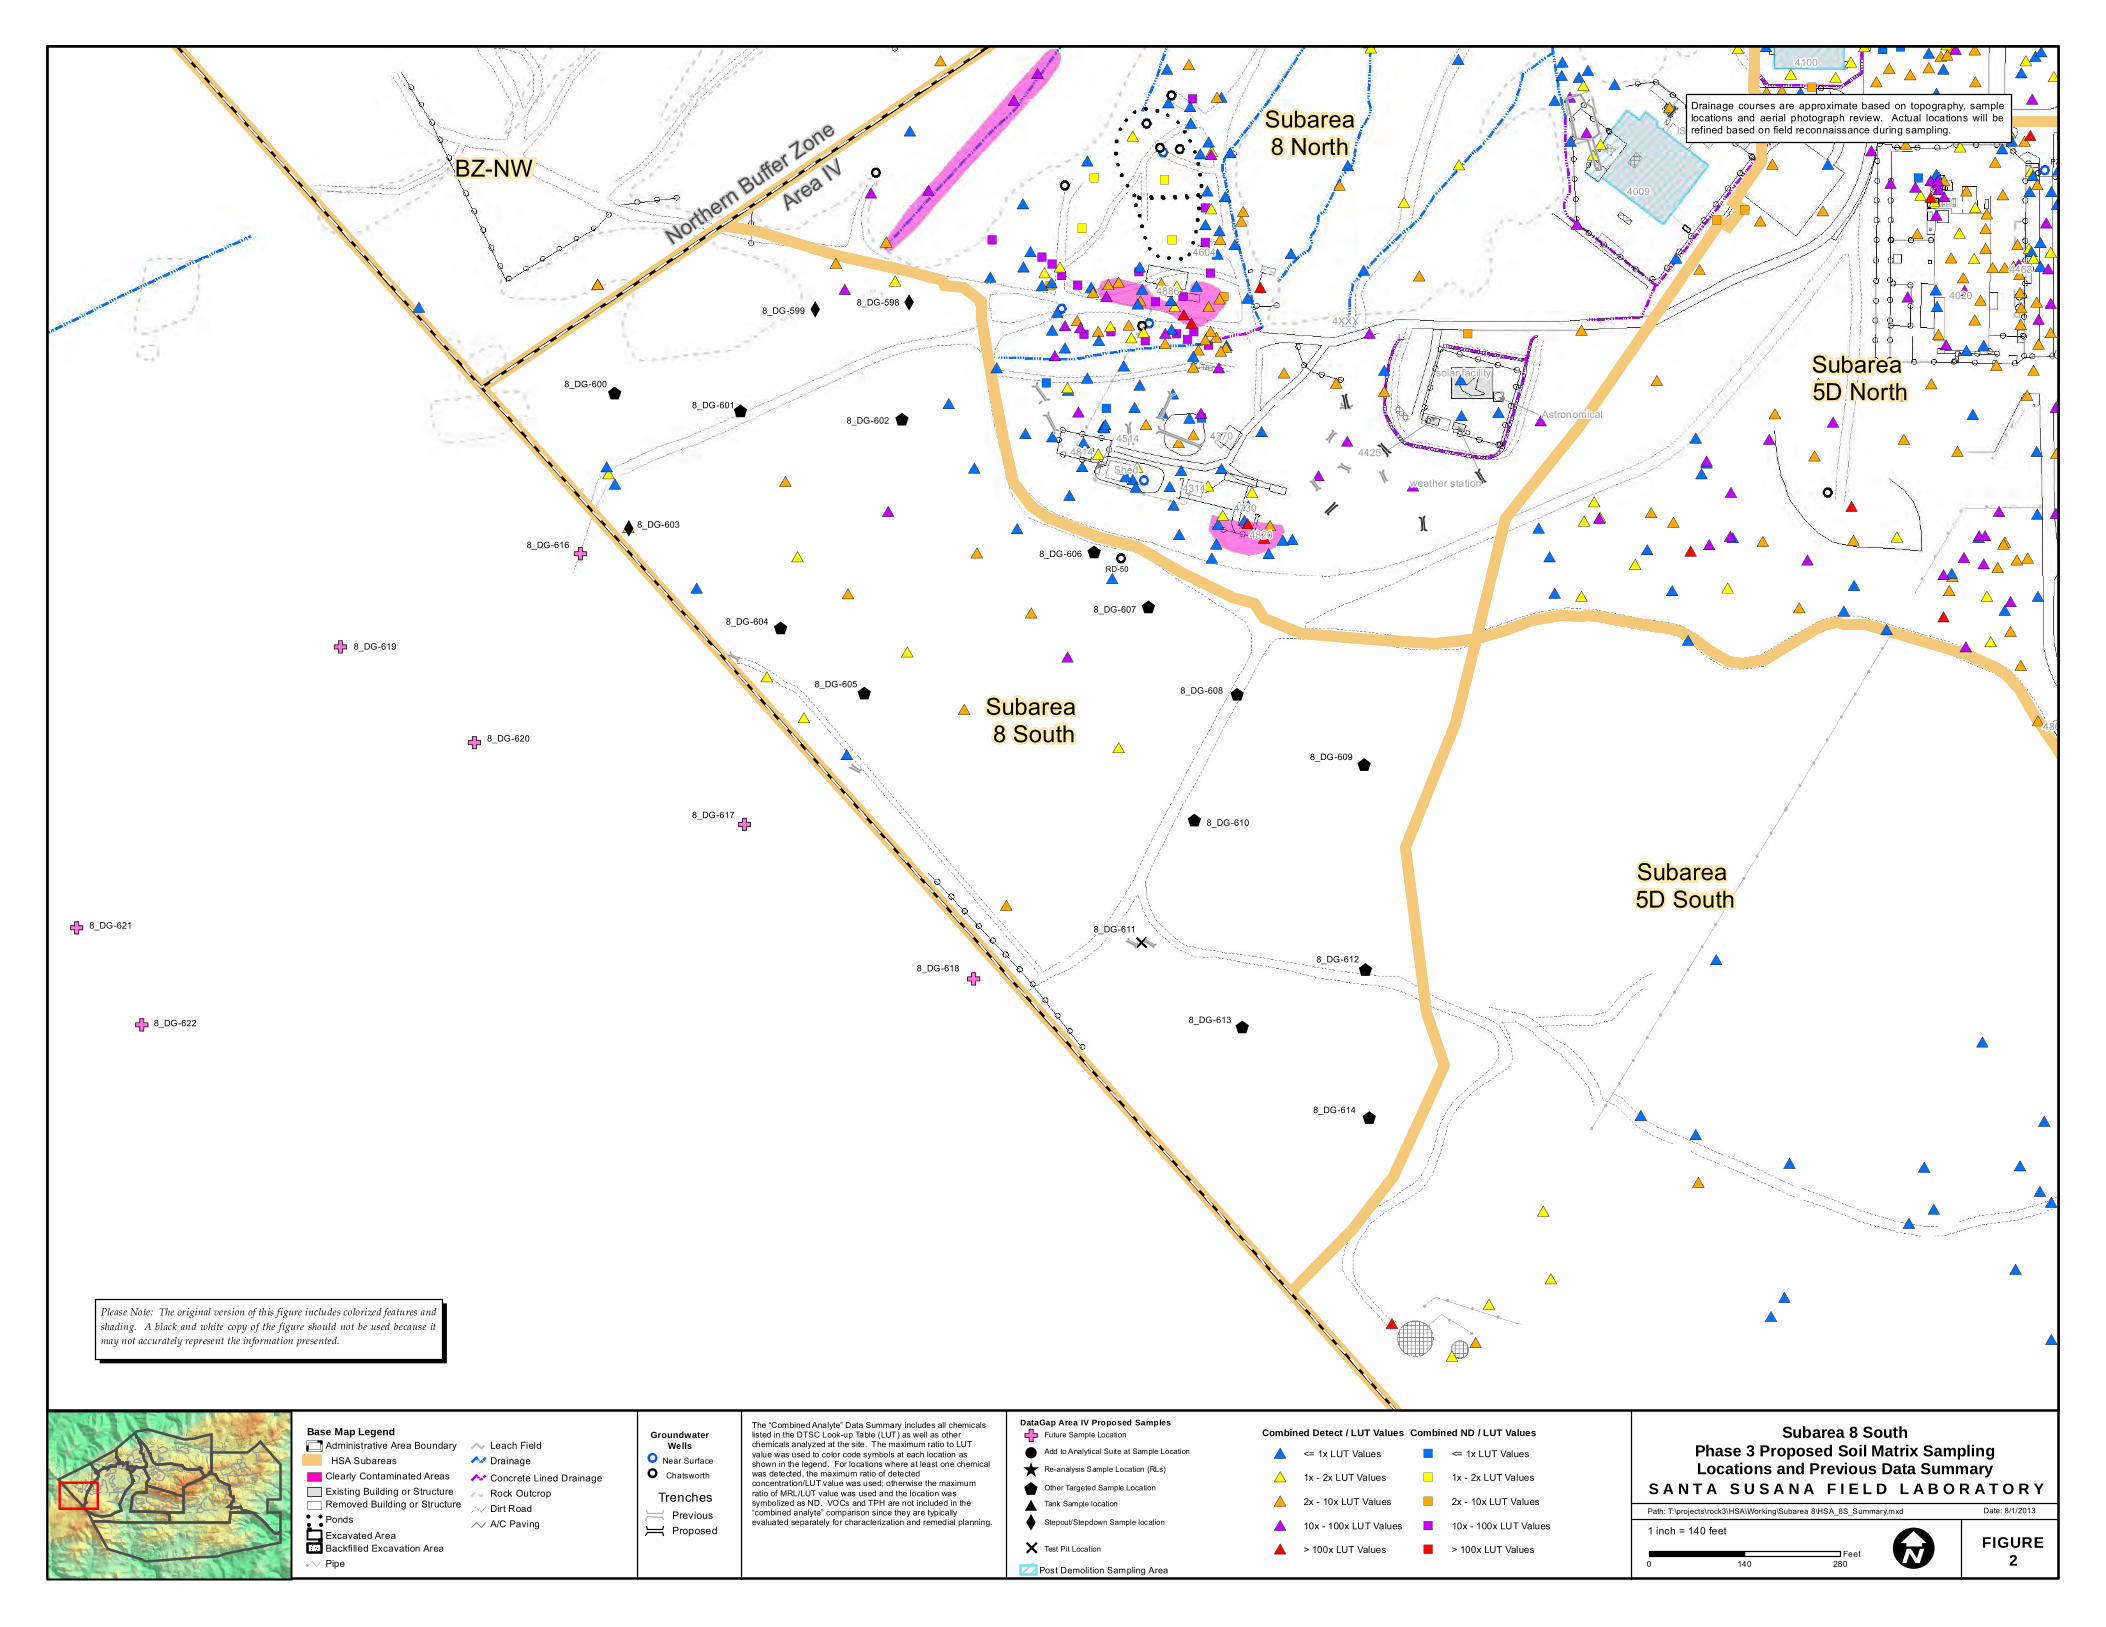
1 inch = 140 feet
")
")")
")
")")
")")
")
")
")
") ")
")
")
")
")
")")")
")
")") ")")")
")")
")
")")
")
")
")")
") ")
#*#*#*#*
#*#*#*#*
#*#*#*#*#*
#*
#*
#*
#*#*
#*
#*#*
#*
#*
#*
#*
#*
#*
#*#*
#*
#* #*
#*
#*
#*
#*
#*
#*
#* #*
#*
#*
#*
#* #*
#*
#*
#*
#*#*#* #*
#*
#*#*
#*#*
#*#*#*
#*#*
#*#*#*
#*
#*#*#*#*#*
#*
#*
#*
#*
#*
#*
#*
#*#*
#*#* #*
#*#*
#*
#* #*
#*
#*
#*
#*#*
#*#*
#*
#*
#*
#*
#*
#*
#*
#*
#*
#* #*#*
#*
#*
#*#*
#*
#*
#*
#*
#*#*
#*
#*
#*
#*
#*
#*
#*
#*
#*
#* #*
#*
#*
#*
#*
#*
#* #*
#*
#*
#*#*#*#*#*
#*#*
#*#*
#*
#*
#*
#*
#*
#*
#*#*
#*
#* #*#*
#*
#*
#*
#*
#*
#*
#*
#*
#*#*
#* #*
#*#*
#*
#* #*
#*#*
#*
#*#*#*
#*
#*
#*
#*
#*#*
#*
#*
#*
#*
#*
#*
#*
#*#*
#*#*
#* #*
#*
#*#*
#*
#*
#*
#*#*#*
#*#*#*
#*#*
#* #*
#*#*
#*
#*#* #*
#* #*#*
#* #*#*
#*#*#*
#* #*#*
#*#*#*
#*#*#*
#*
#*
#*#*
#*
#*
#*
#*
#*#*
#*#*
#*
#*
#* #*#*
#*#* #*
#*
#*#*#*#*#*
#*
#*
#* #*
#* #*
#*#*#*
#*#*#*
#*
#*
#*
#* #*
#*
#*#*#*#*#*#*#*
#*#*#*
#*#*
#*
#*
#*
#*#*
#*#*
#*
#*#*
#*
#*
#*
#*
#*
#*
#*#*
#*#*
#*
#*
#*
#*
#*#*
#*#*#*#*#*
#*#*
#* #*#*
#*
#*#*
#*
#*#*
#*
#*
#* #*#*
#*
#*#*
#*#*
#*
#*
#*
#*
#*
#*
#*
#*
#*
#*#*
#*
#*
#*
#*#*
#*
#*
#*#*#*
#*#*#*
#*#* #*#*
#*
#*
#*#*
#*#*
#*
#*#*
#*#*
#*
#*
#*
#*#*
#*
#*
#*
#*
#*#*
#*
#*
#*#*
#*
#*
#*
#*
#*
#*
#*
#*#*
#* #*
#*
#*
#*#*
#*#*
#*#*
#*
#*
#*
#*
#*
#*#*
#*
#*
#*
#*
#*
#*
#*
#*
#*
#*
#*
#*
#*
#*#*#*
#*#*
#*
#*
#*
#*
#*
#*
#*
#*
#*
#*#*
#*
#*
#*#*
#* #*
#*#*#*
#*
#*
#*
#*
#* #*#*#*
X X
XGF
$
$
$$
$
E
$
$
$
$
$
GF
GF
$
$
$
GF
GF
GF
GF
8_DG-599 8_DG-598
8_DG-6028_DG-601
8_DG-600
8_DG-603
8_DG-606
8_DG-607
8_DG-6088_DG-605
8_DG-604
8_DG-617
8_DG-609
8_DG-610
8_DG-612
8_DG-613
8_DG-614
8_DG-611
8_DG-618
8_DG-622
8_DG-621
8_DG-619
8_DG-620
8_DG-616
RD-50
PZ-103
4468
4020
4100
4865
weather station
4XXX
Astronomical
4814
4730
4820
4514
4009
solar facility
4886
4604
ISI Storage
4425Shed
4370
4314
Please Note: The original version of this figure includes colorized features andshading. A black and white copy of the figure should not be used because itmay not accurately represent the information presented.
Base Map LegendAdministrative Area Boundary
HSA SubareasClearly Contaminated AreasExisting Building or StructureRemoved Building or Structure
ââââââ ââ PondsExcavated AreaBackfilled Excavation Area
!! Pipe
Leach FieldDrainageConcrete Lined DrainageRock OutcropDirt RoadA/C Paving
GroundwaterWells
!! Near Surface!! Chatsworth
I
Subarea 8 SouthPhase 3 Proposed Soil Matrix SamplingLocations and Previous Data Summary
S A N T A S U S A N A F I E L D L A B O R A T O R Y
FIGURE2
Path: T:\projects\rock3\HSA\Working\Subarea 8\HSA_8S_Summary.mxd Date: 8/1/2013
Post Demolition Sampling Area 0 140 280Feet
Drainage courses are approximate based on topography, samplelocations and aerial photograph review. Actual locations will berefined based on field reconnaissance during sampling.
Trenches
ProposedPrevious
The “Combined Analyte” Data Summary includes all chemicals listed in the DTSC Look-up Table (LUT) as well as other chemicals analyzed at the site. The maximum ratio to LUT value was used to color code symbols at each location as shown in the legend. For locations where at least one chemicalwas detected, the maximum ratio of detected concentration/LUT value was used; otherwise the maximum ratio of MRL/LUT value was used and the location was symbolized as ND. VOCs and TPH are not included in the “combined analyte” comparison since they are typically evaluated separately for characterization and remedial planning.
Northern Buffer Zone
Area IV
DataGap Area IV Proposed SamplesGF Future Sample Location
! Add to Analytical Suite at Sample Location
^ Re-analysis Sample Location (RLs)
$ Other Targeted Sample Location
# Tank Sample location
X Stepout/Stepdown Sample location
E Test Pit Location
Subarea 8 South
Subarea 5D South
Subarea8 North
Subarea 5D North
BZ-NW
Combined Detect / LUT Values#* <= 1x LUT Values
#* 1x - 2x LUT Values
#* 2x - 10x LUT Values
#* 10x - 100x LUT Values
#* > 100x LUT Values
Combined ND / LUT Values") <= 1x LUT Values
") 1x - 2x LUT Values
") 2x - 10x LUT Values
") 10x - 100x LUT Values
") > 100x LUT Values
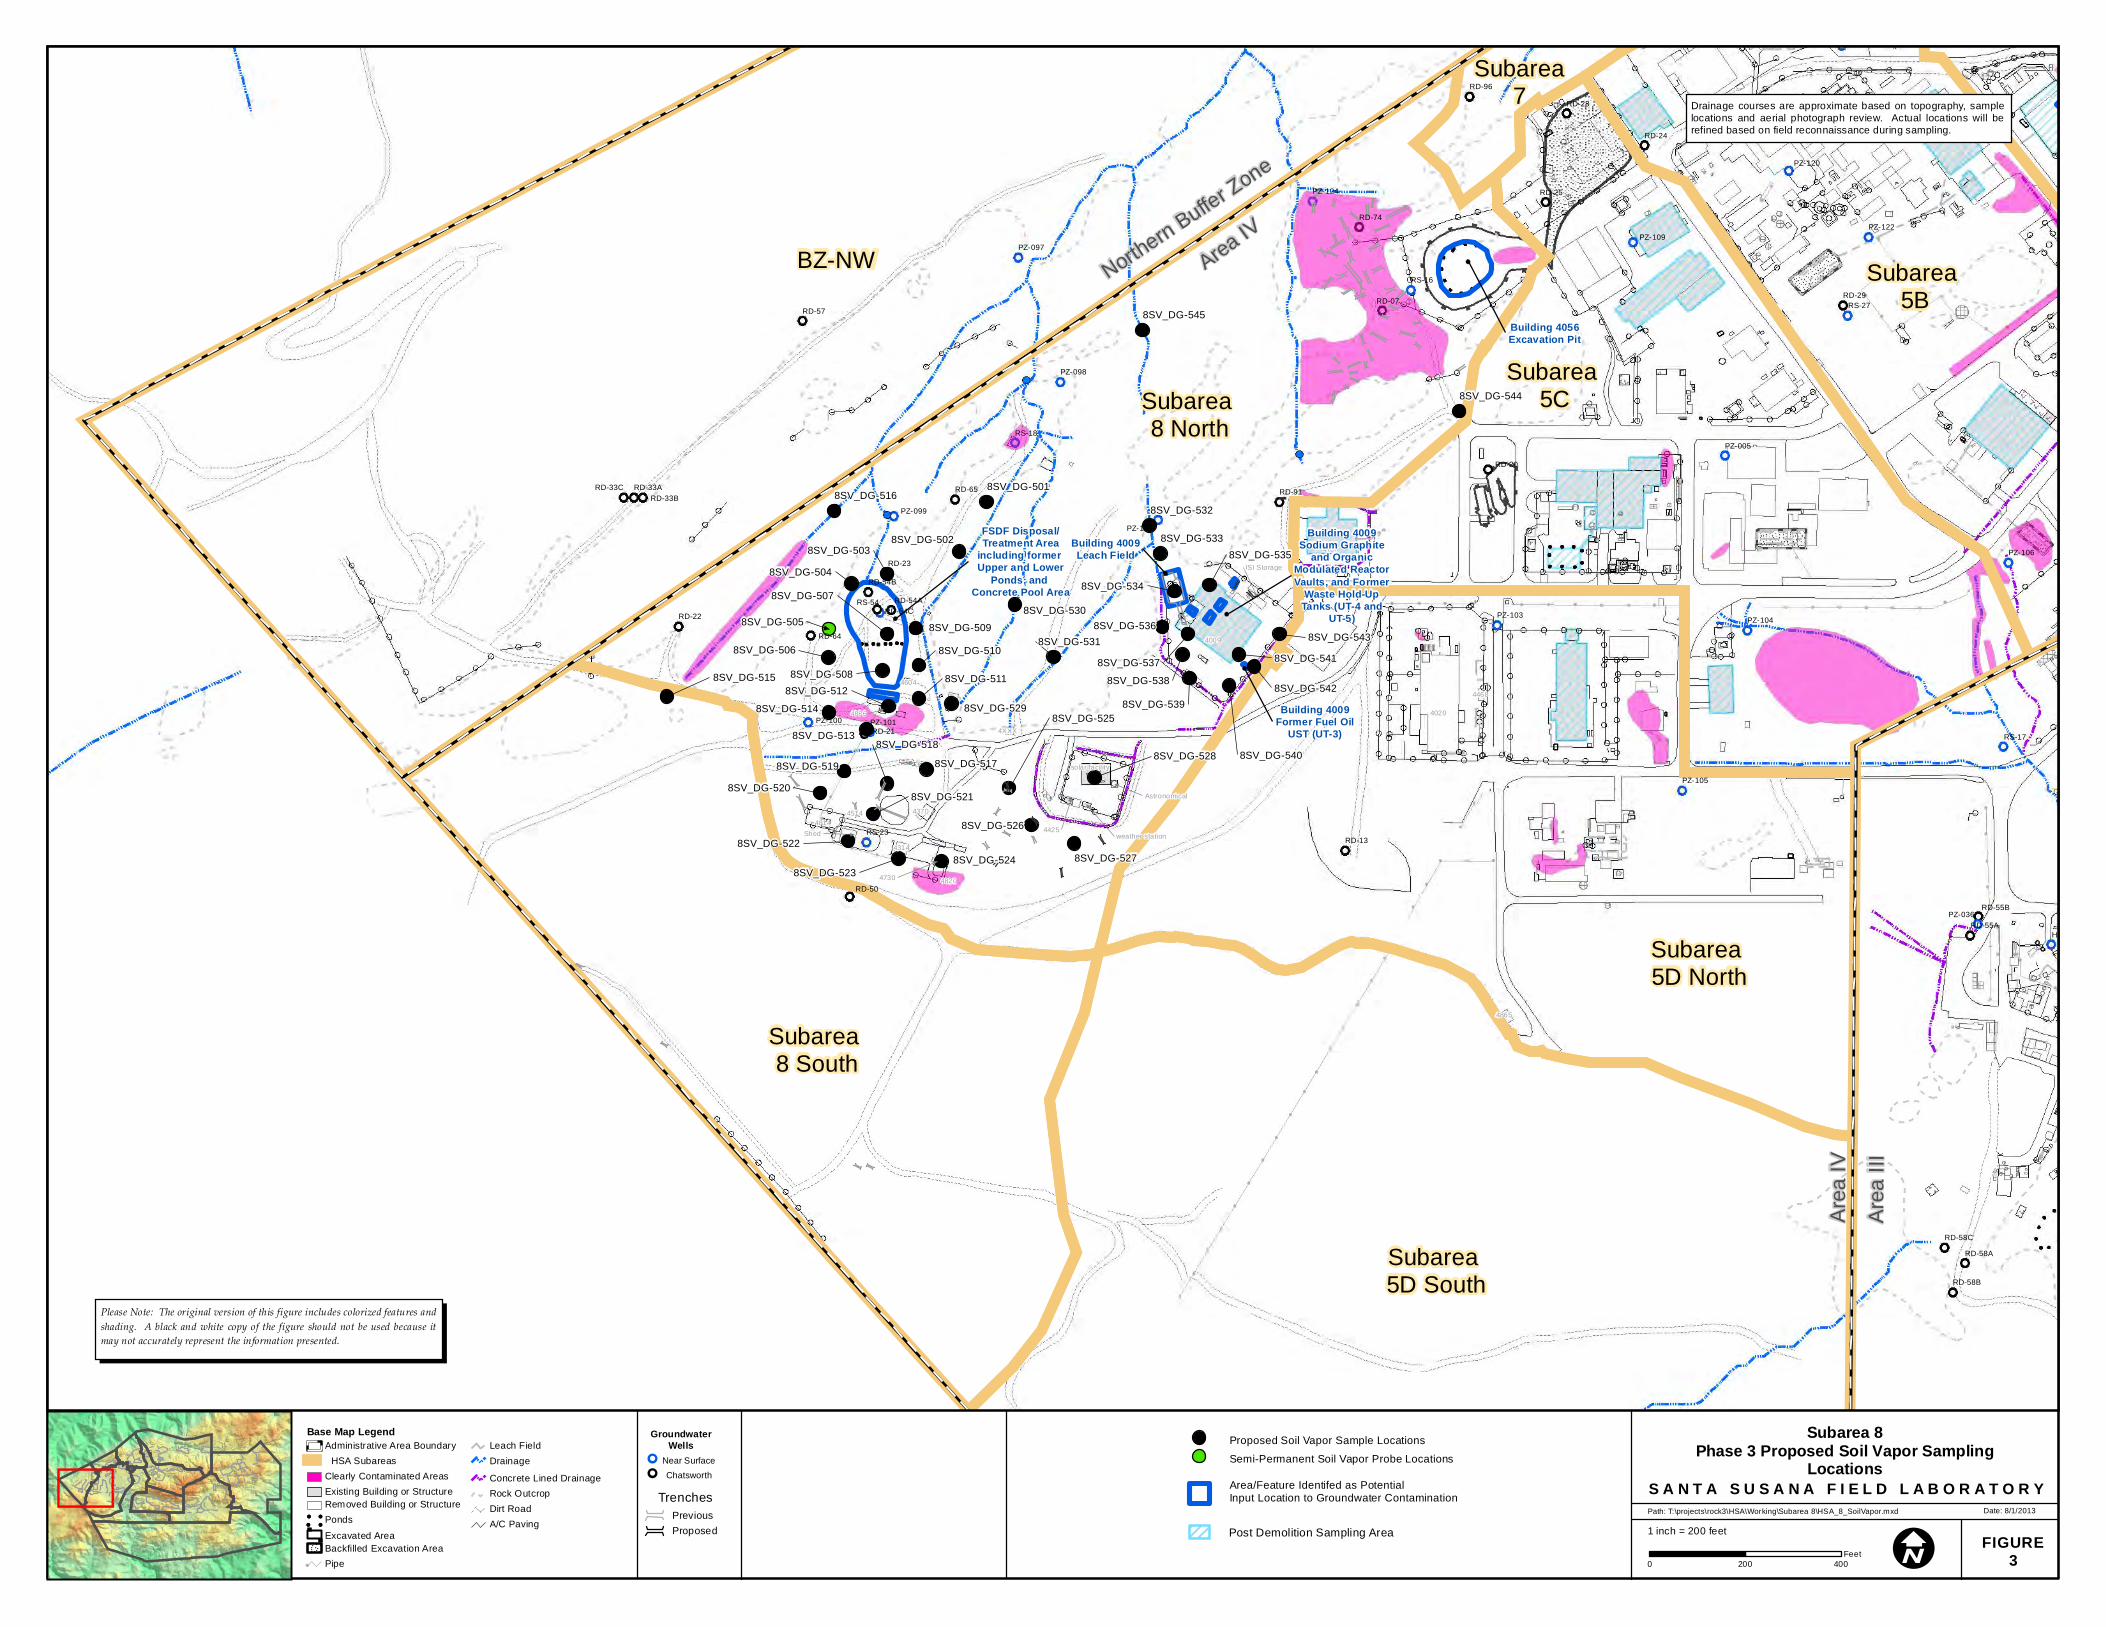
1 inch = 200 feet
8SV_DG-501
8SV_DG-5028SV_DG-503
8SV_DG-509
8SV_DG-507
8SV_DG-508
8SV_DG-510
8SV_DG-511
8SV_DG-517
8SV_DG-512
8SV_DG-513
8SV_DG-514
8SV_DG-506
8SV_DG-505
8SV_DG-504
8SV_DG-516
8SV_DG-515
8SV_DG-519
8SV_DG-520
8SV_DG-522
8SV_DG-521
8SV_DG-518
8SV_DG-5238SV_DG-524
8SV_DG-525
8SV_DG-526
8SV_DG-527
8SV_DG-528
8SV_DG-541
8SV_DG-539
8SV_DG-540
8SV_DG-538
8SV_DG-537
8SV_DG-536
8SV_DG-534
8SV_DG-533
8SV_DG-532
8SV_DG-535
8SV_DG-543
8SV_DG-529
8SV_DG-531
8SV_DG-544
8SV_DG-530
8SV_DG-542
8SV_DG-545
4468
4020
4100
4865
weather station
4XXX
Astronomical
4814
4730 4820
4514
4009
solar facility
4886
4604
ISI Storage
4425Shed
4370
4314
PZ-102
PZ-098
PZ-097
PZ-099
PZ-100 PZ-101
PZ-124
RD-91
RD-96
RS-54
RD-21
RD-22
RD-23
RD-50
RD-54A
RD-54B
RD-54C
RD-07
RS-16
RS-18
RS-23
RD-64
RD-65RD-33ARD-33B
RD-33C
RD-57
RD-74
RS-17
RS-27
HAR-34
RD-13
RD-20
RD-24
RD-25
RD-28
RD-29
RD-55A
RD-55B
RD-58A
RD-58B
RD-58C
PZ-005
PZ-036
PZ-106
PZ-104
PZ-105
PZ-103
PZ-109
PZ-108
PZ-120
PZ-122
Please Note: The original version of this figure includes colorized features andshading. A black and white copy of the figure should not be used because itmay not accurately represent the information presented.
Base Map LegendAdministrative Area Boundary
HSA SubareasClearly Contaminated AreasExisting Building or StructureRemoved Building or Structure
ââââââ ââ Ponds
Excavated AreaBackfilled Excavation Area
!! Pipe
Leach FieldDrainage
Concrete Lined DrainageRock OutcropDirt RoadA/C Paving
GroundwaterWells
!! Near Surface!! Chatsworth
I
Subarea 8Phase 3 Proposed Soil Vapor Sampling
LocationsS A N T A S U S A N A F I E L D L A B O R A T O R Y
FIGURE3
Path: T:\projects\rock3\HSA\Working\Subarea 8\HSA_8_SoilVapor.mxd Date: 8/1/2013
Post Demolition Sampling Area
0 200 400Feet
Drainage courses are approximate based on topography, samplelocations and aerial photograph review. Actual locations will berefined based on field reconnaissance during sampling.
Trenches
ProposedPrevious
Northern Buffer Zone
Area IV
Subarea 8 South
Subarea 5D South
Subarea7
Subarea 5D North
BZ-NW
Proposed Soil Vapor Sample Locations
Semi-Permanent Soil Vapor Probe Locations
Area/Feature Identifed as PotentialInput Location to Groundwater Contamination
Subarea 5C
Subarea 5B
Subarea 8 North
Are
a IV
Are
a III
FSDF Disposal/Treatment Area
including former Upper and Lower
Ponds, and Concrete Pool Area
Building 4009Leach Field
Building 4009Former Fuel Oil
UST (UT-3)
Building 4009Sodium Graphite
and OrganicModulated ReactorVaults, and Former
Waste Hold-UpTanks (UT-4 and
UT-5)
Building 4056Excavation Pit
ATTACHMENTS
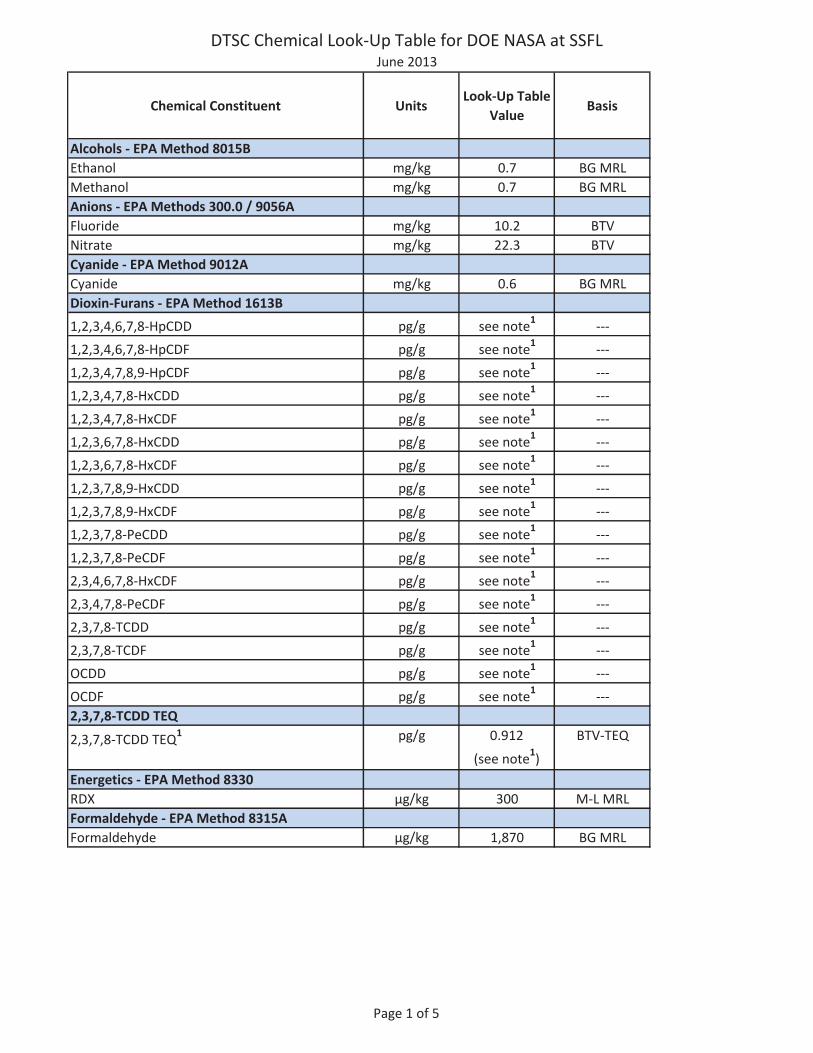
DTSC Chemical Look-Up Table for DOE NASA at SSFLJune 2013
Chemical Constituent UnitsLook-Up Table
ValueBasis
Alcohols - EPA Method 8015BEthanol mg/kg 0.7 BG MRLMethanol mg/kg 0.7 BG MRLAnions - EPA Methods 300.0 / 9056AFluoride mg/kg 10.2 BTVNitrate mg/kg 22.3 BTVCyanide - EPA Method 9012ACyanide mg/kg 0.6 BG MRLDioxin-Furans - EPA Method 1613B1,2,3,4,6,7,8-HpCDD pg/g see note1 ---1,2,3,4,6,7,8-HpCDF pg/g see note1 ---1,2,3,4,7,8,9-HpCDF pg/g see note1 ---1,2,3,4,7,8-HxCDD pg/g see note1 ---1,2,3,4,7,8-HxCDF pg/g see note1 ---1,2,3,6,7,8-HxCDD pg/g see note1 ---1,2,3,6,7,8-HxCDF pg/g see note1 ---1,2,3,7,8,9-HxCDD pg/g see note1 ---1,2,3,7,8,9-HxCDF pg/g see note1 ---1,2,3,7,8-PeCDD pg/g see note1 ---1,2,3,7,8-PeCDF pg/g see note1 ---2,3,4,6,7,8-HxCDF pg/g see note1 ---2,3,4,7,8-PeCDF pg/g see note1 ---2,3,7,8-TCDD pg/g see note1 ---2,3,7,8-TCDF pg/g see note1 ---OCDD pg/g see note1 ---OCDF pg/g see note1 ---2,3,7,8-TCDD TEQ
2,3,7,8-TCDD TEQ1 pg/g 0.912
(see note1)
BTV-TEQ
Energetics - EPA Method 8330RDX μg/kg 300 M-L MRLFormaldehyde - EPA Method 8315AFormaldehyde μg/kg 1,870 BG MRL
Page 1 of 5
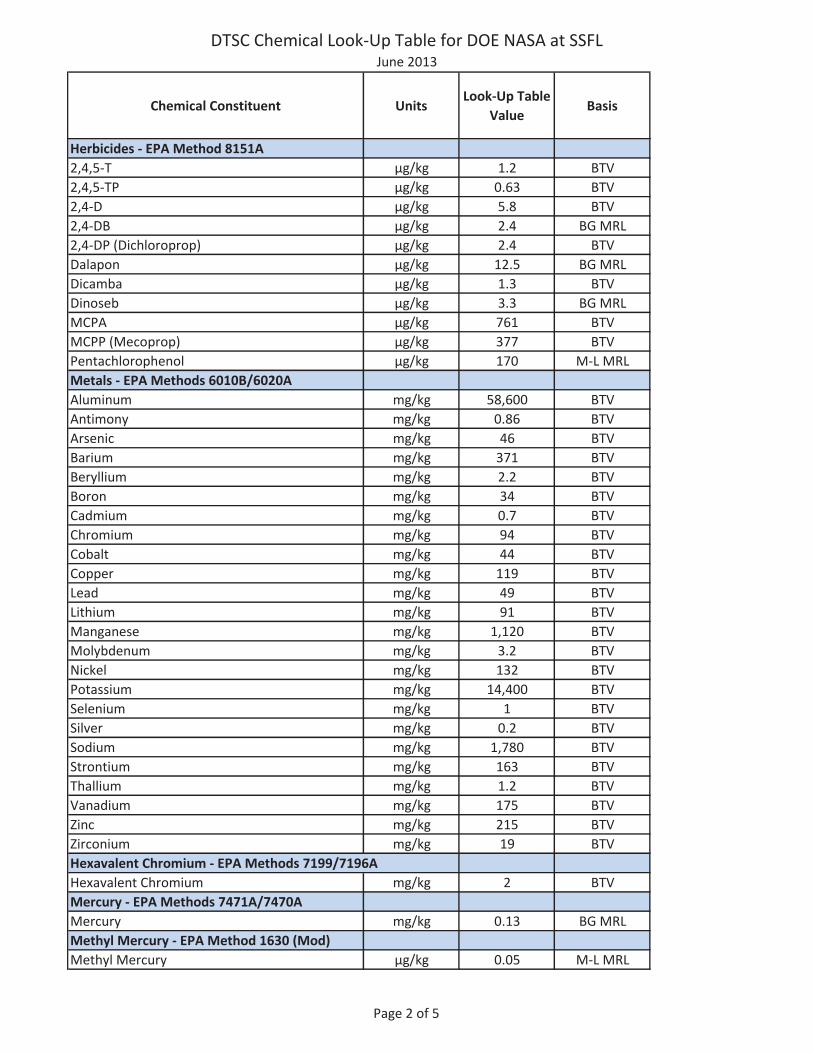
DTSC Chemical Look-Up Table for DOE NASA at SSFLJune 2013
Chemical Constituent UnitsLook-Up Table
ValueBasis
Herbicides - EPA Method 8151A2,4,5-T μg/kg 1.2 BTV2,4,5-TP μg/kg 0.63 BTV2,4-D μg/kg 5.8 BTV2,4-DB μg/kg 2.4 BG MRL2,4-DP (Dichloroprop) μg/kg 2.4 BTVDalapon μg/kg 12.5 BG MRLDicamba μg/kg 1.3 BTVDinoseb μg/kg 3.3 BG MRLMCPA μg/kg 761 BTVMCPP (Mecoprop) μg/kg 377 BTVPentachlorophenol μg/kg 170 M-L MRLMetals - EPA Methods 6010B/6020AAluminum mg/kg 58,600 BTVAntimony mg/kg 0.86 BTVArsenic mg/kg 46 BTVBarium mg/kg 371 BTVBeryllium mg/kg 2.2 BTVBoron mg/kg 34 BTVCadmium mg/kg 0.7 BTVChromium mg/kg 94 BTVCobalt mg/kg 44 BTVCopper mg/kg 119 BTVLead mg/kg 49 BTVLithium mg/kg 91 BTVManganese mg/kg 1,120 BTVMolybdenum mg/kg 3.2 BTVNickel mg/kg 132 BTVPotassium mg/kg 14,400 BTVSelenium mg/kg 1 BTVSilver mg/kg 0.2 BTVSodium mg/kg 1,780 BTVStrontium mg/kg 163 BTVThallium mg/kg 1.2 BTVVanadium mg/kg 175 BTVZinc mg/kg 215 BTVZirconium mg/kg 19 BTVHexavalent Chromium - EPA Methods 7199/7196AHexavalent Chromium mg/kg 2 BTVMercury - EPA Methods 7471A/7470AMercury mg/kg 0.13 BG MRLMethyl Mercury - EPA Method 1630 (Mod)Methyl Mercury μg/kg 0.05 M-L MRL
Page 2 of 5
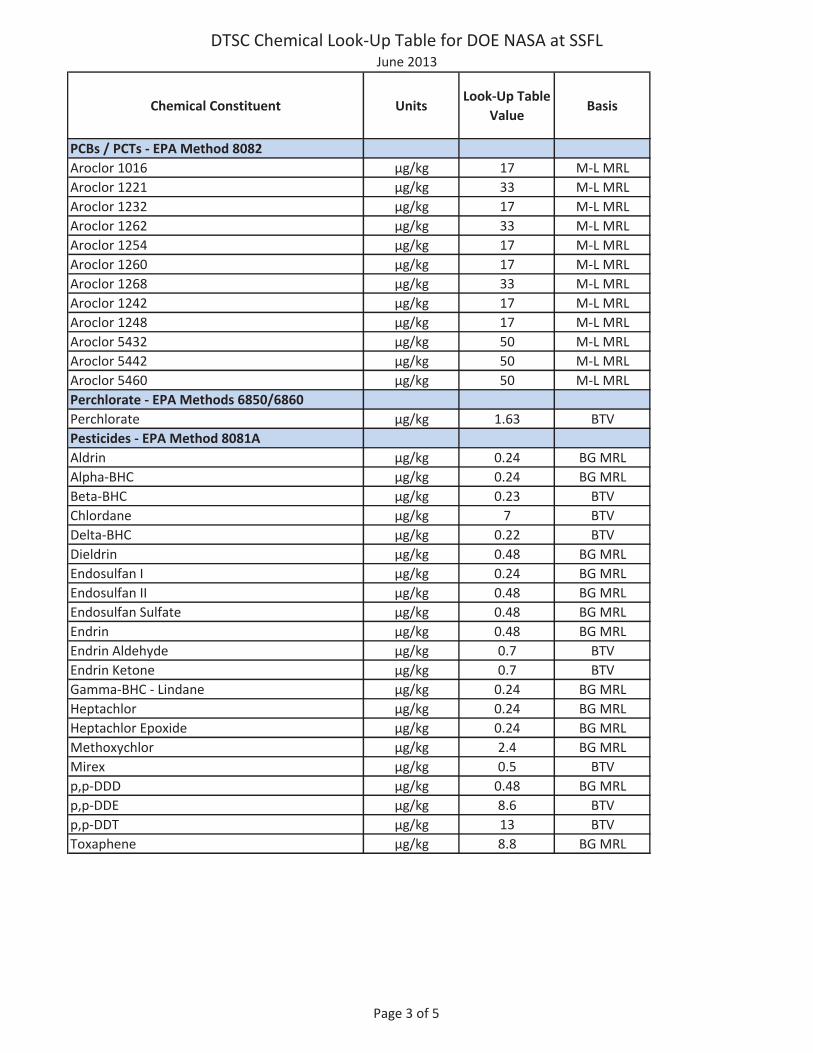
DTSC Chemical Look-Up Table for DOE NASA at SSFLJune 2013
Chemical Constituent UnitsLook-Up Table
ValueBasis
PCBs / PCTs - EPA Method 8082Aroclor 1016 μg/kg 17 M-L MRLAroclor 1221 μg/kg 33 M-L MRLAroclor 1232 μg/kg 17 M-L MRLAroclor 1262 μg/kg 33 M-L MRLAroclor 1254 μg/kg 17 M-L MRLAroclor 1260 μg/kg 17 M-L MRLAroclor 1268 μg/kg 33 M-L MRLAroclor 1242 μg/kg 17 M-L MRLAroclor 1248 μg/kg 17 M-L MRLAroclor 5432 μg/kg 50 M-L MRLAroclor 5442 μg/kg 50 M-L MRLAroclor 5460 μg/kg 50 M-L MRLPerchlorate - EPA Methods 6850/6860Perchlorate μg/kg 1.63 BTVPesticides - EPA Method 8081AAldrin μg/kg 0.24 BG MRLAlpha-BHC μg/kg 0.24 BG MRLBeta-BHC μg/kg 0.23 BTVChlordane μg/kg 7 BTVDelta-BHC μg/kg 0.22 BTVDieldrin μg/kg 0.48 BG MRLEndosulfan I μg/kg 0.24 BG MRLEndosulfan II μg/kg 0.48 BG MRLEndosulfan Sulfate μg/kg 0.48 BG MRLEndrin μg/kg 0.48 BG MRLEndrin Aldehyde μg/kg 0.7 BTVEndrin Ketone μg/kg 0.7 BTVGamma-BHC - Lindane μg/kg 0.24 BG MRLHeptachlor μg/kg 0.24 BG MRLHeptachlor Epoxide μg/kg 0.24 BG MRLMethoxychlor μg/kg 2.4 BG MRLMirex μg/kg 0.5 BTVp,p-DDD μg/kg 0.48 BG MRLp,p-DDE μg/kg 8.6 BTVp,p-DDT μg/kg 13 BTVToxaphene μg/kg 8.8 BG MRL
Page 3 of 5
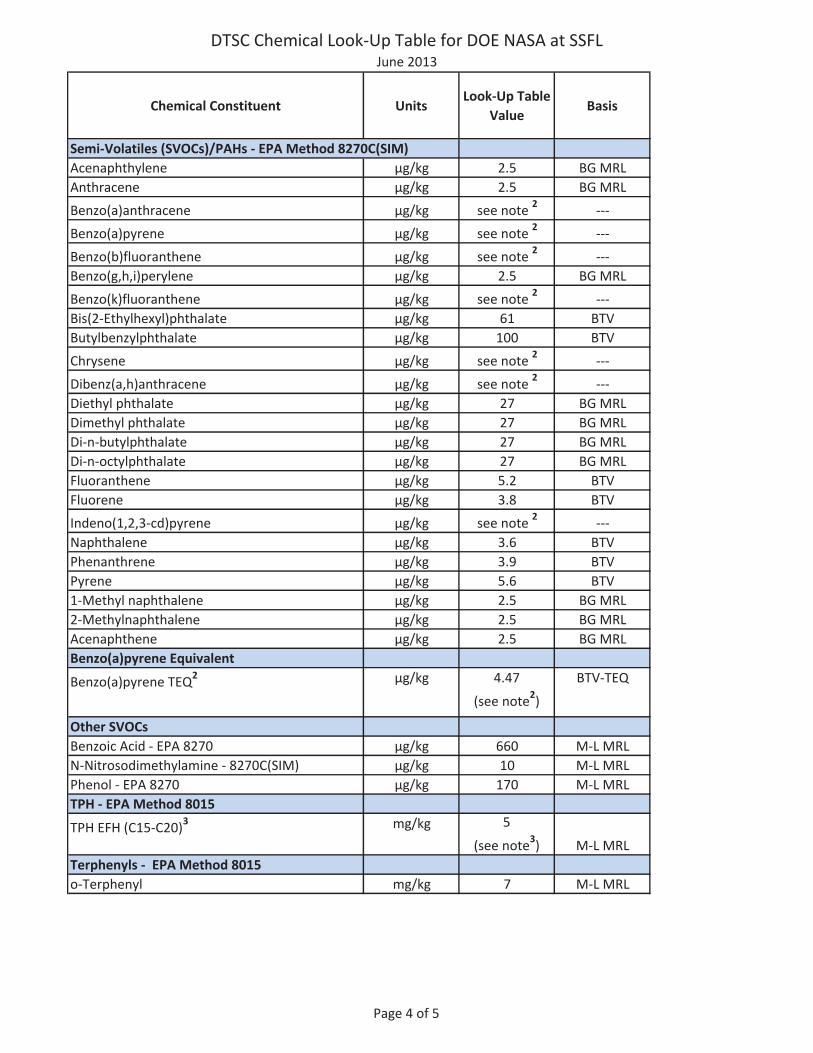
DTSC Chemical Look-Up Table for DOE NASA at SSFLJune 2013
Chemical Constituent UnitsLook-Up Table
ValueBasis
Semi-Volatiles (SVOCs)/PAHs - EPA Method 8270C(SIM)Acenaphthylene μg/kg 2.5 BG MRLAnthracene μg/kg 2.5 BG MRLBenzo(a)anthracene μg/kg see note 2 ---Benzo(a)pyrene μg/kg see note 2 ---Benzo(b)fluoranthene μg/kg see note 2 ---Benzo(g,h,i)perylene μg/kg 2.5 BG MRLBenzo(k)fluoranthene μg/kg see note 2 ---Bis(2-Ethylhexyl)phthalate μg/kg 61 BTVButylbenzylphthalate μg/kg 100 BTVChrysene μg/kg see note 2 ---Dibenz(a,h)anthracene μg/kg see note 2 ---Diethyl phthalate μg/kg 27 BG MRLDimethyl phthalate μg/kg 27 BG MRLDi-n-butylphthalate μg/kg 27 BG MRLDi-n-octylphthalate μg/kg 27 BG MRLFluoranthene μg/kg 5.2 BTVFluorene μg/kg 3.8 BTVIndeno(1,2,3-cd)pyrene μg/kg see note 2 ---Naphthalene μg/kg 3.6 BTVPhenanthrene μg/kg 3.9 BTVPyrene μg/kg 5.6 BTV1-Methyl naphthalene μg/kg 2.5 BG MRL2-Methylnaphthalene μg/kg 2.5 BG MRLAcenaphthene μg/kg 2.5 BG MRLBenzo(a)pyrene Equivalent
Benzo(a)pyrene TEQ2 μg/kg 4.47
(see note2)
BTV-TEQ
Other SVOCsBenzoic Acid - EPA 8270 μg/kg 660 M-L MRLN-Nitrosodimethylamine - 8270C(SIM) μg/kg 10 M-L MRLPhenol - EPA 8270 μg/kg 170 M-L MRLTPH - EPA Method 8015
TPH EFH (C15-C20)3 mg/kg 5
(see note3) M-L MRLTerphenyls - EPA Method 8015o-Terphenyl mg/kg 7 M-L MRL
Page 4 of 5
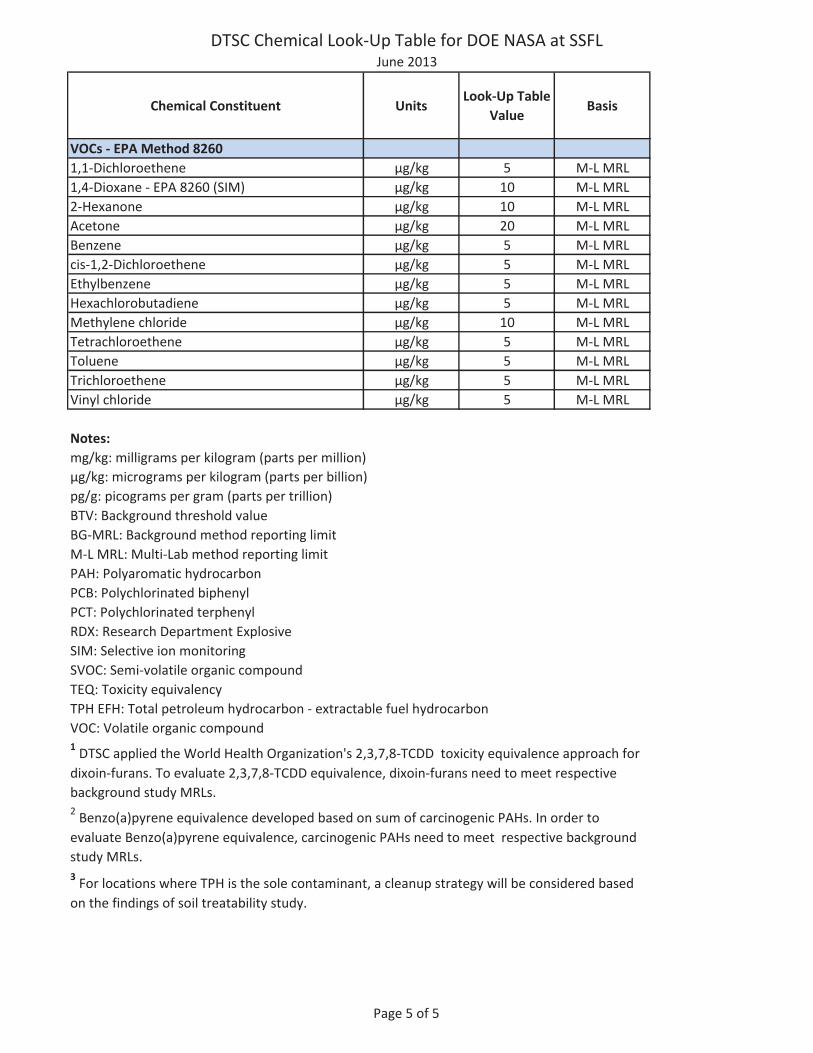
DTSC Chemical Look-Up Table for DOE NASA at SSFLJune 2013
Chemical Constituent UnitsLook-Up Table
ValueBasis
VOCs - EPA Method 82601,1-Dichloroethene μg/kg 5 M-L MRL1,4-Dioxane - EPA 8260 (SIM) μg/kg 10 M-L MRL2-Hexanone μg/kg 10 M-L MRLAcetone μg/kg 20 M-L MRLBenzene μg/kg 5 M-L MRLcis-1,2-Dichloroethene μg/kg 5 M-L MRLEthylbenzene μg/kg 5 M-L MRLHexachlorobutadiene μg/kg 5 M-L MRLMethylene chloride μg/kg 10 M-L MRLTetrachloroethene μg/kg 5 M-L MRLToluene μg/kg 5 M-L MRLTrichloroethene μg/kg 5 M-L MRLVinyl chloride μg/kg 5 M-L MRL
Notes:mg/kg: milligrams per kilogram (parts per million)μg/kg: micrograms per kilogram (parts per billion)pg/g: picograms per gram (parts per trillion)BTV: Background threshold valueBG-MRL: Background method reporting limitM-L MRL: Multi-Lab method reporting limitPAH: Polyaromatic hydrocarbonPCB: Polychlorinated biphenylPCT: Polychlorinated terphenylRDX: Research Department ExplosiveSIM: Selective ion monitoringSVOC: Semi-volatile organic compoundTEQ: Toxicity equivalencyTPH EFH: Total petroleum hydrocarbon - extractable fuel hydrocarbonVOC: Volatile organic compound1 DTSC applied the World Health Organization's 2,3,7,8-TCDD toxicity equivalence approach for dixoin-furans. To evaluate 2,3,7,8-TCDD equivalence, dixoin-furans need to meet respective background study MRLs.2 Benzo(a)pyrene equivalence developed based on sum of carcinogenic PAHs. In order to evaluate Benzo(a)pyrene equivalence, carcinogenic PAHs need to meet respective background study MRLs.3 For locations where TPH is the sole contaminant, a cleanup strategy will be considered based on the findings of soil treatability study.
Page 5 of 5

Attachment 2 Table F
Field Tracker Subarea 8
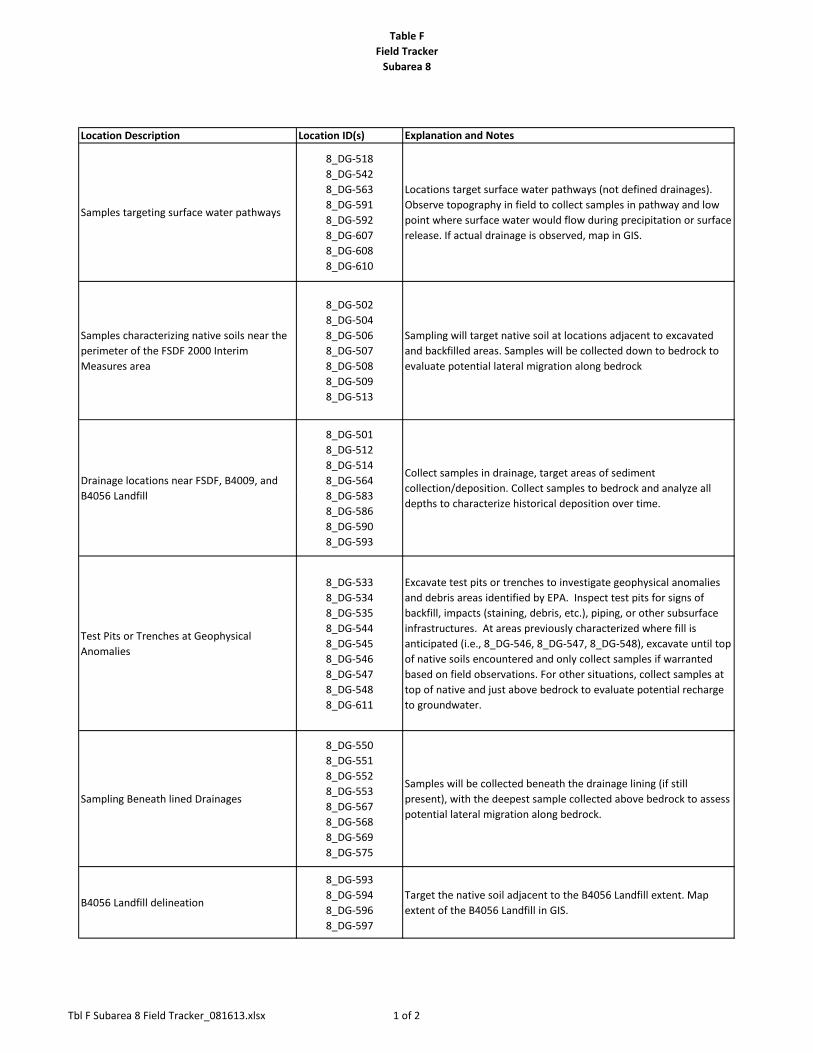
Table FField TrackerSubarea 8
Location Description Location ID(s) Explanation and Notes
Samples targeting surface water pathways
8_DG‐5188_DG‐5428_DG‐5638_DG‐5918_DG‐5928_DG‐6078_DG‐6088_DG‐610
Locations target surface water pathways (not defined drainages). Observe topography in field to collect samples in pathway and low point where surface water would flow during precipitation or surface release. If actual drainage is observed, map in GIS.
Samples characterizing native soils near the perimeter of the FSDF 2000 Interim Measures area
8_DG‐5028_DG‐5048_DG‐5068_DG‐5078_DG‐5088_DG‐5098_DG‐513
Sampling will target native soil at locations adjacent to excavated and backfilled areas. Samples will be collected down to bedrock to evaluate potential lateral migration along bedrock
Drainage locations near FSDF, B4009, and df ll
8_DG‐5018_DG‐5128_DG‐5148_DG‐564
Collect samples in drainage, target areas of sediment collection/deposition. Collect samples to bedrock and analyze all
B4056 Landfill 8_DG‐5838_DG‐5868_DG‐5908_DG‐593
collection/deposition. Collect samples to bedrock and analy e alldepths to characterize historical deposition over time.
Test Pits or Trenches at Geophysical Anomalies
8_DG‐5338_DG‐5348_DG‐5358_DG‐5448_DG‐5458_DG‐5468_DG‐5478_DG‐5488_DG‐611
Excavate test pits or trenches to investigate geophysical anomalies and debris areas identified by EPA. Inspect test pits for signs of backfill, impacts (staining, debris, etc.), piping, or other subsurface infrastructures. At areas previously characterized where fill is anticipated (i.e., 8_DG‐546, 8_DG‐547, 8_DG‐548), excavate until top of native soils encountered and only collect samples if warranted based on field observations. For other situations, collect samples at top of native and just above bedrock to evaluate potential recharge to groundwater.
Sampling Beneath lined Drainages
8_DG‐5508_DG‐5518_DG‐5528_DG‐5538_DG‐5678_DG‐5688_DG‐5698_DG‐575
Samples will be collected beneath the drainage lining (if still present), with the deepest sample collected above bedrock to assess potential lateral migration along bedrock.
B4056 Landfill delineation
8_DG‐5938_DG‐5948_DG‐5968_DG‐597
Target the native soil adjacent to the B4056 Landfill extent. Map extent of the B4056 Landfill in GIS.
Tbl F Subarea 8 Field Tracker_081613.xlsx 1 of 2
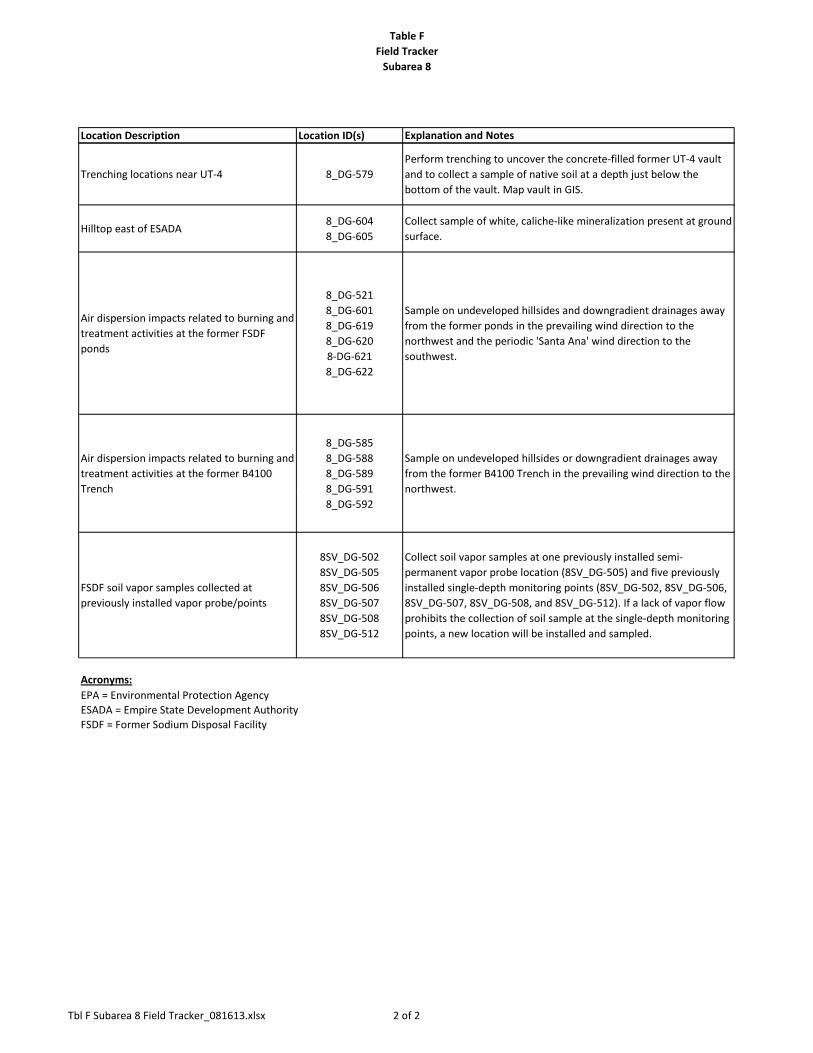
Table FField TrackerSubarea 8
Location Description Location ID(s) Explanation and Notes
Trenching locations near UT‐4 8_DG‐579Perform trenching to uncover the concrete‐filled former UT‐4 vault and to collect a sample of native soil at a depth just below the bottom of the vault. Map vault in GIS.
Hilltop east of ESADA8_DG‐6048_DG‐605
Collect sample of white, caliche‐like mineralization present at ground surface.
Air dispersion impacts related to burning and treatment activities at the former FSDF ponds
8_DG‐5218_DG‐6018_DG‐6198_DG‐6208‐DG‐6218_DG‐622
Sample on undeveloped hillsides and downgradient drainages away from the former ponds in the prevailing wind direction to the northwest and the periodic 'Santa Ana' wind direction to the southwest.
Air dispersion impacts related to burning and treatment activities at the former B4100 Trench
8_DG‐5858_DG‐5888_DG‐5898 DG‐591
Sample on undeveloped hillsides or downgradient drainages away from the former B4100 Trench in the prevailing wind direction to the northwest.Trench 8_DG 591
8_DG‐592northwest.
FSDF soil vapor samples collected at previously installed vapor probe/points
8SV_DG‐5028SV_DG‐5058SV_DG‐5068SV_DG‐5078SV_DG‐5088SV_DG‐512
Collect soil vapor samples at one previously installed semi‐permanent vapor probe location (8SV_DG‐505) and five previously installed single‐depth monitoring points (8SV_DG‐502, 8SV_DG‐506, 8SV_DG‐507, 8SV_DG‐508, and 8SV_DG‐512). If a lack of vapor flow prohibits the collection of soil sample at the single‐depth monitoring points, a new location will be installed and sampled.
Acronyms:
ESADA = Empire State Development AuthorityFSDF = Former Sodium Disposal Facility
EPA = Environmental Protection Agency
Tbl F Subarea 8 Field Tracker_081613.xlsx 2 of 2