Embed Size (px)
Citation preview
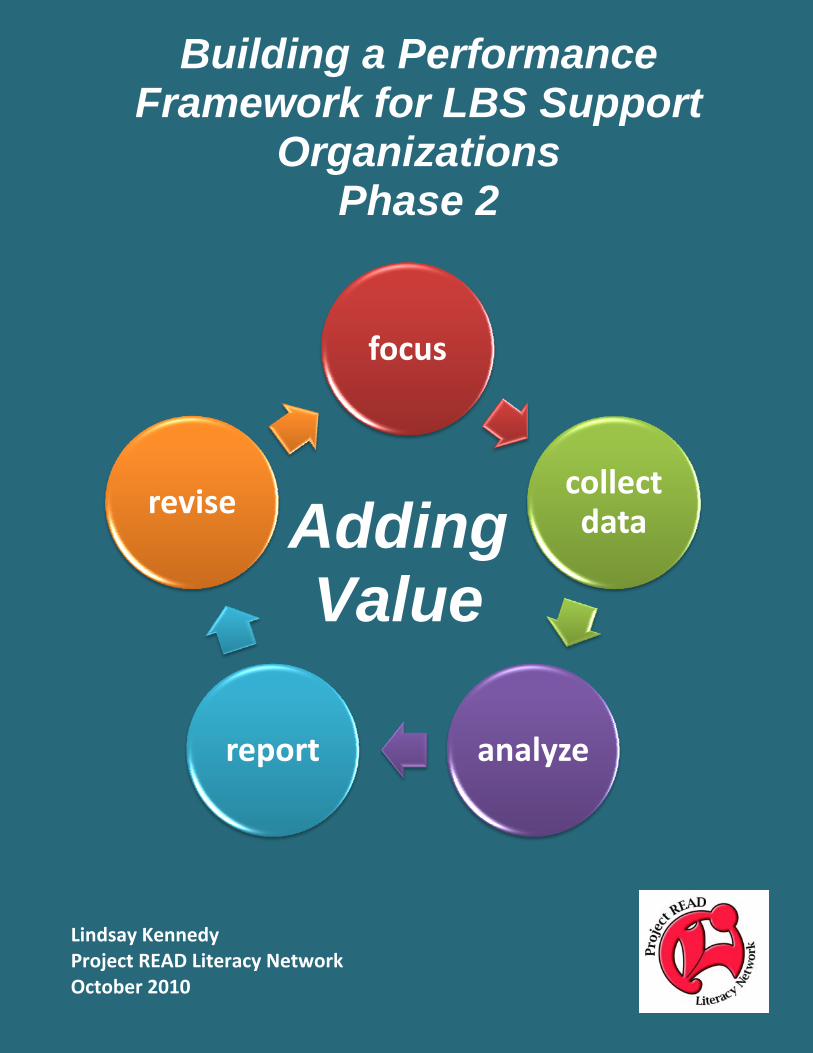
focus
collect data
analyzereport
revise
Building a Performance Framework for LBS Support
Organizations Phase 2
Lindsay Kennedy Project READ Literacy Network October 2010
Adding Value
Acknowledgements
Project Oversight: Anne Ramsay, Project READ Literacy Network
Project Consultant: Lindsay Kennedy
Advisory Team Members: Carole‐Anne Fournier, Literacy Network Northeast
Jennine Agnew‐Kata, Literacy Network Durham Region Peggy Anne Gordon, Deaf Literacy Initiative
Lesley Hamilton, Literacy Ontario Central South
Tamara Kaattari, Literacy Link South Central
Anne Ramsay, Project READ Literacy Network
Lynne Wallace, College Sector Committee
Funding: Employment Ontario Network Development Fund, Ministry of Training, Colleges and Universities
Special thanks to evaluation expert and logic model guru, Robin Wisner, MPA for her guidance, suggestions and willingness to learn about the literacy in field in Ontario. The work of this project would not have been possible without the cooperation and participation of staff members from all the LBS support organizations in Ontario. Thank you! ©2010 Project READ Literacy Network. The contents of this document have been developed for use by LBS support organizations in Ontario. All other users should contact Project READ Literacy Network for permission to use. Project READ Literacy Network Waterloo‐Wellington 298 Frederick Street, Kitchener, ON Canada N2H 2N5 www.projectread.ca
Building a Performance Framework for LBS Support Organizations, Phase 2: Adding Value
Page i
Table of Contents
Chapter 1: Introduction ..................................................................................... Page 1
Chapter 2: Measuring and Monitoring Overview .............................................. Page 13
Chapter 3: Tools for Measuring and Monitoring ............................................... Page 25
Chapter 4: Performance Indicators .................................................................... Page 37
Chapter 5: Performance Measurement Tools ................................................... Page 51
Appendix 1: Modified Logic Models .................................................................. Page 69
Appendix 2: Unrevised Logic Model .................................................................. Page 81

Building a Performance Framework for LBS Support Organizations, Phase 2: Adding Value
Page ii
Building a Performance Framework for LBS Support Organizations, Phase 2: Adding Value
Chapter 1: Introduction | Page 1
Introduction
A wise old man is walking with a young boy along a beach covered with starfish sweltering in the hot sun. The old man picks up one of the starfish and flings it far out into the water. The boy asks why, since he knows the old man can’t possibly rescue enough starfish to really make a difference to the countless others strewn on the beach. “Yes,” the old man replies, “but it made a difference to that one.”
BUILDING A PERFORMANCE FRAMEWORK—PHASE 2
Support organizations in Ontario play an important role in the education and training framework developed by the provincial government. The purpose of Building a Performance Framework – Phase 2 was to provide many of the support organizations in Ontario with information, training and tools that would allow them to increase their knowledge of performance management concepts. Increasing support organizations’ knowledge and use of performance management concepts is one approach to strengthening their capacity to support the programs and organizations that deliver literacy upgrading services to adult learners in Ontario. The project was designed to build on the resources developed during Phase 1 (2008). During Phase 1, logic models and immediate, intermediate and long-term outcomes were developed for the Ministry of Training, Colleges and Universities (TCU) funded service functions1 that were in place at that time. The TCU service functions were used as the starting point for the logic models because all support organizations in Ontario write their business plans based on the same set of service functions. This provided a common base from which the logic models could be created. The drafts of the logic models were called “living drafts” as the intent was to provide support organizations with a draft from which they could build logic models that were tailored to their specific work environments.
1 In this document, as in Phase 1, the key services that are funded by TCU are referred to as service functions. In the business plan document, they are referred to as “service categories”.
Building a Performance Framework for LBS Support Organizations, Phase 2: Adding Value
Chapter 1: Introduction | Page 2
Phase 1 focused on the development of a potential framework for support organizations. In a performance framework a logic model provides organizations with the opportunity to describe what they will accomplish. A performance framework, through the use of performance indicators, helps organizations to decide not only what to measure, but also how to measure the outcomes that have been set. Phase 2 focused on the performance measurement aspect of the framework. Performance measurement describes how resources are being used (efficiency), how the work being done contributes to the achievement of stated outcomes (effectiveness) and whether or not the organizations’ “customers”—delivery agencies and other stakeholders—are satisfied with the results. Before you can measure performance you need to think about and create performance indicators, performance measurement tools and a process for collecting and storing the data.
Changes to TCU Funded Functions Between Phase 1 and Phase 2 TCU revised its service functions or categories. Two of the service functions in place in 2008 were dropped and an additional function was created. For the 2010-11 business planning cycle, the service functions were: 1. Support TCU-funded delivery agencies to deliver coordinated,
quality LBS services responsive to emerging needs (identified by the community and government) within an integrated employment and training system
2. Provide support for Ministry led initiatives using a model of continuous improvement
3. Develop and provide quality resources that support TCU-funded agencies to deliver E-Channel Learning
4. Develop and provide accessible and quality resources that support TCU-funded agencies to deliver LBS programs.
In this document we will refer to the service functions as numbered above.
Building a Performance Framework for LBS Support Organizations, Phase 2: Adding Value
Chapter 1: Introduction | Page 3
During this second phase, two of the Phase 1 logic models were revised. These were TCU service functions two (Provide support for ministry led initiatives using a model of continuous improvement) and four (Develop and provide accessible and quality resources that support TCU-funded agencies to deliver LBS programs).2 At the training workshop (June 2010) a logic model with some outcomes and a number of performance indicators were developed for TCU service function three (Develop and provide quality resources that support TCU-funded agencies to deliver E-Channel Learning.3)
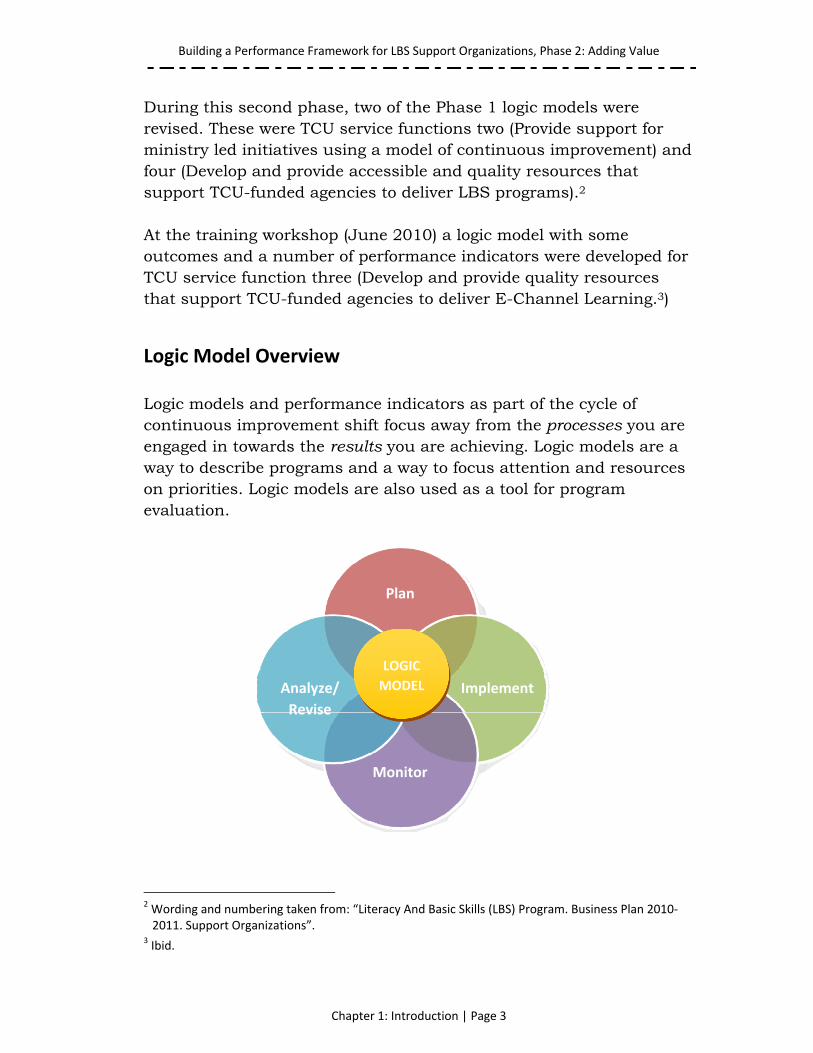
Logic Model Overview Logic models and performance indicators as part of the cycle of continuous improvement shift focus away from the processes you are engaged in towards the results you are achieving. Logic models are a way to describe programs and a way to focus attention and resources on priorities. Logic models are also used as a tool for program evaluation.
2 Wording and numbering taken from: “Literacy And Basic Skills (LBS) Program. Business Plan 2010‐2011. Support Organizations”.
3 Ibid.
LOGIC
MODEL
Plan
Monitor
Analyze/
Revise
Implement
Building a Performance Framework for LBS Support Organizations, Phase 2: Adding Value
Chapter 1: Introduction | Page 4
As a starting point for a performance framework, logic models give you the opportunity to examine the broad scope of work you do for TCU. They are a useful way to examine and explain what you want to achieve (program planning and implementation) and how the work you do will contribute to the literacy field in Ontario (monitoring and analyzing/revising). This multi-function ability allows for the creation of a clear and easy to understand “picture.” Naturally, like all pictures, this one will reflect a particular point in time, based on certain assumptions. The University of Wisconsin, a leader in program logic model theory and application, describes logic models as a useful way to “help clarify expected linkages, tease out underlying assumptions, focus on principles to test, educate funders and policy makers, and move a program into action and learning.”4
Logic Model Development There is no right or wrong way to create logic models. Ideally, however, logic models are created as part of your program planning and design process. As a result of your ongoing consultation and development process you will gather the information you need to create a logic model that describes a clear picture of your contribution to the solution of a problem, issue or situation. While the logic models and performance indicators in this document were developed for you, they were created using information collected from a variety of sources: one-to-one interviews, feedback from training workshops, business plans provided by many support organizations and input from advisory team members. As previously mentioned this is one of the reasons why they have been labeled “living drafts” – the intent is for you to use them as a starting point and then revise them to fit your current situation.
4 Developing a Logic Model: Teaching and Training Guide. Ellen Taylor‐Powell and Ellen Henert. University of Wisconsin‐Extension. Madison: 2008.
Building a Performance Framework for LBS Support Organizations, Phase 2: Adding Value
Chapter 1: Introduction | Page 5
One of the most common ways to present a logic model is in a table format. And while this may create a look or feel of the information being “locked in”, that is not the intent. The format provides an easy to understand illustration of what you are doing—and one that can be revised as needed. In the following sections we’ll describe the process for creating a logic model and at the same time take a brief look at the component parts of a logic model: assumptions, inputs, outputs and outcomes. We’ll use information from the “living draft” logic models to illustrate the type of information that is needed for each component. More information regarding the living drafts can be found in the Phase 1 Report available from Project READ Literacy Network. It’s important to remember that none of this information is meant to be exhaustive or prescriptive—all of it should be considered a starting point. Of course, you can use the information in each logic model as is, but as you review the living drafts in this document you will probably start to refine them to more closely represent the work of your specific organization. The first step that you should follow when revising the living drafts (or when creating new logic models) is to begin to answer these two questions:
1. What is the problem or situation you are trying to “solve” or resolve?
2. What do you know to be true or certain about the problem or situation? In other words, what are your assumptions?
What is the problem or situation you are trying to “solve” or resolve? The living drafts were created using the TCU service functions as the “problem” or “situation” that you are working towards “fixing”. For example, what is your organization’s role or focus in terms of the service function “Provide support for Ministry led initiatives using a model of continuous improvement”?
Building a Performance Framework for LBS Support Organizations, Phase 2: Adding Value
Chapter 1: Introduction | Page 6
For this particular service function there is no simple answer. Your approach will depend on a number of factors, including what the focus of the initiative is, what you have the capacity to provide within current resources, whether or not the stakeholders you represent have identified the initiative as a priority… The development of a logic model can help you to determine what your role could be using current resources and can also help you determine what additional resources you need to increase your capacity. For example, if you think you want to be the lead agency on a TCU initiative, the development of a logic model should help with writing the funding application.
What do you know to be true or certain about the problem or situation? In other words, what are your assumptions? Logic model assumptions are statements that are based on what you know to be true, or certain, about a given situation at a particular point in time. Assumptions can also be made about things that you hope will be true in the future, as a result of certain actions. Almost everything we do is based on one assumption or another. Below are the assumptions that were reviewed and revised during Phase 2. Assumptions for service function #2: Provide support for Ministry led initiatives using a model of continuous improvement: Over-arching assumption: The support organization is committed to enhancing the field’s ability to provide quality service delivery to adult learners. 1. MTCU initiatives/priorities are indentified through a ministry
planning process that reflects larger TCU planning and directions.
2. MTCU initiatives/priorities are communicated to support organizations through the annual business plan development and by special communications to the field.
Building a Performance Framework for LBS Support Organizations, Phase 2: Adding Value
Chapter 1: Introduction | Page 7
3. Ideally, TCU’s rationale for an initiative or priority area is described in a clear, uniform manner to all service support organizations.
4. Ideally, TCU provides sufficient resources (monetary and human) to allow for implementation of initiatives (new and/or ongoing) across regions, sectors and/or streams.
5. Support organizations provide information about and/or training for TCU initiatives/priorities in a positive and supportive manner.
6. Support activities related to a specific initiative or priority area are developed based on information available at a particular point in time.
7. As a result of their role in TCU led initiatives, support organizations gain skills and expertise that increase their profile within the ministry and with the community they serve.
You’ll find the complete logic model for service function two in Appendix 1. In Appendix 2 you will find a worksheet to use to help you review and affirm your own assumptions for any of the logic models. If you were creating a new logic model you would have a number of choices at this point. In logic model development, outcomes are the end points you are working towards. You could start by setting some outcomes and then work backwards to determine the inputs and outputs. You could also start in the middle, so to speak, and determine what outputs you will achieve. You could also start with inputs and move forward from there. Which starting point you use doesn’t matter. In fact the whole process of developing a logic model is circuitous. Even if you start with outcomes you will probably find yourself jumping ahead to outputs and inputs. What is most important is that you end up with a logic model that provides you and others with an easy to understand “illustration” of what you are doing.
Building a Performance Framework for LBS Support Organizations, Phase 2: Adding Value
Chapter 1: Introduction | Page 8
For the purpose of this document we are going to start with the inputs, then move on to the outputs and then finally describe the outcomes for the service function that says you will provide support for Ministry led initiatives using a model of continuous improvement. One thing to keep in mind: in logic model “language” certain terms have specific meanings. For example:
Inputs are the resources you will need to achieve the outcomes you set. You can begin by thinking about the assumptions you have made. You will revisit the inputs several times as you determine the outputs and outcomes.
Outputs focus on answering “what” questions. For example,
what will you be doing and what do you hope to achieve? In our logic models we’ve divided outputs into two types: activities (what you will be doing) and results (what you hope to achieve).
Outcomes are specific statements that capture what it is you
are trying to change. The statements should answer the “so what?” question. Outcomes are usually divided into short-term, mid-term and long-term. In this framework we’ve described these as immediate (short-term), intermediate (mid-term) and impact (long-term).
Now let’s go back to service function #2 and take a look at each of these key components. Based on consultations with staff working in a number of sector and stream organizations and with regional network staff sitting on the advisory team, this service function was revised during Phase 2.
Building a Performance Framework for LBS Support Organizations, Phase 2: Adding Value
Chapter 1: Introduction | Page 9
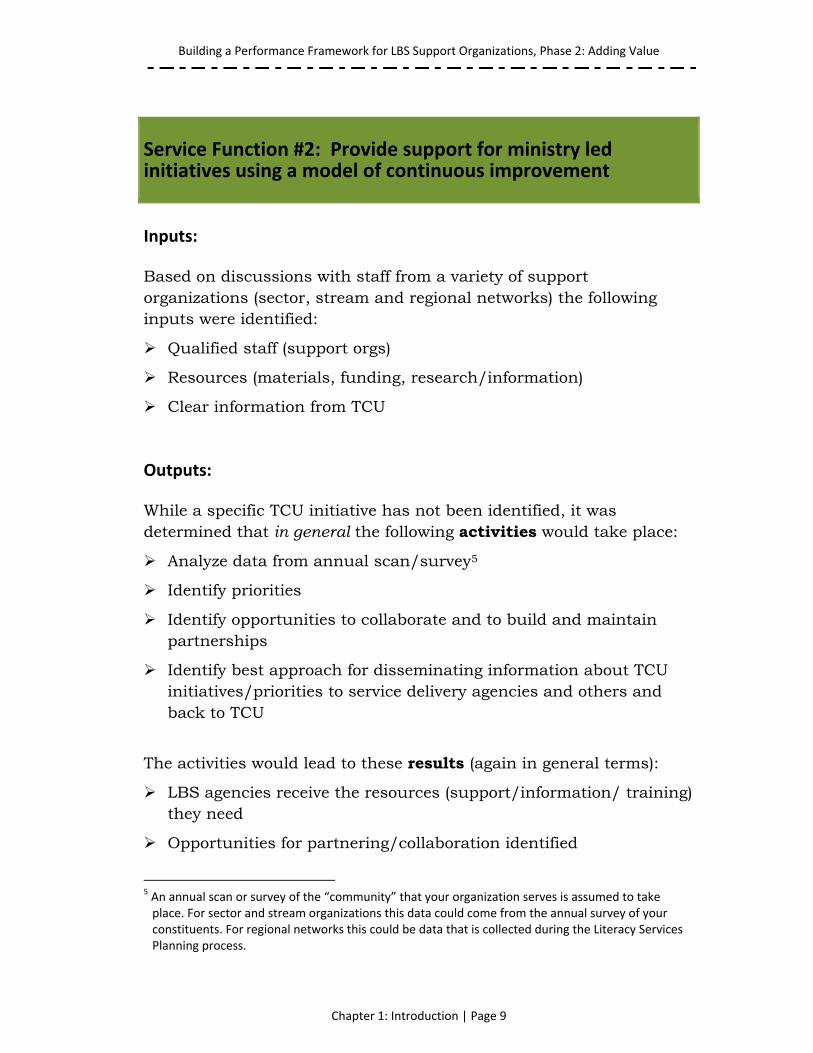
Service Function #2: Provide support for ministry led initiatives using a model of continuous improvement
Inputs:
Based on discussions with staff from a variety of support organizations (sector, stream and regional networks) the following inputs were identified:
Qualified staff (support orgs)
Resources (materials, funding, research/information)
Clear information from TCU Outputs:
While a specific TCU initiative has not been identified, it was determined that in general the following activities would take place:
Analyze data from annual scan/survey5
Identify priorities
Identify opportunities to collaborate and to build and maintain partnerships
Identify best approach for disseminating information about TCU initiatives/priorities to service delivery agencies and others and back to TCU
The activities would lead to these results (again in general terms):
LBS agencies receive the resources (support/information/ training) they need
Opportunities for partnering/collaboration identified
5 An annual scan or survey of the “community” that your organization serves is assumed to take place. For sector and stream organizations this data could come from the annual survey of your constituents. For regional networks this could be data that is collected during the Literacy Services Planning process.
Building a Performance Framework for LBS Support Organizations, Phase 2: Adding Value
Chapter 1: Introduction | Page 10
Support organizations provide TCU with up-to-date feedback about the roll out of TCU initiatives/priorities
Support organizations develop expertise Time lines have not been set for any of the outcomes. Instead they have been defined in terms of a progressive set of changes. An immediate outcome would reflect changes in things such as awareness, knowledge, attitude, opinions and motivation. Intermediate outcomes reflect changes in things such as behaviours, practices, decision-making and policies. Finally, impact outcomes reflect changes in things such as reputation, position, funding, opportunities and learner satisfaction. In other words, immediate outcomes are about learning, intermediate outcomes are about taking action based on what has been learned, and impact outcomes reflect the change in conditions that will result at some point in time as a result of your actions. Below are the outcomes for this service function. Immediate (changes in learning):
Support organizations have a better understanding of TCU initiatives/priorities and how to support them
Data collection and analysis contributes to an increase in continuous improvement for both support organizations and delivery agencies
Support organizations are a key component in TCU led initiatives/priorities
Intermediate (changes in actions)
Service delivery is more responsive to the needs of adults
Literacy service delivery agencies and support organizations work together to provide a training and employment system that is more responsive to TCU initiatives/priorities
Building a Performance Framework for LBS Support Organizations, Phase 2: Adding Value
Chapter 1: Introduction | Page 11
Impact (changes in conditions, behaviour)
Governments have better information on which to base their funding and policy decisions
Provincial targets for number of learners served are met
Delivery agencies have better information on which to base programming decisions
In the following chapters we will focus on performance measurement—indicators and tools.

Building a Performance Framework for LBS Support Organizations, Phase 2: Adding Value
Chapter 1: Introduction | Page 12
Building a Performance Framework for LBS Support Organizations, Phase 2: Adding Value
Chapter 2: Measuring and Monitoring Overview | Page 13
Measuring and Monitoring Overview
“Good performance measurement is an exercise in telling a clear story, backed by credible evidence, about the value that a program adds to Canadian society.
~ Treasury Board of Canada Secretariat A logic model and its performance indicators should help you on a day-to-day basis because they help you focus attention on priorities for resources—whether that is your time, money, physical space or documents. Logic models help you to be intentional in your approach to resource allocation. As you work toward achieving the outcomes you have set, the key performance indicators attached to the logic models act as a useful check point. Are you on track? Do the outcomes or indicators still make sense or do you need to make some revisions? Have the activities that you envisioned happened, or have you had to make changes? In a climate and culture of limited resources, allowing you to make timely changes is one of the most valuable functions that a performance framework and performance measurement can play. Performance measurement is fundamentally about finding a way to systematically evaluate the impact your organization has on the “customers” you serve—whether they are the service delivery organizations you work with or whether you provide some form of direct service to a broader community. In fact, performance measurement is a valuable management tool because it allows you to document and quantify the work that you do. This, in turn, allows you to demonstrate that what you do does make a difference. If you still have some doubts about performance measurement, here are five reasons why you should measure performance:
1. To understand whether current activities are working to achieve intended results. Performance measurement helps you to understand whether what you are doing achieves the results
Building a Performance Framework for LBS Support Organizations, Phase 2: Adding Value
Chapter 2: Measuring and Monitoring Overview | Page 14
you sought and ensures that the impact you have is the intended one.
2. To drive improvement and share information about effective practices with others. Performance measurement also drives program improvement and information sharing. If your program is doing something that works well, share it with others.
3. To ensure a common understanding of what you intend to achieve and how you intend to do it. Performance measurement helps to ensure that everyone (partners, staff, the programs you serve, funders and others) is on the same page—this is especially important for partners and funders who are not involved with your program on a day-today basis.
4. To communicate and “advocate” for community support. As support organizations the community you serve is the sector or stream determined by the sector or stream you work in, or by the region if you are a regional network. Regardless of how you define community, you want to be able to communicate and advocate for your program’s effectiveness to others.
5. To accomplish the outcomes you have set. When you add things to a to-do list, you are more likely to get them done. The same goes for performance measurement—if you take the time to articulate your programs’ goals and the steps you need to take to accomplish them, you are more likely to see results.1
Describing Success
As we noted in Chapter 1, outcomes answer the “so what” question. For example, what would be the “so what” of a workshop you provided to practitioners? An immediate outcome might be a better informed workforce. How would you know if you have been successful? Performance indicators are the evaluative component of a logic model. They are the quantitative or qualitative measurements/ demonstrations of the outcomes. In other words, they provide the
1 Adapted from What Gets Measured Gets Done. Brooke Spellman and Michelle Abbenante. National Alliance to End Homelessness: 2008.Retrieved from www.endhomelessness.org/content/article /detail/2039 December 2009.
Building a Performance Framework for LBS Support Organizations, Phase 2: Adding Value
Chapter 2: Measuring and Monitoring Overview | Page 15
means for you to demonstrate the “so what” value of the work that you do. While indicators are set prior to an activity taking place they are not carved in stone. They, like the logic model itself, should be reviewed and revised as situations change. An indicator statement describes how you will know change has happened as a result of your work. It describes the specific pieces of information you will collect, document and analyze so you can track, or indicate, your progress or success. To go back to the workshop example mentioned above, an indicator could be 60% of practitioners indicate they have gained new knowledge. Outcomes can be the result of many factors. Do you need to measure all the factors? Probably not. But before you can decide what to measure or what not to measure you need a solid understanding of what will take place—what the results will be. You also need to decide whether you can attribute the change directly to your work or if your work contributes to the overall achievement of a desired outcome. In general, one to three indicators is usually a realistic number for each outcome you have identified. In fact, some outcomes can be easily measured with only one indicator. The indicators you select need to provide the evidence that demonstrates progress towards, or successful achievement of, an outcome. How will you know when an outcome has occurred? What will you see or not see? What you measure will depend on the outcomes you have set and the inputs and outputs you have put in place. Here are a few basic guidelines to help you think about what you should be measuring:
1. Measure quality over quantity: Find a way to measure the number of people who actually implement a change in addition to the number of people who attend a training workshop.
2. Pick the “low hanging fruit”: Start with a few areas in which you can easily measure change.
3. “Garbage in” can result in “garbage out”: If you use inaccurate or incomplete data, then you run the risk of reporting inaccurate information or ending up with incorrect conclusions.
Building a Performance Framework for LBS Support Organizations, Phase 2: Adding Value
Chapter 2: Measuring and Monitoring Overview | Page 16
4. Allocate adequate resources: Don’t assume that measurement has to be expensive, but be sure to create a budget line for data collection. For example, while web-based surveys can be free in terms of collecting data, you still need resources to create and analyze the survey (and don’t forget guideline #3—to get the “right” data you need to create the right survey questions—you will get what you “pay” for).
5. Be realistic: Be clear about what you want to measure, what you can measure and how, given the level of investment required for the measure, you will use the information.
6. Stay focused: Prioritizing is a critical component of all social purpose campaigns, and for good reason—you have limited resources (human, financial, etc.) so you need to set clear goals in terms of what your current capability or capacity is and where you want it to be in the future.2
It is also important to keep measuring and monitoring tasks manageable. For example, look for ways to integrate outcome monitoring into existing monitoring systems without increasing the number of questions that someone has to answer (and the amount of data that you will have to review). Some organizations use the move to an outcomes focus to review and revise existing data collection. In some cases they’ve been able to identify that they are collecting information that really serves no purpose. You also need to consider how often or when you collect the data. Are you collecting both pre and post data? Are you also collecting data during an event or an activity? Is your data collection a single point in time? More sophisticated data collection might involve a comparison between two or more groups. Here are seven key questions to consider:3
1. Do you expect change to occur immediately, gradually or over a long period of time?
2 Adapted from Measuring What Matters, The Challenge of Quantifying Social Change. Retrieved from: www.metgroup.com December 2009.
3 Adapted from Creating a Plan for Your Outcome Measurement System. Retrieved from http://www.acf.hhs.gov/programs/ocs/ccf/about_ccf/gbk_om/om_gbk_plan.html.
Building a Performance Framework for LBS Support Organizations, Phase 2: Adding Value
Chapter 2: Measuring and Monitoring Overview | Page 17
2. Are there milestones that can be measured along the way to the outcome you are trying to achieve?
3. What is the frequency of contact with the organizations with
which you are working—once, weekly, monthly or at some other interval?
4. When will data be available?
5. Are there any groups that might serve as comparison groups?
6. Do you have baseline data you can use as a standard?
7. Are you accountable for short-term outcomes or longer-term
impacts? Collecting data isn’t new. You are already collecting information from annual surveys or event evaluations, for example. Where you may need to focus your attention is on refining the information that you collect and/or “mining” data you already have to demonstrate that you are achieving the outcomes that you have set. Setting indicators isn’t without its challenges—especially for support organizations—as some outcomes are hard to measure. For example, how do you measure activities that support or supplement the work of other agencies? What other factors do you need to consider?
Attribution versus Contribution
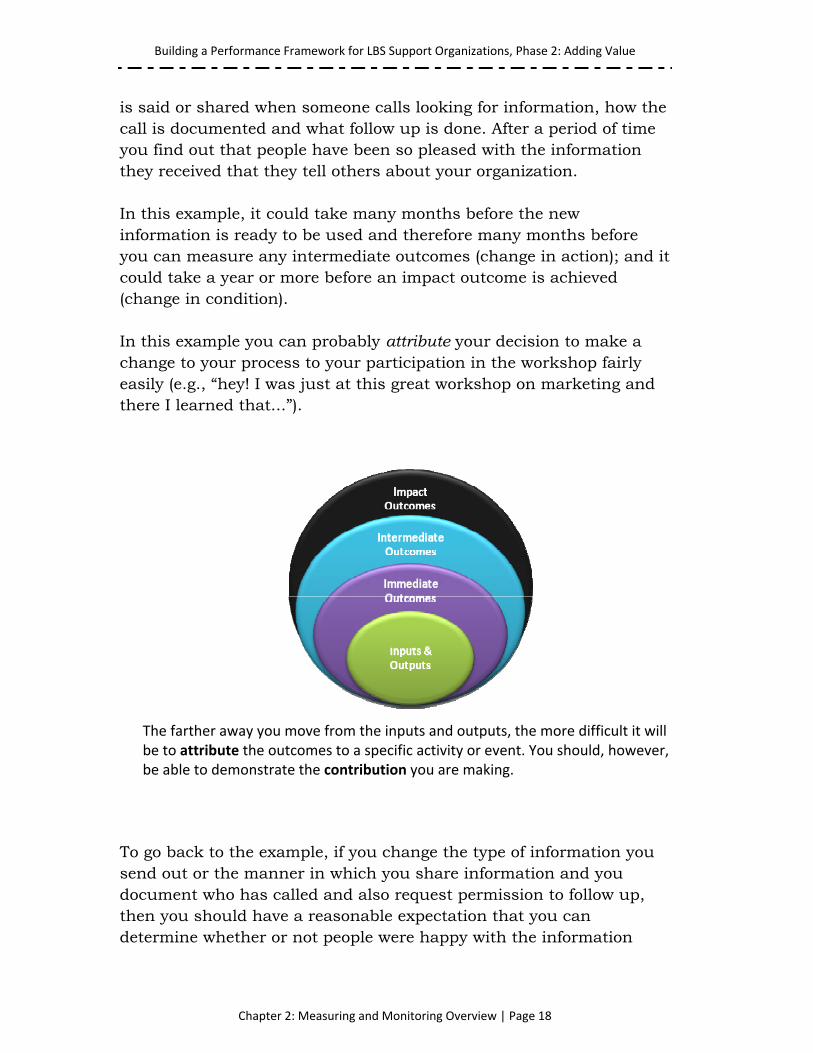
Before we begin to look at potential indicators it’s a good time to review the concepts of attribution and contribution. Attribution, in terms of performance management, refers to things that you do that are a clear link to the outcome. Contribution means that things you have done have probably helped, but the linkage isn’t quite so clear. Here’s an example: While you are at a marketing workshop you may increase your knowledge of a particular aspect of marketing (immediate outcome). The next week you discuss the workshop with a colleague or co-worker. Your discussion helps you to decide to make a change to what
Building a Performance Framework for LBS Support Organizations, Phase 2: Adding Value
Chapter 2: Measuring and Monitoring Overview | Page 18
is said or shared when someone calls looking for information, how the call is documented and what follow up is done. After a period of time you find out that people have been so pleased with the information they received that they tell others about your organization. In this example, it could take many months before the new information is ready to be used and therefore many months before you can measure any intermediate outcomes (change in action); and it could take a year or more before an impact outcome is achieved (change in condition). In this example you can probably attribute your decision to make a change to your process to your participation in the workshop fairly easily (e.g., “hey! I was just at this great workshop on marketing and there I learned that...”). To go back to the example, if you change the type of information you send out or the manner in which you share information and you document who has called and also request permission to follow up, then you should have a reasonable expectation that you can determine whether or not people were happy with the information
The farther away you move from the inputs and outputs, the more difficult it will be to attribute the outcomes to a specific activity or event. You should, however, be able to demonstrate the contribution you are making.
Building a Performance Framework for LBS Support Organizations, Phase 2: Adding Value
Chapter 2: Measuring and Monitoring Overview | Page 19
they received. If they are happy with the information they received then it is possible that they will recommend you to someone else. In this example, how easy will it be to attribute the change in practice (intermediate outcome) or the change in reputation (impact outcome) to the workshop you attended? If you ask people when they call how they heard about your organization, then you are in a better position to document a direct link to the information you have provided in the past. If you can’t make a direct link to it, can you find a way to link what you have done to the changes you have made? Careful wording of outcomes and careful selection of performance indicators should allow you to do this.
Setting Indicators
Here are some general guidelines for setting or selecting indicators: Direct: An indicator should measure as directly as possible what it
is intended to measure, for example, number and percent of stakeholders consulted.
Specific: Indicators need to be stated so that anyone would understand them, for example, number and percent of practitioners who report and increase in skills or knowledge as a result of a specific professional development opportunity.
Useful: Indicators need to help us understand what it is we are measuring. The indicator should provide information that helps us understand and improve our programs.
Practical: Costs and time involved in data collection are important considerations. Though difficult to estimate, the cost of collecting data for an indicator should not exceed the utility of the information collected. Reasonable costs, however, are to be expected.
Building a Performance Framework for LBS Support Organizations, Phase 2: Adding Value
Chapter 2: Measuring and Monitoring Overview | Page 20
Culturally appropriate: Indicators must be relevant to the cultural context. What makes sense or is appropriate in one culture may not make sense in another. Test your assumptions.
Adequate: There is no correct number or type of indicators. The number of indicators you choose depends upon what you are measuring, the level of information you need, and the resources available. Often more than one indicator is necessary. More than five, however, may mean that what you are measuring is too broad, complex or not well understood.
Measure all aspects: Indicators need to express all possible aspects of what you are measuring—possible negative or detrimental aspects as well as the positive. Consider what the negative effects or spin-offs may be and include indicators for these.
Influencing Factors
Influencing factors are those things over which you may have little or no control, but they do impact on your ability to measure and demonstrate success. Two common types of influencing factors are those related to participants and those related to a situation or organization. Participant factors, such as demographics, level of experience, and length of time in the field may need to be taken into account when analyzing data. For example, if you deliver training to program staff who have worked in the field for varying lengths of time, then this range of experience could impact on your ability to demonstrate success. If you ask, on a workshop evaluation form, about the usefulness of the workshop, people new to the field might find the workshop extremely useful, while those who have been around for a while might not agree. Asking participants to indicate how long they have worked in the field will allow you to group responses. Organizational or situational factors are those factors that belong to your organization or to a specific situation. The number of staff you have, the methods used to create or share knowledge or whether you deliver a training workshop once or ten times are just three examples
Building a Performance Framework for LBS Support Organizations, Phase 2: Adding Value
Chapter 2: Measuring and Monitoring Overview | Page 21
of this type of factor. Here’s an example: you hire someone as a project coordinator and they do a great job. You then ask that person to facilitate a workshop and the feedback from participants indicates that the facilitator did a poor job. You might have a great product but a poor facilitator clouds the impact. You’ll need to make sure that you ask questions, on the post-event evaluation that will allow participants to separate their value/view of the content from the skills of the facilitator.
Potential Indicators
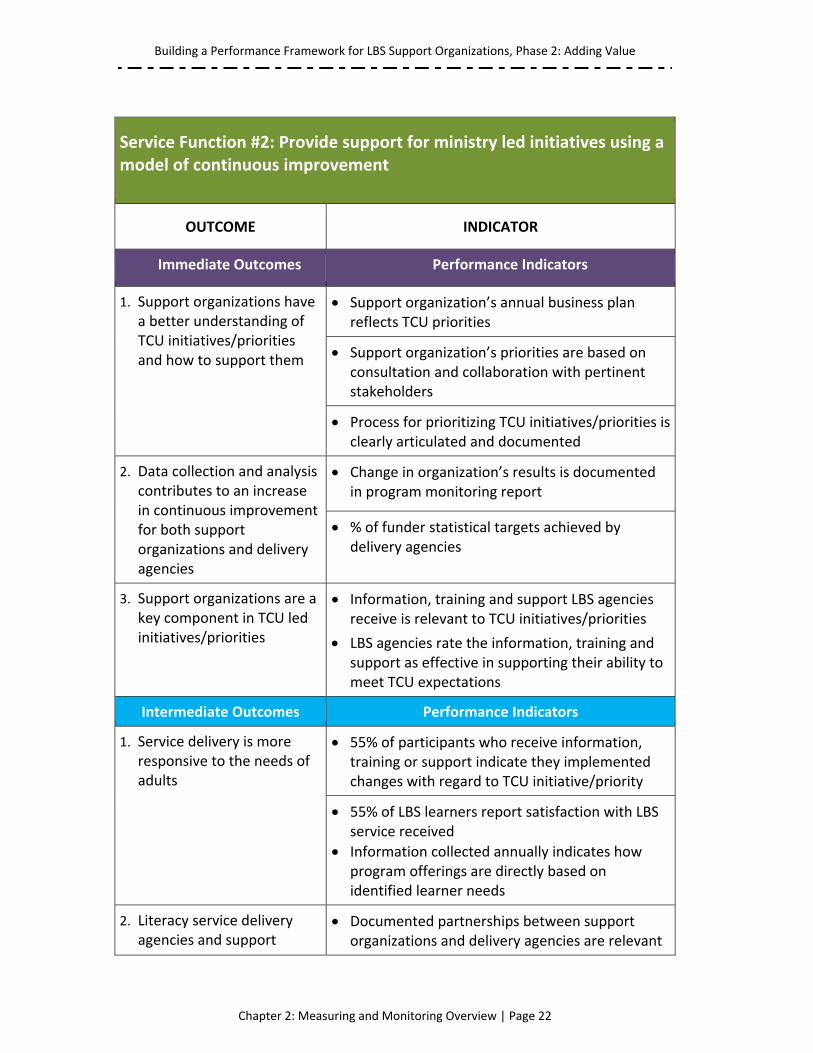
Now let’s go back to the service function (#2) that we looked at in Chapter 1 and take a look at some suggested or potential indicators for the outcomes.
Building a Performance Framework for LBS Support Organizations, Phase 2: Adding Value
Chapter 2: Measuring and Monitoring Overview | Page 22
Service Function #2: Provide support for ministry led initiatives using a model of continuous improvement
OUTCOME INDICATOR
Immediate Outcomes Performance Indicators
1. Support organizations have a better understanding of TCU initiatives/priorities and how to support them
Support organization’s annual business plan reflects TCU priorities
Support organization’s priorities are based on consultation and collaboration with pertinent stakeholders
Process for prioritizing TCU initiatives/priorities is clearly articulated and documented
2. Data collection and analysis contributes to an increase in continuous improvement for both support organizations and delivery agencies
Change in organization’s results is documented in program monitoring report
% of funder statistical targets achieved by delivery agencies
3. Support organizations are a key component in TCU led initiatives/priorities
Information, training and support LBS agencies receive is relevant to TCU initiatives/priorities
LBS agencies rate the information, training and support as effective in supporting their ability to meet TCU expectations
Intermediate Outcomes Performance Indicators
1. Service delivery is more responsive to the needs of adults
55% of participants who receive information, training or support indicate they implemented changes with regard to TCU initiative/priority
55% of LBS learners report satisfaction with LBS service received
Information collected annually indicates how program offerings are directly based on identified learner needs
2. Literacy service delivery agencies and support
Documented partnerships between support organizations and delivery agencies are relevant
Building a Performance Framework for LBS Support Organizations, Phase 2: Adding Value
Chapter 2: Measuring and Monitoring Overview | Page 23
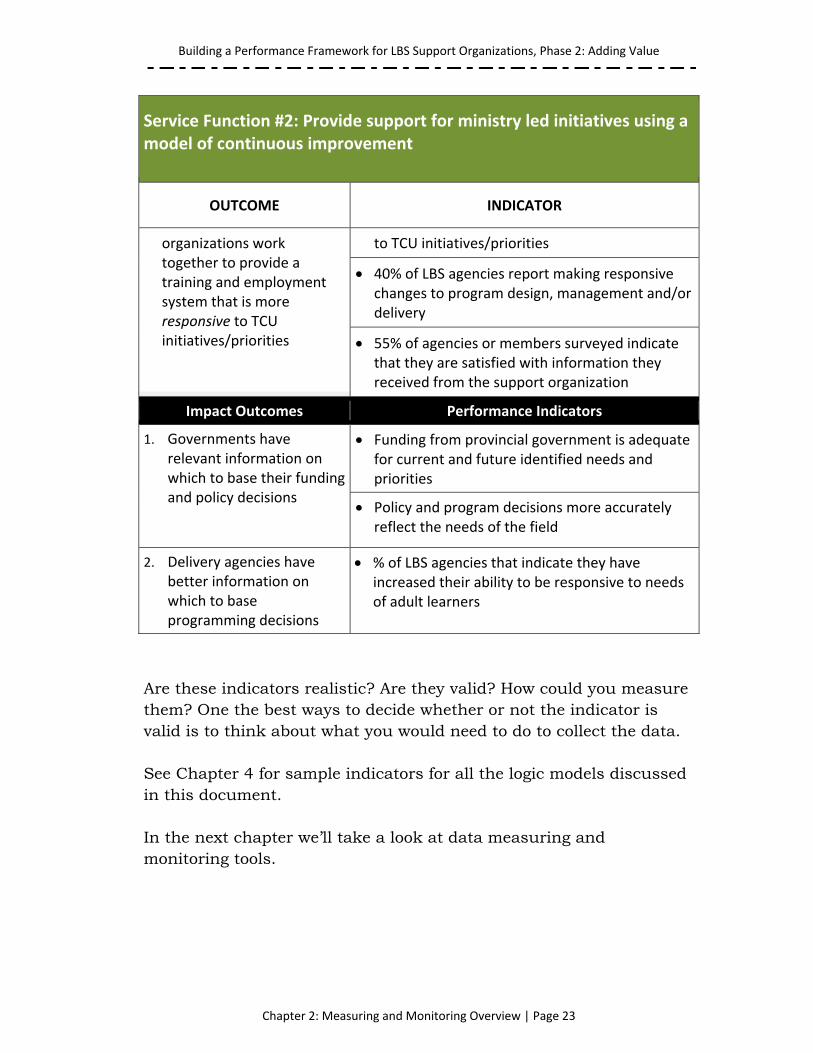
Service Function #2: Provide support for ministry led initiatives using a model of continuous improvement
OUTCOME INDICATOR
organizations work together to provide a training and employment system that is more responsive to TCU initiatives/priorities
to TCU initiatives/priorities
40% of LBS agencies report making responsive changes to program design, management and/or delivery
55% of agencies or members surveyed indicate that they are satisfied with information they received from the support organization
Impact Outcomes Performance Indicators
1. Governments have relevant information on which to base their funding and policy decisions
Funding from provincial government is adequate for current and future identified needs and priorities
Policy and program decisions more accurately reflect the needs of the field
2. Delivery agencies have better information on which to base programming decisions
% of LBS agencies that indicate they have increased their ability to be responsive to needs of adult learners
Are these indicators realistic? Are they valid? How could you measure them? One the best ways to decide whether or not the indicator is valid is to think about what you would need to do to collect the data. See Chapter 4 for sample indicators for all the logic models discussed in this document. In the next chapter we’ll take a look at data measuring and monitoring tools.

Building a Performance Framework for LBS Support Organizations, Phase 2: Adding Value
Chapter 2: Measuring and Monitoring Overview | Page 24
Building a Performance Framework for LBS Support Organizations, Phase 2: Adding Value
Chapter 3: Tools for Measuring and Monitoring | Page 25
Tools for Measuring and Monitoring
“While the field has evolved, funders and social purpose investors still wrestle with the most fundamental of questions: How do they know that their grants and investments are achieving desired results?”
~ Measuring What Matters: The Challenge of Quantifying Social Change
Performance measurement is a key component of any performance management system. Performance measurement should help you better understand and improve the programs and services your organization offers. When performance measurement is part of a performance management system, you will have a process that systematically helps you to determine how you are making an impact and to help you improve what you are doing so you can achieve better results. If you only view performance measurement as something you need to do to keep a funder happy, then you will be missing out on opportunities to truly make a difference—however small you think the change. When you look at one of the logic models, you can see that it is possible to measure all of the components. You can measure the inputs (Did you have the right resources or the correct mix of resources?); outputs: activities and results (What did you create? Did you deliver what you said you would?); and, outcomes (Did you have the intended—or even unintended—impact?). Measurement of inputs and outputs is the most common type of measurement, and mostly because it is relatively easy to capture data. Measuring outputs—as framed by performance indicators—can be a bit more difficult. In today’s funding climate measuring outcomes is of most interest to funders—as can be seen in TCU’s business plan template: “what measureable evidence will you use to show that you have achieved the outcome...?”
Building a Performance Framework for LBS Support Organizations, Phase 2: Adding Value
Chapter 3: Tools for Measuring and Monitoring | Page 26
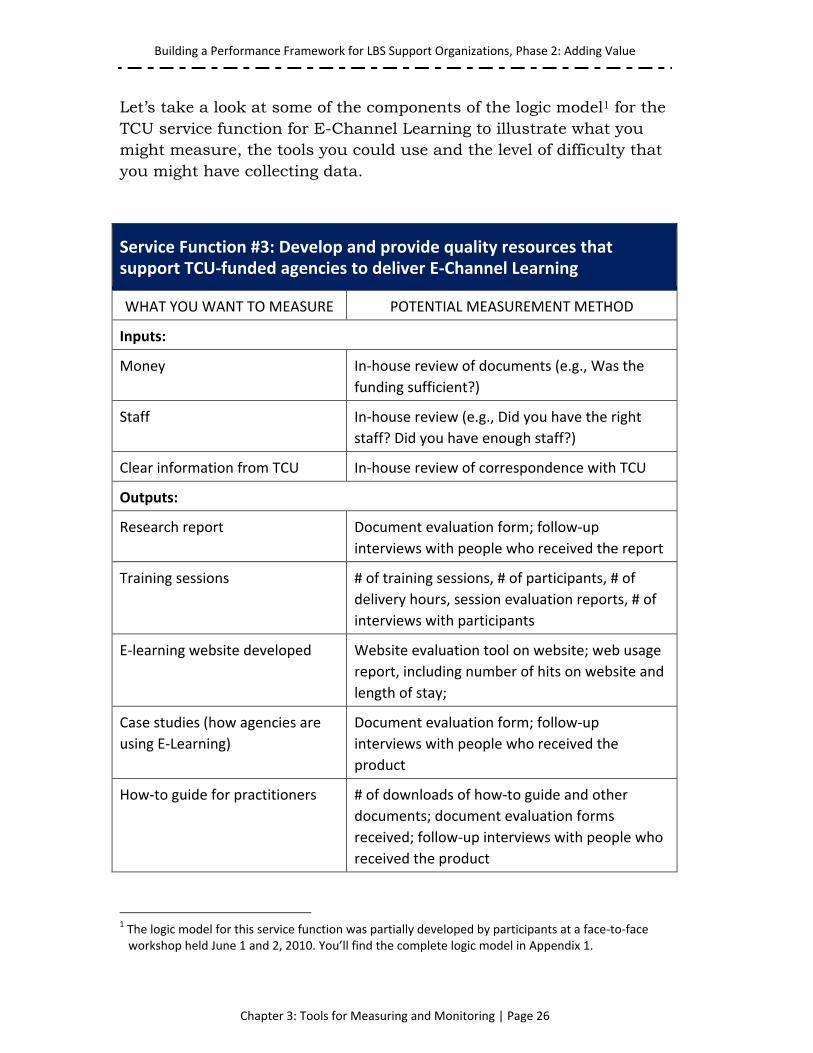
Let’s take a look at some of the components of the logic model1 for the TCU service function for E-Channel Learning to illustrate what you might measure, the tools you could use and the level of difficulty that you might have collecting data.
Service Function #3: Develop and provide quality resources that support TCU‐funded agencies to deliver E‐Channel Learning
WHAT YOU WANT TO MEASURE POTENTIAL MEASUREMENT METHOD
Inputs:
Money
In‐house review of documents (e.g., Was the
funding sufficient?)
Staff
In‐house review (e.g., Did you have the right
staff? Did you have enough staff?)
Clear information from TCU In‐house review of correspondence with TCU
Outputs:
Research report Document evaluation form; follow‐up
interviews with people who received the report
Training sessions # of training sessions, # of participants, # of
delivery hours, session evaluation reports, # of
interviews with participants
E‐learning website developed Website evaluation tool on website; web usage
report, including number of hits on website and
length of stay;
Case studies (how agencies are
using E‐Learning)
Document evaluation form; follow‐up
interviews with people who received the
product
How‐to guide for practitioners # of downloads of how‐to guide and other
documents; document evaluation forms
received; follow‐up interviews with people who
received the product
1 The logic model for this service function was partially developed by participants at a face‐to‐face workshop held June 1 and 2, 2010. You’ll find the complete logic model in Appendix 1.
Building a Performance Framework for LBS Support Organizations, Phase 2: Adding Value
Chapter 3: Tools for Measuring and Monitoring | Page 27
Service Function #3: Develop and provide quality resources that support TCU‐funded agencies to deliver E‐Channel Learning
WHAT YOU WANT TO MEASURE POTENTIAL MEASUREMENT METHOD
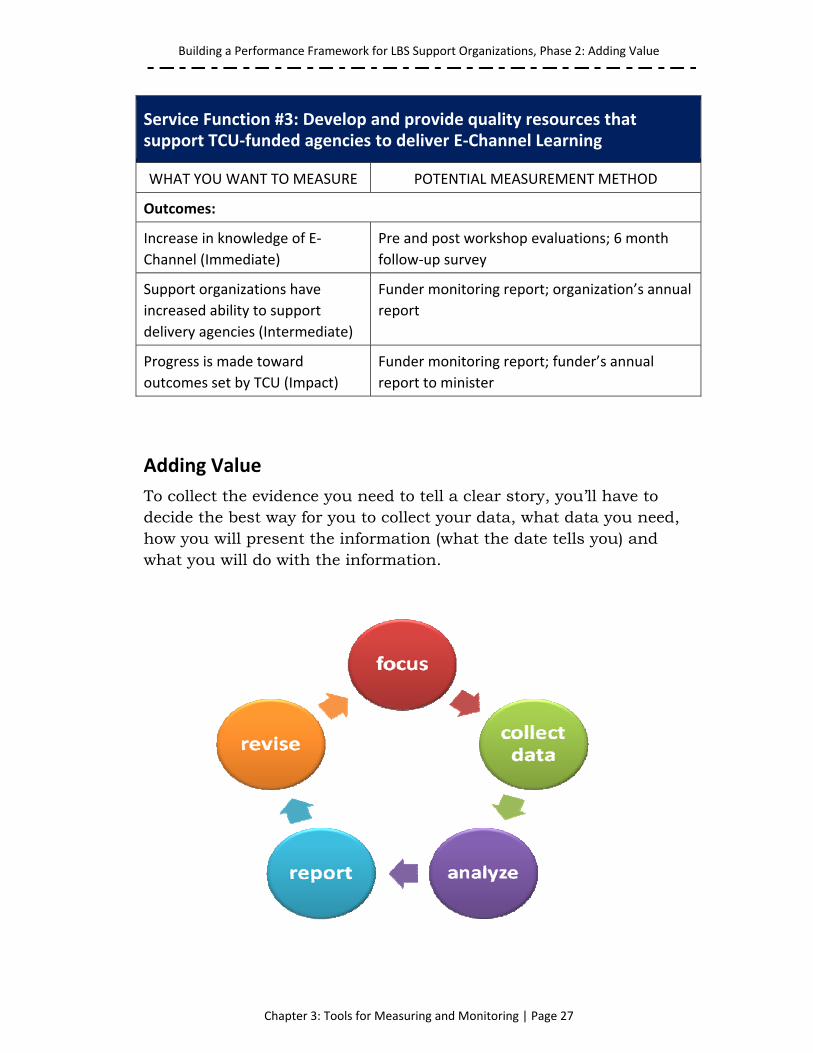
Outcomes:
Increase in knowledge of E‐
Channel (Immediate)
Pre and post workshop evaluations; 6 month
follow‐up survey
Support organizations have
increased ability to support
delivery agencies (Intermediate)
Funder monitoring report; organization’s annual
report
Progress is made toward
outcomes set by TCU (Impact)
Funder monitoring report; funder’s annual
report to minister
Adding Value
To collect the evidence you need to tell a clear story, you’ll have to decide the best way for you to collect your data, what data you need, how you will present the information (what the date tells you) and what you will do with the information.
Building a Performance Framework for LBS Support Organizations, Phase 2: Adding Value
Chapter 3: Tools for Measuring and Monitoring | Page 28
Key Questions to Consider
Focus: What is it you want to find out? What are you measuring/ evaluating? Who needs to be involved in the process? How will the information be used? Collect data: What data? How hard or easy is it to get? What tools are you using? When are you collecting the data? What are your sources of information? What is the most appropriate tool? Analyze data: What does the data tell you? What tools are you using to analyze the data? Report: Who wants to know what you’ve found out and why? Revise: What changes will you make based on what you’ve found out?
Baselines, Benchmarks, Targets and Milestones
Setting an indicator is only a part of the measurement story. There are other factors that you need to consider before you can begin. These are baselines, benchmarks, targets and milestones. For this project the following definitions were used for each of these terms. Baseline
• Reflects current practice
• Helps to clarify the implications contained in the indicator Baseline data reflects the set of “conditions” existing at the outset of a program or time frame. Making a note of the “conditions” before you begin will allow you to make comparisons over time. You can determine progress, or lack thereof, and make appropriate changes or create a rationale for the situation. Benchmark
• A “standard” against which the performance can be measured
• Reflects goal(s) you are working towards
Building a Performance Framework for LBS Support Organizations, Phase 2: Adding Value
Chapter 3: Tools for Measuring and Monitoring | Page 29
Benchmarks aren’t used very much in the literacy field in Ontario. The closest we come to benchmarks are the provincial goals set by TCU (for example, the increase in the number of adults accessing LBS programs in a given year). Targets
• Reflect things you want to achieve at a particular point in time Setting targets will help you to adjust what you are doing while you are doing it. For example, if you said you would consult with 20 organizations during the first 3 months of a project and find that the number is unrealistic, then you can make an adjustment and refine your target. Milestones
• Markers along the way Milestones are really short distance markers or check-in points. Going back to the example of contacting 20 organizations, you would probably decide that you need to reach 5 every 2 weeks (your milestone) so you would have time to write a report on what you learned; if it’s week 3 or 4 and you haven’t had any contact with 5 organizations, then you will probably adjust the total number of organizations or re-evaluate the type of organization you are attempting to contact.
Measurement Tools
There a limited number of tools that you need to use and most, if not all, of these you are already using. What you may need to do is refine or refocus your evaluation tools. During Phase 1 the following were identified as the key measurement tools:
• “Needs” Assessment – annual/semi-annual survey of the stakeholders you serve
• Pre and Post Evaluations of workshops/events
• Participant Follow-up Survey
Building a Performance Framework for LBS Support Organizations, Phase 2: Adding Value
Chapter 3: Tools for Measuring and Monitoring | Page 30
• Document review: Reports, meeting notes, other types of communications
You can find samples of these tools in the Phase1 report. To download the report go to www.projectread.ca/practitioners and scroll down to the link to Building a Performance Framework for LBS Support Organizations in Ontario. In terms of measuring specific indicators, it isn’t all or nothing. Rather, start with a few areas in which you can easily measure change (“low hanging fruit”). You can collect information on the same outcome in more than one way, for example, through a combination of participant self-assessment and focus groups. Using more than one method can increase the strength of your findings. Also, it is possible to use one tool to collect information that addresses two or more outcomes and performance indicators. For example, the data collected from the annual organization evaluation survey you conduct should, if the questions are worded appropriately, provide you with evidence for several outcomes and indictors.
Analyzing Outcome Information
Quantitative analysis
For the most part, you only need a simple quantitative analysis—averages and percentages. For example, the number of workshops held and the percentage of practitioners who attended a particular workshop. Qualitative analysis
While qualitative data asks respondents to express their opinion, you can summarize and group the information collected. Qualitative analysis can be very complex, often involving looking at the themes and ideas that emerge from people’s comments.
Building a Performance Framework for LBS Support Organizations, Phase 2: Adding Value
Chapter 3: Tools for Measuring and Monitoring | Page 31
If you ask enough people the same question, you can turn qualitative data into quantitative data. For example, if you ask “What suggestions do you have for future professional development?” you can group responses into common or similar responses. From here you will be able to say (for example) “70% of respondents requested...”. Interpretation
What does the data tell you? When you look for trends and issues, you will be able to highlight what went well (or is going well). If the data collection is at a mid-point or at the end of the first of a series of workshops (for example), then you can also determine whether change or improvements are needed. You need to situate your analysis or interpretation into the context of your organization. Survey results should tell whether or not you’ve achieved an outcome. Here’s an example: your immediate outcome is an increase in practitioner’s knowledge about E-Channel learning. If you ask people to rate their increase in knowledge, then you’ll be able to say whether or not this has happened. But can you clearly demonstrate why it happened? If you have set your indicator to say that 85% of practitioners will have increased their knowledge about E-channel learning and you don’t meet the target or you exceed that target, can you explain why? To help you understand the results better, and to provide context for the results, you need to filter the results by asking questions such as:
Was the level of inputs adequate? For example, to what extent did the level of money or staffing devoted to the project affect the outcome?
Was the outcome affected by the way in which the work was carried out?
Did other factors influence2 the results?
2 Influencing factors are those things over which you may have little or no control, but they do impact on your ability to measure and demonstrate success. See Chapter 2 for more information.
Building a Performance Framework for LBS Support Organizations, Phase 2: Adding Value
Chapter 3: Tools for Measuring and Monitoring | Page 32
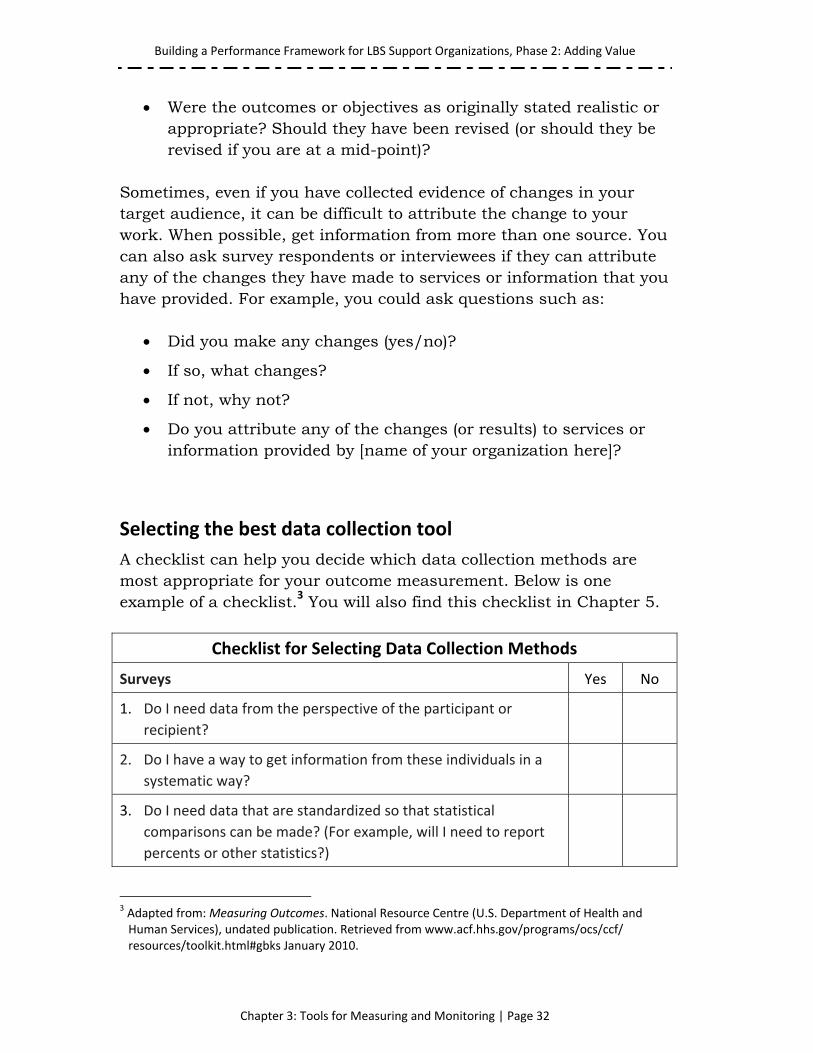
Were the outcomes or objectives as originally stated realistic or appropriate? Should they have been revised (or should they be revised if you are at a mid-point)?
Sometimes, even if you have collected evidence of changes in your target audience, it can be difficult to attribute the change to your work. When possible, get information from more than one source. You can also ask survey respondents or interviewees if they can attribute any of the changes they have made to services or information that you have provided. For example, you could ask questions such as:
Did you make any changes (yes/no)?
If so, what changes?
If not, why not?
Do you attribute any of the changes (or results) to services or information provided by [name of your organization here]?
Selecting the best data collection tool
A checklist can help you decide which data collection methods are most appropriate for your outcome measurement. Below is one example of a checklist.3 You will also find this checklist in Chapter 5.
Checklist for Selecting Data Collection Methods
Surveys Yes No
1. Do I need data from the perspective of the participant or
recipient?
2. Do I have a way to get information from these individuals in a
systematic way?
3. Do I need data that are standardized so that statistical
comparisons can be made? (For example, will I need to report
percents or other statistics?)
3 Adapted from: Measuring Outcomes. National Resource Centre (U.S. Department of Health and Human Services), undated publication. Retrieved from www.acf.hhs.gov/programs/ocs/ccf/ resources/toolkit.html#gbks January 2010.
Building a Performance Framework for LBS Support Organizations, Phase 2: Adding Value
Chapter 3: Tools for Measuring and Monitoring | Page 33
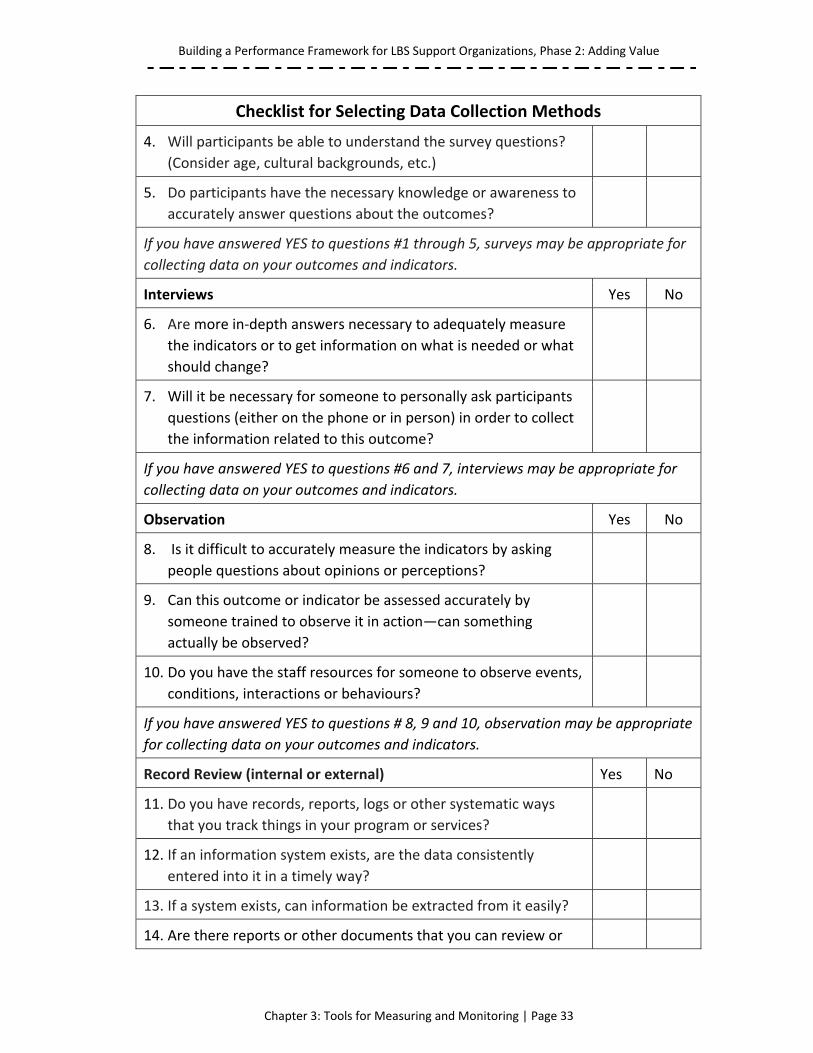
Checklist for Selecting Data Collection Methods
4. Will participants be able to understand the survey questions?
(Consider age, cultural backgrounds, etc.)
5. Do participants have the necessary knowledge or awareness to
accurately answer questions about the outcomes?
If you have answered YES to questions #1 through 5, surveys may be appropriate for
collecting data on your outcomes and indicators.
Interviews Yes No
6. Are more in‐depth answers necessary to adequately measure
the indicators or to get information on what is needed or what
should change?
7. Will it be necessary for someone to personally ask participants
questions (either on the phone or in person) in order to collect
the information related to this outcome?
If you have answered YES to questions #6 and 7, interviews may be appropriate for
collecting data on your outcomes and indicators.
Observation Yes No
8. Is it difficult to accurately measure the indicators by asking
people questions about opinions or perceptions?
9. Can this outcome or indicator be assessed accurately by
someone trained to observe it in action—can something
actually be observed?
10. Do you have the staff resources for someone to observe events,
conditions, interactions or behaviours?
If you have answered YES to questions # 8, 9 and 10, observation may be appropriate
for collecting data on your outcomes and indicators.
Record Review (internal or external) Yes No
11. Do you have records, reports, logs or other systematic ways
that you track things in your program or services?
12. If an information system exists, are the data consistently
entered into it in a timely way?
13. If a system exists, can information be extracted from it easily?
14. Are there reports or other documents that you can review or
Building a Performance Framework for LBS Support Organizations, Phase 2: Adding Value
Chapter 3: Tools for Measuring and Monitoring | Page 34
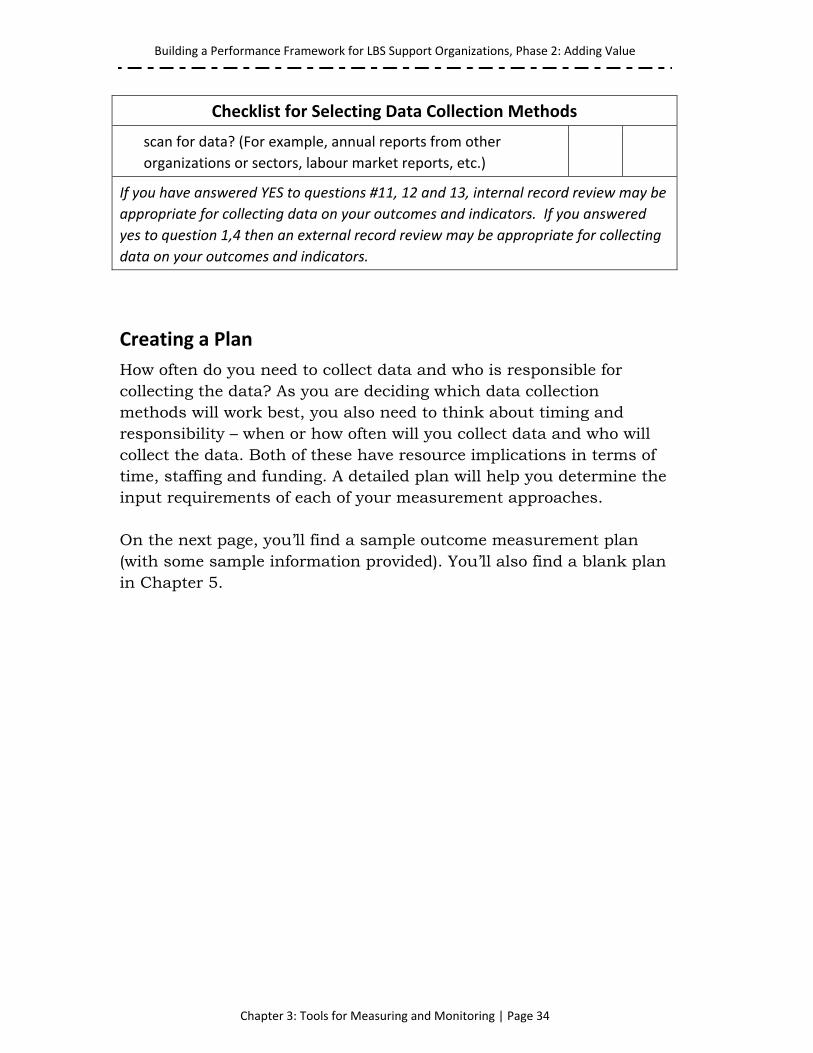
Checklist for Selecting Data Collection Methods
scan for data? (For example, annual reports from other
organizations or sectors, labour market reports, etc.)
If you have answered YES to questions #11, 12 and 13, internal record review may be
appropriate for collecting data on your outcomes and indicators. If you answered
yes to question 1,4 then an external record review may be appropriate for collecting
data on your outcomes and indicators.
Creating a Plan
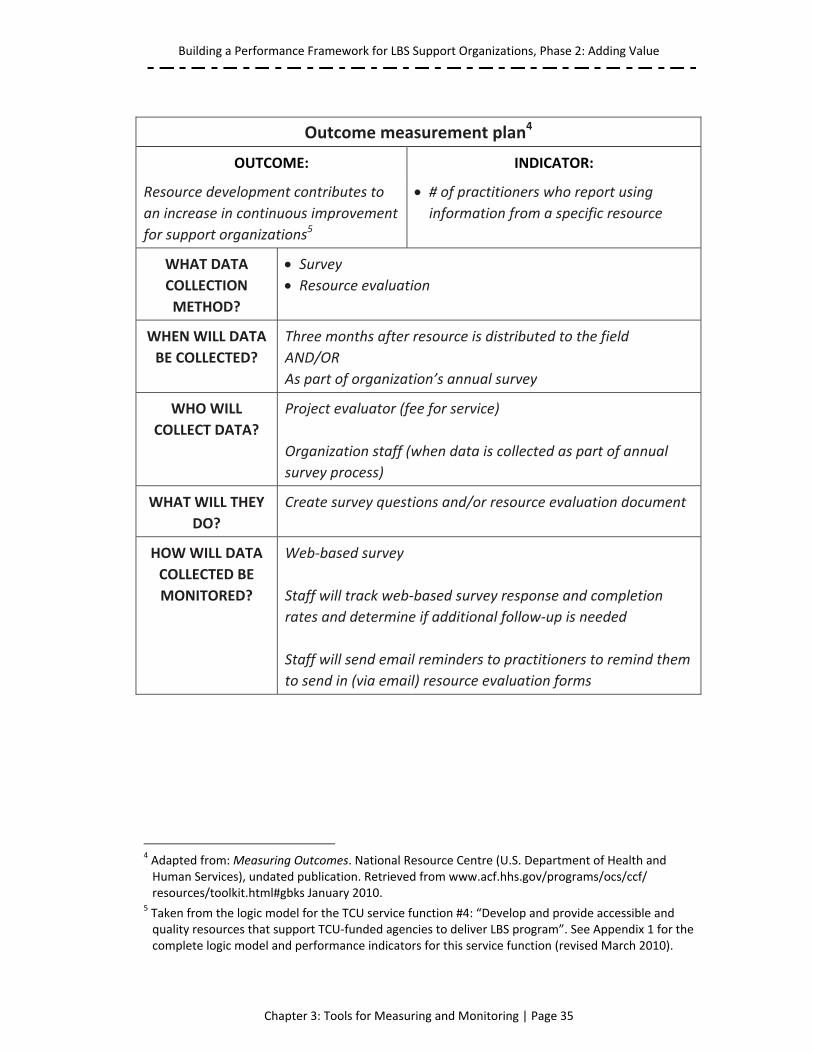
How often do you need to collect data and who is responsible for collecting the data? As you are deciding which data collection methods will work best, you also need to think about timing and responsibility – when or how often will you collect data and who will collect the data. Both of these have resource implications in terms of time, staffing and funding. A detailed plan will help you determine the input requirements of each of your measurement approaches. On the next page, you’ll find a sample outcome measurement plan (with some sample information provided). You’ll also find a blank plan in Chapter 5.
Building a Performance Framework for LBS Support Organizations, Phase 2: Adding Value
Chapter 3: Tools for Measuring and Monitoring | Page 35
Outcome measurement plan4
OUTCOME: INDICATOR:
Resource development contributes to
an increase in continuous improvement
for support organizations5
# of practitioners who report using information from a specific resource
WHAT DATA
COLLECTION
METHOD?
Survey Resource evaluation
WHEN WILL DATA
BE COLLECTED?
Three months after resource is distributed to the field
AND/OR
As part of organization’s annual survey
WHO WILL
COLLECT DATA?
Project evaluator (fee for service)
Organization staff (when data is collected as part of annual
survey process)
WHAT WILL THEY
DO?
Create survey questions and/or resource evaluation document
HOW WILL DATA
COLLECTED BE
MONITORED?
Web‐based survey
Staff will track web‐based survey response and completion
rates and determine if additional follow‐up is needed
Staff will send email reminders to practitioners to remind them
to send in (via email) resource evaluation forms
4 Adapted from: Measuring Outcomes. National Resource Centre (U.S. Department of Health and Human Services), undated publication. Retrieved from www.acf.hhs.gov/programs/ocs/ccf/ resources/toolkit.html#gbks January 2010.
5 Taken from the logic model for the TCU service function #4: “Develop and provide accessible and quality resources that support TCU‐funded agencies to deliver LBS program”. See Appendix 1 for the complete logic model and performance indicators for this service function (revised March 2010).

Building a Performance Framework for LBS Support Organizations, Phase 2: Adding Value
Chapter 3: Tools for Measuring and Monitoring | Page 36
Building a Performance Framework for LBS Support Organizations, Phase 2: Adding Value
Chapter 4: Performance Indicators | Page 37
Performance Indicators
“What measurable evidence will you use to show that you have achieved the outcome/results listed in section D?”
~ TCU Business Plan (2010)
Are logic models and performance indicators magic bullets? Of course they aren’t. Are the logic models and sample indicators perfect at this point in time? No, they aren’t. What you should see, however, are templates you can use to create logic models and set performance indicators that work for you. In Phase 1, the logic models were developed as a way to look at the work that support organizations do for the funding they receive from the Ministry of Training, Colleges and Universities (TCU). The framework should be seen as an opportunity to describe to TCU what it is you do, given a certain set of circumstances (the service functions) and based on a set of assumptions about the way things unfold in the literacy field in Ontario at this point in time. If you work with the framework, then you should be able to make the case for what you do. Without a doubt organizational life is never as clear cut as an “if-then” statement or relationship suggests. There are many interconnected and overlapping correlations between what you do and what happens as a result. Powell-Taylor (2008) and others have noted that one of the limitations of logic models is the “necessity of communicating on paper in a two-dimensional space” what can be multidimensional issues or problems. Together the logic models and performance indicators create a framework, but one that isn’t rigid. In Phase 2, two of the Phase 1 logic models were revised and a logic model for the new service function was created. Each of the revised logic models was reviewed by the Phase 2 advisory team and each one was determined to be a reasonable “picture” of the service function. Work on the third logic
Building a Performance Framework for LBS Support Organizations, Phase 2: Adding Value
Chapter 4: Performance Indicators | Page 38
model was started during a two-day workshop held in June 2010 and finalized after the workshop. In this Chapter we’ve provided outcome statements, performance indicators and suggested measurement tools for these three logic models. In Chapter 5 you’ll some find sample measurement tools. You’ll find the complete logic models and performance indicators for these service functions in Appendix 1. In Appendix 2 you’ll find the logic model for the service function that was not revised during Phase 2. With it are questions and reflection sheets that you can use to make the logic model become a better fit with the work that your organization does in Ontario.
Building a Performance Framework for LBS Support Organizations, Phase 2: Adding Value
Chapter 4: Performance Indicators | Page 39
Service Function #2: Provide support for ministry led initiatives using a model of continuous im
provement
Key Perform
ance In
dicators & M
easures
Immediate Outcomes
Perform
ance In
dicators
Measurement To
ols
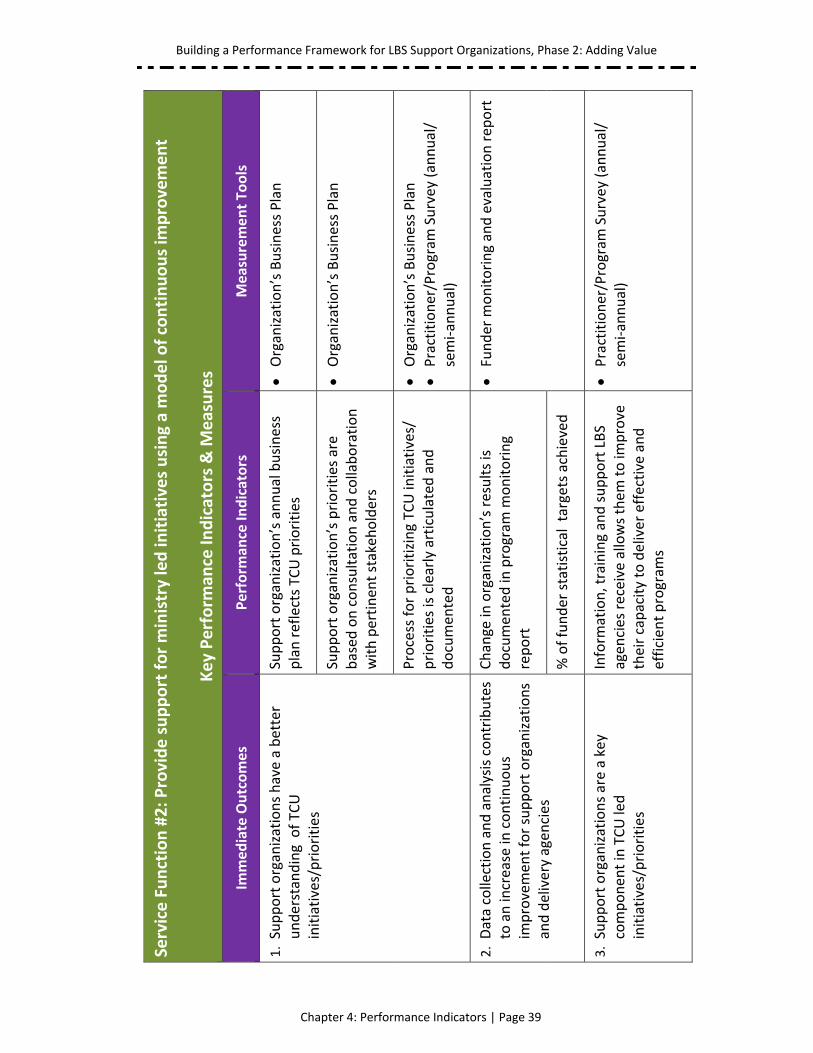
1. Support organizations have a better
understanding of TC
U
initiatives/priorities
Support organization’s annual business
plan reflects TC
U priorities
Organization’s Business Plan
Support organization’s priorities are
based
on consultation and collaboration
with pertinen
t stakeh
olders
Organization’s Business Plan
Process for prioritizing TC
U initiatives/
priorities is clearly articulated and
documen
ted
Organization’s Business Plan
Practitioner/Program
Survey (annual/
semi‐annual)
2. Data collection and analysis contributes
to an increase in
continuous
improvemen
t for support organizations
and delivery agen
cies
Change in
organization’s results is
documen
ted in
program
monitoring
report
Funder m
onitoring and evaluation rep
ort
% of funder statistical targets achieved
3. Support organizations are a key
componen
t in TCU led
initiatives/priorities
Inform
ation, training and support LBS
agen
cies receive allows them
to im
prove
their capacity to deliver effective and
efficien
t program
s
Practitioner/Program
Survey (annual/
semi‐annual)
Building a Performance Framework for LBS Support Organizations, Phase 2: Adding Value
Chapter 4: Performance Indicators | Page 40
Service Function #2: Provide support for ministry led initiatives using a model of continuous im
provement
Key Perform
ance In
dicators & M
easures
Interm
ediate Outcomes
Perform
ance In
dicators
Measurement To
ols
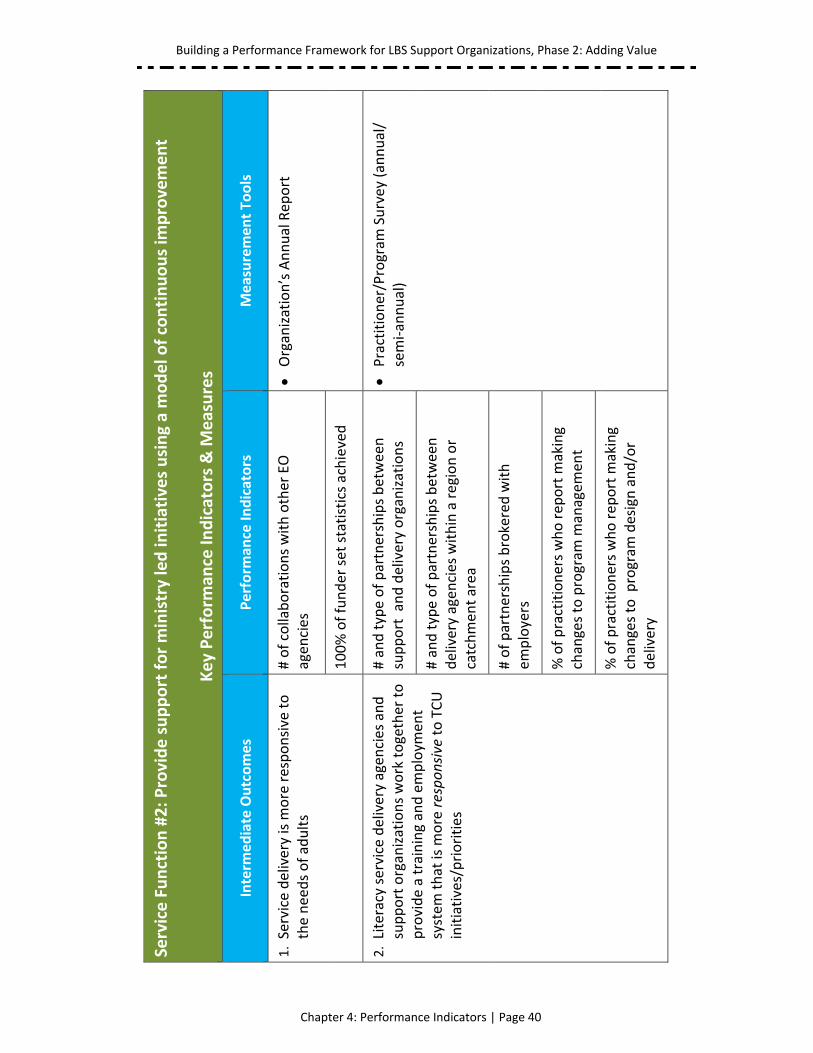
1. Service delivery is m
ore responsive to
the needs of adults
# of collaborations with other EO
agen
cies
Organization’s Annual Rep
ort
100% of funder set statistics achieved
2. Literacy service delivery agen
cies and
support organizations work together to
provide a training and employm
ent
system
that is m
ore responsive to TCU
initiatives/priorities
# and type of partnerships between
support and delivery organizations
Practitioner/Program
Survey (annual/
semi‐annual)
# and type of partnerships between
delivery agen
cies within a region or
catchmen
t area
# of partnerships brokered with
employers
% of practitioners who report m
aking
changes to program
managem
ent
% of practitioners who report m
aking
changes to program
design and/or
delivery
Building a Performance Framework for LBS Support Organizations, Phase 2: Adding Value
Chapter 4: Performance Indicators | Page 41
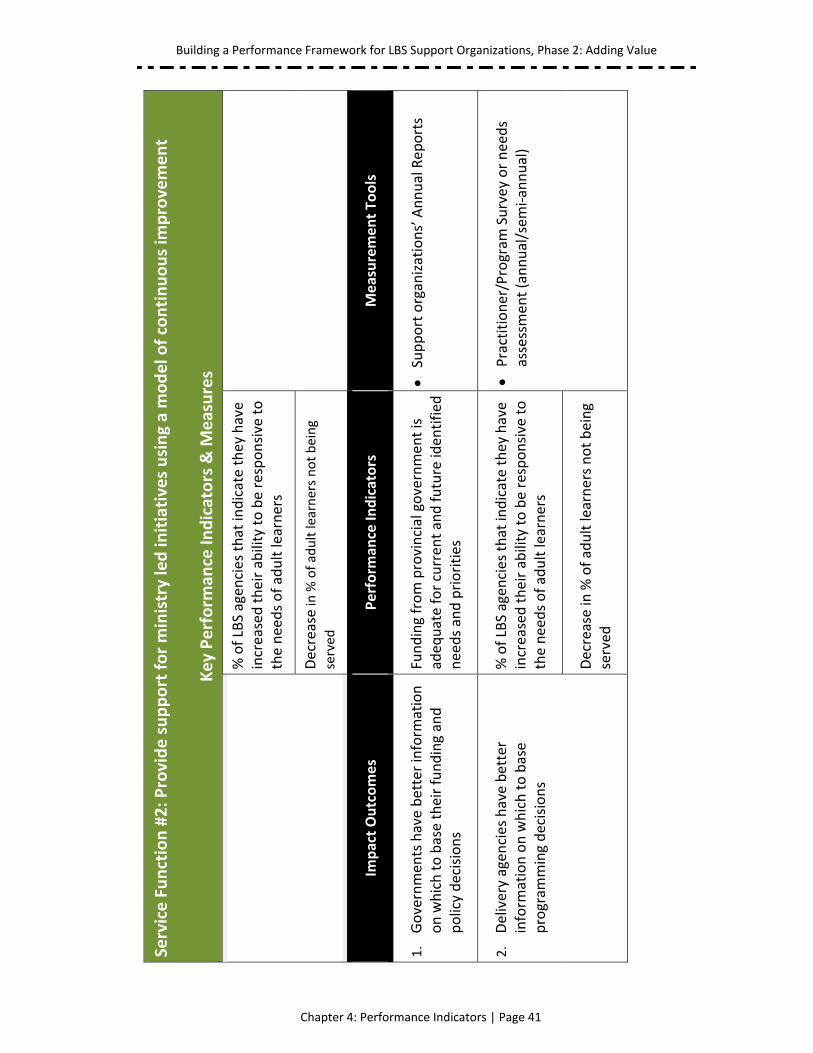
Service Function #2: Provide support for ministry led initiatives using a model of continuous im
provement
Key Perform
ance In
dicators & M
easures
% of LBS agen
cies that indicate they have
increased their ability to be responsive to
the needs of adult learners
Decrease in
% of adult learners not being
served
Impact Outcomes
Perform
ance In
dicators
Measurement To
ols
1.
Governmen
ts have better inform
ation
on which to base their funding and
policy decisions
Funding from provincial governmen
t is
adeq
uate for curren
t and future iden
tified
needs and priorities
Support organizations’ Annual Rep
orts
2.
Delivery agen
cies have better
inform
ation on which to base
program
ming decisions
% of LBS agen
cies that indicate they have
increased their ability to be responsive to
the needs of adult learners
Practitioner/Program
Survey or needs
assessmen
t (annual/sem
i‐annual)
Decrease in
% of adult learners not being
served
Building a Performance Framework for LBS Support Organizations, Phase 2: Adding Value
Chapter 4: Performance Indicators | Page 42
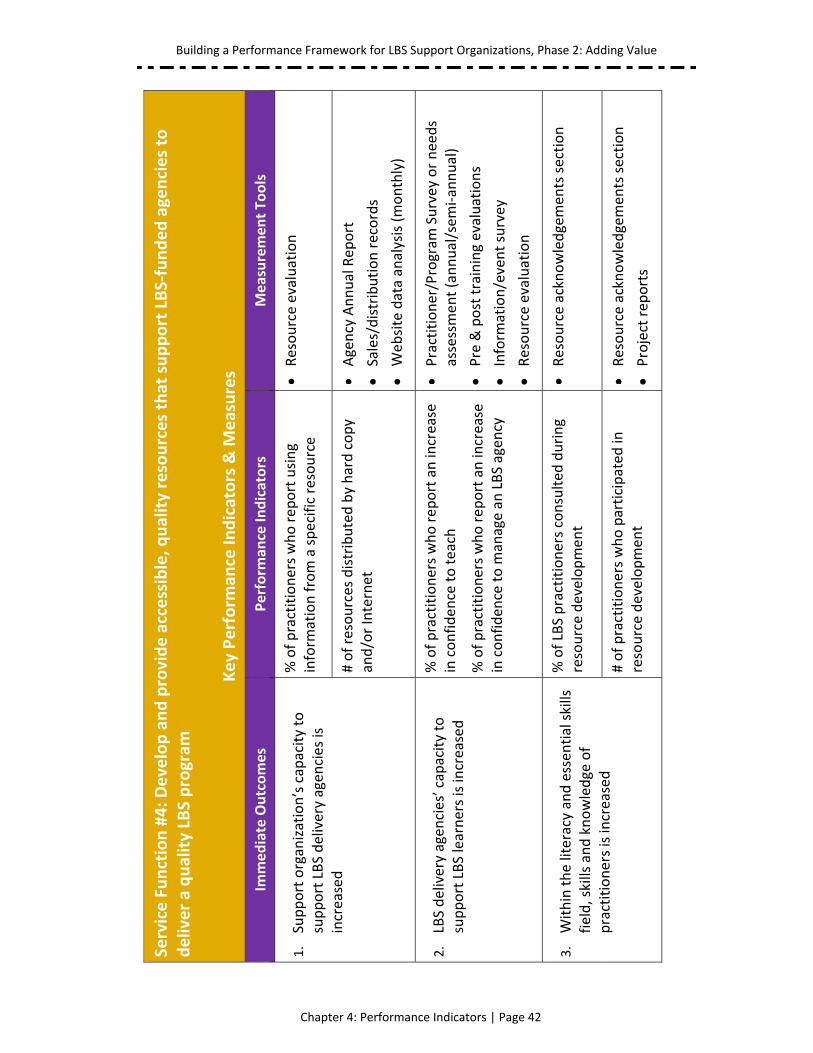
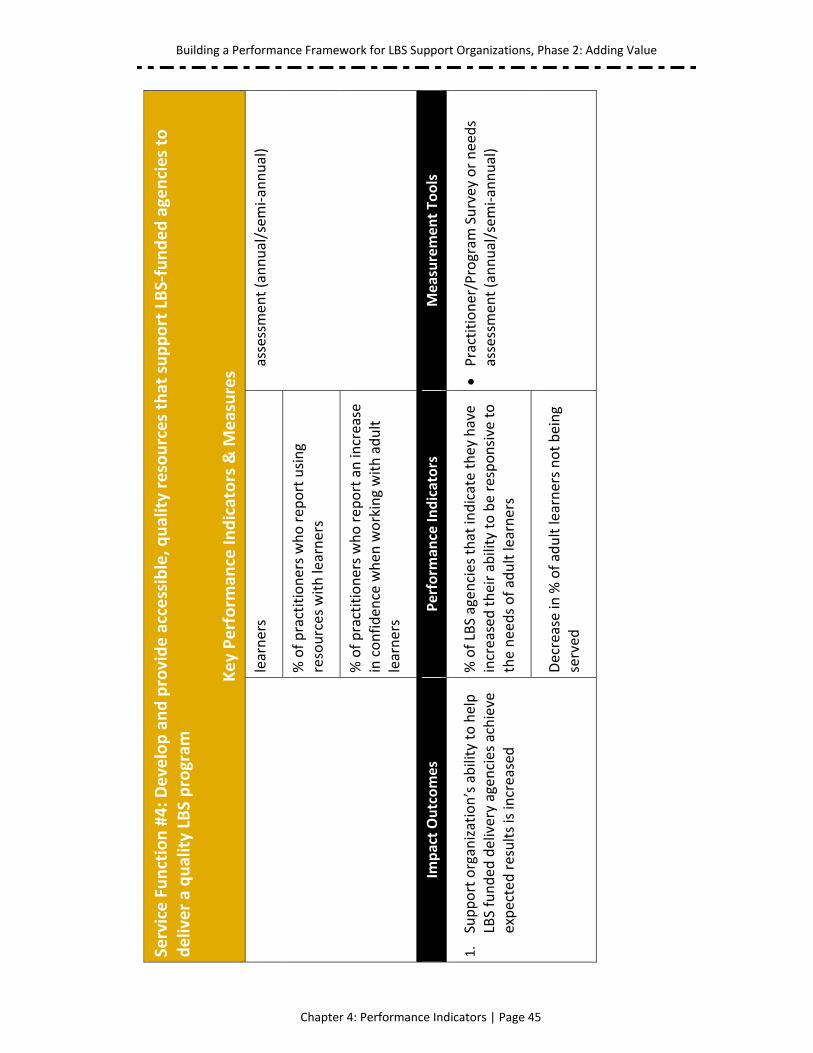
Service Function #4: Develop and provide accessible, q
uality resources that support LBS‐funded agencies to
deliver a quality LBS program
Key Perform
ance In
dicators & M
easures
Immediate Outcomes
Perform
ance In
dicators
Measurement To
ols
1.
Support organization’s capacity to
support LBS delivery agen
cies is
increased
% of practitioners who report using
inform
ation from a specific resource
Resource evaluation
# of resources distributed by hard copy
and/or Internet
Agency Annual Rep
ort
Sales/distribution records
Web
site data analysis (monthly)
2.
LBS delivery agen
cies’ capacity to
support LBS learners is increased
% of practitioners who report an increase
in confiden
ce to teach
% of practitioners who report an increase
in confiden
ce to m
anage an
LBS agen
cy
Practitioner/Program
Survey or needs
assessmen
t (annual/sem
i‐annual)
Pre & post training evaluations
Inform
ation/event survey
Resource evaluation
3.
Within the literacy and essen
tial skills
field, skills and knowledge of
practitioners is increased
% of LBS practitioners consulted
during
resource developmen
t
Resource acknowledgemen
ts section
# of practitioners who participated
in
resource developmen
t
Resource acknowledgemen
ts section
Project rep
orts
Building a Performance Framework for LBS Support Organizations, Phase 2: Adding Value
Chapter 4: Performance Indicators | Page 43
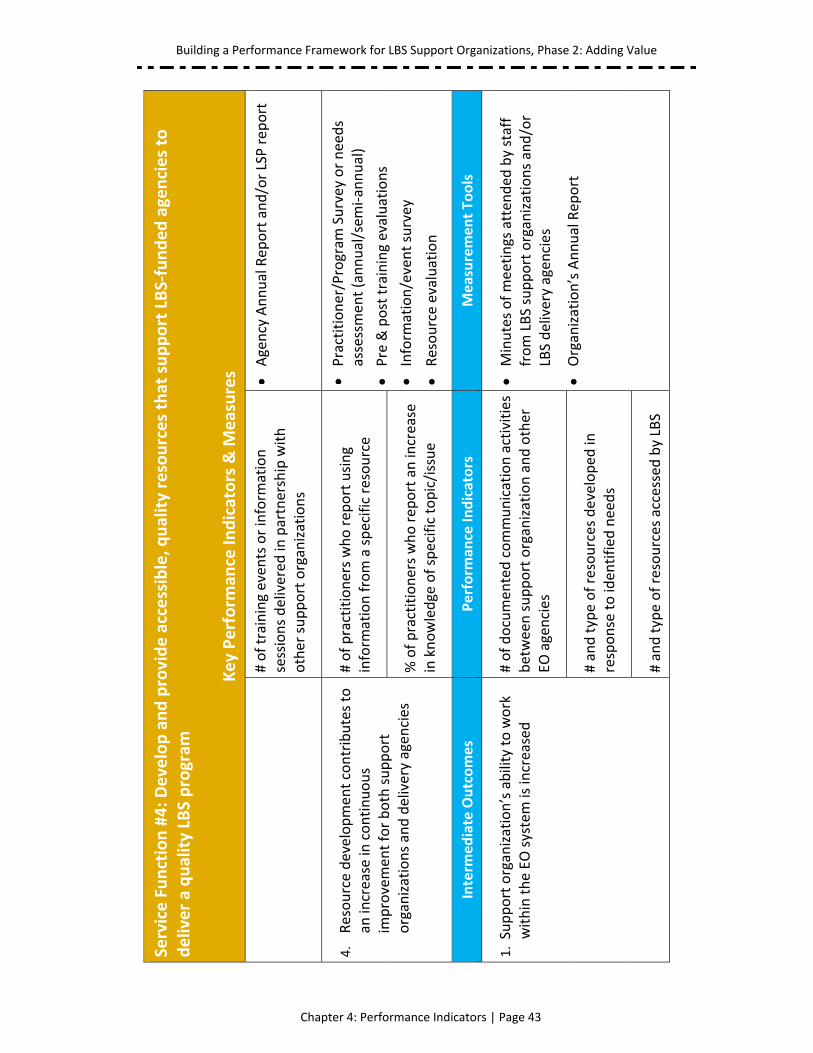
Service Function #4: Develop and provide accessible, q
uality resources that support LBS‐funded agencies to
deliver a quality LBS program
Key Perform
ance In
dicators & M
easures
# of training even
ts or inform
ation
sessions delivered
in partnership with
other support organizations
Agency Annual Rep
ort and/or LSP report
4.
Resource development contributes to
an increase in continuous
improvemen
t for both support
organizations and delivery agen
cies
# of practitioners who report using
inform
ation from a specific resource
Practitioner/Program
Survey or needs
assessmen
t (annual/sem
i‐annual)
Pre & post training evaluations
Inform
ation/event survey
Resource evaluation
% of practitioners who report an increase
in knowledge of specific topic/issue
Interm
ediate Outcomes
Perform
ance In
dicators
Measurement To
ols
1. Support organization’s ability to work
within the EO system is increased
# of documen
ted communication activities
between support organization and other
EO agencies
Minutes of meetings atten
ded
by staff
from LBS support organizations and/or
LBS delivery agen
cies
Organization’s Annual Rep
ort
# and type of resources developed
in
response to iden
tified
needs
# and type of resources accessed by LBS
Building a Performance Framework for LBS Support Organizations, Phase 2: Adding Value
Chapter 4: Performance Indicators | Page 44
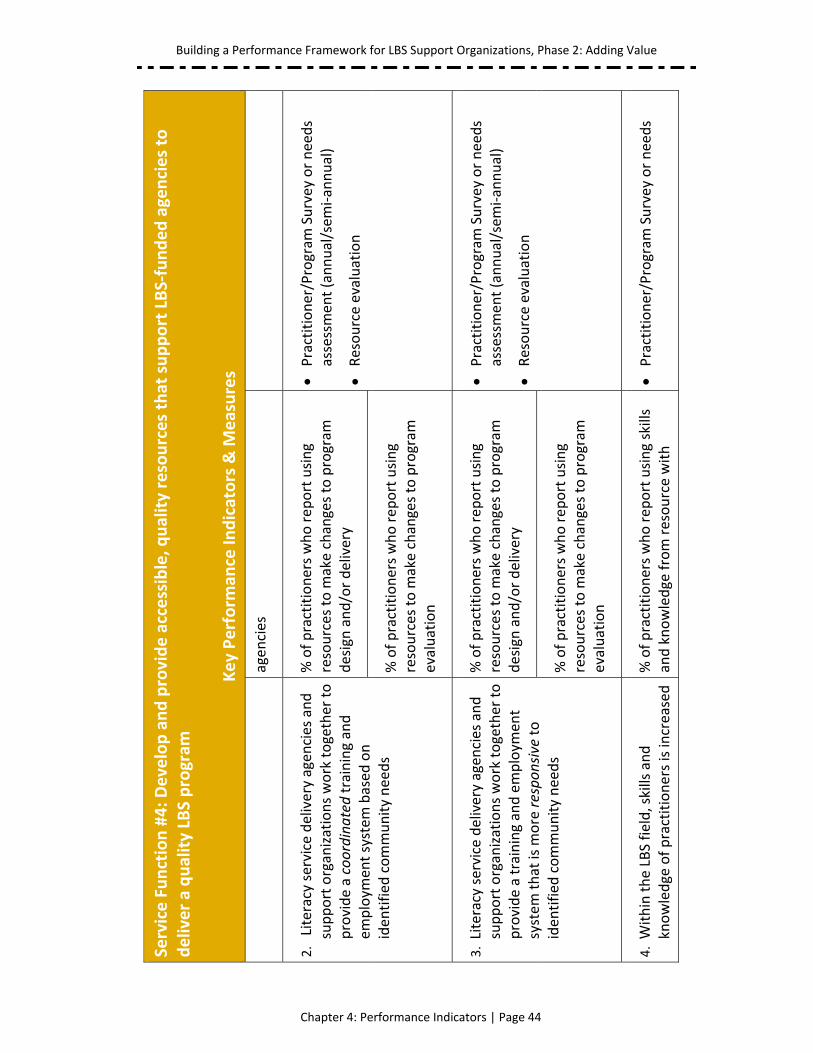
Service Function #4: Develop and provide accessible, q
uality resources that support LBS‐funded agencies to
deliver a quality LBS program
Key Perform
ance In
dicators & M
easures
agen
cies
2. Literacy service delivery agen
cies and
support organizations work together to
provide a coordinated training and
employm
ent system
based
on
iden
tified
community needs
% of practitioners who report using
resources to m
ake changes to program
design and/or delivery
Practitioner/Program
Survey or needs
assessmen
t (annual/sem
i‐annual)
Resource evaluation
% of practitioners who report using
resources to m
ake changes to program
evaluation
3. Literacy service delivery agen
cies and
support organizations work together to
provide a training and employm
ent
system
that is m
ore responsive to
iden
tified
community needs
% of practitioners who report using
resources to m
ake changes to program
design and/or delivery
Practitioner/Program
Survey or needs
assessmen
t (annual/sem
i‐annual)
Resource evaluation
% of practitioners who report using
resources to m
ake changes to program
evaluation
4. Within the LBS field, skills and
knowledge of practitioners is increased
% of practitioners who report using skills
and knowledge from resource with
Practitioner/Program
Survey or needs
Building a Performance Framework for LBS Support Organizations, Phase 2: Adding Value
Chapter 4: Performance Indicators | Page 45
Service Function #4: Develop and provide accessible, q
uality resources that support LBS‐funded agencies to
deliver a quality LBS program
Key Perform
ance In
dicators & M
easures
learners
assessmen
t (annual/sem
i‐annual)
% of practitioners who report using
resources with learners
% of practitioners who report an increase
in confiden
ce when
working with adult
learners
Impact Outcomes
Perform
ance In
dicators
Measurement To
ols
1.
Support organization’s ability to help
LBS funded
delivery agen
cies achieve
expected results is increased
% of LBS agen
cies that indicate they have
increased their ability to be responsive to
the needs of adult learners
Practitioner/Program
Survey or needs
assessmen
t (annual/sem
i‐annual)
Decrease in
% of adult learners not being
served
Building a Performance Framework for LBS Support Organizations, Phase 2: Adding Value
Chapter 4: Performance Indicators | Page 46
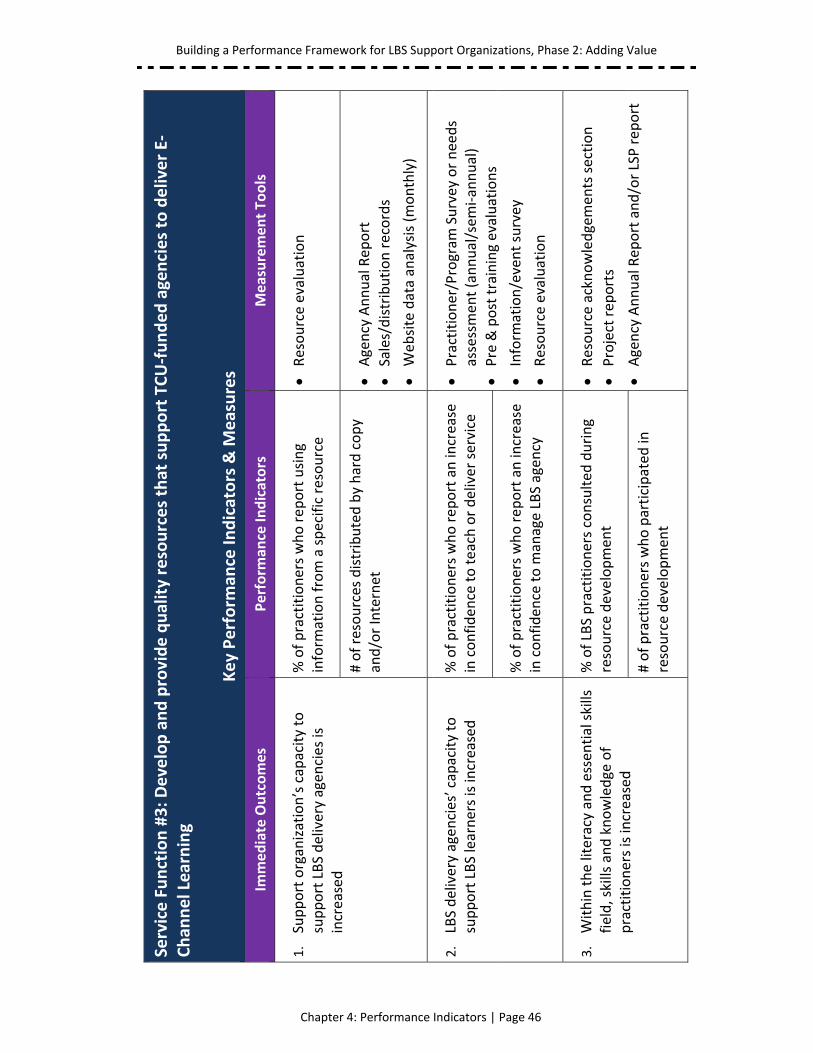
Service Function #3: Develop and provide quality resources that support TCU‐funded agencies to deliver E‐
Chan
nel Learning
Key Perform
ance In
dicators & M
easures
Immediate Outcomes
Perform
ance In
dicators
Measurement To
ols
1.
Support organization’s capacity to
support LBS delivery agen
cies is
increased
% of practitioners who report using
inform
ation from a specific resource
Resource evaluation
# of resources distributed by hard copy
and/or Internet
Agency Annual Rep
ort
Sales/distribution records
Web
site data analysis (monthly)
2.
LBS delivery agen
cies’ capacity to
support LBS learners is increased
% of practitioners who report an increase
in confiden
ce to teach or deliver service
Practitioner/Program
Survey or needs
assessmen
t (annual/sem
i‐annual)
Pre & post training evaluations
Inform
ation/event survey
Resource evaluation
% of practitioners who report an increase
in confiden
ce to m
anage LBS agen
cy
3.
Within the literacy and essen
tial skills
field, skills and knowledge of
practitioners is increased
% of LBS practitioners consulted
during
resource developmen
t
Resource acknowledgemen
ts section
Project rep
orts
Agency Annual Rep
ort and/or LSP report
# of practitioners who participated
in
resource developmen
t
Building a Performance Framework for LBS Support Organizations, Phase 2: Adding Value
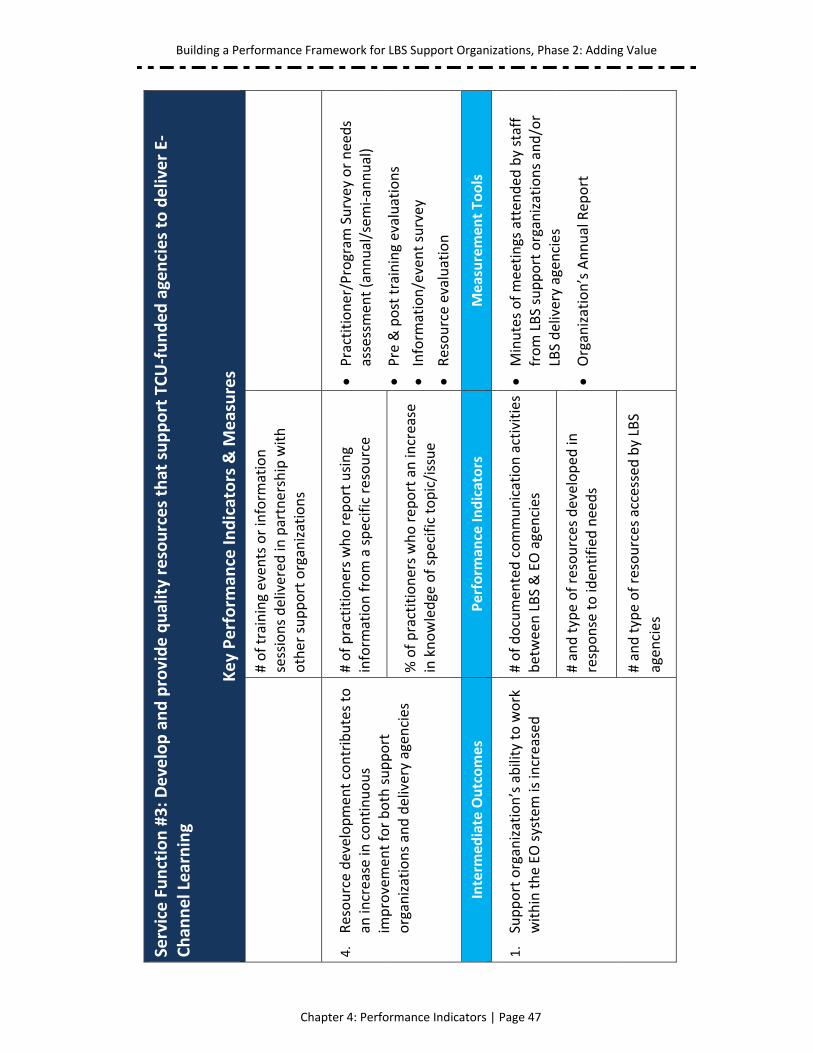
Chapter 4: Performance Indicators | Page 47
Service Function #3: Develop and provide quality resources that support TCU‐funded agencies to deliver E‐
Chan
nel Learning
Key Perform
ance In
dicators & M
easures
# of training even
ts or inform
ation
sessions delivered
in partnership with
other support organizations
4.
Resource development contributes to
an increase in continuous
improvemen
t for both support
organizations and delivery agen
cies
# of practitioners who report using
inform
ation from a specific resource
Practitioner/Program
Survey or needs
assessmen
t (annual/sem
i‐annual)
Pre & post training evaluations
Inform
ation/event survey
Resource evaluation
% of practitioners who report an increase
in knowledge of specific topic/issue
Interm
ediate Outcomes
Perform
ance In
dicators
Measurement To
ols
1.
Support organization’s ability to work
within the EO system is increased
# of documen
ted communication activities
between LBS & EO agencies
Minutes of meetings atten
ded
by staff
from LBS support organizations and/or
LBS delivery agen
cies
Organization’s Annual Rep
ort
# and type of resources developed
in
response to iden
tified
needs
# and type of resources accessed by LBS
agen
cies
Building a Performance Framework for LBS Support Organizations, Phase 2: Adding Value
Chapter 4: Performance Indicators | Page 48
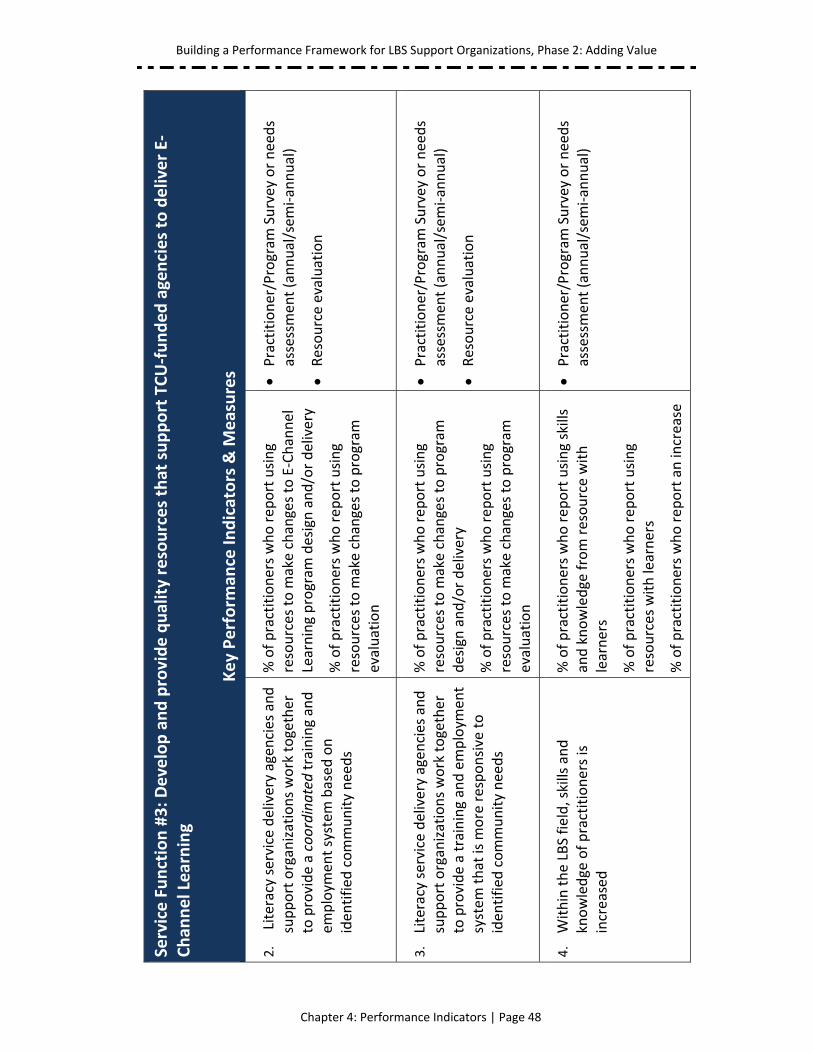
Service Function #3: Develop and provide quality resources that support TCU‐funded agencies to deliver E‐
Chan
nel Learning
Key Perform
ance In
dicators & M
easures
2.
Literacy service delivery agen
cies and
support organizations work together
to provide a coordinated training and
employm
ent system
based
on
iden
tified
community needs
% of practitioners who report using
resources to m
ake changes to E‐Channel
Learning program
design and/or delivery
% of practitioners who report using
resources to m
ake changes to program
evaluation
Practitioner/Program
Survey or needs
assessmen
t (annual/sem
i‐annual)
Resource evaluation
3.
Literacy service delivery agen
cies and
support organizations work together
to provide a training and employm
ent
system
that is m
ore responsive to
iden
tified
community needs
% of practitioners who report using
resources to m
ake changes to program
design and/or delivery
% of practitioners who report using
resources to m
ake changes to program
evaluation
Practitioner/Program
Survey or needs
assessmen
t (annual/sem
i‐annual)
Resource evaluation
4.
Within the LBS field, skills and
knowledge of practitioners is
increased
% of practitioners who report using skills
and knowledge from resource with
learners
% of practitioners who report using
resources with learners
% of practitioners who report an increase
Practitioner/Program
Survey or needs
assessmen
t (annual/sem
i‐annual)
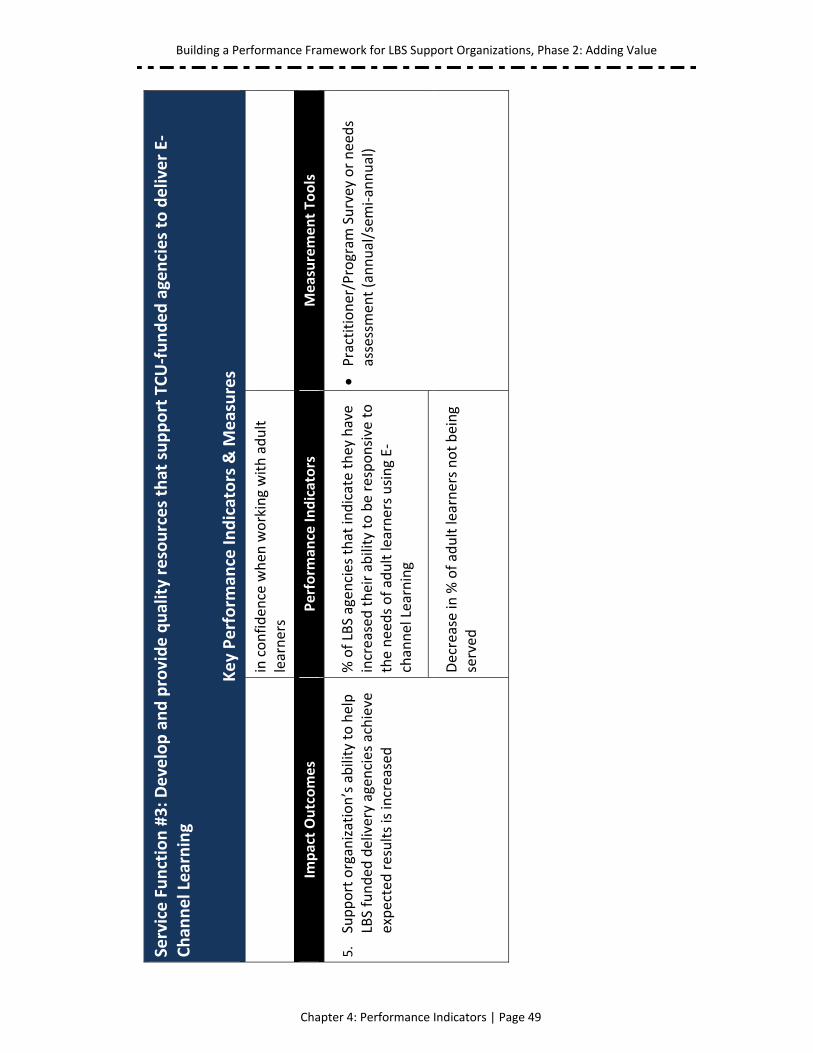
Building a Performance Framework for LBS Support Organizations, Phase 2: Adding Value
Chapter 4: Performance Indicators | Page 49
Service Function #3: Develop and provide quality resources that support TCU‐funded agencies to deliver E‐
Chan
nel Learning
Key Perform
ance In
dicators & M
easures
in confiden
ce when
working with adult
learners
Impact Outcomes
Perform
ance In
dicators
Measurement To
ols
5.
Support organization’s ability to help
LBS funded
delivery agen
cies achieve
expected results is increased
% of LBS agen
cies that indicate they have
increased their ability to be responsive to
the needs of adult learners using E‐
channel Learning
Practitioner/Program
Survey or needs
assessmen
t (annual/sem
i‐annual)
Decrease in
% of adult learners not being
served

Building a Performance Framework for LBS Support Organizations, Phase 2: Adding Value
Chapter 4: Performance Indicators | Page 50
Building a Performance Framework for LBS Support Organizations, Phase 2: Adding Value
Chapter 5: Performance Measurement Tools | Page 51
Performance Measurement Tools
“Done well, performance measurement helps programs tell their stories and can also help drive program improvement.”
~ What Gets Measured, Gets Done In this section you’ll find examples of most of the performance measurement tools mentioned in this document. Many of these tools were created using tools already being used by support organizations in Ontario. Some of the tools mentioned can be found in the Phase 1 report.
Building a Performance Framework for LBS Support Organizations, Phase 2: Adding Value
Chapter 5: Performance Measurement Tools | Page 52
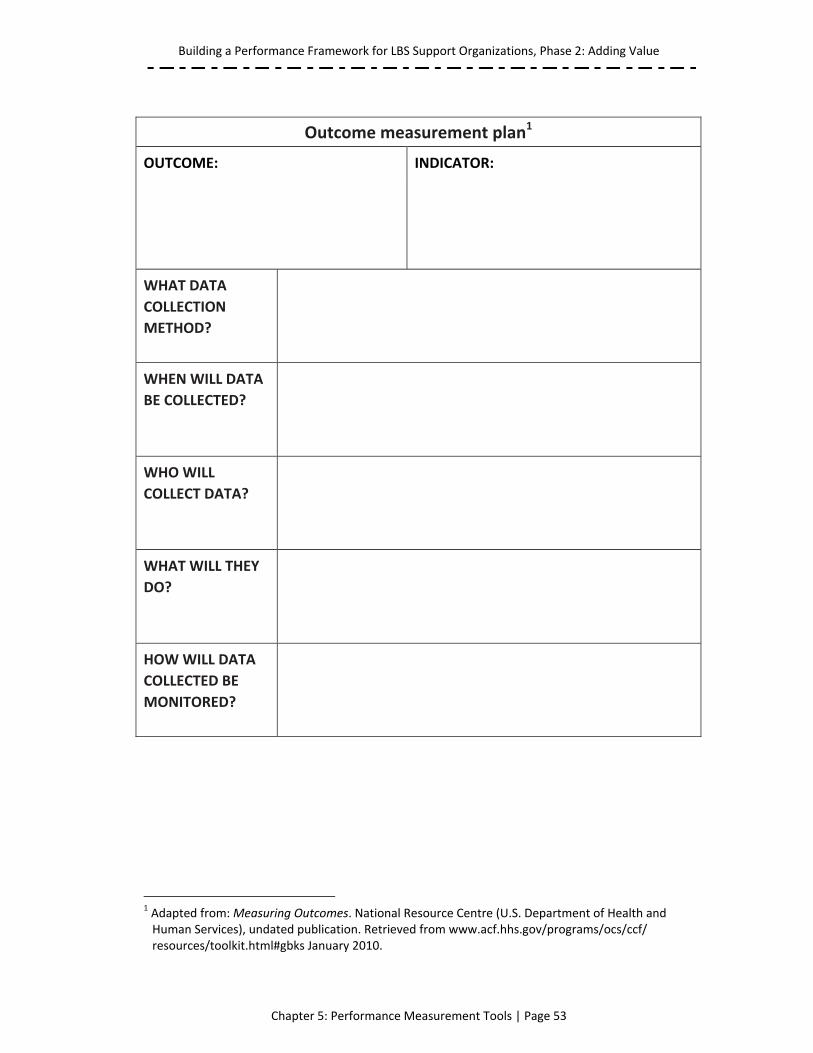
Building a Performance Framework for LBS Support Organizations, Phase 2: Adding Value
Chapter 5: Performance Measurement Tools | Page 53
Outcome measurement plan1
OUTCOME: INDICATOR:
WHAT DATA
COLLECTION
METHOD?
WHEN WILL DATA
BE COLLECTED?
WHO WILL
COLLECT DATA?
WHAT WILL THEY
DO?
HOW WILL DATA
COLLECTED BE
MONITORED?
1 Adapted from: Measuring Outcomes. National Resource Centre (U.S. Department of Health and Human Services), undated publication. Retrieved from www.acf.hhs.gov/programs/ocs/ccf/ resources/toolkit.html#gbks January 2010.
Building a Performance Framework for LBS Support Organizations, Phase 2: Adding Value
Chapter 5: Performance Measurement Tools | Page 54
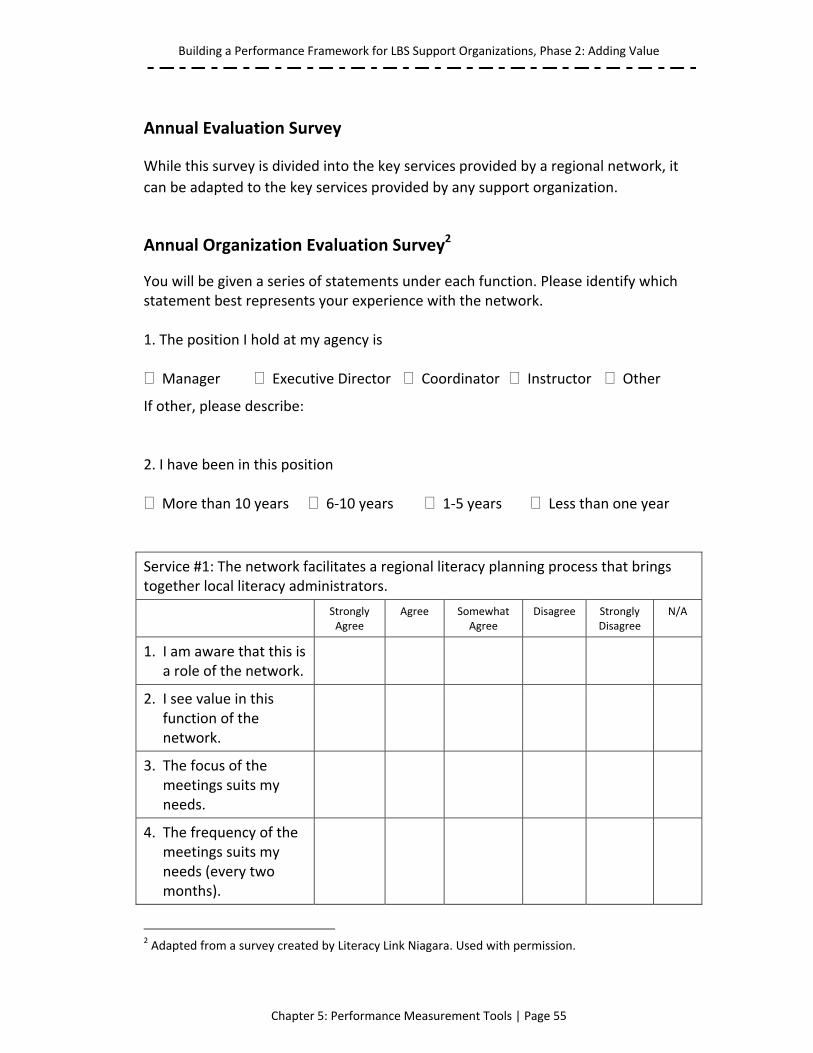
Building a Performance Framework for LBS Support Organizations, Phase 2: Adding Value
Chapter 5: Performance Measurement Tools | Page 55
Annual Evaluation Survey
While this survey is divided into the key services provided by a regional network, it
can be adapted to the key services provided by any support organization.
Annual Organization Evaluation Survey2
You will be given a series of statements under each function. Please identify which statement best represents your experience with the network. 1. The position I hold at my agency is Manager Executive Director Coordinator Instructor Other
If other, please describe: 2. I have been in this position More than 10 years 6‐10 years 1‐5 years Less than one year
Service #1: The network facilitates a regional literacy planning process that brings together local literacy administrators.
Strongly Agree
Agree Somewhat Agree
Disagree Strongly Disagree
N/A
1. I am aware that this is a role of the network.
2. I see value in this function of the network.
3. The focus of the meetings suits my needs.
4. The frequency of the meetings suits my needs (every two months).
2 Adapted from a survey created by Literacy Link Niagara. Used with permission.
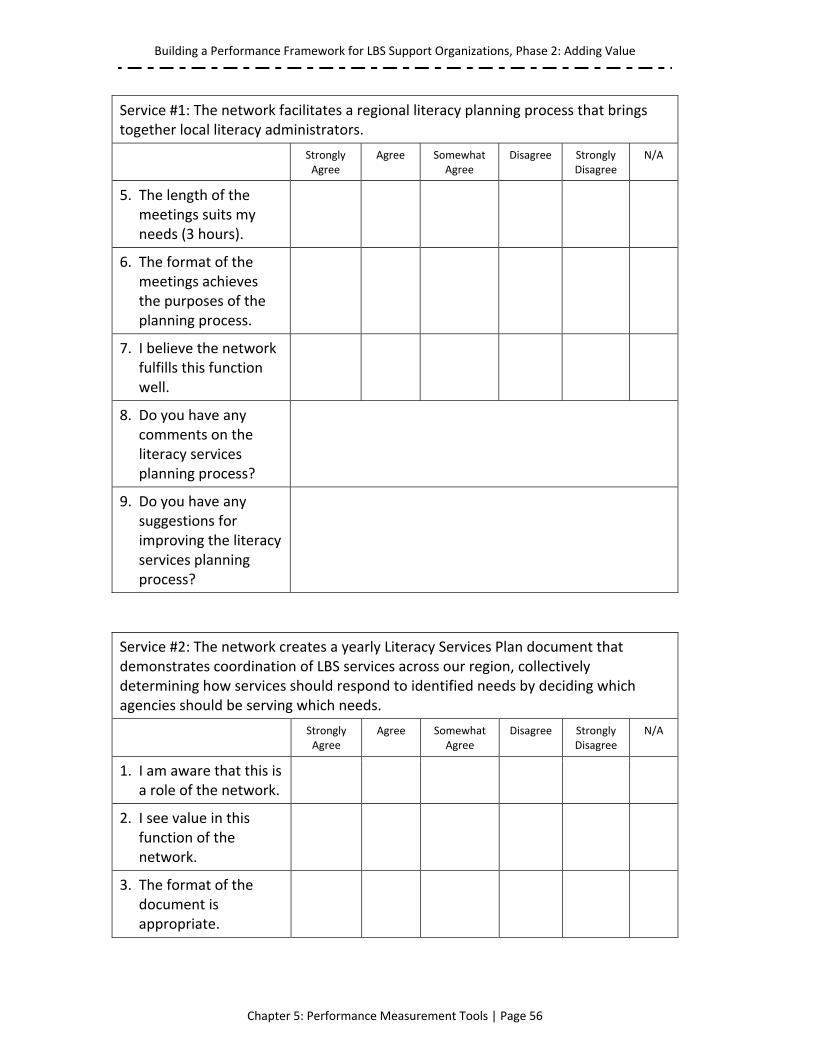
Building a Performance Framework for LBS Support Organizations, Phase 2: Adding Value
Chapter 5: Performance Measurement Tools | Page 56
Service #1: The network facilitates a regional literacy planning process that brings together local literacy administrators.
Strongly Agree
Agree Somewhat Agree
Disagree Strongly Disagree
N/A
5. The length of the meetings suits my needs (3 hours).
6. The format of the meetings achieves the purposes of the planning process.
7. I believe the network fulfills this function well.
8. Do you have any comments on the literacy services planning process?
9. Do you have any suggestions for improving the literacy services planning process?
Service #2: The network creates a yearly Literacy Services Plan document that demonstrates coordination of LBS services across our region, collectively determining how services should respond to identified needs by deciding which agencies should be serving which needs.
Strongly Agree
Agree Somewhat Agree
Disagree Strongly Disagree
N/A
1. I am aware that this is a role of the network.
2. I see value in this function of the network.
3. The format of the document is appropriate.
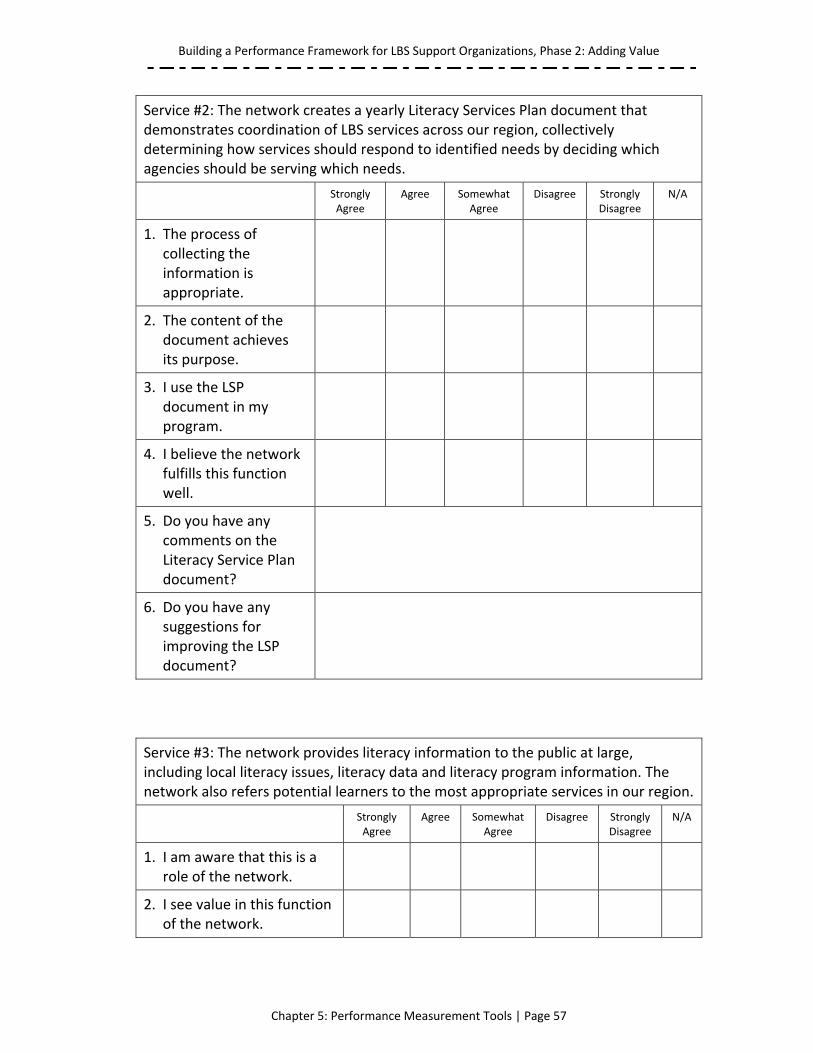
Building a Performance Framework for LBS Support Organizations, Phase 2: Adding Value
Chapter 5: Performance Measurement Tools | Page 57
Service #2: The network creates a yearly Literacy Services Plan document that demonstrates coordination of LBS services across our region, collectively determining how services should respond to identified needs by deciding which agencies should be serving which needs.
Strongly Agree
Agree Somewhat Agree
Disagree Strongly Disagree
N/A
1. The process of collecting the information is appropriate.
2. The content of the document achieves its purpose.
3. I use the LSP document in my program.
4. I believe the network fulfills this function well.
5. Do you have any comments on the Literacy Service Plan document?
6. Do you have any suggestions for improving the LSP document?
Service #3: The network provides literacy information to the public at large, including local literacy issues, literacy data and literacy program information. The network also refers potential learners to the most appropriate services in our region.
Strongly Agree
Agree Somewhat Agree
Disagree Strongly Disagree
N/A
1. I am aware that this is a role of the network.
2. I see value in this function of the network.
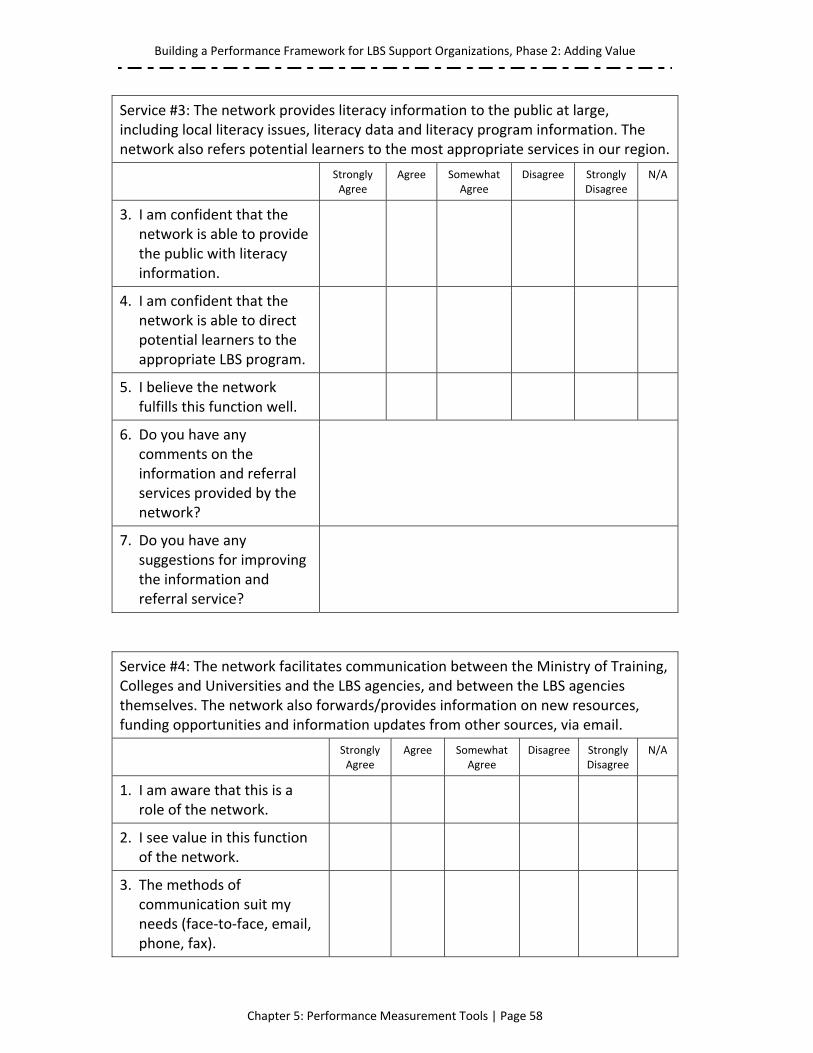
Building a Performance Framework for LBS Support Organizations, Phase 2: Adding Value
Chapter 5: Performance Measurement Tools | Page 58
Service #3: The network provides literacy information to the public at large, including local literacy issues, literacy data and literacy program information. The network also refers potential learners to the most appropriate services in our region.
Strongly Agree
Agree Somewhat Agree
Disagree Strongly Disagree
N/A
3. I am confident that the network is able to provide the public with literacy information.
4. I am confident that the network is able to direct potential learners to the appropriate LBS program.
5. I believe the network fulfills this function well.
6. Do you have any comments on the information and referral services provided by the network?
7. Do you have any suggestions for improving the information and referral service?
Service #4: The network facilitates communication between the Ministry of Training, Colleges and Universities and the LBS agencies, and between the LBS agencies themselves. The network also forwards/provides information on new resources, funding opportunities and information updates from other sources, via email.
Strongly Agree
Agree Somewhat Agree
Disagree Strongly Disagree
N/A
1. I am aware that this is a role of the network.
2. I see value in this function of the network.
3. The methods of communication suit my needs (face‐to‐face, email, phone, fax).
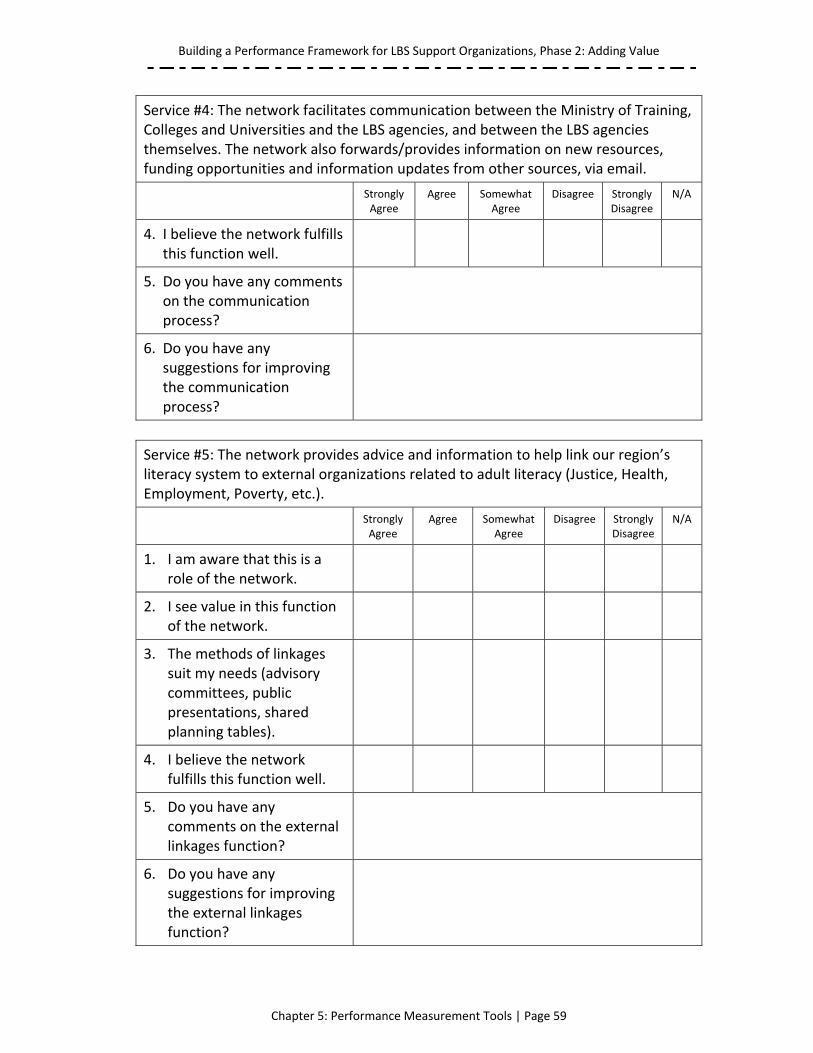
Building a Performance Framework for LBS Support Organizations, Phase 2: Adding Value
Chapter 5: Performance Measurement Tools | Page 59
Service #4: The network facilitates communication between the Ministry of Training, Colleges and Universities and the LBS agencies, and between the LBS agencies themselves. The network also forwards/provides information on new resources, funding opportunities and information updates from other sources, via email.
Strongly Agree
Agree Somewhat Agree
Disagree Strongly Disagree
N/A
4. I believe the network fulfills this function well.
5. Do you have any comments on the communication process?
6. Do you have any suggestions for improving the communication process?
Service #5: The network provides advice and information to help link our region’s literacy system to external organizations related to adult literacy (Justice, Health, Employment, Poverty, etc.).
Strongly Agree
Agree Somewhat Agree
Disagree Strongly Disagree
N/A
1. I am aware that this is a role of the network.
2. I see value in this function of the network.
3. The methods of linkages suit my needs (advisory committees, public presentations, shared planning tables).
4. I believe the network fulfills this function well.
5. Do you have any comments on the external linkages function?
6. Do you have any suggestions for improving the external linkages function?
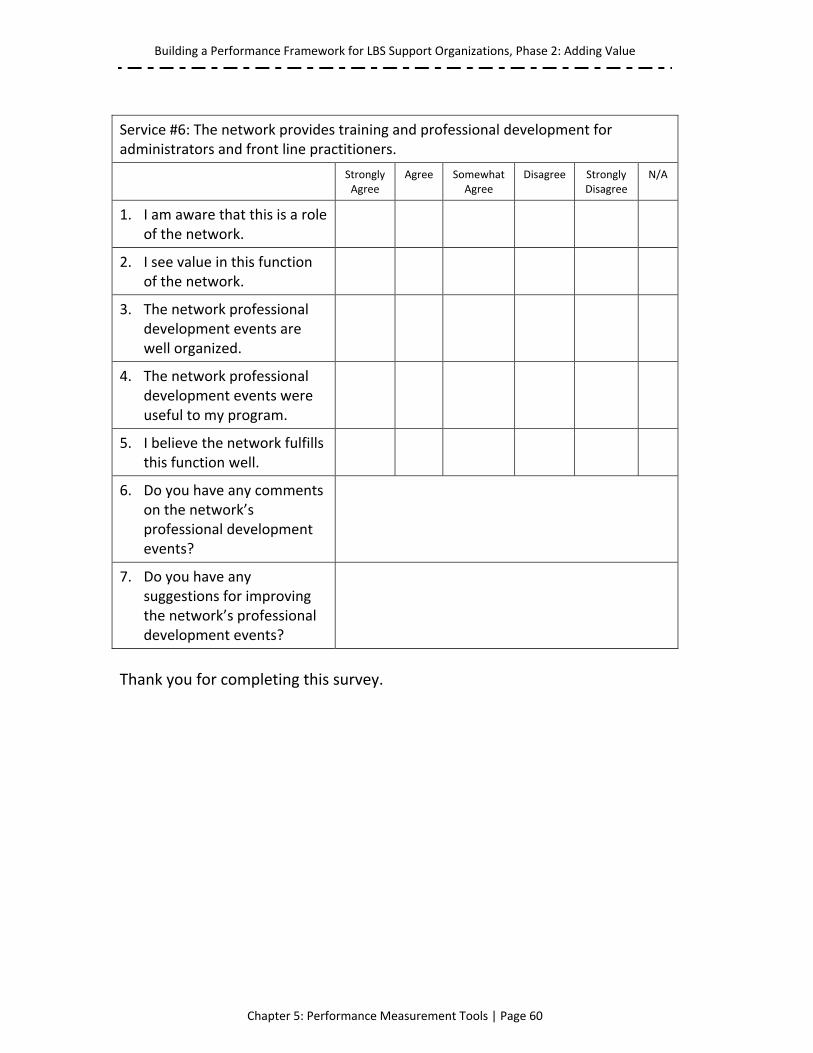
Building a Performance Framework for LBS Support Organizations, Phase 2: Adding Value
Chapter 5: Performance Measurement Tools | Page 60
Service #6: The network provides training and professional development for administrators and front line practitioners.
Strongly Agree
Agree Somewhat Agree
Disagree Strongly Disagree
N/A
1. I am aware that this is a role of the network.
2. I see value in this function of the network.
3. The network professional development events are well organized.
4. The network professional development events were useful to my program.
5. I believe the network fulfills this function well.
6. Do you have any comments on the network’s professional development events?
7. Do you have any suggestions for improving the network’s professional development events?
Thank you for completing this survey.
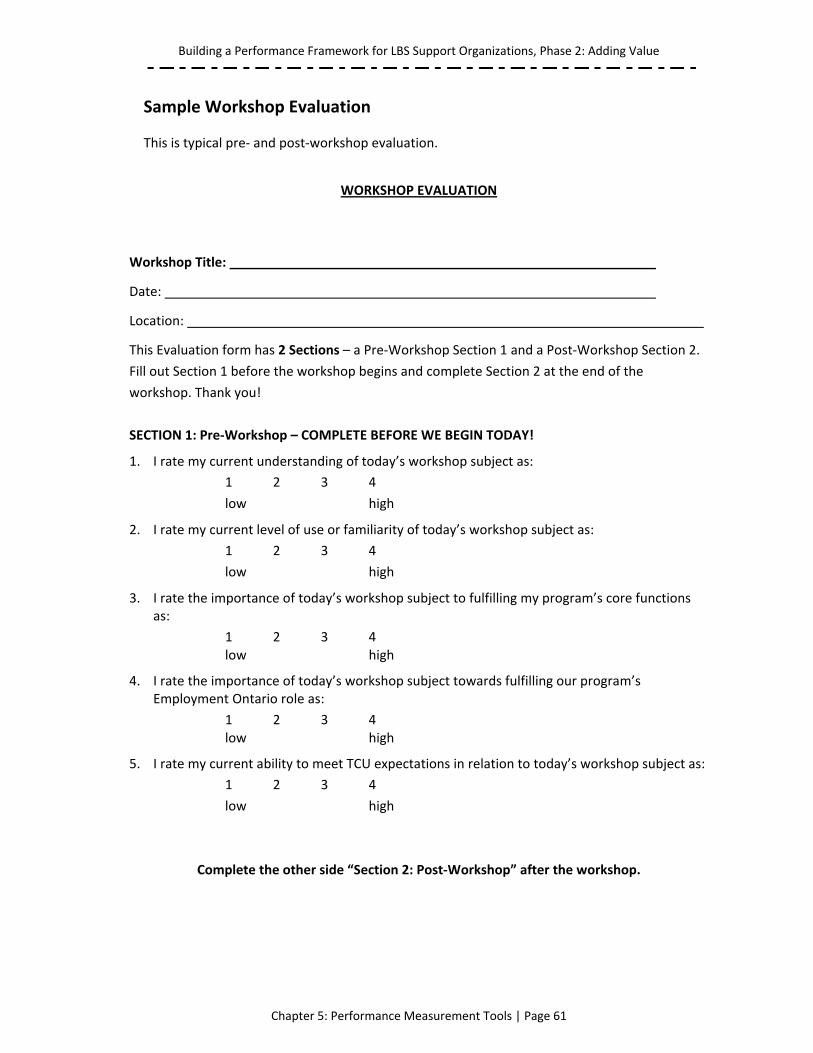
Building a Performance Framework for LBS Support Organizations, Phase 2: Adding Value
Chapter 5: Performance Measurement Tools | Page 61
Sample Workshop Evaluation
This is typical pre‐ and post‐workshop evaluation.
WORKSHOP EVALUATION
Workshop Title:
Date:
Location:
This Evaluation form has 2 Sections – a Pre‐Workshop Section 1 and a Post‐Workshop Section 2.
Fill out Section 1 before the workshop begins and complete Section 2 at the end of the
workshop. Thank you!
SECTION 1: Pre‐Workshop – COMPLETE BEFORE WE BEGIN TODAY!
1. I rate my current understanding of today’s workshop subject as:
1 2 3 4
low high
2. I rate my current level of use or familiarity of today’s workshop subject as:
1 2 3 4
low high
3. I rate the importance of today’s workshop subject to fulfilling my program’s core functions as:
1 2 3 4 low high
4. I rate the importance of today’s workshop subject towards fulfilling our program’s Employment Ontario role as:
1 2 3 4 low high
5. I rate my current ability to meet TCU expectations in relation to today’s workshop subject as:
1 2 3 4
low high
Complete the other side “Section 2: Post‐Workshop” after the workshop.
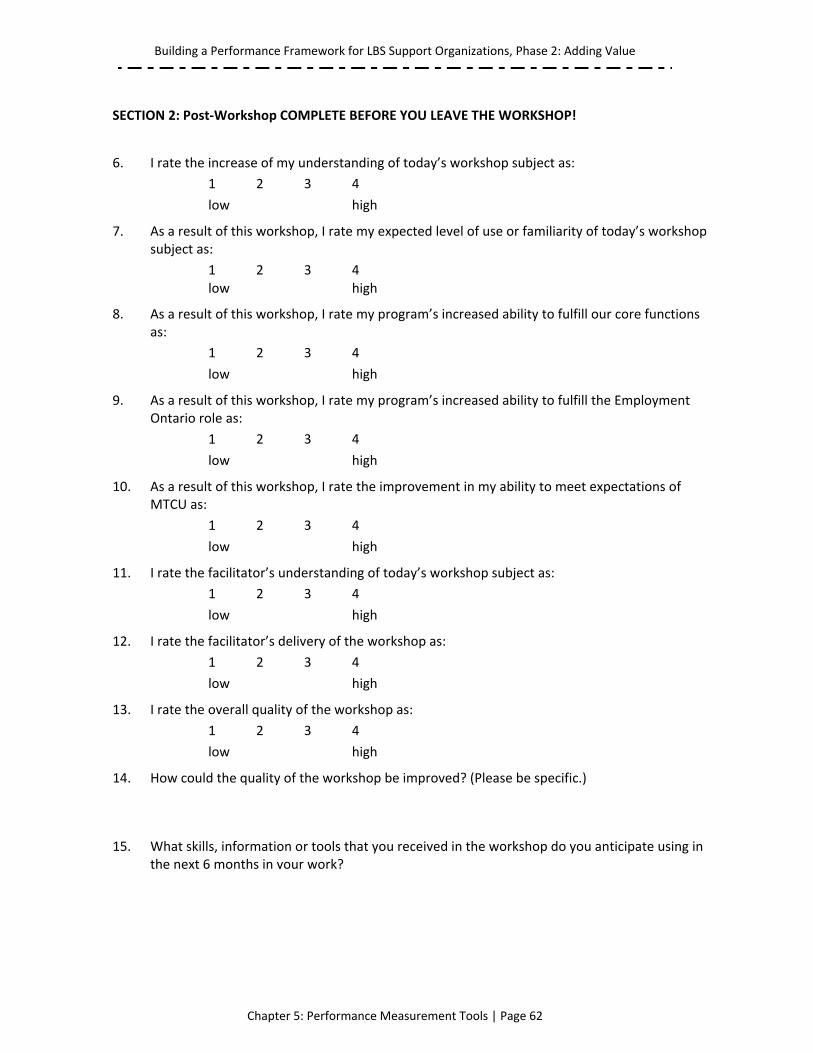
Building a Performance Framework for LBS Support Organizations, Phase 2: Adding Value
Chapter 5: Performance Measurement Tools | Page 62
SECTION 2: Post‐Workshop COMPLETE BEFORE YOU LEAVE THE WORKSHOP!
6. I rate the increase of my understanding of today’s workshop subject as:
1 2 3 4
low high
7. As a result of this workshop, I rate my expected level of use or familiarity of today’s workshop subject as:
1 2 3 4 low high
8. As a result of this workshop, I rate my program’s increased ability to fulfill our core functions as:
1 2 3 4
low high
9. As a result of this workshop, I rate my program’s increased ability to fulfill the Employment Ontario role as:
1 2 3 4
low high
10. As a result of this workshop, I rate the improvement in my ability to meet expectations of MTCU as:
1 2 3 4
low high
11. I rate the facilitator’s understanding of today’s workshop subject as:
1 2 3 4
low high
12. I rate the facilitator’s delivery of the workshop as:
1 2 3 4
low high
13. I rate the overall quality of the workshop as:
1 2 3 4
low high
14. How could the quality of the workshop be improved? (Please be specific.)
15. What skills, information or tools that you received in the workshop do you anticipate using in the next 6 months in your work?
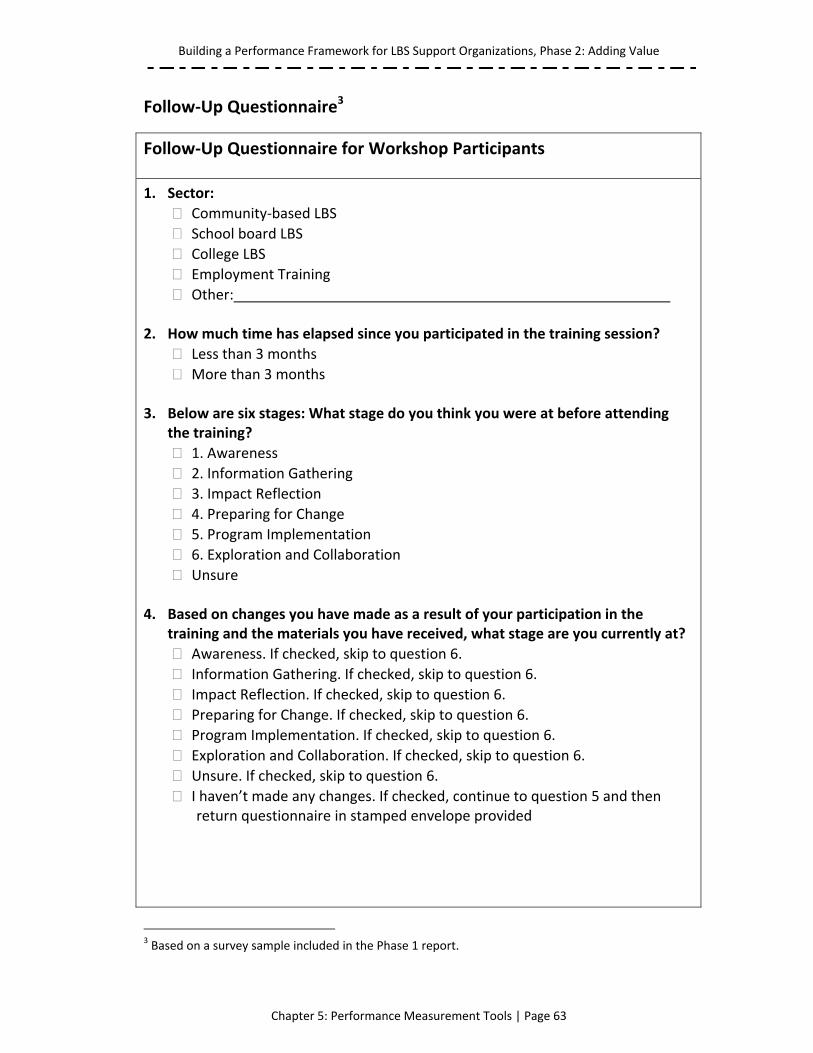
Building a Performance Framework for LBS Support Organizations, Phase 2: Adding Value
Chapter 5: Performance Measurement Tools | Page 63
Follow‐Up Questionnaire3
Follow‐Up Questionnaire for Workshop Participants
1. Sector:
Community‐based LBS
School board LBS College LBS Employment Training
Other: 2. How much time has elapsed since you participated in the training session?
Less than 3 months
More than 3 months 3. Below are six stages: What stage do you think you were at before attending
the training?
1. Awareness 2. Information Gathering
3. Impact Reflection
4. Preparing for Change 5. Program Implementation
6. Exploration and Collaboration Unsure
4. Based on changes you have made as a result of your participation in the
training and the materials you have received, what stage are you currently at?
Awareness. If checked, skip to question 6. Information Gathering. If checked, skip to question 6.
Impact Reflection. If checked, skip to question 6.
Preparing for Change. If checked, skip to question 6. Program Implementation. If checked, skip to question 6.
Exploration and Collaboration. If checked, skip to question 6. Unsure. If checked, skip to question 6. I haven’t made any changes. If checked, continue to question 5 and then return questionnaire in stamped envelope provided
3 Based on a survey sample included in the Phase 1 report.
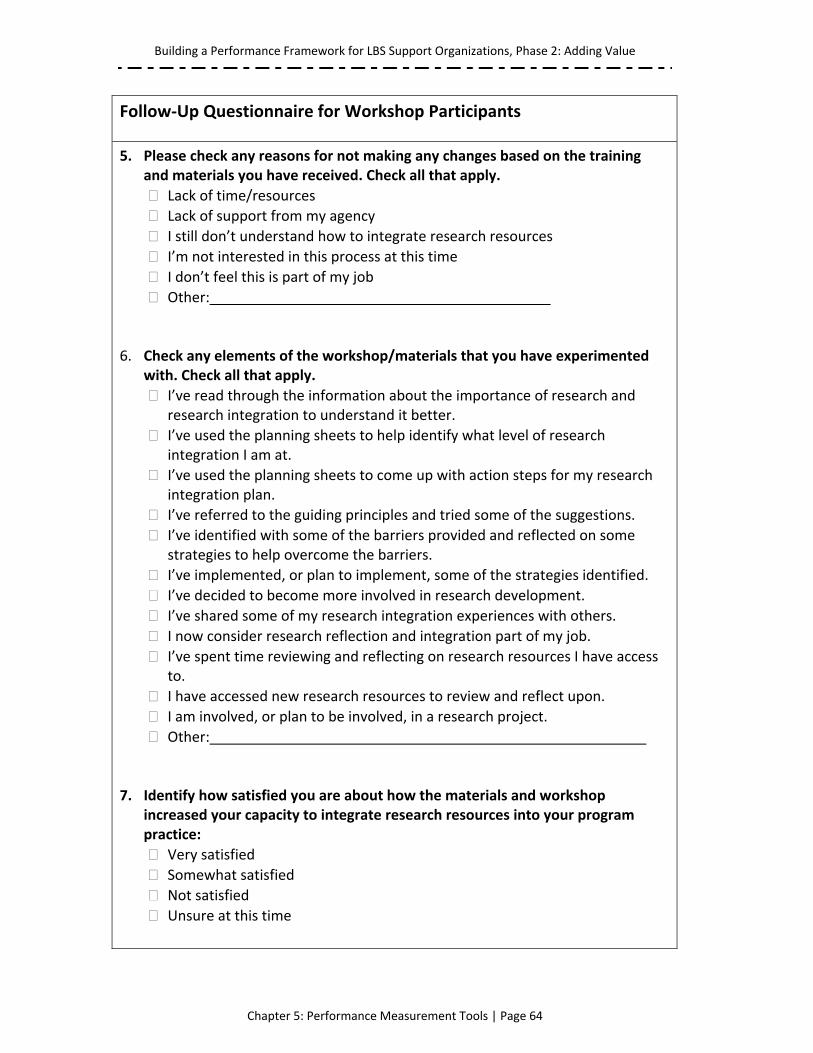
Building a Performance Framework for LBS Support Organizations, Phase 2: Adding Value
Chapter 5: Performance Measurement Tools | Page 64
Follow‐Up Questionnaire for Workshop Participants
5. Please check any reasons for not making any changes based on the training and materials you have received. Check all that apply.
Lack of time/resources
Lack of support from my agency
I still don’t understand how to integrate research resources I’m not interested in this process at this time
I don’t feel this is part of my job
Other: 6. Check any elements of the workshop/materials that you have experimented
with. Check all that apply.
I’ve read through the information about the importance of research and research integration to understand it better.
I’ve used the planning sheets to help identify what level of research integration I am at.
I’ve used the planning sheets to come up with action steps for my research integration plan.
I’ve referred to the guiding principles and tried some of the suggestions.
I’ve identified with some of the barriers provided and reflected on some strategies to help overcome the barriers.
I’ve implemented, or plan to implement, some of the strategies identified.
I’ve decided to become more involved in research development.
I’ve shared some of my research integration experiences with others.
I now consider research reflection and integration part of my job.
I’ve spent time reviewing and reflecting on research resources I have access to.
I have accessed new research resources to review and reflect upon. I am involved, or plan to be involved, in a research project.
Other: 7. Identify how satisfied you are about how the materials and workshop
increased your capacity to integrate research resources into your program practice:
Very satisfied Somewhat satisfied
Not satisfied Unsure at this time
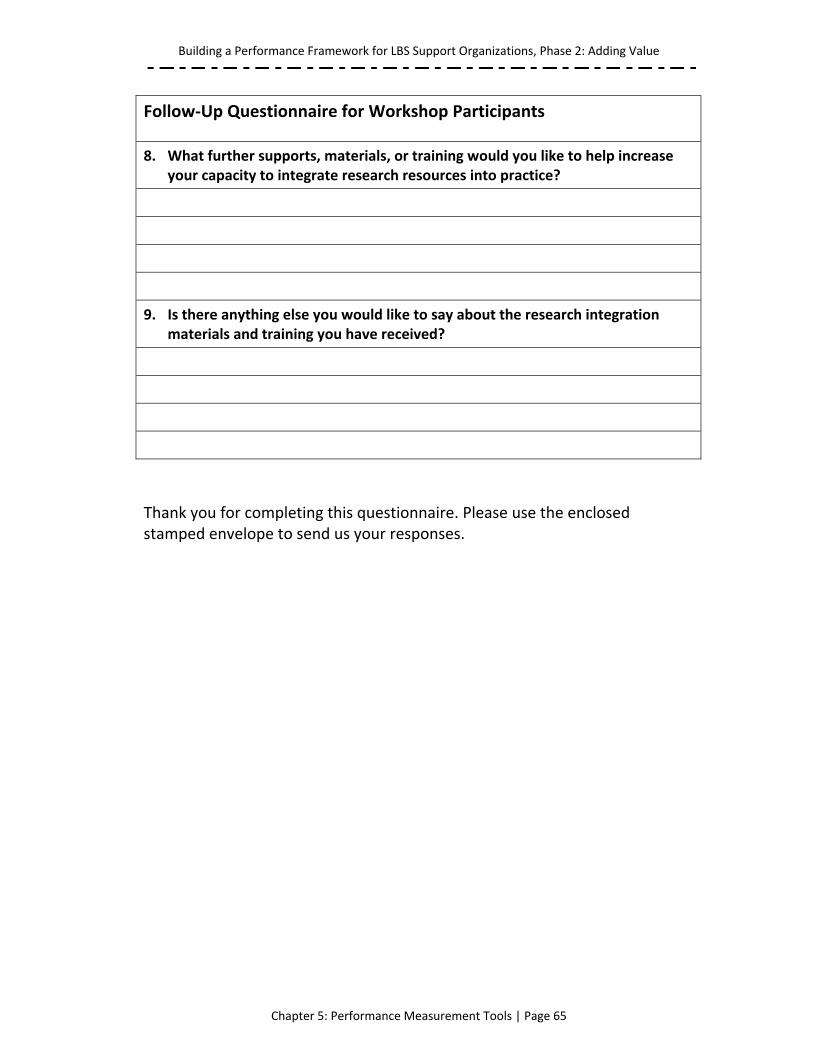
Building a Performance Framework for LBS Support Organizations, Phase 2: Adding Value
Chapter 5: Performance Measurement Tools | Page 65
Follow‐Up Questionnaire for Workshop Participants
8. What further supports, materials, or training would you like to help increase your capacity to integrate research resources into practice?
9. Is there anything else you would like to say about the research integration materials and training you have received?
Thank you for completing this questionnaire. Please use the enclosed stamped envelope to send us your responses.
Building a Performance Framework for LBS Support Organizations, Phase 2: Adding Value
Chapter 5: Performance Measurement Tools | Page 66
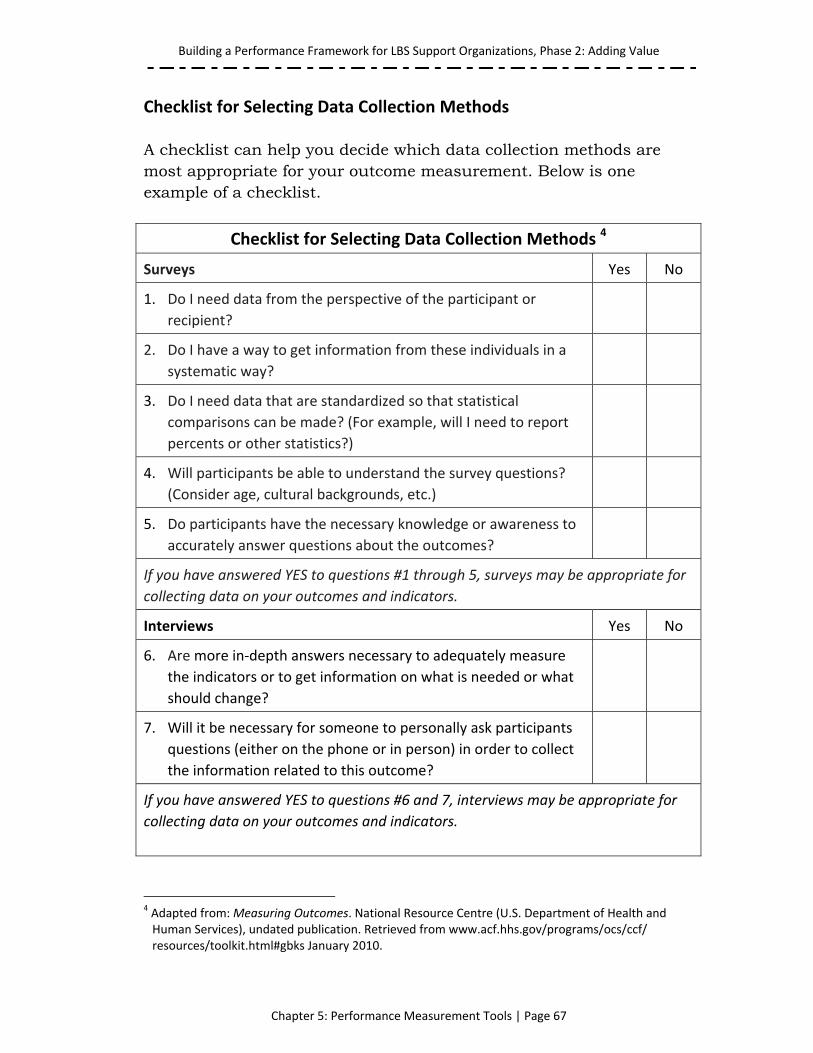
Building a Performance Framework for LBS Support Organizations, Phase 2: Adding Value
Chapter 5: Performance Measurement Tools | Page 67
Checklist for Selecting Data Collection Methods A checklist can help you decide which data collection methods are most appropriate for your outcome measurement. Below is one example of a checklist.
Checklist for Selecting Data Collection Methods 4
Surveys Yes No
1. Do I need data from the perspective of the participant or
recipient?
2. Do I have a way to get information from these individuals in a
systematic way?
3. Do I need data that are standardized so that statistical
comparisons can be made? (For example, will I need to report
percents or other statistics?)
4. Will participants be able to understand the survey questions?
(Consider age, cultural backgrounds, etc.)
5. Do participants have the necessary knowledge or awareness to
accurately answer questions about the outcomes?
If you have answered YES to questions #1 through 5, surveys may be appropriate for
collecting data on your outcomes and indicators.
Interviews Yes No
6. Are more in‐depth answers necessary to adequately measure
the indicators or to get information on what is needed or what
should change?
7. Will it be necessary for someone to personally ask participants
questions (either on the phone or in person) in order to collect
the information related to this outcome?
If you have answered YES to questions #6 and 7, interviews may be appropriate for
collecting data on your outcomes and indicators.
4 Adapted from: Measuring Outcomes. National Resource Centre (U.S. Department of Health and Human Services), undated publication. Retrieved from www.acf.hhs.gov/programs/ocs/ccf/ resources/toolkit.html#gbks January 2010.
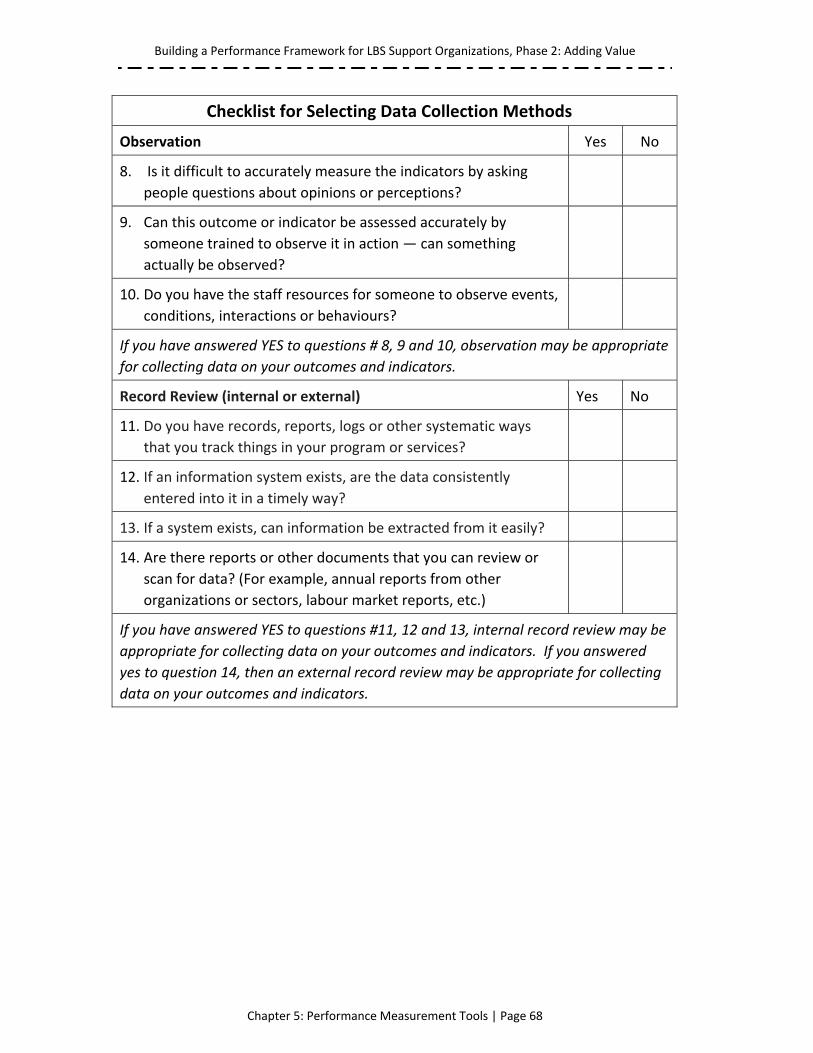
Building a Performance Framework for LBS Support Organizations, Phase 2: Adding Value
Chapter 5: Performance Measurement Tools | Page 68
Checklist for Selecting Data Collection Methods 4
Observation Yes No
8. Is it difficult to accurately measure the indicators by asking
people questions about opinions or perceptions?
9. Can this outcome or indicator be assessed accurately by
someone trained to observe it in action — can something
actually be observed?
10. Do you have the staff resources for someone to observe events,
conditions, interactions or behaviours?
If you have answered YES to questions # 8, 9 and 10, observation may be appropriate
for collecting data on your outcomes and indicators.
Record Review (internal or external) Yes No
11. Do you have records, reports, logs or other systematic ways
that you track things in your program or services?
12. If an information system exists, are the data consistently
entered into it in a timely way?
13. If a system exists, can information be extracted from it easily?
14. Are there reports or other documents that you can review or
scan for data? (For example, annual reports from other
organizations or sectors, labour market reports, etc.)
If you have answered YES to questions #11, 12 and 13, internal record review may be
appropriate for collecting data on your outcomes and indicators. If you answered
yes to question 14, then an external record review may be appropriate for collecting
data on your outcomes and indicators.
Building a Performance Framework for LBS Support Organizations, Phase 2: Adding Value
Appendix 1 | Page 69
Appendix 1: Modified Logic Models
“A performance framework can help you be clear about the benefits of the work that you are doing — and that can translate into giving a clear picture of your achievements—internally and externally. If you can demonstrate your value to the overall “system”, then you should be in a better position to “make your case” when limited resources are being re-allocated.”
~ Building a Performance Framework for LBS support Organizations, Phase 1
Are logic models and performance indicators magic bullets? Absolutely not. Are the logic models and sample indicators in this document perfect? Absolutely not. What you should see them as is templates—a resource from which you can start or continue your performance management journey. In Phase 1, the logic models were developed as a way to look at the work that support organizations do for the funding they receive from the Ministry of Training, Colleges and Universities (TCU). The framework should be seen as an opportunity to describe to MTCU what it is you do, given a certain set of circumstances (the service functions) and based on a set of assumptions about the way things unfold in the literacy field in Ontario at this point in time. If you work with the framework, then you should be able to make the case for what you do. Without a doubt organizational life is never as clear cut as an “if-then” statement or relationship suggests. There are many interconnected and overlapping correlations between what you do and what happens as a result. Powell-Taylor and others have noted that one of the limitations of logic models is the “necessity of communicating on paper in a two-dimensional space” what can be multidimensional issues or problems. The logic models and performance indicators have been created as living drafts. Together they create a framework, but one that isn’t rigid. In Phase 2, two of the logic models created in Phase 1 were revised and a new logic model for a new service function was created.
Building a Performance Framework for LBS Support Organizations, Phase 2: Adding Value
Appendix 1 | Page 70
Each of the revised logic models was reviewed by the Phase 2 advisory team and each one was determined to be a reasonable “picture” of the service function. The third logic model was worked on during a two-day workshop held in June 2010. These three logic models and their performance indicators are provided in this appendix. In Appendix 2 you’ll find the logic model and indicators for part of the service function (#1) that was not revised during Phase 2. With it are question and reflection sheets that you can use to make the logic model become a better fit with the work that your organization does in Ontario. You can access the complete logic model for this service function by going to www.projectread.ca/publications and scrolling down to the link to Building a Performance Framework for LBS Support Organizations in Ontario.
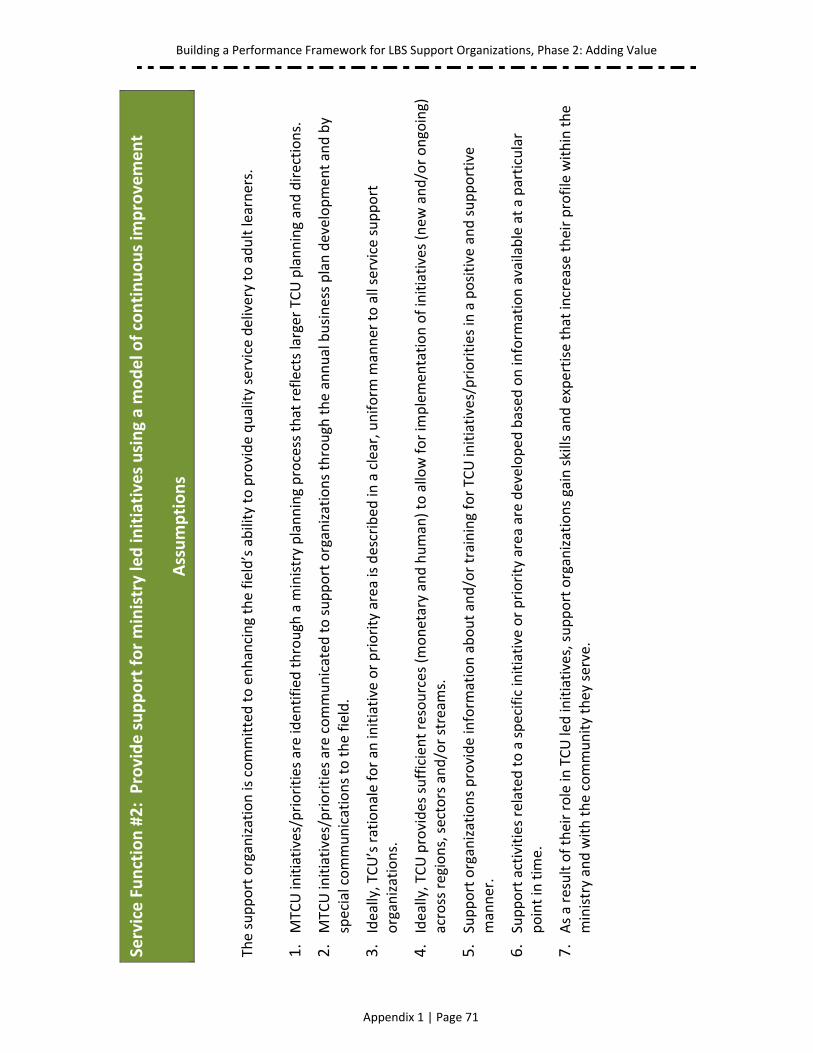
Building a Performance Framework for LBS Support Organizations, Phase 2: Adding Value
Appendix 1 | Page 71
Service Function #2: Provide support for ministry led initiatives using a model of continuous im
provement
Assumptions
The support organization is committed to enhancing the field’s ability to provide quality service delivery to adult learners.
1. MTC
U initiatives/priorities are iden
tified
through
a m
inistry planning process that reflects larger TCU planning and directions.
2. MTC
U initiatives/priorities are communicated
to support organizations through
the annual business plan developmen
t and by
special communications to the field.
3. Ideally, TCU’s rationale for an
initiative or priority area is described
in a clear, uniform
manner to all service support
organizations.
4. Ideally, TCU provides sufficient resources (m
onetary and human) to allow for im
plemen
tation of initiatives (new
and/or ongoing)
across regions, sectors and/or stream
s.
5. Support organizations provide inform
ation about and/or training for TC
U initiatives/priorities in
a positive and supportive
manner.
6. Support activities related to a specific initiative or priority area are developed
based
on inform
ation available at a particular
point in tim
e.
7. As a result of their role in TCU led initiatives, support organizations gain skills and expertise that increase their profile within the
ministry and with the community they serve.
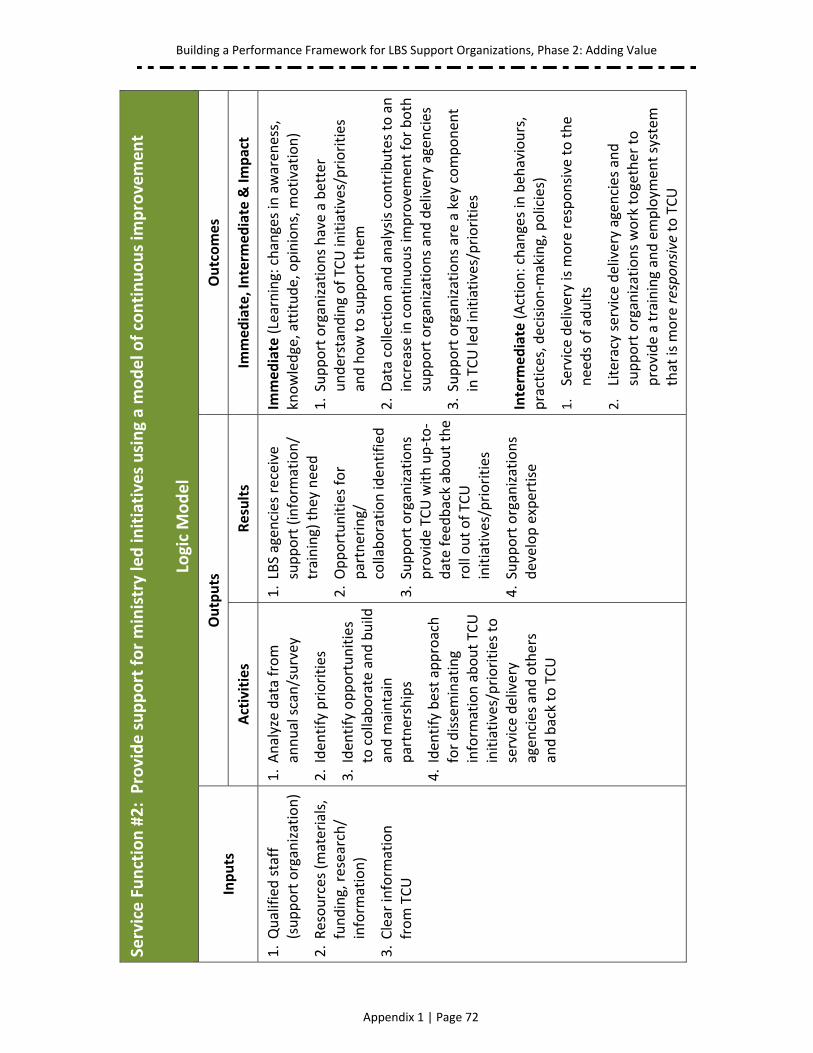
Building a Performance Framework for LBS Support Organizations, Phase 2: Adding Value
Appendix 1 | Page 72
Service Function #2: Provide support for ministry led initiatives using a model of continuous im
provement
Logic Model
Inputs
Outputs
Outcomes
Activities
Results
Immediate, Interm
ediate & Im
pact
1. Qualified staff
(support organization)
2. Resources (materials,
funding, research/
inform
ation)
3. Clear inform
ation
from TCU
1. Analyze data from
annual scan/survey
2. Iden
tify priorities
3. Iden
tify opportunities
to collaborate and build
and m
aintain
partnerships
4. Iden
tify best approach
for disseminating
inform
ation about TC
U
initiatives/priorities to
service delivery
agen
cies and others
and back to TCU
1. LBS agen
cies receive
support (inform
ation/
training) they need
2. Opportunities for
partnering/
collaboration iden
tified
3. Support organizations
provide TCU with up‐to‐
date feedback about the
roll out of TC
U
initiatives/priorities
4. Support organizations
develop expertise
Immediate (Learning: changes in awaren
ess,
knowledge, attitude, opinions, m
otivation)
1. Support organizations have a better
understanding of TC
U initiatives/priorities
and how to support them
2. Data collection and analysis contributes to an
increase in
continuous im
provemen
t for both
support organizations and delivery agen
cies
3. Support organizations are a key componen
t in TCU led initiatives/priorities
Interm
ediate (Action: changes in beh
aviours,
practices, decision‐m
aking, policies)
1.
Service delivery is m
ore responsive to the
needs of adults
2.
Literacy service delivery agen
cies and
support organizations work together to
provide a training and employm
ent system
that is m
ore responsive to TCU
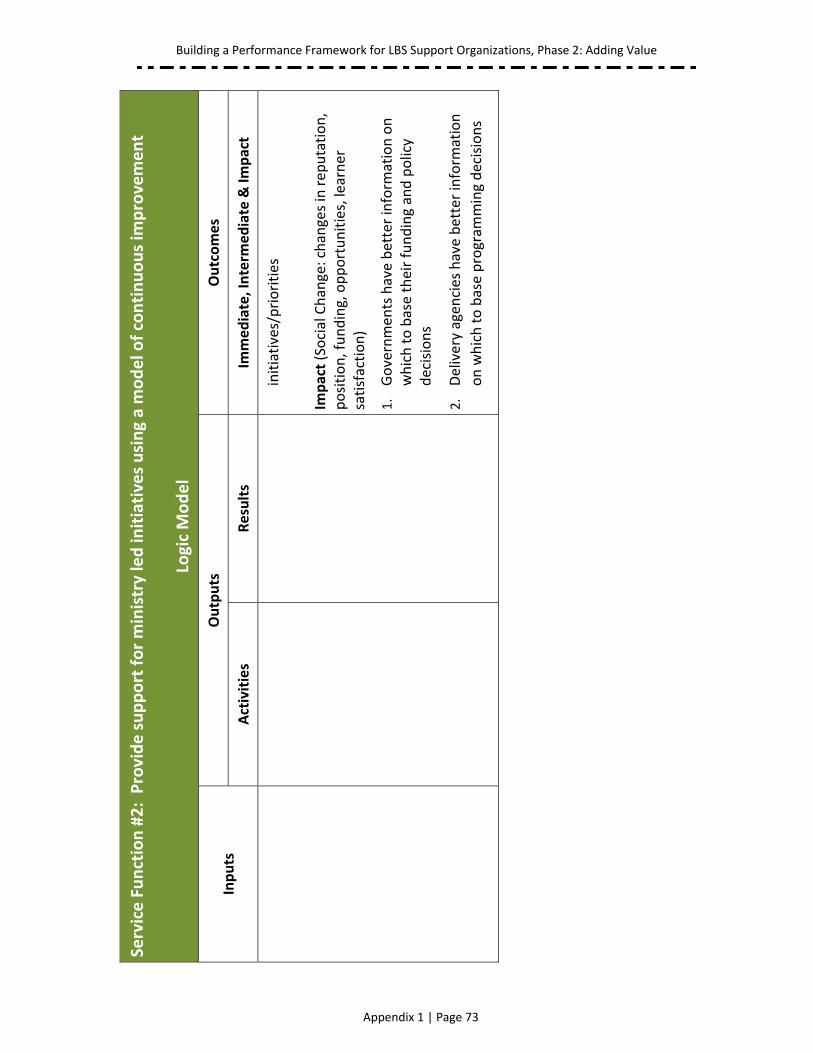
Building a Performance Framework for LBS Support Organizations, Phase 2: Adding Value
Appendix 1 | Page 73
Service Function #2: Provide support for ministry led initiatives using a model of continuous im
provement
Logic Model
Inputs
Outputs
Outcomes
Activities
Results
Immediate, Interm
ediate & Im
pact
initiatives/priorities
Im
pact (Social Change: changes in rep
utation,
position, funding, opportunities, learner
satisfaction)
1.
Governmen
ts have better inform
ation on
which to base their funding and policy
decisions
2.
Delivery agen
cies have better inform
ation
on which to base program
ming decisions
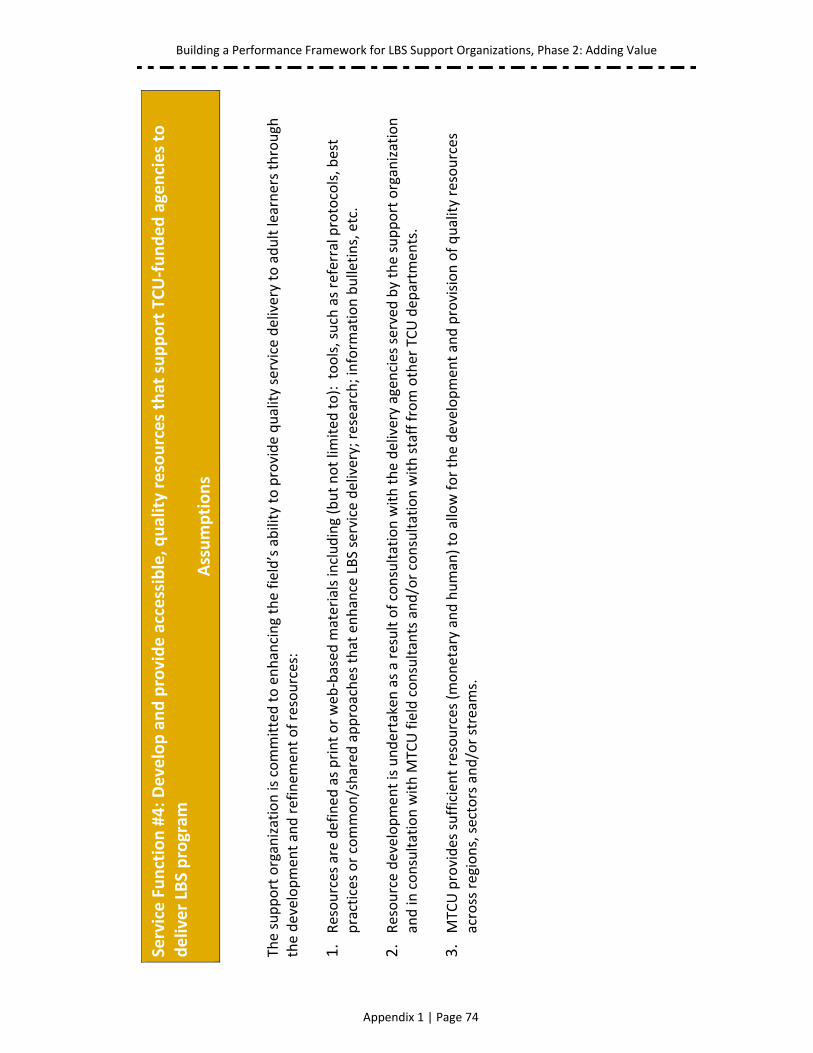
Building a Performance Framework for LBS Support Organizations, Phase 2: Adding Value
Appendix 1 | Page 74
Service Function #4: Develop and provide accessible, q
uality resources that support TCU‐funded agencies to
deliver LBS program
Assumptions
The support organization is committed to enhancing the field’s ability to provide quality service delivery to adult learners through
the developmen
t and refinem
ent of resources:
1. Resources are defined
as print or web‐based
materials including (but not lim
ited
to): tools, such as referral protocols, best
practices or common/shared
approaches that enhance LBS service delivery; research; inform
ation bulletins, etc.
2. Resource development is undertaken as a result of consultation with the delivery agen
cies served by the support organization
and in
consultation with M
TCU field consultants and/or consultation with staff from other TCU dep
artm
ents.
3. MTC
U provides sufficient resources (monetary and human) to allow for the developmen
t and provision of quality resources
across regions, sectors and/or stream
s.
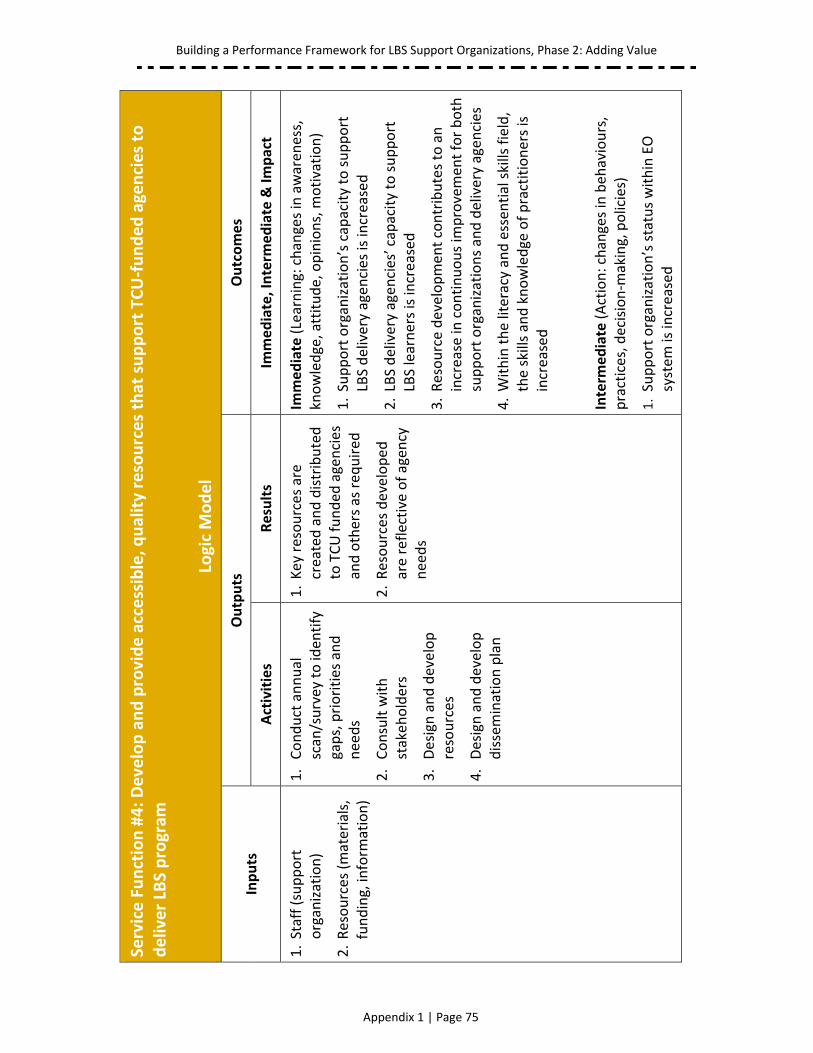
Building a Performance Framework for LBS Support Organizations, Phase 2: Adding Value
Appendix 1 | Page 75
Service Function #4: Develop and provide accessible, q
uality resources that support TCU‐funded agencies to
deliver LBS program
Logic Model
Inputs
Outputs
Outcomes
Activities
Results
Immediate, Interm
ediate & Im
pact
1. Staff (support
organization)
2. Resources (materials,
funding, inform
ation)
1. Conduct annual
scan/survey to iden
tify
gaps, priorities and
needs
2. Consult with
stakeh
olders
3. Design and develop
resources
4. Design and develop
dissemination plan
1. Key resources are
created and distributed
to TCU funded agencies
and others as req
uired
2. Resources developed
are reflective of agen
cy
needs
Immediate (Learning: changes in awaren
ess,
knowledge, attitude, opinions, m
otivation)
1. Support organization’s capacity to support
LBS delivery agen
cies is increased
2. LBS delivery agen
cies’ capacity to support
LBS learners is increased
3. Resource development contributes to an
increase in
continuous im
provemen
t for both
support organizations and delivery agen
cies
4. Within the literacy and essen
tial skills field,
the skills and knowledge of practitioners is
increased
Interm
ediate (Action: changes in beh
aviours,
practices, decision‐m
aking, policies)
1. Support organization’s status within EO
system
is increased

Building a Performance Framework for LBS Support Organizations, Phase 2: Adding Value
Appendix 1 | Page 76
Service Function #4: Develop and provide accessible, q
uality resources that support TCU‐funded agencies to
deliver LBS program
Logic Model
Inputs
Outputs
Outcomes
Activities
Results
Immediate, Interm
ediate & Im
pact
2. Literacy service delivery agen
cies and
support organizations work together to
provide a coordinated training and
employm
ent system
based
on iden
tified
community needs
3. Literacy service delivery agen
cies and
support organizations work together to
provide a training and employm
ent system
that is m
ore responsive to iden
tified
community needs
Im
pact (Social Change: changes in rep
utation,
position, funding, opportunities, learner
satisfaction)
1.
Support organizations help LBS funded
delivery agen
cies achieve expected results
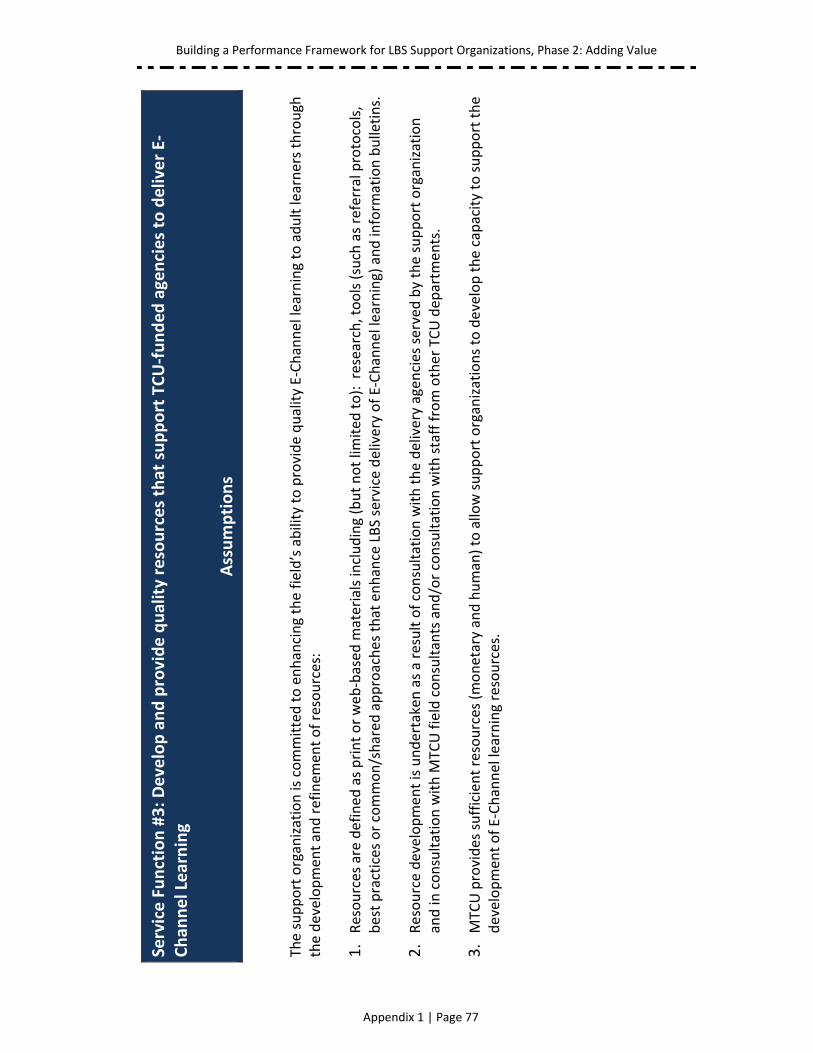
Building a Performance Framework for LBS Support Organizations, Phase 2: Adding Value
Appendix 1 | Page 77
Service Function #3: Develop and provide quality resources that support TCU‐funded agencies to deliver E‐
Chan
nel Learning
Assumptions
The support organization is committed to enhancing the field’s ability to provide quality E‐Channel learning to adult learners through
the developmen
t and refinem
ent of resources:
1. Resources are defined
as print or web‐based
materials including (but not lim
ited
to): research, tools (such as referral protocols,
best practices or common/shared
approaches that enhance LBS service delivery of E‐Channel learning) and inform
ation bulletins.
2. Resource development is undertaken as a result of consultation with the delivery agen
cies served by the support organization
and in
consultation with M
TCU field consultants and/or consultation with staff from other TCU dep
artm
ents.
3. MTC
U provides sufficient resources (monetary and human) to allow support organizations to develop the capacity to support the
developmen
t of E‐Channel learning resources.
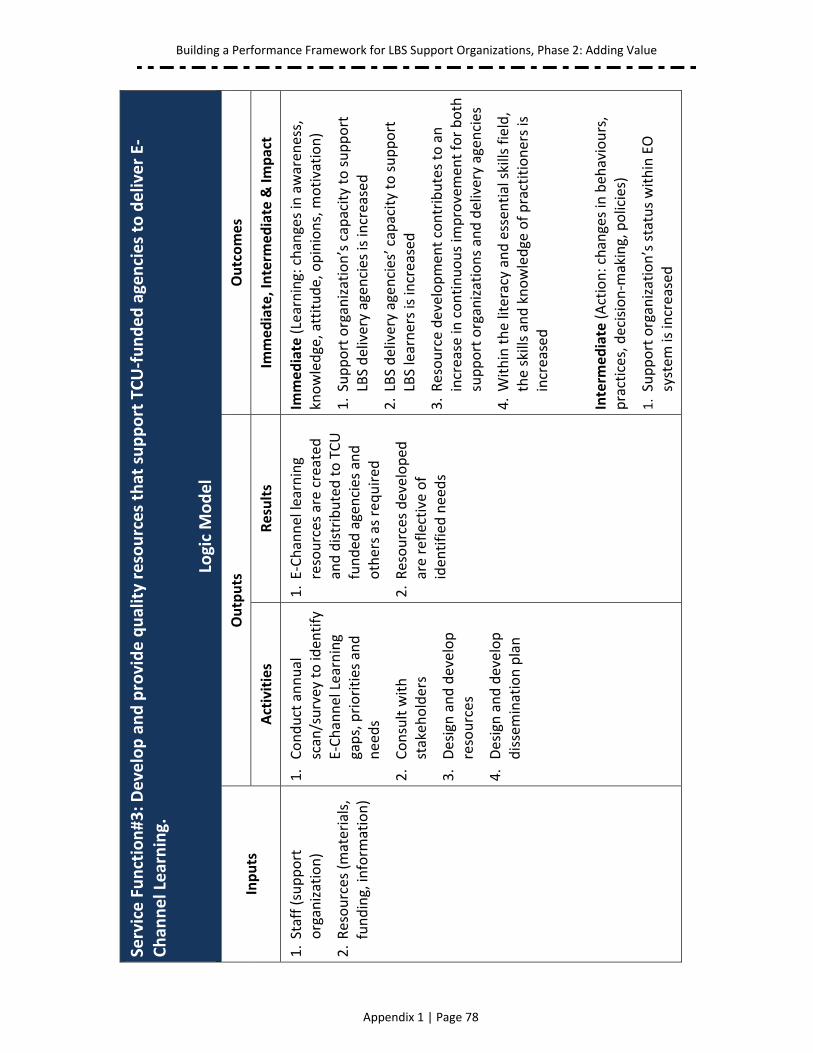
Building a Performance Framework for LBS Support Organizations, Phase 2: Adding Value
Appendix 1 | Page 78
Service Function#3: Develop and provide quality resources that support TCU‐funded agencies to deliver E‐
Chan
nel Learning.
Logic Model
Inputs
Outputs
Outcomes
Activities
Results
Immediate, Interm
ediate & Im
pact
1. Staff (support
organization)
2. Resources (materials,
funding, inform
ation)
1. Conduct annual
scan/survey to iden
tify
E‐Channel Learning
gaps, priorities and
needs
2. Consult with
stakeh
olders
3. Design and develop
resources
4. Design and develop
dissemination plan
1. E‐Channel learning
resources are created
and distributed to TCU
funded
agencies and
others as req
uired
2. Resources developed
are reflective of
iden
tified
needs
Immediate (Learning: changes in awaren
ess,
knowledge, attitude, opinions, m
otivation)
1. Support organization’s capacity to support
LBS delivery agen
cies is increased
2. LBS delivery agen
cies’ capacity to support
LBS learners is increased
3. Resource development contributes to an
increase in
continuous im
provemen
t for both
support organizations and delivery agen
cies
4. Within the literacy and essen
tial skills field,
the skills and knowledge of practitioners is
increased
Interm
ediate (Action: changes in beh
aviours,
practices, decision‐m
aking, policies)
1. Support organization’s status within EO
system
is increased
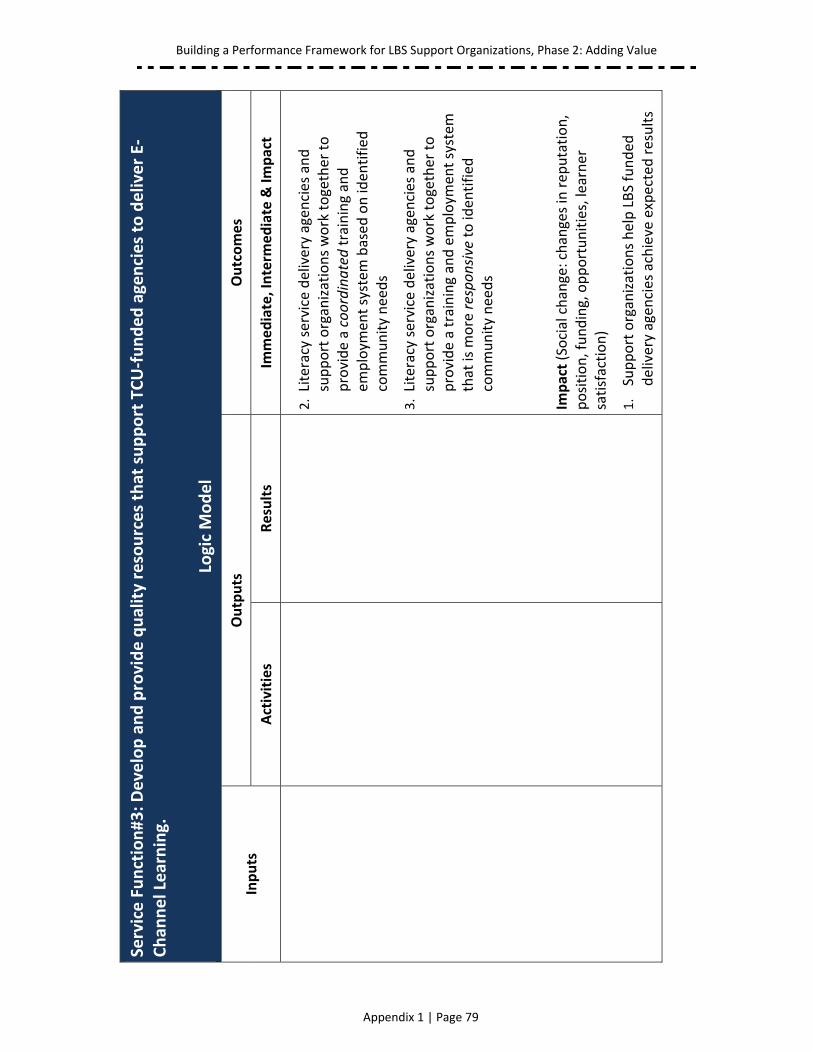
Building a Performance Framework for LBS Support Organizations, Phase 2: Adding Value
Appendix 1 | Page 79
Service Function#3: Develop and provide quality resources that support TCU‐funded agencies to deliver E‐
Chan
nel Learning.
Logic Model
Inputs
Outputs
Outcomes
Activities
Results
Immediate, Interm
ediate & Im
pact
2. Literacy service delivery agen
cies and
support organizations work together to
provide a coordinated training and
employm
ent system
based
on iden
tified
community needs
3. Literacy service delivery agen
cies and
support organizations work together to
provide a training and employm
ent system
that is m
ore responsive to iden
tified
community needs
Im
pact (Social change: changes in rep
utation,
position, funding, opportunities, learner
satisfaction)
1.
Support organizations help LBS funded
delivery agen
cies achieve expected results

Building a Performance Framework for LBS Support Organizations, Phase 2: Adding Value
Appendix 1 | Page 80
Building a Performance Framework for LBS Support Organizations, Phase 2: Adding Value
Appendix 2 | Page 81
Appendix 2: Unrevised Logic Model
In this appendix you’ll find the logic model for the community planning section of the service function that was not revised during Phase 2. This is the service function that says that you will “Support TCU-funded delivery agencies to deliver coordinated, quality LBS services responsive to emerging needs (identified by the community and government) within an integrated employment and training system.” In Phase 1, this service function was divided into three sections: Community planning, Outreach and Networking. With this part of the logic model you will find questions and reflection sheets that you can use to make the logic model become a better fit for your organization. Once you have reviewed and revised the Community Planning section of the logic model, you’ll have to review and revise the performance indicators, and then move on to revising the Outreach and Networking sections.

Building a Performance Framework for LBS Support Organizations, Phase 2: Adding Value
Appendix 2 | Page 82
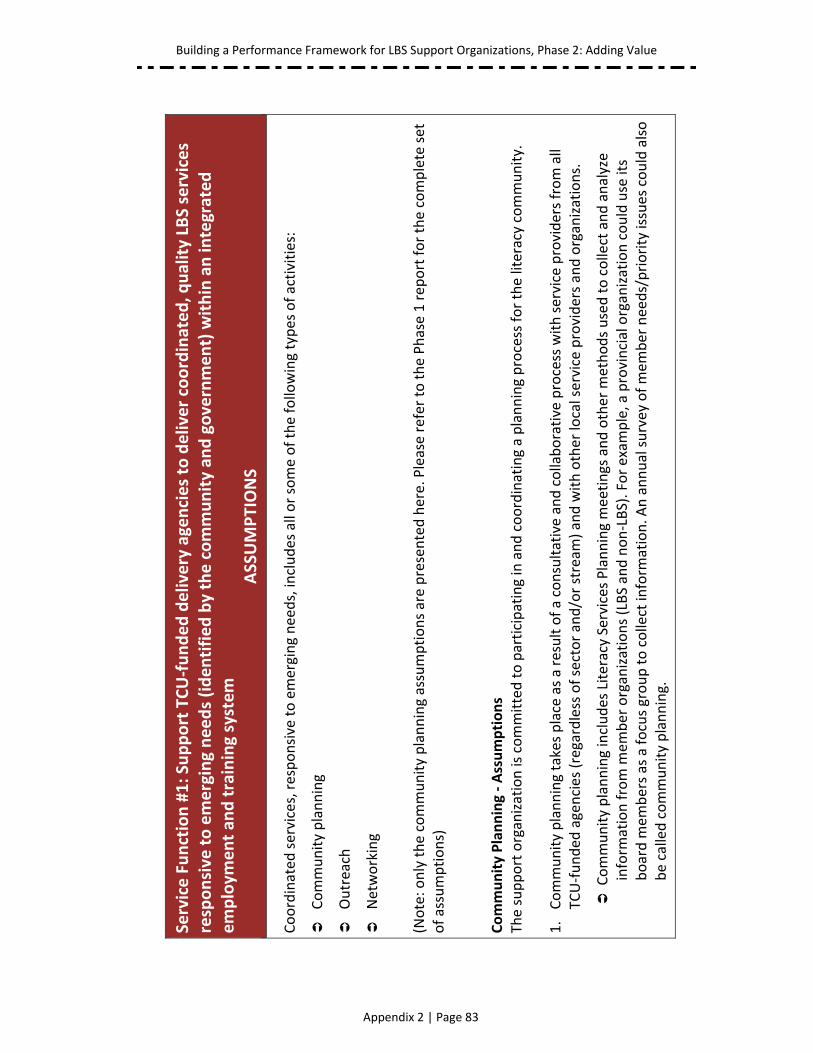
Building a Performance Framework for LBS Support Organizations, Phase 2: Adding Value
Appendix 2 | Page 83
Service Function #1: Support TCU‐funded delivery agencies to deliver coordinated, q
uality LBS services
responsive to emerging needs (identified by the community an
d government) within an integrated
employm
ent an
d training system
ASSUMPTIONS
Coordinated
services, responsive to emerging needs, includes all or some of the following types of activities:
Community planning
Outreach
Networking
(Note: o
nly the community planning assumptions are presented here. Please refer to the Phase 1 rep
ort for the complete set
of assumptions)
Community Planning ‐ Assumptions
The support organization is committed to participating in and coordinating a planning process for the literacy community.
1. Community planning takes place as a result of a consultative and collaborative process with service providers from all
TCU‐funded
agencies (regardless of sector and/or stream
) and with other local service providers and organizations.
Community planning includes Literacy Services Planning meetings and other m
ethods used to collect and analyze
inform
ation from m
ember organizations (LBS and non‐LBS). For exam
ple, a provincial organization could use its
board m
embers as a focus group to collect inform
ation. A
n annual survey of mem
ber needs/priority issues could also
be called community planning.
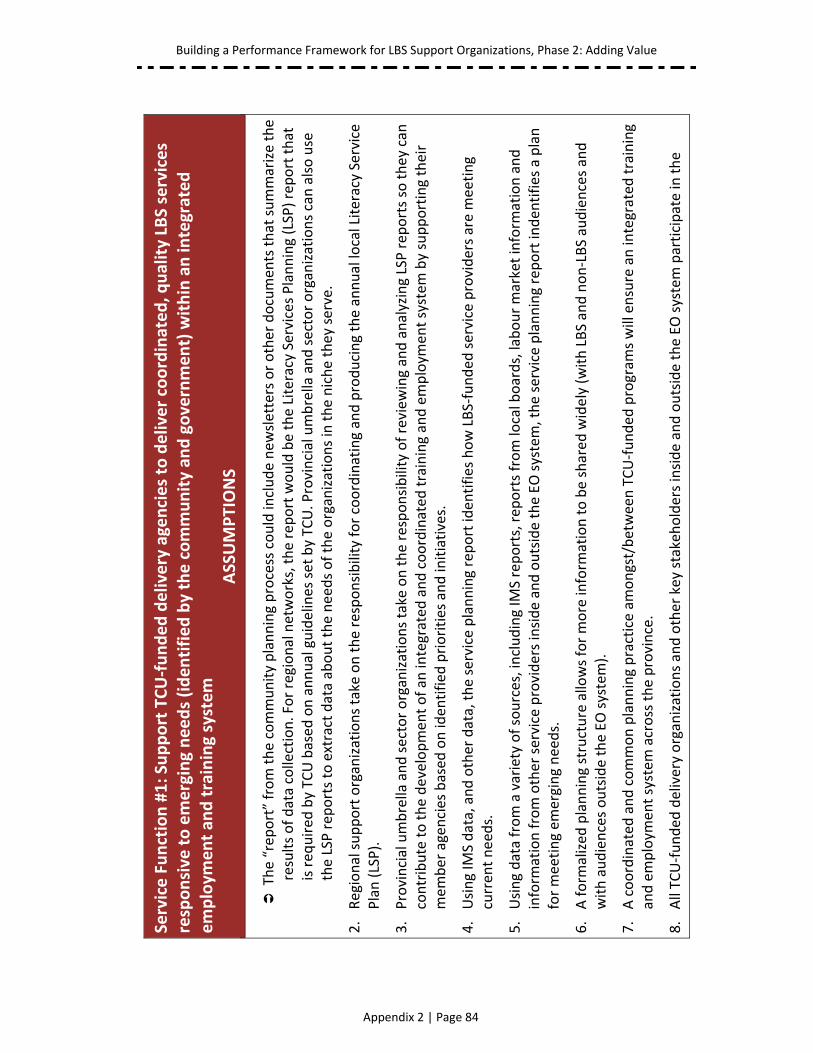
Building a Performance Framework for LBS Support Organizations, Phase 2: Adding Value
Appendix 2 | Page 84
Service Function #1: Support TCU‐funded delivery agencies to deliver coordinated, q
uality LBS services
responsive to emerging needs (identified by the community an
d government) within an integrated
employm
ent an
d training system
ASSUMPTIONS
The “report” from the community planning process could include new
sletters or other documen
ts that summarize the
results of data collection. For regional networks, the rep
ort would be the Literacy Services Planning (LSP) report that
is req
uired
by TC
U based
on annual guidelines set by TC
U. Provincial umbrella and sector organizations can also use
the LSP rep
orts to extract data about the needs of the organizations in the niche they serve.
2. Regional support organizations take on the responsibility for coordinating and producing the annual local Literacy Service
Plan (LSP).
3. Provincial umbrella and sector organizations take on the responsibility of review
ing and analyzing LSP rep
orts so they can
contribute to the developmen
t of an
integrated
and coordinated
training and employm
ent system
by supporting their
mem
ber agencies based
on iden
tified
priorities and initiatives.
4. Using IM
S data, and other data, the service planning report iden
tifies how LBS‐funded
service providers are meeting
curren
t need
s.
5. Using data from a variety of sources, including IM
S reports, rep
orts from local boards, labour market inform
ation and
inform
ation from other service providers inside and outside the EO system, the service planning report inden
tifies a plan
for meeting em
erging needs.
6. A form
alized
planning structure allows for more inform
ation to be shared
widely (w
ith LBS and non‐LBS audiences and
with audiences outside the EO system).
7. A coordinated
and common planning practice amongst/between TCU‐funded
program
s will ensure an integrated
training
and employm
ent system
across the province.
8. All TC
U‐funded
delivery organizations and other key stakeholders inside and outside the EO system participate in
the
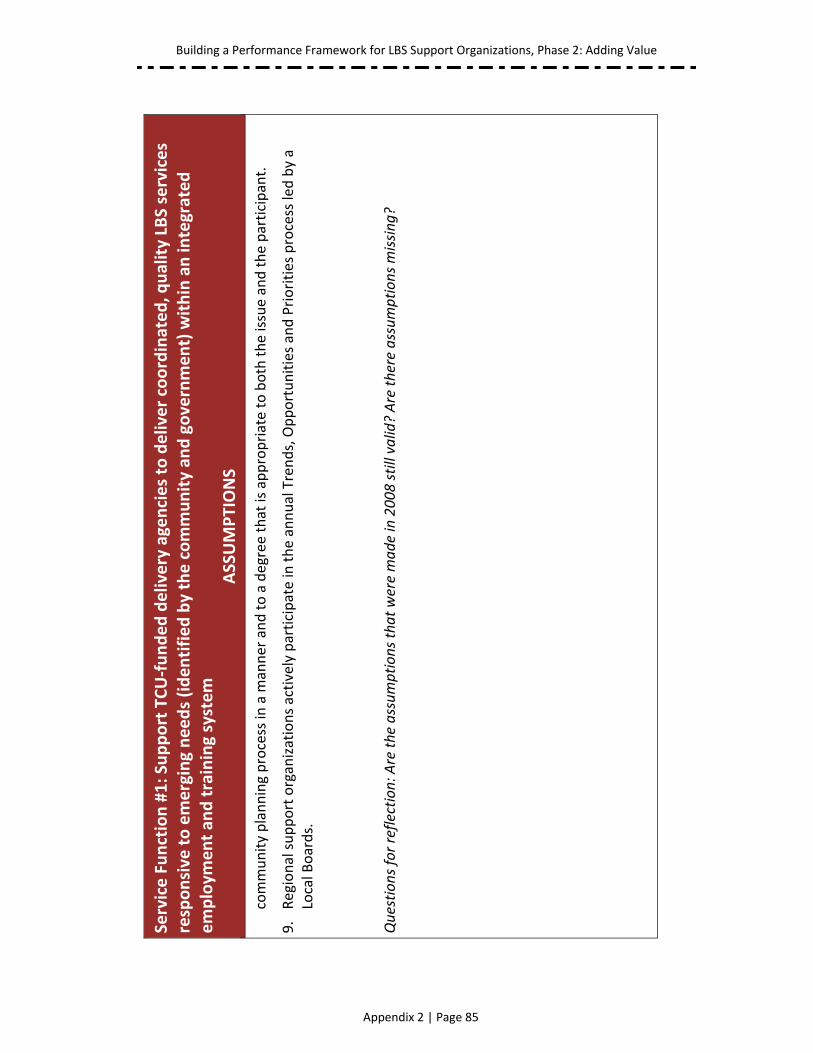
Building a Performance Framework for LBS Support Organizations, Phase 2: Adding Value
Appendix 2 | Page 85
Service Function #1: Support TCU‐funded delivery agencies to deliver coordinated, q
uality LBS services
responsive to emerging needs (identified by the community an
d government) within an integrated
employm
ent an
d training system
ASSUMPTIONS
community planning process in
a m
anner and to a degree that is appropriate to both the issue and the participant.
9. Regional support organizations actively participate in
the annual Trends, Opportunities and Priorities process led by a
Local Boards.
Questions for reflection: A
re the assumptions that were made in 2008 still valid? Are there assumptions missing?
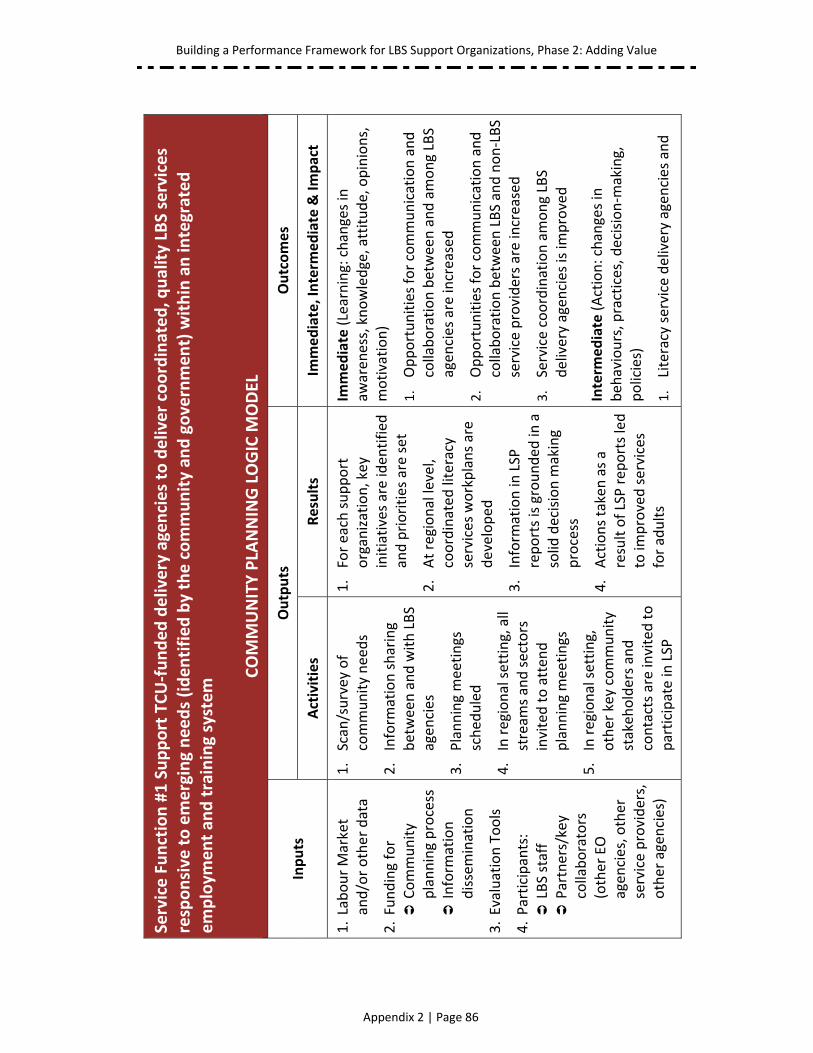
Building a Performance Framework for LBS Support Organizations, Phase 2: Adding Value
Appendix 2 | Page 86
Service Function #1 Support TCU‐funded delivery agencies to deliver coordinated, q
uality LBS services
responsive to emerging needs (identified by the community an
d government) within an integrated
employm
ent an
d training system
COMMUNITY PLA
NNING LOGIC M
ODEL
Inputs
Outputs
Outcomes
Activities
Results
Immediate, Interm
ediate & Im
pact
1. Labour Market
and/or other data
2. Funding for
Community
planning process
Inform
ation
dissemination
3. Evaluation Tools
4. Participants:
LBS staff
Partners/key
collaborators
(other EO
agen
cies, other
service providers,
other agencies)
1. Scan/survey of
community needs
2. Inform
ation sharing
between and with LBS
agen
cies
3. Planning meetings
sched
uled
4. In regional setting, all
stream
s and sectors
invited to atten
d
planning meetings
5. In regional setting,
other key community
stakeh
olders and
contacts are invited to
participate in LSP
1. For each support
organization, key
initiatives are iden
tified
and priorities are set
2. At regional level,
coordinated
literacy
services workplans are
developed
3. Inform
ation in
LSP
reports is grounded
in a
solid
decision m
aking
process
4. Actions taken as a
result of LSP rep
orts led
to im
proved services
for adults
Immediate (Learning: changes in
awaren
ess, knowledge, attitude, opinions,
motivation)
1.
Opportunities for communication and
collaboration between and among LBS
agen
cies are increased
2.
Opportunities for communication and
collaboration between LBS and non‐LBS
service providers are increased
3.
Service coordination among LBS
delivery agen
cies is im
proved
Interm
ediate (Action: changes in
beh
aviours, practices, decision‐m
aking,
policies)
1.
Literacy service delivery agen
cies and
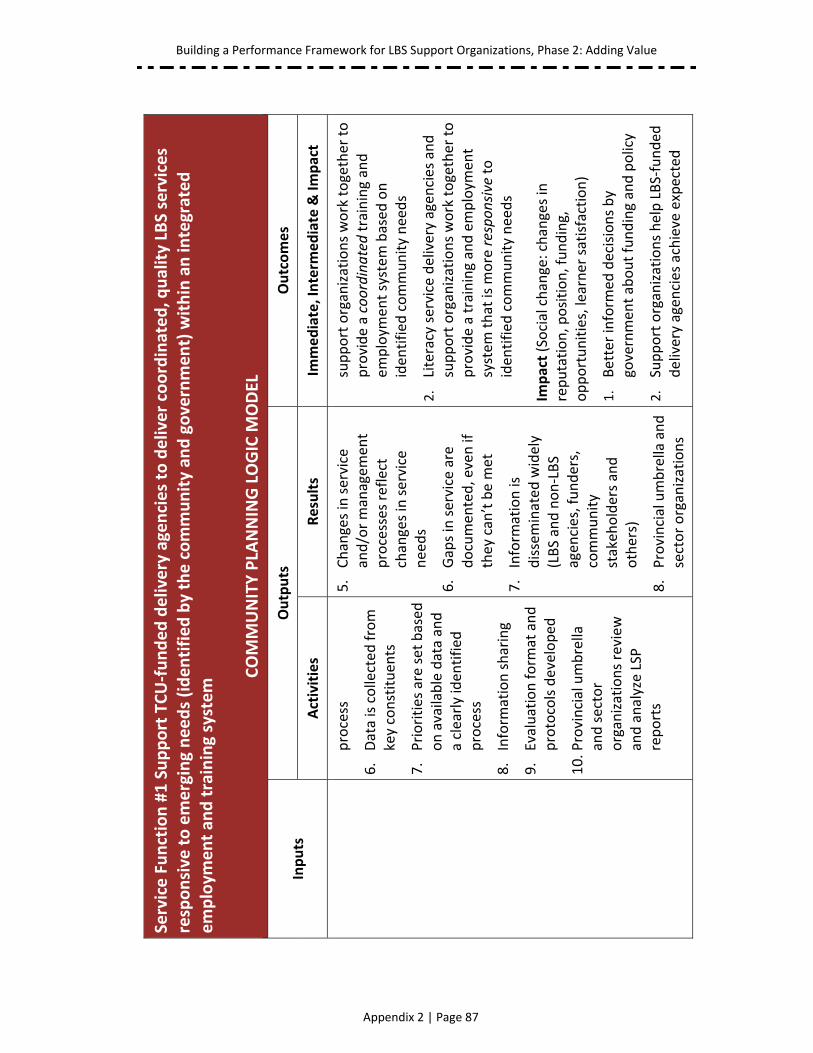
Building a Performance Framework for LBS Support Organizations, Phase 2: Adding Value
Appendix 2 | Page 87
Service Function #1 Support TCU‐funded delivery agencies to deliver coordinated, q
uality LBS services
responsive to emerging needs (identified by the community an
d government) within an integrated
employm
ent an
d training system
COMMUNITY PLA
NNING LOGIC M
ODEL
Inputs
Outputs
Outcomes
Activities
Results
Immediate, Interm
ediate & Im
pact
process
6. Data is collected
from
key constituen
ts
7. Priorities are set based
on available data and
a clearly iden
tified
process
8. Inform
ation sharing
9. Evaluation form
at and
protocols developed
10. Provincial umbrella
and sector
organizations review
and analyze LSP
reports
5. Changes in service
and/or managem
ent
processes reflect
changes in service
needs
6. Gaps in service are
documen
ted, even if
they can’t be m
et
7. Inform
ation is
disseminated
widely
(LBS and non‐LBS
agen
cies, funders,
community
stakeh
olders and
others)
8. Provincial umbrella and
sector organizations
support organizations work together to
provide a coordinated training and
employm
ent system
based
on
iden
tified
community needs
2.
Literacy service delivery agen
cies and
support organizations work together to
provide a training and employm
ent
system
that is m
ore responsive to
iden
tified
community needs
Impact (Social change: changes in
reputation, position, funding,
opportunities, learner satisfaction)
1.
Better inform
ed decisions by
governmen
t about funding and policy
2.
Support organizations help LBS‐funded
delivery agen
cies achieve expected
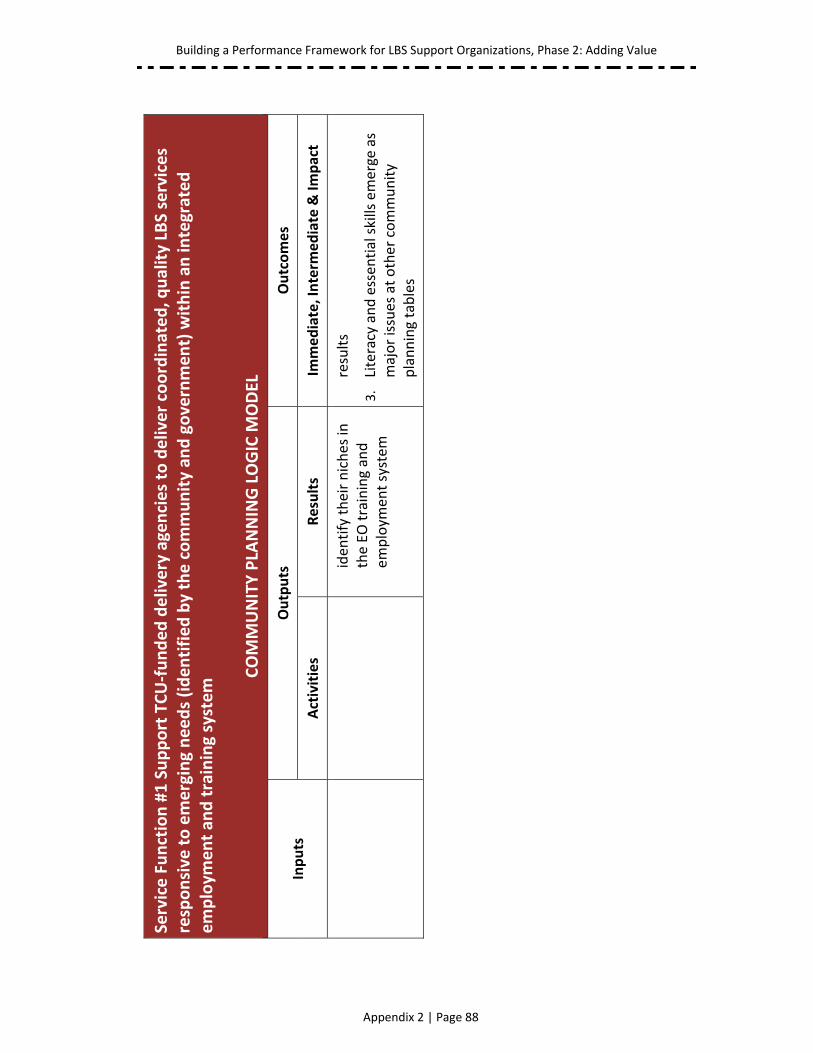
Building a Performance Framework for LBS Support Organizations, Phase 2: Adding Value
Appendix 2 | Page 88
Service Function #1 Support TCU‐funded delivery agencies to deliver coordinated, q
uality LBS services
responsive to emerging needs (identified by the community an
d government) within an integrated
employm
ent an
d training system
COMMUNITY PLA
NNING LOGIC M
ODEL
Inputs
Outputs
Outcomes
Activities
Results
Immediate, Interm
ediate & Im
pact
iden
tify their niches in
the EO training and
employm
ent system
results
3.
Literacy and essen
tial skills emerge as
major issues at other community
planning tables
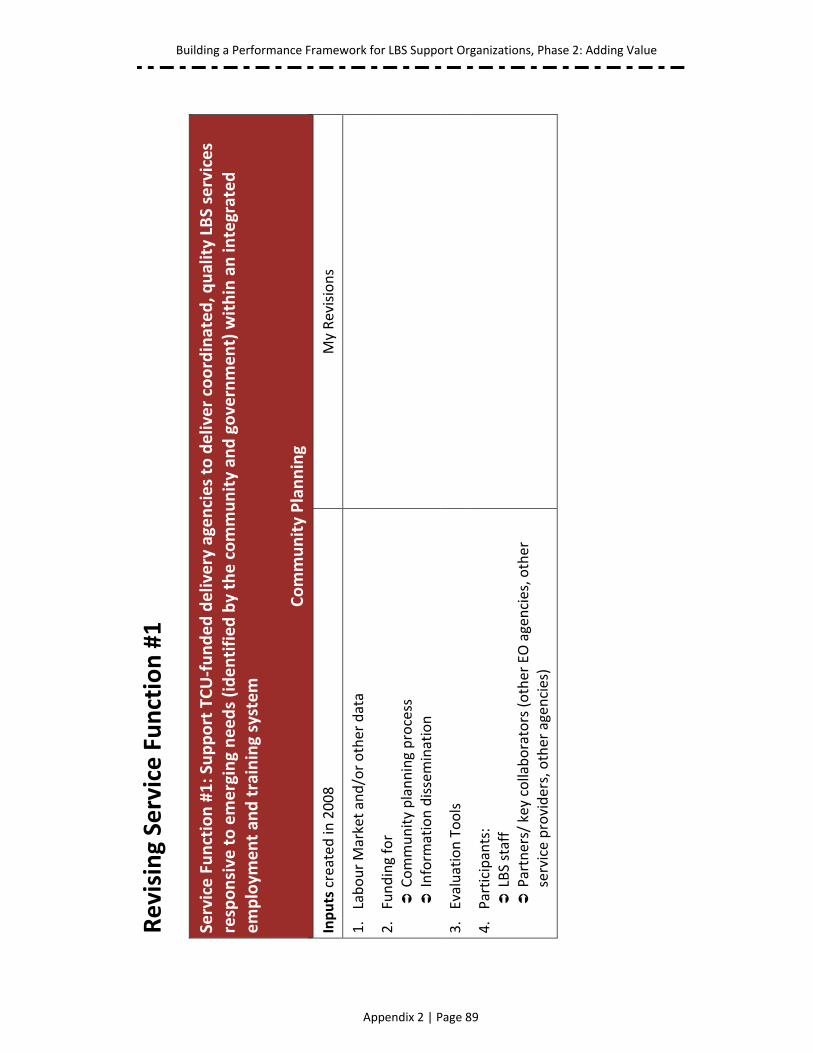
Building a Performance Framework for LBS Support Organizations, Phase 2: Adding Value
Appendix 2 | Page 89
Revising Service Function #1
Service Function #1: Support TCU‐funded delivery agencies to deliver coordinated, q
uality LBS services
responsive to emerging needs (identified by the community an
d government) within an integrated
employm
ent an
d training system
Community Planning
Inputs created in
2008
My Revisions
1. Labour Market and/or other data
2. Funding for
Community planning process
Inform
ation dissemination
3. Evaluation Tools
4. Participants:
LBS staff
Partners/ key collaborators (other EO agencies, other
service providers, other agencies)
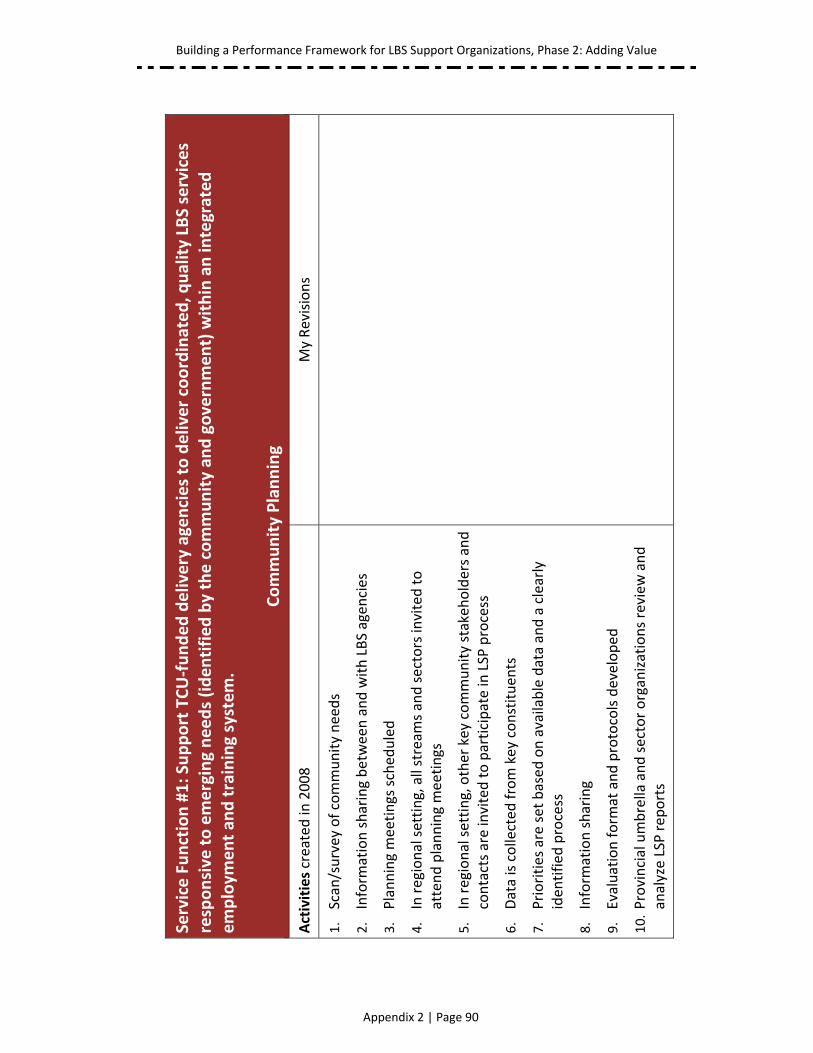
Building a Performance Framework for LBS Support Organizations, Phase 2: Adding Value
Appendix 2 | Page 90
Service Function #1: Support TCU‐funded delivery agencies to deliver coordinated, q
uality LBS services
responsive to emerging needs (identified by the community an
d government) within an integrated
employm
ent an
d training system.
Community Planning
Activities created in
2008
My Revisions
1.
Scan/survey of community needs
2.
Inform
ation sharing between and with LBS agen
cies
3.
Planning meetings sched
uled
4.
In regional setting, all stream
s and sectors invited to
attend planning meetings
5.
In regional setting, other key community stakeh
olders and
contacts are invited to participate in
LSP process
6.
Data is collected
from key constituen
ts
7.
Priorities are set based
on available data and a clearly
iden
tified
process
8.
Inform
ation sharing
9.
Evaluation form
at and protocols developed
10. Provincial umbrella and sector organizations review
and
analyze LSP rep
orts
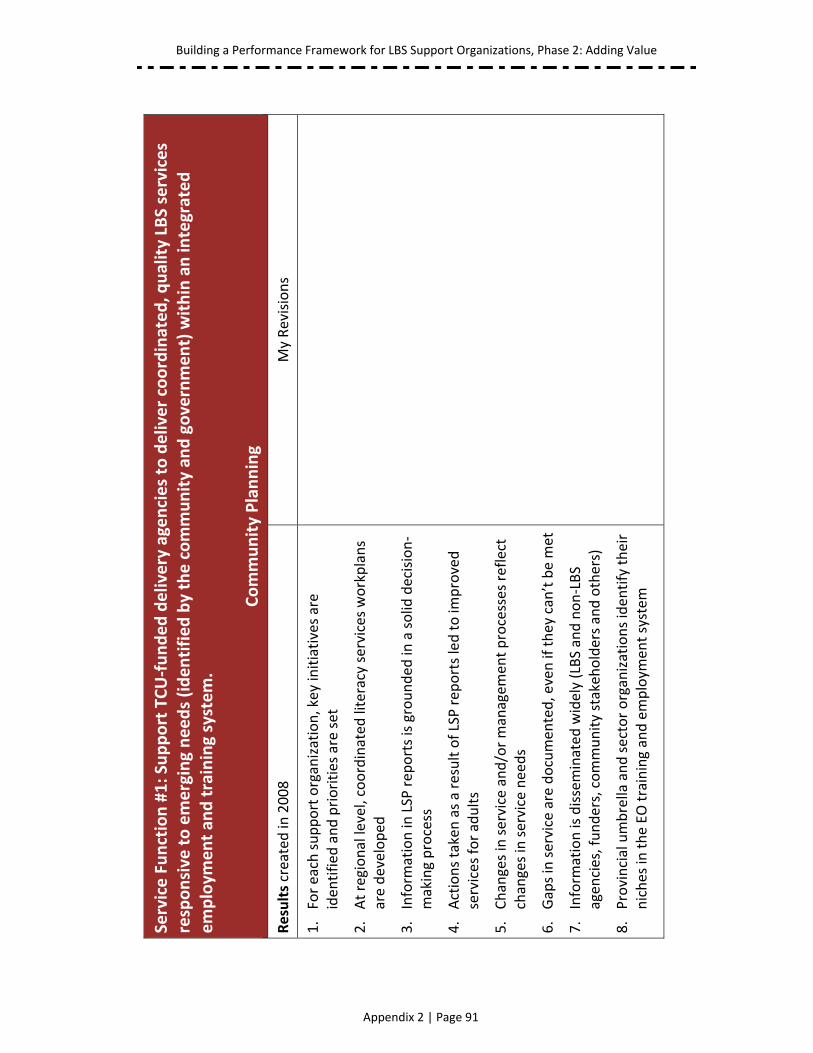
Building a Performance Framework for LBS Support Organizations, Phase 2: Adding Value
Appendix 2 | Page 91
Service Function #1: Support TCU‐funded delivery agencies to deliver coordinated, q
uality LBS services
responsive to emerging needs (identified by the community an
d government) within an integrated
employm
ent an
d training system.
Community Planning
Results created in
2008
My Revisions
1. For each support organization, key initiatives are
iden
tified
and priorities are set
2. At regional level, coordinated
literacy services workplans
are developed
3. Inform
ation in
LSP rep
orts is grounded
in a solid
decision‐
making process
4. Actions taken as a result of LSP rep
orts led to im
proved
services for adults
5. Changes in service and/or managem
ent processes reflect
changes in service needs
6. Gaps in service are documen
ted, even if they can’t be m
et
7. Inform
ation is disseminated
widely (LBS and non‐LBS
agen
cies, funders, community stakeh
olders and others)
8. Provincial umbrella and sector organizations iden
tify their
niches in
the EO training and employm
ent system
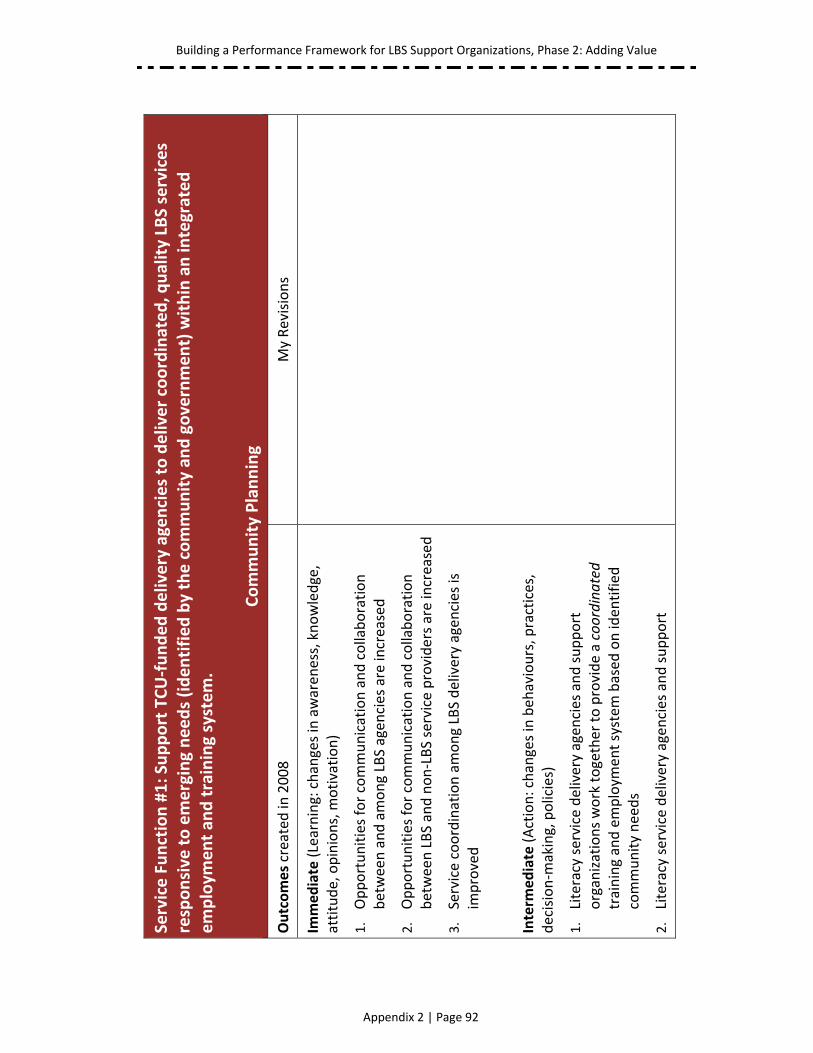
Building a Performance Framework for LBS Support Organizations, Phase 2: Adding Value
Appendix 2 | Page 92
Service Function #1: Support TCU‐funded delivery agencies to deliver coordinated, q
uality LBSservices
responsive to emerging needs (identified by the community an
d government) within an integrated
employm
ent an
d training system.
Community Planning
Outcomes created in
2008
My Revisions
Immediate (Learning: changes in awaren
ess, knowledge,
attitude, opinions, m
otivation)
1.
Opportunities for communication and collaboration
between and among LBS agen
cies are increased
2.
Opportunities for communication and collaboration
between LBS and non‐LBS service providers are increased
3.
Service coordination among LBS delivery agen
cies is
improved
Interm
ediate (Action: changes in beh
aviours, practices,
decision‐m
aking, policies)
1.
Literacy service delivery agen
cies and support
organizations work together to provide a coordinated
training and employm
ent system
based
on iden
tified
community needs
2.
Literacy service delivery agen
cies and support
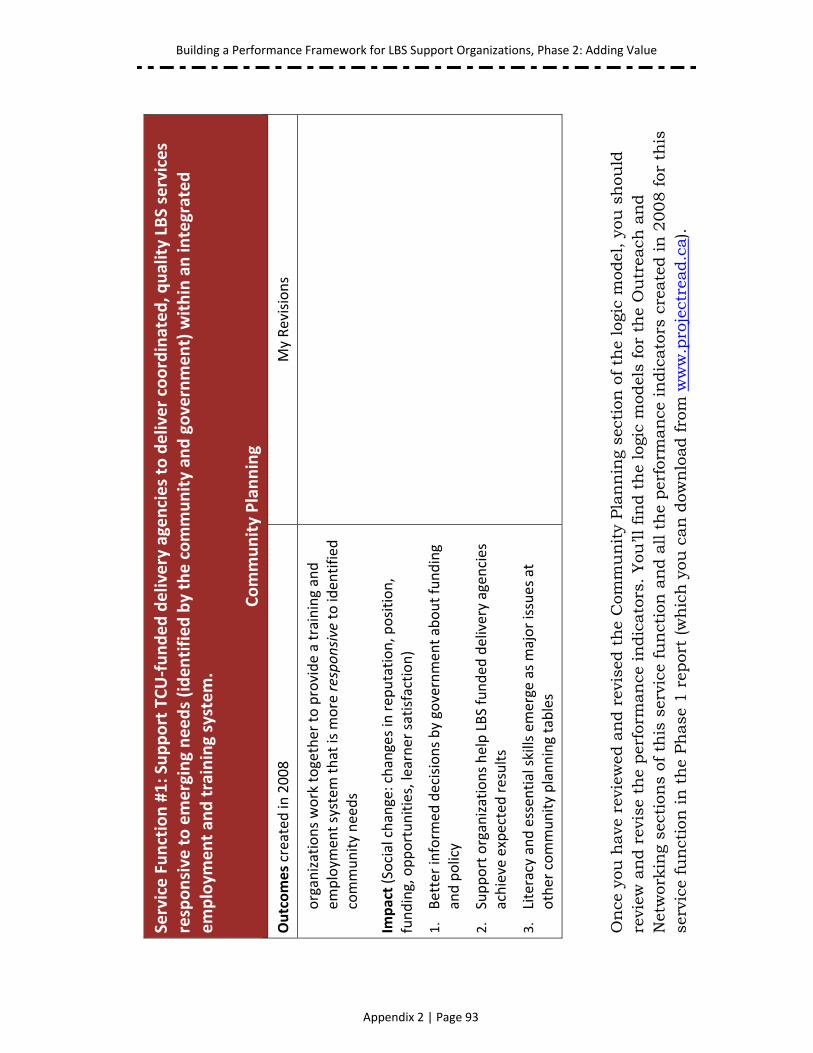
Building a Performance Framework for LBS Support Organizations, Phase 2: Adding Value
Appendix 2 | Page 93
Service Function #1: Support TCU‐funded delivery agencies to deliver coordinated, q
uality LBSservices
responsive to emerging needs (identified by the community an
d government) within an integrated
employm
ent an
d training system.
Community Planning
Outcomes created in
2008
My Revisions
organizations work together to provide a training and
employm
ent system
that is m
ore responsive to iden
tified
community needs
Impact (Social change: changes in rep
utation, position,
funding, opportunities, learner satisfaction)
1.
Better inform
ed decisions by governmen
t about funding
and policy
2.
Support organizations help LBS funded
delivery agen
cies
achieve expected
results
3.
Literacy and essen
tial skills emerge as major issues at
other community planning tables
On
ce y
ou h
ave
revi
ewed
an
d r
evis
ed t
he
Com
mu
nit
y Pla
nn
ing
sect
ion
of
the
logi
c m
odel
, yo
u s
hou
ld
revi
ew a
nd r
evis
e th
e per
form
ance
in
dic
ator
s. Y
ou’ll
fin
d t
he
logi
c m
odel
s fo
r th
e O
utr
each
an
d
Net
wor
kin
g se
ctio
ns
of t
his
ser
vice
fu
nct
ion
an
d a
ll t
he
per
form
ance
in
dic
ator
s cr
eate
d in
2008 f
or t
his
se
rvic
e fu
nct
ion
in
th
e Ph
ase
1 r
epor
t (w
hic
h y
ou c
an d
own
load
fro
m w
ww
.pro
ject
read
.ca )
.

Building a Performance Framework for LBS Support Organizations, Phase 2: Adding Value
Appendix 2 | Page 94


![Adding value to_your_degree[1]](https://img.pdfslide.net/doc/110x75/559755c61a28abd2238b4603/adding-value-toyourdegree1.jpg)