Embed Size (px)
Citation preview

THESIS FOR THE DEGREE OF DOCTOR OF PHILOSOPHY
in
MACHINE AND VEHICLE SYSTEMS
Addressing Female Whiplash Injury Protection A Step Towards 50th Percentile Female Rear Impact Occupant Models
A N N A C A R L S S O N
Department of Applied Mechanics CHALMERS UNIVERSITY OF TECHNOLOGY
Gothenburg, Sweden, 2012
Addressing Female Whiplash Injury Protection A Step Towards 50th Percentile Female Rear Impact Occupant Models ANNA CARLSSON ISBN 978-91-7385-671-3
© ANNA CARLSSON, 2012 Doktorsavhandlingar vid Chalmers tekniska högskola Ny serie nr 3352 ISSN: 0346-718X Department of Applied Mechanics Chalmers University of Technology SE-412 96 Gothenburg Sweden Telephone +46 (0)31 7721000 Cover: The 50th percentile female rear impact dummy FE model, EvaRID V1.0 Pictures courtesy of Humanetics. Chalmers Reproservice Gothenburg, Sweden 2012
- i -
ADDRESSING FEMALE WHIPLASH INJURY PROTECTIONA STEP TOWARDS 50TH PERCENTILE FEMALE REAR IMPACT OCCUPANT MODELS
ANNA CARLSSON Division of Vehicle Safety, Department of Applied Mechanics Chalmers University of Technology Whiplash Associated Disorder (WAD) – commonly denoted whiplash injury – to vehicle occupants involved in collisions, is of worldwide concern. These injuries occur at relatively low velocity changes, typically between 10–25 km/h, and in all impact directions. Rear impacts are, however, the most common in the accident statistics. Since the mid-1960´s, statistical data has shown that females have up to three times higher risk of sustaining whiplash injuries than males, in similar crash conditions. The overall objective was to improve the understanding of why females are at greater risk of sustaining whiplash injuries in rear impacts, compared to males. Two rear impact studies involving ~50th percentile female and male volunteers were carried out. In both studies, response corridors for ~50th percentile females were generated and compared to previously published response corridors for 50th percentile males. Additionally, the Neck Injury Criterion (NIC) values, head-to-head restraint distances and contact times were compared between female and male volunteers. Thereafter, a 50th percentile female rear impact dummy Finite Element (FE) model, EvaRID V1.0, was developed from an existing BioRID II model. The anthropometry and mass distribution of the 50th percentile female were specified based on published data. Its mechanical response was evaluated with data from one of the volunteer studies. Finally, a scaled-down rear impact dummy prototype – BioRID50F – was developed using modified BioRID II dummy components. The scaled-down dummy was representative of a 50th percentile female in mass and key dimensions and intended to function as a representative seat loading device. The BioRID50F was evaluated against new volunteer test results from low-speed rear impact sled tests including female volunteers close to a 50th percentile female in size. A series of rear impact tests with the BioRID50F were performed in four different seats from four different car models. The results were compared to previously performed BioRID tests in equivalent setup. It was found that the overall biofidelity of the EvaRID V1.0 was acceptable at low velocity changes (7 km/h). A general stiffness reduction in EvaRID V1.0 of 30 percent compared to the BioRID II, proved to be a promising first iteration. However, further improvements are of the EvaRID V1.0 as well as BioRID II models are required with regards to the stiffness of the thoracic spine. The results from the rear impact test series comprising volunteers and the BioRID50F supported the findings from earlier publications, indicating that there may be characteristic differences in the rear impact dynamic seat back interaction between males and females. A mechanical or computational model of a 50th percentile female would be an important complement to the existing 50th percentile male BioRID II occupant models when evaluating seat performance. These models can be used, not only as a tool when designing protective systems, but also in the process of further evaluation and development of injury criteria.
KEYWORDS: whiplash, neck injury, volunteers, head restraint, crash test, rear impact, female, dynamic response, occupant model, anthropometry, dummy

- ii -
ACKNOWLEDGEMENTS
This study was mainly funded by the European Commission as part of the project ADSEAT (Adaptive Seat to Reduce Neck Injuries for Female and Male Occupants) – project No. 233904 – within the 7th Framework Program. Additional funding was provided by the Swedish Governmental Agency for Innovation Systems (VINNOVA), IIHS (Insurance Institute for Highway Safety), Folksam Research Foundation, the Swedish Transport Administration, and the Swedish National Road and Transport Research Institute (VTI).
This work has involved many people and I would like to thank you all, and especially:
My examiner, Per Lövsund at Chalmers, for accepting me as a PhD student at Chalmers.
My supervisor, Mats Svensson at Chalmers, for always believing in me, for instant support despite heavy work load, and for fruitful and interesting discussions.
My co-supervisor, Johan Davidsson at Chalmers, for your helping hand, in particular for testing and dummy development, and for thorough review of my work.
My co-supervisor, Astrid Linder at VTI, for introducing me to the area, and for generous and inspiring support during the first part of my studies. Without you the ADSEAT project would not exist.
Gunter Siegmund, MEA Forensic (Canada), for generously providing data and excellent feedback/cooperation.
Anders Kullgren, Folksam/Chalmers, for generously sharing data and knowledge.
Helena Stigson, Folksam, for interesting discussions.
Persons involved in the planning, preparation, and/or performance of the volunteer rear impact sled test series in Munich, Germany; Wolfram Hell, Sylvia Schick, Stefan Horion, and Kristin Thorsteinsdottir at LMU (Germany); and Carsten Reinkemayer, Egon Steinkohl, Martin Grimme, and Helmut Brandl at the Test Centre at Allianz in Ismaning (Germany). Thank you! It’s been an absolute pleasure working with you.
Persons at Humanetics (previously FTSS) involved in the development of the EvaRID V1.0 model; Paul Lemmen, Fred Chang, Fuchun Zhu, Karl Koschdon, Nagananda Burra, Apoorva Lakshminarayana. Thank you! I have thoroughly enjoyed working with you.
Persons involved in the planning, preparation, and/or performance of the rear impact sled test series in Austria; Kai-Uwe Schmitt, Toni Weber, and Markus Muser at AGU Zurich (Schwitzerland); Ernst Tomasch at Graz University of Technology (Austria); and Hermann Steffan, Erich Diesenreither, and Florian Nyvelt at Dr Steffan Datentechnik in Linz (Austria). Thank you! Working with you has been inspiring.
To all partners of the ADSEAT project – I hope that I will have the opportunity to work with you again on future projects.
Ex-colleagues and friends at VTI; especially Niklas, Tania, Christina, Jesper, Mikael, Fredrik, Martin, Anders, Anna, Lennart, Hans-Erik, and Robert at the Göteborg office; and the TST and MFT units in Linköping. Keep up the good spirits.
Colleagues and friends at Chalmers; Karin Brolin, Krister Wolff, Hans Norin, Jikuang Yang, Jac Wismans, Selpi Selpi, Helen Fagerlind, Lotta Jakobsson, Göran Brännare, Sonja Laakso Gustafsson, Marianne Hedfors, Petra Gustafsson, Aleksandra, Stina, Kristian, Jonas, Ruth, Isabelle, Manuel, Linus, Jacobo, Jóna, Marianne, Laure-Lise, Azra, Krystoffer, Ulrich, Anna, Sarbaz, Emma, Henrik, Mikael, Jan, Li, Jan-Ove; and at SAFER; Anna Nilsson-Ehle,

- iii -
Helena Gellerman, Lisa Knutsson, and Daniela Michael; for making my days at the office even more enjoyable.
The participants of the SAFER-Whiplash pre-study for interesting whiplash injury discussions from different viewpoints.
Johannes Adler, for the work with the with the BioRID50F dummy and the laboratory seat.
Thomas Nygårds, Chalmers, for the measurements of foam material properties in the laboratory seat.
Jan Möller, Chalmers, for helping me out with practical work; such as construction of the laboratory seatback, welding, and measurements – and for lending me tools.
Elisabet Agar, my former colleague at VTI, for nice chats and lunches, and for reviewing the language in this thesis.
My Mentor4Research, Christer Wirén – I’m grateful for your guidance.
Bertil Jonsson for enjoyable conversations about everything, but mostly about whiplash injuries and seating postures for males and females.
Colleagues at Autoliv; especially former Autoliv Safety Centre for valuable input regarding crash testing; Johan Svärd; Yngve Håland; Cecilia Sunnevång; Ola Boström; and Linda Eriksson for sharing of knowledge and encouragement. Special thanks to all members of the “Girl Club”, for frequently planning/arranging celebrations, small excursions and picnics (always in nice weather) – much needed breaks in my studies; and to former and present members of the Autoliv Art Lottery Committee, especially Marika Henningsson.
The library at Chalmers, Lindholmen for your excellent service.
Eva-Marie Lundberg, my former colleague at Saab, for always being there
Anna-Carin Gram, my colleague at Autoliv, for our frequent small-talk
Sara Janhäll, my fellow student during the Master Programme at Chalmers, I’m happy to be back in touch again after so many years
My friends; Sanna, Silvia, Andreas, Kristina, Cathrin, Christoffer, Cecilia, Thomas, Markus, Mats, Anders, Marianne, Mats, Susanne, Petra, Rolf for your encouragement, laughs over dinner, and pleasant conversations
Kristin; I’m grateful for your valuable input and support.
My family: Greger, Märta, and Greta for your love and understanding during intense working periods; my parents Eva and Bertil for being there whenever needed; my sisters Petrea and Hillevi and their families; and Malle, Curt and Barbro for taking care of the children.

- iv -
- v -
TABLE OF CONTENTS
ABSTRACT ............................................................................................................................. i ACKNOWLEDGEMENTS ................................................................................................... iiLIST OF APPENDED PAPERS .......................................................................................... vi DEFINITIONS AND ABBREVATIONS .......................................................................... viii 1. INTRODUCTION ............................................................................................................. 1
1.1 Whiplash Injuries ........................................................................................................ 1 1.2 Rear Impacts ................................................................................................................ 3 1.3 The Anatomy and Range of Motion of the Neck ........................................................ 8 1.4 Rear Impact Dynamic Response ............................................................................... 12 1.5 Injury Mechanisms and Injury Sites .......................................................................... 13 1.6 Injury Criteria and Thresholds................................................................................... 15 1.7 Whiplash Injury Protection Strategies ....................................................................... 17 1.8 Human Models Used for Rear Impact Tests ............................................................. 20 1.9 Anthropometry of the 50th Percentile Female ........................................................... 22 1.10 Dynamic Responses of Females and Males ............................................................. 24 1.11 Summary .................................................................................................................. 26
2. OBJECTIVES .................................................................................................................. 27 2.1 Papers I & III ............................................................................................................. 27 2.2 Paper II ...................................................................................................................... 27 2.3 Paper IV ..................................................................................................................... 27 2.4 Paper V ...................................................................................................................... 27
3. METHOD AND MATERIAL ......................................................................................... 28 3.1 Papers I & III ............................................................................................................. 28 3.2 Paper II ...................................................................................................................... 29 3.3 Paper IV ..................................................................................................................... 30 3.4 Paper V ...................................................................................................................... 31
4. RESULTS ......................................................................................................................... 34 4.1 Papers I–III ................................................................................................................ 34 4.2 Paper IV ..................................................................................................................... 40 4.3 Paper V ...................................................................................................................... 45
5. DISCUSSION ................................................................................................................... 48 5.1 Methods ..................................................................................................................... 49 5.2 Results ....................................................................................................................... 51
6. CONCLUSIONS .............................................................................................................. 57 REFERENCES ..................................................................................................................... 59 APPENDIX .......................................................................................................................... A1

- vi -
LIST OF APPENDED PAPERS
PAPER ILinder A, Carlsson A, Svensson MY, Siegmund GP (2008) Dynamic Responses of Female and Male Volunteers in Rear Impacts, Traffic Inj. Prev., Vol. 9, No. 6, pp. 592–599
Division of work between authors: Siegmund performed the volunteer test series during the late 1990´s and provided the data for further analysis. Linder and Svensson made the outline of this study, based on a subset of the volunteers from the first study. Carlsson made the analysis and the presentation of data. The paper was written by Linder and Carlsson, and was reviewed by all authors.
PAPER IICarlsson A, Linder A, Svensson MY, Davidsson J, Hell W (2011) Dynamic Responses of Female Volunteers in Rear Impacts and Comparison to Previous Male Volunteer Tests, Traffic Inj. Prev., Vol. 12, No. 4, pp. 347–357 Division of work between authors: Carlsson made the outline of this study with support of Linder and Svensson. Hell was responsible for the recruitment and medical examination of the female volunteers. Carlsson, Linder, Svensson, Davidsson, and Hell participated, partly or full time, during the tests. Davidsson provided the data from previous tests comprising male volunteers. Carlsson made the analysis and the presentation of data. The paper was written by Carlsson, and reviewed by all authors.
PAPER IIICarlsson A, Siegmund GP, Linder A, Svensson MY (2012) Motion of the Head and Neck of Female and Male Volunteers in Rear Impact Car-to-Car Impacts, accepted for publication in Traffic Inj. Prev. Division of work between authors: Siegmund performed the volunteer test series during the late 1990´s and provided the data for further analysis. Carlsson made the outline of this study with support of Linder and Svensson. Carlsson made the analysis and the presentation of data. The paper was written by Carlsson, and was reviewed by all authors.
PAPER IVCarlsson A, Chang F, Lemmen P, Kullgren A, Schmitt K-U, Linder A, Svensson MY (2012) EvaRID - A 50th Percentile Female Rear Impact Finite Element Dummy Model, prepared for journal submission. Division of work between authors: Carlsson, Chang, Lemmen, Linder, and Svensson made the outline of this study. Schmitt and Kullgren provided anthropometric data from insurance records; Carlsson made the analysis and presentation of data. Carlsson performed the literature review regarding the anthropometry and mass distribution of the 50th percentile female. Chang implemented the anthropometric data in the EvaRID V1.0 model. Carlsson provided data from rear impact tests comprising female volunteers (Paper II) for the evaluation of the model. Carlsson, Chang, Lemmen, and Svensson participated in discussions on how to improve the dummy model response. Carlsson analysed previously performed rear impact tests with the BioRID dummy. The paper was written by Carlsson, and reviewed by all authors.

- vii -
PAPER VCarlsson A, Davidsson J, Weber T, Schick S, Tomasch E, Schmitt K-U, Muser M, Kullgren A, Hell W, Linder A, Svensson MY (2012) Seatback Interaction of 50th Percentile Male and Female Occupant Sizes – Indicating a Need for a Female Rear Impact Dummy, prepared for journal submission. Division of work between authors: Tests with volunteers: Carlsson, Davidsson, Schick, Hell, Linder, and Svensson made the outline of the study. Schick was responsible for the recruitment and medical examination of the female volunteers. Carlsson, Schick, Hell, and Svensson participated, partly or throughout the volunteer tests. Carlsson made the analysis and the presentation of data. Tests with BioRID50F: Carlsson, Davidsson, Tomasch, Schmitt, Kullgren, and Svensson made the outline of the study. Kullgren was involved in the selection of seats for the test series. Svensson and Davidsson were responsible for the development of the BioRID50F dummy. Carlsson, Davidsson, Weber, Tomasch, Muser, Linder, and Svensson participated, partly or throughout the BioRID50F tests. Carlsson made the analysis and the presentation of data. The paper was written by Carlsson, and reviewed by all authors.
Conference Presentations of the Present Work Carlsson A, Linder A, Svensson MY, Siegmund GP. Dynamic Responses of Female and Male Volunteers in Rear Impacts. World Congress on Neck Pain; January 20–22, 2008; Los Angeles, CA
Carlsson A, Linder A, Svensson MY, Davidsson J, Schick S, Horion S, Hell W. Female Volunteer Motion in Rear Impact Sled Tests in Comparison to Results from Earlier Male Volunteer Tests, Proceedings IRCOBI Conference; September 17–19, 2008; Bern, Switzerland, pp. 365–366
Carlsson A. Dynamisk respons av kvinnor och män vid en upphinnandekollision.Transportforum, January 8–9, 2009; Linköping, Sweden
Carlsson A, Siegmund GP, Linder A, Svensson M. Motion of the Head and Neck of Female and Male Volunteers in Rear Impact Car-to-Car Tests at 4 and 8 km/h. Proceedings IRCOBI Conference; September 15–16, 2010; Hanover, Germany, pp. 29–39
Carlsson A. EvaRID: A 50th Percentile Female Rear Impact Dummy FE Model. 5th Inter-national Whiplash Trauma Congress; August 24–28, 2011; Lund, Sweden

- viii -
DEFINITIONS AND ABBREVATIONS
Anterior In front AROM Active Range Of Motion BioRID Biofidelic Low-Speed Rear Impact Dummy CSN Central Nervous System CFD Computational Fluid Dynamics Extension (of the neck) Rearward stretching (of the neck) Flexion (of the neck) Forward stretching (of the neck) GEBOD GEnerator of BODy (ergonomic software) Hybrid III A high-speed frontal impact dummy HR distance/contact Head-to-head restraint distance/contact Kyphosis Outward curvature of a portion of the spine Lordosis Inward curvature of a portion of the spine MRI Magnetic Resonance Imaging NHTSA National Highway Traffic Safety Administration NIC Neck Injury Criterion PMHS Post Mortem Human Subject (human cadaver) Posterior Behind/at the back of Protraction Head moved forward relative to the torso, with
no angular change RAMSIS Rechnergestütztes Anthropometrisch-
Mathematisches System zur Insassen-Simulation (ergonomic software)
Retraction Head moved rearward relative to the torso, with no angular change
RID3D Rear Impact Dummy version 3D SAHR Saab Active Head Restraint SD Standard Deviation T1 First thoracic vertebra THOR Test device for Human Occupant Restraint
(a high-speed frontal impact dummy) UMTRI University of Michigan Transportation Research
Institute WhiPS Volvo’s Whiplash Protection System WIL Toyota’s Whiplash Injury Lessening System

- ix -
To
Märta & Greta
This is for you …

- x -
- 1 -
1. INTRODUCTION
This thesis for the Degree of Doctor of Philosophy considers the dynamic responses of females and males induced by low-speed rear impacts. During this type of impact, the torso of the occupant is 1) pressed into the seatback and 2) pushed away from the seatback, while the head/neck is exposed to a whiplash type motion. Large loads can then arise in the fragile and complicated structures of the neck due to the head inertia, and result in so called whiplash injuries. Many different names are used for this type injury, for instance, Whiplash Associated Disorder (WAD), cervical spine injury, whiplash-type neck distortion, flexion-torsion neck injury, AIS1 neck injury, acute strain of the cervical spine, etc. Throughout this thesis, the most common definition is used: whiplash injury. The injury mechanisms are not fully understood since whiplash injuries are difficult to detect by using diagnostic tools such as X-rays or MRI (Magnetic Resonance Imaging). These injuries are classified as minor, although they can cause long-lasting pain and disability. The symptoms are well known, neck pain, stiffness, loss of sensation, memory impairment, and concentration difficulties to name a few.
The risk of whiplash injury is up to three times higher for females compared to males in similar crash conditions. However, when assessing vehicle safety, the only available occupant model for this impact scenario is a model of an average sized male. For males, significant progress in preventing whiplash injuries has been made due to dummy development and seat optimization. The need to establish the characteristics of the female response in rear impacts and implement the data in models for rear impact testing and evaluation is essential.
1.1 WHIPLASH INJURIESWhiplash injury resulting from vehicle impacts is of worldwide concern. From a societal perspective these injuries are costly since they are frequent and can lead to long-lasting pain and disability. In Europe, the annual cost of whiplash injuries has been estimated to 10 billion Euros (Richter et al. 2000). In Japan, 547,654 traffic related injuries were registered during 1996 in which 44 percent of the victims suffered neck injury (Watanabe et al. 2000). In the USA, the number of whiplash injuries each year has been estimated to 800,000. Of these whiplash injuries, 270,000 were resulting from rear impacts with an annual cost of $2.7 billion (NHTSA 2004). In Sweden (population 9 million), more than 30,000 whiplash injuries are reported following vehicle collisions annually and the associated socio-economic impact is approximately 0.4 billion Euros per annum (the Whiplash Commission 2005). Whiplash injuries account for approximately 70 percent of all injuries leading to disability in modern cars on the Swedish market (Kullgren et al. 2007).
Data from different parts of the world has shown that the risk and the number of whiplash injuries have steadily increased from the late 1960´s to the late 1990´s (Galasko et al. 1993; v. Koch et al. 1994; Ono & Kanno 1996; Hell et al. 1998; Temming & Zobel 1998; Richter et al. 2000; Morris & Thomas 1996). Table 1 summarises the findings from the studies.

- 2 -
Table 1. The increase of whiplash injuries between the late 1960´s and late 1990´s in different countries.
Country Reference Data Source Years Whiplash Injury Increase*)
From: To: Sweden von Koch et al. (1994) Insurance Company 1977 – 1991 19% 47%
Germany Hell et al. (1998) Insurance Company 1969 – 1990 20% 35% Temming & Zobel (1998) VW Accident Database 1987 – 1996 9% 17% Richter et al. (2000) Accident Research Team 1985 – 1997 10% >30%
Japan Ono & Kanno (1996) Insurance Company 1985 – 1991 44% 51%
UK Galasko et al. (1993) Hospital data 1982 – 1991 8% 46%
Morris & Thomas (1996) CCIS database 1984 – 1991 14% 10%
31% 18%
(females) (males)
*) The percentages given in the table have been calculated in different ways, it is not possible to compare the data from different references with each other.
In Germany the incidence of ‘cervical spine injuries’ (CSD) in motor vehicle accidents almost doubled from 1969 to 1990 (Figure 1a) (Hell et al. 1998). In the UK the ‘soft tissue injuries to the cervical spine’ increased from 8 percent 1982 to 46 percent in 1991 (Figure 1b) (Galasko et al. 1993). Morris and Thomas (1996) reported that the ’neck injury’ rates increased almost linearly over the years from 1984 to 1991 and that the increase was greater for the females compared to the males (Table 1).
Germany: Percentage of CSD injuries in Car Accidents per injured person
(all crash directions)Hell et al (1998)
0
10
20
30
40
1969 1974 1980 1990
Rat
e [%
]
20.326.9
29.535.0
UK: Neck Sprain after Road Traffic Accident
(all crash directions)Galasko et al (1993)
0
10
20
30
40
50
Feb 1982-
Feb 1983
Feb 1983-
Feb 1984
1 Jan 1988-
31 Dec 1988
1 Jan 1990-
30 June 1990
1 Nov 1990-
30 Nov 1991
Rat
e [%
]
Seat Belt Legislation
7.7
30.9
20.5
42.545.6
Figure 1. Whiplash injury rates for different years in a) Germany, and b) UK. Based on Hell et al. (1998) and Galasko et al. (1993).
Several factors contribute to the increase in whiplash injury risk and the number of whiplash injuries between the late 1960´s and the late 1990´s, for example:
- The seatbacks have increased up to 5.5-fold in strength from the 1960´s to the 1990´s in order to provide greater occupant retention in high-speed crashes (Viano 2008). The increase in strength has resulted in greater seat stiffness, i.e. an increased change in force during rearward occupant displacement. The boosted seat stiffness affects the interaction between the occupant and the seatback and may increase the forces on the neck.
- The improvements in vehicle construction (Delannoy & Diboine 2001) lead to a stronger and stiffer vehicle structure.
- Wearing seatbelts increases the whiplash injury risk (Deans et al. 1987; Otremski et al. 1989; Maag et al. 1990; Galasko et al. 1993). According to Galasko et al. (1993), the UK whiplash injury rate increased from 7.7 percent one year prior to the seatbelt legislation was implemented in February 1983, to 20.5 percent one year after the seatbelt legislation was implemented (Figure 1b). Deans et al. (1987) reported that >1 year after the crash, 34 percent of those who wore a seatbelt still experienced neck pain, while only 20 percent of those who had not worn a seatbelt still suffered neck pain.
a) b)
- 3 -
A small decrease in the long-term whiplash injury risk in rear impacts (from 15.5 percent to 13.6 percent) was found in cars manufactured after 1997 and equipped with standard seats (i.e. no advanced whiplash protection systems) in comparison to cars manufactured before 1997 (Kullgren et al. 2007). Cars equipped with advanced whiplash protection systems posed an approximately 50 percent lower risk of long-term whiplash injuries for the occupants in rear impacts than for occupants in cars manufactured after 1997 without whiplash protections systems installed (Kullgren et al. 2007). In frontal impacts, it was found that airbags in combination with seatbelt pretensioners reduce the number of whiplash injuries by 41 ±15 percent (Kullgren et al. 2000).
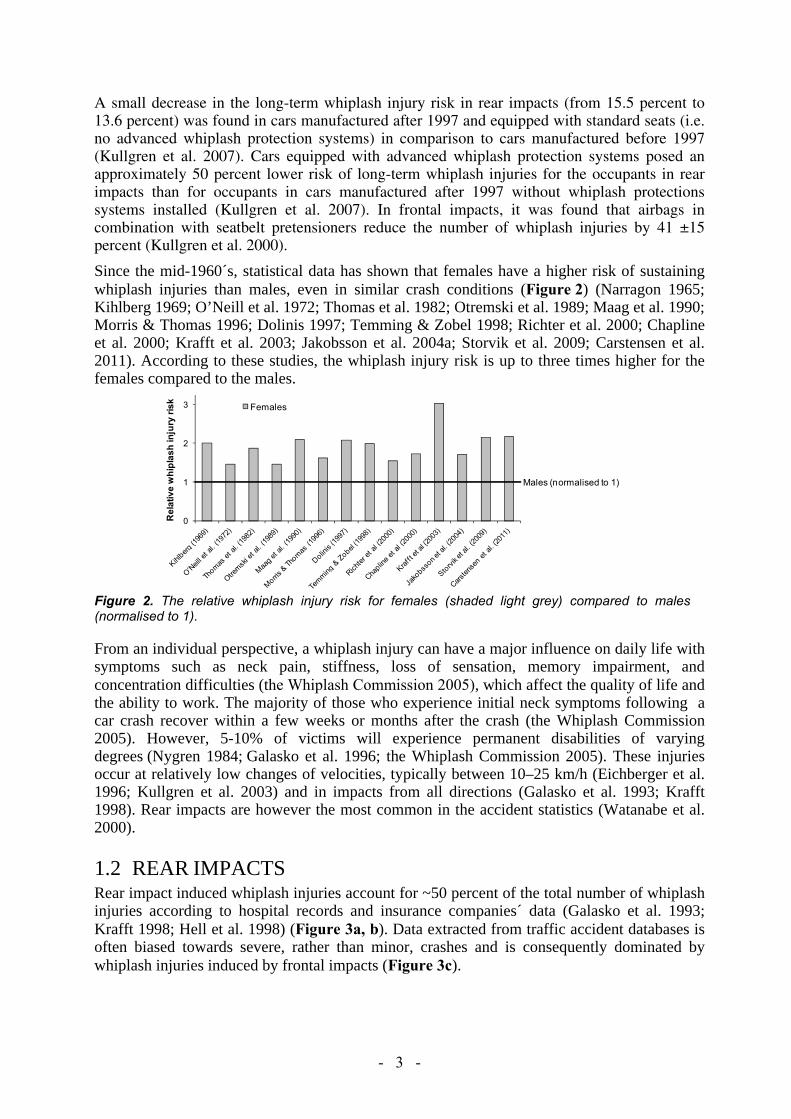
Since the mid-1960´s, statistical data has shown that females have a higher risk of sustaining whiplash injuries than males, even in similar crash conditions (Figure 2) (Narragon 1965; Kihlberg 1969; O’Neill et al. 1972; Thomas et al. 1982; Otremski et al. 1989; Maag et al. 1990; Morris & Thomas 1996; Dolinis 1997; Temming & Zobel 1998; Richter et al. 2000; Chapline et al. 2000; Krafft et al. 2003; Jakobsson et al. 2004a; Storvik et al. 2009; Carstensen et al. 2011). According to these studies, the whiplash injury risk is up to three times higher for the females compared to the males.
0
1
2
3
Rel
ativ
e w
hipl
ash
inju
ry ri
sk Females
Males (normalised to 1)
Figure 2. The relative whiplash injury risk for females (shaded light grey) compared to males (normalised to 1).
From an individual perspective, a whiplash injury can have a major influence on daily life with symptoms such as neck pain, stiffness, loss of sensation, memory impairment, and concentration difficulties (the Whiplash Commission 2005), which affect the quality of life and the ability to work. The majority of those who experience initial neck symptoms following a car crash recover within a few weeks or months after the crash (the Whiplash Commission 2005). However, 5-10% of victims will experience permanent disabilities of varying degrees (Nygren 1984; Galasko et al. 1996; the Whiplash Commission 2005). These injuries occur at relatively low changes of velocities, typically between 10–25 km/h (Eichberger et al. 1996; Kullgren et al. 2003) and in impacts from all directions (Galasko et al. 1993; Krafft 1998). Rear impacts are however the most common in the accident statistics (Watanabe et al. 2000).
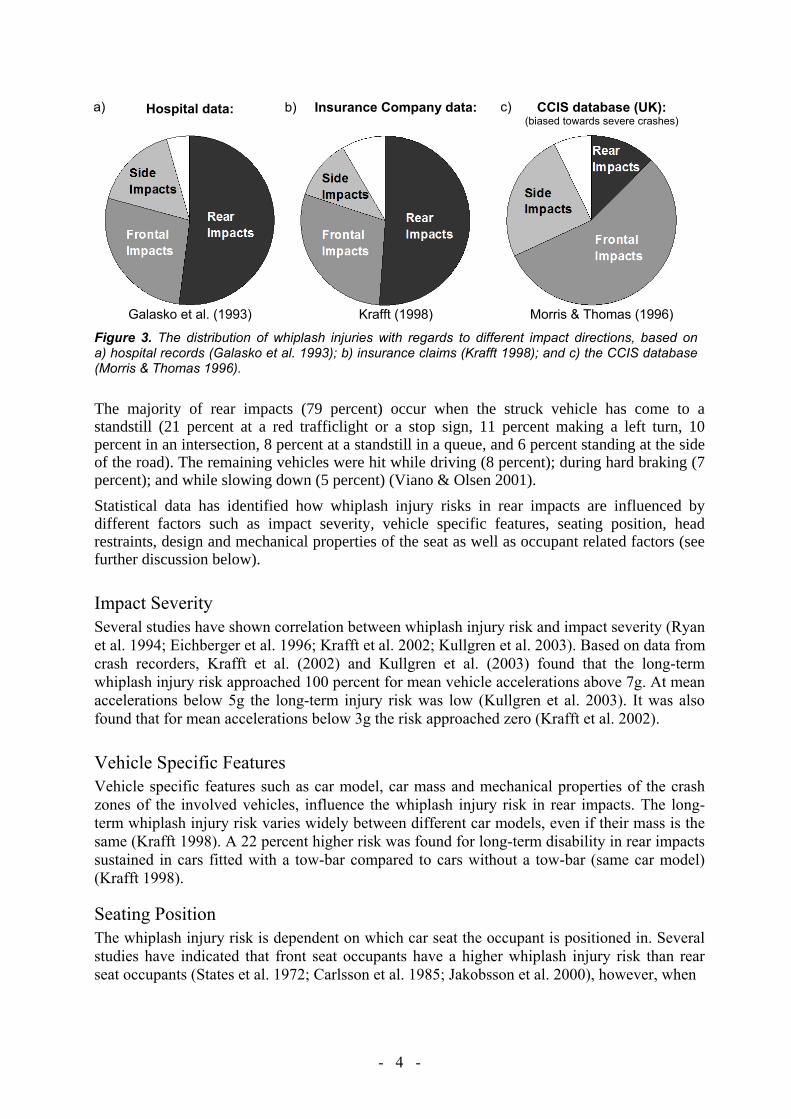
1.2 REAR IMPACTSRear impact induced whiplash injuries account for ~50 percent of the total number of whiplash injuries according to hospital records and insurance companies´ data (Galasko et al. 1993; Krafft 1998; Hell et al. 1998) (Figure 3a, b). Data extracted from traffic accident databases is often biased towards severe, rather than minor, crashes and is consequently dominated by whiplash injuries induced by frontal impacts (Figure 3c).
- 4 -
Hospital data: Insurance Company data: CCIS database (UK): (biased towards severe crashes)
Galasko et al. (1993) Krafft (1998) Morris & Thomas (1996)
Figure 3. The distribution of whiplash injuries with regards to different impact directions, based on a) hospital records (Galasko et al. 1993); b) insurance claims (Krafft 1998); and c) the CCIS database (Morris & Thomas 1996).
The majority of rear impacts (79 percent) occur when the struck vehicle has come to a standstill (21 percent at a red trafficlight or a stop sign, 11 percent making a left turn, 10 percent in an intersection, 8 percent at a standstill in a queue, and 6 percent standing at the side of the road). The remaining vehicles were hit while driving (8 percent); during hard braking (7 percent); and while slowing down (5 percent) (Viano & Olsen 2001).
Statistical data has identified how whiplash injury risks in rear impacts are influenced by different factors such as impact severity, vehicle specific features, seating position, head restraints, design and mechanical properties of the seat as well as occupant related factors (see further discussion below).
Impact Severity Several studies have shown correlation between whiplash injury risk and impact severity (Ryan et al. 1994; Eichberger et al. 1996; Krafft et al. 2002; Kullgren et al. 2003). Based on data from crash recorders, Krafft et al. (2002) and Kullgren et al. (2003) found that the long-term whiplash injury risk approached 100 percent for mean vehicle accelerations above 7g. At mean accelerations below 5g the long-term injury risk was low (Kullgren et al. 2003). It was also found that for mean accelerations below 3g the risk approached zero (Krafft et al. 2002).
Vehicle Specific Features Vehicle specific features such as car model, car mass and mechanical properties of the crash zones of the involved vehicles, influence the whiplash injury risk in rear impacts. The long-term whiplash injury risk varies widely between different car models, even if their mass is the same (Krafft 1998). A 22 percent higher risk was found for long-term disability in rear impacts sustained in cars fitted with a tow-bar compared to cars without a tow-bar (same car model) (Krafft 1998).
Seating Position The whiplash injury risk is dependent on which car seat the occupant is positioned in. Several studies have indicated that front seat occupants have a higher whiplash injury risk than rear seat occupants (States et al. 1972; Carlsson et al. 1985; Jakobsson et al. 2000), however, when
a) b) c)
- 5 -
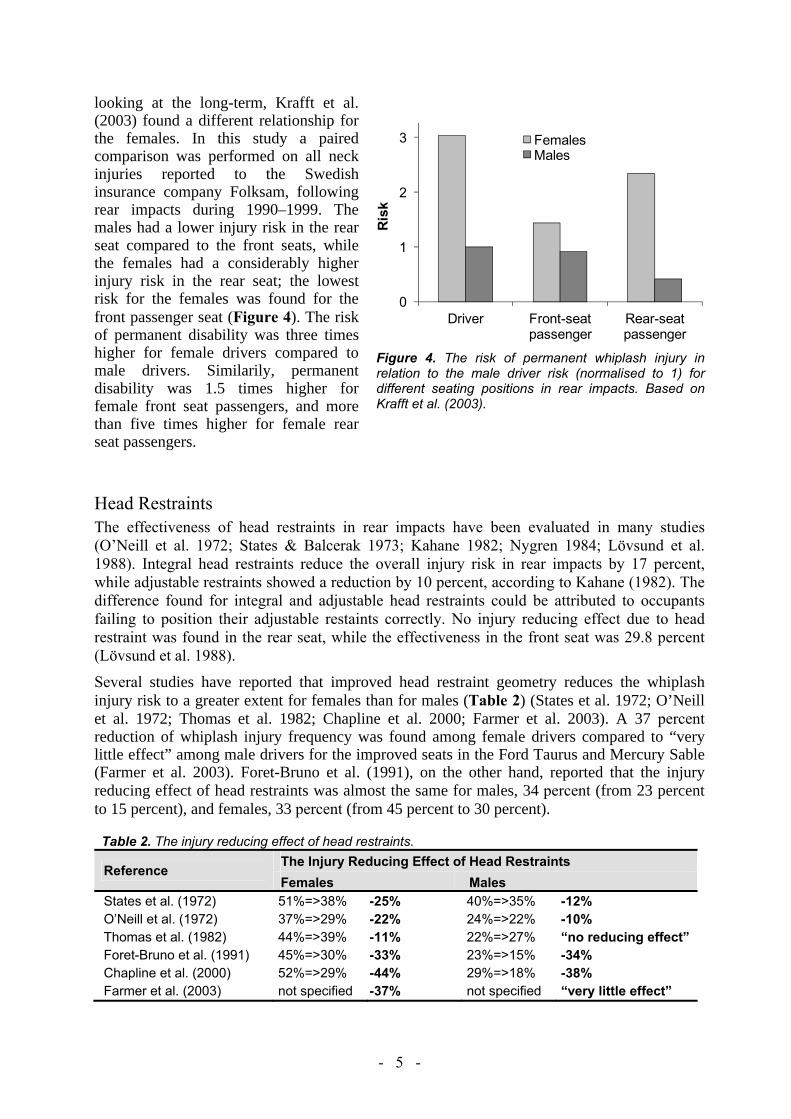
looking at the long-term, Krafft et al. (2003) found a different relationship for the females. In this study a paired comparison was performed on all neck injuries reported to the Swedish insurance company Folksam, following rear impacts during 1990–1999. Themales had a lower injury risk in the rear seat compared to the front seats, while the females had a considerably higher injury risk in the rear seat; the lowest risk for the females was found for the front passenger seat (Figure 4). The risk of permanent disability was three times higher for female drivers compared to male drivers. Similarily, permanent disability was 1.5 times higher for female front seat passengers, and more than five times higher for female rear seat passengers.
Head Restraints The effectiveness of head restraints in rear impacts have been evaluated in many studies (O’Neill et al. 1972; States & Balcerak 1973; Kahane 1982; Nygren 1984; Lövsund et al. 1988). Integral head restraints reduce the overall injury risk in rear impacts by 17 percent, while adjustable restraints showed a reduction by 10 percent, according to Kahane (1982). The difference found for integral and adjustable head restraints could be attributed to occupants failing to position their adjustable restaints correctly. No injury reducing effect due to head restraint was found in the rear seat, while the effectiveness in the front seat was 29.8 percent (Lövsund et al. 1988).
Several studies have reported that improved head restraint geometry reduces the whiplash injury risk to a greater extent for females than for males (Table 2) (States et al. 1972; O’Neill et al. 1972; Thomas et al. 1982; Chapline et al. 2000; Farmer et al. 2003). A 37 percentreduction of whiplash injury frequency was found among female drivers compared to “very little effect” among male drivers for the improved seats in the Ford Taurus and Mercury Sable (Farmer et al. 2003). Foret-Bruno et al. (1991), on the other hand, reported that the injury reducing effect of head restraints was almost the same for males, 34 percent (from 23 percent to 15 percent), and females, 33 percent (from 45 percent to 30 percent).
Table 2. The injury reducing effect of head restraints.
Reference The Injury Reducing Effect of Head Restraints Females Males
States et al. (1972) 51%=>38% -25% 40%=>35% -12% O’Neill et al. (1972) 37%=>29% -22% 24%=>22% -10% Thomas et al. (1982) 44%=>39% -11% 22%=>27% “no reducing effect” Foret-Bruno et al. (1991) 45%=>30% -33% 23%=>15% -34% Chapline et al. (2000) 52%=>29% -44% 29%=>18% -38% Farmer et al. (2003) not specified -37% not specified “very little effect”
0
1
2
3
Driver Front-seat passenger
Rear-seat passenger
Ris
k
FemalesMales
Figure 4. The risk of permanent whiplash injury in relation to the male driver risk (normalised to 1) for different seating positions in rear impacts. Based on Krafft et al. (2003).

- 6 -
Increased head-to-head restraint (HR) distance has been reported to be associated with increased whiplash injury risk (Carlsson et al 1985; Nygren et al. 1985; Olsson et al. 1990; Deutcher 1996; Farmer et al 1999; Jakobsson et al. 2004b). A head restraint located less than 10 cm from the back of the head was found to be more beneficial with regards to whiplash injury outcome compared to a HR distance greater than 10 cm. Based on mathematical simulations, Stemper et al. (2006) suggested limiting the HR distance to less than 6 cm, either passively or actively after impact, further whiplash injury reduction may be accomplished. In contrast, Chapline et al. (2000) reported that the horizontal distance was not a significant factor in relation to neck pain, on the contrary, it was the height of the head restraint that was the primary factor related to head restraint effectiveness, especially for females (Figure 5). Although it was not statistically significant for male drivers, the percentages of both female and male drivers reporting neck pain increased as the position of the head restraint further decreased below the head’s center of gravity.
0%
10%
20%
30%
40%
50%
60%
70%
Adequate Poor >10 cm, 16 cm
Poor >16 cm
Rea
r-stru
ck d
river
s w
ith n
eck
pain
Vertical head restraint position
FemalesMales
Figure 5. Percentage of rear-struck drivers with neck pain by vertical head restraint position (distance between the centre of gravity of the head and the top of the head restraint). Based on Chapline at al. (2000).
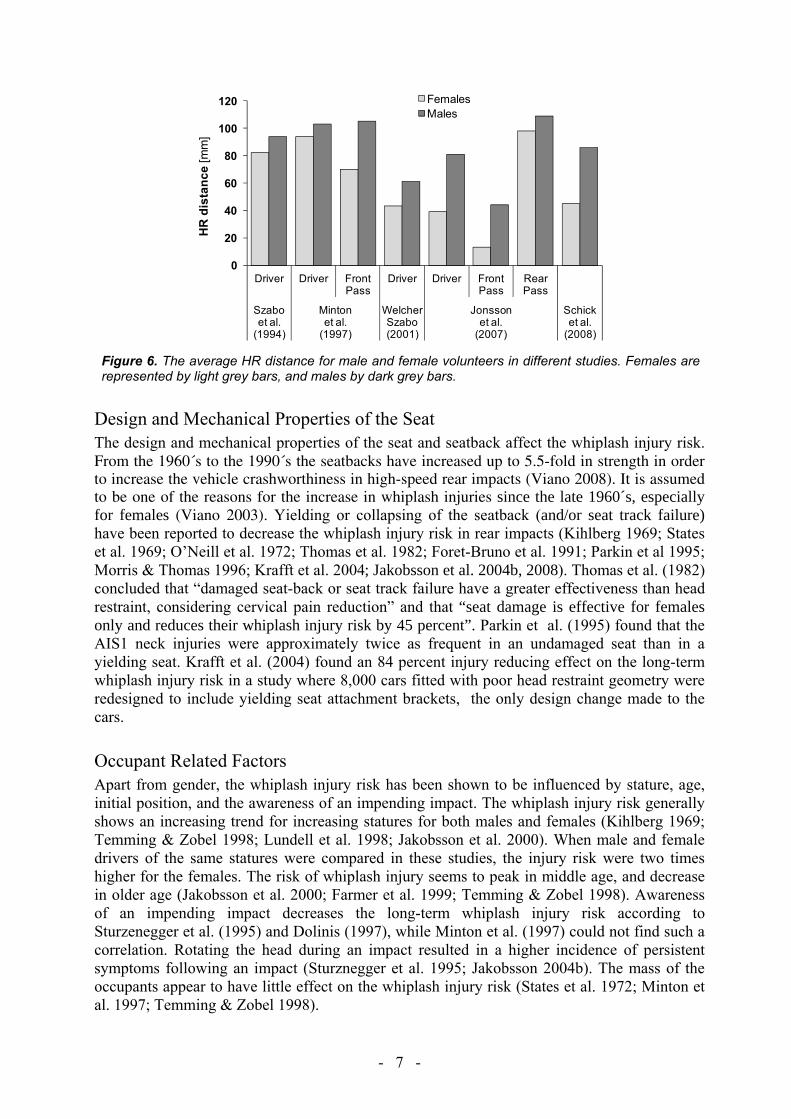
Females tend to be positioned closer to the head restraint than males, based on measurements in stationary conditions (Szabo et al. 1994 (estimation from graph); Minton et al. 1997; Hell et al. 1999; Welcher & Szabo 2001 (estimation from graph); Jonsson et al. 2007; Schick et al. 2008), and the distance depends on the seating position (Jonsson et al. 2007). The average HR distance for males and females in these studies are summarised in Figure 6. Jonsson et al. (2008b) found that the HR distance increased on average ~4 cm for female as well as for male volunteers while driving the vehicle in comparison to the distance measured in a stationary vehicle. Cullen et al. (1996), on the other hand, did not find any significant difference in HR distance for males and females during driving. In this study vehicle occupants were filmed when the vehicles passed rigged cameras and the HR distance was estimated based on film analysis.
- 7 -
0
20
40
60
80
100
120
Driver Driver Front Pass
Driver Driver Front Pass
Rear Pass
Szaboet al.
(1994)
Mintonet al.
(1997)
Welcher Szabo (2001)
Jonssonet al.
(2007)
Schicket al.
(2008)
HR
dis
tanc
e [m
m]
FemalesMales
Figure 6. The average HR distance for male and female volunteers in different studies. Females are represented by light grey bars, and males by dark grey bars.
Design and Mechanical Properties of the Seat The design and mechanical properties of the seat and seatback affect the whiplash injury risk. From the 1960´s to the 1990´s the seatbacks have increased up to 5.5-fold in strength in order to increase the vehicle crashworthiness in high-speed rear impacts (Viano 2008). It is assumed to be one of the reasons for the increase in whiplash injuries since the late 1960´s, especially for females (Viano 2003). Yielding or collapsing of the seatback (and/or seat track failure) have been reported to decrease the whiplash injury risk in rear impacts (Kihlberg 1969; States et al. 1969; O’Neill et al. 1972; Thomas et al. 1982; Foret-Bruno et al. 1991; Parkin et al 1995; Morris & Thomas 1996; Krafft et al. 2004; Jakobsson et al. 2004b, 2008). Thomas et al. (1982) concluded that “damaged seat-back or seat track failure have a greater effectiveness than head restraint, considering cervical pain reduction” and that “seat damage is effective for females only and reduces their whiplash injury risk by 45 percent”. Parkin et al. (1995) found that the AIS1 neck injuries were approximately twice as frequent in an undamaged seat than in a yielding seat. Krafft et al. (2004) found an 84 percent injury reducing effect on the long-term whiplash injury risk in a study where 8,000 cars fitted with poor head restraint geometry were redesigned to include yielding seat attachment brackets, the only design change made to the cars.
Occupant Related Factors Apart from gender, the whiplash injury risk has been shown to be influenced by stature, age, initial position, and the awareness of an impending impact. The whiplash injury risk generally shows an increasing trend for increasing statures for both males and females (Kihlberg 1969; Temming & Zobel 1998; Lundell et al. 1998; Jakobsson et al. 2000). When male and female drivers of the same statures were compared in these studies, the injury risk were two times higher for the females. The risk of whiplash injury seems to peak in middle age, and decrease in older age (Jakobsson et al. 2000; Farmer et al. 1999; Temming & Zobel 1998). Awareness of an impending impact decreases the long-term whiplash injury risk according to Sturzenegger et al. (1995) and Dolinis (1997), while Minton et al. (1997) could not find such a correlation. Rotating the head during an impact resulted in a higher incidence of persistent symptoms following an impact (Sturznegger et al. 1995; Jakobsson 2004b). The mass of the occupants appear to have little effect on the whiplash injury risk (States et al. 1972; Minton et al. 1997; Temming & Zobel 1998).

- 8 -
1.3 THE ANATOMY AND RANGE OF MOTION OF THE NECKThe spine – or the vertebral column – is formed by a series of bones; the vertebrae (Figure 7). The vertebrae are grouped under the names cervical, thoracic, lumbar, sacral, and coccygeal spine according to the regions of the spine they occupy. The neck – or the cervical spine – is formed by seven vertebrae, denoted C1–C7. The topmost vertebra, C1 (atlas), together with the vertebra immediately beneath, C2 (axis), forms the joint connecting the spine to the occipital bone of the skull. The cervical spine is relatively mobile compared to other parts of the spine, but the movement of rotating the head to left and right occur almost entirely at the C1–C2 joint; the atlanto-axial joint. Similarily, the action of tilting the head take place predominantly at the joint between C1 and the occipital bone; the atlanto-occipital joint. The undersurface facets of the occipital bone is called the occipital condyles (OC).
The majority of the vertabrae consist of a front segment – the vertebral body – and a rear segment – the vertebral arch – which enclose the vertebral foramen. The two topmost cervical vertebrae, C1 and C2, have a somewhat different structure in order to increase the range of motion of the head. The spinous and transverse processes serve as attachment points for muscles and ligaments. These muscles and ligaments account for stability and movement, especially of the head and the neck (Schmitt et al. 2004). When the vertebraes articulate with each other, the bodies form a pillar supporting the head and the vertebral foramen constitute a canal for the protection of the vulnerable spinal cord. Cervical vertebrae contain transverse foramina to allow the vertebral arteries to pass through on their way to the foramen magnum, finally ending in the circle of Willis – a circle of arteries that supply blood to the brain.There are two facet joints between each pair of cervical vertebrae from C2 to C7. The facet joint is a synovial joint enclosed by a thin, loose ligament known as the facet capsule (Siegmund et al. 2009). Adjacent vertebrae are separated by intervertebral discs. Differences in the anatomy and physiology of the neck have been reported for males and females, which may contribute to the higher whiplash injury risk for females. For example, it has been reported that: - the female neck muscles have a lower strength than male neck muscles (Vasavada et al. 2001;
Vasavada et al. 2008; Foust et al. 1973). Vasavada et al. (2001) reported, based on measurements on 11 males and 5 females, that the males had 2–2.5 times greater moment-generating muscle capacity than the females. Vasavada et al. (2008) studied differences in head and neck geometry and neck strength in 14 pairs of male and female subjects matched for standing height and neck length. It was found that female necks had significantly lower strength than male necks; 20 percent lower in extension and 32 percent lower in flexion. They also concluded that the females had 33 percent more head mass per unit neck muscle area
Figure 7. a) Human cervical spine segment. b) Human cervical spine vertebra. Pictures courtesy of Wikimedia.

- 9 -
than equivalent sized males. Foust et al. (1973) found that the average neck flexor and extensor muscle strength in males is greater than that in females in each age and stature group. Females tend to decrease gradually in neck strength throughout their lives, while males are often stronger at middle age than they were when young (Figure 8).
0
50
100
150
200
18-24 35-44 62-74
Nec
k m
uscl
e st
reng
th [N
]
Age [years]
FemaleMale
NECK FLEXOR MUSCLES
0
50
100
150
200
18-24 35-44 62-74
Nec
k m
uscl
e st
reng
th [N
]
Age [years]
FemaleMale
NECK EXTENSOR MUSCLES
Figure 8. The strength of a) flexor b) extensor neck muscles in degrees for females (shaded light grey) and males (shaded dark grey) of the same size, for different age categories, based on Foust et al. (1973).
- females have faster reacting neck muscle reflexes than males (Foust et al. 1973, Siegmund et al. 2003). Foust et al. (1973) stated that “…on average, females reflex about 11% faster than males, but are only 60% as strong”.
- females have smaller neck circumference (Vasavada et al. 2001), and more slender necks than males (Vasavada et al. 2008).
- females have smaller necks relative to the head size (1:151) compared to males (1:135) (States et al. 1972) (ratio = head circumference3/neck circumference2).
- females have smaller vertebral dimensions than males (DeSantis Klinich et al. 2004; Stemper et al. 2008; Vasavada et al. 2008). DeSantis Klinich et al. (2004) concluded that ‘‘there are differences in vertebral size associated with gender that do not solely result from the stature differences between men and women.’’ Stemper et al. (2008) performed computed tomography scans of the cervical spine on equivalently sized young healthy male and female volunteers. Geometrical dimensions were obtained at the C4 level. It was found that all geometrical measures were greater in males. Vertebral width and disc-facet depth were significantly greater in males. Additionally, segmental support area, combining interfacet width and disc-facet depth, was greater in males, indicating more stable intervertebral coupling. Vasavada et al. (2008) reported similar results in their study.
- females and males have different neck motion ranges (pages 10–11). - females have decreased collagen content and increased elastin content in lumbar ligaments
compared to males (Osakabe et al. 2001). Differences in structural components of the ligament may lead to decreased stiffness in female spines (cited from Stemper et al. 2008). Nightingale et al. (2007) found that ”the male upper cervical spine was significantly stiffer than the female and significantly stronger than the female in flexion”.
- female tolerance limits for lower neck shear force (384 N) is considerable lower than male tolerance limits (636 N) (Stemper et al. 2007).
- females have a narrower spinal canal than males (Pettersson et al. 1995; Tatarek 2005). In the study by Pettersson et al. (1995) it was found that the spinal canal was significantly smaller in whiplash patients with persistent symptoms. Differences were found between males and females; the spinal canal was significantly narrower for the females. Tatarek (2005) found that females had a narrower spinal canal compared to males based on measurements of the sagittal and transverse diameters of the cervical canal in skeletons.

- 10 -
For more detailed reviews of the anatomical and physiological differences of the neck for males and females, see Mordaka (2004), Vasavada et al. (2008), and Stemper et al. (2008).
Extension The shape of the neck that occurs when the head is angled rearwards relative to the torso is called an extension of the neck (Figure 9). In a study by Youdas et al. (1992) it was found that the Active Range of Motion (AROM) of neck extension was largest for young people, and that the AROM of neck extension was decreasing as the age increased (Figure 11a). At 11-19 years of age the AROM of neck extension was ~85° from the neutral position, while at 80-89 years of age it was reduced to ~50° from the neutral position. The females had a significantly larger AROM of neck extension at 20-69 years of age compared to the males. The most pronounced difference was found at 40-49 years of age, with a 24 percent greater AROM of neck extension for the females (Figure 11a).
Flexion The shape of the neck that occurs when the head is angled forward relative to the torso is called a flexion of the neck (Figure 10). The neck flexion motion is normally limited by the chest. In a study by Youdas et al. (1992), the neck flexion was found to be significantly associated with age, but the annual rate of loss and the number of degrees of AROM at a given age were not found to differ for male and female subjects. For male and female test subjects of the same age, the AROM of neck flexion was estimated to be the same (Figure 11b). Seacrist et al. (2009), on the other hand, found a statistically significant increase in the cervical spine flexion angle in adult females compared to adult males. A decrease in flexion angle was also found for increasing age in that study.
40
45
50
55
60
65
70
75
80
85
90
11-19 20-29 30-39 40-49 50-59 60-69 70-79 80-89 90-97
Age [years]
Act
ive
Ran
ge o
f Mot
ion
[deg
rees
]
FemalesMales
EXTENSION
20
25
30
35
40
45
50
55
60
65
70
11-19 20-29 30-39 40-49 50-59 60-69 70-79 80-89 90-97
Age [years]
Act
ive
Ran
ge o
f Mot
ion
[deg
rees
]
Females and Males
FLEXION
Figure 11. a) The AROM of neck extension (in degrees) for females and males for different age categories. b) The AROM of neck flexion in degrees for females and males for different age categories. Based on Youdas et al. (1992). Females are represented by light grey pillars and males by dark grey bars.
a) b)
Figure 9. Extension of the neck. Adapted from Linder (2001).
Figure 10. Flexion of the neck. Adapted from Linder (2001).

- 11 -
Retraction The shape of the neck that occurs when the head is moved rearward relative to the torso, with no angular change, is called a retraction of the neck (Figure 12). The upper part of the neck is flexed and the lower part is extended during a retraction, which results in an S-curvature of the neck.
In static tests, Jonsson (2007) did not find any significant differences between males and females in cervical retraction capacity.
In dynamic tests, a more pronounced S-curved shape of the neck for females compared to males have been reported (Stemper et al. 2003; Ono et al. 2006). Stemper et al. (2003) performed rear impact tests comprising ten intact PMHS head–neck complexes (5 males, 5 females) and the intervertebral kinematics were analysed as a function of spinal level at the time of maximum cervical S-curvature. Segmental angles were significantly greater in female specimens at C2–C3, C4–C5, C5–C6, and C6–C7 levels. In the study by Ono et al. (2006) six human volunteers (4 males, 2 females) were subjected to rear impacts at 6 km/h. The dynamic response of the neck was monitored by a high speed x-ray camera. The cervical vertebral rotation angle of females was higher than that of the males, and the females´ cervical spine exhibited a more significant S-curved deformation.
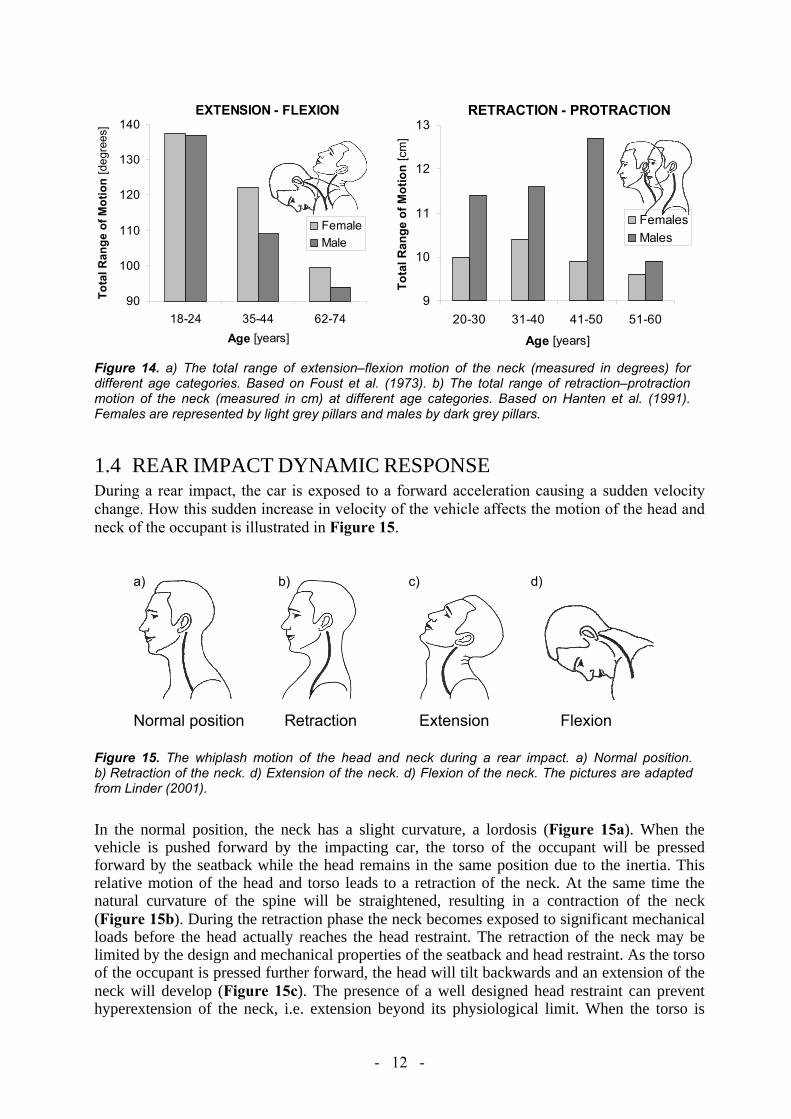
Total Range of Motion The total range of extension–flexion motion (Figures 9–10) is greater for females compared to males (Buck et al. 1959; Foust et al. 1973). Buck et al. (1959) reported that the total range of extension–flexion motion was 150° for 18–23 years old females, while is was 139° for males in the same age group. Foust et al. (1973) studied the total range of extension–flexion motion for males and females with regards to age (Figure 14a). Age had a pronounced effect, but the females tended to lose mobility gradually throughout their lives, while the males deteriorated more rapidly between youth and middle age than they did later in life.
The total range of retraction–protraction motion (Figures 12–13) is less for females compared to males in seated posture (Hanten et al. 1991; Hanten et al. 2000). Hanten et al. (1991) studied the total range of retraction–protraction motion for males and females with regards to age (Figure 14b). For the males, the range of motion increased until 50 years of age before it started to decrease, while for the females the range of motion had a small increase until 40 years of age before the decrease started. According to Hanten et al. (2000) the total range of motion was 10.0 cm for females, and 12.8 cm for males. It is unclear whether the greater motion range for the males was due to differences in stature/size between the males and females in these studies.
Hanten et al. (1991) reported that within their available retraction–protraction excursion range, females held their heads in a more forward position. Mean percentage distance from retracted to resting head postion was 47 percent for females and 43 percent for males. Similar results were found in Hanten et al. (2000) with 43.4 percent for the females and 39.5 percent for the males.
Figure 13. Protraction of the neck. Adapted from Linder (2001).
Figure 12. Retraction of the neck.Adapted from Linder (2001).
- 12 -
1.4 REAR IMPACT DYNAMIC RESPONSEDuring a rear impact, the car is exposed to a forward acceleration causing a sudden velocity change. How this sudden increase in velocity of the vehicle affects the motion of the head and neck of the occupant is illustrated in Figure 15.
Figure 15. The whiplash motion of the head and neck during a rear impact. a) Normal position. b) Retraction of the neck. d) Extension of the neck. d) Flexion of the neck. The pictures are adapted from Linder (2001).
In the normal position, the neck has a slight curvature, a lordosis (Figure 15a). When the vehicle is pushed forward by the impacting car, the torso of the occupant will be pressed forward by the seatback while the head remains in the same position due to the inertia. This relative motion of the head and torso leads to a retraction of the neck. At the same time the natural curvature of the spine will be straightened, resulting in a contraction of the neck (Figure 15b). During the retraction phase the neck becomes exposed to significant mechanical loads before the head actually reaches the head restraint. The retraction of the neck may be limited by the design and mechanical properties of the seatback and head restraint. As the torso of the occupant is pressed further forward, the head will tilt backwards and an extension of the neck will develop (Figure 15c). The presence of a well designed head restraint can prevent hyperextension of the neck, i.e. extension beyond its physiological limit. When the torso is
90
100
110
120
130
140
18-24 35-44 62-74Age [years]
Tota
l Ran
ge o
f Mot
ion
[deg
rees
]
FemaleMale
EXTENSION - FLEXION
9
10
11
12
13
20-30 31-40 41-50 51-60
Age [years]
Tota
l Ran
ge o
f Mot
ion
[cm
]
FemalesMales
RETRACTION - PROTRACTION
Figure 14. a) The total range of extension–flexion motion of the neck (measured in degrees) for different age categories. Based on Foust et al. (1973). b) The total range of retraction–protraction motion of the neck (measured in cm) at different age categories. Based on Hanten et al. (1991). Females are represented by light grey pillars and males by dark grey pillars.
a) b) c) d) Normal position Retraction Extension Flexion

- 13 -
pushed away from the seatback, the neck may be exposed to additional loads if the head lags behind. The forward motion of the torso is stopped by the seat belt, but the head will continue forward, resulting in flexion of the neck (Figure 15d).
The acceleration of the body parts can exceed the acceleration of the vehicle (Severy et al. 1955; Eichberger et al. 1996; Szabo & Welcher 1996 among others). Figure 16 shows an example from a volunteer test at 8 km/h (Siegmund et al. 1997). In this test the head acceleration was more than two times greater than the vehicle acceleration. Typically, there is a delay between the acceleration of the vehicle and the subsequent acceleration of the T1 and head. The vehicle acceleration starts first, then the T1 acceleration, and finally the head acceleration, depending on the interaction of the head and torso with the head restraint and seatback.
0
20
40
60
80
0 50 100 150 200Time [ms]
Vehicle T1
Head
X-ac
cele
ratio
n [m
/s2 ]
Figure 16. The acceleration of the vehicle, T1, and head during a volunteer test in 8 km/h (Siegmund et al. 1997).
1.5 INJURY MECHANISMS AND INJURY SITESThe term ‘whiplash’ is a description of the head/neck motion that causes neck injury, but is often used as a vague diagnosis for ‘injury in the neck region’. Since whiplash injuries are located in the soft tissues of the neck, it is not possible to detect them by using diagnostic tools like X-rays or Magnetic Resonance Imaging (MRI). Due to the complicated structures of the neck, it is therefore difficult to decide the location of the injury and the cause of the symptoms.
There are several different theories for the injury sites and the injury mechanisms, Figure 17.Possible injury sites may be facet joint, disc, muscle, ligament, artery, Central Nervous System (CSN), or dorsal nerve root ganglion, while the injury mechanisms may be abnormal vertebra motion, excessive neck loads, local hyperextension/flexion, or pressure pulses in the spinal canal.

- 14 -
Figure 17. Examples of possible injury sites and injury mechanisms. Based on lecture notes by Johan Davidsson, Chalmers University of Technology, Sweden.
An early whiplash injury theory for rear impacts was hyperextension of the neck (Figure 15c).Since the injury reducing effect of head restraints was limited (Page 5), the research focus was shifted from neck hyperextension towards other possible injury mechanisms, mainly during the retraction (S-curvature) phase (Figure 15b). When the neck exceeds the physiological limit of retraction during rear impacts, the neck becomes exposed to significant mechanical loads. Since many head restraints were positioned too far behind the back of the head to prevent the neck from reaching maximum retraction, this was a possible explanation why head restraints did not offer better neck injury reducing effect. Studies supporting this theory have been reported, for instance, Mertz & Patrick (1971) reported a study comprising one volunteer exposed to substantial velocity changes and accelerations in several tests without suffering serious whiplash symptoms. This was possible due to the volunteers being in contact with the seatback and head restraint from the beginning of the tests so that the retraction motion was minimised. Deng et al. (2000) performed rear impact PMHS tests using a high-speed X-ray to obtain cervical vertebral motions. Substantial facet joint strains were found before the head contacted the head restraint. Aldman (1986) suggested that whiplash injuries may be caused by transient pressure gradients induced between the inside and outside of the spinal canal due to the rapid motion changes of the head/neck during an impact. These pressure gradients may directly load the spinal nerve roots, potentially leading to whiplash-related symptoms like neck pain, headache, vertigo, blurred vision, and neurological symptoms in the upper extremities. Biological tests performed by Svensson et al. (1993a) and Örtengren et al (1996) supported this theory. Using Computational Fluid Dynamics (CFD) modelling, transient pressure patterns from earlier whiplash experiments on animals and PMHSs were simulated with a suitable selection of the model flow properties (Svensson et al. 2009).
Two injury mechanisms of the facet joint have been proposed; pinching of the synovial fold (Ono et al. 1997; Kaneoka et al. 1999), and excessive strain of the capsule (Luan et al. 2000; Pearson et al. 2004). There are strong clinical evidence of facet-mediated neck pain (Barnsley et al. 1993; Bogduk & Marsland 1988; Aprill & Bogduk 1992) and Barnsley et al. (1994) claimed that cervical facet joints are the most common source of neck pain. Injuries to the neck ligaments and intervertebral discs in addition to the facet joints have been documented by MRI
SymptomsFacet joint
?
Disc?
Muscle?
Ligament?
Artery? CSN
?Dorsal
nerve root ganglion
?
?
Abnormal vertebra motion
?
Excessiveneckloads
?
Localhyperextension/
flexion?
Pressurepulses in thespinal canal
?
?? ?
??
SymptomsSymptomsFacet joint
?
Disc?
Muscle?
Ligament?
Artery? CSN
?Dorsal
nerve root ganglion
?
?
Abnormal vertebra motion
?
Excessiveneckloads
?
Localhyperextension/
flexion?
Pressurepulses in thespinal canal
?
?? ?
??

- 15 -
scans and autopsy studies in patients suffering whiplash (Jonsson et al. 1991; Kaale et al. 2005). Ligament injuries may cause acute neck pain and lead to chronic spinal instability (Siegmund et al. 2009). Subfailure injuries of ligaments (spinal ligaments, disc annulus and facet capsules) may cause chronic back pain due to muscle control dysfunction (Panjabi 2006). Altered blood flow due to spasm and/or narrowing of vertebral arteries in whiplash patients have been associated with chronic symptoms like headache, blurred vision, tinnitus, dizziness, and vertigo (Seric et al. 2000; Reddy et al. 2002; Linnman et al. 2009). Symptoms radiating from muscles are common among patients suffering whiplash. It was suggested by Siegmund et al. (2009), that direct muscle injury may not be responsible for chronic whiplash pain, but may play an indirect role in modulating pain caused by injuries to other structures. Neck muscles potentially interact with other anatomical sites of whiplash injury in at least three ways: (1) neck muscles attach directly to the facet capsule, which has been implicated in chronic pain following whiplash; (2) neck muscle activation indirectly affects the loads and strains in other anatomical structures; and (3) altered neuromuscular control may contribute to chronic pain via elevated and inapproprate muscle activation (Siegmund et al. 2009).
For a detailed review on the theories of whiplash injury sites and mechanisms, see Siegmund et al. (2009).
1.6 INJURY CRITERIA AND THRESHOLDS An injury criterion is a function of physical parameters that can be measured in a crash test dummy, for instance, and that correlates with risk of injury for a certain body region. Generally, injury criteria are proposed and validated, based on experimental studies and they are important tools for research, development, and evaluation of safety systems. Here follows a brief summary of the proposed neck injury criterion. For a more detailed description, see Schmitt et al. (2004).
The Neck Injury Criterion (NIC) The Neck Injury Criterion (NIC) was proposed by Boström et al. (1996) and is based on the pressure gradient hypothesis formulated by Aldman (1986), and on the biological experiments by Svensson et al. (1993a) and Örtengren et al (1996). The NIC is calculated as
22.0 relrel vaNIC += Eq. (1)
where arel is the relative horizontal acceleration between T1 and the occipital joint and vrel is the horizontal velocity between T1 and the occipital joint. The NIC value is intended to be calculated at maximum retraction. In Boström et al. (2000) the NICmax was proposed, which is the peak NIC value during the first 150 ms. The NIC formulated to be used for the Hybrid III dummy is denoted NIC50. The tolerance level for NIC, NICmax, and NIC50 is 15 m2/s2.
Based on real-life accidents with crash recorders, in combination with mathematical simulations, Kullgren et al. (2003) found that NICmax is applicable to predict risk of whiplash injury when using a BioRID dummy. For NIC=15 a ~20 percent risk of neck injury lasting more than 1 month was reported. Linder et al. (2004) reconstructed real-world rear impact crashes using sled tests with known injury outcomes in terms of neck injury symptoms of front seat occupants. The results indicated that the risk for whiplash symptoms persisting more than one month was less than 10 percent for NICmax<16.7.

- 16 -
The Nij Criterion The Nij injury criterion was proposed by the US National Highway Traffic Safety Administration (NHTSA) to assess severe neck injuries in frontal impacts, including those with airbag deployment (DeSantis Klinch et al. 1996; Kleinberger et al. 1998). It combines the effects of force and moment measured at the occipital condyles and is based on both the tolerance levels for axial compression and bending moment. The Nij criterion is calculated by:
int
y
int
z
MM
FFNij += Eq. (2)
where Fz represents the axial force and My represents the flexion/extension bending moment. Fint and Mint are critical intercept values for the force and the moment, respectively. The intercept values for the 50th percentile Hybrid III male are proposed to be Fint (tension) = Fint (compression) = 4,500 N, Mint (tension) = 310 Nm, Mint (extension) = 125 Nm. Different intercept values are used for other dummy sizes. Four different load cases can be obtained; Nte for tension and extension, Ntf for tension and flexion, Nce for compression and extension, and Ncf for compression and flexion. An injury threshold value of 1.0 applies for each load case (Schmitt et al. 2004).
The Nkm Criterion The Nkm criterion (Schmitt et al. 2002) was derived to assess neck injuries in rear impacts. It is based on the Nij criterion, and combines moments and shear forces. The Nkm criterion is calculated by
int
y
int
x
MM
FFNkm += Eq. (3)
where Fx represents the shear force and My the flexion/extension bending moment obtained from the upper neck load cell. Fint and Mint are critical intercept values for the force and the moment, respectively. The intercept values are Fint (anterior) = Fint (posterior) = 845 N, Mint (flexion) = 88.1 Nm, Mint (extension) = 47.5 Nm (Schmitt et al. 2002). Four different load cases can be obtained; Nfa for flexion and anterior (positive) x-direction, Nfp for flexion and posterior (negative) x-direction, Nea for extension and (positive) x-direction, and Nep for extension and posterior (negative) x-direction. An injury threshold value of 1.0 applies for each load case. Based on real-life accidents with crash recorders in combination with mathematical simulations, Kullgren et al. (2003) found that Nkm is applicable when predicting whiplash injury risk whilst using a BioRID dummy. A ~20 percent risk of neck injury lasting more than one month was reported for Nkm =0.8. In sled tests, based on reconstructed real-world rear impact crashes with known injury outcomes, Linder et al. (2004) found that the risk for whiplash symptoms persisting more than one month was less than 10 percent for Nkm<0.37.
The Intervertebral Neck Injury Criterion (IV-NIC) The IV-NIC developed by Panjabi et al. (1999), is based on the hypothesis that a neck injury occurs when an intervertebral extension-flexion angle exceeds its physiological limits. It is defined as the portion of the intervertebral motion Θtrauma under traumatic loading and the physiological range of motion Θphysiological. The IV-NIC is calculated by:
i cal,physiologi
i trauma,
ΘΘ
=− NICIV Eq. (4)
- 17 -
There is no threshold value proposed for this criterion (Schmitt et al. 2004) and it can not be used in the existing crash test dummies.
The Neck Displacement Criterion (NDC) The NDC, proposed by Viano & Davidsson (2001), is based on the angular and linear displacement response of the head relative to T1, obtained from volunteer tests. The criterion is given as corridors of the z- versus angular displacements, and x- versus angular displacements of the occipital condyle (OC) of the head relative to the T1. Working performance guidelines for the NDC in the Hybrid III and the BioRID for low speed rear impacts are proposed in four different categories; Excellent, Good, Acceptable and Poor. Kullgren et al. (2003) found that NDC is less applicable to predict whiplash injury risk when using a BioRID dummy. According to Schmitt et al. (2004), the NDC is currently under deliberatation, and the corridors cannot be regarded as definite yet.
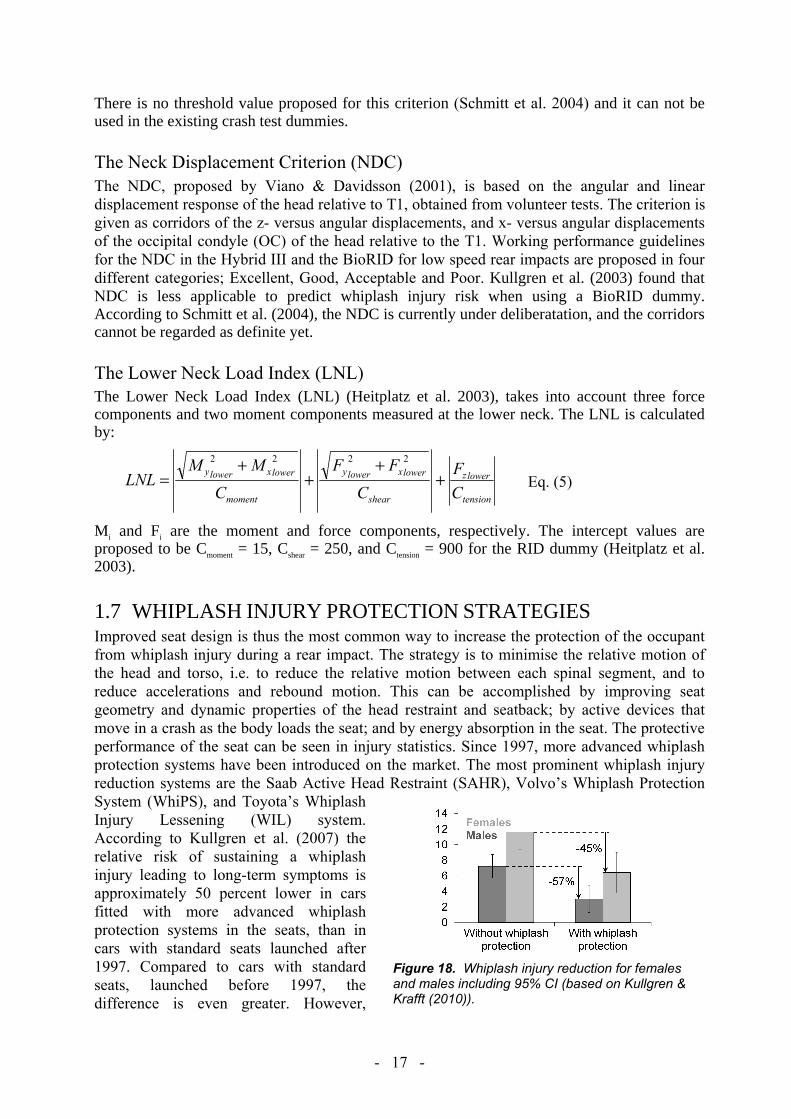
The Lower Neck Load Index (LNL) The Lower Neck Load Index (LNL) (Heitplatz et al. 2003), takes into account three force components and two moment components measured at the lower neck. The LNL is calculated by:
2222
tension
lowerz
shear
lowerxlowery
moment
lowerxlowery
CF
CFF
CMM
LNL ++
++
= Eq. (5)
Mi and Fi are the moment and force components, respectively. The intercept values are proposed to be Cmoment = 15, Cshear = 250, and Ctension = 900 for the RID dummy (Heitplatz et al. 2003).
1.7 WHIPLASH INJURY PROTECTION STRATEGIESImproved seat design is thus the most common way to increase the protection of the occupant from whiplash injury during a rear impact. The strategy is to minimise the relative motion of the head and torso, i.e. to reduce the relative motion between each spinal segment, and to reduce accelerations and rebound motion. This can be accomplished by improving seat geometry and dynamic properties of the head restraint and seatback; by active devices that move in a crash as the body loads the seat; and by energy absorption in the seat. The protective performance of the seat can be seen in injury statistics. Since 1997, more advanced whiplash protection systems have been introduced on the market. The most prominent whiplash injury reduction systems are the Saab Active Head Restraint (SAHR), Volvo’s Whiplash Protection System (WhiPS), and Toyota’s Whiplash Injury Lessening (WIL) system. According to Kullgren et al. (2007) the relative risk of sustaining a whiplash injury leading to long-term symptoms is approximately 50 percent lower in cars fitted with more advanced whiplash protection systems in the seats, than in cars with standard seats launched after 1997. Compared to cars with standard seats, launched before 1997, the difference is even greater. However,
Figure 18. Whiplash injury reduction for females and males including 95% CI (based on Kullgren & Krafft (2010)).

- 18 -
existing whiplash protection concepts are more effective for males than females, with 45 percent risk reduction of permanent medical impairment for females and 57 percent for males, according to insurance claims records (Figure 18) (Kullgren & Krafft 2010). I.e., the differences between females and males have increased even though the whiplash injury risk has decreased.
Saab Active Head Restraint (SAHR) In 1997 (early 1998 in the USA), Saab introduced the SAHR system in the 9-5 model as a first application of crash activated systems to mitigate whiplash injuries. In addition to the active head-restraint, the SAHR system comprises design features in the seatback to control and distribute those loads on the occupant that are generated in rear impacts (Wiklund & Larsson 1998). The active head restraint is mounted to a pressure plate in the seatback by means of a spring-resisted link mechanism (Figure 19). When the seat pushes the occupant forward with more force than the spring can resist, the plate moves rearward into the seat. This forces the head restraint to move upward and forward, thus supporting the head before the relative motion between the head and the torso becomes significant (Wiklund & Larsson 1998). In 2002, the SAHR Generation II was introduced in the Saab 9-3 model. The main modification was that the pressure plate in the seatback was moved down to the lower back region, in order to induce an earlier movement of the head restraint.
Figure 19. The SAHR Generation I (to the left) and Generation II (to the right). Reprinted with permission by Stefan Olsen, Saab.
The injury reducing effect of the SAHR system has been evaluated by Viano & Olsen (2001), Farmer et al. (2003), Kullgren & Krafft (2010), and Kullgren (verbal communication 2012-03-14) and it ranges from 33 to 75 percent in these studies (Figure 20).
0.0
0.2
0.4
0.6
0.8
1.0
1.2
MT-LT symptoms (pain >1 week)
Saab 9-3 Saab 9-5 Medical impairment Medical impairment (new data 2012)
Viano & Olsen(2001)
Farmer et al.(2003)
Kullgren & Kraf f t (2010)
Kullgren (verbal communication)
Rel
ativ
e W
hipl
ash
Inju
ry R
isk
SAHR
Seats without whiplash protection (normalised to 1)
Figure 20. The whiplash injury risk of the SAHR seat relative to seats without whiplash protection (normalised to 1). Based on data reported by Viano & Olsen (2001), Farmer et al. (2003), Kullgren & Krafft (2010), and Kullgren (verbal communication 2012-03-14).

- 19 -
Viano & Olsen (2001) reported that “women experienced Short Term (ST) neck pain at a 52 percent higher rate than men, and the incidence was more frequent in vehicles equipped with SAHR. However, no women reported Mid Term–Long Term (MT–LT) whiplash injury in SAHR vehicles”. Recent studies have indicated that the SAHR system may be more effective for males than females regarding permanent medical impairment (Kullgren & Krafft 2010; Kullgren, verbal communication 2012-03-14).
Whiplash Protection System (WhiPS) The Whiplash Protections System (WhiPS) was first introduced in Volvo cars in 1998, and was developed with the focus on three biomechanical guidelines (Lundell et al. 1998): 1. Reduce occupant acceleration. 2. Minimise relative movements between adjacent vertebrae and in the occipital joint, i.e., the
curvature of the spine should alter as little as possible during the crash. 3. Minimise the forward rebound into the seat belt.
The main feature of WhiPS is the recliner mechanism, enabling the seatback to move rearwards in relation to the seat cushion when loading an occupant during a rear impact (Jakobsson 2004b). The normal occupant position is illustrated in Figure 21a. During a rear impact, the seatback first moves in a translational motion (Figure 21b) and then in a reclining motion (Figure 21c). During this motion, a deformation element in the recliner absorbs energy and thus reduces the occupant acceleration and forward rebound. In addition, the seatback was locally modified to provide a uniform force distribution along the spine of the occupant; and the head restraint was modified to be positioned closer and higher relative to the head (Lundell et al. 1998).
Figure 21. Whiplash Protection System (WhiPS). a) Normal position. b) Translational motion. c) Reclining motion. Reprinted with permission by Ola Boström, Autoliv.
The injury reducing effect of the WhiPS system has been evaluated by Farmer et al. (2003), Jakobsson et al. (2008), Kullgren & Krafft (2010), and Kullgren (verbal communication 2012-03-14) and ranges from 31 to 71 percent in these studies (Figure 22).
0.0
0.2
0.4
0.6
0.8
1.0
1.2
Volvo S70 Initialsymptoms
Persistent symptoms
Medical impairment Medical impairment (new data 2012)
Farmer et al. (2003)
Jakobsson et al.(2008)
Kullgren & Kraf f t (2010)
Kullgren (verbal communication)
Rel
ativ
e W
hipl
ash
Inju
ry R
isk
WhiPS
Seats without whiplash protection (normalised to 1)
Figure 22. The whiplash injury risk of the WhiPS seat relative to seats without without whiplash protection (normalised to 1). Based on data reported by Farmer et al. (2003), Jakobsson et al. (2008), Kullgren & Krafft (2010), and Kullgren (verbal communication 2012-03-14).
a) b) c)

- 20 -
A 45 percent reducing effect of initial symptoms for females as compared to 26 percent for males was found in moderate impact severity (impacts in which the rear longitudinal members were deformed in any direction) (Jakobsson 2004b). The corresponding reduction of persistent symptoms, one year after the crash, was 67 percent for females and 46 percent for males. Kullgren & Krafft (2010) found that WhiPS had a similar injury reducing effect with regards to permanent medical impairment; 53 percent for females and 45 percent for males. Recent data analysis supported these findings (Kullgren, verbal communication 2012-03-14).
Whiplash Injury Lessening (WIL) The Toyota Whiplash Injury Lessening (WIL) system has no active parts and is only working with improved geometry and softer seat back (Sekizuka 1998). The head restraint, especially the metal frame, has been moved forward and upward compared to the position in earlier seat models. The upper part of the seatback frame has been moved rearwards, away from the upper part of the torso, still retaining the seat surface in order to support the upper part of the torso similar to previous seats models. During a rear impact, the upper part of the torso sinks into the malleable seatback whilst the head of the occupant meets the stiffer head restraint and reduces the whiplash motion of the head/neck. The pelvic support, at the lower part of the seatback frame, initiates the lower part of the torso to rebound first, and thereby helps to prevent neck extension. The injury reducing effect of the WIL system has been evaluated by Farmer et al. (2003), Kullgren & Krafft (2010), and Kullgren (verbal communication 2012-03-14) and it ranges from ~0 to 49 percent (Figure 23).
0.0
0.2
0.4
0.6
0.8
1.0
1.2
Toyota Avalon & Lexus Medical impairment Medical impairment (new data 2012)
Farmer et al. (2003)
Kullgren & Krafft (2010)
Kullgren (verbal communication)
Rel
ativ
e W
hipl
ash
Inju
ry R
isk
WIL
Seats without whiplash protection (normalised to 1)
Figure 23. The whiplash injury risk of the WIL seat relative to seats without whiplash protection (normalised to 1). Based on data reported by Farmer et al. (2003), Kullgren & Krafft (2010), and Kullgren (verbal communication 2012-03-14).
The injury reducing effect of the WIL system is similar for females and males (Kullgren & Krafft 2010; Kullgren, verbal communication 2012-03-14).
1.8 HUMAN MODELS USED FOR REAR IMPACT TESTSMechanical crash test dummies are used as human substitutes in crash testing at force levels most probably injurious for living humans. The test dummies are used in sled tests as well as in full scale vehicle tests. The dummy should be sensitive to parameters resembling an injury or an injury mechanism; it should be human-like in terms of size, mass and mass distribution; have a good repeatability; and it should be human-like in terms of the dynamic response during

- 21 -
a crash. The validation of a mechanical dummy model is usually based on volunteer tests and/or PMHS tests. Volunteer tests needs to be carried out at very low, non-harmful velocities and accelerations, while PMHS tests can be performed at higher, injury inducing velocities and accelerations. However, the lack of muscle tone, internal pressure, and other changes in the PMHS due to the time lapse after death, makes the results less representative.
The Hybrid III dummy family was developed for high-speed frontal crash testing and for evaluation of early automotive safety restraint systems. Reports covering the development process are collected in Backaitis & Mertz (1994). The anthropometry of the dummy family was defined in the University of Michigan Transportation Research Institute (UMTRI) study (Schneider et al. 1983, Robbins et al. 1983a,b). Initially, the family consisted of four dummy members; the 5th and 50th percentile females, and the 50th and 95th percentile males. In the first part of the project, data was collected and analysed for all four dummy members. The stature, mass, and seated height (Table 3), were defined based on the National Health and Nutrition Examination Survey (HANES) of 1971–1974 by Abraham et al. (1979a,b). This data was collected on 13,645 individuals representing the 128 million persons aged 18–74 in the US population. The HANES survey provides the most current and appropriate general population model available for US adult females according to Young et al. (1983). It was later decided, though, that the 50th percentile female dummy member should be dropped since the level of funding would not allow completion of the study for all four dummy members.
It has been established that the dynamic response of the the Hybrid III is not human-like in low-speed rear impact tests (Cappon et al. 2000; Scott et al. 1993, among others). Therefore, a new dummy, the Biofidelic Rear Impact Dummy (BioRID), was developed during the late 1990´s. The size of the dummy represents a 50th percentile male (~1.77 m, 77.7 kg) and the mass distribution of the torso is human-like. The spine of the dummy consists of the same number of vertebrae as the human spine, including lordosis of the neck and kyphosis of the thoracic spine. The motion is restricted to the sagittal plane. The BioRID has been evaluated against data from volunteer tests (Davidsson et al. 1999a,b), and PMHS test (Linder et al. 1999). A further low-speed rear impact test dummy, the Rear Impact Dummy version 3D (RID3D) was developed during the late 1990´s. The RID3D is a modification kit (flexible spine and neck construction, a more realistic back shape, and the application of the ribcage design of the THOR dummy) for the 50th percentile Hybrid III male dummy (Cappon et al. 2000). Both the BioRID and the RID3D have been shown to be more biofidelic in low speed rear impact tests than the Hybrid III dummy (Davidsson et al. 1999a,b; Siegmund et al. 2001; Philippens et al. 2002).
The 50th percentile male dummies roughly correspond to a 90th–95th percentile female in terms of stature and mass (Welsh & Lenard 2001), but not in terms of mass distribution and dynamic response. Hence, females are not well represented by the existing 50th percentile rear impact dummies, the BioRID and the RID3D. Only the extremes of the female population are accounted for by either the 50th percentile male dummy or the 5th percentile female dummy currently used in rear impact crash tests (Figure 24). The 50th percentile male dummy is the most commonly used size during the development process of new seat concepts and design with regards to rear impacts. Consequently, the current seats are optimised to the 50th percentile
Table 3. The stature, mass, and seated height of the four member dummy family in the UMTRI study (Schneider et al. 1983).
Percentile Sex Stature Mass Seated
Height [cm] [kg] [cm]
5th Female 151.1 47.3 78.1 50th Female 161.8 62.3 84.4 50th Male 175.3 77.3 90.1 95th Male 186.9 102.3 96.6
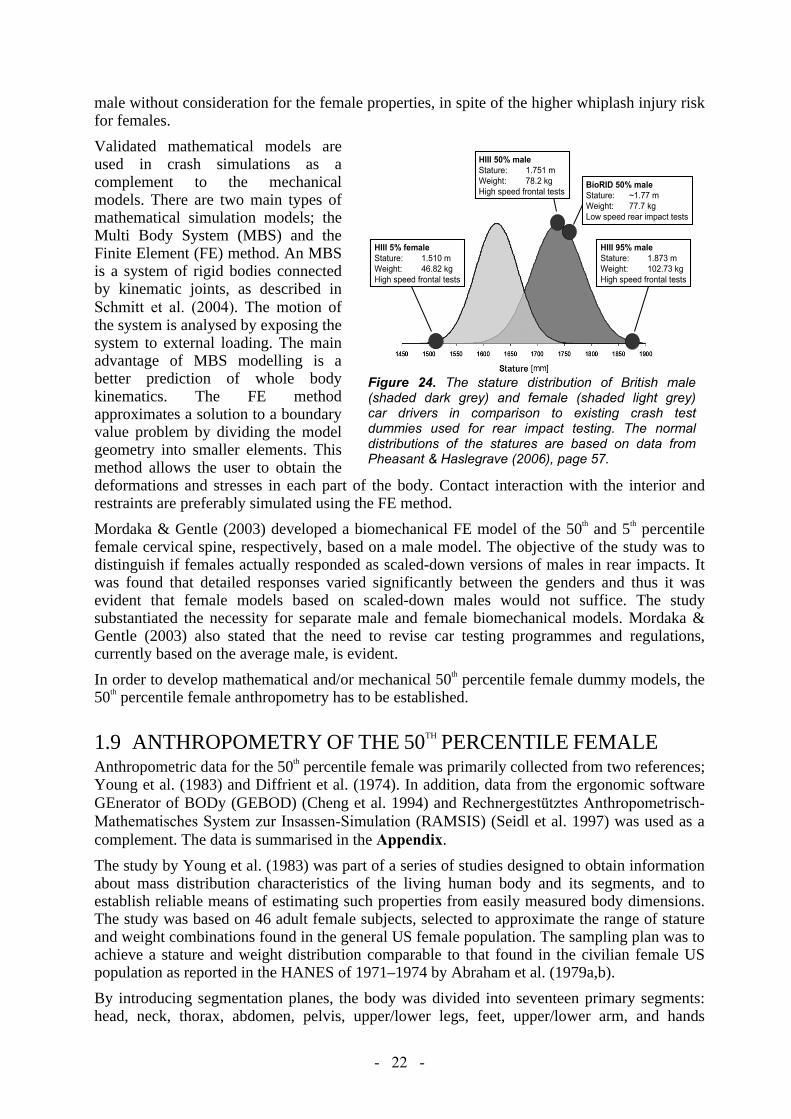
- 22 -
male without consideration for the female properties, in spite of the higher whiplash injury risk for females.
Validated mathematical models are used in crash simulations as a complement to the mechanical models. There are two main types of mathematical simulation models; the Multi Body System (MBS) and the Finite Element (FE) method. An MBS is a system of rigid bodies connected by kinematic joints, as described in Schmitt et al. (2004). The motion of the system is analysed by exposing the system to external loading. The main advantage of MBS modelling is a better prediction of whole body kinematics. The FE method approximates a solution to a boundary value problem by dividing the model geometry into smaller elements. This method allows the user to obtain the deformations and stresses in each part of the body. Contact interaction with the interior and restraints are preferably simulated using the FE method.
Mordaka & Gentle (2003) developed a biomechanical FE model of the 50th and 5th percentile female cervical spine, respectively, based on a male model. The objective of the study was to distinguish if females actually responded as scaled-down versions of males in rear impacts. It was found that detailed responses varied significantly between the genders and thus it was evident that female models based on scaled-down males would not suffice. The study substantiated the necessity for separate male and female biomechanical models. Mordaka & Gentle (2003) also stated that the need to revise car testing programmes and regulations, currently based on the average male, is evident.
In order to develop mathematical and/or mechanical 50th percentile female dummy models, the 50th percentile female anthropometry has to be established.
1.9 ANTHROPOMETRY OF THE 50TH PERCENTILE FEMALE Anthropometric data for the 50th percentile female was primarily collected from two references; Young et al. (1983) and Diffrient et al. (1974). In addition, data from the ergonomic software GEnerator of BODy (GEBOD) (Cheng et al. 1994) and Rechnergestütztes Anthropometrisch-Mathematisches System zur Insassen-Simulation (RAMSIS) (Seidl et al. 1997) was used as a complement. The data is summarised in the Appendix.
The study by Young et al. (1983) was part of a series of studies designed to obtain information about mass distribution characteristics of the living human body and its segments, and to establish reliable means of estimating such properties from easily measured body dimensions. The study was based on 46 adult female subjects, selected to approximate the range of stature and weight combinations found in the general US female population. The sampling plan was to achieve a stature and weight distribution comparable to that found in the civilian female US population as reported in the HANES of 1971–1974 by Abraham et al. (1979a,b).
By introducing segmentation planes, the body was divided into seventeen primary segments: head, neck, thorax, abdomen, pelvis, upper/lower legs, feet, upper/lower arm, and hands
HIII 5% femaleStature: 1.510 mWeight: 46.82 kgHigh speed frontal tests
HIII 95% maleStature: 1.873 mWeight: 102.73 kgHigh speed frontal tests
BioRID 50% maleStature: ~1.77 mWeight: 77.7 kgLow speed rear impact tests
HIII 50% maleStature: 1.751 mWeight: 78.2 kgHigh speed frontal tests
HIII 5% femaleStature: 1.510 mWeight: 46.82 kgHigh speed frontal tests
HIII 5% femaleStature: 1.510 mWeight: 46.82 kgHigh speed frontal tests
HIII 95% maleStature: 1.873 mWeight: 102.73 kgHigh speed frontal tests
HIII 95% maleStature: 1.873 mWeight: 102.73 kgHigh speed frontal tests
BioRID 50% maleStature: ~1.77 mWeight: 77.7 kgLow speed rear impact tests
BioRID 50% maleStature: ~1.77 mWeight: 77.7 kgLow speed rear impact tests
HIII 50% maleStature: 1.751 mWeight: 78.2 kgHigh speed frontal tests
HIII 50% maleStature: 1.751 mWeight: 78.2 kgHigh speed frontal tests
Figure 24. The stature distribution of British male (shaded dark grey) and female (shaded light grey) car drivers in comparison to existing crash test dummies used for rear impact testing. The normal distributions of the statures are based on data from Pheasant & Haslegrave (2006), page 57.

- 23 -
(Figure A2). The upper legs were subdivided into separate proximal flaps. The segmentation planes were determined by surface landmarks on the body. Anatomical axis systems were created for each segment as reference systems from which centres of volume and principal axes of inertia could be located, regardless of body segment position (Table A4). For each body segment the following data was provided:
- Volume (mean values and regression equations using anthropometric measures) (Table A6)- Principal moments of inertia (mean values and regression equations using anthropometric
measures) (Table A7).- Anthropometric measures of body (average values) (Table A8).- Centre of volume (Table A5) from anatomical axis origin (Table A4).- Principal axes of inertia (Table A8) with respect to anatomical axes (Table A4)
The study by Diffrient et al. (1974) “incorporates extensive amount of human engineering data compiled and organised by Henry Dreyfuss Associates over the last thirty years, including the most up-to-date research of anthropologists, psychologists, scientists, human engineers and medical experts”. The Diffrient et al. (1974) study contains anthropometric measures, such as lengths, breadths, depths, and circumferences of different body parts of the average female. Additionally, the distance between joints of the 50th percentile female was specified (Figure A1).
To compare the datasets from Young et al. (1983) and Diffrient et al. (1974) with data from the anthropometric databases RAMSIS and GEBOD, the circumferences for different parts of the body of the 50th percentile female are summarised in Table A1. The table shows that there is in general good correlation between the different datasets. Anthropometric data from Young et al. (1983) and Diffrient et al. (1974) for the head and body are listed in Tables A2–A3.
In Young et al. (1983), the 50th percentile female had the stature 161.2 cm and the mass 63.9 kg; that is 0.4% shorter and 2.6% heavier compared to the data in the UMTRI study (Table 4). In Diffrient et al. (1974), the stature was 161.5 cm and the mass 65.8 kg for the 50th percentile female; that is 0.2% shorter and 5.6% heavier compared to the data in the UMTRI study (Table 4).
Table 4. The stature, mass, and seated height of the 50th percentile female according to Schneider et al. (1983), Diffrient et al. (1974), and Young et al. (1983).
50th Percentile Female Stature Mass Seated Height
[cm] [kg] [cm] Schneider et al. (1983) 161.8 62.3 84.4 Diffrient et al. (1974) 161.5 65.8 84.1 Young et al. (1983) 161.2 63.9 86.2
To adapt the data from Young et al. (1983) and Diffrient et al. (1974) to the 50th percentile female in to the UMTRI study (Schneider et al. 1983), the depth/width dimensions and the circumferences taken from Young et al. (1983) and Diffrient et al. (1974) was scaled according to:
Young et al. (1983): (63.9/62.3)1/3 = 1.008 1% scaling
Diffrient et al. (1974): (65.8/62.3)1/3 = 1.018 2% scaling
The scaled data is included in Tables A3, A6, A7, and A8 as a complement to the original data provided by Young et al. (1983) and Diffrient et al. (1974). Scaling of the length dimensions

- 24 -
was not performed since the difference in statures was considered to be minor (0.4% and 0.2%).
The mass of each body segment was estimated from each segment’s volume (Young et al. 1983) assuming constant density of the body (Table A6). The results are summarised in Table A9, which also includes data from GEBOD and Diffrient et al. (1974) for comparison.
1.10 DYNAMIC RESPONSES OF FEMALES AND MALESIt is necessary to establish the dynamic response of both females and males in order to understand the biomechanics that form the basis for whiplash injury. The primary source of such dynamic response data is gained from comparable volunteer tests comprising males and females. The resulting data can be used as an input into the development of improved occupant models, such as computational models and crash test dummies. Today’s dynamic response data derived from rear impact volunteer tests, is dominated by male data. The scrutiny of the female and male tests in these studies indicate differences in the dynamic response between males and females, but are inconclusive due to the lack of and analysis of existing data. Below is a summary of the results of rear impact volunteer tests including males and females alike Szabo et al. (1994) performed rear impact car-to-car tests comprising two female and three male volunteers in a Ford Escort (model year 1982) at 8 km/h. The data shows that the females, compared to the males, on average had: - less rearward head x-displacement (females: 175 mm, males: 229 mm) - less rearward shoulder x-displacement (females: 111 mm, males: 150 mm) - less rearward head relative-to-torso angular displacement (estimated from graph) - greater peak head x-acceleration (females: 12.5g, male: 10.1g) - greater peak cervical x-acceleration (females: 6.5g, male: 4.5g) In these comparisons, one test (Test 5 – subject C) was excluded due to intentionally increased initial HR distance.
Hell et al. (1999) performed rear impact sled tests comprising three female and thirteen male volunteers in a “German standard car seat” at 6.5 km/h and 9.5 km/h. It was found that the females, compared to the males, on average had: - less initial HR distance. - “much greater forward flexion of the torso” in the rebound phase.- greater and earlier peak head x-acceleration (approximately 75 percent greater and 15 ms
earlier at 9.5 km/h, and 100 percent greater at 6.5 km/h). - greater and earlier peak T1 x-acceleration (in the order of 10–15 percent greater at 9.5 km/h). - less peak head angular acceleration “due to a relatively small head/head restraint distance”.
Kumar et al. (2000) performed rear impact tests comprising nine female and five male volunteers at the accelerations 0.5g, 0.9g, 1.1g and 1.4g. In one set of tests the volunteers were informed of the impending impact. During the other set the volunteers were blindfolded and exposed to loud auditory input to eliminate cues of the imminent impact. They found that the peak accelerations of the volunteers were significantly affected by gender, intensity of impact, and expectation (Figure 25). On average 23 percent reduction of the peak head x-acceleration was recorded in the expected impacts as compared to the unexpected impacts for the male and female volunteers. The females had on average 11 percent greater peak x-accelerations compared to the males in the unexpected as well as the expected impacts. The head x-accelerations in the expected impacts were delayed by 25-40 ms among the males, except during the lightest pulse. Among the females the delay ranged between 78 and 171 ms and tended to decrease as the pulse increased.

- 25 -
0
0.2
0.4
0.6
0.8
1
0.5g 0.9g 1.1g 1.4g
Peak
hea
d x-
acce
lera
tion
[g]
Pulse
Unexpected impact - FemalesUnexpected impact - MalesExpected impact - FemalesExpected impact - Males
0
100
200
300
400
500
0.5g 0.9g 1.1g 1.4g
Peak
occu
renc
e [m
s]
Pulse
Figure 25. a) The peak head x-accelerations and b) peak occurrences for female and male volunteers in unexpected and expected rear impacts. Based on Kumar et al. (2000).
Welcher & Szabo (2001) evaluated the performance of five seats (three stock seats and two concept seats) with differing properties. Rear impact car-to-car tests comprising three volunteers were conducted at v 4 and 8 km/h. The volunteers were selected to resemble the stature of a 50th percentile female, a 50th percentile male, and a 95th percentile male. Each volunteer was exposed to tests at v 4 km/h and 8 km/h in each of the five seats (ten tests per volunteer). The volunteers were instructed to adjust the target vehicle seat and seat back to match their regular driving position. It was found that the 50th percentile female, compared to the 50th percentile male, on average had: - shorter HR distance (female: 4.3 cm, male: 6.1 cm, estimated from graph) - lesser head angular acceleration (female: -190/-606 rad/s2, male: -220/-954 rad/s2 at 4/8 km/h) - lower NIC value (female: 2.6/3.5 m2/s2, male: 6.8/8.9 m2/s2 at 4/8 km/h) - lesser peak T1 x-acceleration (female: 1.8g/2.1g, male: 3.7g/4.0g at 4/8 km/h) - less head relative to T1 angular displacement, extension (female: 11.1°/18.3°, male:
17.2°/24.6° at 4/8 km/h)
Croft et al. (2002) performed rear impact car-to-car tests comprising one female and two male volunteers. It was noticed that the female, compared to the males had: - greater maximum head x-accelerations. - more pronounced “forward shear effect” as well as “forward bending moment”. - faster interaction with the seatback and head restraint and less resistance to the forward
motion.For the males it was noticed that they had: - greater resistance to the forward moving seat, effectively delaying their forward acceleration,
resulting in considerably reduced head linear accelerations. - lower position of the head restraint relative to the head and greater interaction with the
seatback resulting in the males having “experienced markedly greater rearward phase extension and bending moments with corresponding less forward phase motion and bending moments”.
Ono et al. (2006) performed rear impact sled tests with two female volunteers and four male volunteers at 6 km/h in a rigid seat without head restraint. It was found that the females, compared to the males, on average had: - greater cervical vertebral rotation angle, and that their cervical spine exhibited a more
significant S-shaped deformation. - greater shear strain and compression strain of the front/rear edges of the facet joints,
indicating that females are at a higher risk of suffering neck injury. - greater and (somewhat) earlier peak T1 x-acceleration. - (somewhat) lesser and earlier head angular acceleration, first peak. - lesser and later head angular acceleration, second peak.

- 26 -
- earlier upper neck bending moment, first peak; the peaks were of the same magnitude for the females and the males.
- lesser upper neck bending moment, second peak.
Schick et al. (2008) analysed previously performed rear impact sled tests comprising eleven female volunteers and ten male volunteers at 9.5 km/h in a standard car seat. Data from Hell et al. (1999), see above, were included in this comparison. It was found that the females, compared to the males, on average had: - shorter HR distance (females: 4.5 cm, males: 8.6 cm) - greater peak head resultant acceleration (females: 12.7g*, males: 9.7g*) - greater and earlier peak head x-acceleration (females: 8.2g/116 ms*, males: 7.3g/148 ms*) - (somewhat) greater, and earlier peak T1 x-acceleration (females: 7.6g/87 ms, males: 7.2g/106
ms) - greater and earlier thorax peak x-acceleration (females: 8.5g/93 ms*, males: 7.7g/109 ms*) - lesser and earlier head angular acceleration, first peak (females: -513 rad/s2/103 ms, males: -
675 rad/s/126 ms) - lesser and earlier head angular acceleration, second peak (females: 545 rad/s2*/146 ms, males:
1063 rad/s*/160 ms)* indicates statistical significance
1.11 SUMMARYIt is well known, worldwide, that females have a greater whiplash injury risk in rear impacts compared to males. Studies have shown that there are differences between males and females in the anatomy and physiology of the neck, which may contribute to the increased whiplash injury risk for females. Studies have also indicated that there may be characteristic differences in the rear impact dynamic response between males and females. The 50th percentile male dummy may thus limit the assessment and development of whiplash prevention systems that adequately protect both male and female occupants. Data from volunteer tests is required to establish the dynamic response for females and males. Such data is fundamental for developing future occupant mathematical and/or mechanical models for crash safety development and assessment.

- 27 -
2. OBJECTIVESThe overall objective of this study was to improve the understanding why females are at greater risk than males of suffering a whiplash injury in rear impacts and to provide input on future female whiplash protection assessment. A review of the related literature was performed and the findings were summarised in the Introduction section. Further objectives of this study were:- To generate dynamic response corridors for 50th percentile females that can be used for the
evaluation of 50th percentile female occupant models. - To define anthropometric specifications for 50th percentile female occupant models. - To develop and evaluate 50th percentile female rear impact occupant models. - To investigate if there is a need for a future 50th percentile female rear impact dummy. The work has resulted in five papers and the objectives of each paper are summarised below.
2.1 PAPERS I & IIIThe objectives of Paper I and III were to: 1) generate response corridors for the 50th percentile female based on the data set previously
published by Siegmund et al. (1997) for rear impacts. 2) compare response corridors for the 50th percentile female with previously published
corridors for the 50th percentile male in Siegmund et al. (2001) for rear impacts. Additionally, parameters such as NIC values, HR distances and HR contact times were to be compared for the 50th percentile male and female.
2.2 PAPER IIThe objectives of Paper II were to: 1) generate response corridors for the 50th percentile female based on data from rear impact
sled tests comprising female volunteers. 2) compare response corridors for the 50th percentile female with previously published
corridors for the 50th percentile male in Davidsson et al. (1998) for rear impacts. Additionally, parameters such NIC values, HR distances and HR contact times were compared for the 50th percentile male and female.
2.3 PAPER IVThe objective of Paper IV was to combine available female anthropometry data and use them to transform a BioRID II finite element (FE) dummy model into a 50th percentile female rear impact crash dummy model. Published data on muscle strength was to be used to scale the dummy model stiffness properties. The new female dummy model was to be evaluated against volunteer response data of Paper II.
2.4 PAPER VThe objectives of Paper V was to investigate if it is possible to use the 50th percentile male BioRID II dummy to assess the whiplash protection for average sized female occupants. The work was to include the development of a 50th percentile female size seat-loading device. New volunteer tests with larger head restraint gap were to be carried out. Finally, the output from the new volunteer tests was to be used in the evaluation of the 50th percentile female seat-loading device. Thereafter the loading device was to be used in rear impact sled tests to evaluate the possibility to use a 50th percentile male rear impact dummy to predict the seat response of 50th percentile female occupants.

- 28 -
3. METHOD AND MATERIAL
3.1 PAPERS I & IIIThe data used in Paper I and III was extracted from an earlier test series, originally presented in Siegmund et al. (1997). In that study, 42 volunteers – 21 males and 21 females – were exposed to rear impact car-to-car tests at 4 km/h and 8 km/h. From these data sets, response corridors were generated for a subset of 11 of the 21 male volunteers, representing the 50th percentile male, in Siegmund et al. (2001). In Paper I, initial analysis of sensor data, HR distance and contact time, and NIC value from a subset of the female volunteers, representing a 50th
percentile female, was reported. In Paper III, a further analysis of the high-speed film data for the 50th percentile female and male volunteers was presented.
Human Subjects A subset of the females was extracted equivalently to the previous study for the males in Siegmund el al. (2001) and comparable response corridors of the females were generated. Of the original 21 female volunteers, 12 (at 4 km/h) and 9 volunteers (at 8 km/h) were selected. These volunteers were selected based on a stature range (156–167 cm) within ±5.5 cm of a 50th
percentile female (161.5 cm; Diffrient et al. 1974). Their mass range (45.8–83.4 kg) varied between a 5th and 90th percentile mass for females of the 50th percentile height (Najjar & Rowland 1987). The male corridors presented in Siegmund et al. (2001) were derived using data from eleven of the original 21 male volunteers in Siegmund et al. (1997). These subjects were selected based on a stature range (173–178 cm) within ±3 cm of a 50th percentile male (174.7 cm; Diffrient et al. 1974). Their mass range (63–87 kg) varied between the 10th and 75th
percentile mass for males of the 50th percentile stature (Najjar & Rowland 1987).
Test Procedures The volunteers were seated in the front passenger seat of a 1990 Honda Accord LX four-door sedan. The rear of the Honda was struck by the front of a 1981 Volvo 240DL station wagon in the volunteer tests. The Volvo’s impact speeds were selected to produce a change of velocity in the Honda of about 4 km/h and 8 km/h. The Honda’s passenger seat was locked in the full rear position and the initial seatback angle was set to approximately 27 degrees from the vertical for all tests. The head restraint was locked in the full-up position. The volunteers were instructed to assume a regular position in the seat (face forward, keeping their head level and place their hands on their lap) before being restrained by a three-point seatbelt and asked to relax prior to impact. The volunteers knew an impact was imminent but could not predict its exact timing.
Each volunteer underwent two tests; one each at a change of velocity of 4 km/h and 8 km/h. To minimise the effect of habituation, practice or demonstration trials were not given and the two tests were separated by at least one week. The volunteers were fitted with accelerometers and video markers (Figure 26) as described in detail in Siegmund et al. (1997). The NIC value was calculated according Eq (1). Figure 26. The test setup of Paper I.
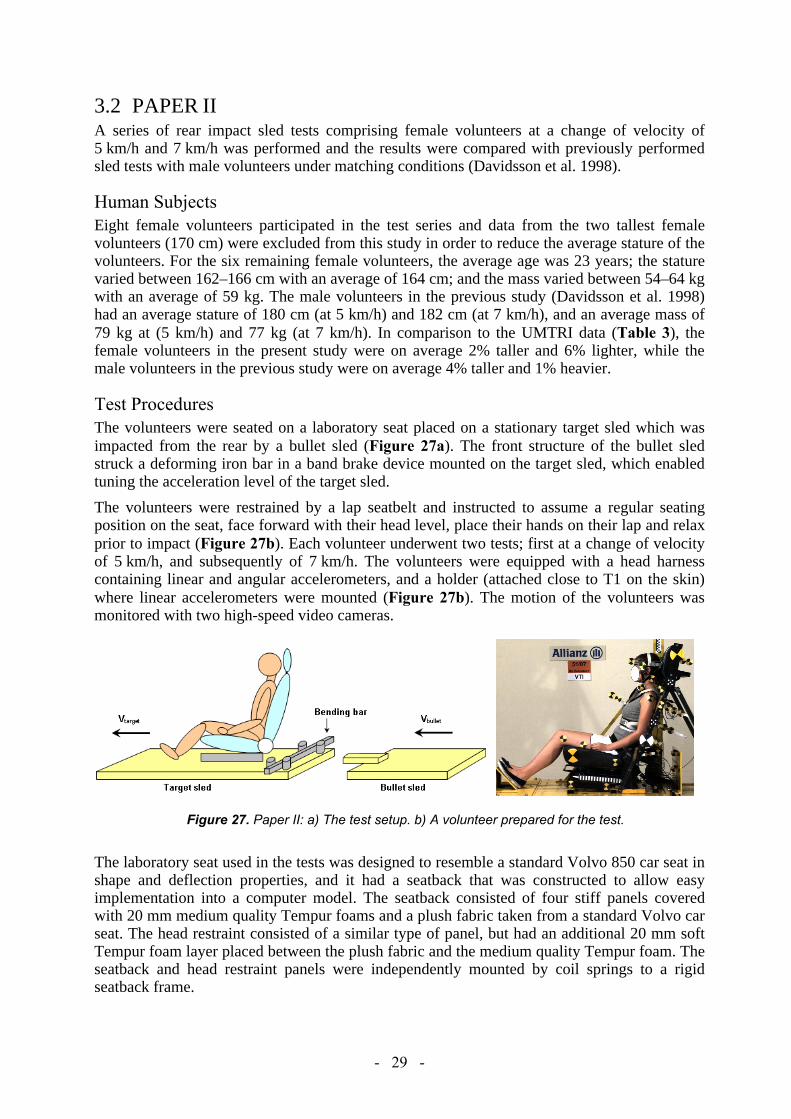
- 29 -
3.2 PAPER IIA series of rear impact sled tests comprising female volunteers at a change of velocity of 5 km/h and 7 km/h was performed and the results were compared with previously performed sled tests with male volunteers under matching conditions (Davidsson et al. 1998).
Human Subjects Eight female volunteers participated in the test series and data from the two tallest female volunteers (170 cm) were excluded from this study in order to reduce the average stature of the volunteers. For the six remaining female volunteers, the average age was 23 years; the stature varied between 162–166 cm with an average of 164 cm; and the mass varied between 54–64 kg with an average of 59 kg. The male volunteers in the previous study (Davidsson et al. 1998) had an average stature of 180 cm (at 5 km/h) and 182 cm (at 7 km/h), and an average mass of 79 kg at (5 km/h) and 77 kg (at 7 km/h). In comparison to the UMTRI data (Table 3), the female volunteers in the present study were on average 2% taller and 6% lighter, while the male volunteers in the previous study were on average 4% taller and 1% heavier.
Test Procedures The volunteers were seated on a laboratory seat placed on a stationary target sled which was impacted from the rear by a bullet sled (Figure 27a). The front structure of the bullet sled struck a deforming iron bar in a band brake device mounted on the target sled, which enabled tuning the acceleration level of the target sled.
The volunteers were restrained by a lap seatbelt and instructed to assume a regular seating position on the seat, face forward with their head level, place their hands on their lap and relax prior to impact (Figure 27b). Each volunteer underwent two tests; first at a change of velocity of 5 km/h, and subsequently of 7 km/h. The volunteers were equipped with a head harness containing linear and angular accelerometers, and a holder (attached close to T1 on the skin) where linear accelerometers were mounted (Figure 27b). The motion of the volunteers was monitored with two high-speed video cameras.
Figure 27. Paper II: a) The test setup. b) A volunteer prepared for the test.
The laboratory seat used in the tests was designed to resemble a standard Volvo 850 car seat in shape and deflection properties, and it had a seatback that was constructed to allow easy implementation into a computer model. The seatback consisted of four stiff panels covered with 20 mm medium quality Tempur foams and a plush fabric taken from a standard Volvo car seat. The head restraint consisted of a similar type of panel, but had an additional 20 mm soft Tempur foam layer placed between the plush fabric and the medium quality Tempur foam. The seatback and head restraint panels were independently mounted by coil springs to a rigid seatback frame.

- 30 -
3.3 PAPER IVThis study was divided into four subtasks: 1) selection of size for the EvaRID V1.0 model, 2) anthropometric specifications of the model, 3) model development, and 4) model evaluation, as described in detail below.
Selection of size Different types of sources were assessed to select the size of the EvaRID dummy model, such as injury statistics, anthropometric data, and previous publications regarding dummy development. Injury statistics was extracted in order to investigate the stature and mass distributions of females sustaining WAD in rear impacts. This data was collected from two different sources; the Working Group on Accident Mechanics (AGU) Zurich database (Switzerland) and the insurance company Folksam´s database (Sweden). Occupant data such as age, gender, stature and mass are kept on these databases. The AGU Zurich database contains records of technical and medical information of persons who have sustained WAD in car crashes. The Folksam in-depth database consists of reported car crashes in Sweden involving cars fitted with crash pulse recorders to record car acceleration-time history.
The basic anthropometry of the injured females was compared to the average stature/mass of the female population in Switzerland (year 2007: 164.7 cm/63.4 kg, obtained by written communication from Swiss Statistical Office) and Sweden (year 2006: 166.2 cm/66.1 kg, Hanson et al. 2008). Furthermore, the method used at UMTRI when developing the existing adult dummy sizes – the 5th percentile female, the 50th percentile male, and the 95th percentile male – was studied (Schneider et al. 1983, Robbins et al. 1983a,b).
Finally, to gain knowledge whilst selecting the 50th percentile female model size, documentation relating to the crash dummy size selection process in the WorldSID project (Moss et al. 2000) was studied. They found, based on anthropometric data across eight regions containing OECD countries (weighted by road fatality rates), that the 50th percentile female had an average stature of 163.2 cm.
Anthropometric specifications The anthropometric data for the 50th percentile female was primarily collected from Diffrient et al. (1974) and Young et al. (1983). In Young et al. (1983), mass distribution characteristics (including moment of inertia and centre of volume) of the average female’s body segments were reported. This reference also contains anthropometric measures of different body parts. The study by Diffrient et al. (1974) was used as a complement to Young et al. (1983) and included measures such as length, breadth, depth, and circumferences of different body parts of the average sized female. Additionally, the distances between different joints of the average female were specified. Furthermore, anthropometric data from the ergonomic software GEBOD (Cheng et al. 1994) and RAMSIS (Seidl et al. 1997) was used to validate the collected data. Product Information from Humanetics (previously FTSS) was also used to collect information on the BioRID II hardware dummy model for direct comparison of anthropometry data. Also, for comparative purposes, part of the 50th percentile male data was based on McConville et al. (1980).
EvaRID V1.0 – Model development The EvaRID V1.0 model was developed by scaling an existing BioRID II LS-DYNA model (DYNAmore GmbH). Mass and length dimensions of each body segment were scaled according to Eq. (6) and (7) to obtain dimensions representative of the 50th percentile female:

- 31 -
Mass Ratio (MR):
Eq. (6)
Scale Factor Length (SFL): Eq. (7)
Width and depth dimensions of the EvaRID were then established based on male dimensions scaling of each body segment (Table 5).
Table 5. Equations for SFB (Scale Factor Breadth) and SFD (Scale Factor Depth) for different body parts. MR = Mass Ratio, SFL = Scale Factor Length.
Body Part SFB SFD
Head
Neck = SFBupper torso = SFLneck
Upper Torso
Pelvis
Upper Arm
Lower Arm Upper Leg Lower Leg
Apart from the geometrical scaling stiffness and damping properties of those parts representing the neck and spine, responses were scaled to a value of 70 percent of the original values in the BioRID II model.
Model evaluation The EvaRID V1.0 model was exposed to the same impact conditions as the female volunteers in Paper II (page 29). The dynamic response of the EvaRID V1.0 model was subsequently analysed and compared to the responses in the volunteer tests.
In addition, three sled tests with a BioRID II were performed in identical test conditions as with the female volunteers. The BioRID II was equipped with standard sensors; a tri-axial accelerometer in the head, linear x- and z-accelerometers at the T1, and an upper neck load cell. The motion of the head and T1 relative to the sled was obtained from high-speed video analysis.
3.4 PAPER VA scaled-down rear impact dummy – BioRID50F – was developed from modified body segments originating from a standard BioRID II dummy. The scaled-down dummy was representative of a 50th percentile female in mass and rough dimensions and intended to function as a representative seat loading device. The BioRID50F was evaluated against low-speed rear impact sled tests comprising female volunteers close to a 50th percentile female in size. A series of rear impact tests with the BioRID50F were performed in four different car seat models and the results were compared to previously performed BioRID tests in the same setup.
- 32 -
The 50th Percentile Female Rear Impact Prototype Dummy – BioRID50F The BioRID50F was assembled using modified parts originating from a BioRID II 50th
percentile male dummy. Target dimensions and masses of the BioRID50F’s body segments were mainly based on the EvaRID LS-Dyna Model V1.0 by Humanetics (previously FTSS) (Chang et al. 2010; Linder et al. 2011).
The length of the upper arms was kept unchanged, the lower arms were shortened and the wrist rotators, wrist pivots, and hands were removed. No modifications were made to the pelvis. However, both the upper and lower legs were shortened, and the ankles were replaced by aluminium square profiles where the shoes (in a new lightweight design) were attached. The flesh was sculpted to match the reduced length of the limbs. Furthermore, sections of the interior flesh were removed and oval holes were machined in different parts of the steel skeleton to reduce the mass.
Two sections (one horizontal and one vertical) were cut out from the torso jacket and the remaining pieces were reassembled, resulting in reduced shoulder joint distance. The interface pins (connecting the spine to the torso jacket) were shortened to match the modified torso jacket width. Two lumbar vertebrae were removed from the spine, and the height of the sacral vertebra was reduced. The size of the neck and spine polyurethane bumpers was decreased and the neck muscle substitute springs were replaced by softer ones. The spring cartridges and muscle substitute wires were replaced to match the length of the new springs. The wire pretension was in total 14 mm equivalent as for the original BioRID II neck.
The head of the BioRID50F consisted of a BioRID head from which the anterior flesh had been removed.
To evaluate the dynamic response, one verification test was performed with the BioRID50F in the same setup as in previously performed (not published) tests with 50th percentile female volunteers (Figure 28a), as described below.
Tests with BioRID50F and 50th Percentile Female Volunteers in Laboratory Seat Eight female volunteers were recruited for the test series. Their age varied between 22–29 years with an average of 26 years; their stature varied between 161–166 cm with an average of 163 cm; and their mass varied between 55–67 kg with an average of 60 kg. In comparison to the 50th percentile female EvaRID V1.0 (Chang et al. 2010, Linder et al. 2011) the female volunteers were on average 1% taller and 4% lighter. The volunteers were thus representative of the 50th percentile female.
The test procedure and setup was similar to the one described in Paper II (page 29, Figure 27a); however, some changes were made:
- The design of the seat base and the head restraint was modified in order to simplify the mathematical modelling of the laboratory seat. The new head restraint consisted of a plywood panel supported by a stiff steel frame; the HR distance was adjusted by adding padding to the head restraint (Figure 28b). The new seat base consisted of a stiff aluminium frame, covered by a plywood top surface. The seatback construction was kept unchanged.
- Each volunteer underwent two tests; in the first test the initial HR distance was ~10 cm, and in the second it was ~15 cm.
- All the tests were performed at the same crash pulse (mean acceleration: 2.1g, change of velocity: 6.8 km/h).

- 33 -
- The T1 accelerometers were mounted on a holder, which was attached to the skin at four points (one above each clavicle, and two bilateral and close to the spinal process of the T1 (the upper thoracic vertebra) (Figure 28b).
- The volunteers were restrained by a standard three point seatbelt.
Results from six of the eight tests at the initial HR distance ~15 cm were used for further analysis in this study (two tests were excluded since the volunteers’ heads did not make contact with the head restraint). The high-speed video camera data was digitized, set to zero at the time of impact (T=0), and was expressed in a sled fixed coordinate system.
Figure 28. a) The BioRID50F. b) The volunteer prepared for the test in the laboratory seat.
Tests with the BioRID50F in Vehicle Seats A series of eight sled tests were performed with the BioRID50F in the medium pulse (triangular, v 16km/h, peak acceleration 10g), according to the Euro NCAP test procedure (EuroNCAP 2010). The tests were performed in four different standard seats (A–D). Seats A, B, and D were equipped with different types of whiplash protection systems, while seat C had a basic seat design. Two tests were performed with each seat model to verify repeatability of the test set-up and the BioRID50F; the seats were changed between tests and each seat was tested only once.
For the BioRID50F the same seat configuration and dummy positioning was used as for the BioRID II based on the EuroNCAP test procedure (EuroNCAP 2010); the H-point and the seat back angle were determined using the SAE J826 mannequin. Since the test conditions were equal to those of EuroNCAP, the results were compared to corresponding tests with a BioRID in the same seat models. These reference tests were performed at Thatcham (UK) and the data was made available for this study.
The BioRID50F was equipped with accelerometers in the head, T1, T8, and L1. The tests were monitored from the side by two high-speed digital video cameras. The camera data was digitized, set to zero at the time of impact (T=0), and was expressed in a sled fixed coordinate system.

- 34 -
4. RESULTS
4.1 PAPERS I–III
Peak values and their timing were derived from the x-accelerations, x- and angular displacements of the head, T1, and head relative to T1, and response corridors were generated (FFigures 29---31, Tables 6---8). The corridors were defined from the average ±one standard deviation (SD). In addition, the HR distance and contact time, and the NIC value were extracted from the data (FFigure 32, Tables 9---10). For each dynamic response parameter it was investigated whether the observed differences in parameter values between females and males were statistically significant. T-tests were performed with the statistical significance level of 0.05 without any corrections for multiple comparisons.
X-Accelerations (Papers I & II) In paper I, the x-accelerations of the head and T1 had one single peak, while in Paper II they had two peaks in most tests. These peaks were generally greater and had earlier occurrences for the female volunteers compared to the male volunteers (Figures 29a-d, Table 6). At 7 km/h (Paper II), the first peak of the head x-acceleration was 56 percent greater (p=0.023) and 19 percent earlier (p=0.012) for the females, while the second peak was 64 percent greater (p=0.030) and 19 percent earlier (p=0.008). For the T1 the first peak was 8 percent greater (p=0.513, not statistical significant) and 7 percent earlier (p=0.214, not statistical significant), however, the second peak was 7 percent less (p=0.441, not statistical significant) and 7 percent later (p=0.413, not statistical significant). At 8 km/h (Paper I), the peak head x-acceleration was 10 percent greater (p=0.128, not statistical significant) and 9 percent earlier (p=0.001), while it was 16 percent greater but had similar occurrence for the T1.
Paper I: Paper II:
Figure 29. X-accelerations of the head at (a) 4 km/h (b) 8 km/h (c) 5 km/h (d) 7 km/h; T1 at (e) 4 km/h (f) 8 km/h (g) 5 km/h (h) 7 km/h; the head relative to T1 at (i) 4 km/h (j) 8 km/h (k) 5 km/h (l) 7 km/h. The tests at 4 km/h and 8 km/h originate from Paper I, and at 5 km/h and 7 km/h from Paper II. The response corridors were calculated from the average ±1SD. The response corridors are shaded light grey for females and dark grey for males.

- 35 -
Table 6. Average x-acceleration peaks and occurrences of the head and T1 for the male and female volunteers at 4 km/h and 8 km/h (Paper I); and at 5 km/h and 7 km/h (Paper II).
X-Acceleration
Paper I Paper II 4 km/h 8 km/h 5 km/h 7 km/h
[m/s2]
@ [ms]
[m/s2]
@ [ms]
[m/s2]
@ [ms]
[m/s2]
@ [ms]
Head
Male1) 30 (4) 159 (12) 84 (13) 140 (6) 29 (10) 112 (12) 44 (16) 102 (8) Female1) 40 (5) 149 (12) 92 (11) 128 (7) 51 (4) 83 (10) 68 (9) 82 (9) Difference +32% -7% +10% -9% +76% -26% +56% -19% P-value 0.001 0.053 0.128 0.001 0.002 0.005 0.023 0.012 Male2) - - - - 39 (14) 157 (14) 51 (11) 145 (15)
Female2) - - - - 49 (9) 116 (7) 84 (22) 117 (7) Difference - - - - +27% -26% +64% -19% P-value - - - - 0.196 0.001 0.030 0.008
T1
Male1) 18 (3) 122 (25) 39 (7) 124 (23) 24 (5) 95 (13) 40 (8) 93 (7) Female1) 21 (3) 115 (14) 45 (7) 123 (15) 27 (4) 86 (10) 43 (3) 86 (4) Difference +18% -6% +16% -1% +12% -9% +8% -7% P-value 0.022 0.413 0.073 0.893 0.337 0.280 0.513 0.214 Male2) - - - - 30 (4) 126 (7) 48 (6) 116 (7) Female2) - - - - 31 (2) 129 (9) 44 (4) 122 (10)
Difference - - - - +6% +2% -7% +5% P-value - - - - 0.404 0.589 0.441 0.413
1) Peak 1 2) Peak 2
X-Displacements (Paper II & III) The peak x-displacements of the head, T1, and head relative to T1 were on average less and earlier for the females compared to the males (Figure 30, Table 7). For example, in Paper III at 8 km/h the peak head x-displacement was 12 percent less (p=0.018) and 6 percent earlier (p=0.028) for the females, while for the T1 it was 8 percent less (p=0.138, not statistical significant) and 5 percent earlier (p=0.013). The resulting head relative to T1 x-displacement peak was 22 per cent less (p=0.018) and 9 percent earlier for the females compared to the males (p=0.014).
In Paper III, it was found that the rebound motion was more pronounced for the females in comparison to the males, with an earlier return to the initial position (=0 cm) of the head and T1 and a larger forward displacement at the end of the data set (positive values in Figure 30a-f). At 8 km/h, the heads of the females returned to their initial positions 10 percent earlier than the heads of the males; a similar trend was recorded for the T1 (11 percent earlier), and for the head relative to T1 (8 percent earlier). The entire rebound motion was not captured by the cameras; however, the forward displacement of the head at the end of the data set was 76 percent greater for the females than the males at 8 km/h. For the T1, and the head relative to T1, the forward displacement at the end of the data set was 67 percent and 107 percent greater, respectively, for females than males. In Paper II, no conclusions could be drawn regarding the rebound motion of the female and male volunteers due to different seatbelt geometry (the females wore a two-point seatbelt while the males wore a three-point seatbelt).
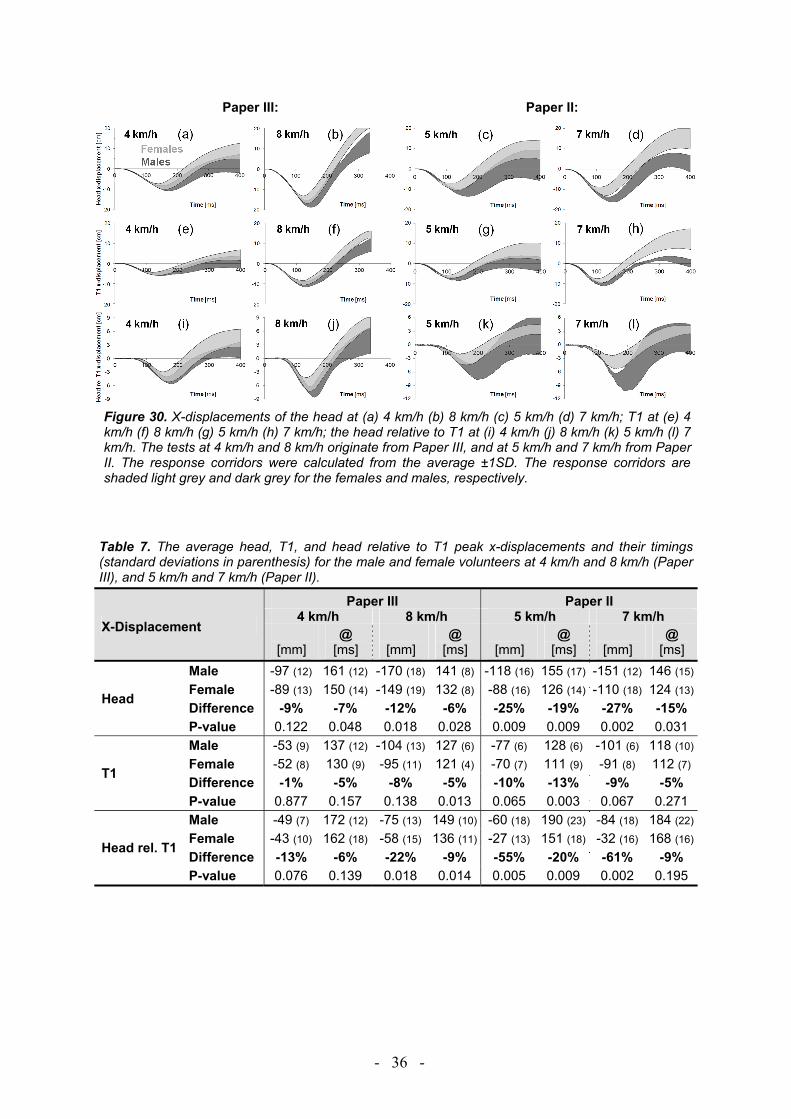
- 36 -
Paper III: Paper II:
Figure 30. X-displacements of the head at (a) 4 km/h (b) 8 km/h (c) 5 km/h (d) 7 km/h; T1 at (e) 4 km/h (f) 8 km/h (g) 5 km/h (h) 7 km/h; the head relative to T1 at (i) 4 km/h (j) 8 km/h (k) 5 km/h (l) 7 km/h. The tests at 4 km/h and 8 km/h originate from Paper III, and at 5 km/h and 7 km/h from Paper II. The response corridors were calculated from the average ±1SD. The response corridors are shaded light grey and dark grey for the females and males, respectively.
Table 7. The average head, T1, and head relative to T1 peak x-displacements and their timings (standard deviations in parenthesis) for the male and female volunteers at 4 km/h and 8 km/h (Paper III), and 5 km/h and 7 km/h (Paper II).
X-Displacement
Paper III Paper II 4 km/h 8 km/h 5 km/h 7 km/h
[mm]
@ [ms]
[mm]
@ [ms]
[mm]
@ [ms]
[mm]
@ [ms]
Head
Male -97 (12) 161 (12) -170 (18) 141 (8) -118 (16) 155 (17) -151 (12) 146 (15)
Female -89 (13) 150 (14) -149 (19) 132 (8) -88 (16) 126 (14) -110 (18) 124 (13)
Difference -9% -7% -12% -6% -25% -19% -27% -15% P-value 0.122 0.048 0.018 0.028 0.009 0.009 0.002 0.031
T1
Male -53 (9) 137 (12) -104 (13) 127 (6) -77 (6) 128 (6) -101 (6) 118 (10)
Female -52 (8) 130 (9) -95 (11) 121 (4) -70 (7) 111 (9) -91 (8) 112 (7)
Difference -1% -5% -8% -5% -10% -13% -9% -5% P-value 0.877 0.157 0.138 0.013 0.065 0.003 0.067 0.271
Head rel. T1
Male -49 (7) 172 (12) -75 (13) 149 (10) -60 (18) 190 (23) -84 (18) 184 (22)
Female -43 (10) 162 (18) -58 (15) 136 (11) -27 (13) 151 (18) -32 (16) 168 (16)
Difference -13% -6% -22% -9% -55% -20% -61% -9% P-value 0.076 0.139 0.018 0.014 0.005 0.009 0.002 0.195
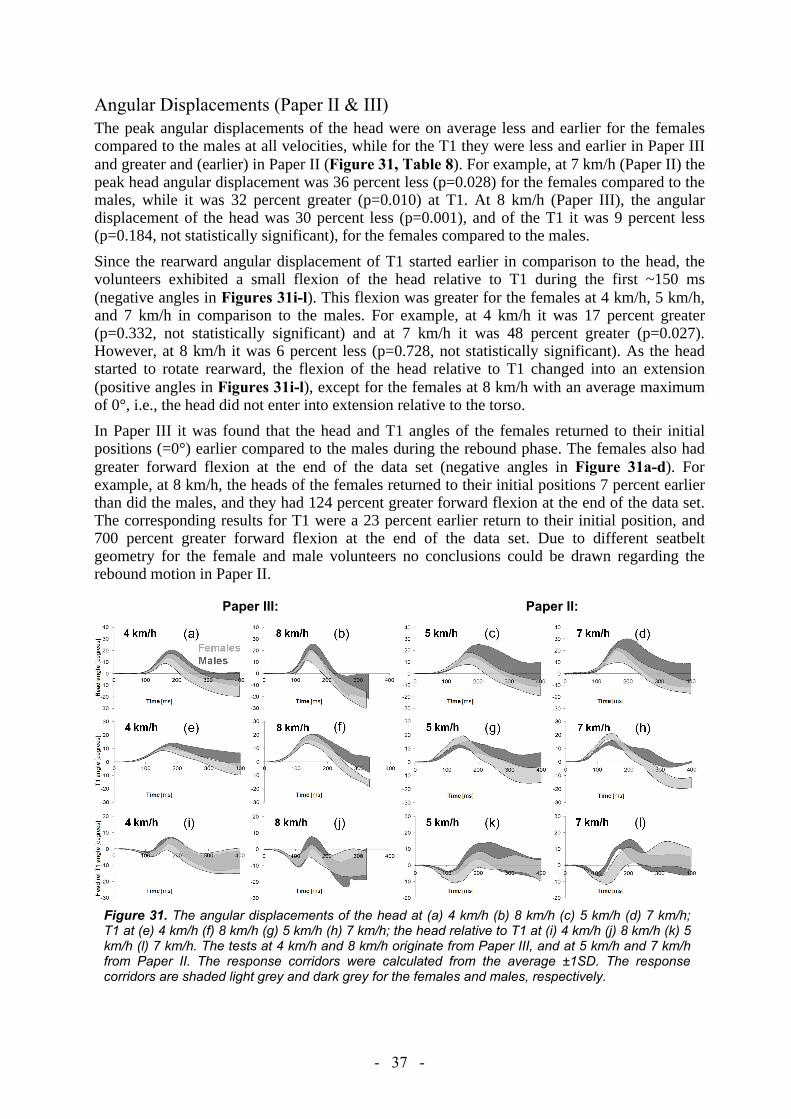
- 37 -
Angular Displacements (Paper II & III) The peak angular displacements of the head were on average less and earlier for the females compared to the males at all velocities, while for the T1 they were less and earlier in Paper III and greater and (earlier) in Paper II (Figure 31, Table 8). For example, at 7 km/h (Paper II) the peak head angular displacement was 36 percent less (p=0.028) for the females compared to the males, while it was 32 percent greater (p=0.010) at T1. At 8 km/h (Paper III), the angular displacement of the head was 30 percent less (p=0.001), and of the T1 it was 9 percent less (p=0.184, not statistically significant), for the females compared to the males.
Since the rearward angular displacement of T1 started earlier in comparison to the head, the volunteers exhibited a small flexion of the head relative to T1 during the first ~150 ms (negative angles in Figures 31i-l). This flexion was greater for the females at 4 km/h, 5 km/h, and 7 km/h in comparison to the males. For example, at 4 km/h it was 17 percent greater (p=0.332, not statistically significant) and at 7 km/h it was 48 percent greater (p=0.027). However, at 8 km/h it was 6 percent less (p=0.728, not statistically significant). As the head started to rotate rearward, the flexion of the head relative to T1 changed into an extension (positive angles in Figures 31i-l), except for the females at 8 km/h with an average maximum of 0°, i.e., the head did not enter into extension relative to the torso.
In Paper III it was found that the head and T1 angles of the females returned to their initial positions (=0°) earlier compared to the males during the rebound phase. The females also had greater forward flexion at the end of the data set (negative angles in Figure 31a-d). For example, at 8 km/h, the heads of the females returned to their initial positions 7 percent earlier than did the males, and they had 124 percent greater forward flexion at the end of the data set. The corresponding results for T1 were a 23 percent earlier return to their initial position, and 700 percent greater forward flexion at the end of the data set. Due to different seatbelt geometry for the female and male volunteers no conclusions could be drawn regarding the rebound motion in Paper II.
Paper III: Paper II:
Figure 31. The angular displacements of the head at (a) 4 km/h (b) 8 km/h (c) 5 km/h (d) 7 km/h; T1 at (e) 4 km/h (f) 8 km/h (g) 5 km/h (h) 7 km/h; the head relative to T1 at (i) 4 km/h (j) 8 km/h (k) 5 km/h (l) 7 km/h. The tests at 4 km/h and 8 km/h originate from Paper III, and at 5 km/h and 7 km/h from Paper II. The response corridors were calculated from the average ±1SD. The response corridors are shaded light grey and dark grey for the females and males, respectively.
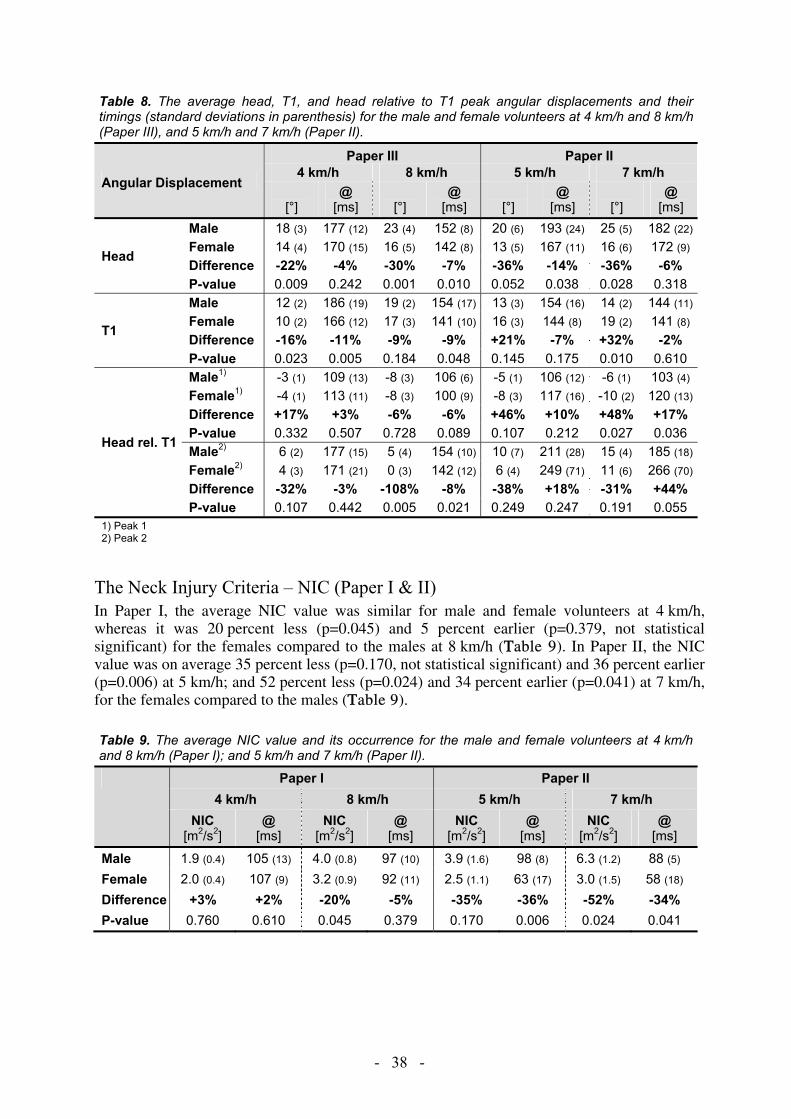
- 38 -
Table 8. The average head, T1, and head relative to T1 peak angular displacements and their timings (standard deviations in parenthesis) for the male and female volunteers at 4 km/h and 8 km/h (Paper III), and 5 km/h and 7 km/h (Paper II).
Angular Displacement
Paper III Paper II 4 km/h 8 km/h 5 km/h 7 km/h
[°]
@ [ms]
[°]
@ [ms]
[°]
@ [ms]
[°]
@ [ms]
Head
Male 18 (3) 177 (12) 23 (4) 152 (8) 20 (6) 193 (24) 25 (5) 182 (22)
Female 14 (4) 170 (15) 16 (5) 142 (8) 13 (5) 167 (11) 16 (6) 172 (9) Difference -22% -4% -30% -7% -36% -14% -36% -6% P-value 0.009 0.242 0.001 0.010 0.052 0.038 0.028 0.318
T1
Male 12 (2) 186 (19) 19 (2) 154 (17) 13 (3) 154 (16) 14 (2) 144 (11)
Female 10 (2) 166 (12) 17 (3) 141 (10) 16 (3) 144 (8) 19 (2) 141 (8) Difference -16% -11% -9% -9% +21% -7% +32% -2% P-value 0.023 0.005 0.184 0.048 0.145 0.175 0.010 0.610
Head rel. T1
Male1) -3 (1) 109 (13) -8 (3) 106 (6) -5 (1) 106 (12) -6 (1) 103 (4) Female1) -4 (1) 113 (11) -8 (3) 100 (9) -8 (3) 117 (16) -10 (2) 120 (13)
Difference +17% +3% -6% -6% +46% +10% +48% +17% P-value 0.332 0.507 0.728 0.089 0.107 0.212 0.027 0.036 Male2) 6 (2) 177 (15) 5 (4) 154 (10) 10 (7) 211 (28) 15 (4) 185 (18)
Female2) 4 (3) 171 (21) 0 (3) 142 (12) 6 (4) 249 (71) 11 (6) 266 (70)
Difference -32% -3% -108% -8% -38% +18% -31% +44% P-value 0.107 0.442 0.005 0.021 0.249 0.247 0.191 0.055
1) Peak 1 2) Peak 2
The Neck Injury Criteria – NIC (Paper I & II) In Paper I, the average NIC value was similar for male and female volunteers at 4 km/h, whereas it was 20 percent less (p=0.045) and 5 percent earlier (p=0.379, not statistical significant) for the females compared to the males at 8 km/h (TTable 9). In Paper II, the NIC value was on average 35 percent less (p=0.170, not statistical significant) and 36 percent earlier (p=0.006) at 5 km/h; and 52 percent less (p=0.024) and 34 percent earlier (p=0.041) at 7 km/h, for the females compared to the males (TTable 9).
Table 9. The average NIC value and its occurrence for the male and female volunteers at 4 km/h and 8 km/h (Paper I); and 5 km/h and 7 km/h (Paper II).
Paper I Paper II 4 km/h 8 km/h 5 km/h 7 km/h
NIC [m2/s2]
@ [ms]
NIC [m2/s2]
@ [ms]
NIC [m2/s2]
@ [ms]
NIC [m2/s2]
@ [ms]
Male 1.9 (0.4) 105 (13) 4.0 (0.8) 97 (10) 3.9 (1.6) 98 (8) 6.3 (1.2) 88 (5) Female 2.0 (0.4) 107 (9) 3.2 (0.9) 92 (11) 2.5 (1.1) 63 (17) 3.0 (1.5) 58 (18) Difference +3% +2% -20% -5% -35% -36% -52% -34% P-value 0.760 0.610 0.045 0.379 0.170 0.006 0.024 0.041

- 39 -
The Head-to-Head Restraint Distance / Contact (Paper I & II) The initial HR distance was on average shorter for the females compared to the males (TTable 10) and there were considerable individual differences. In comparison to the males, the initial HR distance was on average 9 percent shorter for the females in tests performed for Paper I, and 40 percent shorter for tests performed for Paper II.
Table 10. The HR distance at T=0 (estimated from film analysis) and the HR contact (Papers I–II).
HR Distance & HR Contact
Paper I Paper II 4 km/h 8 km/h 5 km/h 7 km/h
Distance [mm]
Contact [ms]
Distance[mm]
Contact[ms]
Distance[mm]
Contact [ms]
Distance [mm]
Contact[ms]
Male 45 (15) 128 (14) 43 (17) 100 (10) 80 (21) 94 (18) 89 (17) 94 (7) Female 41 (18) 114 (19) 39 (17) 91 (10) 49 (21) 70 (15) 51 (23) 67 (16) Difference -7% -11% -10% -9% -38% -26% -43% -29% P-value 0.639 0.058 0.588 0.066 0.031 0.027 0.012 0.007
The female volunteers had an earlier HR contact compared to the males (TTable 10). The contact time was on average 14 ms earlier at 4 km/h, 9 ms earlier at 8 km/h (Paper I); 24 ms earlier at 5 km/h, and 27 ms earlier at 7 km/h (Paper II). In Paper I it was found that for the same initial HR restraint distance, head restraint contact occurred 11 ms and 7 ms earlier for the females than for the males at 4 km/h and 8 km/h, respectively (FFigure 32).
R2 = 0,8548
R2 = 0,7594
R2 = 0,8456
R2 = 0,783
60
80
100
120
140
160
0 10 20 30 40 50 60 70 80 90Head-to-head restraint distance [mm]
Hea
d-to
-hea
d re
stra
int c
onta
ct [m
s]
4 km/h Male 8 km/h Male 4 km/h Female 8 km/h Female
Figure 32. The HR contact with regards to the HR distance for the male and female volunteers at 4 km/h and 8 km/h (Paper I).
Summary of Results (Paper I–III) The results from Papers I---III are summarized in FFigure 33. The bars in the upper part of the figure represent the peak maximum for the females relative to the males (normalised to 1). The bars in the lower part of the figure represent the peak occurrence for the females relative to the males (normalised to 1).

- 40 -
Figure 33. Summary of results from Papers I–III. The bars represent the females and the males are represented by the solid vertical line (normalised to 1). a) The peak maximum for the females relative to the males. b) The peak occurrence for the females relative to the males.
4.2 PAPER IV
Injury statistics was extracted from insurance records in order to investigate the stature and mass distributions of females sustaining WAD in rear impacts. The anthropometry of the EvaRID V1.0 was then specified based on data found in the published literature. A rear impact LS-Dyna dummy model – EvaRID V1.0 – was developed based on the same design concept as the existing 50th percentile male BioRID II rear impact dummy model from DYNAmore GmbH. The dynamic response of EvaRID V1.0 was compared to data from rear impact sled tests with female volunteers.
EvaRID – Selection of size Insurance records revealed that the 50th percentile female dummy would correlate in size to the females that are most frequently injured in rear impacts (Figure 34). In the AGU Zurich database, the injured females had an average stature/mass of 165.3 cm/65.2 kg; close to the average size of the female population in Switzerland (164.7 cm/63.4 kg, obtained by written communication from Swiss Statistical Office). Correspondingly, in the Folksam database the average stature/mass was 165.3 cm/65.2 kg for the injured females; close to the average size of the female population in Sweden (165.9 cm/65.9 kg, Hanson et al. 2008). It was decided to use the basic anthropometric measures of the 50th percentile female in the UMTRI study (stature 161.8 cm, mass 62.3 kg, Schneider et al. 1983) to define the EvaRID V1.0 model primarily due to that the EvaRID V1.0 would correlate to the 50th percentile female in relation to the existing adult dummies. In addition, the selected size was close to the stature of the 50th percentile female (163.2 cm) according to the WorldSID study (Moss et al. 2000). Their data was based on anthropometric data across eight regions containing OECD countries (weighted by road fatality rates).
Peak maximuma)
b) Peak occurrence
Males (normalised to 1)
Males (normalised to 1)

- 41 -
AGU ZurichFolksam
Stature Distribution [cm] Mass Distribution [kg]
a) b)
Figure 34. The stature and mass distributions of whiplash injured female occupants in a) Sweden (Folksam database) and b) Switzerland (AGU Zurich database).
Anthropometry of the 50th Percentile Female Having defined the stature, mass and seated height of the EvaRID model, the next step was to specify other measures and properties such as dimensions, mass, centre of mass, and moment of inertia of each body segment; as well as the distances between joints. Since the UMTRI study only provided the stature, mass, and seated height of the 50th percentile female, the data had to be found elsewhere.
The anthropometric measures for the 50th percentile female (Diffrient et al. 1974; Young et al. 1983) are summarised in the Appendix. The length dimensions taken from Young et al. (1983) and Diffrient et al. (1974) were not scaled since the differences in statures between these two references and the 50th percentile female were minor (0.4% and 0.2%, respectively, Table 4).However, due to the somewhat greater differences in mass (2.6% and 5.6%, Table 4); the depth, widths and circumferences taken from Young et al. (1983) and Diffrient et al. (1974) was scaled 1% and 2%, respectively. The distances between joints of the EvaRID were specified based on data reported by Diffrient et al. (1974) (Figure A1).
The traditional segmentation of the human body for use in developing crash test dummies is head, neck, thorax, abdomen, pelvis, upper and lower leg, foot, upper and lower arm, and hand (Figure A2).The estimated volume of each body part of the 50th percentile female was received from regression equations (Young et al. 1983) (Tables A6 and A8). The mass of each body part was then calculated assuming constant density (Table A6).The masses (absolute and relative compared to the overall mass) and mass ratios of each body part of the EvaRID V1.0 and BioRID II dummies is provided in Table 11.
Table 11. The mass, mass distribution (in percent of the total mass), and Mass Ratio (MEvaRID/MBioRID) of the BioRID II and the EvaRID.
Body Part EvaRID BioRID II MEvaRID
MBioRIDMass[kg]
% of total
Mass [kg]
% of total
Head x1 3.58 5.7 4.54 5.8 0.789 Upper Torso1) x1 19.58 31.4 26.61 34.0 0.736 Pelvis2) x1 15.84 25.4 15.80 20.2 1.003 Upper Arm x2 1.40 2.2 2.02 2.6 0.691 Lower Arm3) x2 1.16 1.9 2.23 2.9 0.518 Upper Leg4) x2 5.67 9.1 5.99 7.7 0.947 Lower Leg5) x2 3.43 5.5 5.44 7.0 0.631 TOTAL 62.30 100 78.24 100 - 1) The upper torso consists of the thorax, the abdomen,
and the spine (including the neck). 2) Flaps included. 3) Hand included. 4) Flap excluded. 5) Foot included.

- 42 -
EvaRID V1.0 – Model developmentBasic scaling methodology was used to establish the Scale Factor Length (SFL) for each body segment, by taking the EvaRID’s length over the BioRID's length (Eq. 7). The calculations of the Scale Factor Breadth (SFB) and Scale Factor Depth (SFD) for each body segment are described in detail below and the results are included in Table 12. The masses and mass ratios for each body segment are listed in Table 11.The head was scaled to meet the three dimensional requirements for the EvaRID (total length 20.30 cm; breadth 14.58 cm; depth 18.69 cm) (Table A2). The mass requirement of the head (3.58 kg, Table 11) was met by adjusting the density of the skull. The neck height was defined as the mastoid height less the cervical height. Due to lack of an accurate landmark of the mastoid and the cervical spine, the 50th
percentile male data from McConville et al. (1983) was used for the neck height (12.04 cm) (Table 12).
The upper torso was defined as the torso without the pelvis and ran from the cervicale to the iliac crest. During scaling, the EvaRID maintained the same spine and back profile as the BioRID II’s as the scaling factors for the SFL and SFD were kept identical. The mass of the upper torso was derived by subtracting the pelvis mass from the torso mass. The breadth, defined as the distance between shoulder joints, was 31.50 cm for the EvaRID and 34.60 cm for the BioRID II. The SFD was then derived from the MR, SFL, and SFB of the upper torso (Table 5). The torso shape was further modified based on the data from Young et al. (1983) or Diffrient et al. (1974). In this model, the waist breadth 31.05 cm from Young et al. (1983) was chosen as well as the following breadth dimensions of the torso: bust 288 mm; 10th rib 257 mm; buttock 373 mm; and bust point distance 180 mm.
The scaling of the limbs was performed according to basic scaling methodology. First, the mass ratio of EvaRID over BioRID II was calculated (Eq. 6, Table 11). Then the SFL of EvaRID over BioRID II was determined based on the 50th percentile female data reported by Diffrient et al. (1974) and the dimensions measured from the BioRID II model (Eq. 7, Table 12). The SFB and SFD were then derived by taking the square root of the mass ratio over SFL (Table 5).
No major difference was found between the dimensions of the 50th percentile female and the 50th percentile male pelvis in the anthropometric studies by Young et al. (1983) and McConville et al. (1983). Furthermore, the distance between the hip joints was similar for the 50th percentile female and the BioRID II. Accordingly, the pelvis mass was similar for the 50th
percentile male (15.80 kg) and the 50th percentile female (15.84 kg) (Table 11). Only minor changes were made to the pelvis; the shape was adjusted to match the breadth dimensions from
Table 12. Calculation of the Scale Factor Length (SFL) (=LEvaRID/LBioRID) for different body parts. The corresponding values of the Scale Factor Breadth (SFB) and the Scaled Factor Depth (SFD) are given.
Body Part Length Scale Factors
LEvaRID LBioRID SFL SFB SFD [cm] [cm]
Head1) 20.308) 21.59 0.940 0.925 0.935 Neck2) 10.288) 12.04 0.854 0.910 0.854 Upper Torso3) 47.948) 52.65 0.911 0.910 0.888 Pelvis 25.828) 25.83 1.000 1.000 1.003 Upper Arm4) 26.408) 26.14 1.010 0.823 0.823 Lower Arm5) 23.408) 24.88 0.941 0.765 0.765 Upper Leg6) 38.908) 40.55 0.959 1.014 1.014 Lower Leg7) 45.708) 49.55 0.922 0.861 0.861 1) Top of head to chin. 2) C0/C7 joint to C7/T1 joint. 3) C7/T1 joint to mid-point of hip joints. 4) Shoulder joint to elbow joint. 5) Elbow joint to wrist joint. 6) Hip joint to knee joint. 7) Knee joint to bottom of heel along tibia. 8) Diffrient et al. (1974).

- 43 -
Young et al. (1983). The EvaRID V1.0 dummy model maintained the same pelvis angle of 26.5 degrees as the BioRID II.
The seated height was defined as the standing height less 774 mm (Diffrient et al. 1974). The heights of the cervicale, bust point, 10th rib, iliac crest, and omphalion (waist) were based on Young et al. (1983) (Figure 35).
Background Mesh Size 10×10 mm
Figure 35. Torso details – heights of major landmarks.
A comparison between the EvaRID V1.0 and the BioRID II model is shown in Figure 36.
Figure 36. Comparison of the EvaRID V1.0 and the BioRID II models.

- 44 -
Model Evaluation A pre-simulation was performed to establish the initial position of the sled simulation of the dummy model by dropping the EvaRID into the seat and allowing the gravity to find its balanced position. After the balanced position was achieved the head panel was adjusted, in this case closer to the head, to match the measured initial head-to-head restraint distance, as estimated from film analysis.
Simulated results were compared with the dynamic response corridors obtained from the volunteer tests in Paper II (Figure 37). In general, the simulated results correlated well for about ~250 ms with responses being inside or close to the corridors. However, the T1 rearward angular displacement was much less with values less than 25 percent of the requirement set by the corridor. This may indicate that the thoracic spine is too stiff in extension. An extensive parameter study was conducted to explore these and other causes, however, these adjustments resulted only in a minor increase of the T1 rearward angular displacement.
Figure 37. X-accelerations of (a) the head, (b) the T1 and (c) the head relative to T1; angular displacements of (d) the head, (e) the T1 and (f) the head relative to T1; x-displacements relative to the sled of (g) the head, (h) the T1 and (i) the head relative to T1 for the 50th percentile female volunteers (grey corridor) and the EvaRID V1.0 (solid black line). The response corridors were calculated ±1SD from the average response.
To investigate the model response in more detail, simulations using the original BioRID II dummy model were made under volunteer loading conditions. Experimental data, dynamic response corridors and simulated results are depicted in Figure 38. It was found that the BioRID II model responses showed identical trends as the EvaRID for these loading conditions, including the notably lesser T1 rotation.
a) b) c)
d) e) f)
g) h) i)

- 45 -
Figure 38. X-accelerations of (a) the head, (b) the T1 and (c) the head relative to T1; angular displacements of (d) the head, (e) the T1 and (f) the head relative to T1; x-displacements relative to the sled of (g) the head, (h) the T1 and (i) the head relative to T1 for the BioRID II dummy (grey corridor) and the BioRID II FE model (solid black line). The response corridors were calculated ±1SD from the average response.
4.3 PAPER V
Rear Impact Sled Tests with the Female Volunteers and EvaRID50F The dynamic response of the BioRID50F was compared to response corridors (the average ± 1 SD) for the volunteers (Figure 39). The peak values and their occurrences were determined for the head, T1, and head relative to T1 x-accelerations, x-displacements, and angular displacements for the volunteers and BioRID50F. The initial HR distance for the volunteers was estimated from film analysis at impact (T=0). The HR contact time was documented. The Neck Injury Criterion (NIC) value (Boström et al. 1996; Boström et al. 2000) was calculated (Eq. 1).
The overall response of the BioRID50F came close to the female volunteer response corridors (Figure 39). The head x-acceleration of the BioRID50F had delayed onset and a greater peak value compared to the volunteers (Figure 39a). The T1 x-acceleration was similar for the volunteers and the BioRID50F during the first ~85 ms. As the upper torso of the BioRID50F was pushed forward by the seatback, the T1 x-acceleration started to increase, resulting in a minor (local) peak at 106 ms (Figure 39b). However, since the head lagged behind, the T1 x-acceleration decreased before it peaked again as the head reached the head restraint.
The head rearward angular displacement of the BioRID50F was almost within the corridor of the female volunteers (Figure 39d), however the onset started somewhat early. The peak T1 rearward angular displacement was lower and earlier for the BioRID50F compared to the female volunteers (Figure 39e). In the head relative to T1 angular displacement, the volunteers
a) b) c)
d) e) f)
g) h) i)

- 46 -
exhibited a small flexion during the first ~160 ms (negative values in Figure 39f) since the rearward angular displacement of T1 started earlier than the head did. This small flexion was not found in the BioRID50F due to the early onset of the head angular displacement. As the head of the volunteers started to rotate rearward, the flexion of the head relative to T1 changed into extension (positive values in Figure 39f). The corresponding extension angle for the BioRID50F was within the corridor of the female volunteers.
The rearward head x-displacement relative to the sled was similar for the volunteers and BioRID50F since they had approximately the same initial HR restraint distance (15 cm). However, the peak occurred somewhat earlier for the BioRID50F due to the earlier HR restraint contact. Compared to the volunteers, the rearward x-displacement of the T1 was slightly lesser for the BioRID50F.
Figure 39. X-accelerations of (a) the head, (b) the T1, and (c) the head relative to T1; angular displacements of (d) the head, (e) the T1, and (f) the head relative to T1; x-displacements relative to the sled of (g) the head, (h) the T1, and (i) the head relative to T1, for the 50th percentile female volunteers (grey corridor) and the BioRID50F (solid black line). The response corridors were calculated ±1SD from the average response.
The NIC value was on average 70 percent greater and occurred 13 percent earlier for the BioRID50F (8.5 m2/s2 at 106 ms) compared to the female volunteers (5.0 m2/s2 at 123 ms).
Rear Impact Sled Tests with the BioRID50F in four different standard seats Two tests were performed in each seat model with the BioRID50F and it was found that the repeatability was high. The maximum deviation of the peak head and T1 forward x-accelerations were ±1.2g and ±0.6g, respectively. Similarly, for the peak head and T1 rearward x-displacements it was ±3.0 mm and ±2.5 mm, respectively; and for the rearward angular displacements it was ±1.1° and ±0.9°, respectively. Accelerometer signals and data from film analysis from the BioRID50F tests were compared to previously performed tests with the BioRID II in equivalent crash conditions. The data from the BioRID II tests was used as a reference and the data was normalised to 1 (Figure 40).
a) b) c)
d) e) f)
g) h) i)

- 47 -
The BioRID50F was able to partially activate the whiplash protection systems (A, B, D). In the basic seat (C) the BioRID50F intruded deeply into the seatback during impact.
Compared to the BioRID II, the BioRID50F had more than 100 percent greater peak head x-acceleration in two of the seats (A, B), similar peak magnitude in one seat (C) and ~7 percent less peak in one seat (D). The peak T1 x-acceleration was greater in the BioRID50F compared to the BioRID II in three of the seats (A, B, C), ranging from 13 to 31 percent with an average of 26 percent, while in one seat (D) it was 9 percent lesser (Figure 40). In the T8, the peaks were greater for the BioRID50F in all four seats, ranging from 11 to 204 percent with an average of 61 percent. Compared to the BioRID II, the peak L1 x-acceleration had a similar magnitude for the BioRID50F in two of the seats (A, C) while it was more than 100 percent greater in the other two seats (B, D).
The maximum rearward x-displacements of the head, T1, head relative to T1 and pelvis were generally shorter for the BioRID50F in comparison to the BioRID II. On average, it was 21 percent shorter (ranging from 7 to 31 percent) for the head and 48 percent shorter (ranging from 29 to 67 percent) for the head relative to T1 (Figure 40). For T1, the rearward displacement of the BioRID50F was on average 18 percent shorter in three of the seats (A, B, D), while it was 10 percent greater in one seat (C). A similar result was found for the pelvis; on average 14 percent shorter in three seats (A, C, D) and a similar magnitude in one seat (B).
The maximum rearward angular displacements of the head and T1 were less for the BioRID50F compared to the BioRID II in all seats (Figure 40). On average, it was 43 percent less for the head (ranging from 29 to 53 percent) and 34 percent less for the T1 (ranging from 20 to 44 percent). In comparison to the BioRID II, the maximum rearward angular displacements of the seatback was on average 41 percent less for the BioRID50F (ranging from 32 to 57 percent) (Figure 40).
Figure 40. The relative peak head, T1, T8, and L1 x-accelerations; head, T1, head relative to T1, and pelvis x-displacements; and head, T1, and seat-back angular displacement for the EvaRID P1 and the BioRID (normalised to 1) in four different standard seats (A-D).

- 48 -
5. DISCUSSION
Vehicle crashes causing whiplash injuries are still of worldwide concern. The risk and the number of whiplash injuries increased steadily from the late 1960´s to the late 1990´s (Table 1). A small decrease in the whiplash injury risk in rear impacts (from 15.5 percent to 13.6 percent) was recorded in cars manufactured after 1997 equipped with standard seats (i.e. no advanced whiplash protection systems) in comparison to cars manufactured before 1997. Cars equipped with advanced whiplash protection systems posed on average a ~50 percent lower risk of long-term whiplash injuries for the occupants in rear impacts than for occupants in cars manufactured after 1997 without whiplash protection systems installed. Nevertheless, whiplash injuries account for ~70 percent of all injuries leading to disability sustained in modern cars on the Swedish market. Since the mid-1960´s, statistical data has shown that females have a higher risk of sustaining whiplash injuries than males, even under similar crash conditions. According to these studies, the whiplash injury risk is up to three times higher for females compared to males (Figure 2).
There are physiological differences in the head/neck of males and females which may contribute to the higher injury risk for females. For example, females have lower strength in their neck muscles and faster neck muscle reflexes. Furthermore, females have smaller necks relative to their head size compared to males. In addition, females have smaller vertebral dimensions than males and a smaller segmental support area, indicating a less stable intervertebral coupling. Differences in the ligaments structural components may lead to decreased stiffness in female spines. It has been reported that the total range of extension–flexion motion is greater for females compared to males and that the total range of retraction–protraction motion is less for females compared to males (in seated posture). In dynamic tests, a more pronounced S-curved shape of the neck for females compared to males has been reported.
Females and males have different anthropometry and mass distribution which may influence the interaction between the upper body and the seatback/head restraint and thus the injury risk. For example, the deflection of the seat frame, seatback padding and springs may depend on the body size as well as the mass and/or the centre of mass of the upper body with respect to the lever about the seatback hinge. The deflection of the structures of the seatback affects the plastic deformation, energy absorption and the dynamic HR distance as well as the rebound of the torso. The motion of the head relative to the head restraint may be affected by seated height in relation to the head restraint geometry. It has been reported that females have a somewhat different dynamic response in rear impact volunteer tests, such as greater head and T1 x-accelerations, lesser NIC value, and more pronounced rebound than males.
Tall females are associated with the greatest whiplash injury risk in rear impacts. However, females of average stature are associated with the highest whiplash injury frequency/incidence in rear impacts. Yet, only the extremes of the female population are accounted for by the existing dummies that may be used for rear impact crash testing; the 50th percentile male rear impact dummy, or possibly the 5th percentile female frontal impact dummy (Figure 24). This may explain why existing whiplash protection concepts are ~30 percent more effective for males than females in respect of permanent medical impairment (Figure 18). This study, which includes five papers (Papers I–V), provides the first step towards 50th percentile female occupant models. The overall objective was to improve the understanding why females are at greater risk of suffering a whiplash injury in rear impacts compared to males and to provide input on future female whiplash protection assessment.

- 49 -
5.1 METHODS The study was divided in two major parts; rear impact volunteer tests (Papers I–III) and 50th
percentile female occupant models (Papers IV–V). The rear impact volunteer studies provided important dynamic response data from tests comprising ~50th percentile females. Data from those tests was compared to previously published dynamic response data from tests comprising ~50th percentile male volunteers in equivalent conditions. In addition, other parameters such as NIC values, initial HR distances and HR contacts were compared for the female and male volunteers. Such comparisons may help understanding the reasons for the injury risk being greater for females compared to males. Whiplash protection systems are however usually not activated in volunteer test conditions. To activate those systems, tests need to be performed at higher velocity changes, where whiplash injuries may occur.
A 50th percentile female rear impact FE model, EvaRID V1.0, was developed from an existing BioRID II model (Paper IV). The anthropometry and mass distribution of the 50th percentile female were specified based on published data. The stiffness and damping properties of the neck and spine were scaled to 70 percent of the original values in the BioRID II model, based on reported differences between females and males in neck muscle strength (Foust et al. 1973). Apart from the muscle strength, further factors may affect the stiffness of the spine, such as muscle reflexes (Foust et al. 1973, Siegmund et al. 2003), ligament properties (Osakabe et al. 2001; Stemper et al. 2008), support area between vertebrae (Stemper et al. 2008), and the effect of ageing (Hanten et al. 1991; Youdas et al. 1992; Hanten et al. 2000; Seacrist et al. 2009). These variables were not considered in the EvaRID V1.0 model. Data from the rear impact test series comprising 50th percentile female volunteers (Paper II) was used for the validation of the model. This new research tool may be used in parallel with the existing BioRID II dummy model in the evaluation of whiplash injury protection systems. However, it is a complicated process to develop computational models of vehicle seats and these models are usually proprietary property of vehicle manufacturers. Mechanical crash test dummies are thus important tools in independent testing of vehicle seats.
A scaled-down rear impact dummy prototype, BioRID50F, was developed using modified BioRID II dummy components. The scaled-down dummy was representative of a 50th percentile female in mass and key dimensions (Paper IV) and intended to function as a representative seat loading device. The BioRID50F was evaluated against new volunteer test results from low-speed rear impact sled tests comprising ~50th percentile female volunteers. Eight rear impact sled tests at 16 km/h (EuroNCAP medium pulse) were performed with the BioRID50F in four different vehicle front seats. These tests provided additional information, complementing the results from the volunteer tests, about differences between females and males regarding dynamic responses and seat interactions.
Another option to study seat interactions and/or seat performances at higher velocity changes would be with PMHS. However, tests performed with PMHS may differ from living humans due to the lack of muscle tonus, especially at low velocity changes. Most whiplash injuries occur at relatively low velocity changes, typically between 10–25 km/h (Eichberger et al. 1996; Kullgren et al. 2003). Since PMHS tests are not repeatable it is neither an option for independent testing of vehicle seats. Nevertheless, rear impact tests comprising PMHS would be a valuable complement to the volunteer tests in future validations of 50th percentile female occupant models.
The overall method used in this study is summarised in Figure 41. The results from Paper II was used as an input to Paper IV, and the results from Paper IV was used as an input to Paper V, indicated by the arrows in the figure. The general outcome of Papers I–III and Paper V was increased knowledge about dynamic responses and seat interactions of 50th percentile female and male occupants.

- 50 -
In addition, a review of the literature related to the topic was performed and the findings were summarised in the introduction section of the thesis.
Rear Impact Volunteer Tests
50th Percentile Female Occupant Models
Paper IVEvaRID V1.0
Anthropometry
Dynamic Responses&
Seat Interactions
Paper IIVolunteer Sled Tests
5 and 7 km/h
Papers I & IIIVolunteer Car-to-Car Tests
4 and 8 km/h
Paper VBioRID50F Prototype Dummy
Sled Tests with Standard Seats
Figure 41. Schematic overview of this study.
General Limitation A general limitation of this study approach was that the same seat and head restraint adjustments for the 50th percentile female and male volunteers in the car-to-car tests (Papers I & III) and in the sled tests (Paper II). The same applied for the finite element model EvaRID V1.0 (Paper IV) and the mechanical BioRID50F (Paper V) as for the BioRID II. The primary reason behind that decision was that neither test procedures nor seat and head restraint adjustments are yet specified for the 50th percentile female. The different seated heights of 50th
percentile females and males may result in different geometries relative to the seat and head restraint, and may thus influence the initial HR distance. It has been reported that females tend to be seated in a more upright position, with three degrees less seatback angle compared to males (Jonsson et at. 2008a). Smaller seatback angles may potentially lead to decreased ramping, shorter HR distance, earlier HR contact, and/or greater accelerations of female occupants, i.e. generally increase the differences reported between females and males. Thus, to use equivalent seat adjustments for females and males may not be fully representative, however, the effect was considered to be of minor importance in this first step toward 50th
percentile female rear impact occupant models. Further studies are required in order to define future test procedures and seat adjustments adapted for 50th percentile female dummy models.
- 51 -
5.2 RESULTS
EvaRID V1.0 Based on insurance records it was confirmed that a 50th percentile female dummy would correlate in size to the females most frequently suffering whiplash injury (Figure 34). Thus, a 50th percentile female rear impact dummy would probably have a greater influence on the whiplash injury statistics compared to a 5th percentile sized dummy.
The rear impact female volunteer data from Paper II was used to validate the EvaRID V1.0 model. The simulated dynamic responses of the EvaRID V1.0 correlated well until ~250 ms with responses being within or close to the corridors, however, the T1 rearward angular displacement was less than 25 percent of the requirement set by the corridor (Figure 37). In spite of an extensive parameter study of the T1 angular displacement, the general response did not improve significantly. In addition to the initial reduction down to 70 percent in stiffness and damping characteristics, values were reduced further down to 50 percent of the original values in the BioRID II model. Also, the stiffness of the spring coils was increased in the lowest seat panel, and elements representing the breasts were removed. Although each of these adjustments resulted in some increase of the T1 angular displacement, the general response did not show any significant improvement, even in different combinations.
To confirm the above results, it was decided to run the BioRID II model in the same test setup as in the volunteer tests. Experimental data and dynamic response corridors were obtained from tests with the BioRID II dummy. It was found that the BioRID II model displayed identical trends as the EvaRID V1.0 model, including the notably lesser T1 rearward angular displacement (Figure 38). The results suggest that the biofidelity of the EvaRID V1.0 and BioRID II models have limitations in terms of a too stiff thoracic spine at low velocity changes (7 km/h) which may be explained by the fact that the BioRID II model was validated against BioRID dummy test results in consumer test loading conditions (EuroNCAP 2010).
Based on these observations it is advisable to further evaluate and improve the BioRID II and EvaRID V1.0 models at low velocity changes. Additionally, the HR distance was relatively short in the volunteer test series (Paper II), which indicates that the head response was largely governed by the head restraint properties and not entirely by the neck properties. Thus, the volunteer tests may be less suitable for fine tuning the neck parameters, stressing the importance of using greater HR distance in future validation studies.
BioRID50F To evaluate the dynamic response of the BioRID50F, one verification test was performed in the same test setup as in previous tests comprising ~50th percentile female volunteers. The overall response of the BioRID50F resembled the female volunteer response corridors (Figure 39). However, the comparison indicates that the cervical and upper thoracic spine segments were stiffer in the BioRID50F than in an average female. The lower thoracic and lumbar joint stiffness may possibly contribute to the differences observed between the BioRID50F and the volunteers; for these segments the BioRID II joint properties were maintained. Consequently the rearward angular displacements of the head and T1 and the rearward x-displacement of the T1 were less for the BioRID50F in comparison to the female volunteers (Figures 39d,e,h). These differences may have been more pronounced in the volunteer test setup due to the substantial initial HR distance (~15 cm). Additional adjustments of the stiffness of the spine are necessary to further improve the dynamic response of the BioRID50F. However, even though the biofidelity of the BioRID50F had some limitations general conclusions could be drawn from the subsequent study with vehicle seats, since the anthropometry and mass distribution was fairly representative of a 50th percentile female.

- 52 -
The head of the BioRID50F consisted of a BioRID II head with the anterior flesh removed. However, the 5th percentile female dummy’s head would probably have resulted in better correlation to the 50th percentile female with regards to anthropometric measures and centre of gravity (Table 13). Due to limited time and the unavailability of a 5th percentile female head, it was decided to use the BioRID’s head instead in the present study.
Table 13. Comparisons of the mass and anthropometric measures of the head for the Hybrid III 5th percentile female, BioRID II 50th percentile male, and the 50th percentile female. Head measures
Hybrid III 5th percentile female
50th percentile female
BioRID 50th percentile male
- Mass 3.731) kg 3.582) kg 4.541) kg - Circumference 53.851) cm 54.903) cm 57.151) cm - Breadth 14.221) cm 14.583) cm 15.491) cm - Depth 18.291) cm 18.693) cm 19.561) cm 1) Product information from Humanetics/Denton. 2) From Table 11. 3) Young et al. (1983).
Dynamic Responses and Seat Interactions In this section the combined results of the volunteer tests (Papers I–III) and the BioRID50F tests in vehicle seats (Paper V) are discussed. In general, the results supported the findings in previous studies, indicating differences in the dynamic responses of females and males (Szabo et al. 1994; Siegmund et al. 1997; Hell et al. 1999; Kumar et al. 2000; Welcher & Szabo 2001; Croft et al. 2002; Mordaka & Gentle 2003; Viano 2003; Ono et al. 2006; Schick et al. 2008).
The HR contact occurred on average earlier for the females than for the males (Papers I–II) (Table 10). In Paper II, the main reason was that the females on average had a shorter initial HR distance than the males. In Paper I, the females had a slightly shorter initial HR distance also; however, it was shown that the females had an earlier HR contact even when the initial distance was equivalent to that of the males (Figure 32). One contributing factor may be the different seated heights of the 50th percentile male and female volunteers. From high-speed film analysis it was noted that the males´ head tended to make contact at a higher position of the head restraint compared to the females. In addition, Svensson et al. (1993b) recorded a delay of the HR contact when the occupant’s torso loaded the seatback and caused the seatback and head restraint to move rearwards relative to the seat base during a rear impact. This effect would probably be less for light and short females, and may thus be another contributing factor to their earlier HR contact (Study I). An earlier HR contact for females has also been found in mathematical simulations with a 5th percentile female model and a 50th percentile male model (Viano 2003).
The peak rearward x-displacements of the head, T1, and head relative to T1 tended to be less for the female volunteers compared to the male volunteers (Figure 30, Table 7) (Papers II–III) as well as for the BioRID50F compared to the BioRID II (Figure 40) (Paper V). In the volunteer tests, the lesser head x-displacement of the females may partly be due to shorter initial HR distance and partly to their mass being lower. For the BioRID50F, the head x-displacements were less even though the initial HR distance was greater compared to the BioRID II. The reason may be that BioRID50F tests were performed at a higher velocity change ( v 16 km/h) compared to the volunteer tests ( v 4–8 km/h), resulting in greater seatback deflections – especially for the BioRID II. In comparison to the BioRID II, the BioRID50F caused 32 to 57 percent less rearward angular displacement of the seatbacks, i.e. the seats were
- 53 -
relatively stiffer for the BioRID50F. This effect was possibly due to the lower mass of the BioRID50F, which, in combination with the lower centre of mass, resulted in less torque relative to the pivot point of the seatback. This would probably also explain the lesser x-displacements of the T1 and of the head relative to T1 for the females compared to the males, as well as for the BioRID50F compared to the BioRID II. However, in one of the tested seats (C) (Paper V), the BioRID50F intruded deeply into the seatback which resulted in a somewhat greater T1 x-displacement compared to the BioRID (Figure 40). The neck region of the BioRID50F may have interacted with the horizontal metal structure of the seat frame, but this was not possible to detect with available instrumentation. Thus, occupants with small anthropometry (typically females) may have different seatback interaction compared to occupants with large anthropometry (typically males). Small occupants may to a higher extent interact with the interior seat structures (such as springs, rods, lumbar support, and steel mesh), while large occupants may interact more with the seat frame. The ability to activate different types of whiplash protection systems for different sized occupants may be affected by such differences in seatback interaction. Lumbar and thoracic spine injuries may possibly arise during the interaction with the seatback during a rear impact. The spine injury risk would potentially be further reduced if the seatback would offer even support for a variety of occupant sizes. Pressure distribution measurements (Olsson et al. 2008) between the seatback and dummy during rear impact testing may be a valuable tool for such evaluation.
The head angular displacements were less for the female volunteers compared to the male volunteers (Figure 31a–d, Table 8) (Paper II–III), and for the BioRID50F compared to the BioRID II (Figure 40) (Paper V). In the volunteer tests, it may be due to the shorter initial HR distance and/or different geometry at the head restraint contact point for the females. Earlier studies have reported that the head angular displacement tends to increase for increasing initial HR distance (Svensson 1993c; Siegmund et al. 2005). For the BioRID50F, the less head angular displacement was probably due to less seatback deflection compared to the BioRID II. The T1 angular displacements were greater for the female volunteers than for the male volunteers in the laboratory seat (Paper II), while in the standard seat they were less (Paper III) (Figure 31e–h, Table 8). The T1 angular displacements were also less for the BioRID50F compared to the BioRID II in the standard seats (Figure 40) (Paper V). The differing results for the rearward angular displacement of the T1 in the laboratory seat compared to the standard seats may be due to different interaction between the upper torso and the seatback.
The peak x-accelerations tended to be greater and earlier for the female volunteers compared to the male volunteers (Papers I–II) (Figure 29). Greater and earlier peak x-accelerations for females have been reported in other volunteer tests (Szabo et al. 1994; Hell et al. 1999; Kumar et al. 2000; Croft et al. 2002; Ono et al. 2006; Schick et al. 2008) as well as in mathematical simulations (Mordaka & Gentle 2003; Viano 2003). Greater x-accelerations were also recorded for the BioRID50F compared to the BioRID II (Figure 40) (Paper V). The greater peak x-accelerations for the females may be due to differences in the interaction with the head restraint and seatback between the female and male volunteers. For example, smaller mass, different torso geometry, and/or differing mass distribution of the females compared to the males may contribute to such differences. The earlier occurrence of the peak head x-acceleration may be due to the earlier HR contact for the females.
The NIC value was on average less for the females compared to the males at 5 km/h, 7 km/h, and at 8 km/h (Paper I–II), while it was similar for the females and males at 4 km/h (Paper I) (Table 9). The NIC values ranged from 1.9 to 6.3 m2/s2 and were far below the threshold value of 15 m2/s2. The lower and earlier NIC value for the females may be due to their earlier HR contact and that the contact force between the upper part of the torso and seat structure peaked after the HR contact, resulting in a smaller relative acceleration between the head and T1 for the females. Assuming less favourable head restraint geometry, with a large HR distance, it is
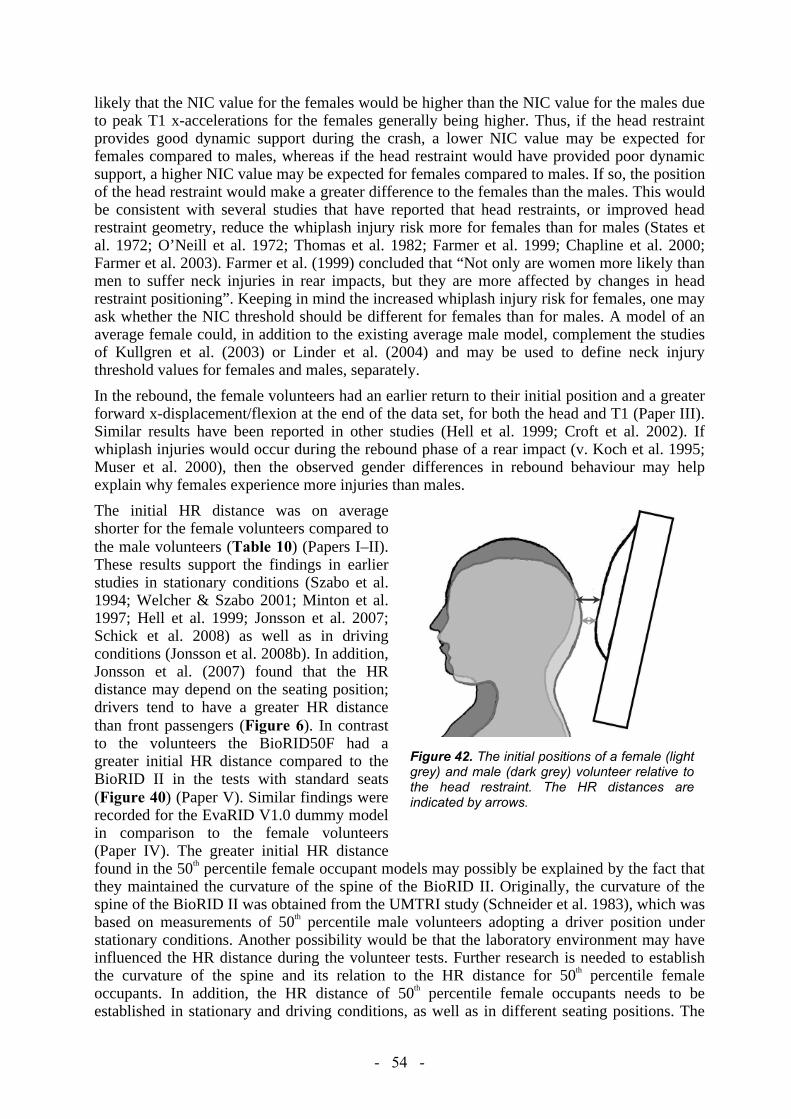
- 54 -
likely that the NIC value for the females would be higher than the NIC value for the males due to peak T1 x-accelerations for the females generally being higher. Thus, if the head restraint provides good dynamic support during the crash, a lower NIC value may be expected for females compared to males, whereas if the head restraint would have provided poor dynamic support, a higher NIC value may be expected for females compared to males. If so, the position of the head restraint would make a greater difference to the females than the males. This would be consistent with several studies that have reported that head restraints, or improved head restraint geometry, reduce the whiplash injury risk more for females than for males (States et al. 1972; O’Neill et al. 1972; Thomas et al. 1982; Farmer et al. 1999; Chapline et al. 2000; Farmer et al. 2003). Farmer et al. (1999) concluded that “Not only are women more likely than men to suffer neck injuries in rear impacts, but they are more affected by changes in head restraint positioning”. Keeping in mind the increased whiplash injury risk for females, one may ask whether the NIC threshold should be different for females than for males. A model of an average female could, in addition to the existing average male model, complement the studies of Kullgren et al. (2003) or Linder et al. (2004) and may be used to define neck injury threshold values for females and males, separately. In the rebound, the female volunteers had an earlier return to their initial position and a greater forward x-displacement/flexion at the end of the data set, for both the head and T1 (Paper III). Similar results have been reported in other studies (Hell et al. 1999; Croft et al. 2002). If whiplash injuries would occur during the rebound phase of a rear impact (v. Koch et al. 1995; Muser et al. 2000), then the observed gender differences in rebound behaviour may help explain why females experience more injuries than males.
The initial HR distance was on average shorter for the female volunteers compared to the male volunteers (Table 10) (Papers I–II). These results support the findings in earlier studies in stationary conditions (Szabo et al. 1994; Welcher & Szabo 2001; Minton et al. 1997; Hell et al. 1999; Jonsson et al. 2007; Schick et al. 2008) as well as in driving conditions (Jonsson et al. 2008b). In addition, Jonsson et al. (2007) found that the HR distance may depend on the seating position; drivers tend to have a greater HR distance than front passengers (Figure 6). In contrast to the volunteers the BioRID50F had a greater initial HR distance compared to the BioRID II in the tests with standard seats (Figure 40) (Paper V). Similar findings were recorded for the EvaRID V1.0 dummy model in comparison to the female volunteers (Paper IV). The greater initial HR distance found in the 50th percentile female occupant models may possibly be explained by the fact that they maintained the curvature of the spine of the BioRID II. Originally, the curvature of the spine of the BioRID II was obtained from the UMTRI study (Schneider et al. 1983), which was based on measurements of 50th percentile male volunteers adopting a driver position under stationary conditions. Another possibility would be that the laboratory environment may have influenced the HR distance during the volunteer tests. Further research is needed to establish the curvature of the spine and its relation to the HR distance for 50th percentile female occupants. In addition, the HR distance of 50th percentile female occupants needs to be established in stationary and driving conditions, as well as in different seating positions. The
Figure 42. The initial positions of a female (light grey) and male (dark grey) volunteer relative to the head restraint. The HR distances are indicated by arrows.

- 55 -
results from such research activities will then be implemented in the mathematical and mechanical 50th percentile female occupant models.
A short HR distance is associated with decreased whiplash injury risk (Carlsson et al 1985; Nygren et al. 1985; Olsson et al. 1990; Deutcher 1996; Farmer et al 1999; Jakobsson et al. 2004b). The shorter HR distance reported for females may seem contradictory to the greater incidence of whiplash injuries in females. However, there are physiological differences between females and males that may contribute to the greater whiplash injury risk in females (Buck et al. 1959; States et al. 1972; Foust et al. 1973; Hanten et al. 1991, 2000; Vasavada et al. 2001, 2008; Siegmund et al. 2003; DeSantis Klinich et al. 2004; Stemper et al. 2008).Studies have indicated that the whiplash injury risk is approximately twice as high for females as for males of equal size (Kihlberg 1969; Temming & Zobel 1998; Lundell et al. 1998; Jakobsson et al. 2000). More research is required in order to understand how these physiological differences between females and males may influence the whiplash injury risk. In the long term perspective, this may also improve the understanding of the whiplash injury mechanisms in general.
Studies have indicated that neck injuries do not occur in rear impacts if the head is in contact with the head restraint at the time of the crash (Mertz & Patrick 1967; Jakobsson et al. 1994). In the study by Mertz & Patrick (1967), rear impact volunteer sled tests were performed in a seat with a high rigid seatback. No signs of injury were registered, even though the volunteer was subjected to velocity changes of up to 30 km/h. This was probably because the head of the volunteer was in contact with the head restraint from the start of impact. Similar results were presented by Jakobsson et al. (1994). The Saab active head restraint, SAHR (Viano & Olsen 2001), was developed to improve the whiplash injury protection even if the head restraint is not adjusted to the most favorable position. As the occupant is pressed into the seatback during a rear impact, the head restraint is raised and moved forward, providing earlier support of the head and neck. The injury reducing effect of the SAHR is approximately of 33 to 75 percent (Viano & Olsen 2001; Farmer et al. 2003; Kullgren & Krafft 2010; Kullgren, verbal communication 2012-03-14). Recent studies have, however, indicated that the SAHR system may be more effective for males than females with regards to permanent medical impairment (Kullgren & Krafft 2010; Kullgren, verbal communication 2012-03-14).
Seatback yielding and/or seat track failure decreases the whiplash injury risk in rear impacts (Kihlberg 1969; States et al. 1969; O’Neill et al. 1972; Thomas et al. 1982; Foret-Bruno et al. 1991; Parkin et al 1995; Morris & Thomas 1996; Krafft et al. 2004; Jakobsson et al. 2004b, 2008); especially in females (Thomas et al. 1982; Jakobsson et al. 2004b, 2008). Yet, seatbacks have increased up to 5.5-fold in strength from the 1960´s to the 1990´s in order to increase the vehicle crashworthiness in high-speed rear impacts (Viano 2008). The increase in strength has resulted in greater seat stiffness. The boosted seat stiffness affects the interaction between the occupant and the seatback and may increase the forces on the neck. This is believed to be one of the reasons for the increase in whiplash injuries since the late 1960´s; especially in females (Morris & Thomas 1996; Hell et al. 1998; Viano 2003). Controlled seat yielding is one option to reduce occupant accelerations, and several technical solutions have been presented (Krafft et al. 2004; Jakobsson et al. 2000; Zellmer et al 2001; Schmitt el al. 2003). Krafft et al. (2004) obtained a substantial reduction of the whiplash injury risk when the forward acceleration of the occupant was reduced after the introduction of yielding of the seat front attachments to the floor (the only design change made to the vehicle). Volvo’s whiplash protection system (WhiPS) is based on controlled yielding of the seatback (Jakobsson et al. 2000) and the injury reducing effect has been reported to be in the range of 31 to 71 percent (Farmer et al. 2003; Jakobsson et al. 2008; Kullgren & Krafft 2010; Kullgren, verbal communication 2012-03-14). Studies have indicated that the injury reducing effect of the WhiPS may be somewhat greater for females compared to males (Jakobsson 2004b; Kullgren & Krafft 2010; Kullgren, verbal
- 56 -
communication 2012-03-14). By adapting the stiffness of the seats to account for smaller occupants as well, further reductions in the whiplash injury risk in females may thus be expected. A mechanical or computational model of the average female would be an important tool when evaluating the seat response with regards to the female properties.
It has been reported that the dynamic response of the BioRID 50th percentile male dummy is humanlike in low speed rear impacts (Philippens et al. 2002). The dynamic response of the BioRID dummy was validated with regard to male volunteer tests in Davidsson et al. (1999a), the same tests that the female volunteers in Paper II were compared to. However, the results in Paper II show that the female volunteers had a somewhat different dynamic response than the male volunteers. Similar findings were reported in Papers I, III, and V. Comparing the responses of the BioRID50F and the BioRID II (Figure 40), different trends for different seat models can be observed. These results indicate that there does not seem to be a simple way to “reinterpret” or “scale” data obtained with the BioRID II to address the female dynamic response. Thus, it is important that future whiplash protection systems are developed and evaluated with consideration of the female properties as well. Based on mathematical simulations, Mordaka & Gentle (2003) concluded that a “scaled down male model is not adequate to simulate female responses even though the scaling constitutes a good height and mass match”. Additionally, Vasavada et al. (2008) found that “male and female necks are not geometrically similar and indicate that a female-specific model will be necessary to study gender differences in neck-related disorders”, i.e. a female model needs to be based on data from tests comprising females. The results of this study support these findings and stress the importance of further research and development of 50th percentile female occupant models.
- 57 -
6. CONCLUSIONS AND RECOMMENDATIONS
General conclusions - The 50th percentile female dummy would correlate in size to the females that are most
frequently injured in rear impacts. - The selected size of the 50th percentile female (stature 161.8 cm, mass 62.3 kg) correlates in
size of existing adult dummy families. - In comparison to the BioRID II, the BioRID50F caused 32 to 57 percent less rearward
angular displacement of the seatbacks, i.e. the seats were relatively stiffer for the BioRID50F. - Occupants with small anthropometry (typically females) may have different seatback
interaction compared to occupants with large anthropometry (typically males). Small occupants may to a higher extent interact with the interior seat structures (such as springs, rods, lumbar support, and steel mesh), while large occupants may interact more with the seat frame.
- Different trends for different seat models were observed when comparing the dynamic responses of the BioRID50F and the BioRID II. There does not seem to be a simple way to “reinterpret” or “scale” data obtained with the BioRID II to address the female dynamic response.
- The combined results from the volunteer tests and the BioRID50F tests in vehicle seats supported the findings in previous studies, indicating differences in the dynamic responses of females and males. The females tended to have earlier HR contact, less rearward displacements, greater forward accelerations, and a more pronounced rebound than the males.
- The NIC values tended to be lower for the female volunteers compared to the male volunteers.
- Due to short initial HR distances, the volunteer tests in this study may be less suitable for fine tuning the neck parameters in the 50th percentile female occupant models, stressing the importance of using greater HR distance in future validation studies.
Recommended improvement of the EvaRID V1.0 - It is advisable to further evaluate and improve the stiffness properties in the upper torso of the
EvaRID V1.0 as well as the BioRID II models at low velocity changes.
Recommended improvement of the BioRID50F - Additional adjustments of the stiffness of the spine are necessary to further improve the
dynamic response of the BioRID50F.- The 5th percentile female dummy’s head would probably result in better correlation to the 50th
percentile female dummy’s head with regards to anthropometric measures and centre of gravity compared to the 50th percentile male dummy’s head.
Recommended research - To define future test procedures and seat adjustments adapted for 50th percentile female
dummy models. - To establish the curvature of the spine and its relation to the HR distance for seated 50th
percentile female occupants. In addition, the HR distance of 50th percentile female occupants needs to be established in stationary and driving conditions, as well as in different seating positions.

- 58 -
- To understand how physiological differences between females and males may influence the whiplash injury risk. In the long term perspective, this may also improve the understanding of the whiplash injury mechanisms in general.
- To define neck injury reference values for females and males, separately. These results need to be implemented in improved computational and mechanical 50th
percentile female occupant models. In addition, more research is recommended in order to evaluate the performance of different types of whiplash protection systems for females and males, separately.
- 59 -
REFERENCES
Abraham S, Johnson CL, Najjar F (1979a) Weight and Height of Adults 18-74 Years of Age, Vital Health Statistics, Series 11, Number 211, National Center for Health Statistics, Hyattsville, MD, USA
Abraham S, Johnson CL, Najjar MF (1979b) Weight and Height and Age for Adults 18-74 Years, Vital Health Statistics, Series 11, Number 208, National Center for Health Statistics, Hyattsville, MD, USA
Aldman B (1986) An Analytical Approach to the Impact Biomechanics of Head and Neck Injury, Proc. 30th Annual AAAM, Montreal, Quebec (Canada), pp. 446–454
Aprill C, Bogduk N (1992) The Prevalence of Cervical Zygapophyseal Joint Pain: A First Approximation, Spine, Vol. 17, pp. 744–747
Backaitis SH, Mertz HJ (1994) Hybrid III: the first human-like crash test dummy, Society of Automotive Engineers , Warrendale, PA (USA), ISBN 1-56091-449-1
Barnsley L, Lord S, Bogduk N (1993) Comparative Local Anaesthetic Blocks in the Diagnosis of Cervical Zygapophyseal Joint Pain. Pain, Vol. 55, pp. 99–106.
Barnsley L, Lord S, Bogduk N. (1994) Whiplash Injury, Pain, Vol. 58, No. 3, pp. 283–307
Bogduk N, Marsland A (1988) The Cervical Zygapophyseal Joints as a Source of Neck Pain,Spine, Vol. 13, No. 6, pp. 610–617
Boström O, Svensson MY, Aldman B, Hansson HA, Håland Y, Lövsund P, Seeman T, Suneson A, Sälsjö A, Örtengren T (1996) A New Neck Injury Criterion Candidate - Based on Injury Findings in the Cervical Spinal Ganglia after Experimental Neck Extension Trauma, Proc. IRCOBI Conf., Dublin (Ireland), pp. 123–136
Boström O, Fredriksson R, Håland Y, Jakobsson L, Krafft M, Lövsund P, Muser MH, Svensson MY (2000) Comparison of car seats in low speed rear-end impacts using the BioRID dummy and the new neck injury criterion (NIC), Accid. Anal. Prev., Vol 32, No. 2, pp. 321–328
Buck CA, Dameron FB, Dow MJ, Skowlund HV (1959) Study of Normal Range of Motion in the Neck Utilizing a Bubble Goniometer, Arch. Phys. Med. Rehabil., Vol. 40, pp. 390–392
Cappon HJ, Philippens MMGM, Van Ratingen MR, Wismans JSHM (2000) Evaluation of dummy behaviour during low severity rear impact, Proc. IRCOBI Conf., Montpellier, (France), pp. 53–65
Carlsson G, Nilsson S, Nilsson-Ehle A, Norin H, Ysander L, Örtengren R (1985) Neck Injuries in Rear End Car Collisions; Biomechanical Considerations to Improve Head Restraints,Proc. IRCOBI Conf., Göteborg (Sweden), pp. 277–289
Carstensen TB, Frostholm L, Oernboel E, Kongsted A, Kasch H, Jensen TS, Fink P (2011) Are There Gender Differences in Coping with Neck Pain Following Acute Whiplash Trauma? A 12-Month Follow-Up Study, Eur. J. Pain, Vol. 16, No. 1, pp. 49–60
Chang F, Carlsson A, Lemmen P, Svensson M, Davidsson J, Schmitt K-U, Zhu F, Linder A (2010) EvaRID, a dummy model representing females in rear end impacts, Proc. Whiplash 2010 Neck Pain in Car Crashes, 3rd International Conference, Munich, Germany
Chapline JF, Ferguson SA, Lillis RP, Lund AK, Williams AF (2000) Neck pain and head restraint position relative to the driver's head in rear-end collisions, Accid. Anal. Prev., Vol 32, No. 2, pp. 287–297.

- 60 -
Cheng H, Obergefell L, Rizer A (1994) Generator of body (GEBOD) manual, Report No. AL/CF-TR-1994-0051, Human Effectiveness Directorate, Crew Surviability and Logistics Division, Write-Patterson Air Force Base, Ohio, USA
Croft AC, Haneline MT, Freeman MD (2002) Differential Occupant Kinematics and Forces Between Frontal and Rear Automobile Impacts at Low Speed: Evidence for a Differential Injury Risk, Proc. IRCOBI Conf., Munich (Germany), pp. 365–366
Cullen E, Stabler KM, Mackay GM, Parkin S (1996) Head restraint positioning and occupant safety in rear impacts: the case for smart restraints. Proc. IRCOBI Conf., Lyon (France), pp. 137–152
Davidsson J, Deutscher C, Hell W, Svensson MY, Linder A, Lövsund P (1998) Human Volunteer Kinematics in Rear-End Sled Collisions, Proc. IRCOBI Conf., Göteborg (Sweden), pp. 289–301
Davidsson J, Flogård A, Lövsund P, Svensson MY (1999a) BioRID P3 – Design and Performance Compared to Hybrid III and Volunteers in Rear Impacts at V=7 km/h, Proc. 43rd Stapp Car Crash Conf., SAE 99SC16, pp. 253–265
Davidsson ET AL (1999b) A Comparison between volunteer, BioRID P3 and Hybrid III performance in Rear Impacts, Proc IRCOBI 1999 pp 165–178
Deans GT, Magalliard JN, Malcolm Kerr, Rutherford WH (1987) Neck sprain - a Major Cause of Disability Following Car Accidents, Injury, Vol. 18, No. 2, pp. 10–12
Delannoy P, Diboine A (2001) Structural Front Unit Global Approach, Proc. 17th ESV Conf., Amsterdam (The Netherlands), pp. 1–11
Deng B, Begeman PC, Yang KH, Tashman S, King AI (2000) Kinematics of Human Cadaver Cervical Spine During Low Speed Rear-End Impacts, Proc. 44th Stapp Car Crash Conf., Society of Automotive Engineers (2000-01-SC13), Warrendale, PA (USA), pp. 171–188
DeSantis Klinch K, Saul RA, Auguste G, Backaitis S, Kleinberger M (1996) Techniques for Developing Child Dummy Protection Reference Values, NHTSA Docket No. 74–14
DeSantis Klinich K, Ebert SM, Van Ee CA, Flannagan CA, Prasad M, Reed MP, Schneider LW (2004) Cervical spine geometry in the automotive seated posture: variations with age, stature, and gender, Stapp Car Crash J., Vol. 48, pp. 301–330
Deutscher C (1996) Movement of Car Occupants in Rear-End Accidents, Paper No. 96A5016, Int. Conf. ‘Active and Passive Automobile Safety’, Capri, Italy, pp. 147–154
Diffrient N, Tilley AR, Bardagjy JC (1974) Humanscale 1/2/3 – A Portfolio of Information,The MIT Press, Cambridge, MA.
Dolinis J (1997) Risk Factors for “Whiplash” in Drivers: a Cohort Study of Rear-End Traffic Crashes, Injury, Vol. 28, No. 3, pp. 173–179
Eichberger A, Geigl BC, Moser A, Fachbach B, Steffan H (1996) Comparison of Different Car Seats Regarding Head-Neck Kinematics of Volunteers During Rear End Impact, Proc. IRCOBI Conf., Brunnen (Switzerland), pp. 153–164
EuroNCAP (European New Car Assessment Programme) (2010) The Dynamic Assessment of Car Seats for Neck Injury Protection Testing Protocol, Version 3.0, Brussels, Belgium
Farmer CM, Wells JK, Werner JV (1999) Relationship of Head Restraint Positioning to Driver Neck Injury in Rear-End Crashes, Accid. Anal. Prev., Vol. 31, No. 6, pp. 719–728
- 61 -
Farmer CM, Wells JK, Lund AK (2003) Effects of Head Restraint and Seat Redesign on Neck Injury Risk in Rear-End Crashes, Traffic Inj. Prev., Vol. 4, No. 2, pp. 83–90
Foret-Bruno JY, Dauvilliers F, Tarriere C, Mack P (1991) Influence of the Seat and Head Rest Stiffness on the Risk of Cervical Injuries in Rear Impact, Proc. 13th ESV Conf. (91-SS-W-19), Paris (France), pp. 968–974
Foust DR, Chaffin DB, Snyder RG, Baum JK (1973) Cervical Range of Motion and Dynamic Response and Strength of Cervical Muscles, Proc. 17th Stapp Car Crash Conf., Society of Automotive Engineers (730975), Warrendale, PA (USA), pp. 285–308
Galasko CSB, Murray PM, Pitcher M, Chambers H, Mansfield S, Madden M, Jordon C, Kinsella A, Hodson M (1993) Neck Sprain after Road Traffic Accidents: A Modern Epidemic, Injury, Vol. 24, No. 3, pp. 155–157
Galasko CSB, Murray PA, Pitcher M (1996) Whiplash Associated Disorders, Proc. 15th ESV Conf., Melbourne (Australia), pp. 1504–1513
Hanson L, Sperling L, Gard G, Ipsen S, Olivares Vergara C (2008) Swedish Anthropometrics for Product and Workplace Design, Appl. Ergon., Vol. 40, No. 4, pp. 797–806
Hanten WP, Lucio RM, Russell JL, Brunt D (1991) Assessment of Total Head Excursion and Resting Head Posture, Arch. Phys. Med. Rehabil., Vol. 72, No. 11, pp. 877–880
Hanten WP, Olson S L, Russell JL, Lucio RM, Campbell AH (2000) Total Head Excursion and Resting Head Posture: Normal and Patient Comparisons, Arch. Phys. Med. Rehabil., Vol. 81, No. 1, pp. 62–66
Heitplatz F, Sferco R, Tay P, Reim J, Kim A, Prasad P (2003) An Evaluation of Existing and Proposed Injury Criteria with Various Dummies to Determine Their Ability to Predict the Levels of Soft Tissue Neck Injury Seen in Real Wold Accidents, Proc. 18th ESV Conf., Nagoya (Japan), pp. 1–8
Hell W, Langwieder K, Walz F (1998) Reported Soft Tissue Neck Injuries After Rear-End Car Collision, Proc. IRCOBI Conf., Göteborg (Sweden), pp 261–274
Hell W, Langwieder K, Walz F, Muser M, Kramer M, Hartwig E (1999) Consequences for Seat Design due to Rear End Accident Analysis, Sled Tests and Possible Test Criteria for Reducing Cervical Spine Injuries after Rear-End Collision, Proc. IRCOBI Conf., Sitges (Spain), pp. 243–259
Jakobsson l, Norin H, Jerkström C, Svensson S-E, Johnsén P, Isaksson-Hellman I, Svensson MY (1994) Analysis of Different Head and Neck Responses in Rear-End Car Collisions Using a New Human-Like Mathematical Model, Proc. IRCOBI Conf., Lyon (France), pp 109–125
Jakobsson L, Lundell B, Norin H, Isaksson-Hellman I (2000) WHIPS-Volvo’s Whiplash Protection Study, Accid. Anal. Prev., Vol. 32, No. 2, pp. 307–319
Jakobsson L, Norin H, Svensson MY (2004a) Parameters Influencing AIS 1 Neck Injury Outcome in Frontal Impacts, Traffic Inj. Prev., Vol. 5, No. 2, pp. 156–163
Jakobsson, L (2004b) Field Analysis of AIS1 Neck Injuries in Rear-End Car Impacts-Injury Reducing Effect of the WHIPS Seat, J. of Whiplash & Related Disorders, Vol. 3, No. 2, pp. 37–54
Jakobsson L, Isaksson-Hellman I, Lindman M (2008) WHIPS (Volvo Cars’ Whiplash Protection System) – The Development and Real-World Performance, Traffic Inj. Prev., Vol. 9, No. 6, pp. 600–605

- 62 -
Jonsson B, Stenlund H, Svensson MY, Björnstig U (2007) Backset and Cervical Retraction Capacity Among Occupants in a Modern Car, Traffic Inj. Prev., Vol. 8, No. 1, pp. 87–93
Jonsson B, Stenlund H, Svensson MY, Björnstig U (2008a) Seat adjustment – capacity and repeatability among occupants in a modern car, Ergonomics, Vol. 51, No. 2, pp. 232–4
Jonsson B, Stenlund H, Björnstig U (2008b) Backset – Stationary and During Car Driving,Traffic Inj. Prev., Vol. 9, No. 6, pp. 568–373
Jonsson H, Bring G, Rauschning W, Sahlstedt B (1991) Hidden Cervical Spine Injuries in Traffic Accident Victims with Skull Fractures, J. Spinal Disord., Vol. 4, No. 3, pp. 251–263
Kaale BR, Krakenes J, Albrektsen G, Wester K (2005) Head Position and Impact Direction in Whiplash Injuries: Associations with MRI Verified Lesions of Ligaments and Membranes in the Upper Cervical Spine, J. Neurotrauma, Vol. 22, No. 11, pp. 1294–1302.
Kahane CJ (1982) An Evaluation of Head Restraints, Technical Report DOT HS-806 108 FMVSS 202, US DoT, National Highway Traffic Safety Administration, Washington, DC
Kaneoka K, Ono K, Inami S, Hayashi K (1999) Motion analysis of cervical vertebrae during whiplash loading, Spine, Vol. 24, No. 8, pp. 763–770
Kihlberg JK (1969) Flexion-Torsion Neck Injury in Rear Impacts, Proc. 13th AAAM, pp. 1–16
Kleinberger M, Sun E, Eppinger R, Kuppa S, Saul R (1998) Development of Improved Injury Criteria for the Assessment of Advanced Automotive Restraint Systems, NHTSA report
v. Koch M, Nygren A, Tingvall C (1994) Impairment Pattern in Passenger Car Crashes, a Follow-up of Injuries Resulting in Long Term Consequences, Proc. 14th ESV Conf. (94-S5-O-02), Munich (Germany), pp. 776–781
v. Koch M, Kullgren A, Lie A, Nygren A, Tingvall C (1995) Soft Tissue Injury of the Cervical Spine in Rear-End and Frontal Car Collisions, Proc. IRCOBI Conf., Brunnen (Switzerland), pp. 273–283
Krafft M (1998) A Comparison of Short- and Long-Term Consequences of AIS1 Neck Injuries, in Rear Impacts, Proc. IRCOBI Conf., Göteborg (Sweden), pp. 235–248
Krafft M, Kullgren A, Ydenius A, Tingvall C (2002) Influence of Crash Pulse Characteristics on Whiplash Associated Disorders in Rear Impacts – Crash Recording in Real Life Crashes, Traffic Inj. Prev., Vol. 3, No. 2, pp. 141–149
Krafft M, Kullgren A, Lie A, Tingvall C (2003) The Risk of Whiplash Injury in the Rear Seat Compared to the Front Seat in Rear Impacts, Traffic Inj. Prev., Vol. 4, No. 2, pp. 136–140
Krafft M, Kullgren A, Ydenius A, Boström O, Håland Y, Tingvall C (2004) Rear Impact Neck Protection by Reducing Occupant Forward Acceleration – A Study of Cars on Swedish Roads Equipped with Crash Recorders and a New Anti-Whiplash Device, Proc. IRCOBI Conf., Graz (Austria), pp. 221–231
Kullgren A, Krafft M, Malm S, Ydenius A, Tingvall C (2000) Influence of Airbags and Seatbelt Pretensioners on AIS1 Neck Injuries for Belted Occupants in Frontal Impacts,Proc. 44st Stapp Car Crash Conf., Society of Automotive Engineers (2000-01-SC09), Warrendale, PA (USA), pp. 117–125
Kullgren A, Eriksson L, Boström O, Krafft M (2003) Validation of neck injury criteria using reconstructed real-life rear-end crashes with recorded crash pulses, Proc. 18th ESV Conf. (344), Nagoya (Japan), pp. 1–13

- 63 -
Kullgren A, Krafft M, Lie A, Tingvall C (2007) The Effect of Whiplash Protection Systems in Real-Life Crashes and Their Correlation to Consumer Crash Test Programmes, Proc. 20th
ESV Conf. (07-0468), Lyon (France), pp. 1–7
Kullgren A, Krafft M (2010) Gender Analysis on Whiplash Seat Effectiveness: Results from Real-World Crashes, Proc. IRCOBI Conf., Hanover (Germany), pp. 17–28
Kumar S, Narayan Y, Amell T (2000) Role of Awareness in Head-Neck Acceleration in Low Velocity Rear-End Impacts, Accid. Anal. Prev., Vol. 32, No, 2, pp. 233–241
Linder A, Lövsund P, Steffan H (1999) Validation of the BioRID P3 against Volunteer and PMHS Test Data and Comparison to the Hybrid III in Low-Velocity Rear-End Impacts,Proc. 43rd AAAM, Barcelona (Spain), pp. 367–381
Linder A (2001) Neck Injuries in Rear Impacts, PhD Thesis, Department of Machine and Vehicle Systems, Crash Safety Division, Chalmers University of Technology, Göteborg, Sweden, ISBN 91-7291-106-9
Linder A, Avery M, Kullgren A, Krafft M (2004) Real-world rear impacts reconstructed in sled tests, Proc. IRCOBI Conf., Graz (Austria), pp. 233–244
Linder A, Svensson M, Carlsson A, Lemmen P, Chang F, Schmitt K-U, Kullgren A (2011) EvaRID - Anthropometric and biomechanical specification of a finite element dummy model of an average female for rear impact testing, Proc. 22nd ESV Conf., Washington (USA)
Linnman C, Appel L, Söderlund A, Frans O, Engler H, Furmark T, Gordh T, Långström B, Fredrikson M (2009) Chronic whiplash symptoms are related to altered regional cerebral blood flow in the resting state, Eur. J. Pain, Vol. 13, No. 1, pp. 65–70
Luan F, Yang KH, Deng B, Begeman PC, Tashman S, King AI (2000) Qualitative Analysis of Neck Kinematics during Low-speed Rearend Impact, Clin. Biomech., Vol. 15, pp. 649–657.
Lundell B, Jakobsson L, Alfredsson B, Jernström C, Isaksson-Hellman I (1998) Guidelines for and the Design of a Car Seat Concept for Improved Protection Against Neck Injuries in Rear-End Car Impacts, Proc. Int. Congress and Exposition Detroit, Michigan (USA), Society of Automotive Engineers (SAE 980301), Warrendale, PA (USA)
Lövsund P, Nygren Å, Salen B, Tingvall C (1988) Neck Injuries in Rear-End Collisions among Front and Rear Seat Occupants, Proc. IRCOBI Conf., Bergisch-Gladbach (Germany), pp. 319–325
Maag U, Desjardins D, Bourbeau R, Laberge-Nadeau C (1990) Seat Belts and Neck Injuries,Proc. IRCOBI Conf., Bron (France), pp. 1–14
McConville JT, Churchill TD, Kaleps I, Clauser CE, Cuzzi J (1980) Anthropometric Relationships of Body and Body Segment Moments of Inertia, AMRL-TR-80-119, Wright-Patterson AFB, Aerospace Medical Research Laboratory, Yellow Springs, OH, USA
Mertz HJ, Patrick LM (1969) Investigation of the Kinematics and Kinetics of Whiplash, Proc. 11th Stapp Car Crash Conf., SAE 670919, SAE Inc., New York (USA), pp. 267–315
Mertz HJ, Patrick LM (1971) Strength and Response of the Human Neck, Proc. 15th Stapp Car Crash Conf., SAE 710855, SAE Inc., New York (USA), pp. 207–255
Minton R, Murray P, Pitcher M, Galasko CSB (1997) Causative Factors in Whiplash Injury: Implications for Current Seat and Head Restraint Design, Proc. IRCOBI Conf., Hanover (Germany), pp. 207–222
Mordaka J, Gentle RC (2003) The Biomechanics of Gender Difference and Whiplash Injury: Designing Safer Car Seats for Women, Acta Politechnica, Vol. 43, No. 3, pp. 47–54.

- 64 -
Mordaka J (2004) Finite Element Analysis of Whiplash Injury for Women, PhD Thesis, Nottingham Trent University, UK
Morris AP, Thomas PD (1996) Neck Injuries in the UK Co-operative Crash Injury Study, Proc. 40th Stapp Car Crash Conf., SAE 962433), pp. 317–329
Moss S, Wang Z, Salloum M, Reed M, van Ratingen M, Beusenberg M (2000) Anthropometry for WorldSID a World-Harmonized Midsize Male Side Impact Crash Dummy, SAE Paper No. 220-01-2202, Society of Automotive Engineers, Inc., Warrendale, PA, USA
Muser MH, Walz, FH, Zellmer H (2000) Biomechanical Significance of the Rebound Phase in Low Speed Rear End Impacts, Proc. IRCOBI Conf., Montpellier (France), pp. 411–424
Najjar MF, Rowland M (1987) Anthropometric Reference Data and Prevalence of Overweight, United States, 1976-80, Data from the National Health Survey series 11, No. 238 (PHS) 87-1688. National Center for Health Statistics, Department of Health and Human Services, Hyattsville, MD
Narragon EA (1965) Sex Comparisons in Automobile Crash Injury, CAL Report No. VJ-1823-R15
NHTSA (National Highway Traffic Safety Administration) (2004) Federal Motor Vehicle Safety Standards; Head Restraints; Final Rule, Federal Register, Vol. 69, No. 239, Rules and Regulations, 49 CFR Part 571, [Docket No. NHTSA–2004–19807], RIN 2127–AH09, pp. 74848–74891
Nightengale RW, Chancey VC, Ottaviano D, Luck JF, Tran L, Prange M, Myers BS (2007) Flexion and extension structural properties and strengths for male cervical spine segments,J. Biomech., Vol. 40, No. 3, pp. 535–542
Nygren Å, Gustafsson H, Tingvall C (1985) Effects of Different Types of Headrests in Rear-End Collisions, Proc. 10th ESV Conf., Oxford (UK), pp. 85–90
Nygren A (1984) Injuries to Car Occupants - Some Aspects of the Interior Safety of Cars, Acta Oto - Laryngologica - Supp1. 395, ISSN 0365-5237
Olsson I, Bunketorp O, Carlsson G, Gustafsson C, Planath I, Norin H, Ysander L (1990) An In-Depth Study of Neck Injuries in Rear End Collisions, Proc. IRCOBI Conf., Lyon (France), pp. 269–278
Olsson K, Blomkvist A, Beckung E. (2008) Pressure mapping as a complement in clinical sitting analysis in children during activity, Advances in Physiotherapy, Vol. 10, No. 2, pp. 76–84
O’Neill B, Haddon W, Kelley AB, Sorenson WW (1972) Automobile Head Restraints—Frequency of Neck Injury Claims in Relation to the Presence of Head Restraints, Am. J. Public Health, Vol. 62, No. 3, pp. 399–405
Ono K, Kanno M (1996) Influence of the Physical Parameters on the Risk to Neck Injuries in Low Impact Speed Rear Collisions, Accid. Anal. Prev., Vol. 28, No. 4, pp. 493–499
Ono K, Kaneoka K, Wittek A, Kajzer J (1997) Cervical Injury Mechanism Based on the Analysis of Human Cervical Vertebral Motion and Head-Neck-Torso Kinematics during Low-speed Rear Impacts, Proc. 41st Stapp Car Crash Conf., SAE 973340, pp. 339–356
Ono K, Ejima S, Suzuki Y, Kaneoka K, Fukushima M, Ujihashi S (2006) Prediction of Neck Injury Risk Based on the Analysis of Localized Cervical Vertebral Motion of Human Volunteers During Low-Speed Rear Impacts. Proc. IRCOBI Conf., Madrid (Spain), pp. 103–113

- 65 -
Örtengren T, Hansson HA, Lövsund P, Svensson MY, Suneson A, Saljo A (1996) Membrane Leakage in Spinal Ganglion Nerve Cells Induced by Experimental Whiplash Extension Motion: A Study in Pigs, J. Neurotrauma, Vol. 13, pp. 171–180
Osakabe T, Hayashi M, Hasegawa K, Okuaki T, Ritty TM, Mecham RP, Wachi H, Seyama RP (2001) Age- and Gender-Related Changes in Ligament Components, Ann. Clin. Biochem., Vol. 38, pp. 527–532
Otremski I, Marsh JL, Wilde BR, McLardy Smith PD, Newman RJ (1989) Soft tissue cervical injuries in motor vehicle accidents, Injury, Vol. 20, No. 6, pp. 349–351
Panjabi MM, Wang J-L, Delson N (1999) Neck Injury Criterion Based on Intervertebral Motions and its Evaluation Using an Instrumented Neck Dummy, Proc. IRCOBI Conf., Sitges (Spain) pp. 179–190
Panjabi MM (2006) A Hypothesis of Chronic Back Pain: Ligament Subfailure Injuries Lead to Muscle Control Dysfunction, Eur. Spine J., Vol. 15, No. 5, pp. 668–676
Parkin S, Mackay GM, Hassan AM, Graham R (1995) Rear End collisions and seat performance - to yield or not to yield, Proc. 39th AAAM, Chicago, Illinois (USA), pp. 231–244
Pearson AM, Ivancic PC, Ito S, Panjabi MM (2004) Facet Joint Kinematics and Injury Mechanisms during Simulated Whiplash, Spine, Vol. 29, pp. 390–397
Pettersson K, Kärrholm J, Toolanen G, Hildingsson C (1995) Decreased Width of the Spinal Canal in Patients With Chronic Symptoms After Whiplash Injury, Spine, Vol. 20, No.15, pp. 1664–1667
Pheasant S, Haslegrave C (2006) Bodyspace: Anthropometry, Ergonomics, and the Design of Work, Taylor & Francis, 3rd ed., ISBN 0-415-28520-8
Philippens M, Cappon H, Van Ratingen M, Wismans J, Svensson M, Sirey F, Ono K, Nishimoto N, Matsuoka F (2002) Comparison of the Rear Impact Biofidelity of BioRID II and RID 2, Stapp Car Crash J., Vol. 46, pp. 461–476
Reddy M, Reddy B, Schoggl A, Saringer W, Matula C (2002) The Complexity of Trauma to the Cranio-Cervical Junction: Correlation of Clinical Presentation with Doppler Flow Velocities in the V3-Segment of the Vertebral Arteries, Acta Neurochir. (Wien), Vol. 144, pp. 575–580
Richter M, Otte D, Pohlemann T, Krettek C, Blauth M (2000) Whiplash-Type Neck Distortion in Restrained Car Drivers: Frequency, Causes and Long-Term Results, Eur. Spine J., Vol. 9, No. 2, pp. 109–117
Robbins DH (1983a) Anthropometric specifications for mid-sized male dummy, Final Report, UMTRI-83-53-2, University of Michigan Transportation Research Institute, Ann Arbor, Michigan, USA
Robbins DH. (1983b) Anthropometric specifications for small female and large male dummies,Final Report, UMTRI-83-53-3, University of Michigan Transportation Research Institute, Ann Arbor, Michigan, USA
Ryan GA, Taylor GW, Moore VM, Dolinis J (1994) Neck Strain in Car Occupants: Injury Status after 6 months and Crash Related Factors, Injury, Vol. 25, pp. 533–537
Schick S, Horion S, Thorsteinsdottir K, Hell W (2008) Differences and Commons in Kinetic Parameters of Male and Female Volunteers in Low Speed Rear End Impacts, TÜV SÜD, Whiplash – Neck Pain in Car Crashes, 2nd Intern. Conf., Erding (Germany)

- 66 -
Schmitt K-U, Muser M, Walz F, Niederer P (2002) Nkm – a proposal for a neck protection criterion for low speed rear-end impacts, Traffic Inj. Prev., Vol. 3, No. 2, pp. 117–126
Schmitt K-U, Muser M, Heggendorn M, Niederer P, Walz F (2003) Development of a Damping Seat Slide to Reduce Whiplash Injury, Proc. of the Institution of Mechanical Engineers, Part D: Journal of Automobile Engineering, Vol. 217, pp. 949–955
Schmitt K-O, Niederer PF, Muser MH, Walz F (2004) Trauma Biomechanics: Introduction to Accidental Injury, Springer-Verlag Berlin Heidelberg New York, ISBN 3-540-22299-5
Schneider LW, Robbins DH, Pflüg MA and Snyder RG (1983) Development of Anthropometrically Based Design Specifications for an Advanced Adult Anthropomorphic Dummy Family, Final Report, UMTRI-83-53-1, University of Michigan Transportation Research Institute, Ann Arbor, Michigan, USA
Scott MW, McConnell WE, Guzman HM, Howard RP, Bomar JB, Smith HL, Benedict JV, Raddin JH, Hatsell CP (1993) Comparison of Human and ATD Head Kinematics during Low-Speed Rear-end Impacts, SAE 930094, pp. 1–8
Seacrist T, Maltese MR, Balasubramanian S, Garcia-Espana JF, Arbogast KB, Sterner R, Saffioti J, Kadlowec J (2009) Comparison of Passive Cervical Spine Flexion in Children and Adults, Proc. 21st ESV Conf. (09-0142), Stuttgart (Germany), pp. 1–10
Seidl A (1997) RAMSIS – A new CAD tool for ergonomic analysis of vehicles developed for the German automotive industry, SAE 970088, Society of Automotive Engineers, Inc., Warrendale, PA, USA
Sekizuka M (1998) Seat Designs for Whiplash Injury Lessening, Proc. 16th ESV Conf. (98-S7-O-06), Windsor (Canada), pp. 1570–1578
Seric V, Blazic-Cop N, Demarin V (2000) Haemodynamic Changes in Patients with Whiplash Injury Measured by Transcranial Doppler Sonography (TCD), Coll. Antropol., Vol. 24, No. 1, pp. 197–204
Severy DM, Mathewson JH, Bechtol CO (1955) Controlled Automotive Rear-End Collisions, an Investigation of Related Engineering and Medical Phenomena, Canadian Services Medical Journal, VII, pp. 727–759
Siegmund GP, King DJ, Lawrence JM, Wheeler JB, Brault JR, Smith TA (1997) Head/Neck Kinematic Response of Human Subjects in Low-Speed Rear-End Collisions, Proc. 41st Stapp Car Crash Conf., SAE 973341, pp. 357–385
Siegmund GP, Heinrichs BE, Lawrence JM, Philippens MM (2001) Kinetic and Kinematic Responses of the RID2a, Hybrid III and Human Volunteers in Low-Speed Rear-End Collisions, Proc. 45th Stapp Car Crash Conf., SAE 2001-22-0011, pp. 1–18
Siegmund GP, Sanderson DJ, Myers BS, and Inglis JT (2003) Awareness effects the response to single whiplash perturbations, Spine, Vol. 28, No. 7, pp. 671–679
Siegmund GP, Heinrichs BE, Chimich DD, Lawrence J (2005) Variability in Vehicle and Dummy Responses in Rear-End Collisions, Traffic Inj. Prev., Vol. 6, No. 3, pp. 267–277
Siegmund GP, Winkelstein BA, Ivancic PC, Svensson MY, Vasavada A (2009) The Anatomy and Biomechanics of Acute and Chronic Whiplash Injury, Traffic Inj. Prev., Vol. 10, No. 2, pp. 101–112
States JD, Korn MW, Masengill JB (1969) The Enigma of Whiplash Injuries, Proc. 13th
AAAM, pp. 83–108
- 67 -
States JD, Balcerak JC, Williams JS, Morris AT, Babcock W, Polvino R, Riger P, Dawley RE (1972) Injury Frequency and Head Restraint Effectiveness in Rear-End Impact Accidents,Proc. 16th Stapp Car Crash Conf., SAE 720967, pp. 228–257
States JD, Balcerak JC (1973) The Effectiveness of Head Restraints in Rear End Impacts,Universiy Rochester School of Medicine U.S. Department of Transportation, Report No. HS-167-2-261
Stemper BD, Yoganandan N, Pintar F (2003) Gender Dependent Cervical Spine Segmental Kinematics During Whiplash, J. Biomech., Vol. 36, No. 9, pp. 1281–1289
Stemper BD, Yoganandan N, Pintar FA (2006) Effect of head restraint backset on head–neck kinematics in whiplash, Accid. Anal. Prev., Vol. 38, No. 2, pp. 317–323
Stemper BD, Yoganandan N, Gennarelli TA, Pintar FA (2007) Toward a Lower Neck Rear Impact Injury Criterion – Correlation of Lower Neck Loads with Spinal Kinematics, Proc. IRCOBI Conf., Maastrich (The Netherlands), pp. 249–260
Stemper BD, Yoganandan N, Pintar FA, Maiman DJ, Meyer MA, DeRosia J, Shender BS, Paskoff G (2008) Anatomical Gender Differences in Cervical Vertebrae of Size-Matched Volunteers, Spine, Vol. 33, No. 2, pp. E44–E49
Storvik SG, Stemper BD, Yoganandan N, Pintar FA (2009) Population-Based Estimates of Whiplash Injury Using NASS CDS Data, Biomed Sci Instrum., No. 45, pp. 244–249
Sturzenegger M, Radanov BP, Di Stefano G (1995) The effect of accident mechanisms and initial findings on the long-term course of whiplash injury, J. Neurol., Vol. 242, No. 7, pp. 443–449
Svensson MY, Aldman B, Lövsund P, Hansson HA, Sunesson A, Seeman T, Örtengren T (1993a) Pressure Effects in the Spinal Canal during Whiplash Extension Motion - A Possible Cause of Injury to the Cervical Spinal Ganglia, Proc. IRCOBI Conf., Eindhoven (The Netherlands), pp. 189–200
Svensson MY, Lövsund P, Håland Y, Larsson S (1993b) Rear-End Collisions—A Study of the Influence of Backrest Properties on Head-Neck Motion Using a New Dummy Neck, SAE 930343, pp. 129–142
Svensson MY, Lövsund P, Håland Y, Larsson S (1993c) The Influence of Seat-Back and Head-Restraint Properties on the Head-Neck Motion During Rear-Impact, Proc. IRCOBI Conf., Eindhoven (the Netherlands), pp. 395–406
Svensson M, Davidson L, Boström O, Liu F, Yang J, Goeury C (2009) CFD Modelling of Pressure of Pressure Transients in the Spinal Canal During Whiplash Motion – a Pilot Study, Proc. IRCOBI Conf., York (UK), pp. 415–418
Szabo TJ, Welcher JB, Anderson RD, Rice MM, Ward JA, Paulo LR, Carpenter NJ (1994) Human Occupant Kinematic Response to Low-Speed Rear End Impacts, Proc. 38th Stapp Car Crash Conf., SAE 940532, pp. 23–35
Szabo TJ, Welcher J (1996) Human Subject Kinematics and Electromyographic Activity during Low Speed Rear Impacts, Proc. 40th Stapp Car Crash Conf., SAE 962432, pp. 295–314
Tatarek NE (2005) Variation in the human cervical neural canal, Spine J., Vol. 5, No. 6, pp. 623–631
Temming J, Zobel R (1998) Frequency and Risk of Cervical Spine Distortion Injuries in Passenger Car Accidents: Significance of Human Factors Data, Proc. IRCOBI Conf., Göteborg (Sweden), pp. 219–233

- 68 -
Thomas C, Faverjon G, Hartemann F, Tarriere C, Patel A, Got C (1982) Protection against Rear-End Accidents, Proc. IRCOBI Conf., Cologne (Germany), pp. 17–29
Vasavada AN, Li S, Delp SL (2001) Three-dimensional isometric strength of neck muscles in humans, Spine, Vol. 26, No. 17, pp. 1904–1909
Vasavada AN, Danaraj J, Siegmund GP (2008) Head and Neck Anthropometry, Vertebral Geometry and Neck Strength in Height-Matched Men and Women, J Biomech. Vol. 41, No. 1, pp. 114–121
Viano D, Olsen S (2001) The effectiveness of active Head restraint in preventing Whiplash,J. Trauma, Vol. 51, No. 5, pp. 959–969
Viano D, Davidsson J (2001) Neck Displacements of Volunteers, BioRID P3 and Hybrid III in Rear Impacts: Implications to Whiplash Assessment by a Neck Displacement Criterion (NDC), Proc. IIWPG/IRCOBI Symposium, Isle of Man (UK)
Viano D (2003) Seat Influences on Female Neck Responses in Rear Crashes: A Reason Why Women Have Higher Whiplash Rates, Traffic Inj. Prev., Vol. 4, No. 3, pp. 228–239
Viano D (2008) Seat Design Principles to Reduce Neck Injuries in Rear Impacts, Traffic Inj. Prev., Vol. 9, No. 6, pp. 552–560
Watanabe Y, Ichikawa H, Kayama O, Ono, K, Kaneoka K, Inami S (2000) Influence of seat characteristics on occupant motion in low-velocity rear-end impacts, Accid. Anal. Prev., Vol. 32, No. 2, pp. 243–250
The Whiplash Commission Final Report (2005) http://www.whiplashkommissionen.se/pdf/WK_finalreport.pdf
Wiklund K, Larsson H (1998) Saab Active Head Restraint (Sahr) - Seat Design to Reduce the Risk of Neck Injuries in Rear Impacts, SAE 980297, pp. 620–628
Welsh R, Lenard J (2001) Male and Female Car Drivers – Differences in Collision and Injury Risks, Proc. 45th AAAM, Texas (USA), pp. 73–91
Welcher JB, Szabo JS (2001) Relationships between Seat Properties and Human Subject Kinematics in Rear Impact Tests, Accid. Anal. Prev., Vol. 33, No. 3, pp. 289–304
Youdas JW, Garrett TR, Suman VJ, Bogard CL, Hallman HO, Carey JR (1992) Normal Range of Motion of the Cervical Spine: an Initial Goniometric Study, Phys Ther. Vol. 72, No. 11, pp. 770–780
Young JW, Chandler RF, Snow CC, Robinette KM, Zehner GF, Lofberg MS (1983) Anthropometric and Mass Distribution Characteristics of Adult Female Body Segments, Federal Aviation Administration, Civil Aeromedical Institute, Oklahoma City, OK, USA
Zellmer H, Stamm M, Seidenschwang A, Brunner A (2001) Benefit from a Neck Protection System for Aftermarket Fitting. Proc. IRCOBI Conf., Isle of Man (UK), pp. 337–340

- A1 -
APPENDIX
The 50th Percentile Female – Circumferences (Comparisons)
Table A1. Comparisons of anthropometric data (circumferences) of the 50th percentile female. Based Diffrient et al. (1974), Young et al. (1983), GEBOD, and RAMSIS. The picture based on Diffrient et al. (1974).
Circumference [cm]
Body Part Diffrient et al. (1974)
Young et al. (1983) GEBOD RAMSIS
Stature [cm] 161.5 161.2 161.8 161.8 Mass [kg] 65.8 63.9 62.3 62.3 A Head 54.9 54.8 - - B Neck 35.1 32.9 34.3 - C Shoulder 98.0 - - - D Arm pit 89.2 - - - E Arm3) 29.01) 28.81) 27.1 21.7 F Bust 95.8 95.4 - - G Chest4) 79.0 - - - H Waist 74.2 - - 74.6 I Elbow 28.21) 24.42) 27.5 - J Forearm 26.21) 21.22) 24.2 23.7 K Hip 100.8 100.1 - - L Wrist 15.5 15.7 15.2 - M Thigh 59.2 59.4 58.0 - N Knee 38.1 37.0 38.5 - O Calf 35.8 35.8 35.3 33.8 P Ankle 21.8 21.4 21.5 -
1) Flexed 2) Relaxed 3) Upper Arm
4) Below bust 5) Upper thigh
The 50th Percentile Female – Anthropometric Data (Head)
Table A2. Anthropometric data of the head for the 50th percentile female. Based on Diffrient et al. (1974) and Young et al. (1983). Original picture from Wikimedia Commons.
50th Percentile Female
[cm]
Total Head Height 20.301)
Head Length 18.692)
Head Breadth 14.582) 1) Diffrient et al. (1974)
2) Young et al. (1983)
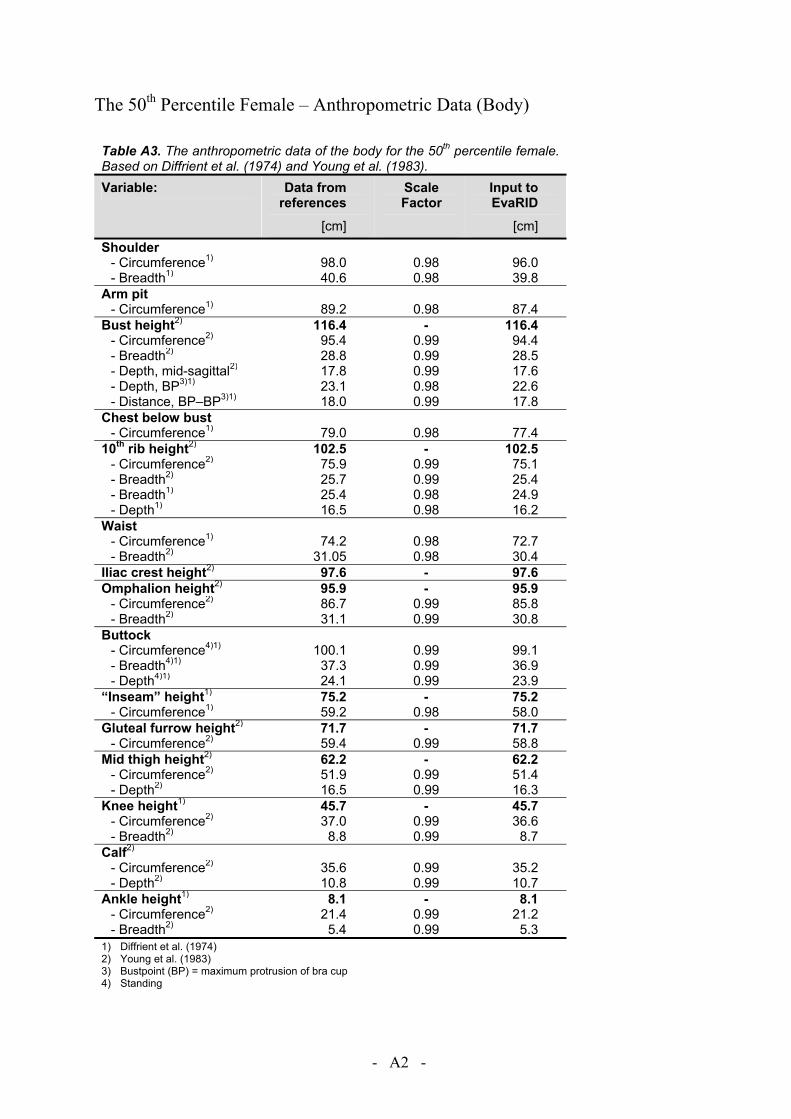
- A2 -
The 50th Percentile Female – Anthropometric Data (Body)
Table A3. The anthropometric data of the body for the 50th percentile female. Based on Diffrient et al. (1974) and Young et al. (1983). Variable: Data from
references
[cm]
Scale Factor
Input to EvaRID
[cm] Shoulder
- Circumference1) 98.0 0.98 96.0 - Breadth1) 40.6 0.98 39.8
Arm pit - Circumference1) 89.2 0.98 87.4
Bust height2) 116.4 - 116.4 - Circumference2) 95.4 0.99 94.4 - Breadth2) 28.8 0.99 28.5 - Depth, mid-sagittal2) 17.8 0.99 17.6 - Depth, BP3)1) 23.1 0.98 22.6 - Distance, BP–BP3)1) 18.0 0.99 17.8
Chest below bust - Circumference1) 79.0 0.98 77.4
10th rib height2) 102.5 - 102.5 - Circumference2) 75.9 0.99 75.1 - Breadth2) 25.7 0.99 25.4 - Breadth1) 25.4 0.98 24.9 - Depth1) 16.5 0.98 16.2
Waist - Circumference1) 74.2 0.98 72.7 - Breadth2) 31.05 0.98 30.4
Iliac crest height2) 97.6 - 97.6 Omphalion height2) 95.9 - 95.9
- Circumference2) 86.7 0.99 85.8 - Breadth2) 31.1 0.99 30.8
Buttock - Circumference4)1) 100.1 0.99 99.1 - Breadth4)1) 37.3 0.99 36.9 - Depth4)1) 24.1 0.99 23.9
“Inseam” height1) 75.2 - 75.2 - Circumference1) 59.2 0.98 58.0
Gluteal furrow height2) 71.7 - 71.7 - Circumference2) 59.4 0.99 58.8
Mid thigh height2) 62.2 - 62.2 - Circumference2) 51.9 0.99 51.4 - Depth2) 16.5 0.99 16.3
Knee height1) 45.7 - 45.7 - Circumference2) 37.0 0.99 36.6 - Breadth2) 8.8 0.99 8.7
Calf2) - Circumference2) 35.6 0.99 35.2 - Depth2) 10.8 0.99 10.7
Ankle height1) 8.1 - 8.1- Circumference2) 21.4 0.99 21.2 - Breadth2) 5.4 0.99 5.3
1) Diffrient et al. (1974) 2) Young et al. (1983) 3) Bustpoint (BP) = maximum protrusion of bra cup 4) Standing
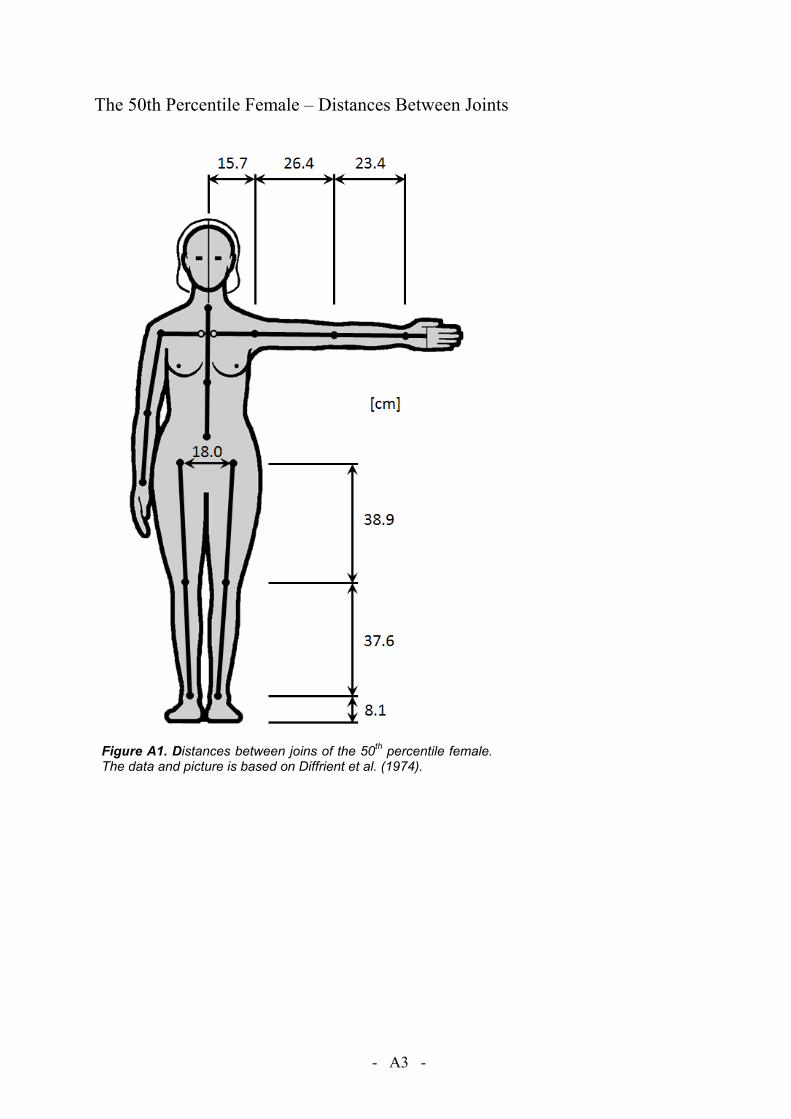
- A3 -
The 50th Percentile Female – Distances Between Joints
Figure A1. Distances between joins of the 50th percentile female. The data and picture is based on Diffrient et al. (1974).

- A4 -
Segmentation of the Body
The traditional segmentation of the human body for developing crash test dummies is (Robbins et al. (1983a):
- Head (×1)- Neck (×1) - Thorax (×1) - Abdomen (×1) - Pelvis (×1)
- Upper Leg (×2)- Lower Leg (×2) - Foot (×2) - Upper Arm (×2) - Lower Arm (×2) - Hand (×2)
Slight simplifications were made by coupling hand and lower arm masses, although the location of the wrist joint was specified.
In the study by Young et al (1983) the body was divided by the following planes (Figure A2): Head plane: A simple plane that passes through the right and left gonion points and nuchale. Neck plane: A compound plane in which a horizontal plane originates at cervicale and passes anteriorly to intersect with the second plane. The second plane originates at the lower of the two clavicale landmarks and passes superiorly at a 45 degree angle to intersect the horizontal plane. Thorax plane: A simple transverse plane that originates at the 10th rib midspine landmark and passes horizontally through the torso. Abdominal plane: A simple transverse plane originating at the higher of the two iliocristale landmarks and continuing horizontally through the torso. Hip plane: A simple plane originating midsagittally on the perineal surface and passing superiorly and laterally midway between the anterior superior iliac spine and trochanterion landmarks, paralleling the right and left inguinal ligaments. Thigh flap plane: A simple plane originating at the gluteal furrow landmark and passing horizontally through the thigh. Knee plane: A simple plane originating at the lateral femoral epicondyle and passing horizontally through the knee. Ankle plane: A simple plane originating at the sphyrion landmark and passing horizontally through the ankle. Shoulder plane: A simple plane originating at the acromion landmark and passing inferiorly and medially through the anterior and posterior scye point marks at the axiallary level. Elbow plane: A simple plane originating at the olecranon landmark and passing through the medial and lateral humeral epicondyle landmarks. Wrist plane: A simple plane originating at the ulnar and radial styloid landmarks and passing through the wrist perpendicular to the long axis of the forearm.
Figure A2. The segmentation of the body. Based on Young et al. (1983). Original picture from Wikipedia Commons.
Head
Neck
Hand
Lower Arm (forearm)
Upper Arm
Lower Leg (calf)
Upper Leg (thigh)
Foot
Thorax
Abdomen
Flap
Pelvis

- A5 -
The Anatomical Axis System
Table A4. The anatomical axis system (Young et al. 1983).
Body Part X-axis Y-axis Z-axis Origin
Head Normal from Y-axis to right infraorbiatale
Vector from right tragion to left tragion X x Y
Intersection of Y-axis and a normal passing through sellion
Neck
Normal from Y-axis though the midpoint of a line between left and right clavicales
Normal vector to the subject’s left from the plane formed by cricoid cartilage, cervicale, and suprasternale
X x Y At cervicale
Thorax Normal from Z-axis to supra-sternale
Z x X Vector from 10th rib midspine to cervi-cale
At 10th rib midspine
Abdomen Normal from 10th rib midspine to Y-axis
Vector from right 10th rib to left 10th rib X x Y At intersection of X and Y
vectors
Pelvis Torso Total body
Y x Z Vector from right anterior superior iliac spine to left anterior superior iliac spine
Normal from symphysion to Y-axis
At intersection of Y-axis and the normal to it passing through a point midway between the posterior superior iliac spines
Upper arm Y x Z
Right: Normal from Z-axis to medial humeral epicondyle Left: Normal from medial humeral epicondyle to Z-axis
Vector from lateral humeral epicondyle to acromion
At acromion
Forearm Forearm plus hand
Y x Z
Right: Normal from radial styloid to Z-axis Left: Normal from Z-axis to radial styloid
Vector from ulnar styloid to radiale At radiale
Hand Y x Z
Right: Vector from metacarpale II to metacarpale V Left: Vector from metacarpale V to metacarpale III
Normal from dactylion to Y-axis
At intersection of Y-axis and the normal passing through metacarpale III
Thigh Thigh minus flap Hip flap
Y x Z
Right: Normal from Z-axis to medial femoral epicondyle Left: Normal from medial femoral epicondyle to Z-axis
Vector from lateral femoral epicondyle to trochanterion
At trochaterion
Calf Y x Z
Right: Normal from lateral malleolus to Z-axis Left: Normal from Z-axis to lateral malleolus
Vector from sphyrion to tibiale
At tibiale
Foot
Vector from posterior calcaneous to normally projected position of toe 2 on X-Y plane
Z x X
Superiorly directed vector normal to the X-Y plane formed by metatarsal I, and metatarsal V, and posterior calca-neous
At the intersection of the X-axis and the normal passing through metatarsal phalange I
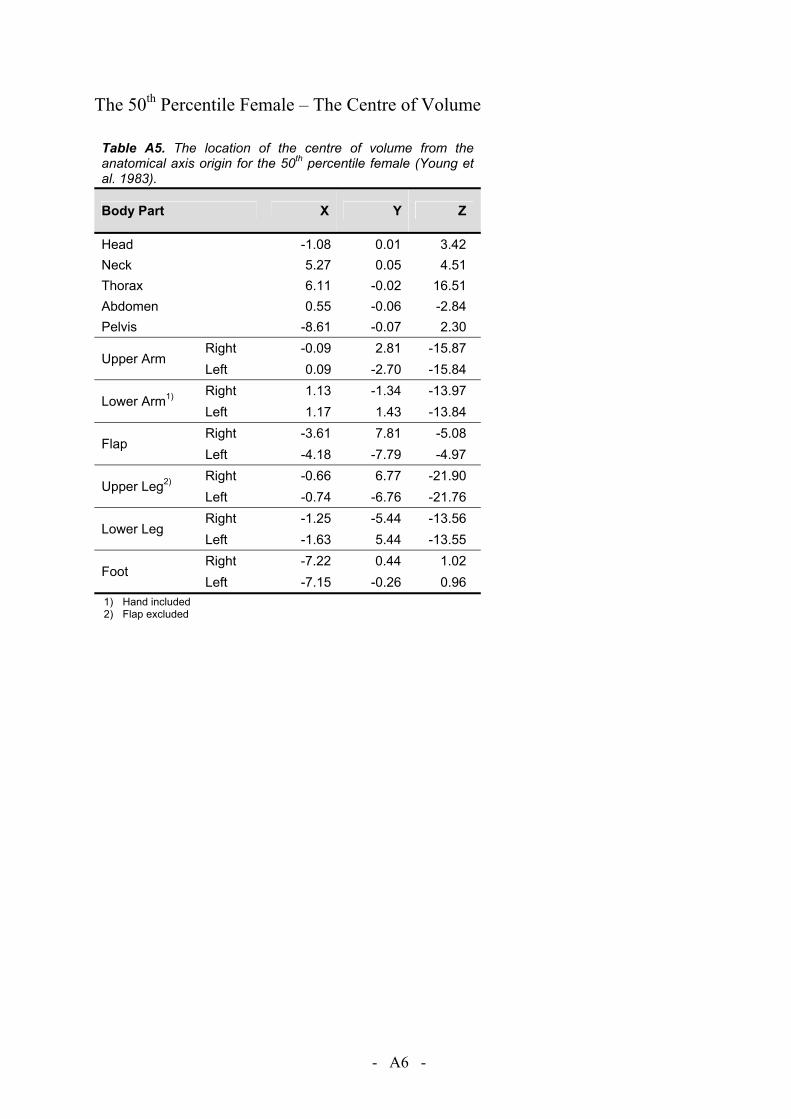
- A6 -
The 50th Percentile Female – The Centre of Volume
Table A5. The location of the centre of volume from the anatomical axis origin for the 50th percentile female (Young et al. 1983).
Body Part X Y Z
Head -1.08 0.01 3.42 Neck 5.27 0.05 4.51 Thorax 6.11 -0.02 16.51 Abdomen 0.55 -0.06 -2.84 Pelvis -8.61 -0.07 2.30
Upper Arm Right -0.09 2.81 -15.87 Left 0.09 -2.70 -15.84
Lower Arm1) Right 1.13 -1.34 -13.97 Left 1.17 1.43 -13.84
Flap Right -3.61 7.81 -5.08 Left -4.18 -7.79 -4.97
Upper Leg2) Right -0.66 6.77 -21.90 Left -0.74 -6.76 -21.76
Lower Leg Right -1.25 -5.44 -13.56 Left -1.63 5.44 -13.55
Foot Right -7.22 0.44 1.02 Left -7.15 -0.26 0.96
1) Hand included 2) Flap excluded
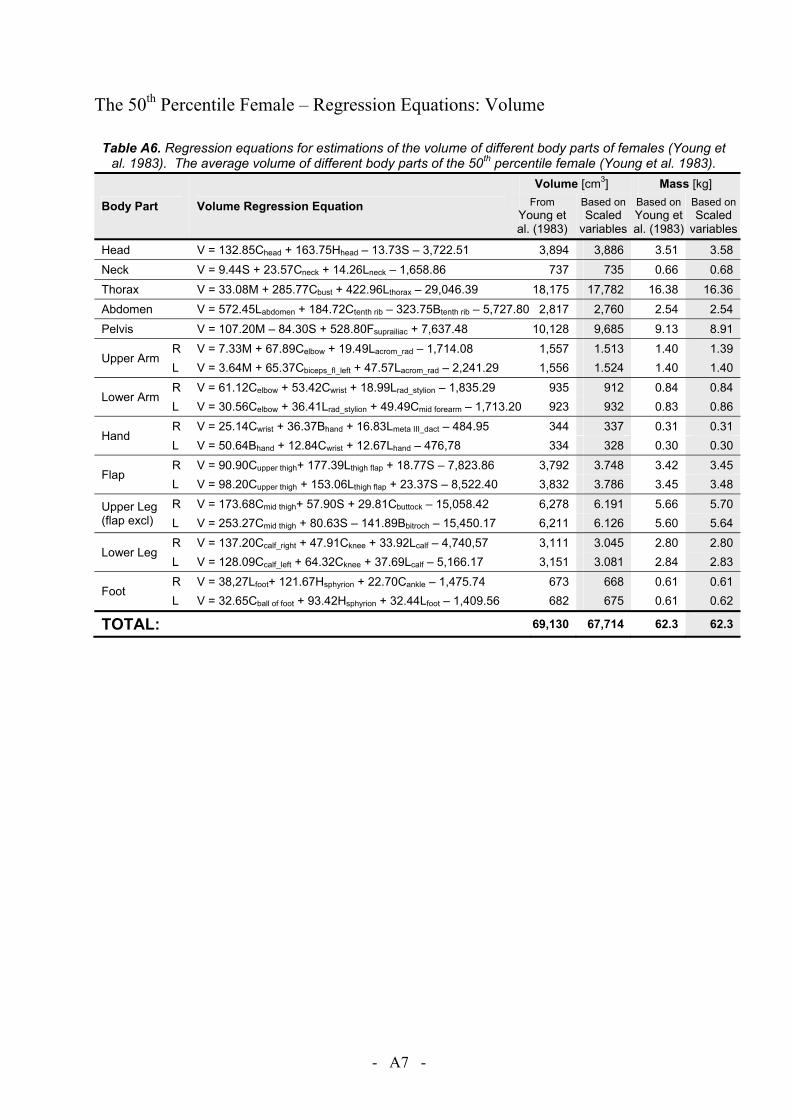
- A7 -
The 50th Percentile Female – Regression Equations: Volume
Table A6. Regression equations for estimations of the volume of different body parts of females (Young et al. 1983). The average volume of different body parts of the 50th percentile female (Young et al. 1983).
Body Part Volume Regression Equation
Volume [cm3] Mass [kg] From
Young et al. (1983)
Based on Scaled
variables
Based onYoung et al. (1983)
Based onScaled
variables
Head V = 132.85Chead + 163.75Hhead – 13.73S – 3,722.51 3,894 3,886 3.51 3.58 Neck V = 9.44S + 23.57Cneck + 14.26Lneck – 1,658.86 737 735 0.66 0.68 Thorax V = 33.08M + 285.77Cbust + 422.96Lthorax – 29,046.39 18,175 17,782 16.38 16.36 Abdomen V = 572.45Labdomen + 184.72Ctenth rib – 323.75Btenth rib – 5,727.80 2,817 2,760 2.54 2.54 Pelvis V = 107.20M – 84.30S + 528.80Fsuprailiac + 7,637.48 10,128 9,685 9.13 8.91
Upper Arm R V = 7.33M + 67.89Celbow + 19.49Lacrom_rad – 1,714.08 1,557 1.513 1.40 1.39 L V = 3.64M + 65.37Cbiceps_fl_left + 47.57Lacrom_rad – 2,241.29 1,556 1.524 1.40 1.40
Lower Arm R V = 61.12Celbow + 53.42Cwrist + 18.99Lrad_stylion – 1,835.29 935 912 0.84 0.84 L V = 30.56Celbow + 36.41Lrad_stylion + 49.49Cmid forearm – 1,713.20 923 932 0.83 0.86
Hand R V = 25.14Cwrist + 36.37Bhand + 16.83Lmeta III_dact – 484.95 344 337 0.31 0.31 L V = 50.64Bhand + 12.84Cwrist + 12.67Lhand – 476,78 334 328 0.30 0.30
Flap R V = 90.90Cupper thigh+ 177.39Lthigh flap + 18.77S – 7,823.86 3,792 3.748 3.42 3.45 L V = 98.20Cupper thigh + 153.06Lthigh flap + 23.37S – 8,522.40 3,832 3.786 3.45 3.48
Upper Leg (flap excl)
R V = 173.68Cmid thigh+ 57.90S + 29.81Cbuttock – 15,058.42 6,278 6.191 5.66 5.70 L V = 253.27Cmid thigh + 80.63S – 141.89Bbitroch – 15,450.17 6,211 6.126 5.60 5.64
Lower Leg R V = 137.20Ccalf_right + 47.91Cknee + 33.92Lcalf – 4,740,57 3,111 3.045 2.80 2.80 L V = 128.09Ccalf_left + 64.32Cknee + 37.69Lcalf – 5,166.17 3,151 3.081 2.84 2.83
Foot R V = 38,27Lfoot+ 121.67Hsphyrion + 22.70Cankle – 1,475.74 673 668 0.61 0.61 L V = 32.65Cball of foot + 93.42Hsphyrion + 32.44Lfoot – 1,409.56 682 675 0.61 0.62
TOTAL: 69,130 67,714 62.3 62.3
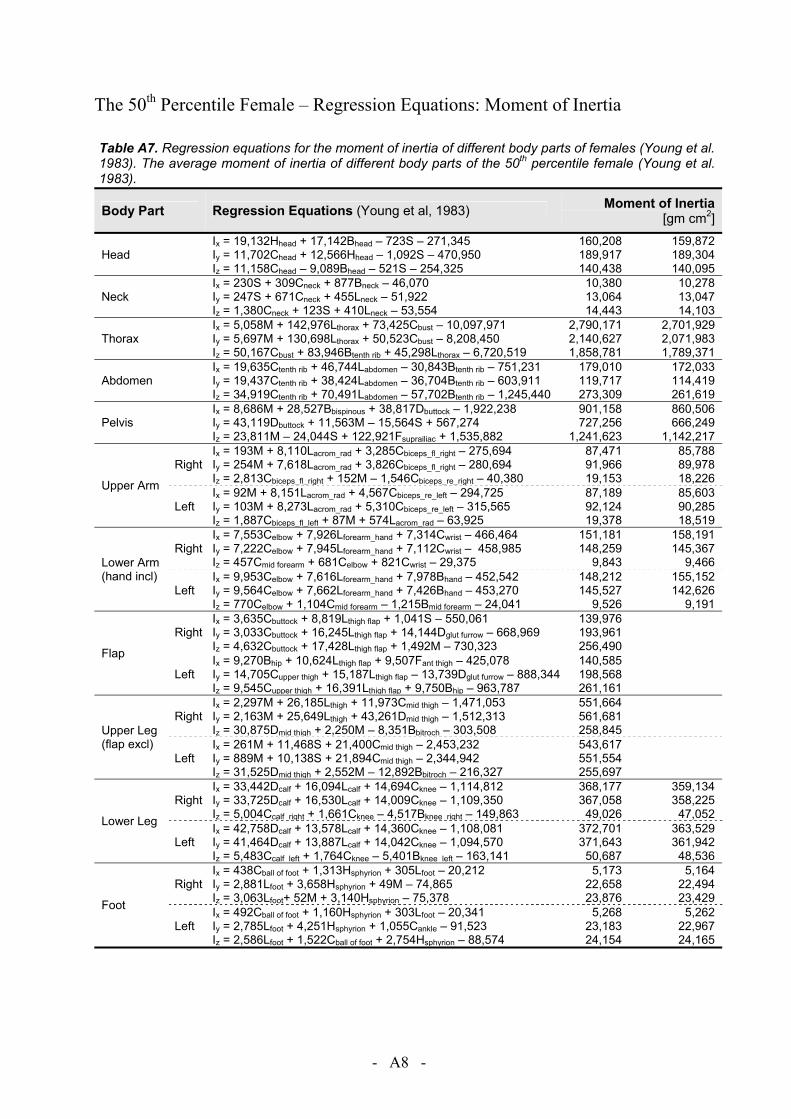
- A8 -
The 50th Percentile Female – Regression Equations: Moment of Inertia
Table A7. Regression equations for the moment of inertia of different body parts of females (Young et al. 1983). The average moment of inertia of different body parts of the 50th percentile female (Young et al. 1983).
Body Part Regression Equations (Young et al, 1983) Moment of Inertia [gm cm2]
Head Ix = 19,132Hhead + 17,142Bhead – 723S – 271,345 Iy = 11,702Chead + 12,566Hhead – 1,092S – 470,950 Iz = 11,158Chead – 9,089Bhead – 521S – 254,325
160,208 189,917 140,438
159,872 189,304 140,095
Neck Ix = 230S + 309Cneck + 877Bneck – 46,070 Iy = 247S + 671Cneck + 455Lneck – 51,922 Iz = 1,380Cneck + 123S + 410Lneck – 53,554
10,380 13,064 14,443
10,278 13,047 14,103
Thorax Ix = 5,058M + 142,976Lthorax + 73,425Cbust – 10,097,971 Iy = 5,697M + 130,698Lthorax + 50,523Cbust – 8,208,450 Iz = 50,167Cbust + 83,946Btenth rib + 45,298Lthorax – 6,720,519
2,790,171 2,140,627 1,858,781
2,701,929 2,071,983 1,789,371
Abdomen Ix = 19,635Ctenth rib + 46,744Labdomen – 30,843Btenth rib – 751,231 Iy = 19,437Ctenth rib + 38,424Labdomen – 36,704Btenth rib – 603,911 Iz = 34,919Ctenth rib + 70,491Labdomen – 57,702Btenth rib – 1,245,440
179,010 119,717 273,309
172,033 114,419 261,619
Pelvis Ix = 8,686M + 28,527Bbispinous + 38,817Dbuttock – 1,922,238 Iy = 43,119Dbuttock + 11,563M – 15,564S + 567,274 Iz = 23,811M – 24,044S + 122,921Fsuprailiac + 1,535,882
901,158 727,256
1,241,623
860,506 666,249
1,142,217
Upper Arm
Right Ix = 193M + 8,110Lacrom_rad + 3,285Cbiceps_fl_right – 275,694 Iy = 254M + 7,618Lacrom_rad + 3,826Cbiceps_fl_right – 280,694 Iz = 2,813Cbiceps_fl_right + 152M – 1,546Cbiceps_re_right – 40,380
87,471 91,966 19,153
85,788 89,978 18,226
Left Ix = 92M + 8,151Lacrom_rad + 4,567Cbiceps_re_left – 294,725 Iy = 103M + 8,273Lacrom_rad + 5,310Cbiceps_re_left – 315,565 Iz = 1,887Cbiceps_fl_left + 87M + 574Lacrom_rad – 63,925
87,189 92,124 19,378
85,603 90,285 18,519
Lower Arm (hand incl)
Right Ix = 7,553Celbow + 7,926Lforearm_hand + 7,314Cwrist – 466,464 Iy = 7,222Celbow + 7,945Lforearm_hand + 7,112Cwrist – 458,985 Iz = 457Cmid forearm + 681Celbow + 821Cwrist – 29,375
151,181 148,259
9,843
158,191 145,367
9,466
Left Ix = 9,953Celbow + 7,616Lforearm_hand + 7,978Bhand – 452,542 Iy = 9,564Celbow + 7,662Lforearm_hand + 7,426Bhand – 453,270 Iz = 770Celbow + 1,104Cmid forearm – 1,215Bmid forearm – 24,041
148,212 145,527
9,526
155,152 142,626
9,191
Flap
Right Ix = 3,635Cbuttock + 8,819Lthigh flap + 1,041S – 550,061 Iy = 3,033Cbuttock + 16,245Lthigh flap + 14,144Dglut furrow – 668,969 Iz = 4,632Cbuttock + 17,428Lthigh flap + 1,492M – 730,323
139,976 193,961 256,490
Left Ix = 9,270Bhip + 10,624Lthigh flap + 9,507Fant thigh – 425,078 Iy = 14,705Cupper thigh + 15,187Lthigh flap – 13,739Dglut furrow – 888,344 Iz = 9,545Cupper thigh + 16,391Lthigh flap + 9,750Bhip – 963,787
140,585 198,568 261,161
Upper Leg (flap excl)
Right Ix = 2,297M + 26,185Lthigh + 11,973Cmid thigh – 1,471,053 Iy = 2,163M + 25,649Lthigh + 43,261Dmid thigh – 1,512,313 Iz = 30,875Dmid thigh + 2,250M – 8,351Bbitroch – 303,508
551,664 561,681 258,845
Left Ix = 261M + 11,468S + 21,400Cmid thigh – 2,453,232 Iy = 889M + 10,138S + 21,894Cmid thigh – 2,344,942 Iz = 31,525Dmid thigh + 2,552M – 12,892Bbitroch – 216,327
543,617 551,554 255,697
Lower Leg
Right Ix = 33,442Dcalf + 16,094Lcalf + 14,694Cknee – 1,114,812 Iy = 33,725Dcalf + 16,530Lcalf + 14,009Cknee – 1,109,350 Iz = 5,004Ccalf_right + 1,661Cknee – 4,517Bknee_right – 149,863
368,177 367,058 49,026
359,134 358,225 47,052
Left Ix = 42,758Dcalf + 13,578Lcalf + 14,360Cknee – 1,108,081 Iy = 41,464Dcalf + 13,887Lcalf + 14,042Cknee – 1,094,570 Iz = 5,483Ccalf_left + 1,764Cknee – 5,401Bknee_left – 163,141
372,701 371,643 50,687
363,529 361,942 48,536
Foot
Right Ix = 438Cball of foot + 1,313Hsphyrion + 305Lfoot – 20,212 Iy = 2,881Lfoot + 3,658Hsphyrion + 49M – 74,865 Iz = 3,063Lfoot+ 52M + 3,140Hsphyrion – 75,378
5,173 22,658 23,876
5,164 22,494 23,429
Left Ix = 492Cball of foot + 1,160Hsphyrion + 303Lfoot – 20,341 Iy = 2,785Lfoot + 4,251Hsphyrion + 1,055Cankle – 91,523 Iz = 2,586Lfoot + 1,522Cball of foot + 2,754Hsphyrion – 88,574
5,268 23,183 24,154
5,262 22,967 24,165
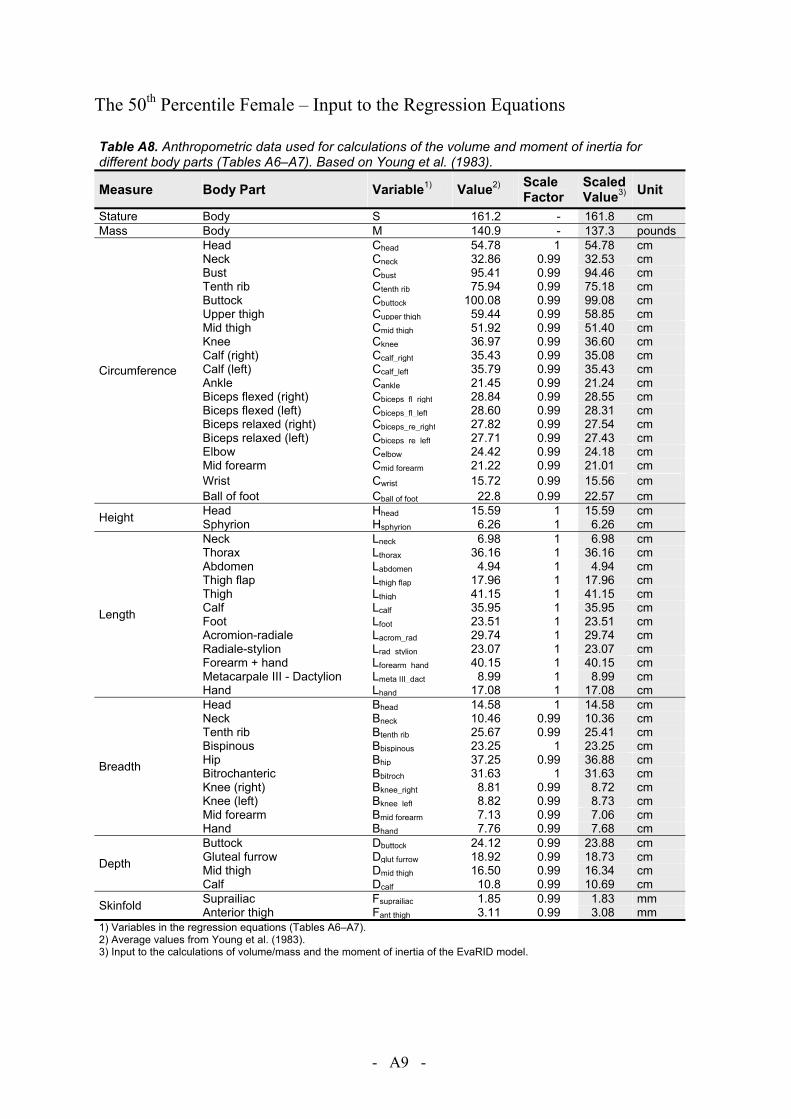
- A9 -
The 50th Percentile Female – Input to the Regression Equations
Table A8. Anthropometric data used for calculations of the volume and moment of inertia for different body parts (Tables A6–A7). Based on Young et al. (1983).
Measure Body Part Variable1) Value2) Scale Factor
Scaled Value3) Unit
Stature Body S 161.2 - 161.8 cm Mass Body M 140.9 - 137.3 pounds
Circumference
Head Chead 54.78 1 54.78 cm Neck Cneck 32.86 0.99 32.53 cm Bust Cbust 95.41 0.99 94.46 cm Tenth rib Ctenth rib 75.94 0.99 75.18 cm Buttock Cbuttock 100.08 0.99 99.08 cm Upper thigh Cupper thigh 59.44 0.99 58.85 cm Mid thigh Cmid thigh 51.92 0.99 51.40 cm Knee Cknee 36.97 0.99 36.60 cm Calf (right) Ccalf_right 35.43 0.99 35.08 cm Calf (left) Ccalf_left 35.79 0.99 35.43 cm Ankle Cankle 21.45 0.99 21.24 cm Biceps flexed (right) Cbiceps_fl_right 28.84 0.99 28.55 cm Biceps flexed (left) Cbiceps_fl_left 28.60 0.99 28.31 cm Biceps relaxed (right) Cbiceps_re_right 27.82 0.99 27.54 cm Biceps relaxed (left) Cbiceps_re_left 27.71 0.99 27.43 cm Elbow Celbow 24.42 0.99 24.18 cm Mid forearm Cmid forearm 21.22 0.99 21.01 cm Wrist Cwrist 15.72 0.99 15.56 cm Ball of foot Cball of foot 22.8 0.99 22.57 cm
Height Head Hhead 15.59 1 15.59 cm Sphyrion Hsphyrion 6.26 1 6.26 cm
Length
Neck Lneck 6.98 1 6.98 cm Thorax Lthorax 36.16 1 36.16 cm Abdomen Labdomen 4.94 1 4.94 cm Thigh flap Lthigh flap 17.96 1 17.96 cm Thigh Lthigh 41.15 1 41.15 cm Calf Lcalf 35.95 1 35.95 cm Foot Lfoot 23.51 1 23.51 cm Acromion-radiale Lacrom_rad 29.74 1 29.74 cm Radiale-stylion Lrad_stylion 23.07 1 23.07 cm Forearm + hand Lforearm_hand 40.15 1 40.15 cm Metacarpale III - Dactylion Lmeta III_dact 8.99 1 8.99 cm Hand Lhand 17.08 1 17.08 cm
Breadth
Head Bhead 14.58 1 14.58 cm Neck Bneck 10.46 0.99 10.36 cm Tenth rib Btenth rib 25.67 0.99 25.41 cm Bispinous Bbispinous 23.25 1 23.25 cm Hip Bhip 37.25 0.99 36.88 cm Bitrochanteric Bbitroch 31.63 1 31.63 cm Knee (right) Bknee_right 8.81 0.99 8.72 cm Knee (left) Bknee_left 8.82 0.99 8.73 cm Mid forearm Bmid forearm 7.13 0.99 7.06 cm Hand Bhand 7.76 0.99 7.68 cm
Depth
Buttock Dbuttock 24.12 0.99 23.88 cm Gluteal furrow Dglut furrow 18.92 0.99 18.73 cm Mid thigh Dmid thigh 16.50 0.99 16.34 cm Calf Dcalf 10.8 0.99 10.69 cm
Skinfold Suprailiac Fsuprailiac 1.85 0.99 1.83 mm Anterior thigh Fant thigh 3.11 0.99 3.08 mm
1) Variables in the regression equations (Tables A6–A7). 2) Average values from Young et al. (1983). 3) Input to the calculations of volume/mass and the moment of inertia of the EvaRID model.

- A10 -
The 50th Percentile Female – Principal Axes of Inertia
Table A8. Principal axes of inertia with respect to anatomical axes (Table A4); cosine matrix expressed in degrees (Young et al. 1983).
Body Part Principal Axes
x y z
Head x 42.19° 91.28° 47.83° y 88.84° 1.32° 89.37° z 132.17° 89.69° 42.17°
Neck x 8.38° 89.60° 81.53° y 89.98° 2.94° 92.94° z 98.38° 87.09° 8.88°
Thorax x 19.19° 91.53° 70.87° y 88.20° 1.88° 90.53° z 109.10° 88.91° 19.14°
Abdomen x 0.45° 90.13° 90.43° y 89.87° 0.34° 89.69° z 89.57° 90.31° 0.53°
Pelvis x 2.77° 90.37° 92.74° y 89.63° 0.37° 90.00° z 87.26° 90.01° 2.74°
Upper Arm
Right x 28.64° 62.14° 83.86° y 118.51° 29.27° 83.94° z 92.52° 98.26° 8.64°
Left x 25.42° 114.69° 84.33° y 64.72° 26.17° 96.32° z 92.45° 81.86° 8.51°
Lower Arm (hand incl)
Right x 17.36° 106.49° 95.29° y 74.33° 17.65° 97.91° z 82.71° 83.89° 9.54°
Left x 16.56° 74.41° 95.46° y 104.70° 16.97° 81.70° z 82.54° 96.55° 9.95°
Flap
Right x 17.24° 104.44° 80.78° y 73.56° 21.89° 104.04° z 95.06° 73.91° 16.90°
Left x 18.32° 74.97° 79.77° y 107.35° 22.84° 75.62° z 95.69° 106.78° 17.78°
Upper Leg (flap excl)
Right x 8.12° 81.89° 89.58° y 98.09° 8.28° 91.76° z 90.66° 88.32° 1.80°
Left x 15.26° 74.80° 88.69° y 105.23° 15.31° 88.44° z 90.85° 91.85° 2.03°
Lower Leg
Right x 1.27° 88.90° 90.64° y 91.08° 1.81° 88.55° z 89.33° 91.44° 1.58°
Left x 47.57° 42.44° 90.34° y 137.56° 47.57° 90.76° z 90.33° 89.24° 0.83°
Foot
Right x 6.39° 89.83° 96.39° y 88.31° 16.91° 73.18° z 83.84° 106.91° 18.06°
Left x 6.47° 90.33° 96.46° y 91.47° 16.11° 106.04° z 83.71° 73.89° 17.36°

- A11 -
The 50th Percentile Female – Mass of Body Parts (Comparisons)
Table A9. The mass and volume of different body parts of the 50th percentile female according to Diffrient et al. (1974), Young et al. (1983), and GEBOD.
Body Part
Young et al. (1983) GEBOD Diffrient et al. (1974)
Volume
Estimated Mass3)
Mass4)
Mass
[cm3] [kg] [kg] [kg] Head (x1) 3,894 3.60 3.59 3.55 Neck (x1) 737 0.68 0.68 1.25 Thorax (x1) 18,175 16.80 16.41
28.84 Abdomen (x1) 2,817 2.60 2.44 Pelvis (x1) 17,7522) 16.41 8.92 Leg upper1) (x2) 6,244 5.77 9.11 7.16 Leg lower1) (x2) 3,131 2.89 2.84 3.27 Foot1) (x2) 678 0.63 0.63 0.75 Arm upper1) (x2) 1,556 1.44 1.40 1.87 Arm lower1) (x2) 929 0.86 0.84 0.97 Hand1) (x2) 339 0.31 0.31 0.31 Total 69,130 63.9 62.3 62.3 1) Average left / right. 2) Including flaps. 3) Calculated from the volume of each body part and the body mass 63.9 kg, assuming a constant density of the body. 4) The mass of each bocy part of a female with the stature 161.8 cm and the mass 62.3 kg.


![A Study of Current Neck Injury Criteria Used for Whiplash ... · BioRID-II [5][6][7]. One of the main problems in the development of this kind of procedures has been related to the](https://img.pdfslide.net/doc/110x75/5b4b9ddd7f8b9aac238cf764/a-study-of-current-neck-injury-criteria-used-for-whiplash-biorid-ii-567.jpg)