Embed Size (px)
Citation preview
Administrtive Planning/OverviewPBIS Systems of Support:Tier2/Secondary and Tier
3/Tertiary Levels of Support
Vermont PBISSeptember 16, 2010
Lucille EberIllinois PBIS Networkwww.pbisillinois.org
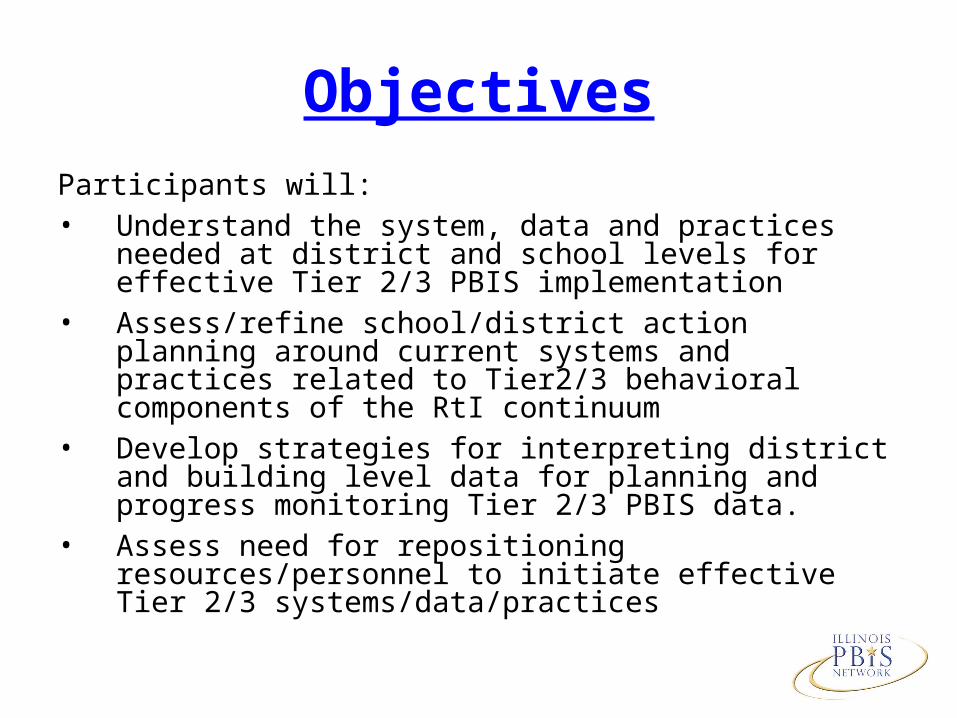
Objectives
Participants will:• Understand the system, data and practices needed at
district and school levels for effective Tier 2/3 PBIS implementation
• Assess/refine school/district action planning around current systems and practices related to Tier2/3 behavioral components of the RtI continuum
• Develop strategies for interpreting district and building level data for planning and progress monitoring Tier 2/3 PBIS data.
• Assess need for repositioning resources/personnel to initiate effective Tier 2/3 systems/data/practices
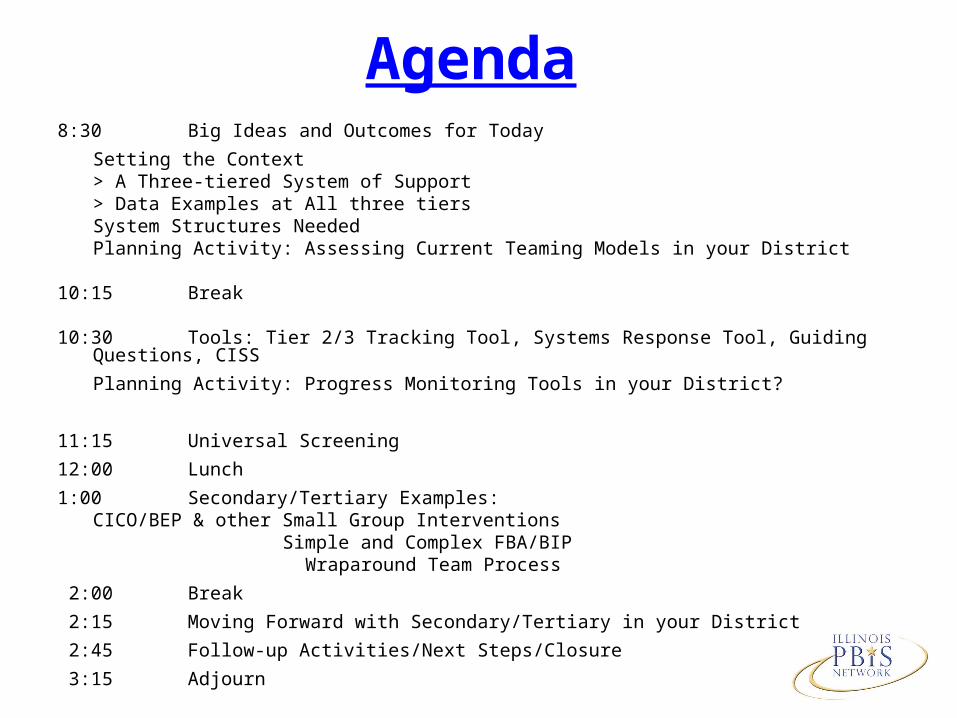
Agenda 8:30 Big Ideas and Outcomes for Today
Setting the Context > A Three-tiered System of Support> Data Examples at All three tiers
System Structures NeededPlanning Activity: Assessing Current Teaming Models in your District
10:15 Break
10:30 Tools: Tier 2/3 Tracking Tool, Systems Response Tool, Guiding Questions, CISS
Planning Activity: Progress Monitoring Tools in your District?
11:15 Universal Screening
12:00 Lunch
1:00 Secondary/Tertiary Examples:CICO/BEP & other Small Group Interventions
Simple and Complex FBA/BIP Wraparound Team Process
2:00 Break
2:15 Moving Forward with Secondary/Tertiary in your District
2:45 Follow-up Activities/Next Steps/Closure
3:15 Adjourn
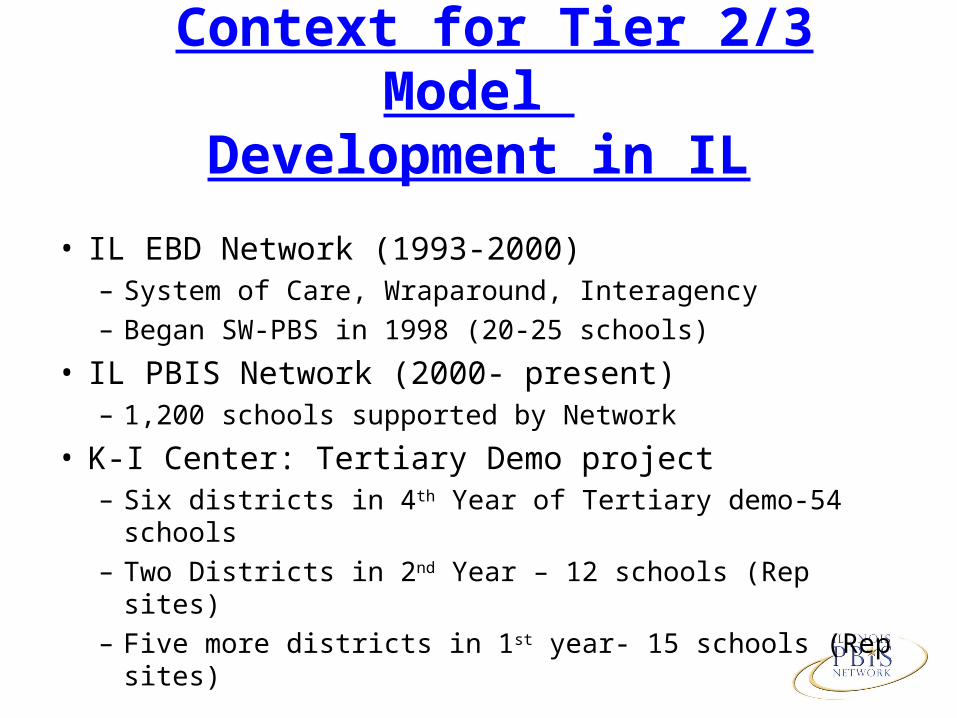
Context for Tier 2/3 Model Development in IL
• IL EBD Network (1993-2000)– System of Care, Wraparound, Interagency– Began SW-PBS in 1998 (20-25 schools)
• IL PBIS Network (2000- present)– 1,200 schools supported by Network
• K-I Center: Tertiary Demo project– Six districts in 4th Year of Tertiary demo-54 schools– Two Districts in 2nd Year – 12 schools (Rep sites)– Five more districts in 1st year- 15 schools (Rep sites)
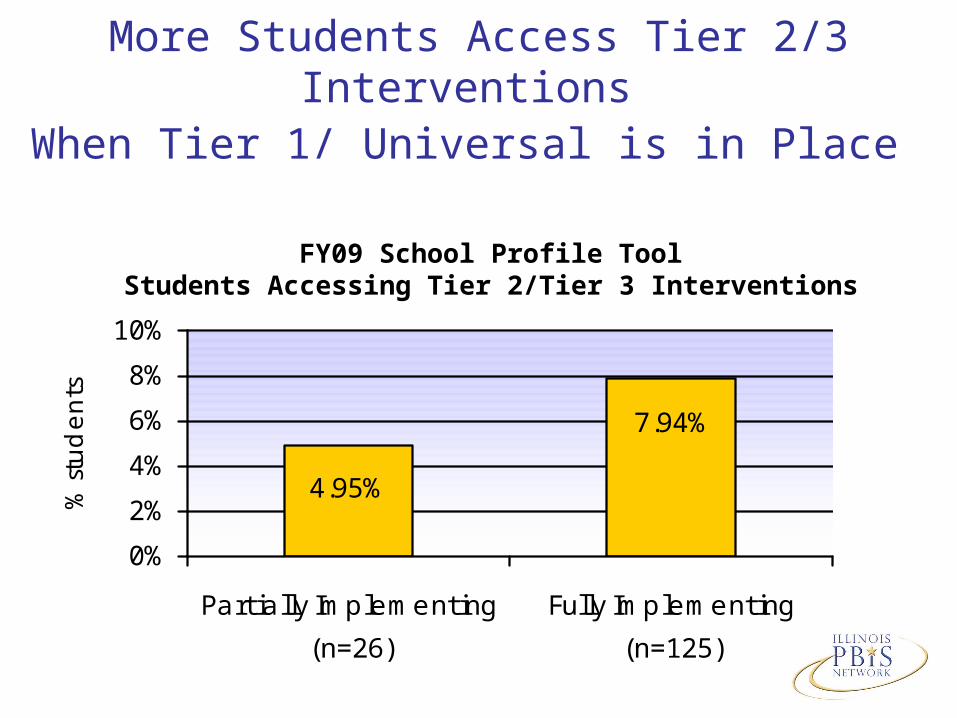
More Students Access Tier 2/3 Interventions When Tier 1/ Universal is in Place
7.94%
4.95%
0%
2%
4%
6%
8%
10%
Partially Implementing
(n=26)
Fully Implementing
(n=125)
% stu
de
nts
FY09 School Profile ToolStudents Accessing Tier 2/Tier 3 Interventions
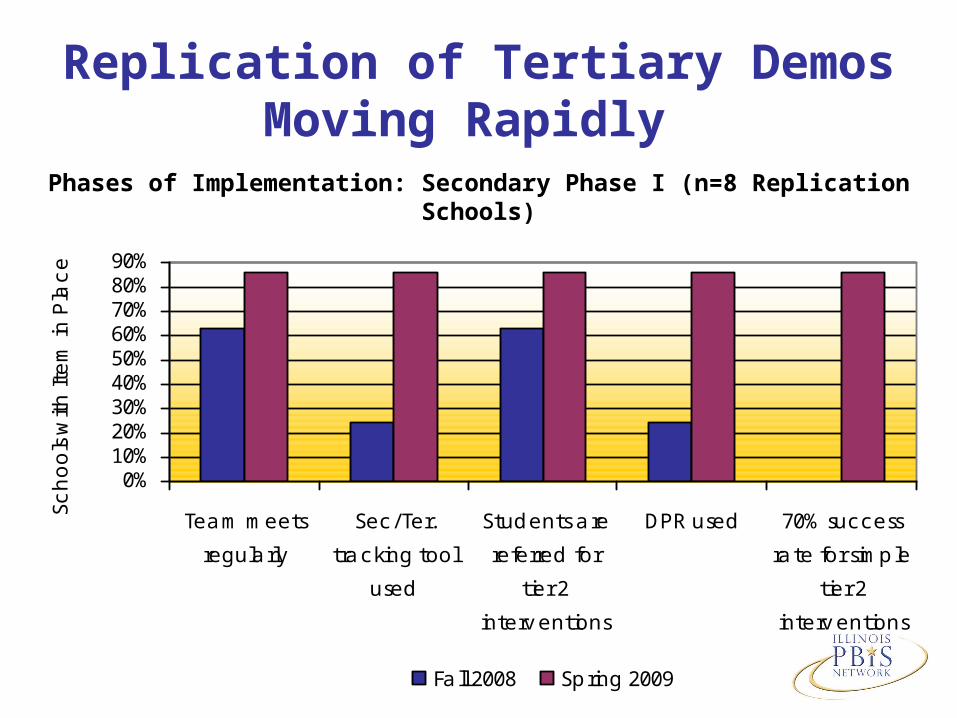
Replication of Tertiary Demos Moving Rapidly
Phases of Implementation: Secondary Phase I (n=8 Replication Schools)
0%10%20%30%40%50%60%70%80%90%
Team meets
regularly
Sec/Ter.
tracking tool
used
Students are
referred for
tier 2
interventions
DPR used 70% success
rate for simple
tier 2
interventions
Sch
oo
ls w
ith It
em
in P
lac
e
Fa ll 2008 Spring 2009
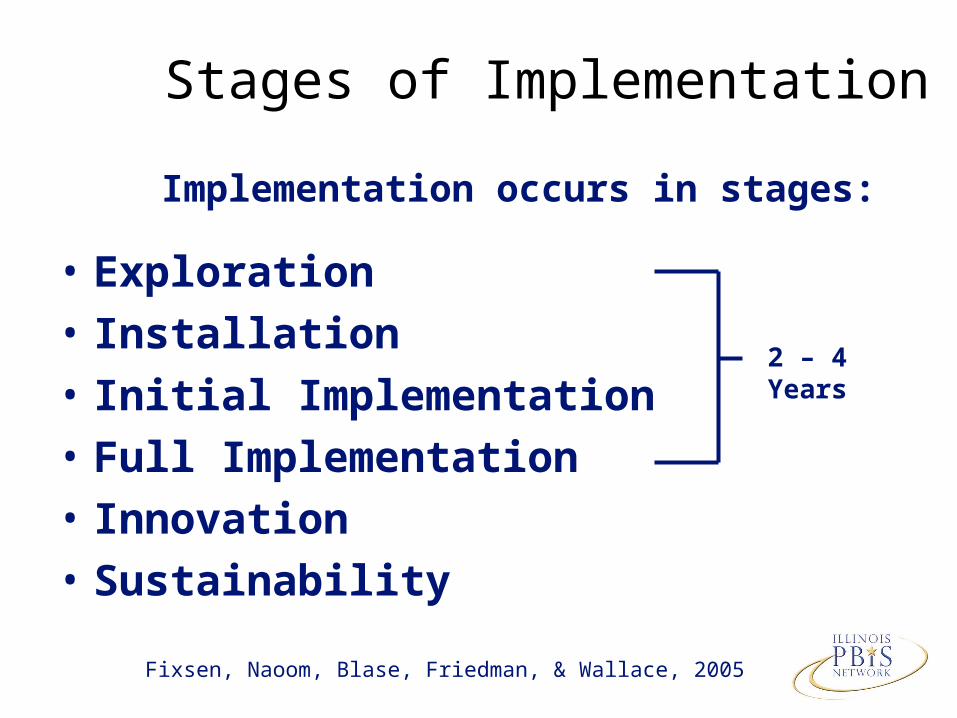
Stages of Implementation
• Exploration
• Installation
• Initial Implementation
• Full Implementation
• Innovation
• Sustainability
Implementation occurs in stages:
Fixsen, Naoom, Blase, Friedman, & Wallace, 2005
2 – 4 Years
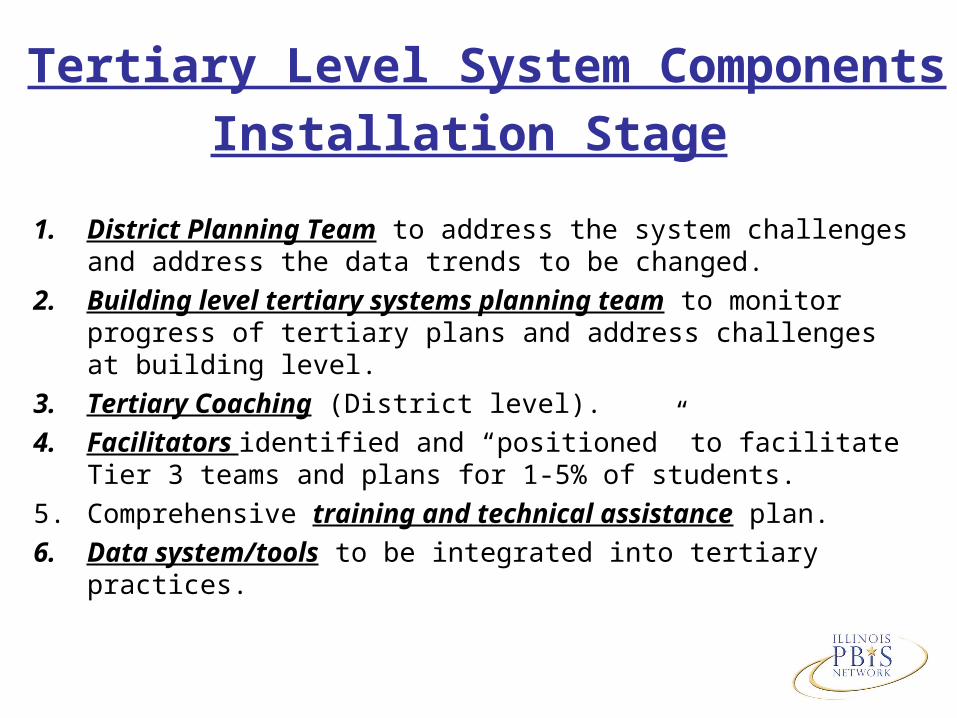
1. District Planning Team to address the system challenges and address the data trends to be changed.
2. Building level tertiary systems planning team to monitor progress of tertiary plans and address challenges at building level.
3. Tertiary Coaching (District level).
4. Facilitators identified and “positioned” to facilitate Tier 3 teams and plans for 1-5% of students.
5. Comprehensive training and technical assistance plan.
6. Data system/tools to be integrated into tertiary practices.
Tertiary Level System Components
Installation Stage
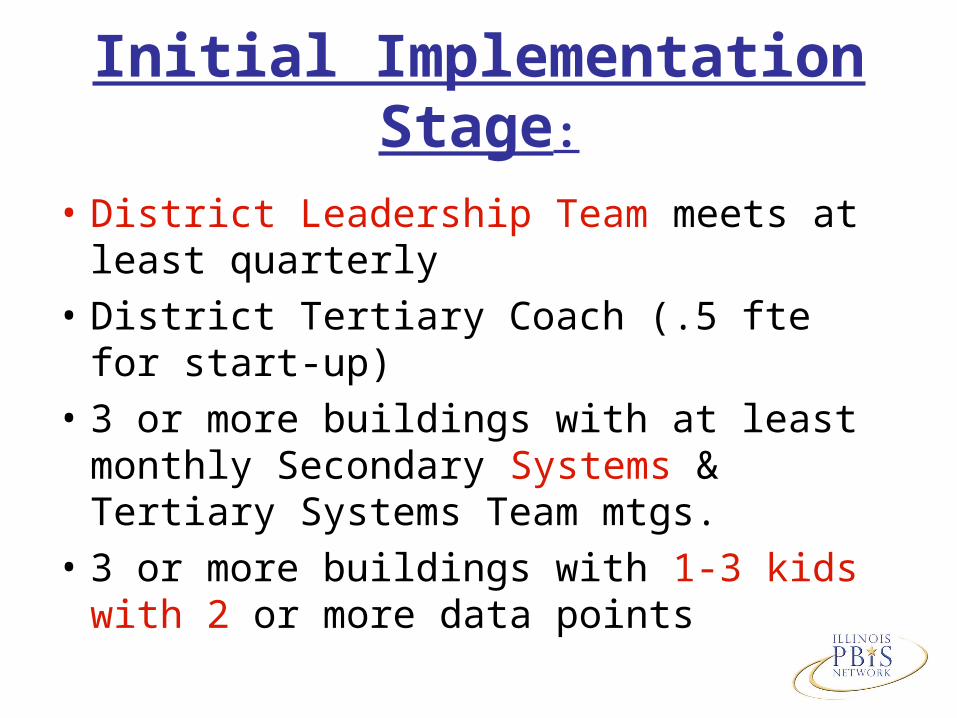
Initial Implementation Stage:
• District Leadership Team meets at least quarterly
• District Tertiary Coach (.5 fte for start-up)
• 3 or more buildings with at least monthly Secondary Systems & Tertiary Systems Team mtgs.
• 3 or more buildings with 1-3 kids with 2 or more data points
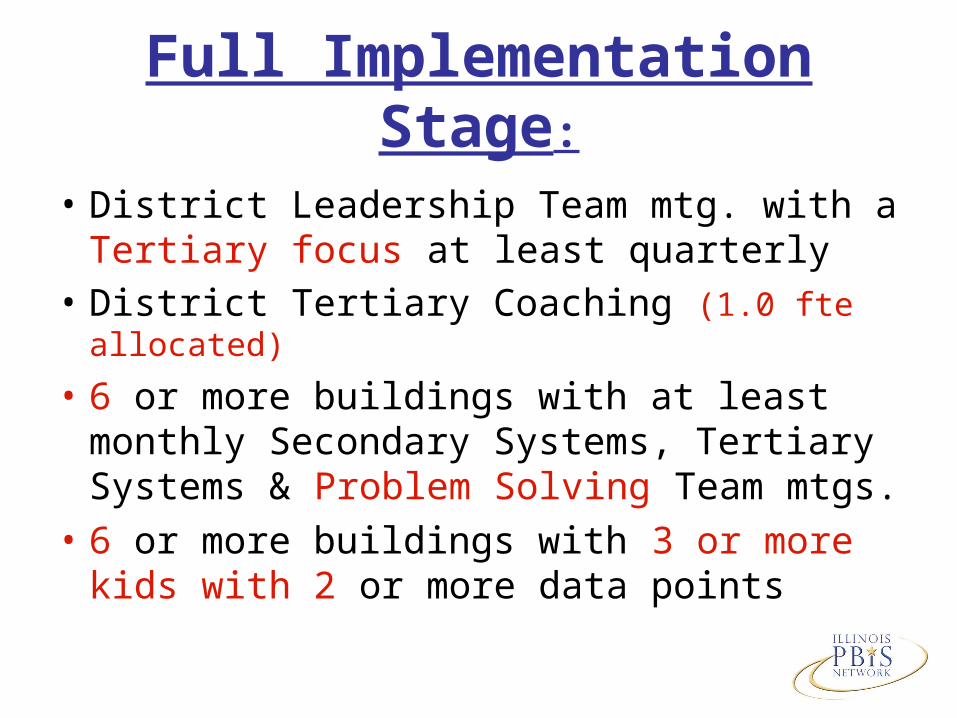
Full Implementation Stage:
• District Leadership Team mtg. with a Tertiary focus at least quarterly
• District Tertiary Coaching (1.0 fte allocated)
• 6 or more buildings with at least monthly Secondary Systems, Tertiary Systems & Problem Solving Team mtgs.
• 6 or more buildings with 3 or more kids with 2 or more data points
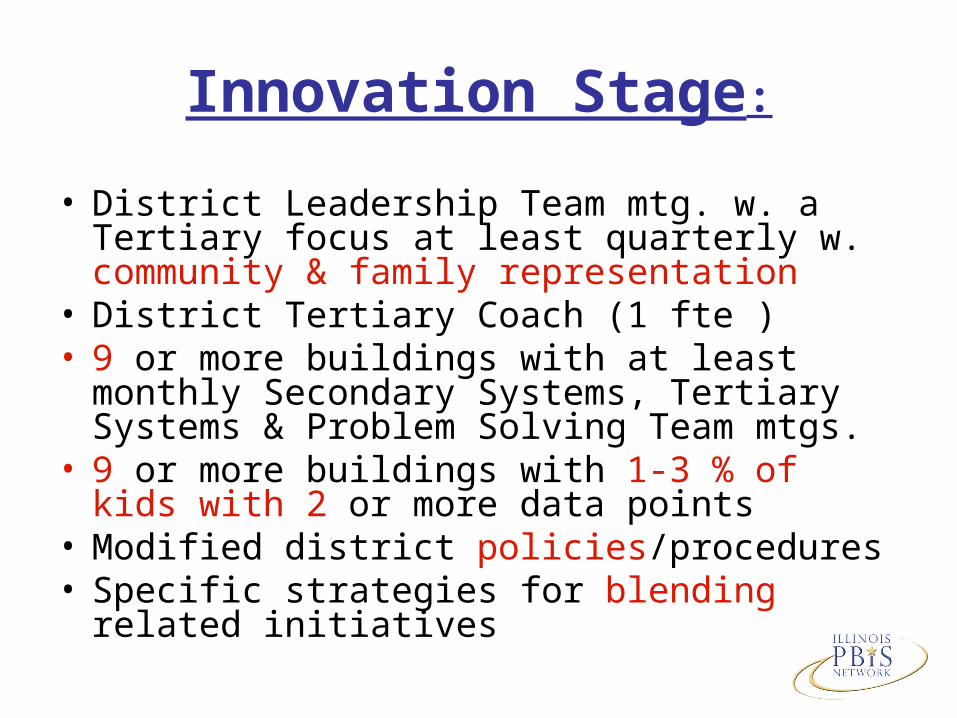
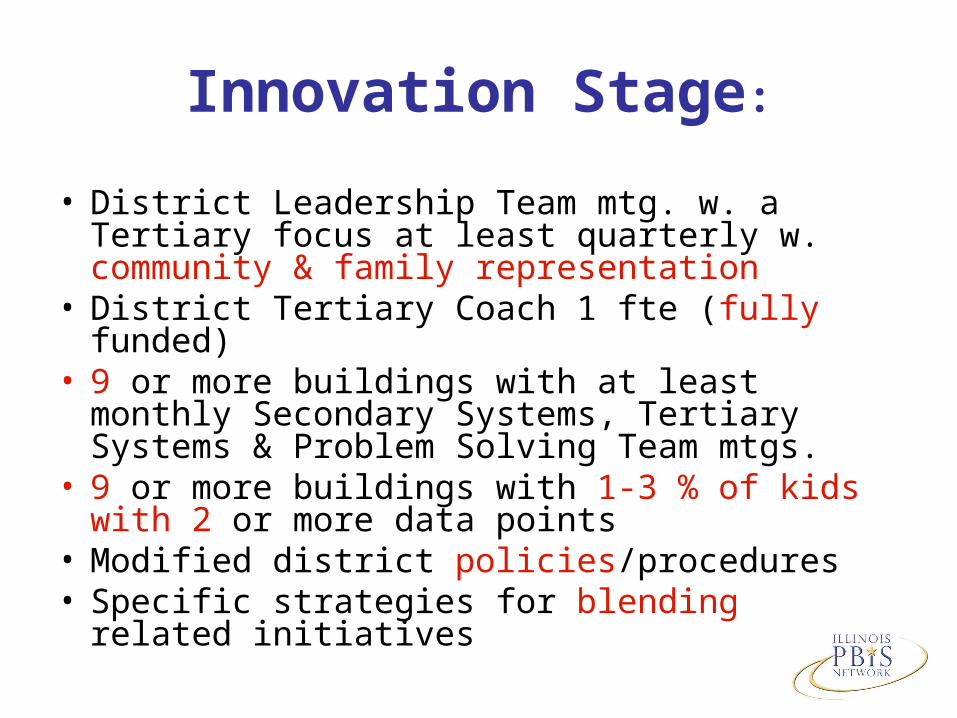
Innovation Stage:
• District Leadership Team mtg. w. a Tertiary focus at least quarterly w. community & family representation
• District Tertiary Coach (1 fte )• 9 or more buildings with at least monthly
Secondary Systems, Tertiary Systems & Problem Solving Team mtgs.
• 9 or more buildings with 1-3 % of kids with 2 or more data points
• Modified district policies/procedures• Specific strategies for blending related initiatives
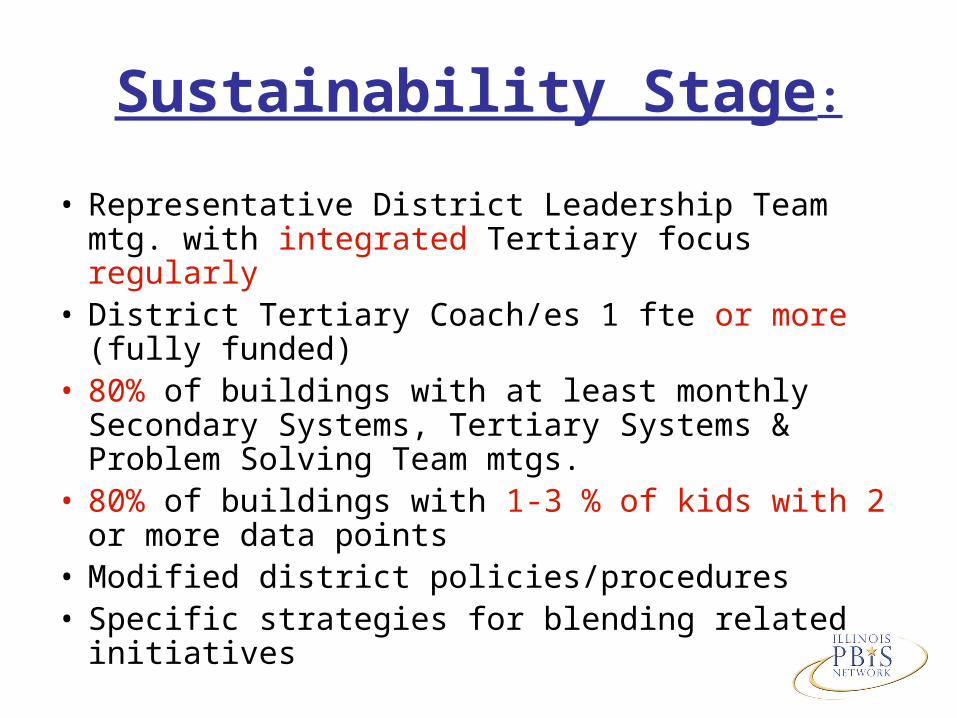
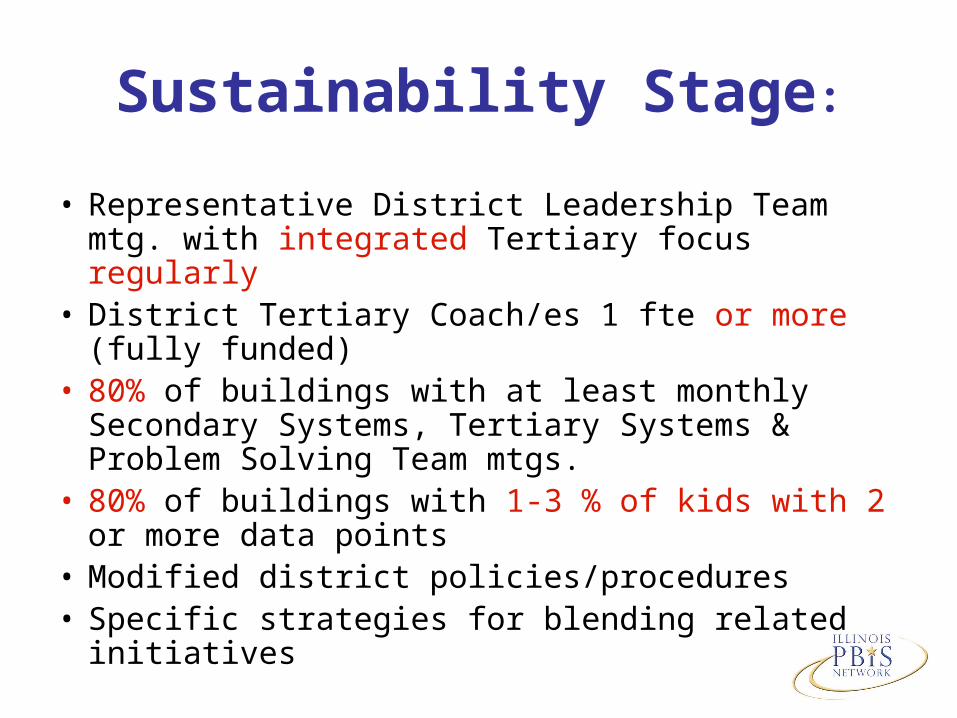
Sustainability Stage:
• Representative District Leadership Team mtg. with integrated Tertiary focus regularly
• District Tertiary Coach/es 1 fte or more (fully funded)
• 80% of buildings with at least monthly Secondary Systems, Tertiary Systems & Problem Solving Team mtgs.
• 80% of buildings with 1-3 % of kids with 2 or more data points
• Modified district policies/procedures• Specific strategies for blending related initiatives
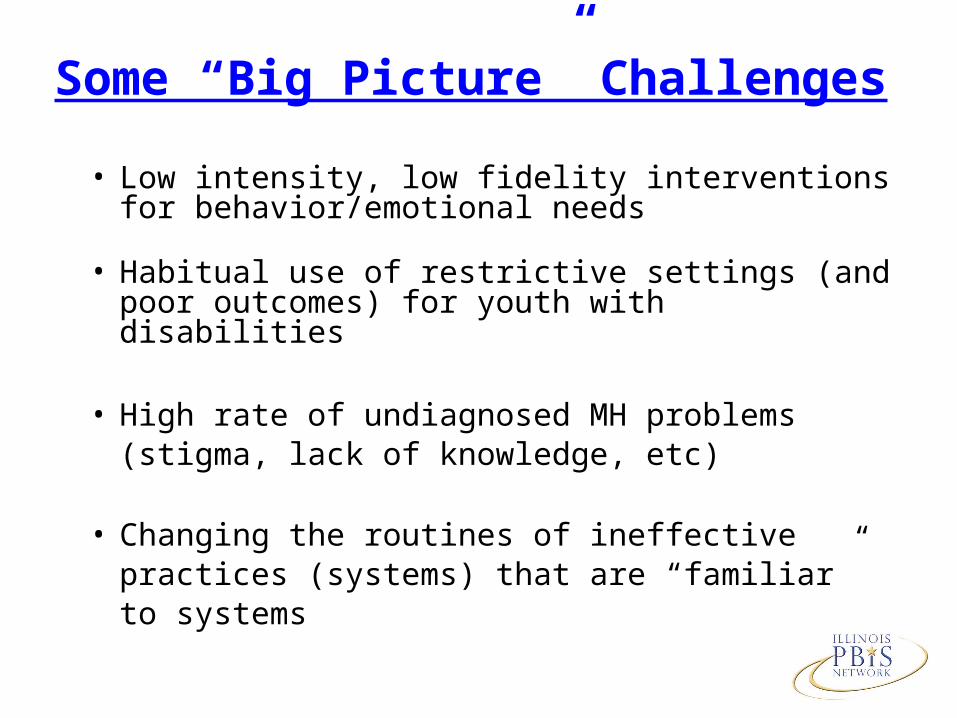
Some “Big Picture” Challenges
• Low intensity, low fidelity interventions for behavior/emotional needs
• Habitual use of restrictive settings (and poor outcomes) for youth with disabilities
• High rate of undiagnosed MH problems (stigma, lack of knowledge, etc)
• Changing the routines of ineffective practices (systems) that are “familiar” to systems
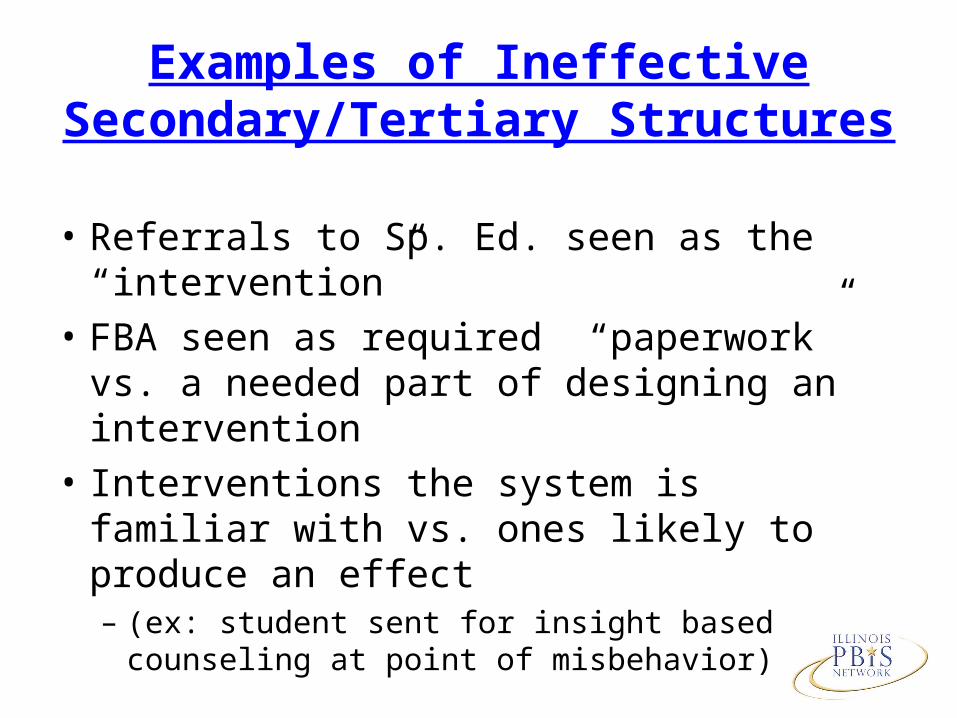
Examples of Ineffective Secondary/Tertiary Structures
• Referrals to Sp. Ed. seen as the “intervention”
• FBA seen as required “paperwork” vs. a needed part of designing an intervention
• Interventions the system is familiar with vs. ones likely to produce an effect – (ex: student sent for insight based counseling at
point of misbehavior)
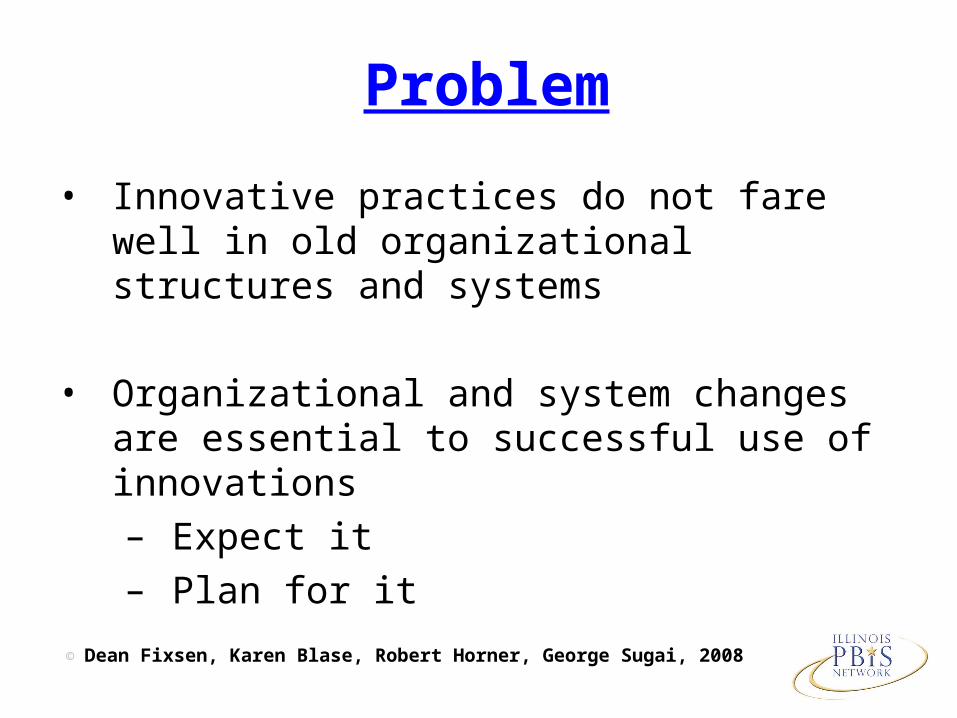
© Dean Fixsen, Karen Blase, Robert Horner, George Sugai, 2008
Problem
• Innovative practices do not fare well in old organizational structures and systems
• Organizational and system changes are essential to successful use of innovations– Expect it– Plan for it
Why We Need MH Partnerships
• One in 5 youth have a MH “condition”
• About 70% of those get no treatment
• School is “defacto” MH provider
• JJ system is next level of system default
• 1-2% identified by schools as EBD
• Those identified have poor outcomes
• Suicide is 4th leading cause of death among young adults
Tools/Processes for Guiding Your District Plan
• Unified School-Based Action Plan
• District Action Plan
• Triangle Activity (data and interventions)
Where/how will Community Partners/Resources, including family voice, be integrated into the overall district and in school buildings?
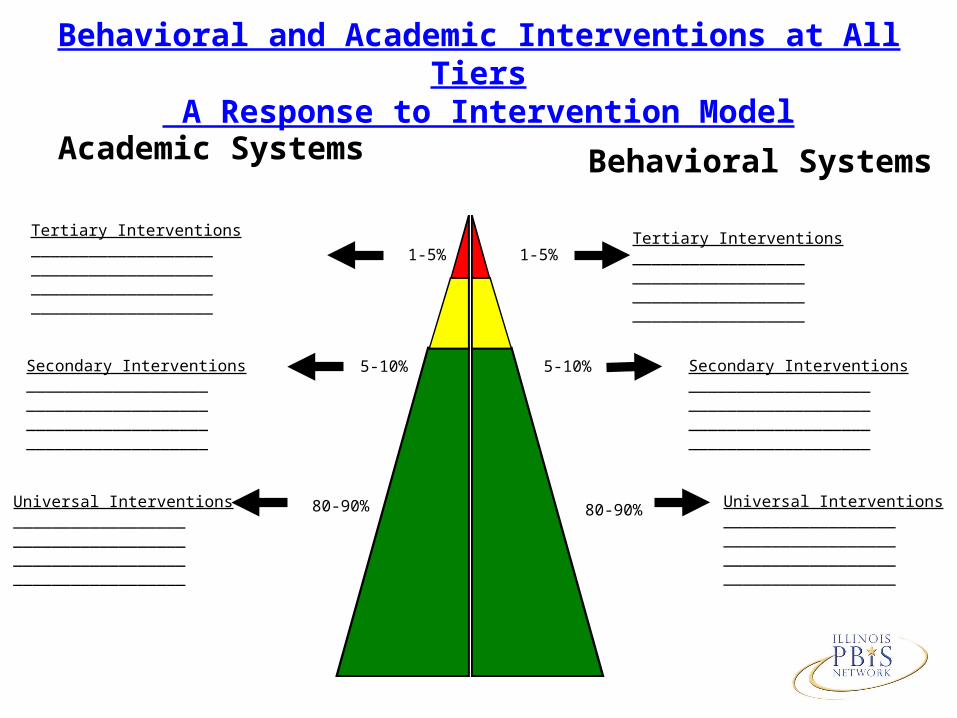
1-5% 1-5%
5-10% 5-10%
80-90% 80-90%
Tertiary Interventions____________________________________________________________________________
Tertiary Interventions________________________________________________________________________
Secondary Interventions____________________________________________________________________________
Secondary Interventions____________________________________________________________________________
Universal Interventions________________________________________________________________________
Universal Interventions________________________________________________________________________
Behavioral and Academic Interventions at All Tiers A Response to Intervention Model
Academic Systems Behavioral Systems
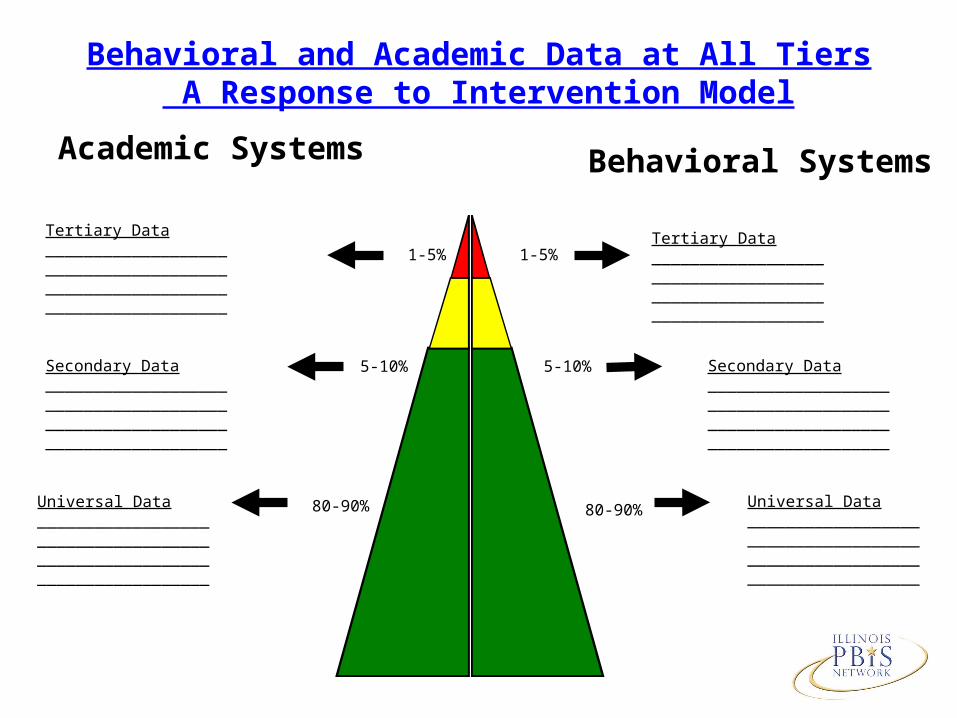
1-5% 1-5%
5-10% 5-10%
80-90% 80-90%
Tertiary Data____________________________________________________________________________
Tertiary Data________________________________________________________________________
Secondary Data____________________________________________________________________________
Secondary Data____________________________________________________________________________
Universal Data________________________________________________________________________
Universal Data________________________________________________________________________
Behavioral and Academic Data at All Tiers A Response to Intervention Model
Academic Systems Behavioral Systems
Big Ideas about Tier 2/Tier 3
• PBIS legislation, SEL, RtI• The link between academic and social success• ALL students get access to PBS; ALL students
should receive constant positive feedback• Administrators “need to know” the system, the
data/tools, and the practices well enough to guide/lead any “corrections” needed. – Ex: If an individual behavior intervention plan is not
working, what should you look for or ask?
Administrators Need to…
– Know what the practices look like when implemented with fidelity;
– Be aware of data on the tracking tool and the SR-T; help decide what needs to change;
– Be active/visible on teams;– Be “hands on” with the first few tertiary plans;– Apply high-level problem-solving skills
troubleshooting systems level issues.
Dealing with the Tough Issues
• Adult response to problem behavior.– Adults need to model being respectful in their
communications with students around behavior.
– non-examples that need correcting?
• School personnel should not get to choose NOT to give students evidenced based interventions.
Student “Need” or System “Need”?
There is a high use of restrictive settings for students with EBD; and the outcomes for these students are not good.
There is no self-contained classroom nor one-to-one aide for students with EBD in life/society after high school; just jail.
Students removed from general education due to emotional/behavioral factors, are more likely to go to jail than to have good “life” outcomes.
References:
Bradley, Henderson, Monfore (2004) Bullock and McArthur (1994), Rutherford and Nelson (2005), Rutherford, Nelson and Woford (1985), Grosenick, George, George, Lewis (1991), Greenbaum, Dedrick, Freidman, Kutash, Brown, Lardieri (1996), Mathur (2007), Quinn (2004)
Moore, Soloman, “Mentally IL Offenders Stretch the Limits of Juvenile Justice”,New York Times, August 10, 2009 page 1
Setting the Context:
• A Three-tiered System of Support
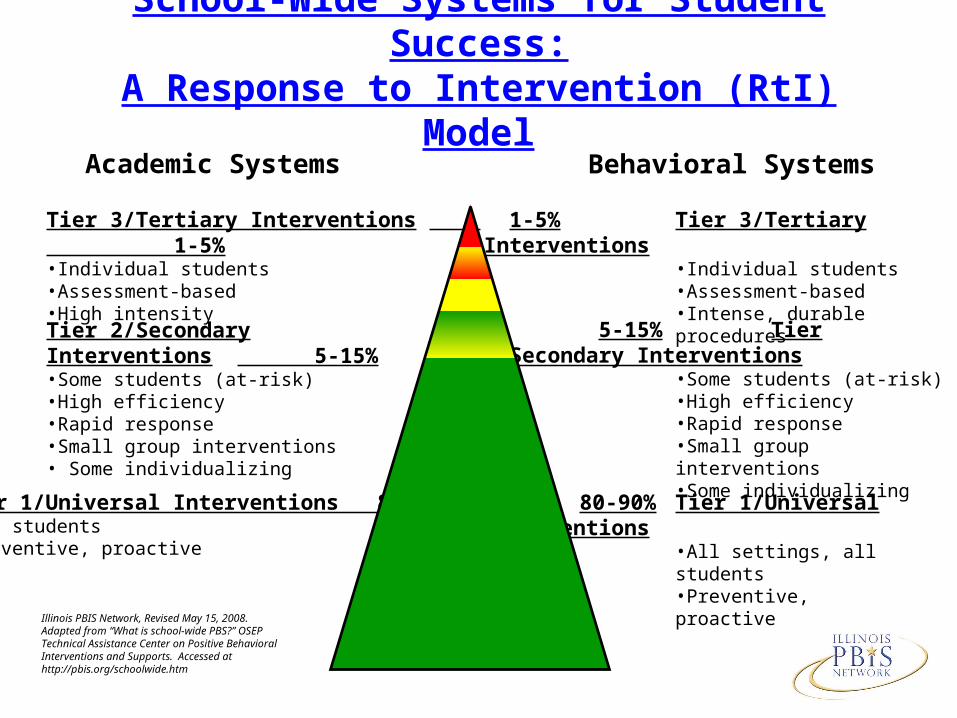
Tier 3/Tertiary Interventions 1-5%•Individual students•Assessment-based•High intensity
1-5% Tier 3/Tertiary Interventions•Individual students•Assessment-based•Intense, durable procedures
Tier 2/Secondary Interventions 5-15%•Some students (at-risk)•High efficiency•Rapid response•Small group interventions• Some individualizing
5-15% Tier 2/Secondary Interventions•Some students (at-risk)•High efficiency•Rapid response•Small group interventions•Some individualizing
Tier 1/Universal Interventions 80-90%•All students•Preventive, proactive
80-90% Tier 1/Universal Interventions•All settings, all students•Preventive, proactive
School-Wide Systems for Student Success:
A Response to Intervention (RtI) ModelAcademic Systems Behavioral Systems
Illinois PBIS Network, Revised May 15, 2008. Adapted from “What is school-wide PBS?” OSEP Technical Assistance Center on Positive Behavioral Interventions and Supports. Accessed at http://pbis.org/schoolwide.htm
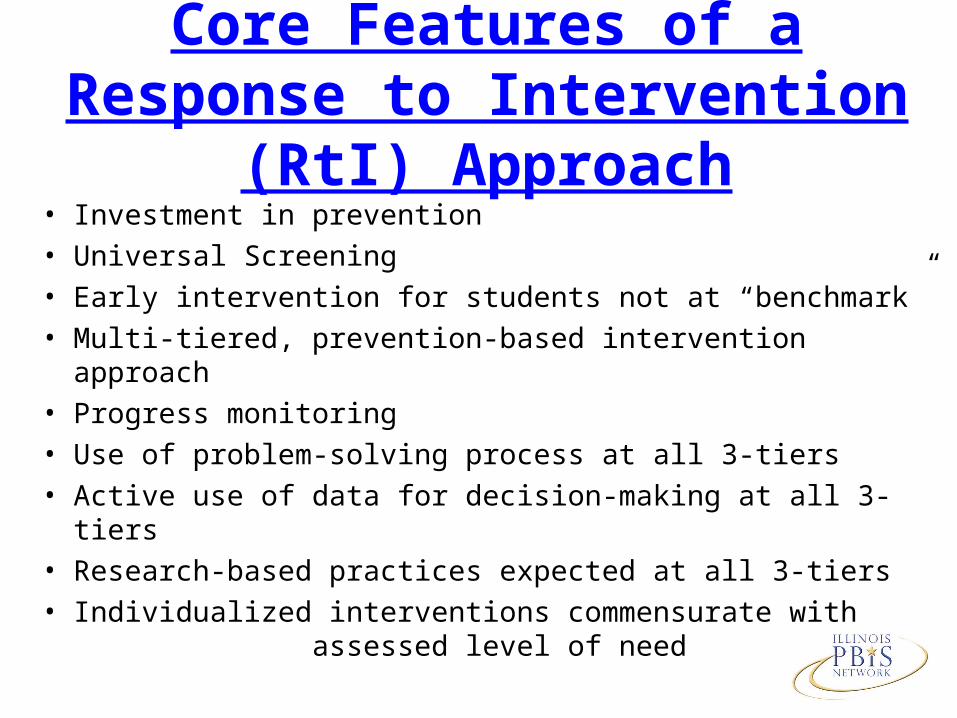
Core Features of a Response to Intervention (RtI) Approach
• Investment in prevention• Universal Screening• Early intervention for students not at “benchmark”• Multi-tiered, prevention-based intervention approach• Progress monitoring• Use of problem-solving process at all 3-tiers• Active use of data for decision-making at all 3-tiers• Research-based practices expected at all 3-tiers• Individualized interventions commensurate with
assessed level of need

Problem Solving Steps
Step 1: Problem Identification
Step 2: Problem Analysis
Step 3: Intervention Design
Step 4: Response to Intervention
Why is it occurring?
What’s the problem?
What are we going to do about it?
Is it working?
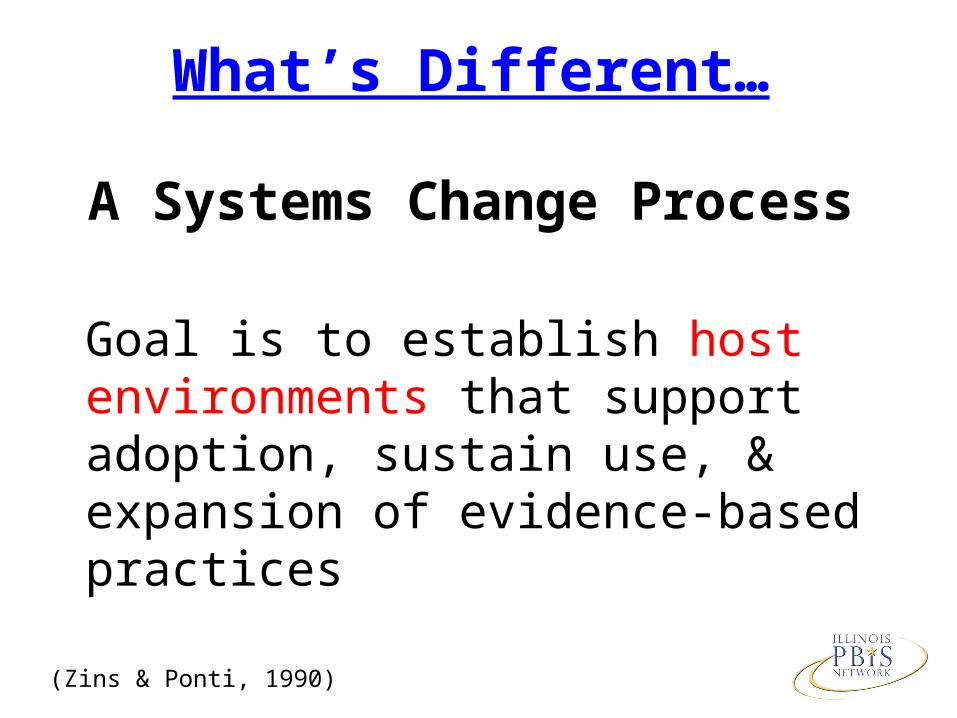
What’s Different…
A Systems Change Process
Goal is to establish host environments that support adoption, sustain use, & expansion of evidence-based practices
(Zins & Ponti, 1990)
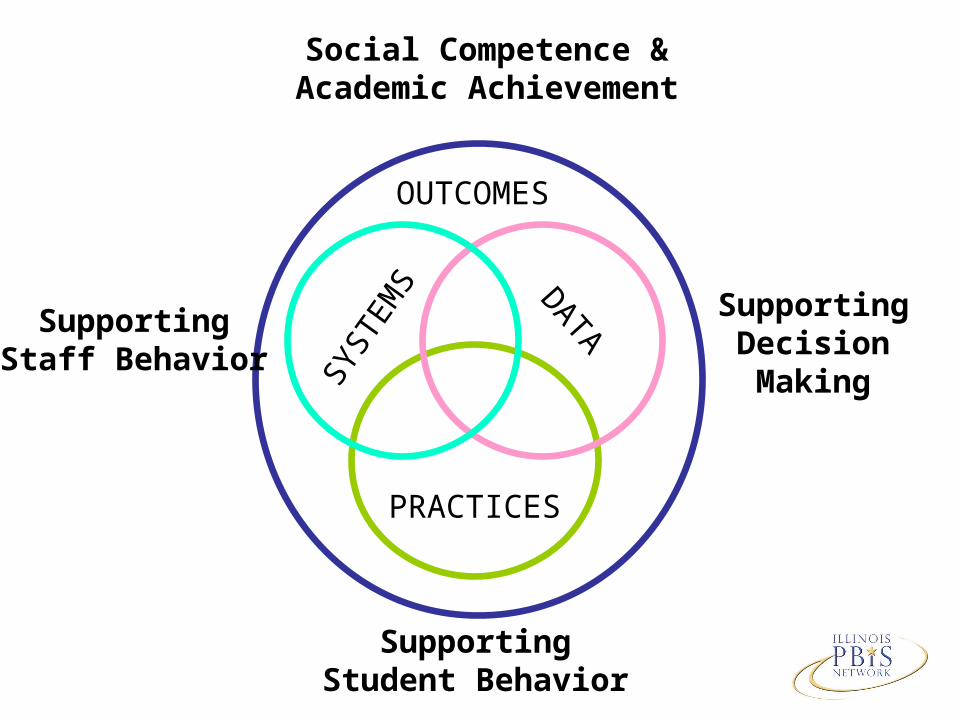
SYST
EMS
PRACTICES
DATASupportingStaff Behavior
SupportingDecisionMaking
SupportingStudent Behavior
OUTCOMES
Social Competence &Academic Achievement
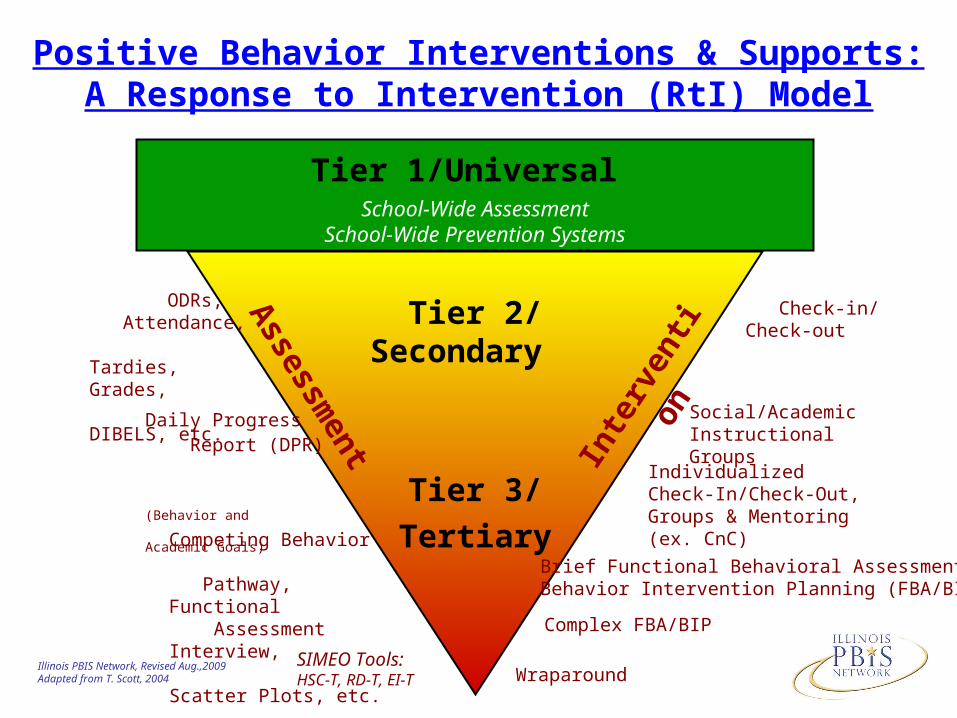
Tier 1/Universal School-Wide Assessment
School-Wide Prevention Systems
SIMEO Tools: HSC-T, RD-T, EI-T
Check-in/ Check-out
Individualized Check-In/Check-Out, Groups & Mentoring (ex. CnC)
Brief Functional Behavioral Assessment/Behavior Intervention Planning (FBA/BIP)
Complex FBA/BIP
Wraparound
ODRs, Attendance, Tardies, Grades, DIBELS, etc.
Daily Progress Report (DPR) (Behavior and Academic Goals)
Competing Behavior Pathway, Functional Assessment Interview, Scatter Plots, etc.
Social/Academic Instructional Groups
Positive Behavior Interventions & Supports:A Response to Intervention (RtI) Model
Illinois PBIS Network, Revised Aug.,2009Adapted from T. Scott, 2004
Tier 2/Secondary
Tier 3/Tertiary
Inte
rven
tio
nAssessm
en
t
Implementation Data/Examples…..
• Tier 1/Universal
• Tier 2/Secondary
• Tier 3/Tertiary
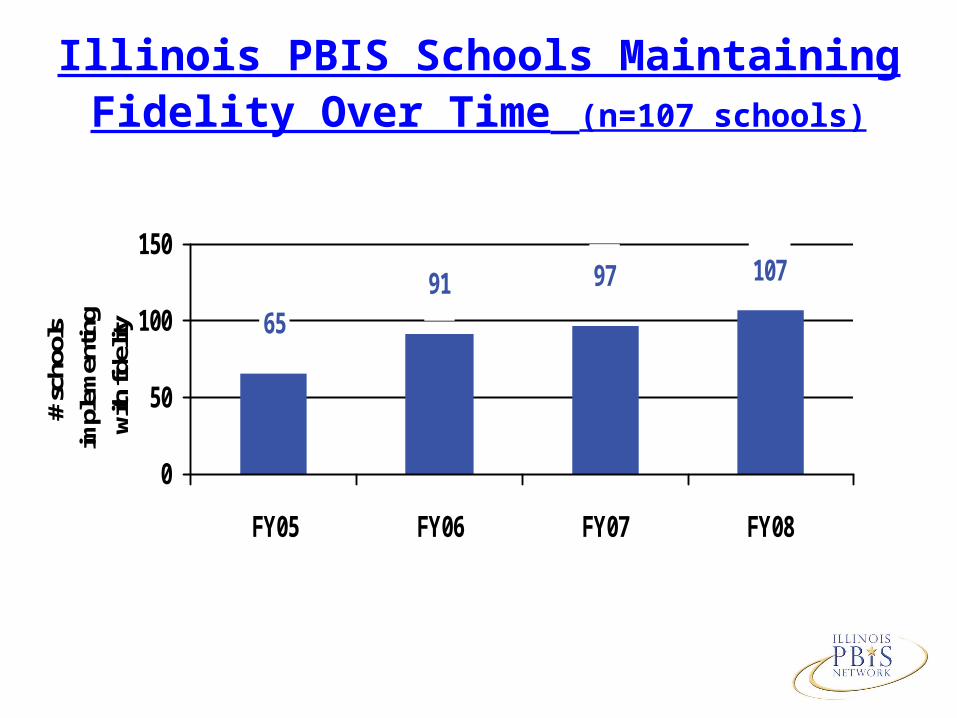
Illinois PBIS Schools Maintaining Fidelity Over Time (n=107 schools)
107
6591 97
0
50
100
150
FY05 FY06 FY07 FY08
# sc
hool
s im
plem
entin
g w
ith fi
delit
y
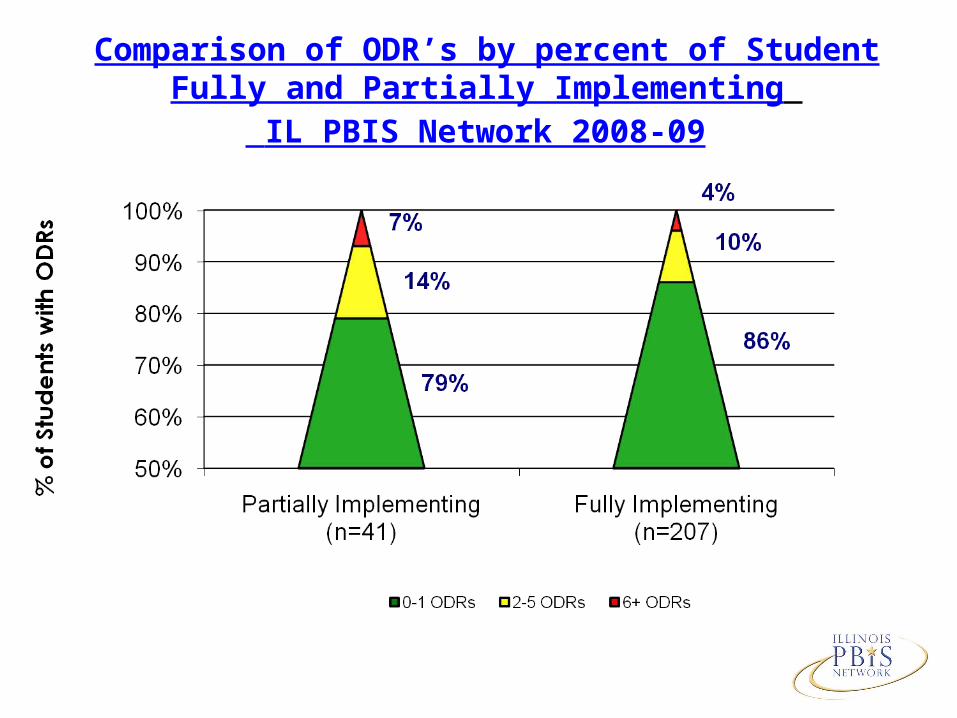
Comparison of ODR’s by percent of StudentFully and Partially Implementing
IL PBIS Network 2008-09
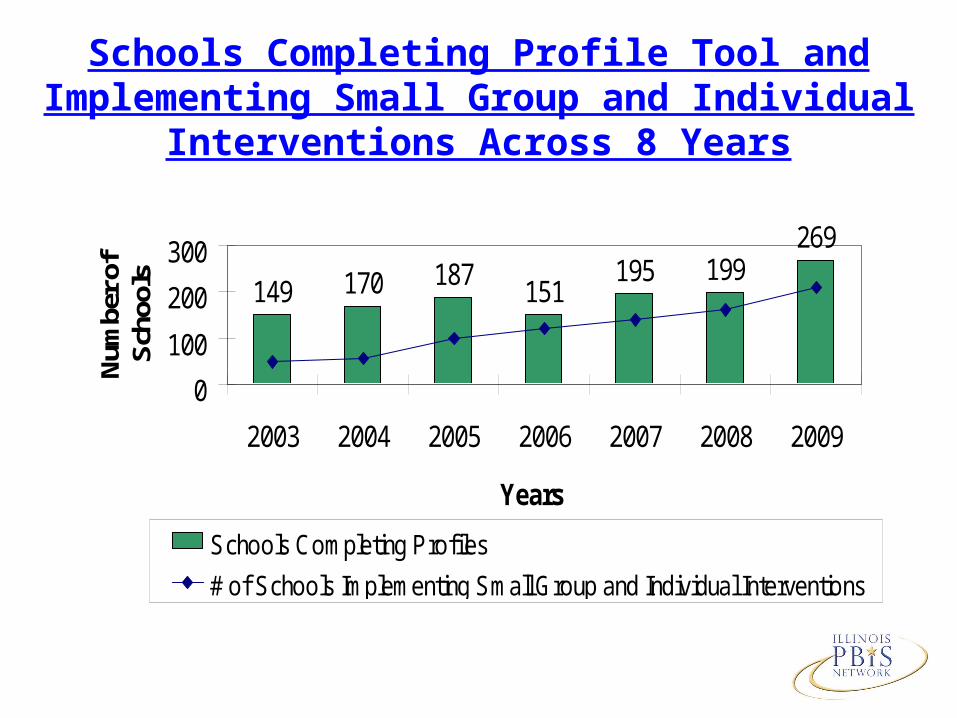
Schools Completing Profile Tool and Implementing Small Group and Individual
Interventions Across 8 Years
149 170 187151
195 199269
0
100
200
300
2003 2004 2005 2006 2007 2008 2009
Years
Num
ber o
f Sc
hool
s
Schools Completing Profiles
# of Schools Implementing Small Group and Individual Interventions
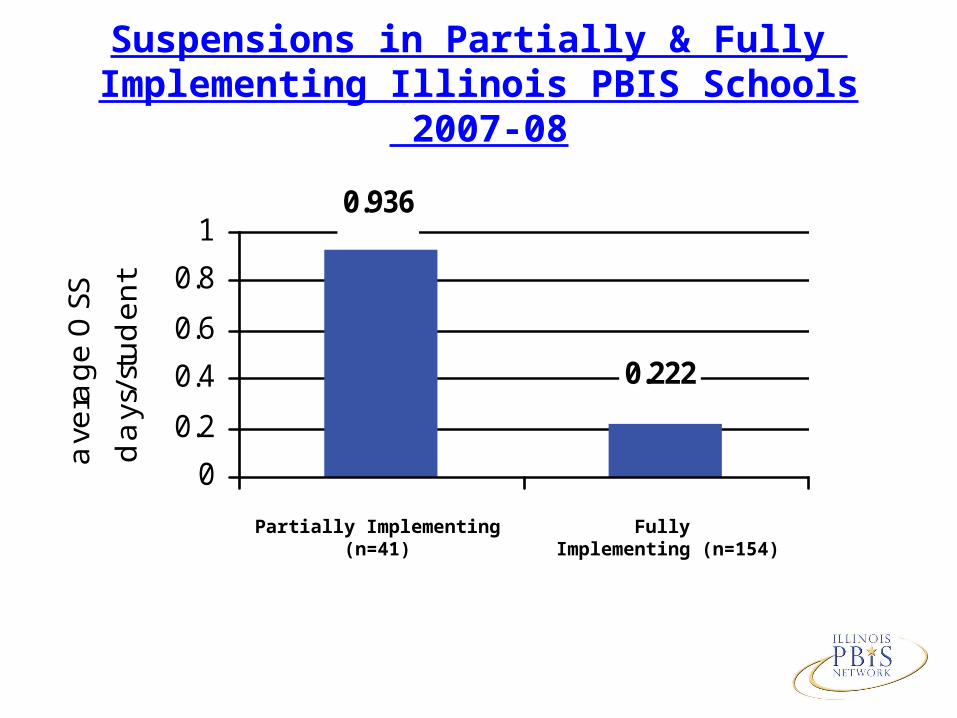
Suspensions in Partially & Fully Implementing Illinois PBIS Schools
2007-08
0.222
0.936
0
0.2
0.4
0.6
0.8
1
ave
rage
OSS
da
ys/s
tud
en
t
Partially Implementing (n=41)
Fully Implementing (n=154)
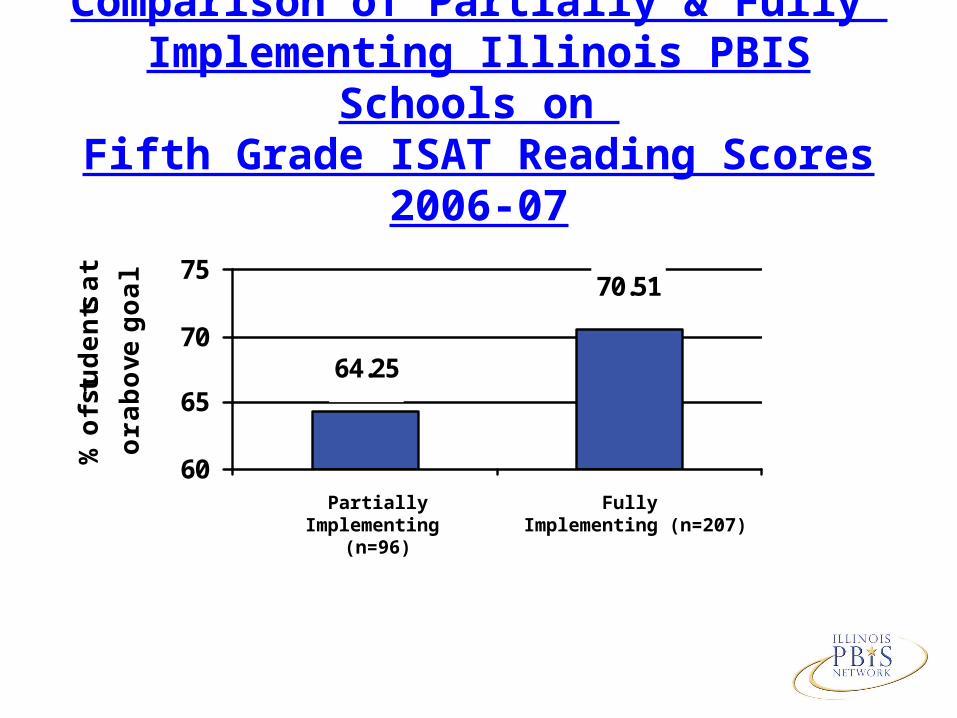
Comparison of Partially & Fully Implementing Illinois PBIS Schools on
Fifth Grade ISAT Reading Scores 2006-07
70.51
64.25
60
65
70
75
% o
f stu
dents
at
or above
goal
Partially Implementing
(n=96)
Fully Implementing (n=207)
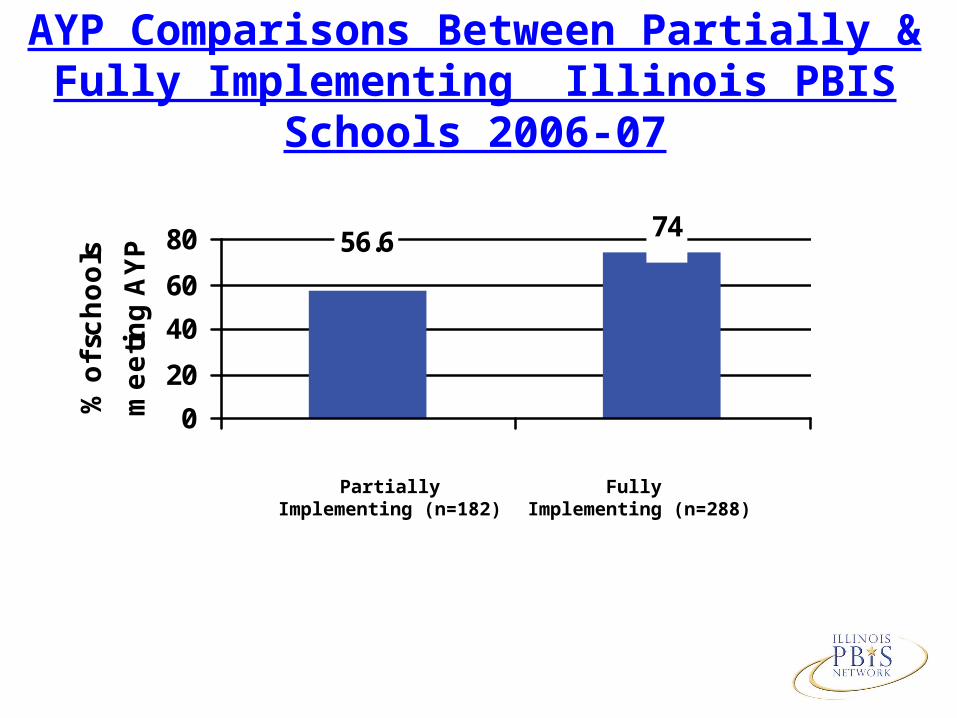
AYP Comparisons Between Partially & Fully Implementing Illinois PBIS Schools 2006-07
56.6 74
0
20
40
60
80
% o
f schools
meetin
g A
YP
Partially Implementing
(n=182)
Fully Implementing
(n=288)
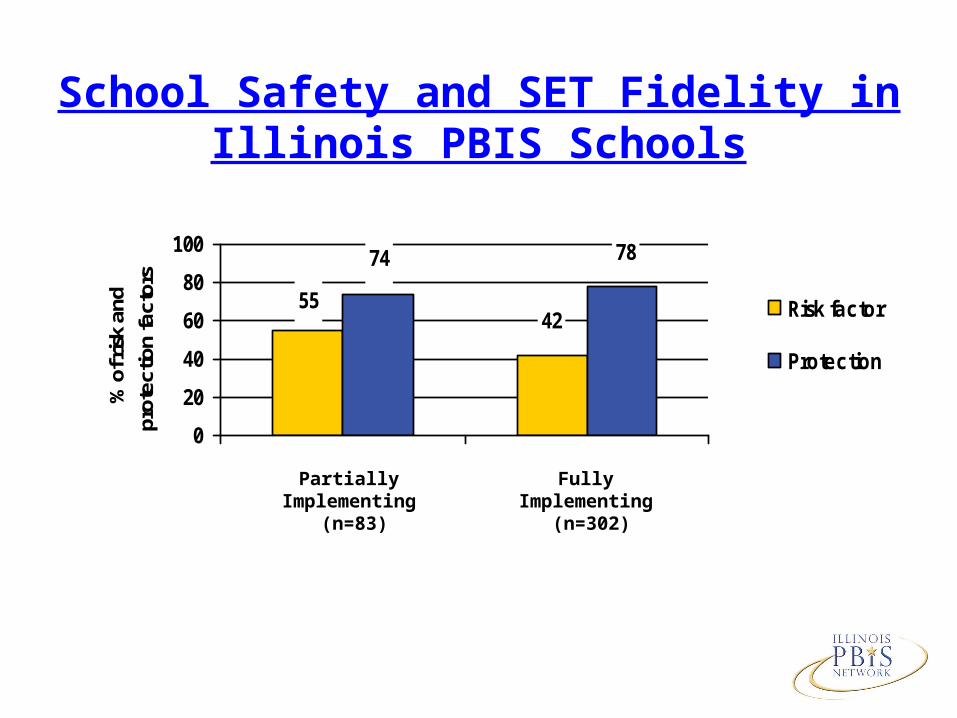
School Safety and SET Fidelity in Illinois PBIS Schools
5542
74 78
0
20
40
60
80
100
% o
f ris
k an
d pr
otec
tion
fact
ors
Risk factor
Protectionfactor
Partially Implementing
(n=83)
Fully Implementing
(n=302)
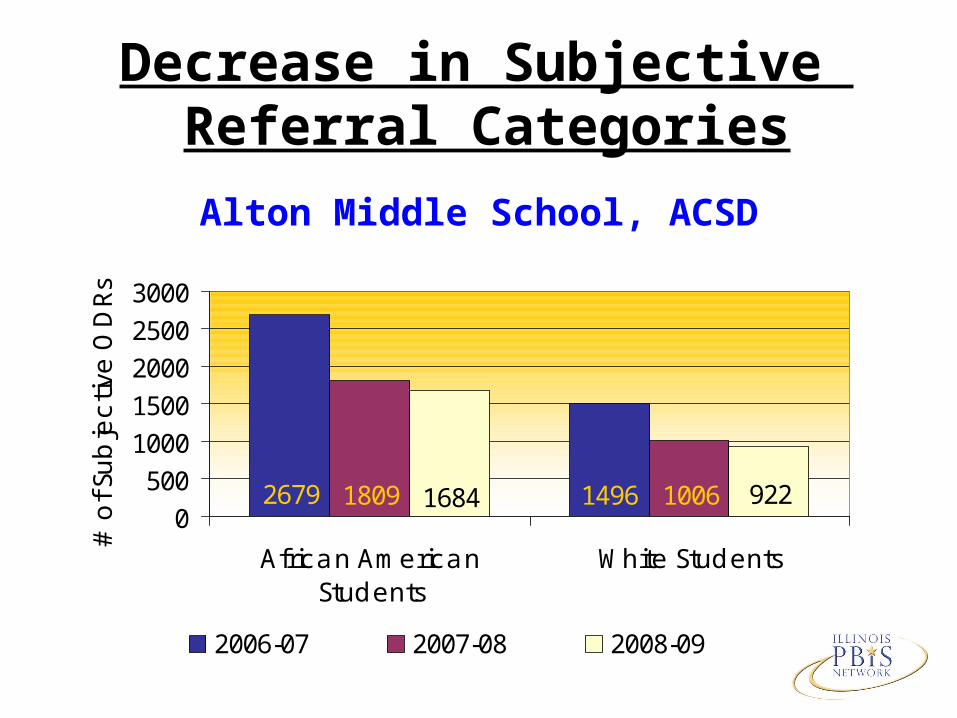
Decrease in Subjective Referral Categories
Alton Middle School, ACSD
14962679 10061809 92216840
50010001500200025003000
African AmericanStudents
White Students
# o
f Sub
jec
tive
OD
Rs
2006-07 2007-08 2008-09
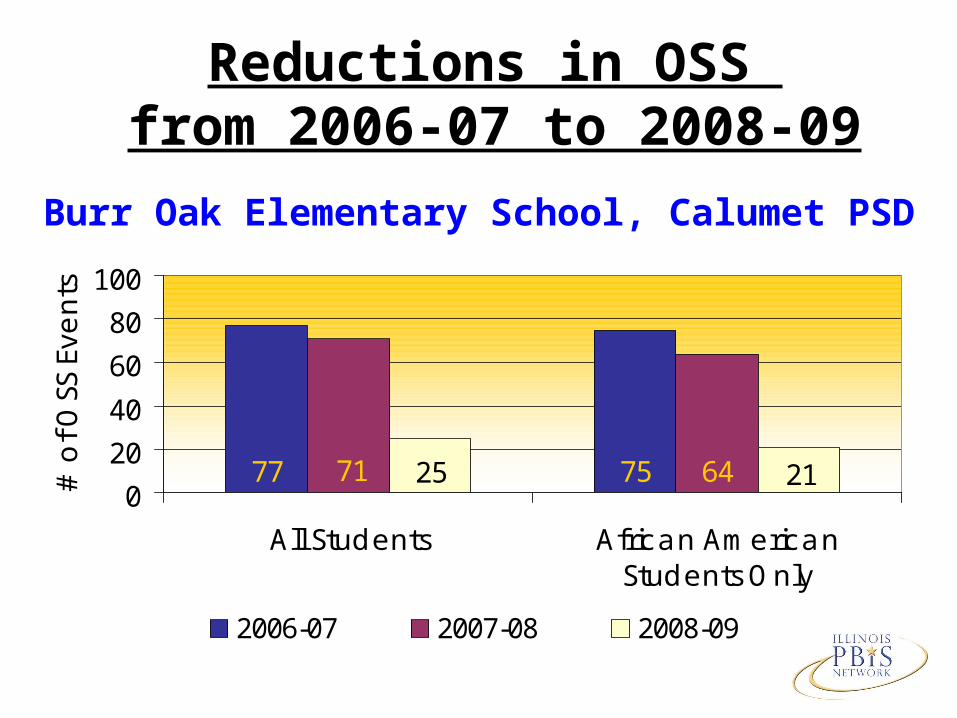
Reductions in OSS from 2006-07 to 2008-09
Burr Oak Elementary School, Calumet PSD
7577 6471 21250
20
40
60
80
100
All Students African AmericanStudents Only
# o
f OSS
Eve
nts
2006-07 2007-08 2008-09
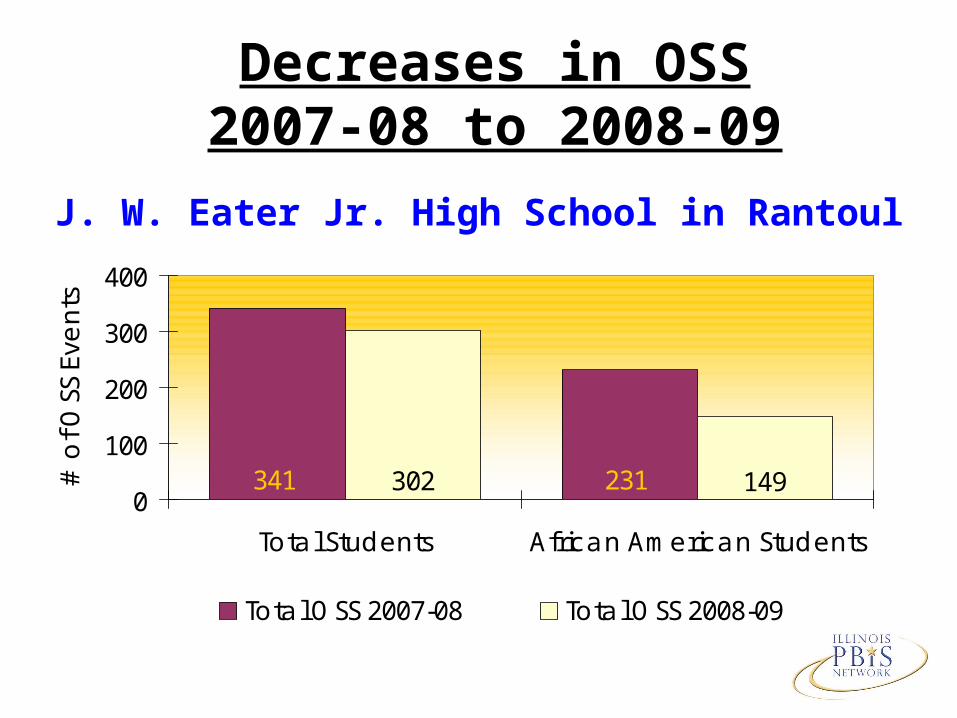
Decreases in OSS2007-08 to 2008-09
J. W. Eater Jr. High School in Rantoul
341 231302 1490
100
200
300
400
Total Students African American Students
# o
f OSS
Eve
nts
Total OSS 2007-08 Total OSS 2008-09
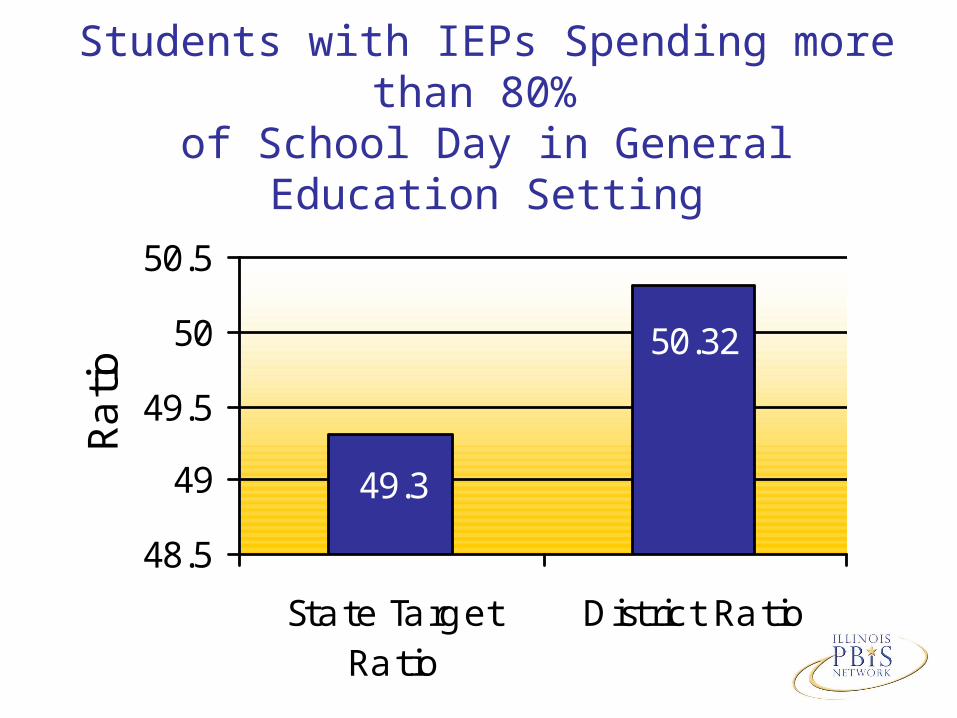
Students with IEPs Spending more than 80% of School Day in General Education Setting
50.32
49.3
48.5
49
49.5
50
50.5
State TargetRatio
District Ratio
Ra
tio
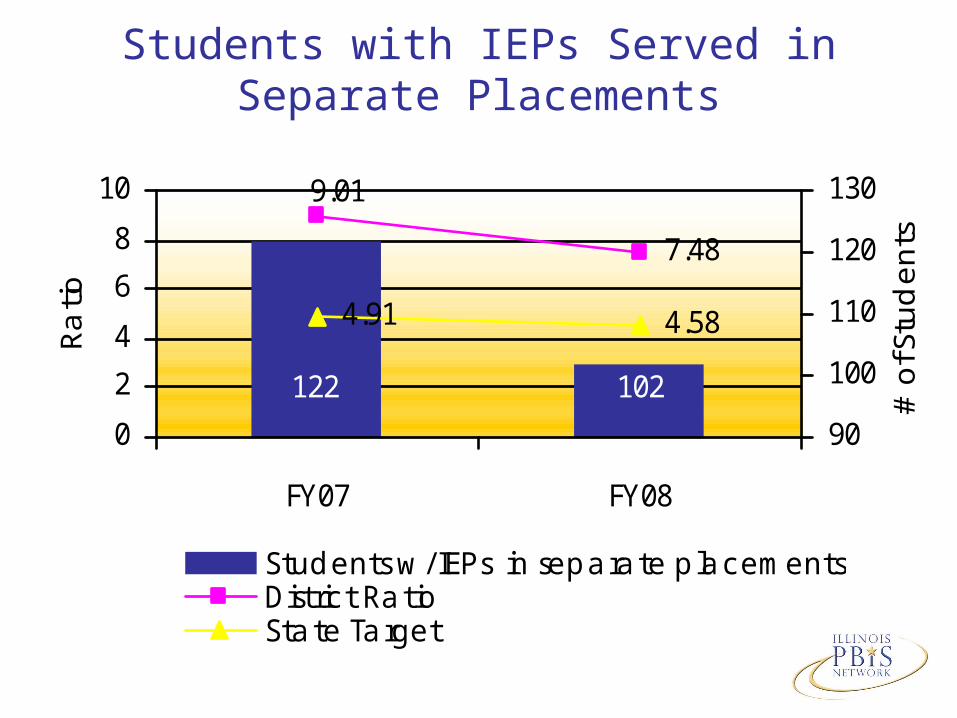
Students with IEPs Served in Separate Placements
102122
7.48
4.91 4.58
9.01
0
2
4
6
8
10
FY07 FY08
Ra
tio
90
100
110
120
130
# o
f Stu
de
nts
Students w/ IEPs in separate placementsDistrict Ratio State Target
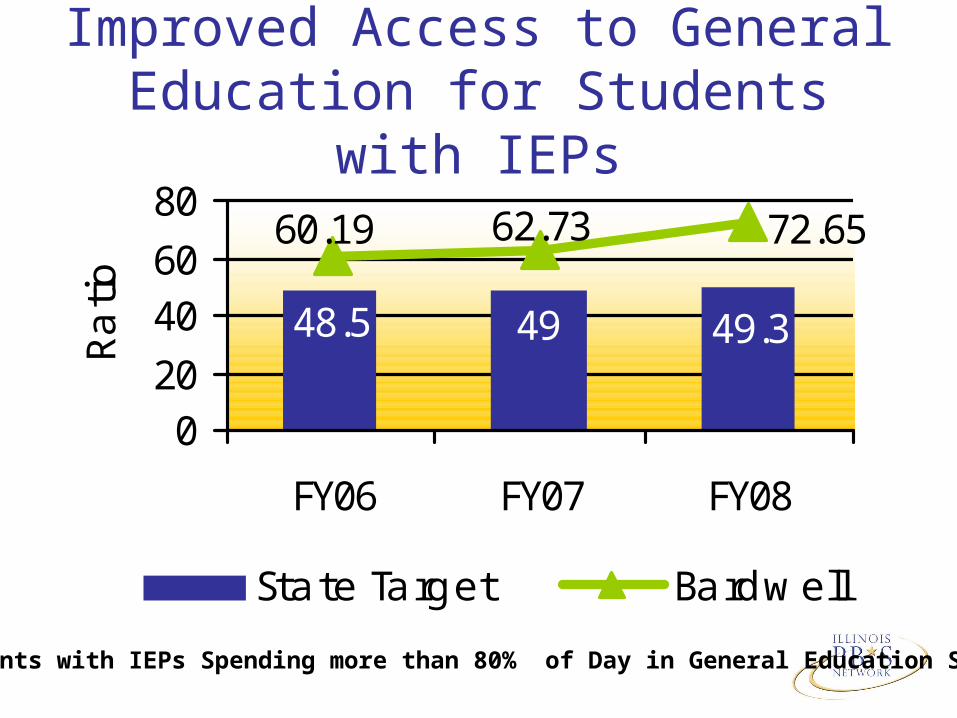
Improved Access to General Education for Students with IEPs
49.34948.5
72.6560.19 62.73
020
4060
80
FY06 FY07 FY08
Ra
tio
State Target Bardwell
Students with IEPs Spending more than 80% of Day in General Education Setting
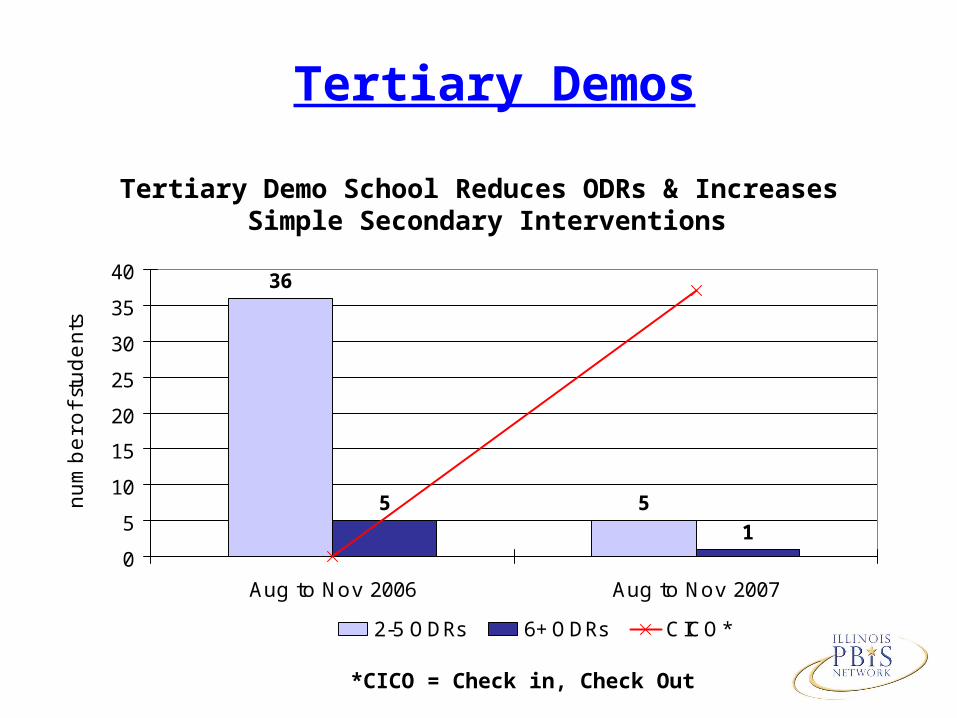
Tertiary Demo School Reduces ODRs & Increases Simple Secondary Interventions
36
551
0
5
10
15
20
25
30
35
40
Aug to Nov 2006 Aug to Nov 2007
num
be
r of st
ud
ents
2-5 ODRs 6+ ODRs CICO*
*CICO = Check in, Check Out
Tertiary Demos
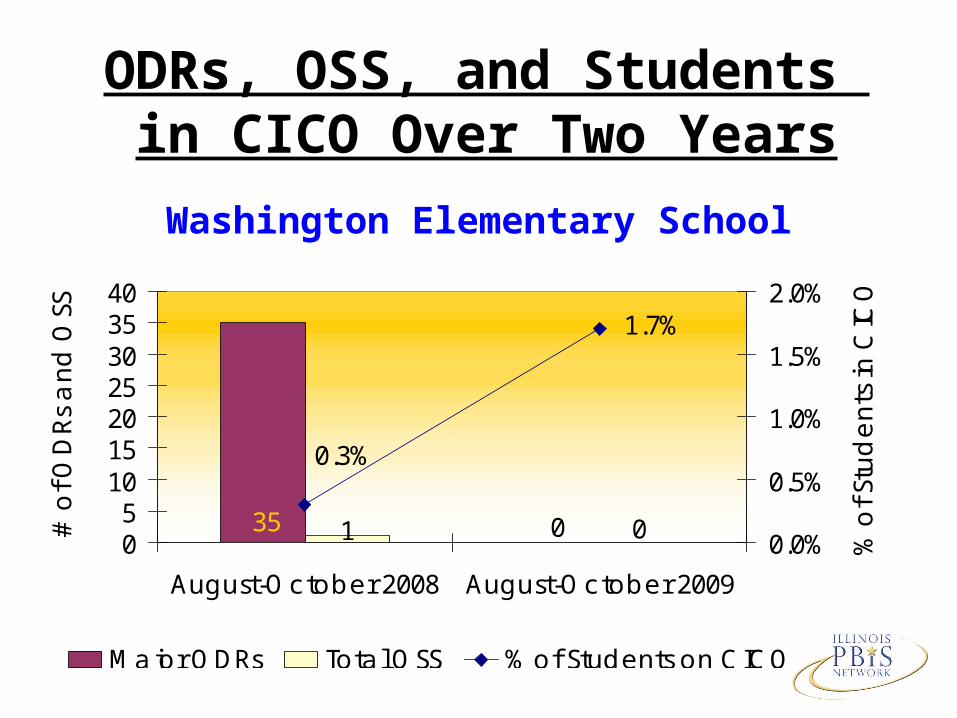
ODRs, OSS, and Students in CICO Over Two Years
Washington Elementary School
035 01
1.7%
0.3%
05
10152025303540
August-October 2008 August-October 2009
# o
f OD
Rs
and
OSS
0.0%
0.5%
1.0%
1.5%
2.0%
% o
f Stu
de
nts
in C
ICO
Major ODRs Total OSS % of Students on CICO
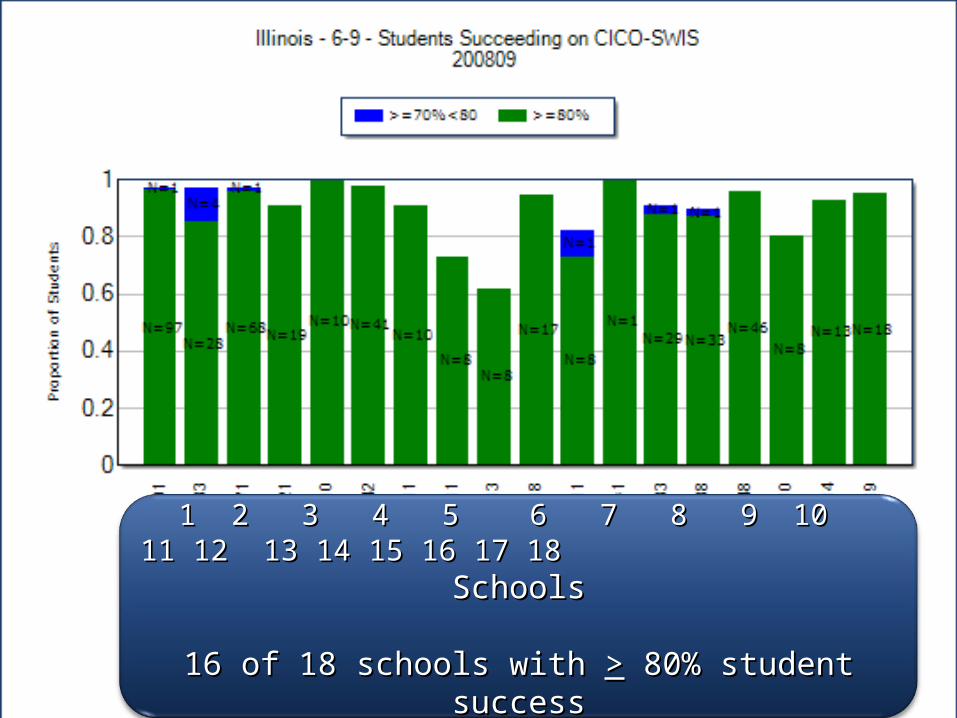
1 2 3 4 5 6 7 8 9 10 11 12 13 14 15 1 2 3 4 5 6 7 8 9 10 11 12 13 14 15 16 17 1816 17 18
SchoolsSchools
16 of 18 schools with 16 of 18 schools with >> 80% student success 80% student success
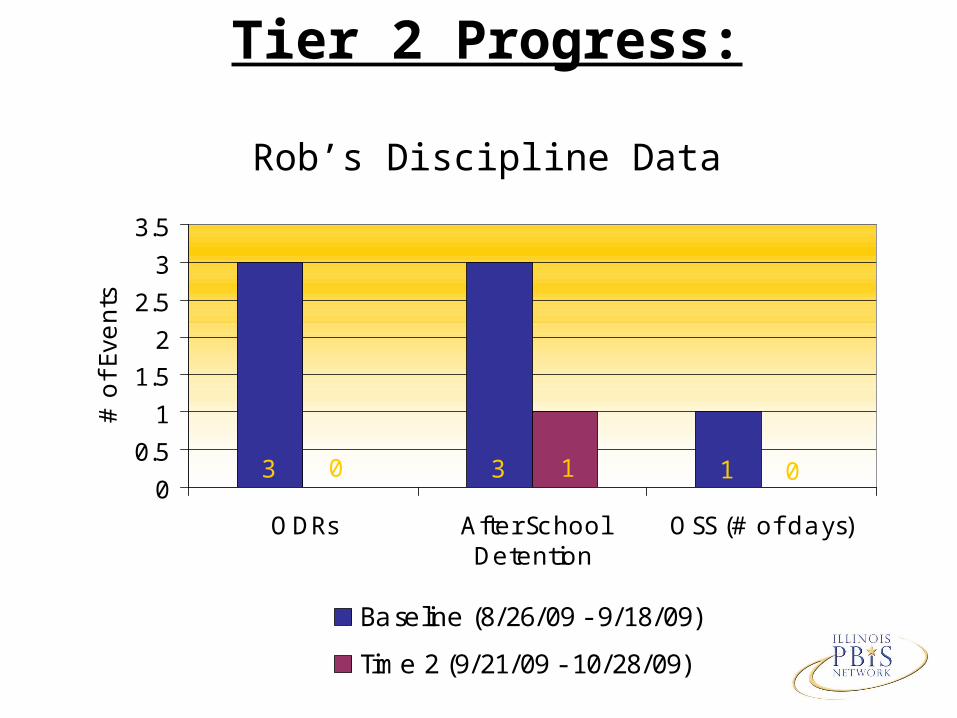
Tier 2 Progress:
Rob’s Discipline Data
133 00 10
0.5
1
1.5
2
2.5
3
3.5
ODRs After SchoolDetention
OSS (# of days)
# o
f Ev
ents
Baseline (8/26/09 - 9/18/09)
Time 2 (9/21/09 - 10/28/09)
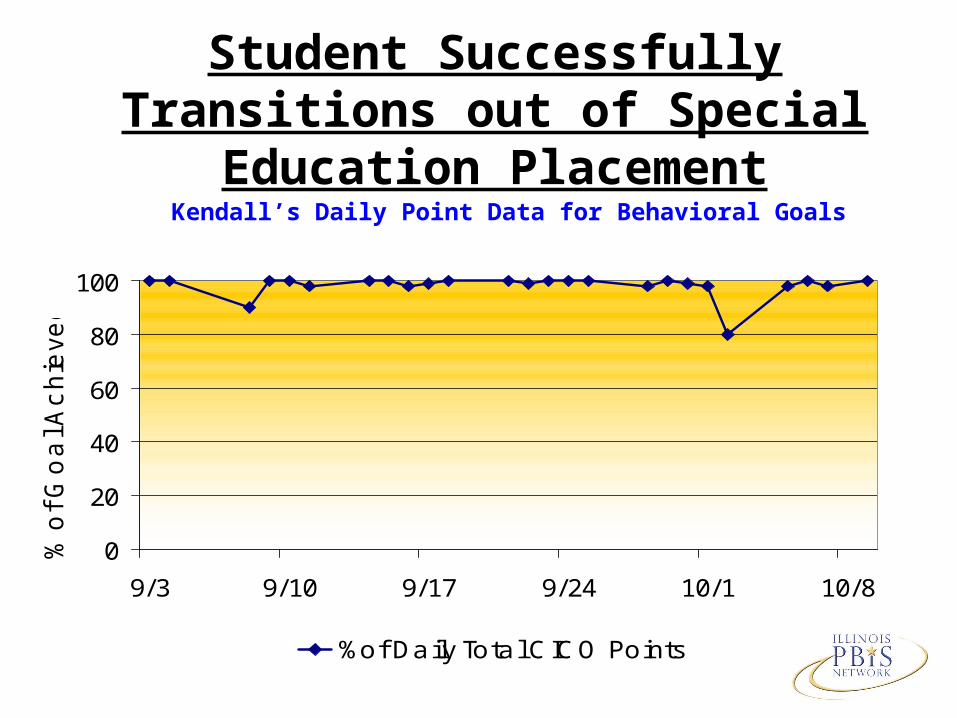
Student Successfully Transitions out of Special Education Placement
0
20
40
60
80
100
9/3 9/10 9/17 9/24 10/1 10/8
% o
f G
oa
l Ac
hie
ve
d
%of Daily Total CICO Points
Kendall’s Daily Point Data for Behavioral Goals
FY 2009 SIMEO Study II: Time 1 and Time 2 Assessment
04/20/2353
• 125 students receiving Tertiary Wraparound Intervention within school setting
• Average length of time receiving Tertiary Intervention= 9.1 months
• Baseline assessed within 30 days of team engagement (Student Disposition Tool, Education Information Tool, Home School Community Tool)
• Follow up assessment conducted at Time 2 (on average 3.94 months later)
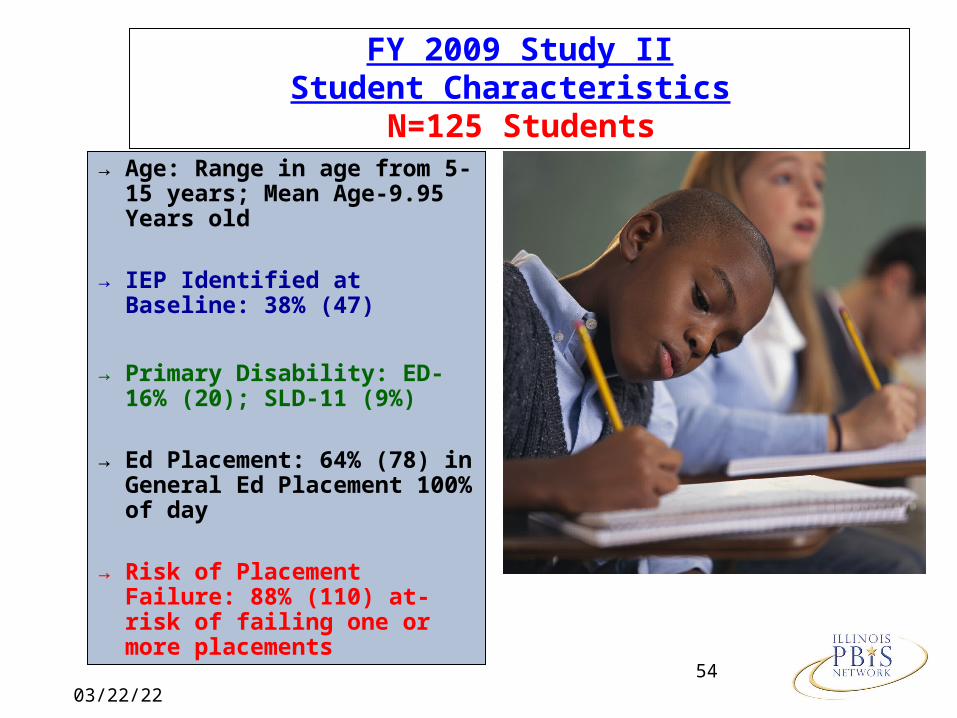
FY 2009 Study IIStudent Characteristics
N=125 Students
→ Age: Range in age from 5-15 years; Mean Age-9.95 Years old
→ IEP Identified at Baseline: 38% (47)
→ Primary Disability: ED-16% (20); SLD-11 (9%)
→ Ed Placement: 64% (78) in General Ed Placement 100% of day
→ Risk of Placement Failure: 88% (110) at-risk of failing one or more placements
04/20/2354
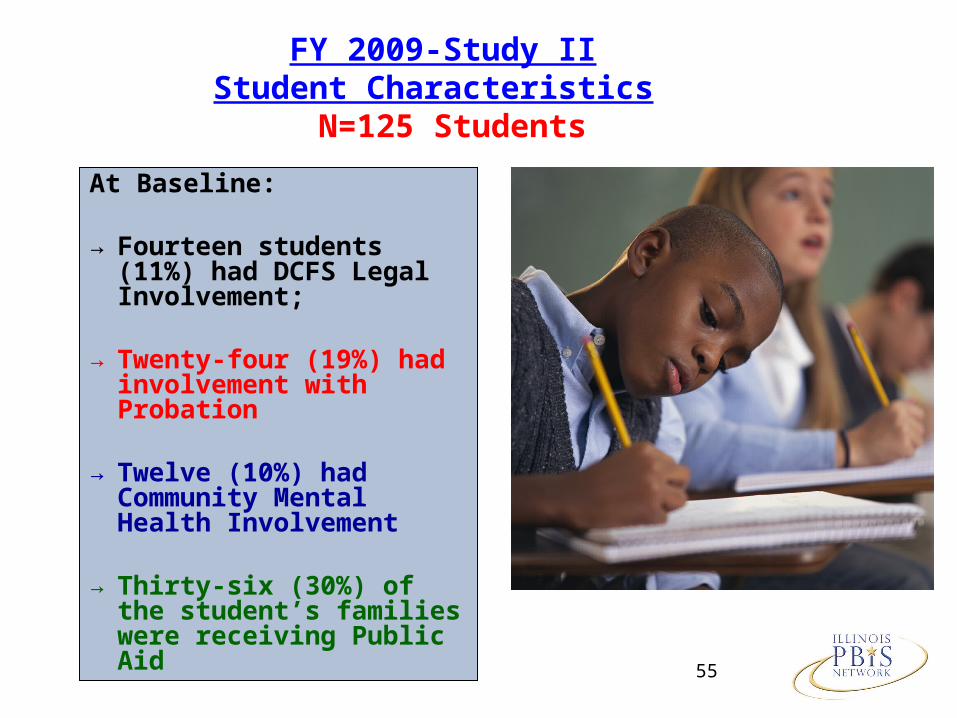
At Baseline:
→Fourteen students (11%) had DCFS Legal Involvement;
→Twenty-four (19%) had involvement with Probation
→Twelve (10%) had Community Mental Health Involvement
→Thirty-six (30%) of the student’s families were receiving Public Aid
55
FY 2009-Study IIStudent Characteristics
N=125 Students
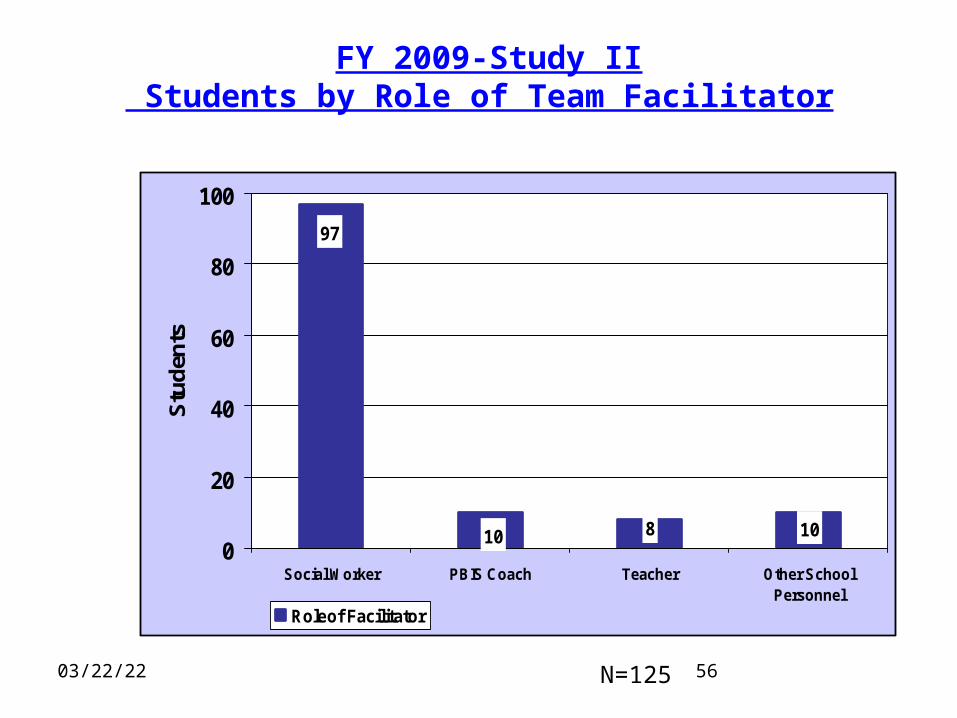
04/20/23 56N=125
10
97
8 100
20
40
60
80
100
Social Worker PBIS Coach Teacher Other SchoolPersonnel
Stu
den
ts
Roleof Facilitator
FY 2009-Study II Students by Role of Team Facilitator
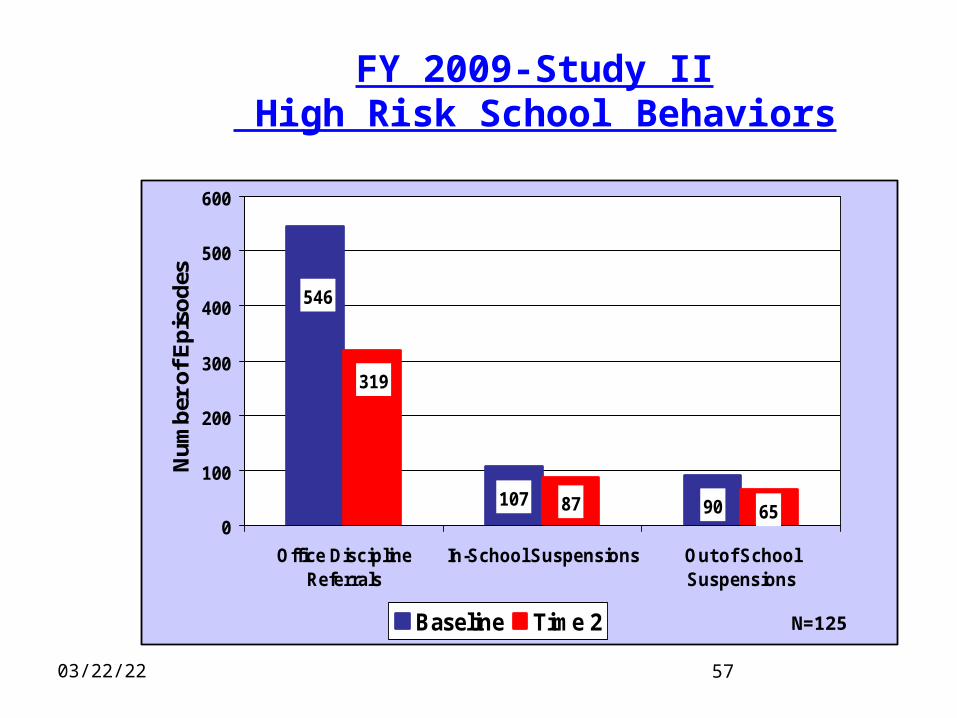
04/20/23 57
N=70
90
546
107 87
319
650
100
200
300
400
500
600
Office DisciplineReferrals
In-School Suspensions Out of SchoolSuspensions
Nu
mb
er o
f E
pis
od
es
Baseline Time 2 N=125
FY 2009-Study II High Risk School Behaviors
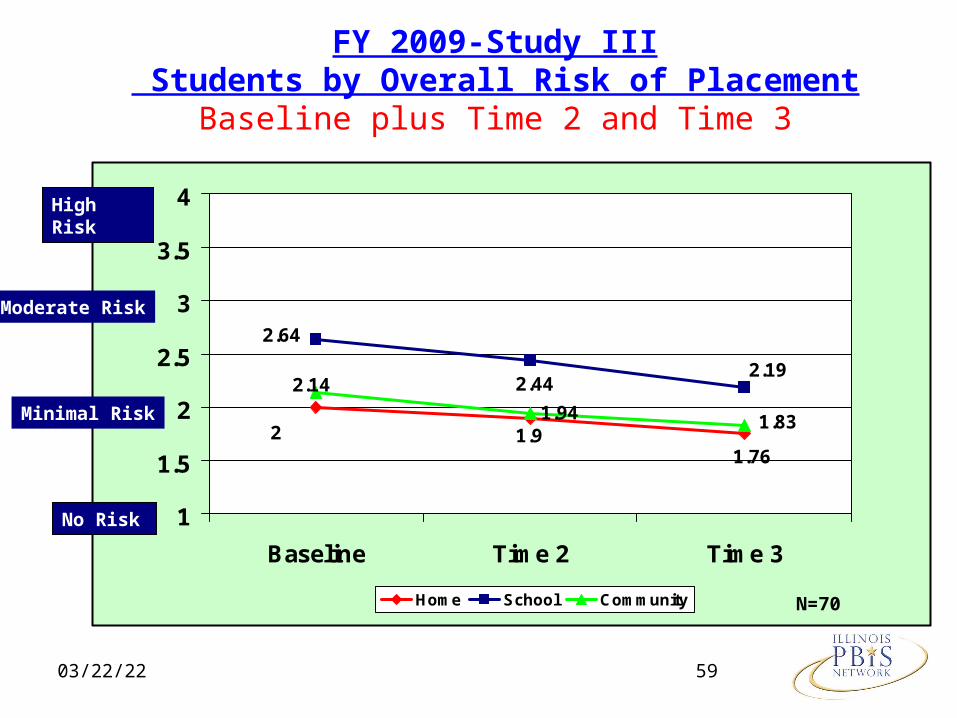
1.921.76
2.64
2.442.19
1.94
2.14
1.83
1
1.5
2
2.5
3
3.5
4
Baseline Time 2 Time 3
Home School Community
04/20/23 59
N=70
High Risk
No Risk
Minimal Risk
Moderate Risk
FY 2009-Study III Students by Overall Risk of Placement
Baseline plus Time 2 and Time 3
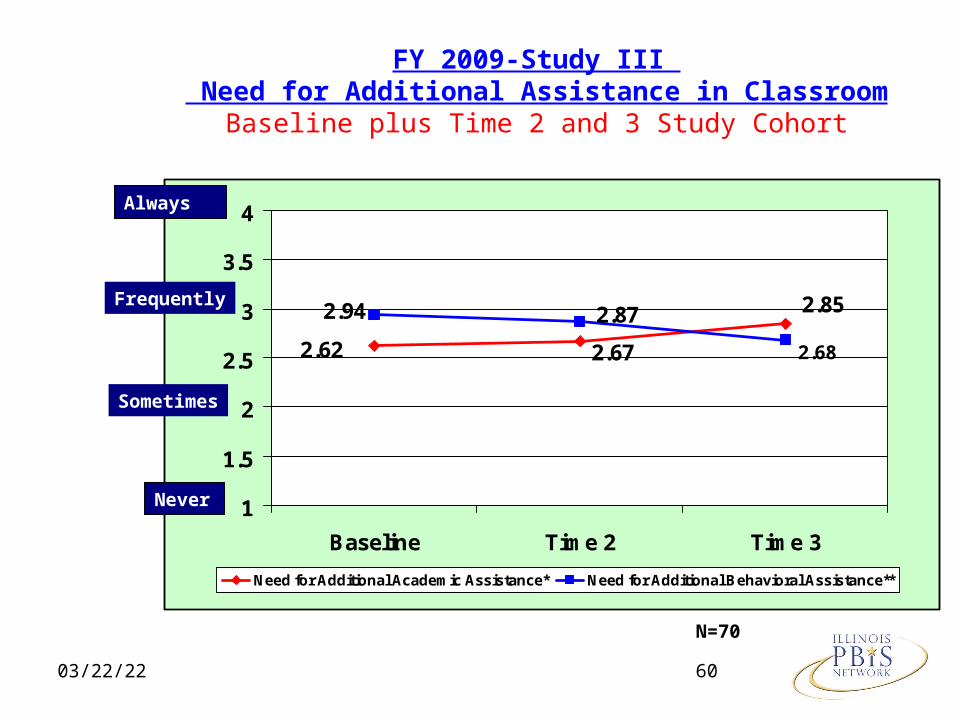
2.85
2.672.62 2.68
2.872.94
1
1.5
2
2.5
3
3.5
4
Baseline Time 2 Time 3
Need for Additional Academic Assistance* Need for Additional Behavioral Assistance**
04/20/23 60
N=70
Always
Never
Sometimes
Frequently
FY 2009-Study III Need for Additional Assistance in Classroom
Baseline plus Time 2 and 3 Study Cohort
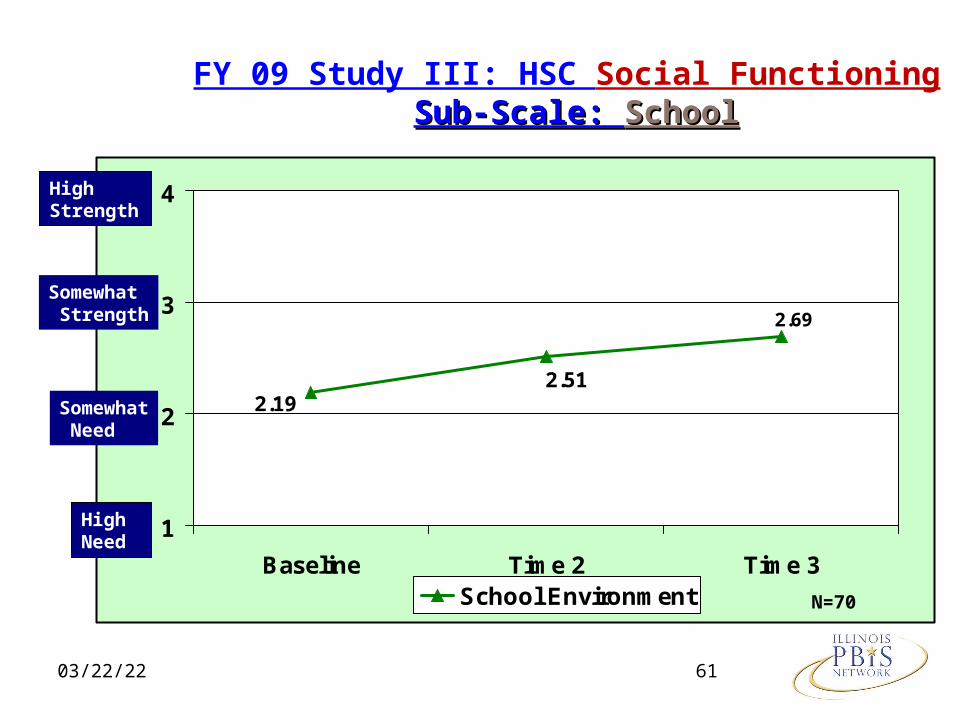
04/20/23 61
2.512.19
2.69
1
2
3
4
Baseline Time 2 Time 3
School Environment N=70
High Strength
High Need
Somewhat Need
Somewhat Strength
FY 09 Study III: HSC Social Functioning Sub-Scale: Sub-Scale: SchoolSchool
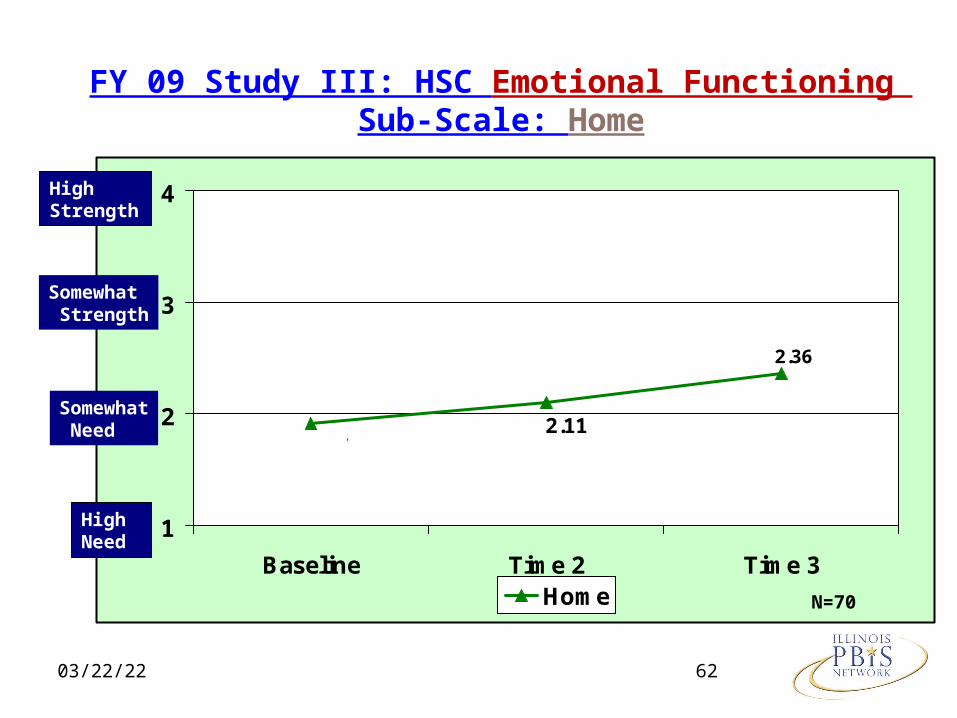
04/20/23 62
2.36
2.11
1
2
3
4
Baseline Time 2 Time 3
Home
1.94
N=70
High Strength
High Need
Somewhat Need
Somewhat Strength
FY 09 Study III: HSC Emotional Functioning Sub-Scale: Home
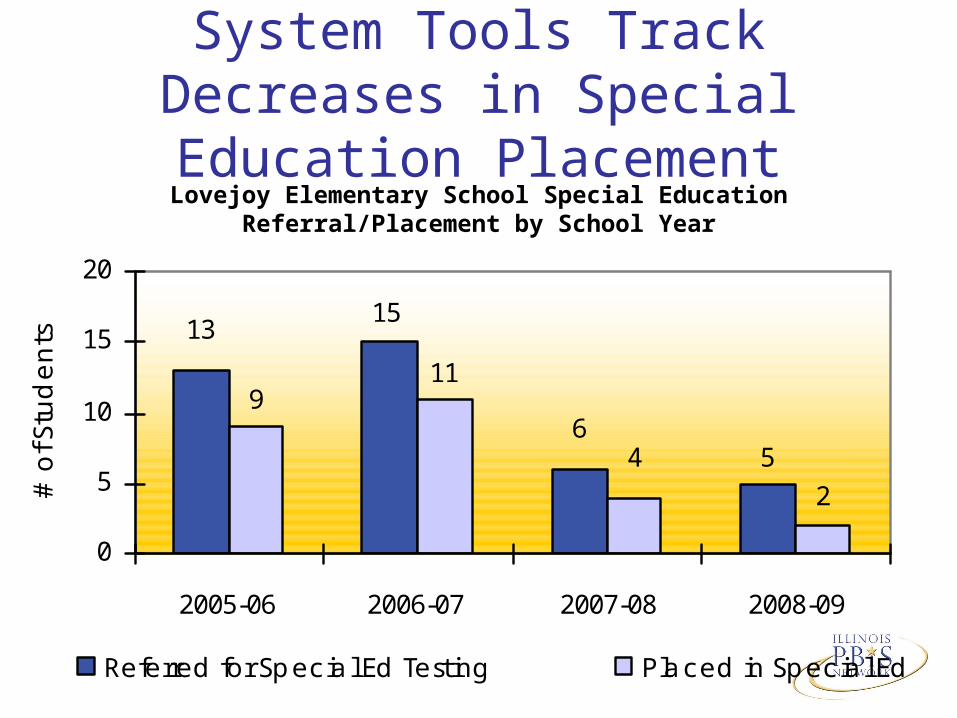
System Tools Track Decreases in Special Education PlacementLovejoy Elementary School Special Education
Referral/Placement by School Year
13
64 5
15
2
119
0
5
10
15
20
2005-06 2006-07 2007-08 2008-09
# o
f Stu
de
nts
Referred for Special Ed Testing Placed in Special Ed
System Structures Needed
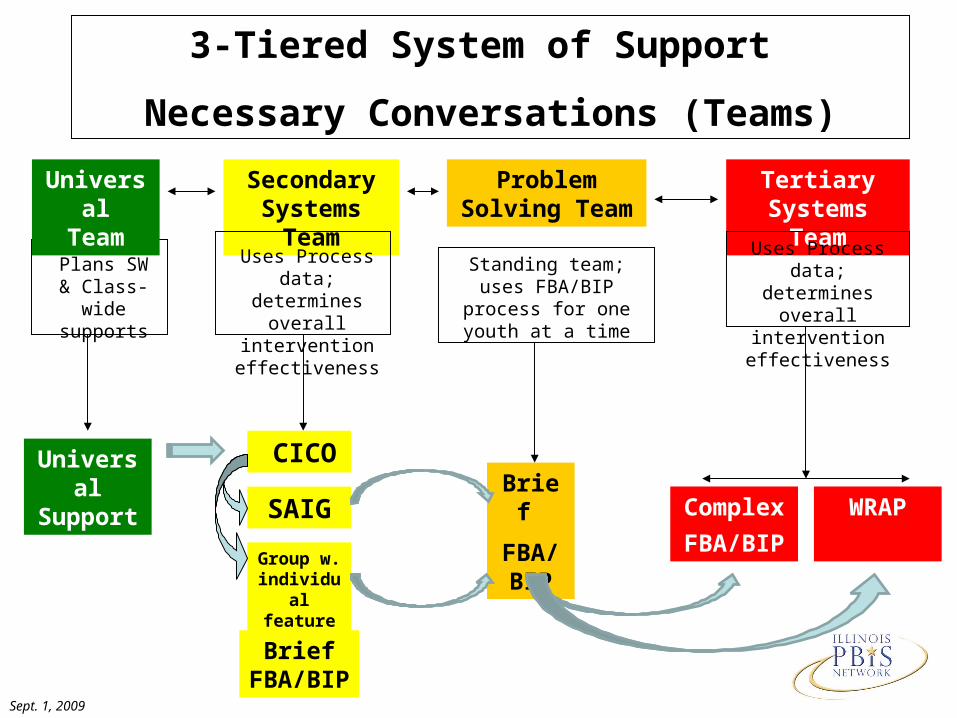
3-Tiered System of Support
Necessary Conversations (Teams)
CICO
SAIG
Group w. individual
feature
Complex
FBA/BIP
Problem Solving Team
Tertiary Systems Team
Brief
FBA/BIP
Brief FBA/BIP
WRAP
Secondary Systems Team
Plans SW & Class-wide supports
Uses Process data; determines overall
intervention effectiveness
Standing team; uses FBA/BIP process for one youth at a time
Uses Process data; determines overall
intervention effectiveness
Sept. 1, 2009
UniversalTeam
Universal Support
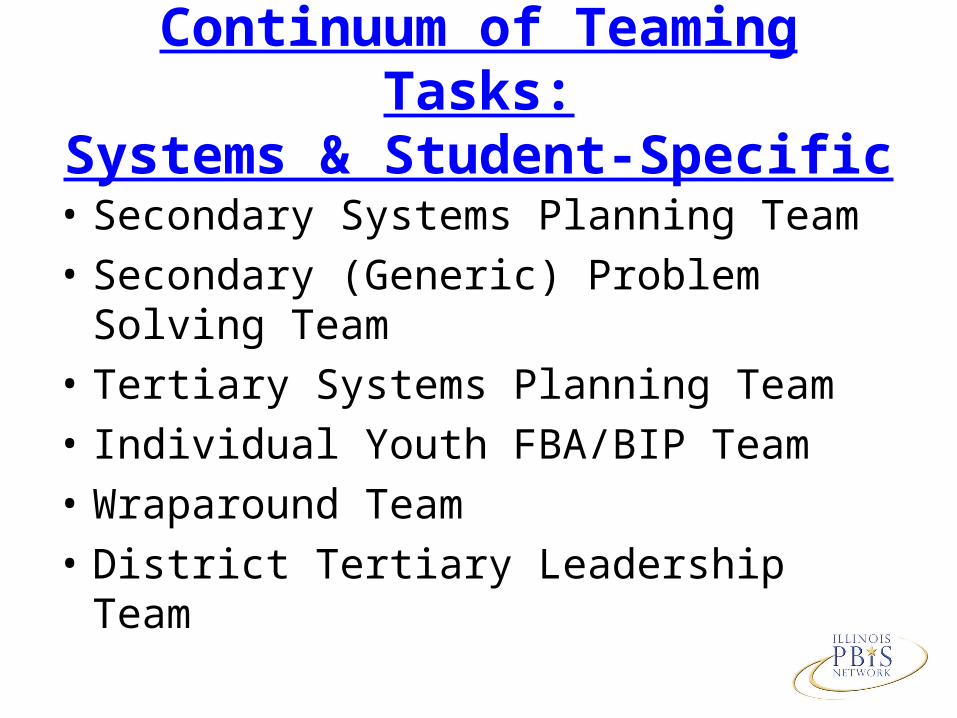
Continuum of Teaming Tasks:Systems & Student-Specific
• Secondary Systems Planning Team
• Secondary (Generic) Problem Solving Team
• Tertiary Systems Planning Team
• Individual Youth FBA/BIP Team
• Wraparound Team
• District Tertiary Leadership Team
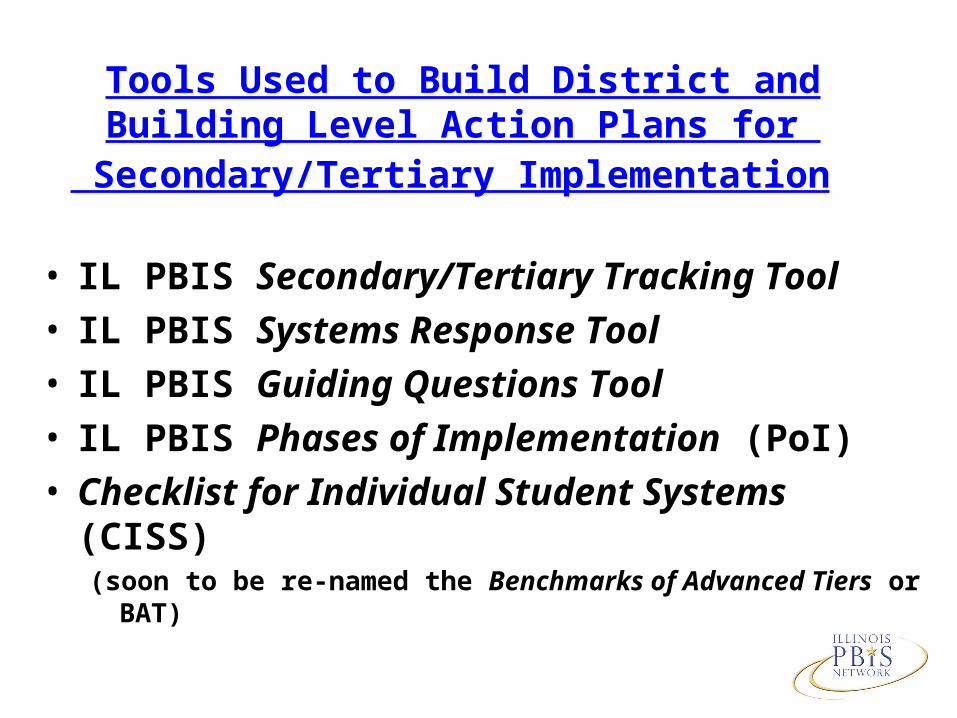
Tools Used to Build District and Building Level Action Plans for
Secondary/Tertiary Implementation
• IL PBIS Secondary/Tertiary Tracking Tool• IL PBIS Systems Response Tool• IL PBIS Guiding Questions Tool• IL PBIS Phases of Implementation (PoI) • Checklist for Individual Student Systems (CISS)
(soon to be re-named the Benchmarks of Advanced Tiers or BAT)
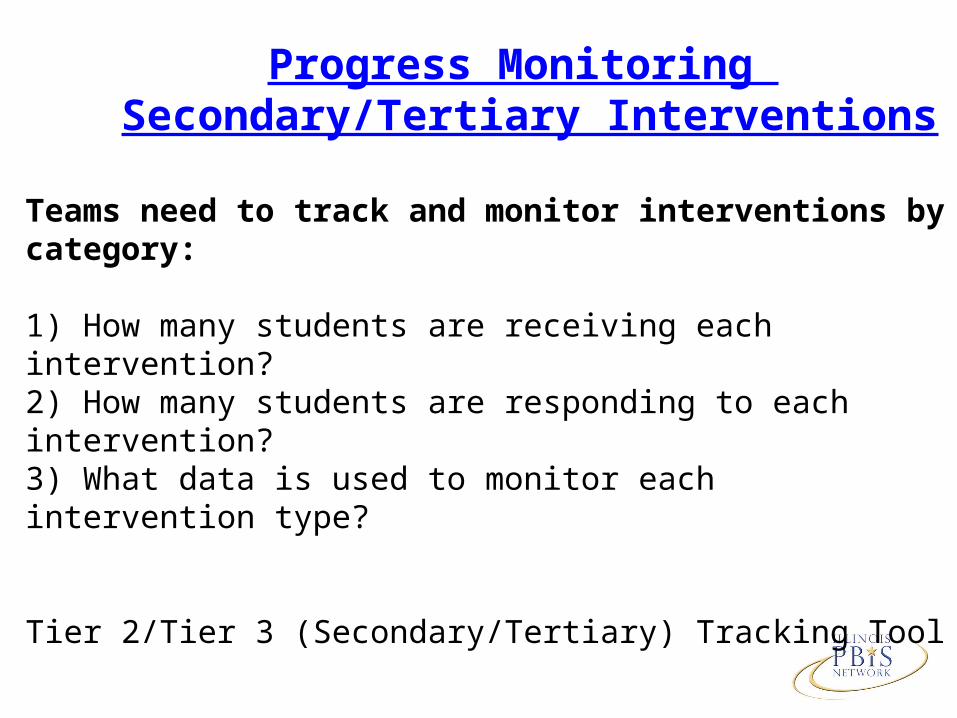
Progress Monitoring Secondary/Tertiary Interventions
Teams need to track and monitor interventions by category:
1) How many students are receiving each intervention?2) How many students are responding to each intervention?3) What data is used to monitor each intervention type?
Tier 2/Tier 3 (Secondary/Tertiary) Tracking Tool
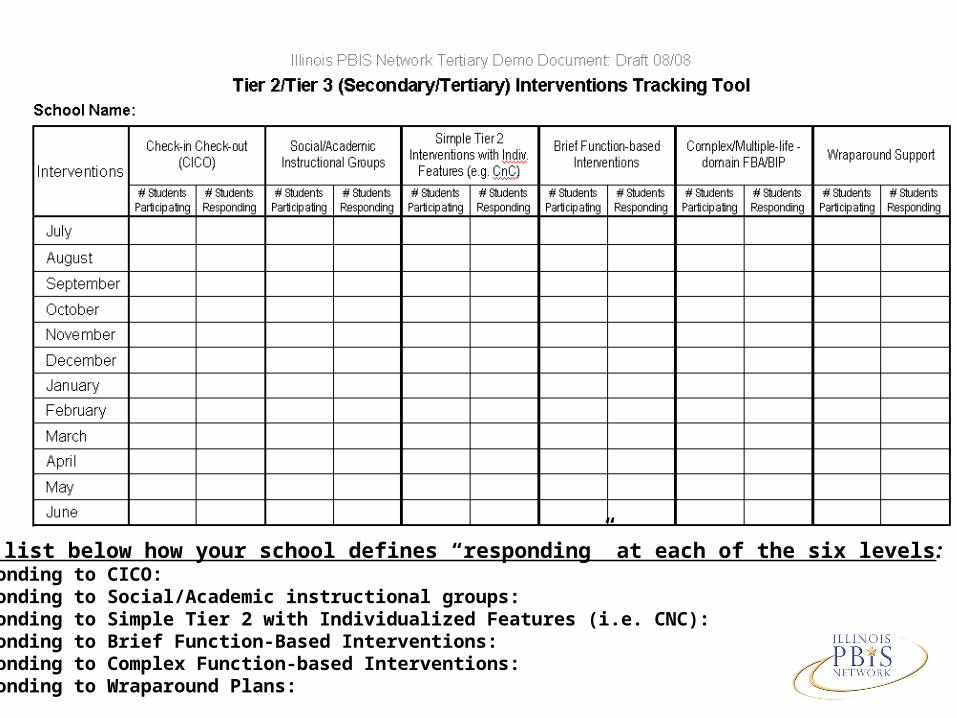
Please list below how your school defines “responding” at each of the six levels:1. Responding to CICO:2. Responding to Social/Academic instructional groups:3. Responding to Simple Tier 2 with Individualized Features (i.e. CNC):4. Responding to Brief Function-Based Interventions:5. Responding to Complex Function-based Interventions:6. Responding to Wraparound Plans:
“Finding” Students in Need of Tertiary Supports
• Systems Response Tool
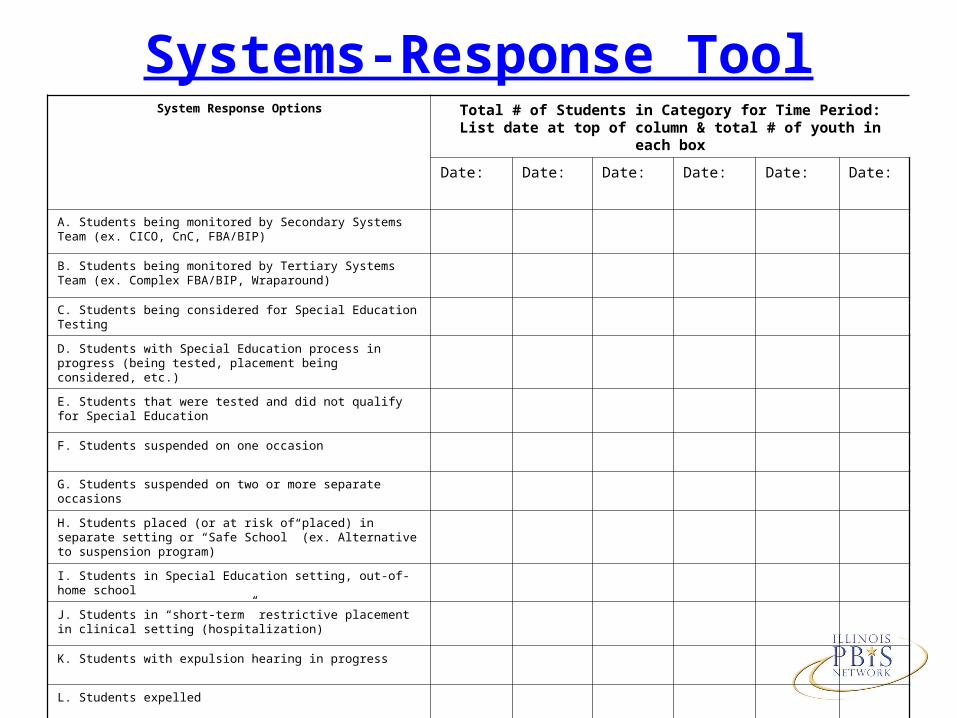
Systems-Response ToolSystem Response Options Total # of Students in Category for Time Period: List date at top
of column & total # of youth in each box
Date: Date: Date: Date: Date: Date:
A. Students being monitored by Secondary Systems Team (ex. CICO, CnC, FBA/BIP)
B. Students being monitored by Tertiary Systems Team (ex. Complex FBA/BIP, Wraparound)
C. Students being considered for Special Education Testing
D. Students with Special Education process in progress (being tested, placement being considered, etc.)
E. Students that were tested and did not qualify for Special Education
F. Students suspended on one occasion
G. Students suspended on two or more separate occasions
H. Students placed (or at risk of placed) in separate setting or “Safe School” (ex. Alternative to suspension program)
I. Students in Special Education setting, out-of-home school
J. Students in “short-term” restrictive placement in clinical setting (hospitalization)
K. Students with expulsion hearing in progress
L. Students expelled
Guiding Questions Tool
• Assessing and planning your Tier 2 and Tier 3 Systems, data and practices
Self-Assessing Implementation at Tier 2 and Tier 3
• Checklist for Individual Student Systems (CISS)
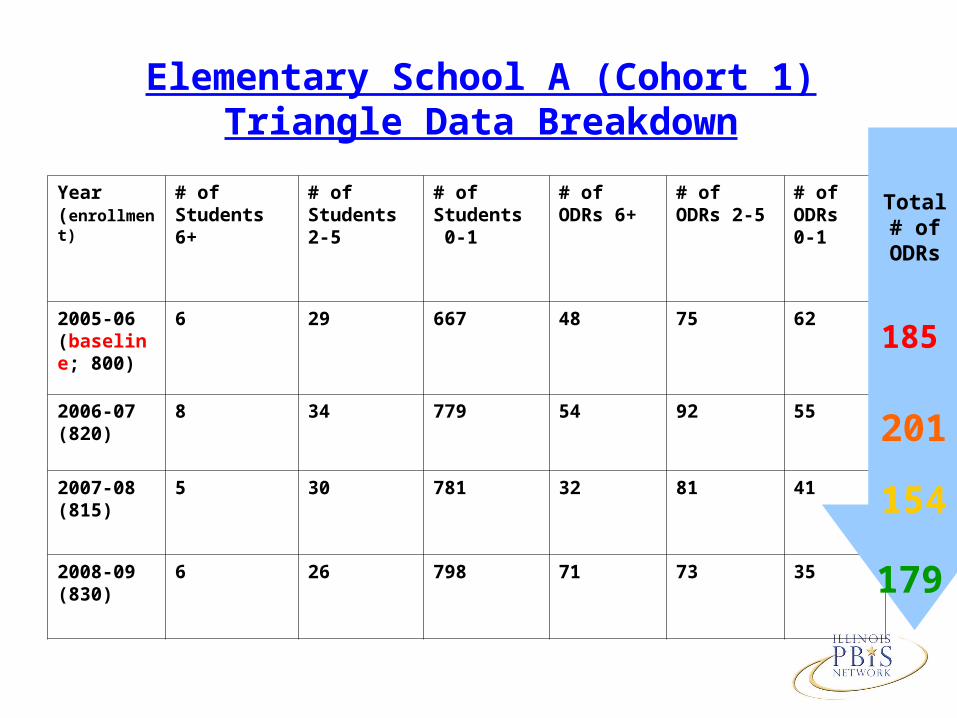
Year (enrollment)
# of Students 6+
# of Students 2-5
# of Students 0-1
# of ODRs 6+
# of ODRs 2-5
# of ODRs0-1
2005-06 (baseline; 800)
6 29 667 48 75 62
2006-07 (820)
8 34 779 54 92 55
2007-08 (815)
5 30 781 32 81 41
2008-09 (830)
6 26 798 71 73 35
Elementary School A (Cohort 1)Triangle Data Breakdown
Total # of
ODRs
179
201
185
154
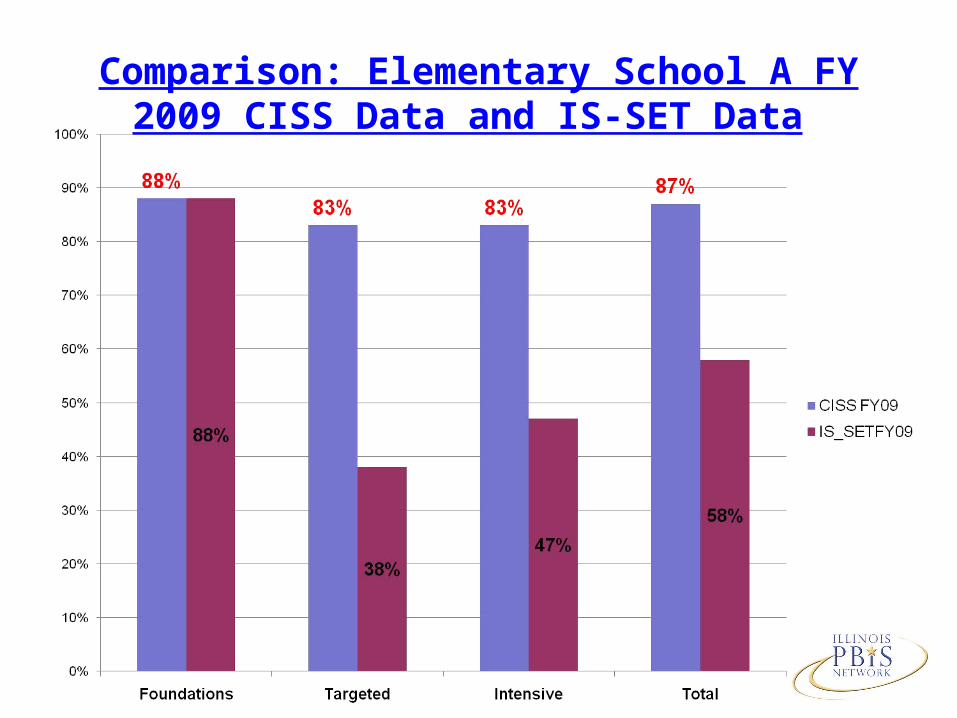
Comparison: Elementary School A FY 2009 CISS Data and IS-SET Data
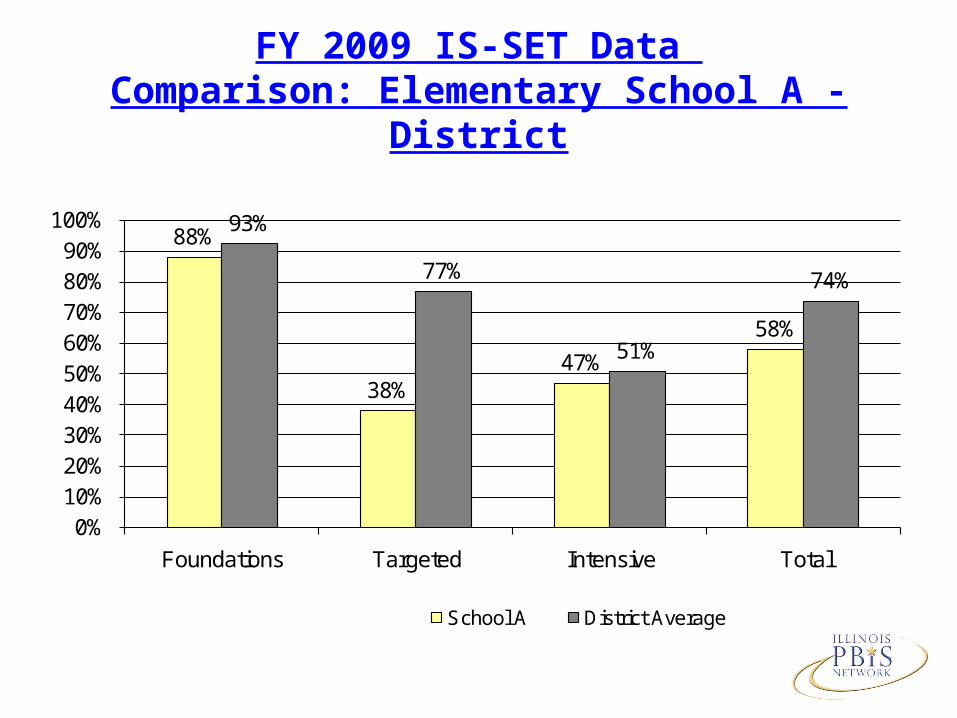
FY 2009 IS-SET Data Comparison: Elementary School A - District
88%
38%47%
58%
93%
77%
51%
74%
0%10%20%30%40%50%60%70%80%90%
100%
Foundations Targeted Intensive Total
School A District Average

Year (enrollment)
# of Students 6+
# of Students 2-5
# of Students 0-1
# of ODRs 6+
# of ODRs 2-5
# of ODRs 0-1
2006-07 (baseline; 677)
5 31 642 31 88 45
2007-08 (707)
0 15 692 0 41 30
2008-09 (695)
2 10 684 11 26 24
Elementary School B (Cohort 2)Triangle Data Breakdown
Total # of ODRs
61
71
164
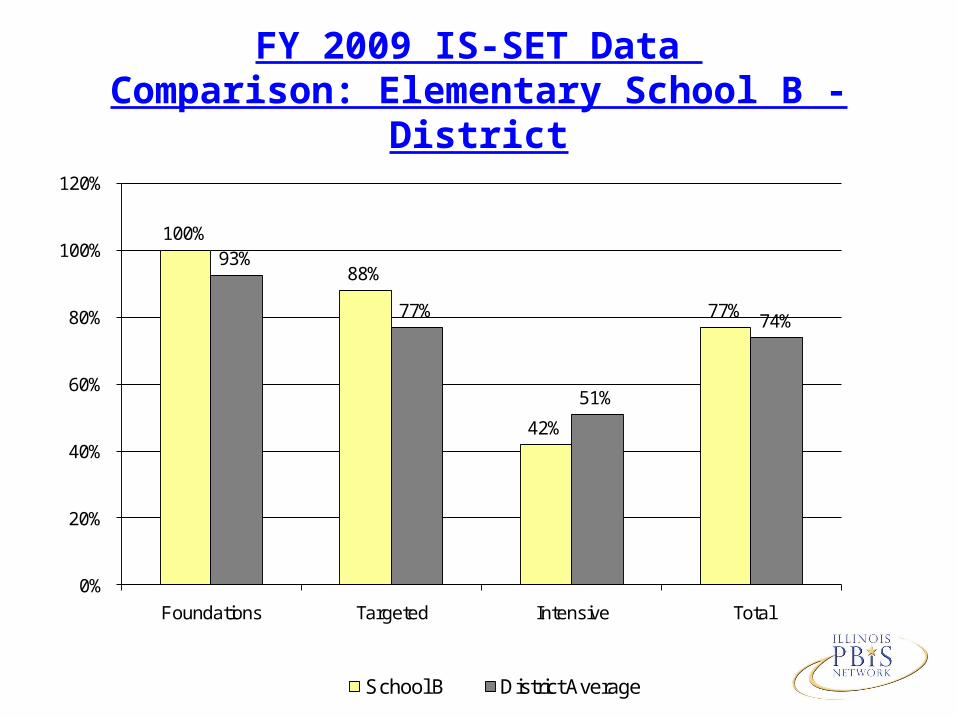
FY 2009 IS-SET Data Comparison: Elementary School B - District
100%
88%
42%
77%
93%
77%
51%
74%
0%
20%
40%
60%
80%
100%
120%
Foundations Targeted Intensive Total
School B District Average
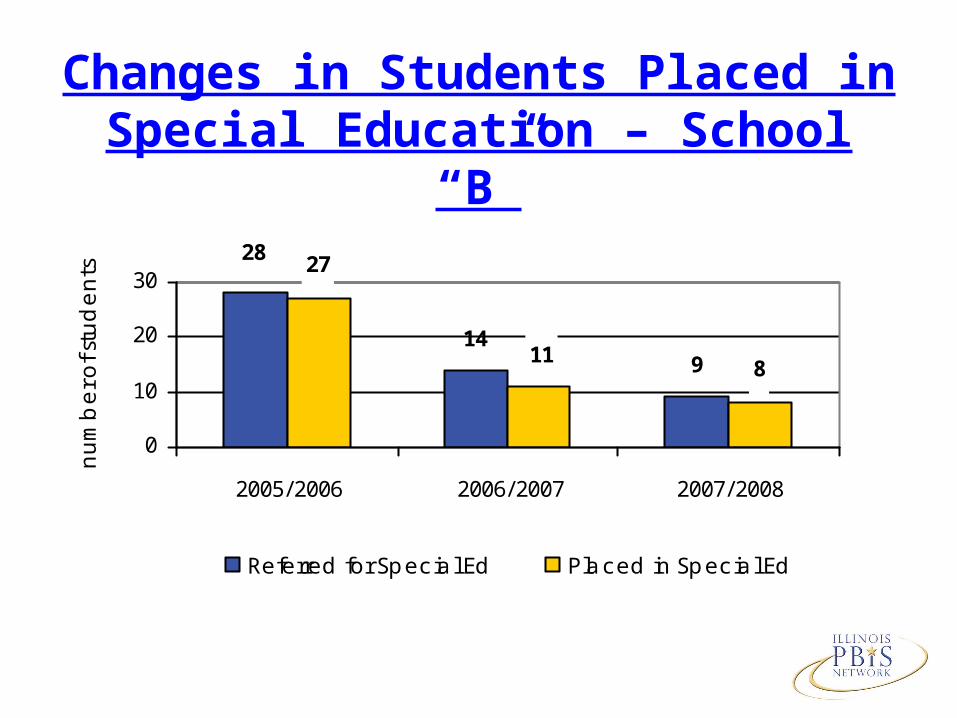
Changes in Students Placed in Special Education – School “B”
914
28
811
27
0
10
20
30
2005/2006 2006/2007 2007/2008
nu
mb
er o
f stu
de
nts
Referred for Special Ed Placed in Special Ed
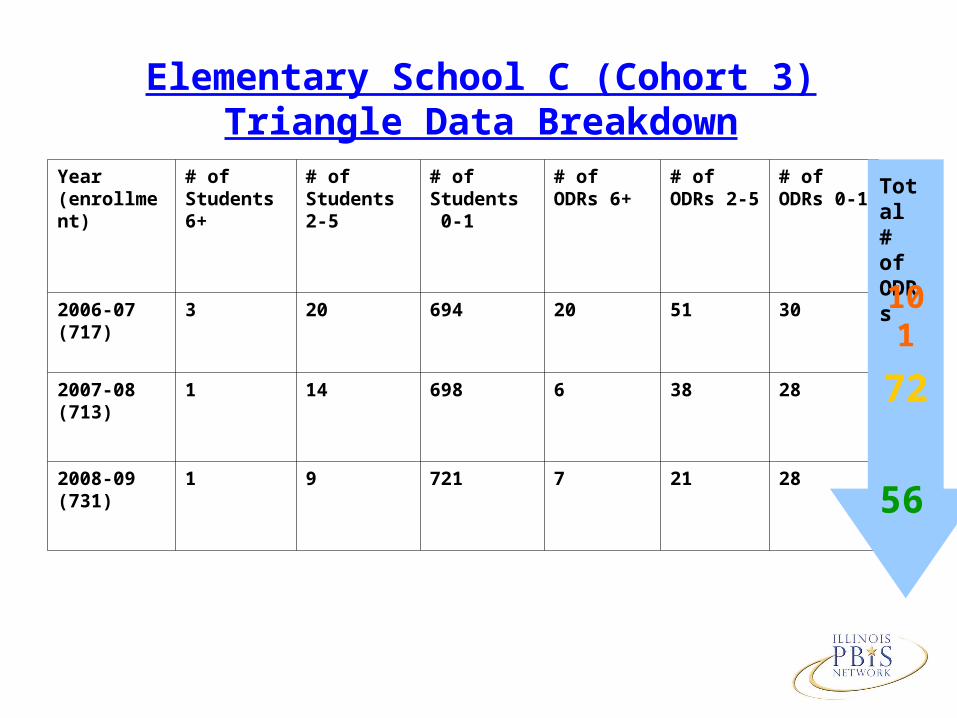
Year (enrollment)
# of Students 6+
# of Students 2-5
# of Students 0-1
# of ODRs 6+
# of ODRs 2-5
# of ODRs 0-1
2006-07 (717)
3 20 694 20 51 30
2007-08 (713)
1 14 698 6 38 28
2008-09 (731)
1 9 721 7 21 28
Elementary School C (Cohort 3)Triangle Data Breakdown
Total # of ODRs
56
72
101
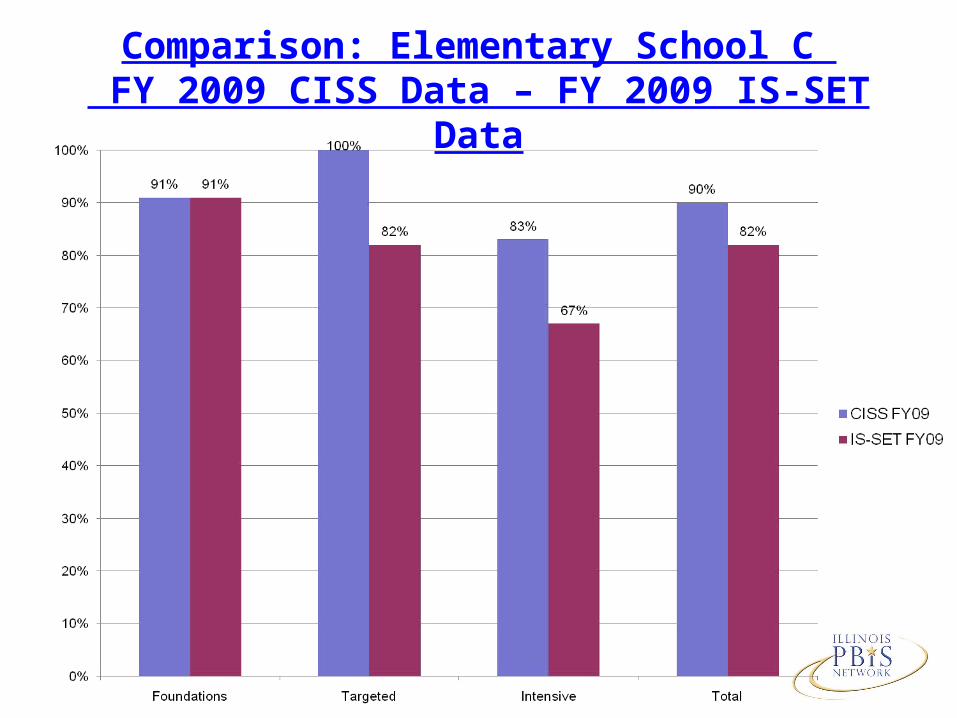
Comparison: Elementary School C FY 2009 CISS Data – FY 2009 IS-SET Data
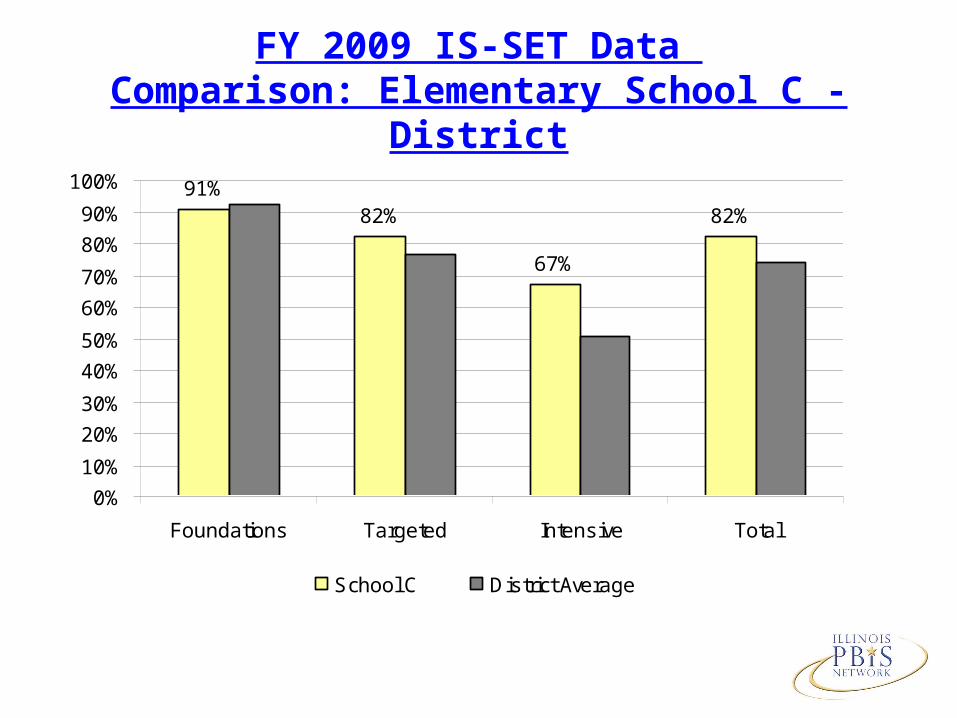
FY 2009 IS-SET Data Comparison: Elementary School C - District
91%82%
67%
82%
0%
10%
20%
30%
40%
50%
60%
70%
80%
90%
100%
Foundations Targeted Intensive Total
School C District Average
Universal Screening
• Looking Beyond ODRs
Why Do We Need to Go
Beyond Use of ODRs?
• Use of “alternative” discipline responses; often w/o documentation.
• Over use of “Special Education” placement w/o adequate dosage of interventions.
Why Do We Need to Go
Beyond Use of ODRs? (continued)
• High rate of unidentified MH problems.
• Youth get identified only after “crisis” which makes it harder and more “costly” to intervene.
The Systematic Screening for Behavior Disorders (SSBD)
(Walker and Severson, 1992)
• Developed as a school-wide (Universal) screening tool for children in grades 1-6
– Similar to annual vision/hearing screenings
Background
• Identifies behaviors that may impede academic and social functioning
• Leads to earlier intervention
• May reduce need for formalized, lengthy “requests for assistance” by using data to identify youth
2007-08 Implementation
• Between early September-first of November, completed screenings in 6 districts and 18 schools (tertiary demos)
• Initial results indicate that approximately 5%-10% of students enrolled in grades 1-6 were identified by the SSBD
Implementation
• A Middle school case example:
– Approximately 320 students enrolled in sixth grade were screened using the SSBD
– 38 six graders or 11% passed gate two
2007-08 Implementation
• School-based secondary teams used SSBD data to implement low-intensity interventions (e.g., check-in/check-out) for most students identified
• Some students received small group instructional approaches or BIPs

Lunch
© Dean Fixsen, Karen Blase, Robert Horner, George Sugai, 2008
Problem
• Students cannot benefit from interventions they do not experience
Secondary/Tertiary Interventions
• Descriptions and Examples…
Critical Features of Secondary/Tier 2 Group Interventions
• Intervention is continuously available• Rapid access to intervention (72 hr.)• Very low effort by teachers• Consistent with school-wide expectations• All staff/faculty in school are involved/have access• Flexible intervention based on descriptive functional
assessment• Adequate resources (admin., team)• Continuous monitoring for decision-making
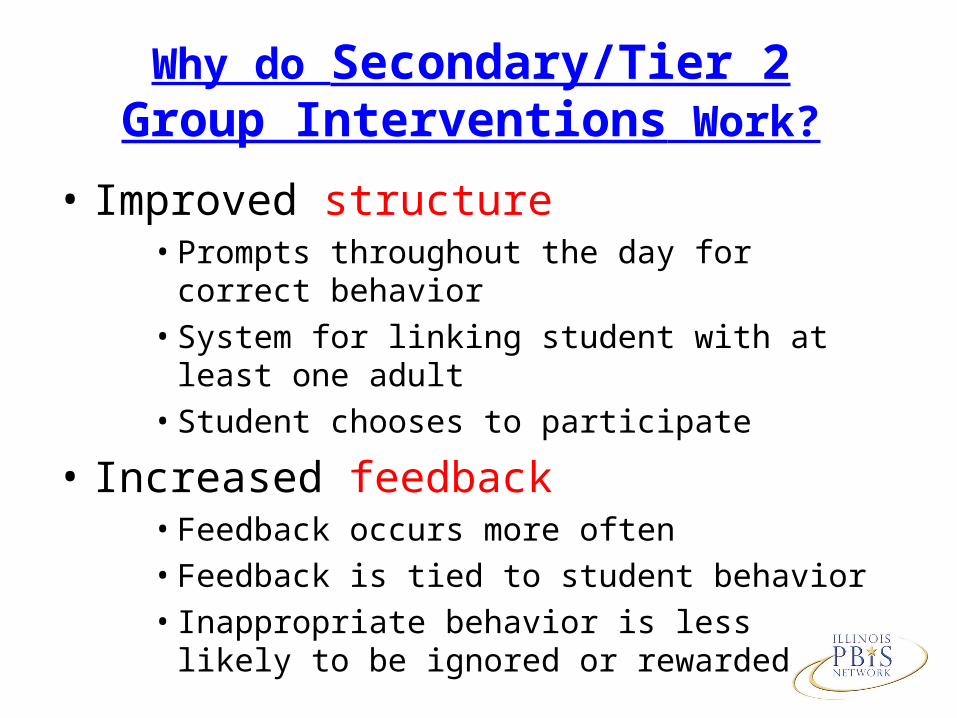
Why do Secondary/Tier 2 Group Interventions Work?
• Improved structure• Prompts throughout the day for correct behavior• System for linking student with at least one adult• Student chooses to participate
• Increased feedback• Feedback occurs more often• Feedback is tied to student behavior• Inappropriate behavior is less likely to be ignored
or rewarded
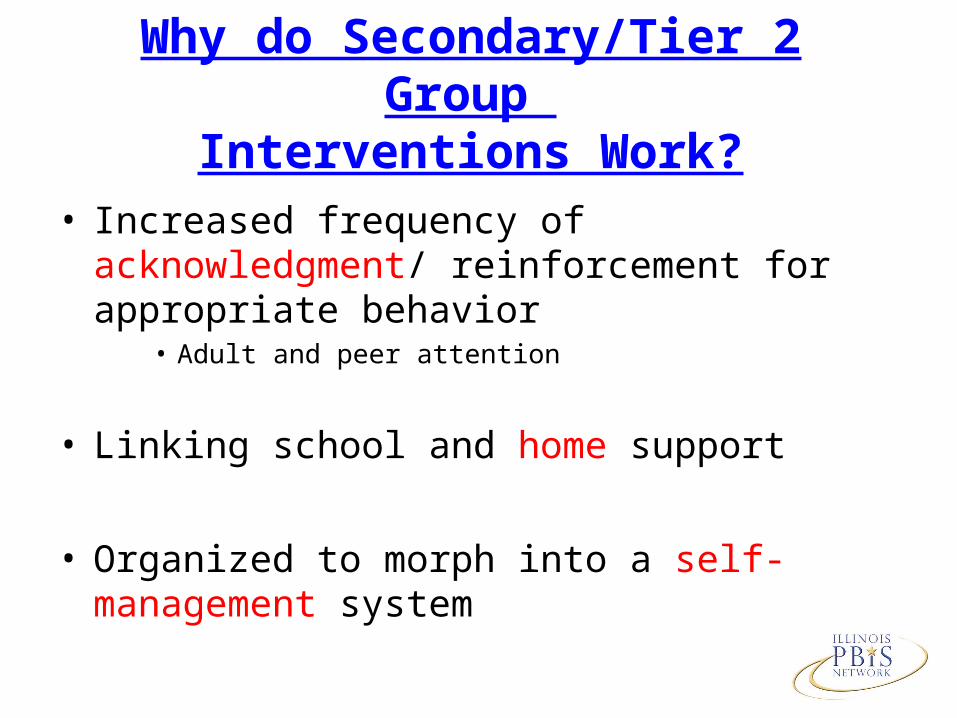
Why do Secondary/Tier 2 Group Interventions Work?
• Increased frequency of acknowledgment/ reinforcement for appropriate behavior
• Adult and peer attention
• Linking school and home support
• Organized to morph into a self-management system
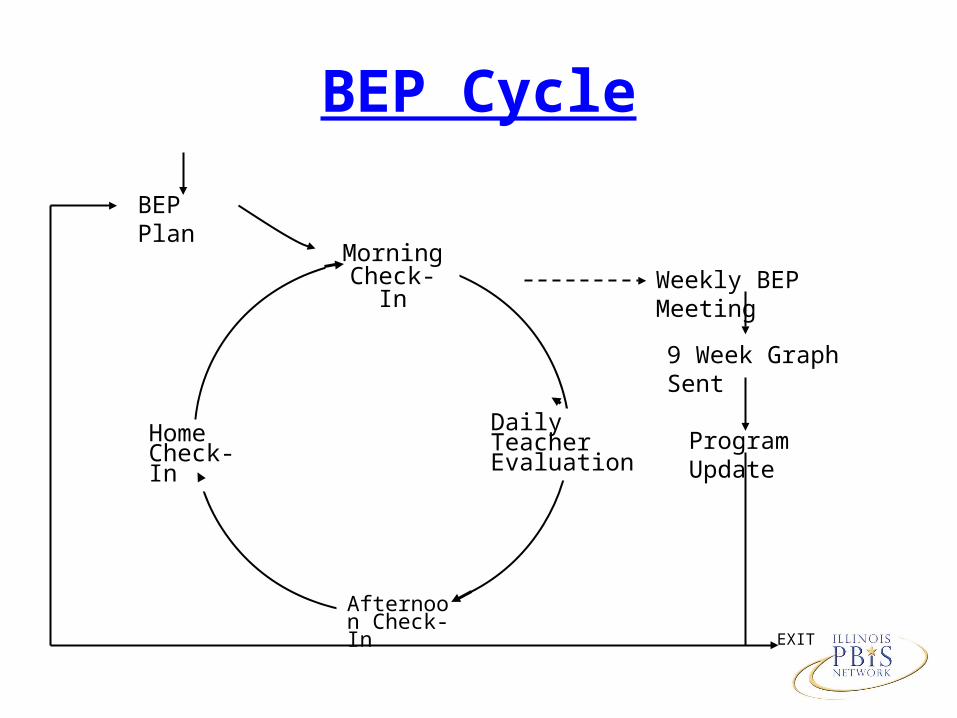
BEP Cycle
Weekly BEP Meeting
9 Week Graph Sent
Program Update
EXIT
BEP Plan
Morning Check-In
Afternoon Check-In
Home Check-In
Daily Teacher Evaluation
Data-Collection for Decision-Making
Regular use of data by BEP team
• Monitor BEP points earned each day
• Academic achievement
• Office Discipline Referrals
• Other outcome data
Parkwood Elementary School (U-46)
• 72% (18/25) students averaged daily points at or above 80%
• 28% (7/25) students averaged below 80%• Out of 20 referrals during the four weeks, 11
were received by CICO students• 60% (17) students have not received a referral
since CICO
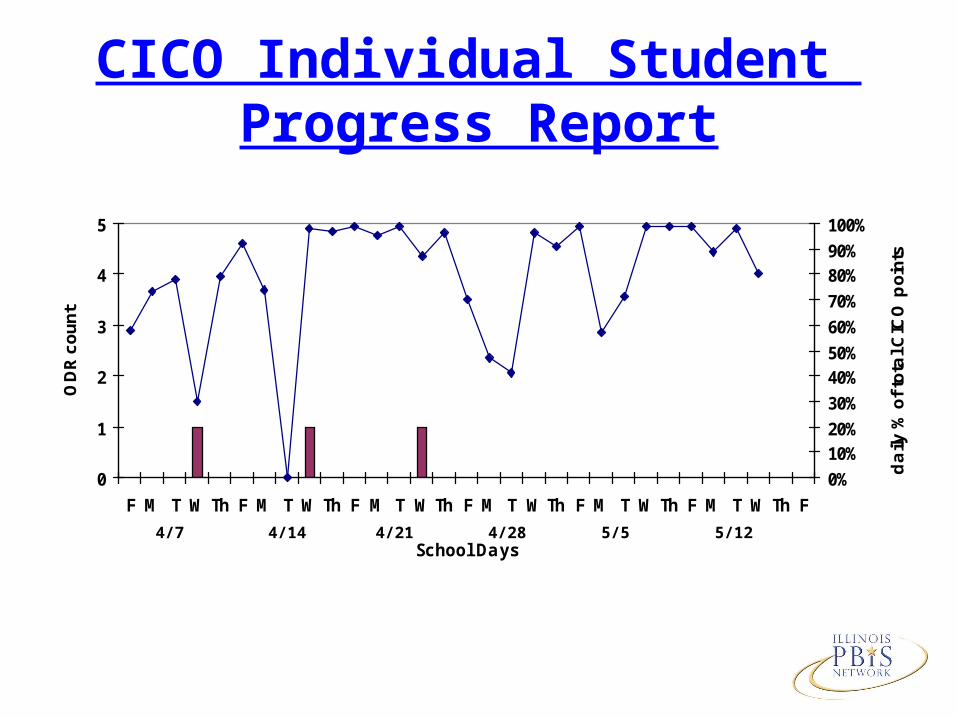
CICO Individual Student Progress Report
0
1
2
3
4
5
F M T W Th F M T W Th F M T WTh F M T WTh F M T W Th F M T W Th F
School Days
ODR c
oun
t
0%
10%20%
30%
40%50%
60%
70%
80%90%
100%
daily
% o
f to
tal C
ICO
poi
nts
4/7 4/14 4/21 4/28 5/5 5/12
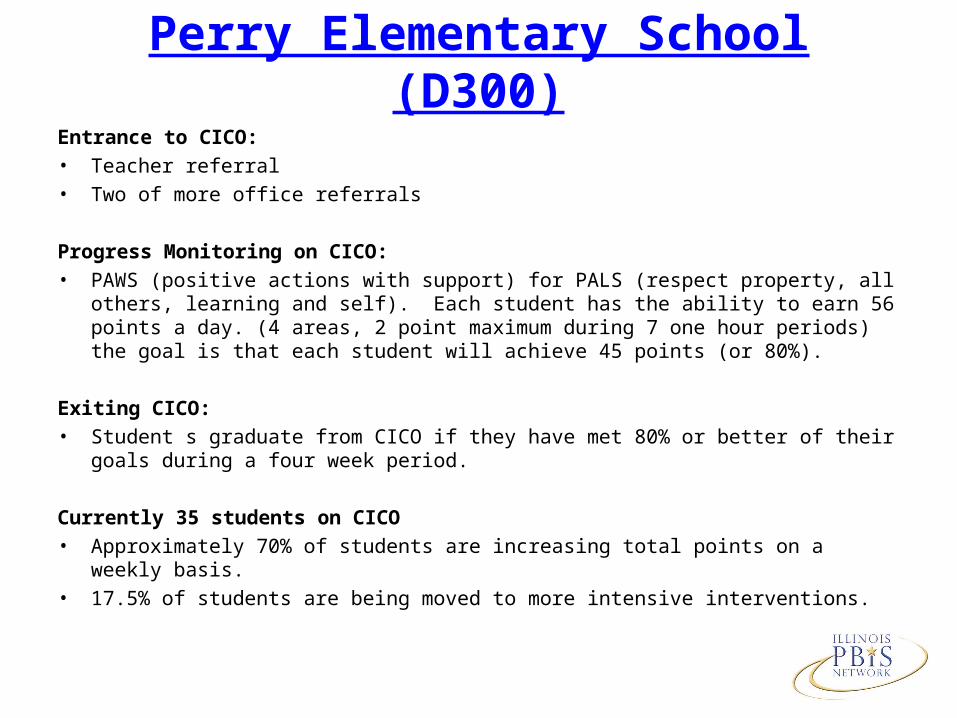
Perry Elementary School (D300)Entrance to CICO:• Teacher referral• Two of more office referrals
Progress Monitoring on CICO:• PAWS (positive actions with support) for PALS (respect property, all others, learning
and self). Each student has the ability to earn 56 points a day. (4 areas, 2 point maximum during 7 one hour periods) the goal is that each student will achieve 45 points (or 80%).
Exiting CICO:• Student s graduate from CICO if they have met 80% or better of their goals during a
four week period.
Currently 35 students on CICO• Approximately 70% of students are increasing total points on a weekly basis.• 17.5% of students are being moved to more intensive interventions.
Social Skills/Academic Instructional Groups
Three types of skills-building groups:1) Pro-social skills
2) Problem-solving skills
3) Academic Behavior Skills
• Use Daily Progress Report
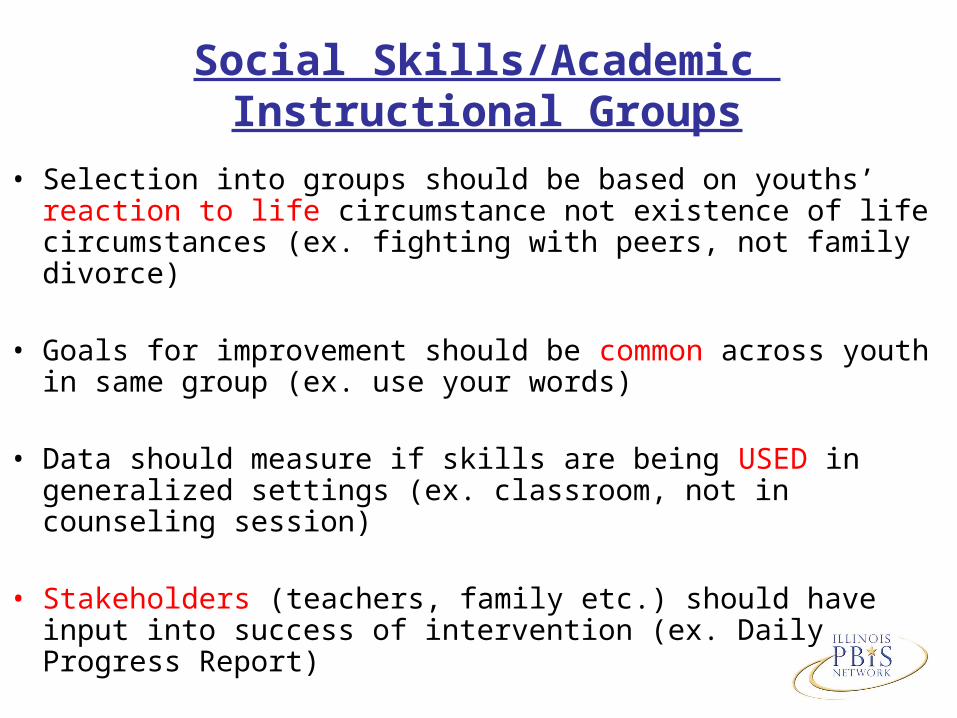
Social Skills/Academic Instructional Groups
• Selection into groups should be based on youths’ reaction to life circumstance not existence of life circumstances (ex. fighting with peers, not family divorce)
• Goals for improvement should be common across youth in same group (ex. use your words)
• Data should measure if skills are being USED in generalized settings (ex. classroom, not in counseling session)
• Stakeholders (teachers, family etc.) should have input into success of intervention (ex. Daily Progress Report)
Critical Features
• Includes structured prompts for ‘what to do’ in relevant situations (transference and generalization)
• Results in student receiving positive feedback from staff
• Includes a school-home communication exchange system at least weekly
Critical Features• Linked directly to school-wide expectations
and/or academic goals
• Continuously available for student participation
• Can be implemented within 3 school days of determination that the student should receive the intervention
Other Types of Group Interventions
• Newcomers Club
• Homework Study Groups
• Lunch Bunch
• Bus Riders School
• Anger Management Group
• Grief Group
• Others from today’s audience
Activity: Assessing intervention History

Tier 1/Universal School-Wide Assessment
School-Wide Prevention Systems
SIMEO Tools: HSC-T, RD-T, EI-T
Check-in/ Check-out
Individualized Check-In/Check-Out, Groups & Mentoring (ex. CnC)
Brief Functional Behavioral Assessment/Behavior Intervention Planning (FBA/BIP)
Complex FBA/BIP
Wraparound
ODRs, Attendance, Tardies, Grades, DIBELS, etc.
Daily Progress Report (DPR) (Behavior and Academic Goals)
Competing Behavior Pathway, Functional Assessment Interview, Scatter Plots, etc.
Social/Academic Instructional Groups
Positive Behavior Interventions & Supports:A Response to Intervention (RtI) Model
Illinois PBIS Network, Revised Aug.,2009Adapted from T. Scott, 2004
Tier 2/Secondary
Tier 3/Tertiary
Inte
rven
tio
nAssessm
en
t
A Context for PBIS
• Behavior support is the redesign of environments, not the redesign of individuals.
• Positive behavior support plans define changes in the behavior of those who will implement the plan. A behavior support plan describes what we will do differently.
Functional Assessment of Behavior“BIG IDEAS”
• Functional assessment is a problem solving process – a way to think about behavior systematically.
“FA can be done in your head.”
• Functional assessment identifies the events that reliably predict and maintain problem behavior.
Identifying who needs an FBA/BIP
• Academic/behavior data indicates challenge• High intensity or frequency of behavior• Behavior impedes academic performance• Don’t understand behavior• Behavior seems to meet need or be reinforcing
for student• Interventions have not been successful• Use data
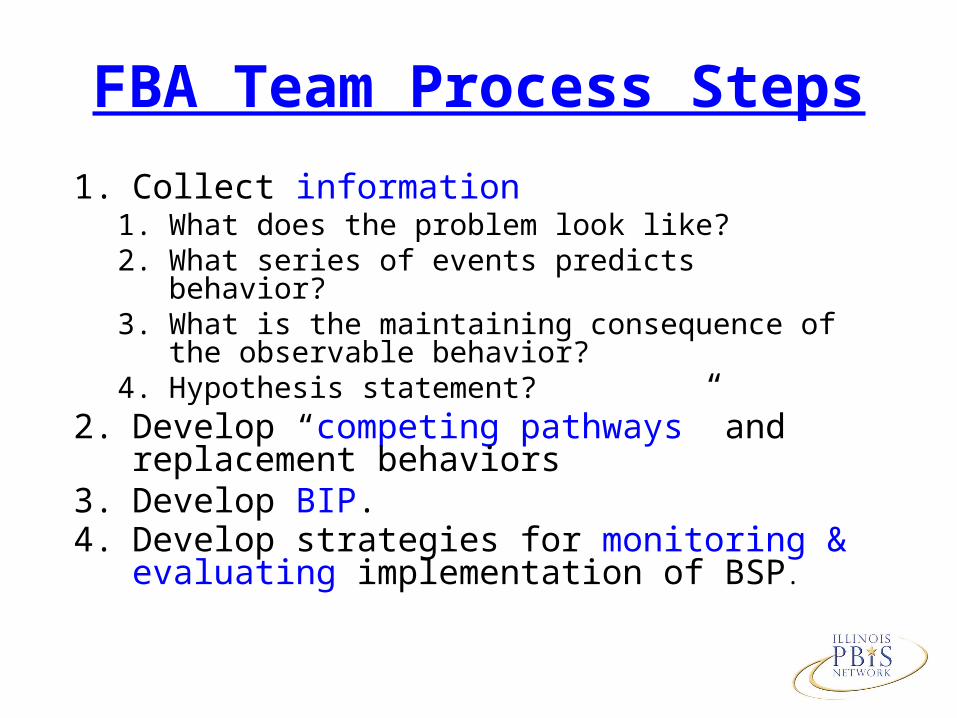
FBA Team Process Steps
1. Collect information1. What does the problem look like?2. What series of events predicts behavior?3. What is the maintaining consequence of the
observable behavior?4. Hypothesis statement?
2. Develop “competing pathways” and replacement behaviors
3. Develop BIP.4. Develop strategies for monitoring &
evaluating implementation of BSP.
The person who is supposed to implement the strategy needs to be actively involved in designing it; or it probably won’t work!
Ownership & Voice: A Key to Intervention Design
Interventions…
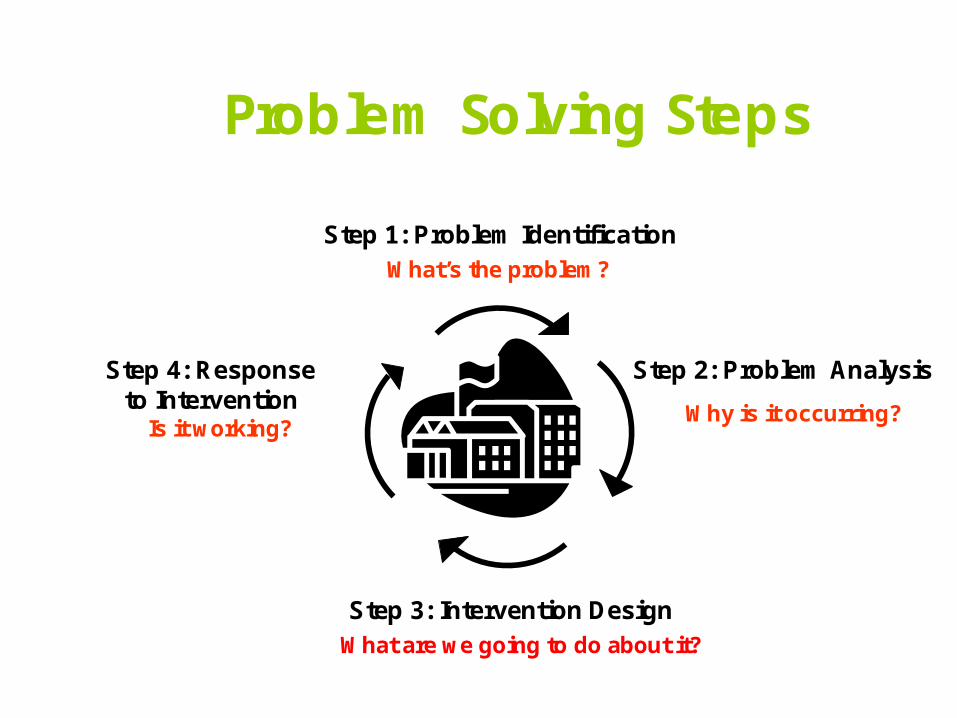
Problem Solving Steps
Step 1: Problem Identification
Step 2: Problem Analysis
Step 3: Intervention Design
Step 4: Response to Intervention
Why is it occurring?
What’s the problem?
What are we going to do about it?
Is it working?
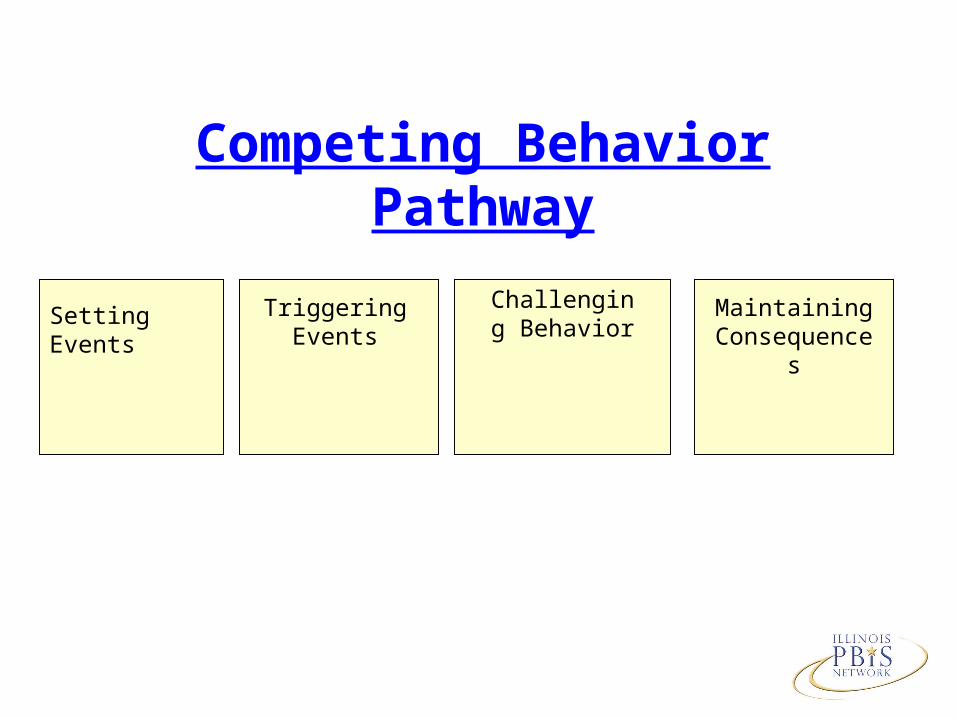
Setting Events Triggering Events
Challenging Behavior
Maintaining Consequences
Competing Behavior Pathway
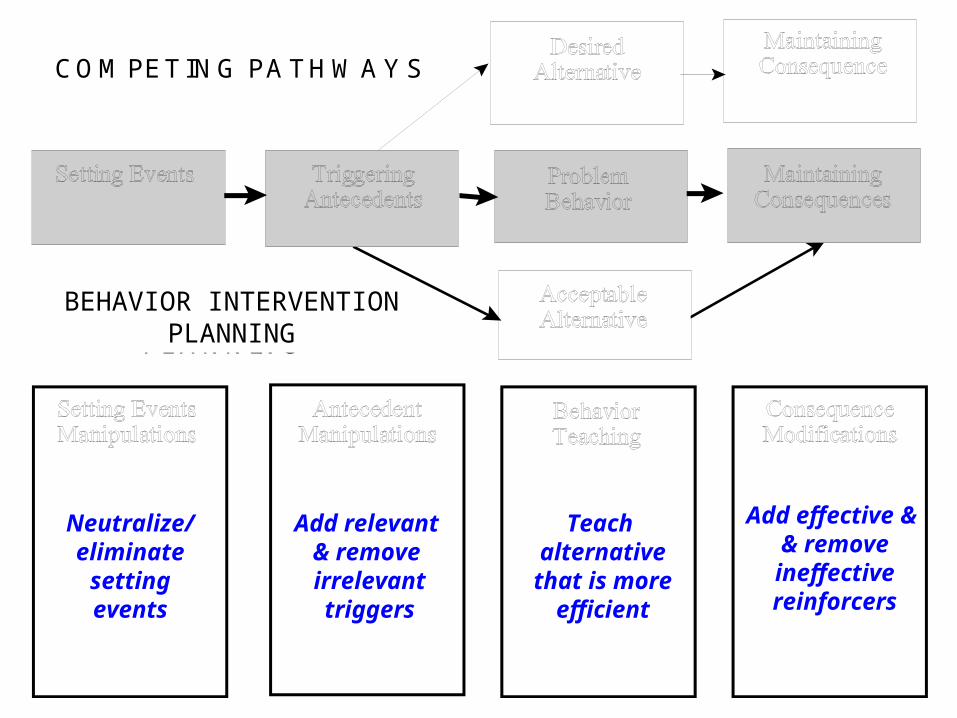
BEHAVIOR SUPPORTPLANNING
COMPETING PATHWAYS
Neutralize/eliminate
settingevents
Add relevant & remove irrelevanttriggers
Teach alternative
that is moreefficient
Add effective & & removeineffectivereinforcers
BEHAVIOR INTERVENTION PLANNING
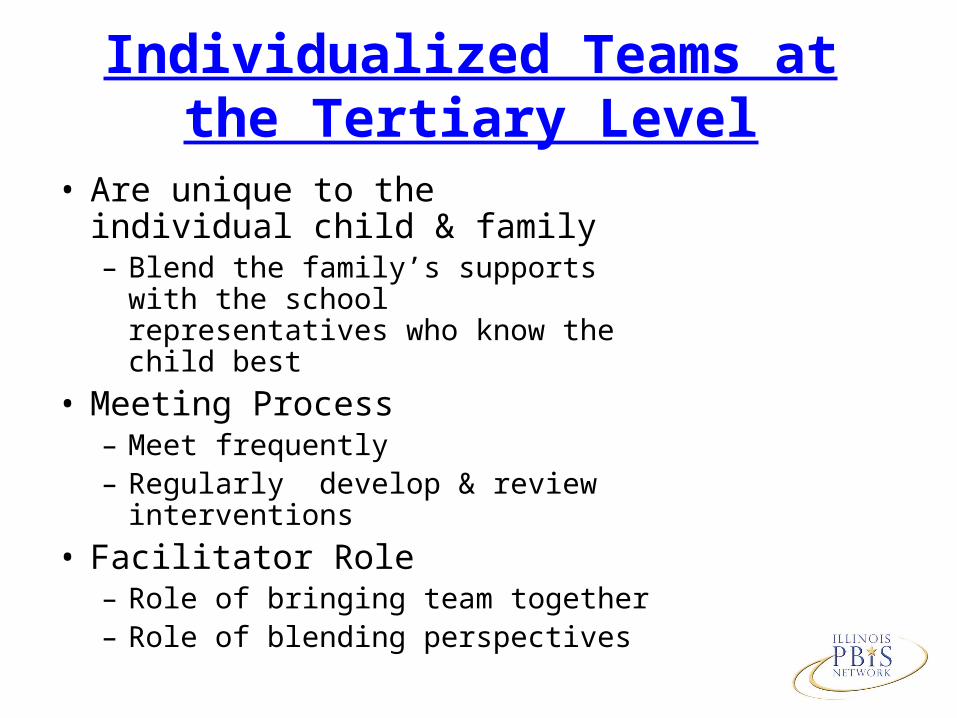
Individualized Teams at the Tertiary Level
• Are unique to the individual child & family– Blend the family’s supports with the
school representatives who know the child best
• Meeting Process– Meet frequently – Regularly develop & review
interventions
• Facilitator Role– Role of bringing team together– Role of blending perspectives
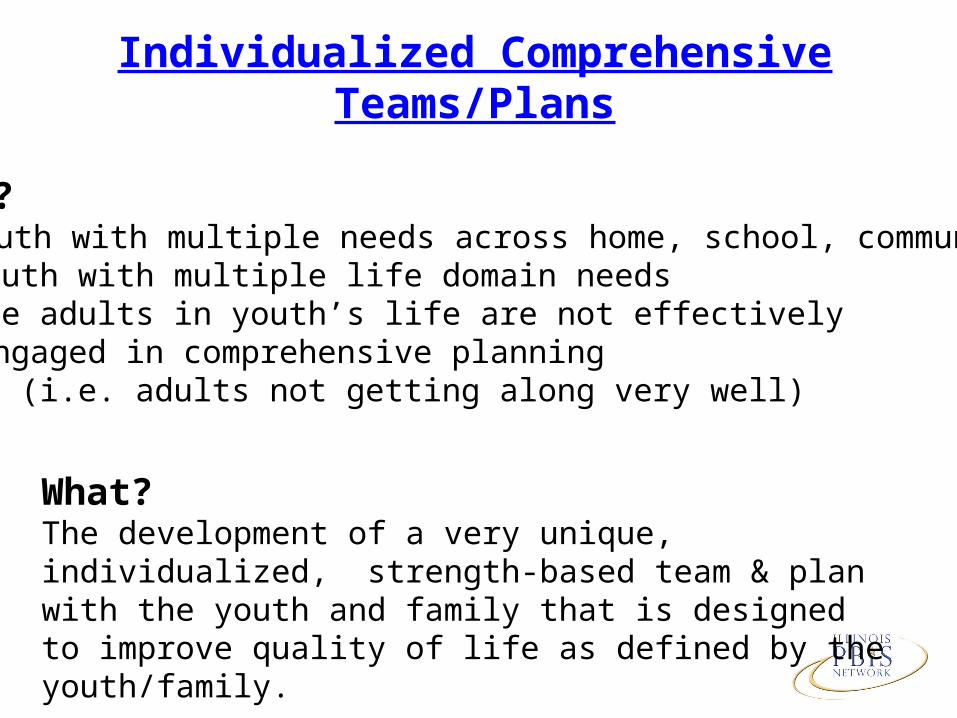
Individualized Comprehensive Teams/Plans
What?The development of a very unique, individualized, strength-based team & plan with the youth and family that is designed to improve quality of life as defined by the youth/family.
Who?• Youth with multiple needs across home, school, community• Youth with multiple life domain needs • The adults in youth’s life are not effectively
engaged in comprehensive planning (i.e. adults not getting along very well)
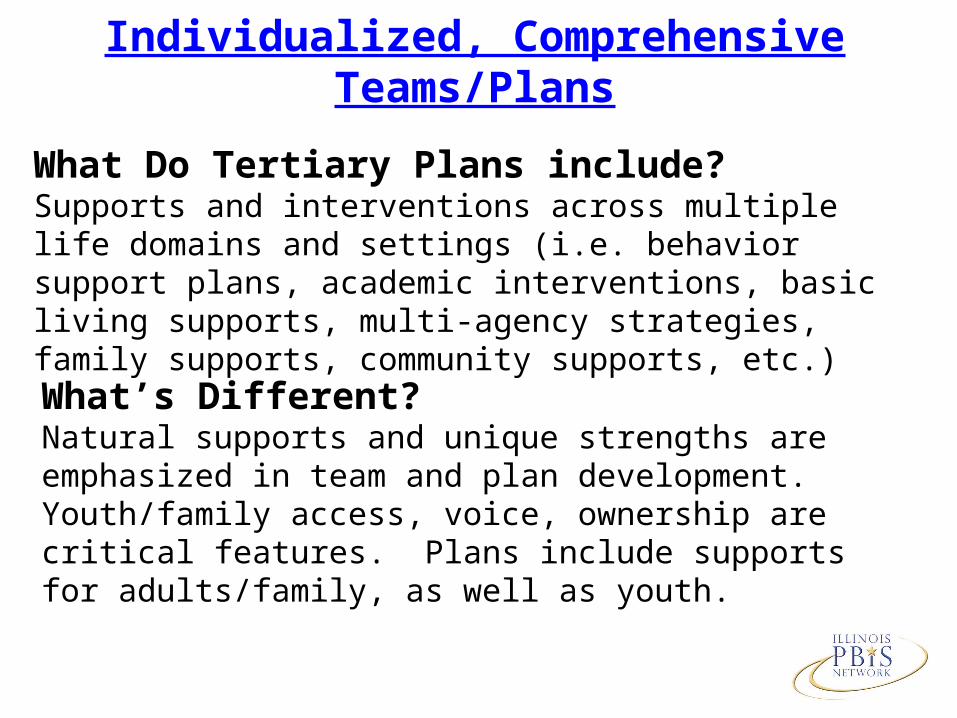
Individualized, Comprehensive Teams/Plans
What Do Tertiary Plans include?Supports and interventions across multiple life domains and settings (i.e. behavior support plans, academic interventions, basic living supports, multi-agency strategies, family supports, community supports, etc.)
What’s Different?Natural supports and unique strengths are emphasized in team and plan development. Youth/family access, voice, ownership are critical features. Plans include supports for adults/family, as well as youth.
What is Wraparound?
• Wraparound is a tool (e.g. a process) used to implement interagency systems of care in achieving better outcomes for youth and their families.
• The wraparound process is similar to person-centered planning, the individualized Positive Behavior Support (PBS) planning process.
What is Wraparound?
• Wraparound is a process for developing
family-centered teams and plans that are
strength and needs based
– (not deficit based)
– across multiple settings and life domains.
• Wraparound plans include natural supports,
are culturally relevant, practical and realistic.
Implementing Wraparound:Key Elements Needed for Success
Engaging students, families & teachers Team development & team ownership Ensuring student/family/teacher voice
Getting to real (big) needs
Effective interventions Serious use of strengths Natural supports Focus on needs vs. services
Monitoring progress & sustaining System support buy-in
What’s New in Wraparound?
• Skill set specificity
• Focus on intervention design/effectiveness
• Integration with school-wide PBS
• Phases to guide implementation/supervision
• Data-based decision-making
• Integrity/fidelity assessment (WIT)
• Tools to guide teams:
– Home School Community
– Education Information Tool
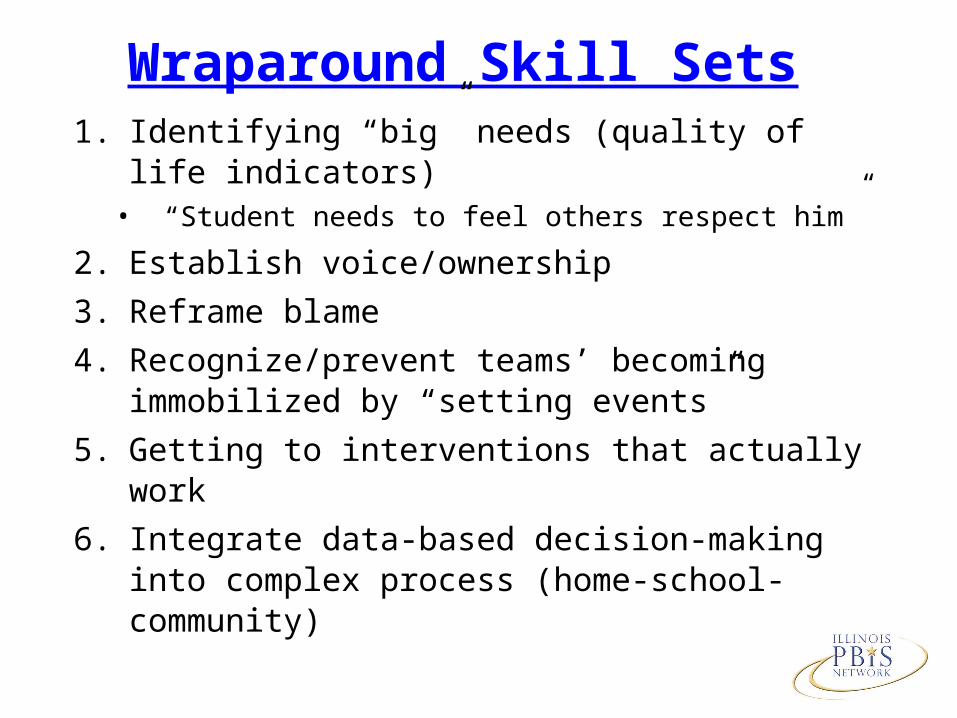
Wraparound Skill Sets1. Identifying “big” needs (quality of life
indicators)• “Student needs to feel others respect him”
2. Establish voice/ownership
3. Reframe blame
4. Recognize/prevent teams’ becoming immobilized by “setting events”
5. Getting to interventions that actually work
6. Integrate data-based decision-making into complex process (home-school-community)
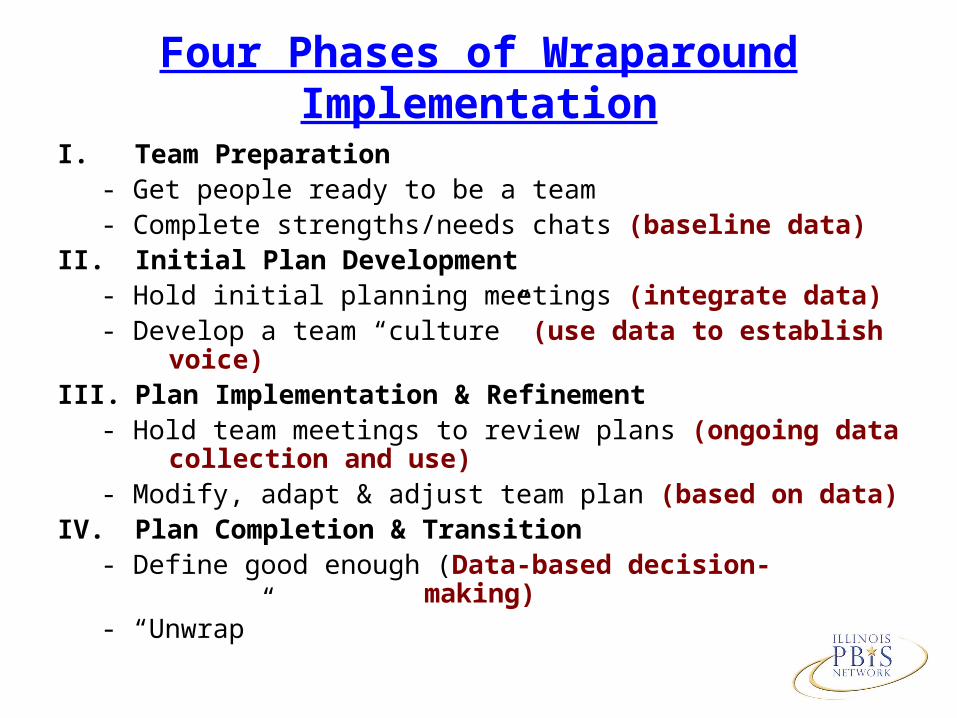
Four Phases of Wraparound Implementation
I. Team Preparation- Get people ready to be a team- Complete strengths/needs chats (baseline data)
II. Initial Plan Development- Hold initial planning meetings (integrate data)- Develop a team “culture” (use data to establish voice)
III. Plan Implementation & Refinement- Hold team meetings to review plans (ongoing data collection
and use)- Modify, adapt & adjust team plan (based on data)
IV. Plan Completion & Transition- Define good enough (Data-based decision-
making)- “Unwrap”
“Bruce”
• 5th grade
• Difficulty socially interacting with peers at school and in the community
• Entered the 2007/08 school year with a Behavior Intervention Plan from the previous school year
• DCFS involvement
Trauma
• DCFS involvement
• Removal from home, school, or community
• Adults in conflict (domestic violence, parent in jail/prison, drug/alcohol abuse)
• Medical concerns in family
• Poverty
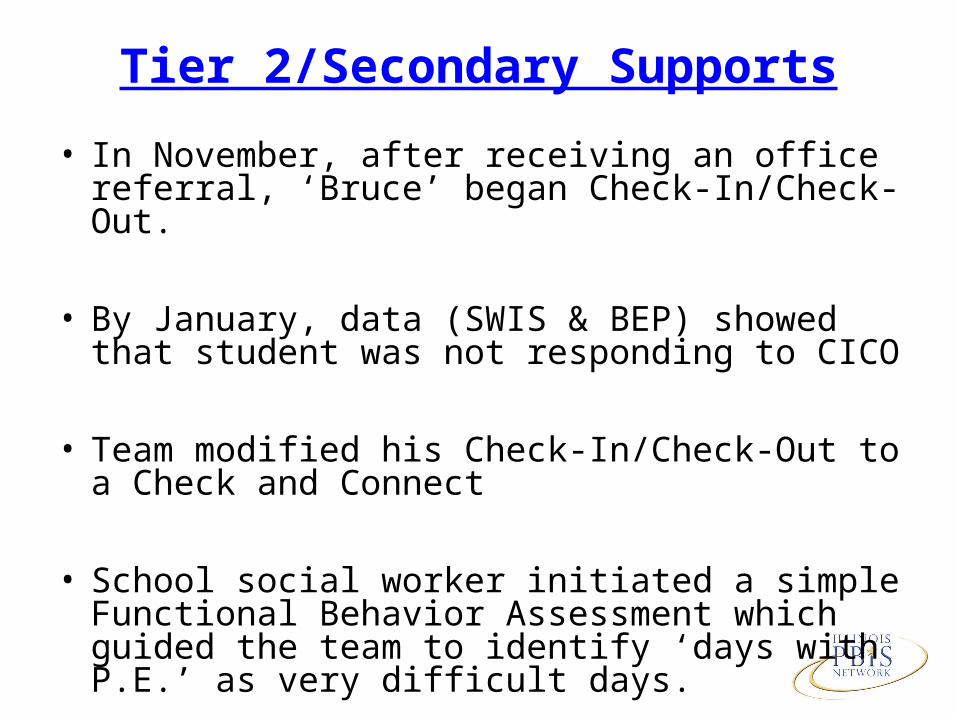
Tier 2/Secondary Supports
• In November, after receiving an office referral, ‘Bruce’ began Check-In/Check-Out.
• By January, data (SWIS & BEP) showed that student was not responding to CICO
• Team modified his Check-In/Check-Out to a Check and Connect
• School social worker initiated a simple Functional Behavior Assessment which guided the team to identify ‘days with P.E.’ as very difficult days.
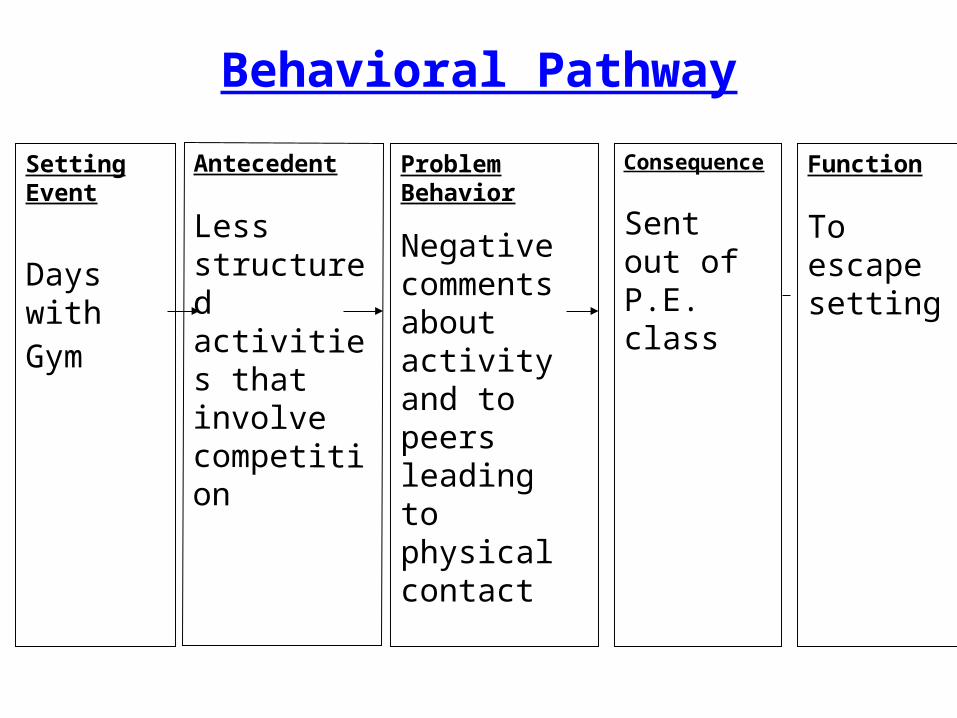
Behavioral Pathway
Setting Event
Days with Gym
Antecedent
Less structured activities that involve competition
Problem Behavior
Negative comments about activity and to peers leading to physical contact
Consequence
Sent out of P.E. class
Function
To escape setting
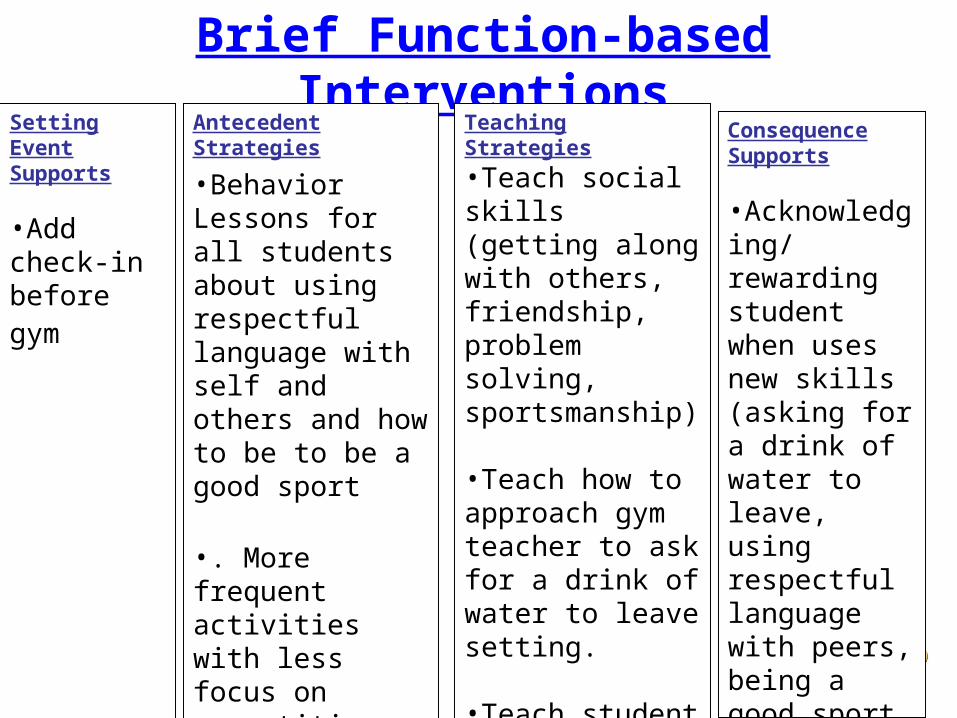
Brief Function-based Interventions
•
Setting Event Supports
•Add check-in before gym
Teaching Strategies
•Teach social skills (getting along with others, friendship, problem solving, sportsmanship)
•Teach how to approach gym teacher to ask for a drink of water to leave setting.
•Teach student how to re-enter and continue with activity
Consequence Supports
•Acknowledging/rewarding student when uses new skills (asking for a drink of water to leave, using respectful language with peers, being a good sport, etc..)
Antecedent Strategies
•Behavior Lessons for all students about using respectful language with self and others and how to be to be a good sport
•. More frequent activities with less focus on competition (parachute, 4-square, etc...)
•Pre-correct
Better Access to Universal Systems
• Secondary supports provided student with opportunities to use new skills and be acknowledged/rewarded at high frequency
• Student was able to ‘earn’ his way into the monthly incentive program in April and May.
Tier 3/Tertiary Support
• Wraparound process lead to identified community interests and LAN funding to support these
• Student attended summer camp and is involved in football
Data-based Progress
• By May, ‘Bruce’s’ reading skills improved by 19% (only gain since October)
• Bruce had no additional office referrals after January.
• Decreased risk of failure in home, school, and community placements
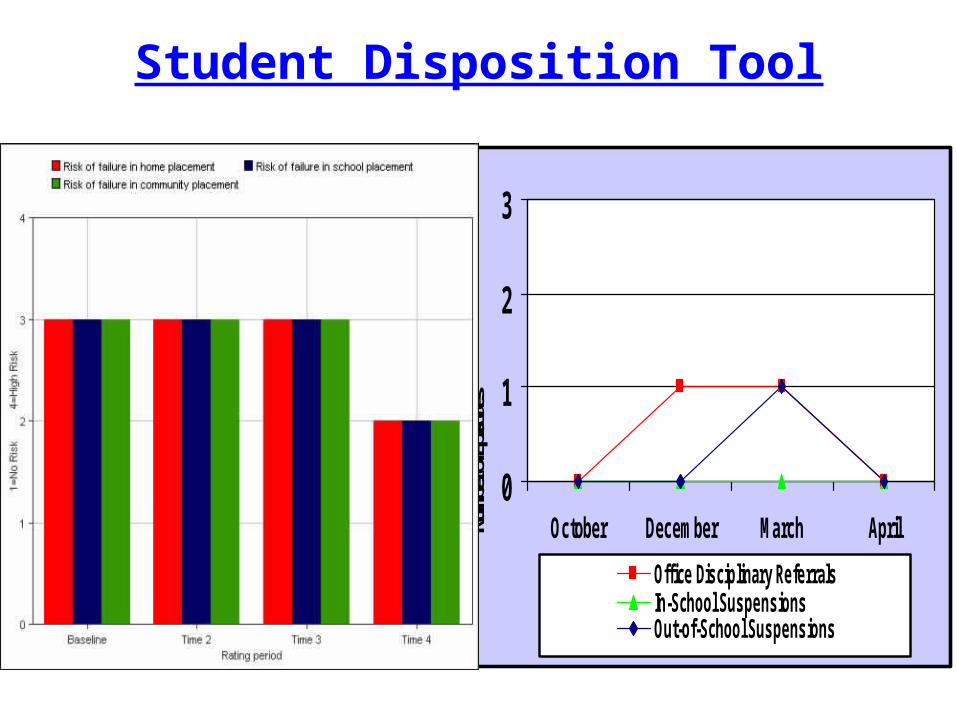
Student Disposition Tool
0
1
2
3
October December March AprilNumb
er of
Episo
des
Office Disciplinary ReferralsIn-School SuspensionsOut-of-School Suspensions
• 6th grade student
• Behavior difficulties and academic failure
• GPA 1.25 (2nd quarter)
• 6 ODRs (1st two quarters)
• 15 Out-of-School Suspensions (safety)
• Family support needs –history of mobility with plan to move at the end current school year. Student moved nine times since first grade
Andy
Why move to Phase I wraparound instead of an FBA around one problem behavior?
– Discussing problem behaviors would not have motivated family to participate on team.
– Probably not the first time schools have approached family in this manner (“let’s talk about behavior”)
– Bigger needs to work on to improve quality of life for youth and family
– Open-ended conversation and use of wrap data tools helped engage family
The team developed a mission statement:
“Andy will be happy and confident in school”
Andy
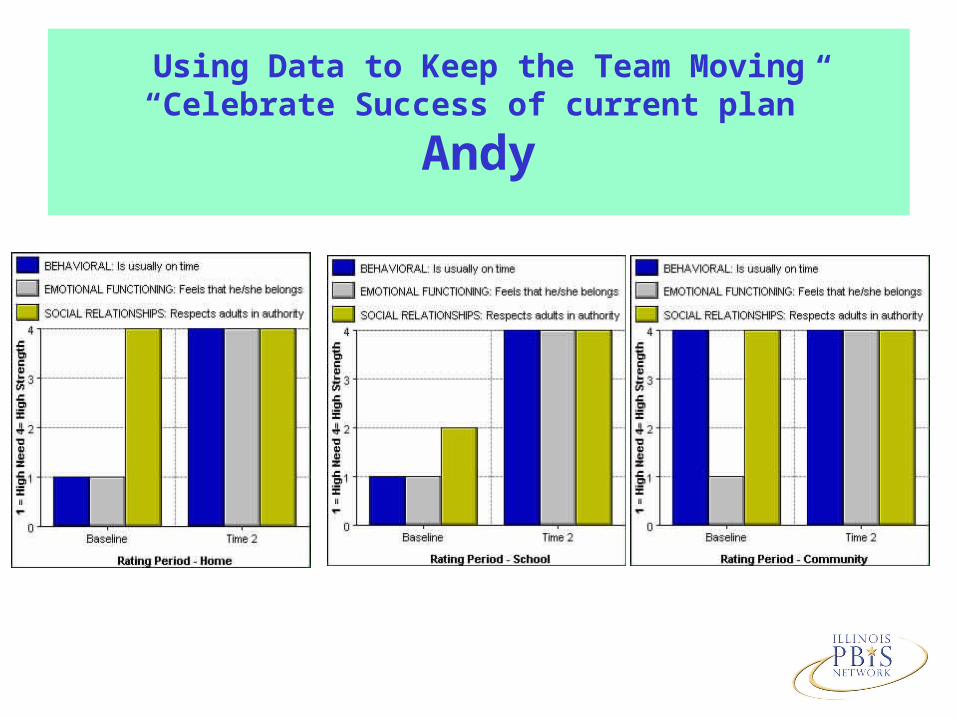
Using Data to Keep the Team Moving“Celebrate Success of current plan”
Andy
• Andy was happy at school and his mother was pleased with the help that the wrap team provided. Teachers were pleased with the change in Andy.
• Data is used to then identify “next steps”.
Andy
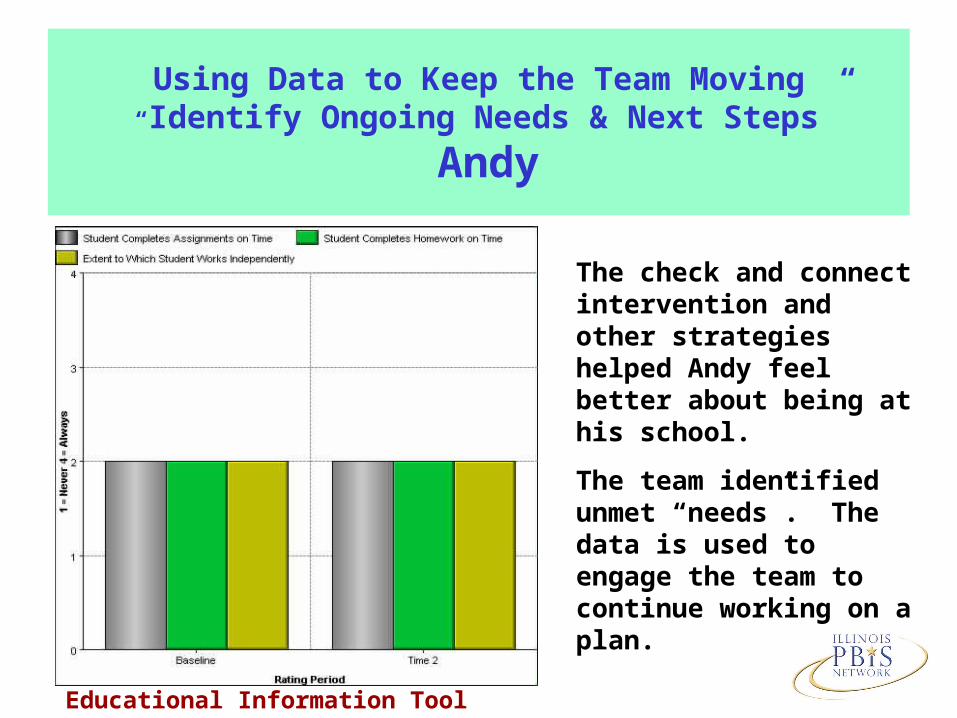
Using Data to Keep the Team Moving “Identify Ongoing Needs & Next Steps”
Andy
The check and connect intervention and other strategies helped Andy feel better about being at his school.
The team identified unmet “needs”. The data is used to engage the team to continue working on a plan.
Educational Information Tool
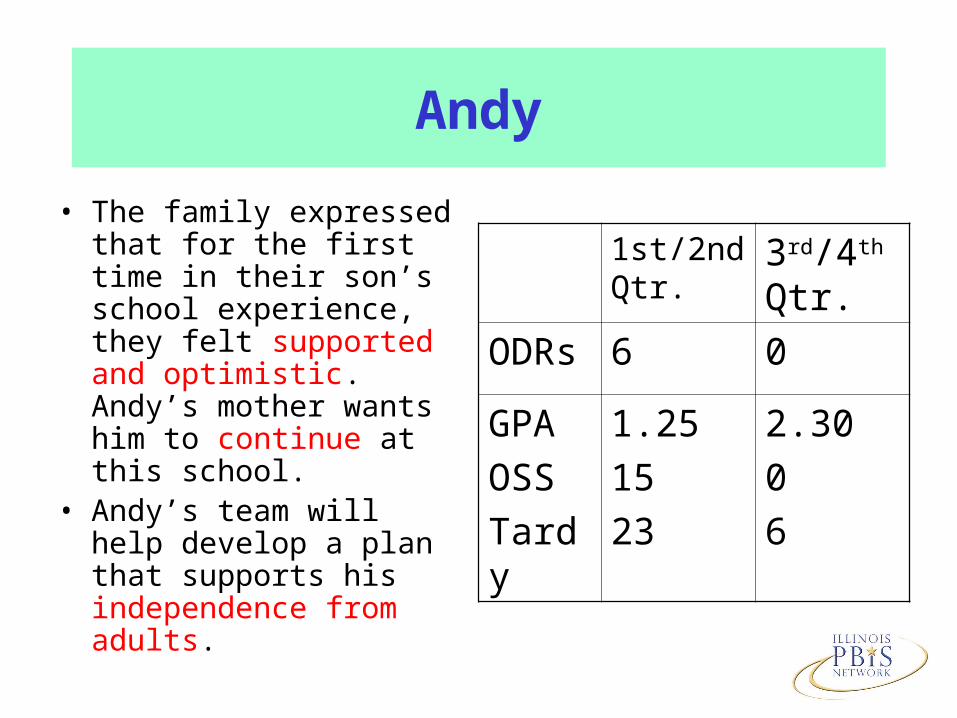
Andy
• The family expressed that for the first time in their son’s school experience, they felt supported and optimistic. Andy’s mother wants him to continue at this school.
• Andy’s team will help develop a plan that supports his independence from adults.
1st/2nd Qtr.
3rd/4th Qtr.
ODRs 6 0
GPA
OSS
Tardy
1.25
15
23
2.30
0
6
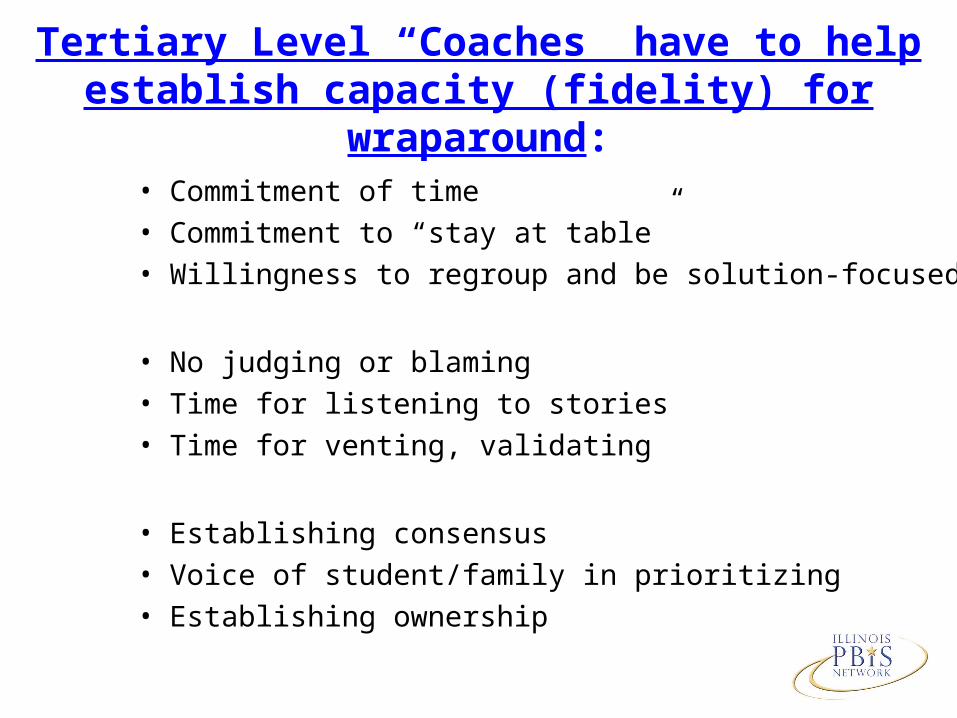
Tertiary Level “Coaches” have to help establish capacity (fidelity) for wraparound:
• Commitment of time
• Commitment to “stay at table”
• Willingness to regroup and be solution-focused
• No judging or blaming
• Time for listening to stories
• Time for venting, validating
• Establishing consensus
• Voice of student/family in prioritizing
• Establishing ownership
Moving Forward with Tier 2 and Tier 3
“Advanced Organizer:” Current Status of District
Implementation
“Where is your district at
in implementation of the full continuum of tier 2/ tier 3 supports?”
What direction and structure do districts provide to schools/principals to ensure that schools take an ‘appropriate’ (evidence-based, effective, efficient)
path to achieve district outcomes?
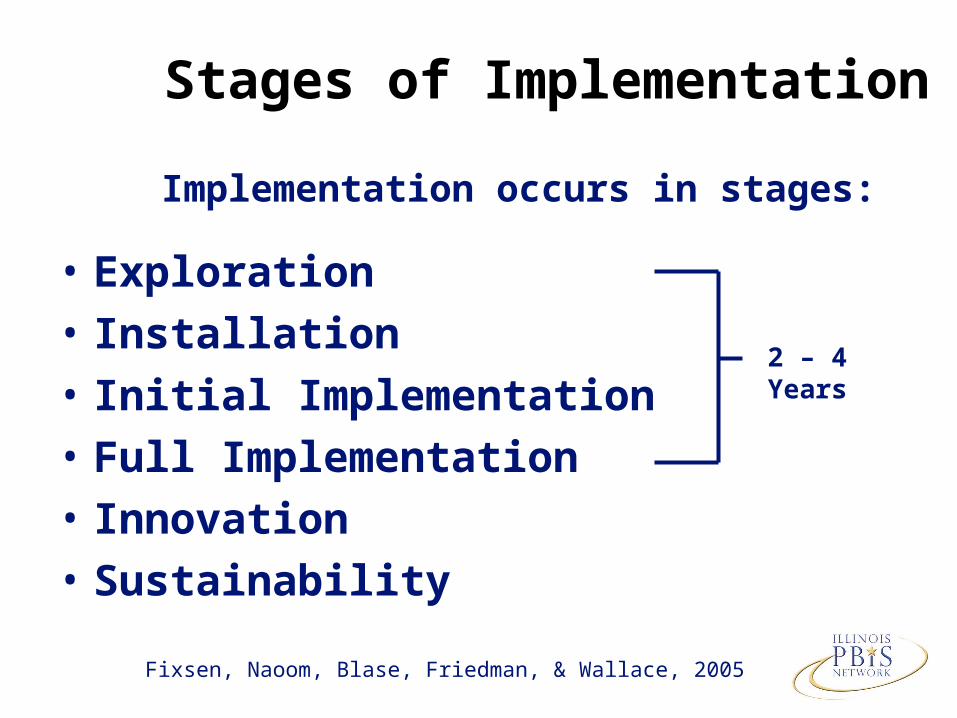
Stages of Implementation
• Exploration
• Installation
• Initial Implementation
• Full Implementation
• Innovation
• Sustainability
Implementation occurs in stages:
Fixsen, Naoom, Blase, Friedman, & Wallace, 2005
2 – 4 Years
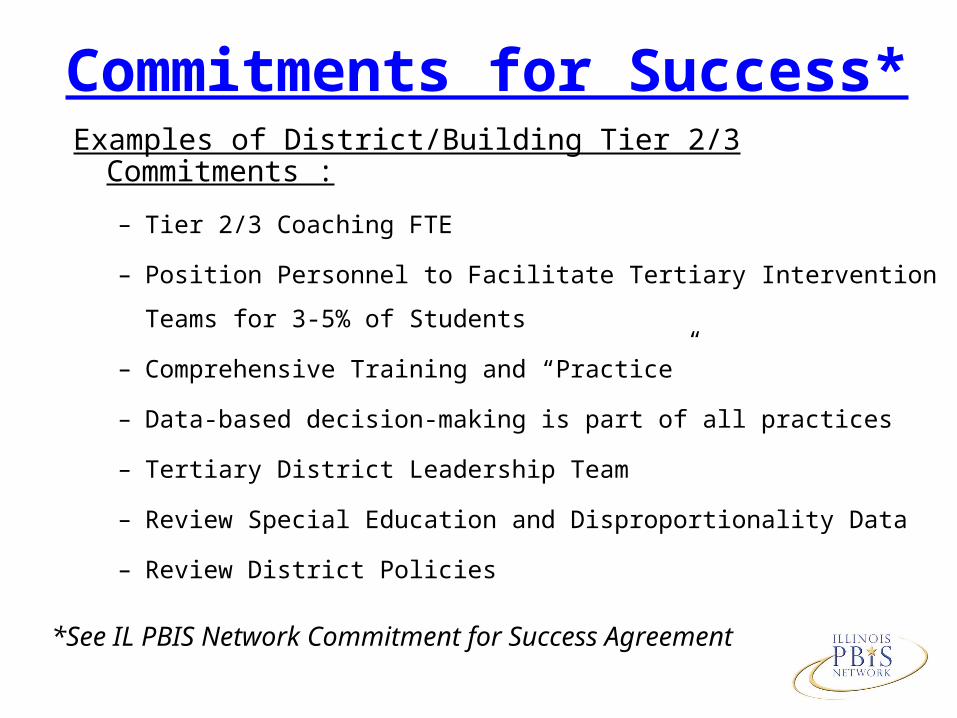
Commitments for Success*Examples of District/Building Tier 2/3 Commitments :
– Tier 2/3 Coaching FTE
– Position Personnel to Facilitate Tertiary Intervention Teams for 3-
5% of Students
– Comprehensive Training and “Practice”
– Data-based decision-making is part of all practices
– Tertiary District Leadership Team
– Review Special Education and Disproportionality Data
– Review District Policies
*See IL PBIS Network Commitment for Success Agreement
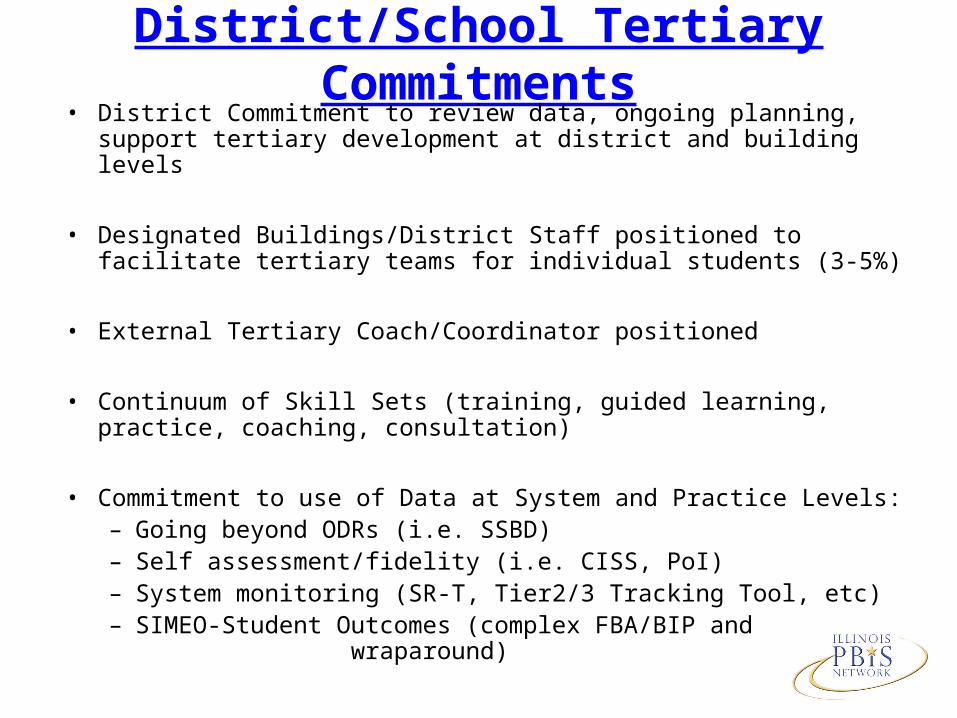
District/School Tertiary Commitments• District Commitment to review data, ongoing planning, support
tertiary development at district and building levels
• Designated Buildings/District Staff positioned to facilitate tertiary teams for individual students (3-5%)
• External Tertiary Coach/Coordinator positioned
• Continuum of Skill Sets (training, guided learning, practice, coaching, consultation)
• Commitment to use of Data at System and Practice Levels:– Going beyond ODRs (i.e. SSBD)– Self assessment/fidelity (i.e. CISS, PoI)– System monitoring (SR-T, Tier2/3 Tracking Tool, etc)– SIMEO-Student Outcomes (complex FBA/BIP and
wraparound)
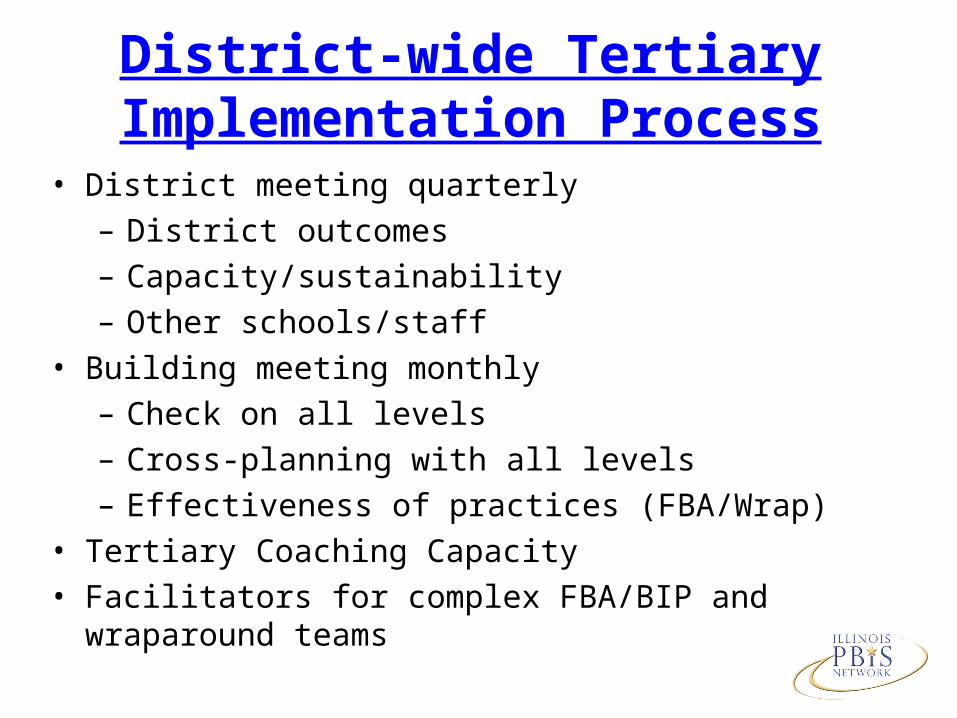
District-wide Tertiary Implementation Process
• District meeting quarterly– District outcomes– Capacity/sustainability– Other schools/staff
• Building meeting monthly– Check on all levels– Cross-planning with all levels– Effectiveness of practices (FBA/Wrap)
• Tertiary Coaching Capacity• Facilitators for complex FBA/BIP and wraparound teams
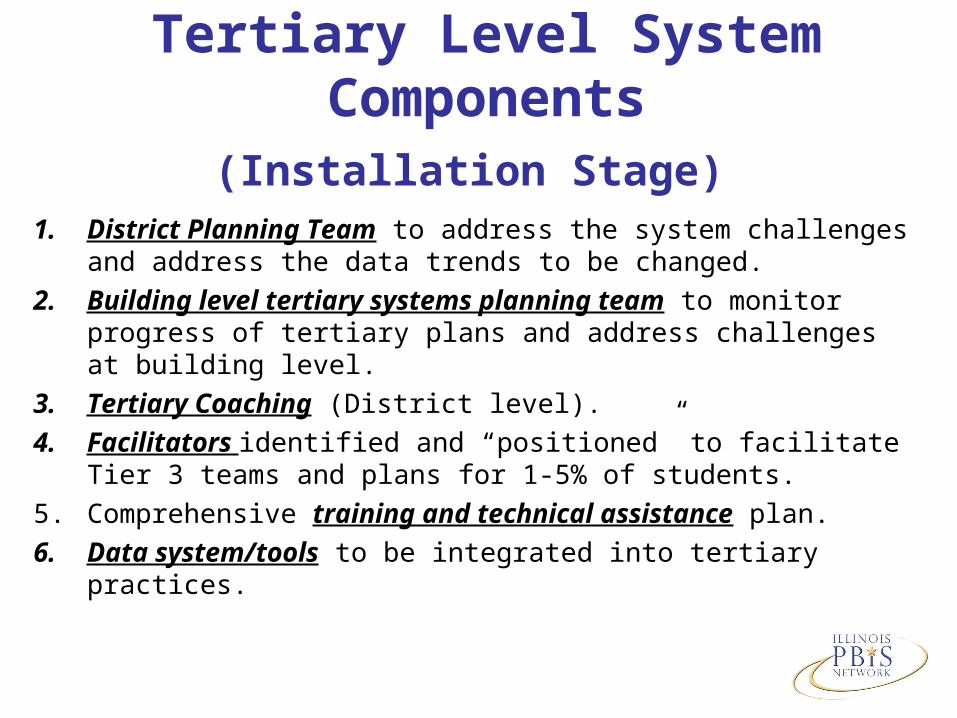
1. District Planning Team to address the system challenges and address the data trends to be changed.
2. Building level tertiary systems planning team to monitor progress of tertiary plans and address challenges at building level.
3. Tertiary Coaching (District level).
4. Facilitators identified and “positioned” to facilitate Tier 3 teams and plans for 1-5% of students.
5. Comprehensive training and technical assistance plan.
6. Data system/tools to be integrated into tertiary practices.
Tertiary Level System Components(Installation Stage)
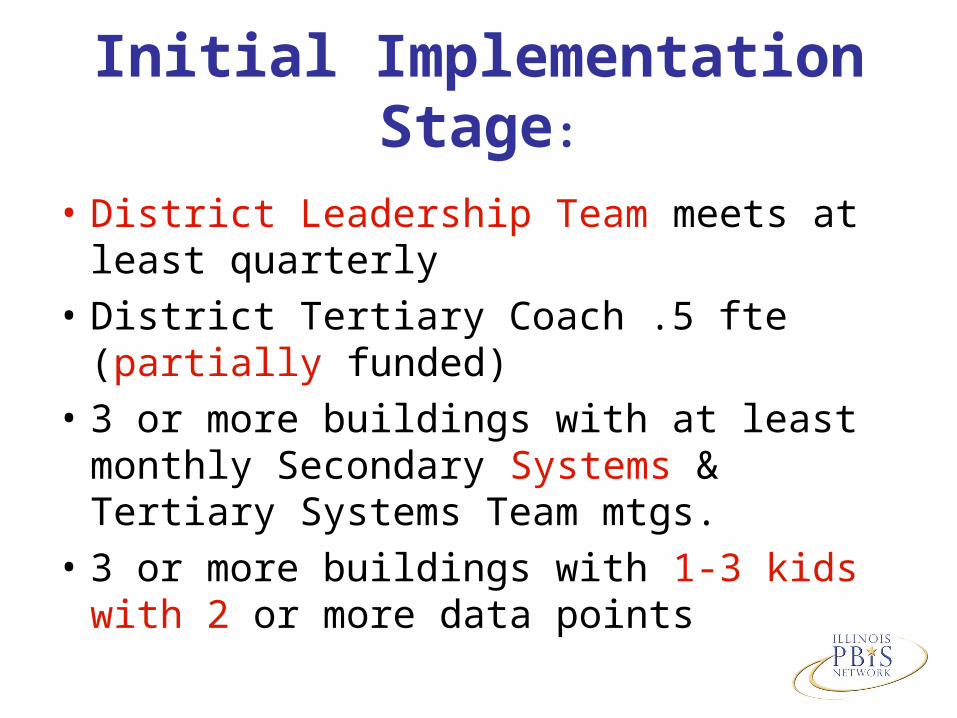
Initial Implementation Stage:
• District Leadership Team meets at least quarterly
• District Tertiary Coach .5 fte (partially funded)
• 3 or more buildings with at least monthly Secondary Systems & Tertiary Systems Team mtgs.
• 3 or more buildings with 1-3 kids with 2 or more data points
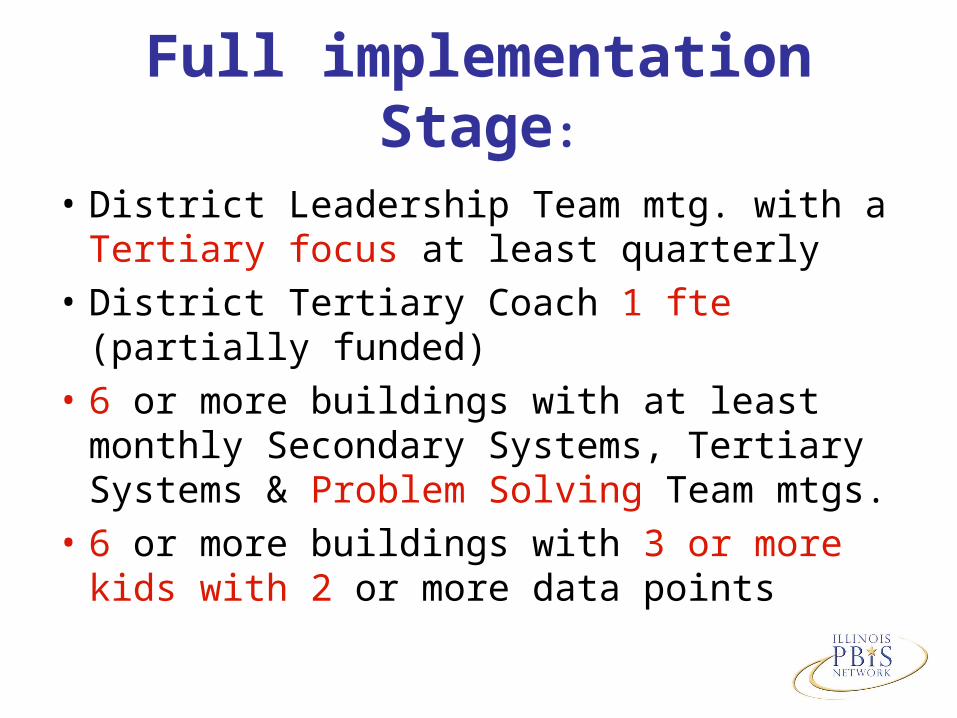
Full implementation Stage:
• District Leadership Team mtg. with a Tertiary focus at least quarterly
• District Tertiary Coach 1 fte (partially funded)
• 6 or more buildings with at least monthly Secondary Systems, Tertiary Systems & Problem Solving Team mtgs.
• 6 or more buildings with 3 or more kids with 2 or more data points
Innovation Stage:
• District Leadership Team mtg. w. a Tertiary focus at least quarterly w. community & family representation
• District Tertiary Coach 1 fte (fully funded)• 9 or more buildings with at least monthly
Secondary Systems, Tertiary Systems & Problem Solving Team mtgs.
• 9 or more buildings with 1-3 % of kids with 2 or more data points
• Modified district policies/procedures• Specific strategies for blending related initiatives
Sustainability Stage:
• Representative District Leadership Team mtg. with integrated Tertiary focus regularly
• District Tertiary Coach/es 1 fte or more (fully funded)
• 80% of buildings with at least monthly Secondary Systems, Tertiary Systems & Problem Solving Team mtgs.
• 80% of buildings with 1-3 % of kids with 2 or more data points
• Modified district policies/procedures• Specific strategies for blending related initiatives
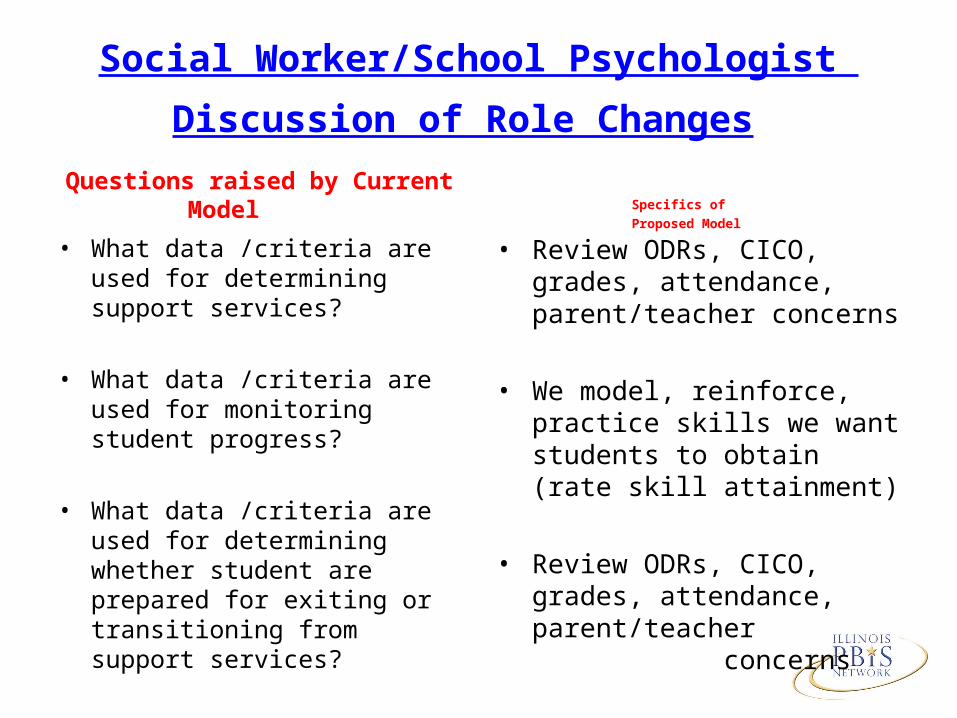
Social Worker/School Psychologist
Discussion of Role Changes Questions raised by Current
Model
• What data /criteria are used for determining support services?
• What data /criteria are used for monitoring student progress?
• What data /criteria are used for determining whether student are prepared for exiting or transitioning from support services?
Specifics of
Proposed Model
• Review ODRs, CICO, grades, attendance, parent/teacher concerns
• We model, reinforce, practice skills we want students to obtain (rate skill attainment)
• Review ODRs, CICO, grades, attendance, parent/teacher concerns
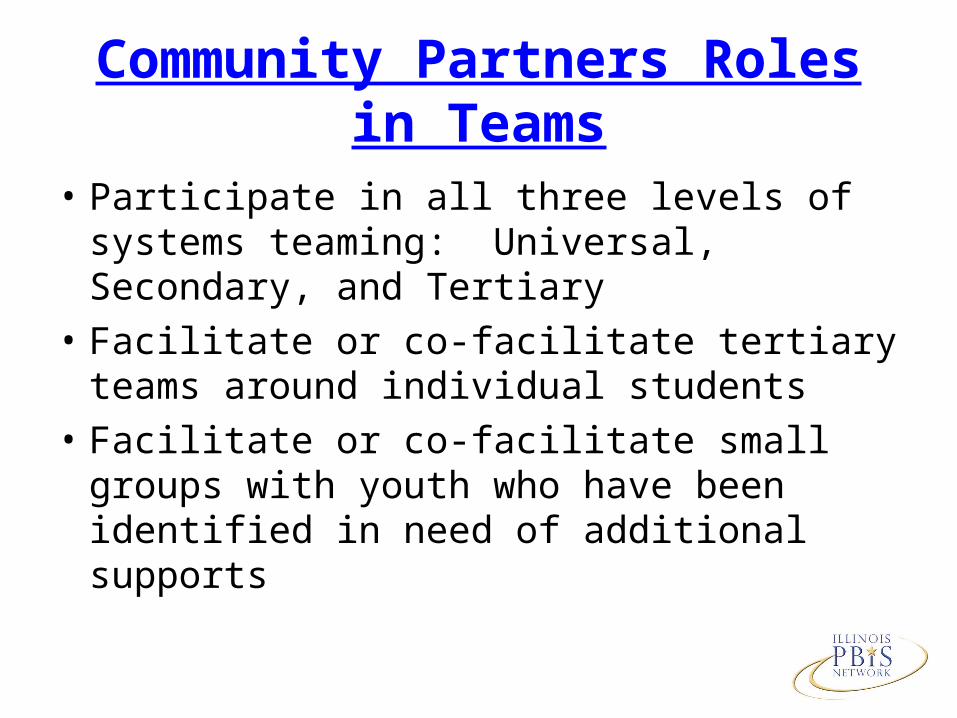
Community Partners Roles in Teams
• Participate in all three levels of systems teaming: Universal, Secondary, and Tertiary
• Facilitate or co-facilitate tertiary teams around individual students
• Facilitate or co-facilitate small groups with youth who have been identified in need of additional supports
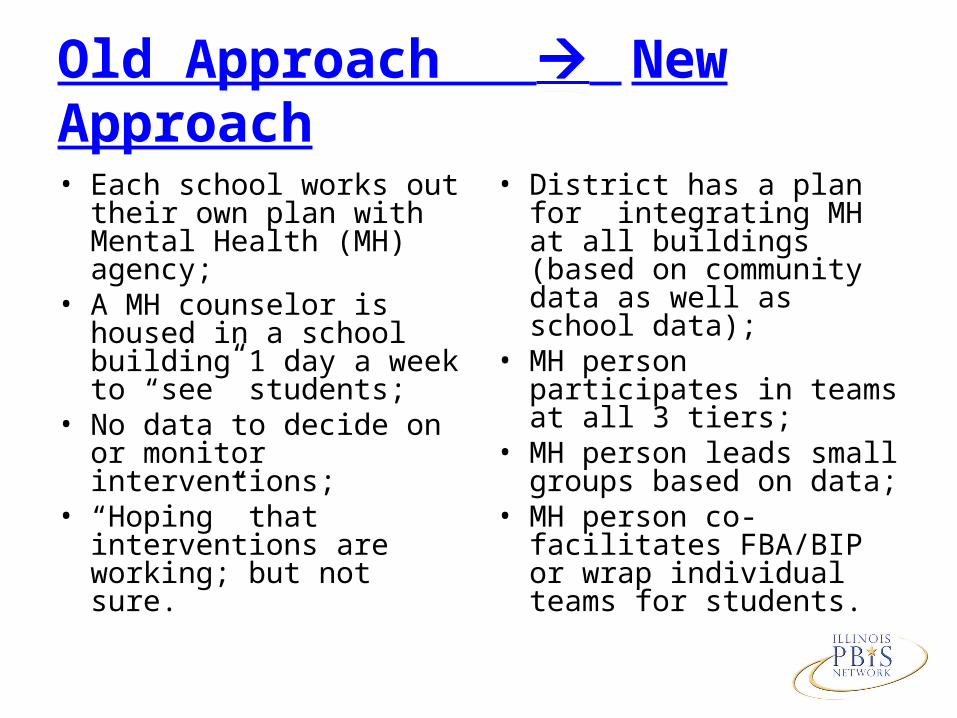
Old Approach New Approach
• Each school works out their own plan with Mental Health (MH) agency;
• A MH counselor is housed in a school building 1 day a week to “see” students;
• No data to decide on or monitor interventions;
• “Hoping” that interventions are working; but not sure.
• District has a plan for integrating MH at all buildings (based on community data as well as school data);
• MH person participates in teams at all 3 tiers;
• MH person leads small groups based on data;
• MH person co-facilitates FBA/BIP or wrap individual teams for students.
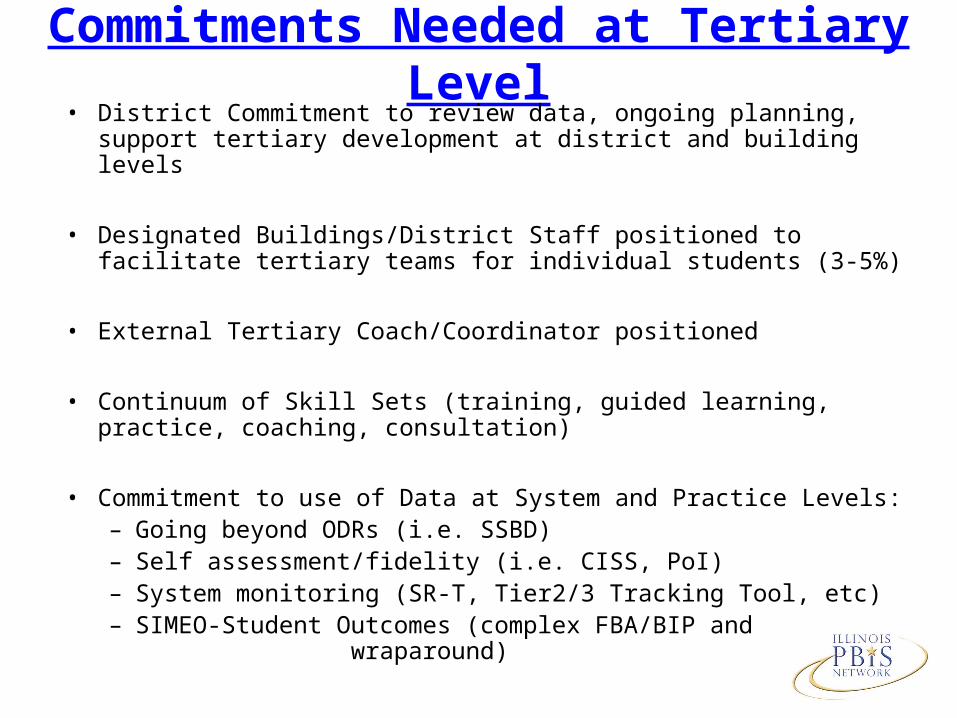
Commitments Needed at Tertiary Level• District Commitment to review data, ongoing planning, support
tertiary development at district and building levels
• Designated Buildings/District Staff positioned to facilitate tertiary teams for individual students (3-5%)
• External Tertiary Coach/Coordinator positioned
• Continuum of Skill Sets (training, guided learning, practice, coaching, consultation)
• Commitment to use of Data at System and Practice Levels:– Going beyond ODRs (i.e. SSBD)– Self assessment/fidelity (i.e. CISS, PoI)– System monitoring (SR-T, Tier2/3 Tracking Tool, etc)– SIMEO-Student Outcomes (complex FBA/BIP and
wraparound)
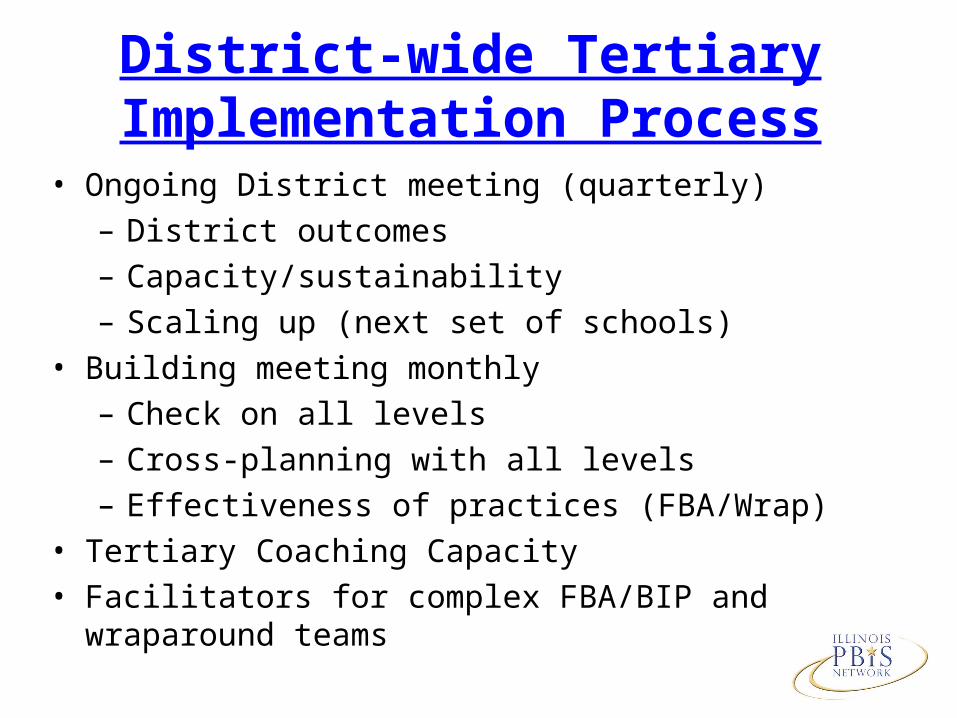
District-wide Tertiary Implementation Process
• Ongoing District meeting (quarterly)– District outcomes– Capacity/sustainability– Scaling up (next set of schools)
• Building meeting monthly– Check on all levels– Cross-planning with all levels– Effectiveness of practices (FBA/Wrap)
• Tertiary Coaching Capacity• Facilitators for complex FBA/BIP and wraparound teams
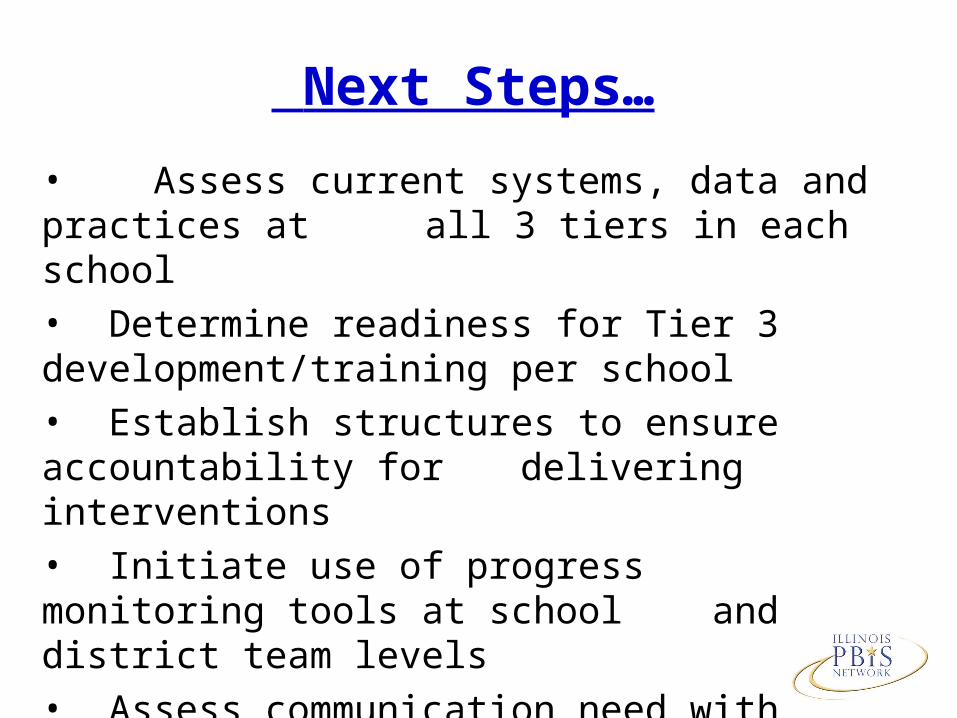
Next Steps…
• Assess current systems, data and practices at all 3 tiers in each school
• Determine readiness for Tier 3 development/training per school• Establish structures to ensure accountability for
delivering interventions • Initiate use of progress monitoring tools at school
and district team levels• Assess communication need with whole staff
about Tier 2/3 systems, data and practices•


![Golden Code PBIS Program Golden Ring Middle School Syretta James [PBIS Coach] Gina Peller [PBIS Team Member] Linda Salihi [PBIS Team Leader] Kevin Roberts](https://img.pdfslide.net/doc/110x75/56649f305503460f94c4b850/golden-code-pbis-program-golden-ring-middle-school-syretta-james-pbis-coach.jpg)