Embed Size (px)
Citation preview

Adopted June 12, 2014

Region XII Council of Governments Policy Council AUDUBON COUNTY
Duane Deist, County Supervisor Gary VanAernam, County Supervisor Jay Dee Mendenhall, Retired Gene Karstens, Conservation Board Member
CARROLL COUNTY Marty Danzer, County Supervisor, Chair Dan Nieland, County Supevisor Neil Bock, County Supervisor Cindy Fay, Banker
CRAWFORD COUNTY Eric Skoog, County Supervisor Rachel Desy, CDC, Denison Loren Schultz, Retired Jane Smith, City Clerk, City of Schleswig
GREENE COUNTY Guy Richardson, County Supervisor, Treasurer Jane Heun, County Auditor John Muir, County Supervisor Amy Milligan, Jefferson
GUTHRIE COUNTY Jerry Caraher, County Supervisor Jerri Christman, County Auditor
Curt Thornberry, Panora Telco Luann Waldo, Publisher SAC COUNTY
Rannell Drake, County Supervisor Elaine Rex, Resident Morris Boeckman, Resident Joan Godbersen, City of Odebolt
Region XII Technical Advisory Committee Josh Sebern, Guthrie County Engineer, Chair
Randy Krauel, City of Carroll Public Works Director, Vice Chair Paul Assman, Crawford County Engineer
Terry Crawford, City of Denison, Sundquist Engineering Tom Feldman, Western Iowa Transit Director
Ron Haden, Sac County Engineer Dave Paulson, Carroll County Engineer Mitch Rydl, Audubon County Engineer Wade Weiss, Greene County Engineer
Mark Bechtel, FTA, Ex-Officio Dakin Schultz, IDOT District 3 Planner, Ex-Officio
Tracy Troutner, FHWA, Ex-Officio Transit Roundtable XII Committee
Cindy Duhrkopf, Partnerships 4 Families Tom Feldman, Western Iowa Transit System Director
Jeff Greteman, Windstar Lines Annette Koster, BVSC Empowerment Coordinator
Becky Sporrer, Elderbridge Agency on Aging Faith Steinkamp, New Hope Village
Region XII Council of Governments Staff Richard T. Hunsaker, Executive Director Chris Whitaker, Local Assistance Director
Sam Parker, Regional Planner
This report was funded in part through a grant from the Federal Highway Administration, Federal Transit Administration, and the U.S. Department of Transportation. The views and opinions expressed herein do not necessarily state or reflect those of the U. S. Department of Transportation.

Chapter I: Introduction and Purpose
Region XII Council of Governments (Region XII COG) is the transportation
planning authority for Audubon, Carroll, Crawford, Greene, Guthrie and Sac
Counties in west central Iowa
as designated by the Boards
of Supervisors in each county.
Region XII COG was formed
in 1973 by these counties
through the joint exercise of
powers provision in Chapter
28E of the Code of Iowa.
Aside from transportation
planning, Region XII provides
technical and professional
support services to the governments in the region, and administers numerous
workforce programs, the Western Iowa Transit, the Housing Preservation Loan
Program, various housing initiatives, the Housing Trust Fund through Council of
Governments Housing, Inc., the Iowa Waste Exchange and the Region XII
Development Corporation revolving loan funds.
The Passenger Transportation Planning (PTP) process is designed to promote
passenger transportation planning and coordination amongst health and human
service agencies, transportation providers and the transportation planning
agency in the region to further the development of the public transportation
systems. The Region XII PTP will cover a five (5) year period and provide
justification for passenger transportation projects to be included in the regional
Transportation Improvement Program (TIP). The PTP will provide the basis for
efficient and effective passenger transportation resource allocation for
operations, maintenance, and service development; as well as
determining/addressing service duplication and gaps in the provision of needed

PAGE 2
services. The PTP is a required element for the Region XII RPA’s annual
Transportation Planning Work Program (TPWP).
The document you are reading is the updated PTP for fiscal year 2015 through
2019. The plan is composed of several sections exploring and describing many
aspects of the passenger transportation system in the Region XII service area.
Chapter II will provide an overall background of the social and economic
characteristics of the region. Chapter III describes the passenger transportation
operations that exist in the service area. Chapter IV studies the needs, goals,
and objectives of passenger transportation including: existing service needs,
expanded service needs, fleet, facilities, communications, maintenance, drivers,
administration, coordination and marketing. Chapter V discusses financial
resources for public transportation.

PASSENGER TRANSPORTATION PLAN
PAGE 3
Chapter II: Service Area Description
The Region XII COG service area covers approximately 3,456 square miles and
includes Audubon, Carroll, Crawford, Greene, Guthrie, and Sac Counties in Iowa.
The 2010 US Census reported the region's total population as 74,671 residents.
The region contains 56 municipalities, with 25% of the area's total population
residing within 2 small urban cities. (For transportation planning purposes, an
urban area is one with a population exceeding 5,000 persons.) The urban cities
are Carroll in Carroll County and Denison in Crawford County. The region's
small urban cities and rural towns primarily serve as agricultural service centers
and retail trade centers, but related small scale manufacturing activity is also
found in many of these centers. Carroll serves as the US Economic
Development
Administration’s designated
economic development
center and has a large retail
trade, with nearly double
that of all the other counties
within the region, as
illustrated in chart 2.1 from
the Iowa State University
Community Indicators Program. While still maintaining a primary reliance on
agriculture, the region’s economy is diversified, featuring such industries as Pella
Corporation, Turbine Fuel Technologies, Farner Bocken, American Home Shield,
Amanco, Scranton Manufacturing, AAI, Conner Athletic, Evapco, and Agri-Drain.
Farmland Foods manages agricultural and manufacturing operations and is the
region’s largest employer.
Section A: Population – Past Trends and Future Projections
The population of an area probably includes the most important assets a region
can have. Within a population are the community leaders, labor force, taxpayers,
and buyers of goods and services. This section will address several

PAGE 4
characteristics of Region XII’s population including past, present and future
trends of the region.
Total Population
This section will give the current population figures of the region. The most likely
reason for the slight decrease is the fact that the population is aging and younger
citizens are moving to larger metropolitan areas. All six counties lost a significant
number of residents from their unincorporated areas. This is due to the lack of
young farm families because today’s families are not as large as they were in the
first half of the twentieth century and most farm children have gone off to college
and end up working in non-agricultural fields combined with the fact that farms
are also getting larger.
Audubon County
Audubon County continued its population decline in 2010. The 2010 Census
recorded a continued decline, dropping from 6,830 in 2000 to 6,119. Exira was
the only city to gain in population, increasing from 810 to 840, while the county
seat of Audubon lost over 200 people, dropping from 2,382 to 2,176. In 2010,
Audubon had the fifth-highest median age of all counties in the state.
Carroll County
The 2010 Census indicated a 2.8% decrease in population since the last count in
2000, with the total population decreasing to 20,816. Five of the thirteen cities
experienced increases, while the unincorporated areas of the county declined by
over 39 people. The cities of Carroll and Glidden, which grew from 2000 and
2010, had the slight population decreases while Arcadia, Breda, Glidden,
Manning, and Templeton all featured some gain. Carroll only decreased by 3
while Glidden decreased by 103. The reasons for these increases are most likely
the result of Carroll’s strong, diverse economy. Communities in the surrounding
area have many residents who commute to the Pella Corporation or Farner-
Bocken facilities, the largest employers.

PASSENGER TRANSPORTATION PLAN
PAGE 5
Crawford County
With an increase of 154 individuals between 2000 and 2010, Crawford County
grew to 17,096. Five Crawford County cities posted population increases
between 2000 and 2010, ranging from an increase of one in Ricketts to 959 in
Denison. Much of this growth can be attributed to the growth and expansion of
the meat producing industries, such as Tyson Foods, Farmland, and Premium
Protein Products. Dow City, Schleswig, and Kiron also recorded modest
population increases, due in part to direct highway access into Denison.
Greene County
Unlike Crawford County, Greene County reversed its population growth of the
1990s and declined between 2000 and 2010. Between 2000 and 2010, Greene
County lost 9.9% of its population, dropping from 10,366 to 9,336. All cities and
the rural areas lost population between 2000 and 2010. Jefferson, the county
seat decreased by over 6%. Grand Junction decreased over 14%, the second-
highest rate in the county between Dana, which had a population decrease from
84 to 71.
Guthrie County
Guthrie County also lost residents between 2000 and 2010 after gains in the
1990s, dropping from 11,353 to 10,954, or a rate of 3.5%. All nine communities
decreased from their 2000 population. In the 1990s, Stuart increased by almost
200 people, while Yale and Bagley, both under 400, increased by 30.5% and
16.8%--but those trends reversed--possibly as the result of increasing fuel prices
for those that formerly commuted into the Des Moines Metro area.
Sac County
Sac County, like Audubon, continued a decades-long decline in population, with
a decrease of 10.2% between 2000 and 2010—a comparable rate to the 12.7%
decrease in the 1980s; the population of the entire County is now 10,350. Only
two small cities saw population growth from 1990: Auburn and Lytton. The

PAGE 6
population of the other cities continued to decline, with the exception of Schaller,
which grew in the 1990s and decreased by seven between 2000 and 2010.
Population Projections
The region as a whole is experiencing a declining population. The region’s
population has experienced a slow, but steady decline in population since 1930.
From 1980 to 1990, Region XII experienced its greatest population decline in its
history (11.1%). The 2010 Census and population projections from Woods and
Poole Economics, Inc. indicate that the population will continue to decrease, but
at slower rates than the past. Figure 2.1 illustrates the total population of the six
Region XII counties from 1860 to the 2040 projections.
Predicting future populations is a very difficult task due to the nature of the
multiple and often unpredictable variables that impact population. There are
various methods and formulas used to predict populations. Since there are many
variables associated with population growth and decline, projections should not
be totally relied upon, but rather used as a guide for future trends. Woods and
Poole annually produces population projections in five year increments through
the year 2030 for all of Iowa’s counties. These projections are based on current
birth rates and death rates as well as the current level of in and out migration.
The following section will discuss the future population trends of the region.

PASSENGER TRANSPORTATION PLAN
PAGE 7
Source: U.S. Census Bureau & Woods and Poole, Inc.
Previous paragraphs indicated that the population has been declining. Many
want to know if this will continue into the future. Figures from Woods and Poole
suggest that this is the case. Woods and Poole projects a slowing population
decline, stabilizing near 72,000 people in the region by 2040.
Figure 2.2: Region XII Population, 1860-2040
0
20,000
40,000
60,000
80,000
100,000
120,000
1860
1870
1880
1890
1900
1910
1920
1930
1940
1950
1960
1970
1980
1990
2000
2010
2020
2030
2040
Year
Popu
latio
n

PAGE 8
Section B: Age Distribution
An additional factor for the population decline is the increasing number of elderly
citizens. The number of citizens over the age of 65 has been increasing while
the number of citizens under the age of 29 has been declining. The following
graph compares the percentage of residents in the various age groups from 2000
to 2010. Two of the age brackets experienced decreases in all six counties: 35-
44 and 75-84 year olds. Only Crawford (5-9), Guthrie (10-14) and Audubon (15-
19) experienced an increased percentage in school-age children between 2000
and 2010, and those were the only three cohorts across the region to have any
gain in school-age individuals. On a positive note, the 25-34 age group
percentage grew in every county but Audubon, and the 20-24 year old age group
remained somewhat steady with increases in three counties: Audubon, Crawford,
and Greene; the retention of this age group has been one of the main concerns
of the region. Overall, residents between the ages of 35 and 54 decreased as a
percentage of the total population, while those that made up that growing cohort
ten years ago now account for increased rate of those in the 45-54 range. The
percent of residents over the age of 75 has also decreased since 2000, but the
percentage of residents over the age of 85 increased.
Table 2.1: Population by Age Group as a Percent of Total Population (2000/2010) Age Group Audubon Carroll Crawford Greene Guthrie Sac
0-4 5.8/5.5 6.0/7.0 6.4/7.4 5.8/5.6 5.5/5.6 5.6/5.8 5-9 7.1/5.1 7.2/6.5 6.9/7.1 7.0/6.3 6.6/6.5 6.2/6.1
10-14 8.0/6.6 8.3/6.6 7.7/7.3 7.7/6.8 6.8/7.3 7.5/6.6 15-19 6.7/6.9 8.0/6.7 8.4/7.8 7.5/6.5 6.7/6.5 7.2/5.9 20-24 3.3/3.4 4.8/4.5 5.3/5.6 3.7/4.1 4.2/3.1 4.4/3.6 25-34 9.2/8.9 10.3/10.8 10.9/10.9 9.5/9.7 9.6/9.7 9.3/9.3 35-44 13.5/10.7 15.6/11.3 14.9/11.3 14.8/10.2 15.2/11.6 14.3/10.7 45-54 12.3/16.5 12.4/15.7 12.9/14.4 13.1/15.9 14.0/15.8 13.2/15.8 55-64 10.6/13.3 8.6/10.3 9.6/11.9 9.3/14.1 10.9/14.0 9.6/14.1 65-74 10.6/10.6 8.7/8.1 8.2/7.9 9.6/9.4 10.2/10.0 10.2/9.3 75-84 8.9/8.0 7.1/6.9 6.3/5.4 8.1/7.3 7.2/6.8 8.6/8.1 85+ 3.9/4.6 2.8/3.6 2.6/3.0 3.9/4.2 3.1/3.1 3.9/4.7
Source: 2010 U.S. Census When comparing the age groups to the state and national percentages, Region
XII’s population has significantly higher percentages in the age groups over the
age of 65. This is reinforced when comparing median ages of the six counties to

PASSENGER TRANSPORTATION PLAN
PAGE 9
the state and national figures. The counties’ medians are anywhere from two to
seven years older than the national median.
All six counties had median ages greater than the state’s (38.1) in 2010.
Crawford County’s median age is the closest at 38.4, followed by Carroll (42.3),
Guthrie (44.8), Greene (45.6), Sac (46.6), and finally Audubon, which owns the
oldest median age in the region at 47.0. All six counties, as well as the state,
have experienced increases in their median ages since 1980.
To explain the aging population, there are several possible explanations. First,
birth rates are down compared to the 1940s and 1950s. The “baby boomers” of
the 1940s and 1950s are now reaching their sixties and seventies. Also, life
spans are increasing due to modern medicines and life lengthening treatments.
The 30-49 year old age group can be considered to be a somewhat transient
age, frequently moving to find better jobs in other areas of the state or country.
However, while this group was the largest out-migration group it was also the
largest in-migration group as well. Also, when the farm economy was struggling,
many communities tried to produce jobs that were not solely reliant on the
agricultural economy. It is believed that this age group, along with former
farmers, filled these jobs. Increases in the median age continue to raise the
demand and the amount of services that are needed for the growing number of
senior citizens in the region.
Audubon, Sac and Greene Counties are near the top of the list of counties with
high percentages of residents over the age of 65. Table 2.2 indicates Region XII
and its counties all have significantly higher percentages of residents over the
age of 65 than the state as a whole. This will likely be a cause for concern in the
future as these residents will likely need additional healthcare services, housing
and transportation.
PAGE 10
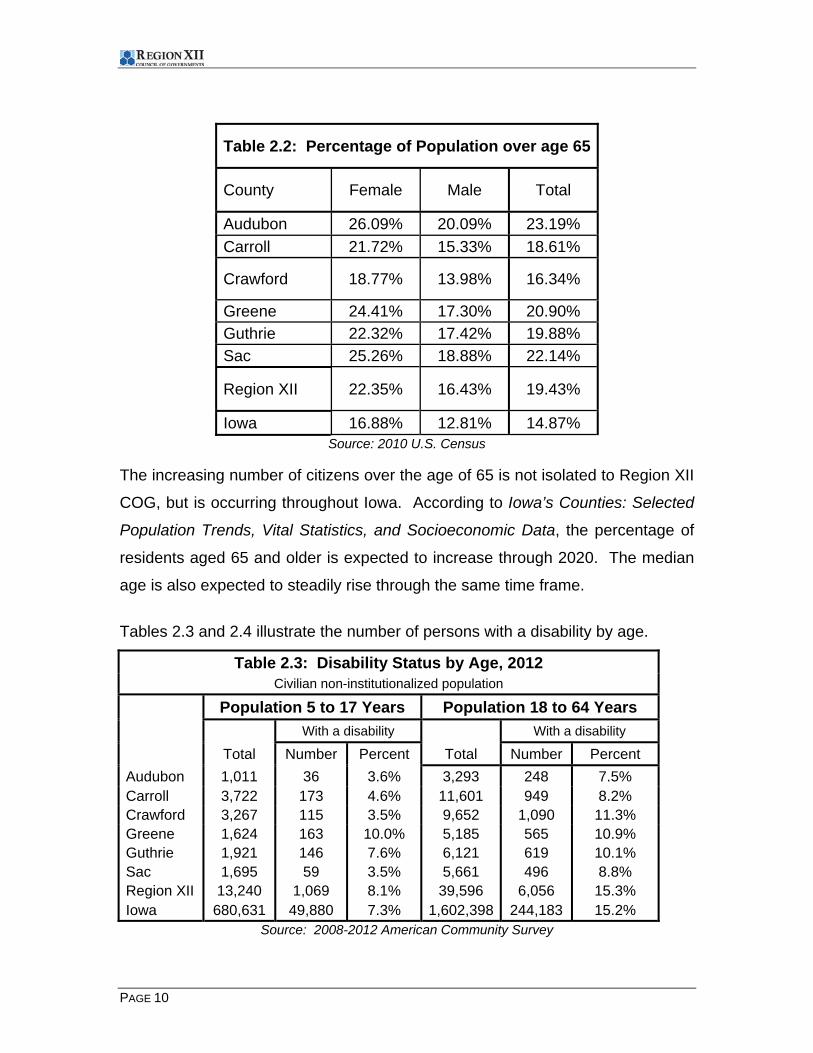
Table 2.2: Percentage of Population over age 65
County Female Male Total
Audubon 26.09% 20.09% 23.19%
Carroll 21.72% 15.33% 18.61%
Crawford 18.77% 13.98% 16.34%
Greene 24.41% 17.30% 20.90% Guthrie 22.32% 17.42% 19.88%
Sac 25.26% 18.88% 22.14%
Region XII 22.35% 16.43% 19.43%
Iowa 16.88% 12.81% 14.87% Source: 2010 U.S. Census
The increasing number of citizens over the age of 65 is not isolated to Region XII
COG, but is occurring throughout Iowa. According to Iowa’s Counties: Selected
Population Trends, Vital Statistics, and Socioeconomic Data, the percentage of
residents aged 65 and older is expected to increase through 2020. The median
age is also expected to steadily rise through the same time frame.
Tables 2.3 and 2.4 illustrate the number of persons with a disability by age.
Table 2.3: Disability Status by Age, 2012 Civilian non-institutionalized population
Population 5 to 17 Years Population 18 to 64 Years
With a disability With a disability
Total Number Percent Total Number Percent
Audubon 1,011 36 3.6% 3,293 248 7.5% Carroll 3,722 173 4.6% 11,601 949 8.2% Crawford 3,267 115 3.5% 9,652 1,090 11.3% Greene 1,624 163 10.0% 5,185 565 10.9% Guthrie 1,921 146 7.6% 6,121 619 10.1% Sac 1,695 59 3.5% 5,661 496 8.8% Region XII 13,240 1,069 8.1% 39,596 6,056 15.3% Iowa 680,631 49,880 7.3% 1,602,398 244,183 15.2%
Source: 2008-2012 American Community Survey

PASSENGER TRANSPORTATION PLAN
PAGE 11
As Table 2.4 shows, the percentage of those persons with a disability from age 5
through 17 in the Region XII area is higher than the percentage for the entire
State. The percentage of persons from ages 18 to 64 with a disability in the
Region XII area and the entire State of Iowa is nearly the same. While the data
for employed disabled individuals is not available for rural counties, the
percentage of disabled persons employed in the region was 3.5% higher than the
state average in 2000 when the Census last released the data. Regardless of
the local rates, the 2011 statewide employment rate for disabled individuals is
41.8% and a similar rate can be assumed to be applicable in this region, it is
likely that many of these persons are utilizing public transit or a taxi-cab to get to
and from employment.
Table 2.4 illustrates the population over 65 years old that have a disability.
Table 2.4: Disability Status by Age, 2012
Civilian non-institutionalized population
Population 65 years and
over
With a disability
Total Number Percent Audubon 1,305 390 29.9% Carroll 3,616 1,243 34.4% Crawford 2,661 913 34.3% Greene 1,846 789 42.7% Guthrie 2,024 668 33.0% Sac 2,104 690 32.8% Region XII 13,556 5,147 38.0% Iowa 431,172 142,969 33.2% Source: 2008-2012 American Community Survey
The percentage of people over 65 years of age that have a disability is 38%
region-wide. This percentage is higher than the statewide number of 33.2%.
Given the increasing population of elderly people in the region combined with the
number of persons over 65 years of age, the need for specialized, individuals
with disabilities accessible transportation services continue to grow.

PAGE 12
Section C: Income and Employment
The following information is from the 2008 Western Iowa Advantage Laborshed
Analysis completed by Iowa Workforce Development. The purpose of this
Laborshed analysis is to measure the availability and characteristics of workers
within the region by developing and conducting a telephone survey based on
geographic principles. The fundamental goal of any Laborshed analysis is to
estimate the potential availability of workers and determine how well the
surrounding geographical areas are able to provide a stable supply of workers to
the central Laborshed node. Factors are explored at both the micro (individual)
level and at the macro (zip code or Laborshed) level. The estimated total
potential labor force is developed using a logistic regression with polytomous
response model based on the above covariates drawn from survey data that
estimates the theoretical probability of persons accepting or changing
employment.
Audubon County
Survey respondents from the Audubon County Laborshed area were asked to
identify the industry they are currently working. The production, construction, &
material handling occupational category employed 25.4% of the workforce in the
county. Salesis the smallest employment category in the county, employing
4.4% of the workforce. The current median wage of those who are employed is
$12.50 per hour and the median salary is $43,000 per year.
Commuting
Commuting data collected by the Laborshed survey assists developers and
employers in understanding how employed residents can/could commute
within/out of the area. Overall, individuals are commuting an average of 9 miles
one way for employment opportunities. Those who live in Zone 1 are commuting
an average of 10 miles one way, while residents in Zone 2 are commuting an
average of 7 miles one way, and Zone 3 residents are commuting an average of
11 miles one way for the right employment opportunity. Keep in mind that for

PASSENGER TRANSPORTATION PLAN
PAGE 13
those residing in Zones 2 and 3 commuting distances of less than 20 miles one
way may or may not get them into the nodal community (Audubon).
Map 2.3: Audubon County Commuter Concentration by Place of Residence
[_
§̈¦35
5
tu65
§̈¦80
§̈¦80
§̈¦680
tu71
tu34
tu30
tu169
tu6
tu59
tu77
tu20
§̈¦29 tu71
Chariton
Harlan
Adair
Denison
Clarion
Audubon
Jefferson
Irwin
Carroll
Perry
Exira
Atlantic
Guthrie Center
AnitaNeola
Odebolt
Rockwell City
Walnut
Bayard
Avoca
Gray
Breda
Mondamin
Westside
Coon Rapids
Lake View
Brayton
Manilla
Council Bluffs
Glidden
Elk Horn
DedhamManningTempleton
Lidderdale
Kimballton
Council Bluffs
UNION
CASS
BURT
SARPY
DOUGLAS
WASHINGTON
DODGE
THURSTON
SAUNDERS
DAKOTA
OTOE
LANCASTER
CUMING
DIXON
SACIDA
POLK
CASS ADAIR
STORYBOONE
MONONA
DALLAS
MILLS
SHELBY
WOODBURY WEBSTER
HARDIN
GREENE
HARRISON
UNION
GUTHRIE
LUCAS
WRIGHT
WARREN
CRAWFORD
PLYMOUTH
CARROLL
MADISON
ADAMS
CALHOUNHAMILTON
POTTAWATTAMIE
CLARKE
FRANKLIN
JASPER
MARION
AUDUBON
PAGE
CHEROKEE BUENA VISTA POCAHONTAS
HUMBOLDT
MONTGOMERY
TAYLOR WAYNEFREMONT
MARSHALL
DECATURRINGGOLD
MONROE
APPANOOSE
y
Area Shown Legend
[_ Audubon
Interstate
4-Lane Highways
US Highways
State Highways
Iowa County
Nebraska County
South Dakota County
Commuter Concentration
by Place of Residence (per ZIP Code)
1 - 11
12 - 28
29 - 84
85 - 502
10 Mile Intervals Between Rings
0 20 40 60 8010Miles

PAGE 14
Map 2.3 above represents commuting patterns into Audubon County with the
concentration per ZIP code represented in the legend. Those who are willing to
change employment in the Audubon County Laborshed area are willing to
commute an average of 24 miles one way for employment opportunities.
Carroll County
The largest concentration of the workforce are employed within the professional,
paraprofessional, & technical occupational category (28.4%). The sales
occupational category represents the smallest sector of workers who are
currently employed (3.5%). The current median wage of those who are
employed is $15.00 per hour and the median salary is $42,000 per year.
Commuting
Overall, individuals are commuting an average of 12 miles one way for
employment opportunities. Those who live in Zone 1 are commuting an average
of 6 miles one way, while residents in Zone 2 are commuting an average of 11
miles one way, and Zone 3 residents are commuting an average of 18 miles one
way for the right employment opportunity. Keep in mind that for those residing in
Zones 2 and 3 commuting distances of less than 20 miles one way may or may
not get them into the nodal community (Carroll).

PASSENGER TRANSPORTATION PLAN
PAGE 15
Map 2.4 Commuter Concentration by Place of Residence into Carroll
[_
§̈¦35
5§̈¦80
§̈¦80
§̈¦680
tu30
tu169
tu6
tu59
tu18
tu77
tu20
§̈¦29
tu71
Denison
Boone
Audubon
Jefferson
Irwin
Carroll
Ida Grove
Fonda
Storm Lake
Exira
Ames
Atlantic
Early
Guthrie Center
Vail
Sac City
Paton
Dow City
Odebolt
Emmetsburg
Lake City
Kiron
Ogden
Rockwell City
Newell
Dunlap
Auburn
Bayard
Arcadia Scranton
Churdan
Hubbard
Ankeny
Wall Lake
Missouri Valley
Woodbine
Moorhead
Polk City
Westside
Deloit
Panora
Breda
Arthur
Lytton
Coon Rapids
Halbur
Lake View
Bagley
Gowrie
Hamlin
Manilla
Yale
Schleswig
Glidden
Pomeroy
Kirkman
Ricketts
Manson
Maxwell
Nemaha
Lohrville
DedhamManningCooper
Peterson
Pomeroy
Templeton
LidderdaleLanesboro
Charter Oak
Grand Junction
Farnhamville
Council Bluffs
Altoona
Redfield
Arion
Urbandale
West Des Moines
Des Moines
Varina
Ralston
UNION
LINCOLN
UNION
BURT
DOUGLAS
WASHINGTON
THURSTON
DODGE
DAKOTA
SAUNDERS
SARPY
SACIDA
POLK
SIOUX CLAY
CASS
STORYBOONE
ADAIR
MONONA
DALLAS
PLYMOUTH
SHELBY
WOODBURY
WEBSTER
WRIGHT
GREENE
OBRIEN
HARRISON
GUTHRIE
HARDIN
CRAWFORD
CARROLL
CALHOUN
KOSSUTH HANCOCK
HAMILTON
WARREN
FRANKLIN
CHEROKEE
POTTAWATTAMIE
MADISON
PALO ALTO
AUDUBON
BUENA VISTA
JASPER
POCAHONTAS
HUMBOLDT
CERRO GORDO
MARION
MARSHALL
Area Shown Legend
[_ Carroll
Interstate
4-Lane Highways
US Highways
State Highways
Iowa County
Nebraska County
South Dakota County
Commuter Concentration
by Place of Residence (per ZIP Code)
1 - 20
21 - 84
85 - 330
331 - 3,041
10 Mile Intervals Between Rings
0 20 40 60 8010Miles
Map 2.4 above represents commuting patterns into Carroll County with the
concentration per ZIP code represented in the legend. Those who are willing to
change employment in the Carroll Laborshed area are willing to commute an
average of 25 miles one way for employment opportunities.

PAGE 16
Crawford County
In Crawford County, the largest concentration of the workforce are employed
within the production, construction, & material handling occupational category
26.3%). The sales occupational category represents the smallest sector of
workers who are currently employed (4.7%). The current median wage of those
who are employed is $12.30 per hour and the median salary is $46,750 per year.
Commuting
Overall, individuals are commuting an average of 10 miles one way for
employment opportunities. Those who live in Zone 1 and Zone 2 are commuting
an average of 8 miles one way. Zone 3 residents are commuting an average of
14 miles one way for the right employment opportunity. Keep in mind that for
those residing in Zones 2 and 3 commuting distances of less than 20 miles one
way may or may not get them into the nodal community (Denison).

PASSENGER TRANSPORTATION PLAN
PAGE 17
Map 2.5: Commuter Concentration by Place of Residence into Denison
[_
§̈¦80
§̈¦80
§̈¦680
tu30
tu169
tu6
tu59
tu275tu77
§̈¦29
tu20
§̈¦29
tu71
tu75
Logan
Harlan
Adair
AltaCherokee
Denison
Audubon
Jefferson
Irwin
Carroll
Perry
Ida Grove
Onawa
Storm Lake
Exira
Atlantic
Guthrie Center
Vail
Sac City
Earlham
Fremont
Dow City
Odebolt
Earling
Lake City
KironMapleton
Rockwell City
Pocahontas
Newell
Soldier
Ute
Dunlap
Wakefield
Pisgah
Lawton
Treynor
Holstein Schaller
Avoca
Mondamin
Wall Lake
Missouri Valley
Woodbine
Moorhead
Winnebago
Deloit
Galva
Breda
Arthur
Halbur
Lake View
Bouton
Auburn
Marcus
Arcadia
Battle Creek
Scranton
Danbury
Castana
Waukee
Sutherland
Westside
Coon RapidsManilla
Council Bluffs
Schleswig
Glidden
Kirkman
Ricketts
Panama
Lohrville
DedhamManningAspinwall Templeton
Lidderdale
Kimballton
Little Sioux
Portsmouth
Charter Oak
Council Bluffs
South Sioux City
Arion
Sioux City
Urbanda
Omaha
Defiance
Omaha
Tennant
CLAY
UNION
YANKTON
LINCOLNTURNER
BURT
DIXON
DODGE
CUMING
SAUNDERS
CEDAR
WAYNE
THURSTON
DOUGLASBUTLER
COLFAX
DAKOTA
WASHINGTON
SARPY
STANTON
SACIDA
CASS ADAIR
BOONE
PLYMOUTH
MONONA
DALLASSHELBY
WOODBURY
WEBSTER
SIOUX CLAY
GREENE
HARRISONGUTHRIE
CRAWFORD
CARROLL
MADISON
CALHOUN
POTTAWATTAMIE
CHEROKEE
OBRIEN
AUDUBON
BUENA VISTA POCAHONTAS
KOSSUTH
WRIGHT
HUMBOLDT
PALO ALTO
HAMILTON
POLK
HANCOCK
MILLS ADAMS UNIONMONTGOMERY CLARKE
WARREN
Area Shown Legend
[_ Denison
Interstate
4-Lane Highways
US Highways
State Highways
Iowa County
Nebraska County
South Dakota County
Commuter Concentration
by Place of Residence (per ZIP Code)
1 - 26
27 - 82
83 - 181
182 - 2,644
10 Mile Intervals Between Rings
0 20 40 60 8010Miles
Map 2.5 represents commuting patterns into Crawford County with the
concentration per ZIP code represented in the legend. Those who are willing to
change employment in the Crawford County Laborshed area are willing to
commute an average of 25 miles one way for employment opportunities.

PAGE 18
Greene County
The largest concentration of the workforce in Greene County are employed within
the professional, paraprofessional, & technical occupational category (32.2%).
The sales occupational category represents the smallest sector of workers who
are currently employed (2.2%). The current median wage of those who are
employed is $15.20 per hour and the median salary is $48,000 per year.
Commuting
Overall, individuals are commuting an average of 12 miles one way for
employment opportunities. Those who live in Zone 1 are commuting an average
of 8 miles one way, Those who live in Zone 1 are commuting an average of 8
miles one way, while residents in Zone 2 are commuting an average of 15 miles
one way, and Zone 3 residents are commuting an average of 13 miles one way
for the right employment opportunity. Keep in mind that for those residing in
Zones 2 and 3 commuting distances of less than 20 miles one way may or may
not get them into the nodal community (Jefferson).

PASSENGER TRANSPORTATION PLAN
PAGE 19
Map 2.6 Commuter Concentration by Place of Residence into Jefferson
[_
§̈¦35
§̈¦80
§̈¦80
§̈¦680
tu30
tu169
tu6
tu59tu20
tu71
Denison
Boone
Jefferson
Carroll
Perry
Madrid
Ames
Guthrie Center
Earlham
Paton
Lake City
Ogden
OthoRockwell City
Beaver
Bayard
Dayton
Churdan
Ankeny
Rippey
Fort Dodge
Panora
Bagley
Gowrie
Yale
Stuart
Glidden
Somers
Roland
Cooper
Dana
AmesScranton
Waukee
Coon Rapids
Dawson
Lohrville Harcourt
Bradgate
Moorland
Lanesboro
WoodwardJamaica
Grand Junction
Farnhamville
Dallas Center
Minburn
Pilot Mound
Johnston
Des Moines
Urbandale
West Des Moines
Des Moines
GilbertRalston
SACIDA
POLK
CASS
STORYBOONE
ADAIR
DALLAS
SHELBY
HARDIN
WEBSTER
WRIGHT
GREENE
GUTHRIE
CRAWFORD CARROLL
FRANKLIN
CALHOUN
JASPER
HAMILTON
WARRENMADISON
CHEROKEE
POTTAWATTAMIE
AUDUBON
MARION
BUENA VISTA POCAHONTAS
HARRISON
HUMBOLDT
MONONA
MARSHALL
WOODBURY
PLYMOUTH
BUTLER
GRUNDY
HANCOCK CERRO GORDOKOSSUTH FLOYD
Area ShownLegend
[_ Jefferson
Interstate
4-Lane Highways
US Highways
State Highways
Iowa County
Commuter Concentration
by Place of Residence (per ZIP Code)
1 - 9
10 - 41
42 - 79
80 - 961
10 Mile Intervals Between Rings
0 20 40 60 8010Miles
Map 2.6 above represents commuting patterns into Greene County with the
concentration per ZIP code represented in the legend. Those who are willing to
change employment in the Greene County Laborshed area are willing to
commute an average of 24 miles one way for employment opportunities.

PAGE 20
Guthrie County
In Guthrie County, the largest concentration of the workforce are employed within
the professional, paraprofessional, & technical occupational category (27.4%).
The agricultural occupational category represents the smallest sector of workers
who are currently employed (4.5%). The current median wage of those who are
employed is $15.00 per hour and the median salary is $41,000 per year.
Commuting
Overall, individuals are commuting an average of 18 miles one way for
employment opportunities. Those who live in Zone 1 are commuting an average
of 14 miles one way, while residents in Zone 2 are commuting an average of 20
miles one way, and Zone 3 residents are commuting an average of 13 miles one
way for the right employment opportunity. Keep in mind that for those residing in
Zones 2 and 3 commuting distances of less than 19 miles one way may or may
not get them into the nodal community (Guthrie Center).

PASSENGER TRANSPORTATION PLAN
PAGE 21
Map 2.7: Commuter Concentration by Place of Residence
into Guthrie Center
[_
§̈¦35
5
tu65
§̈¦80
§̈¦80
§̈¦680
tu34
tu30
tu169
tu6
tu59
tu20
tu71
tu69
Harlan
Audubon
Jefferson
Casey
Perry
Exira
Guthrie Center
Anita
Earlham
Greenfield
Bayard
Rippey
Menlo
Deloit
Panora
Linden
Bagley
Gowrie
Yale
Bouton
Stuart
Glidden
Lorimor
Dexter
Massena
Coon Rapids
DedhamTempleton
Jamaica
Redfield
Minburn
Johnston
West Des Moines
Urbandale
CASS
SARPY
SARPY
DOUGLAS
POLK
SAC
CASS
IDA
ADAIR
STORYBOONE
DALLAS
MILLS
SHELBY
GREENE
UNION
GUTHRIE
LUCAS
WARREN
CRAWFORDCARROLL
MADISON
ADAMS
HARDIN
CLARKE
POTTAWATTAMIE
JASPER
WEBSTERCALHOUN HAMILTON
MARION
AUDUBONHARRISON
MONONA
PAGE
MONTGOMERY
MARSHALL
WOODBURY
TAYLORFREMONTWAYNEDECATURRINGGOLD
MONROE
APPANOOSE
Area Shown Legend
[_ Guthrie Center
Interstate
4-Lane Highways
US Highways
State Highways
Iowa County
Nebraska County
Commuter Concentration
by Place of Residence (per ZIP Code)
1 - 4
5 - 9
10 - 41
42 - 273
10 Mile Intervals Between Rings
0 20 40 60 8010Miles
Map 2.7 represents commuting patterns into Guthrie County with the
concentration per ZIP code represented in the legend. Those who are willing to
change employment in the Guthrie County Laborshed area are willing to

PAGE 22
commute an average of 32 miles one way for employment opportunities.
Sac County
The professional, paraprofessional, & technical occupational category employed
the largest concentration of the workforce in Sac County (26.1%). The
agricultural occupational category represents the smallest sector of workers who
are currently employed (2.9%). The current median wage of those who are
employed is $12.58 per hour or the median salary is $40,000 per year for those
who are paid on a salaried basis.
Commuting
Overall, individuals are commuting an average of 9 miles one way for
employment opportunities. Those who live in Zone 1 are commuting an average
of 9 miles one way, Zone 2 residents are commuting an average of 11 miles one
way, and Zone 3 residents are commuting an average of 10 miles one way for
the right employment opportunity. Keep in mind that for those residing in Zones
2 and 3 commuting distances of less than 20 miles one way may or may not get
them into the nodal (Sac City) community.

PASSENGER TRANSPORTATION PLAN
PAGE 23
Map 2.8: Commuter Concentration by Place of Residence into Sac City
[_
§̈¦35
tu30
tu169
tu75
tu59
tu18
tu20
§̈¦29
tu71
Alta
Carroll
Ida Grove
Fonda
Storm Lake
Early
Rolfe
Sac City
Odebolt
Lake City
Rockwell City
Pocahontas
Newell
Auburn
Holstein Schaller
Wall Lake
Albert City
Galva
Breda
Arthur
Lytton
Lake View
Jolley
Glidden
MansonNemaha
Lohrville
Moorland
Lanesboro
BURT
THURSTON
WASHINGTON
SACIDA
CLAYSIOUX
BOONE
MONONA
OBRIENKOSSUTH
WEBSTER
WRIGHT
GREENE
WOODBURY
CRAWFORDCARROLL
CALHOUN
HANCOCK
PLYMOUTHCHEROKEE
PALO ALTO
HAMILTON
BUENA VISTAPOCAHONTAS
HUMBOLDT
SHELBYHARRISONDALLAS
STORY
POLKGUTHRIEAUDUBON
EMMETLYON
WINNEBAGODICKINSONOSCEOLA
Area Shown Legend
[_ Sac City
Interstate
4-Lane Highways
US Highways
State Highways
Iowa County
Nebraska County
Commuter Concentration
by Place of Residence (per ZIP Code)
1 - 8
9 - 21
22 - 55
56 - 693
10 Mile Intervals Between Rings
0 20 40 60 8010Miles
Map 2.8 represents commuting patterns into Sac County with the concentration
per ZIP code represented in the legend. Those who are willing to change
employment in the Sac County Laborshed area are willing to commute an
average of 24 miles one way for employment opportunities.

PAGE 24
Service Center Locations
The following will visually display the locations of banks, clinics, grocery stores,
hospitals, nursing homes and pharmacies throughout the region as well as
business districts that have a concentration of retail businesses.

PASSENGER TRANSPORTATION PLAN
PAGE 25
Map 2.9: Audubon County Service Centers
Most transit trip generators are located in the City of Audubon where Western
Iowa Transit operates one full time bus. An additional transit bus is located in
Exira.
PAGE 26
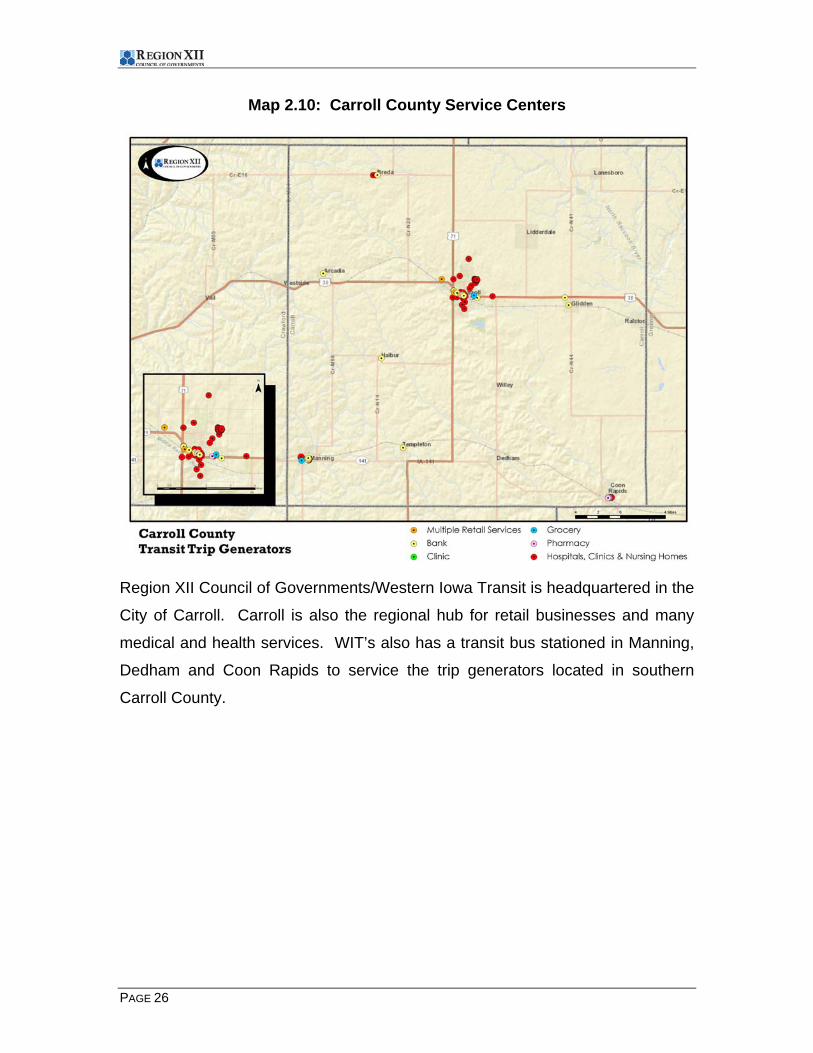
Map 2.10: Carroll County Service Centers
Region XII Council of Governments/Western Iowa Transit is headquartered in the
City of Carroll. Carroll is also the regional hub for retail businesses and many
medical and health services. WIT’s also has a transit bus stationed in Manning,
Dedham and Coon Rapids to service the trip generators located in southern
Carroll County.

PASSENGER TRANSPORTATION PLAN
PAGE 27
Map 2.11: Crawford County Service Centers
Denison and Crawford County is home to several service providers. WIT has a
satellite facility in Denison to provide service.

PAGE 28
Map 2.12: Greene County Service Centers
Jefferson is the county seat of Greene County and is the location for several trip
generators and service centers. WIT operates a satellite building in Jefferson to
provide service throughout Greene County.

PASSENGER TRANSPORTATION PLAN
PAGE 29
Map 2.13: Guthrie County Service Centers
Trip Generators in Guthrie County are concentrated in Guthrie Center and
Panora. WIT operates 3 vehicles on a regular basis in Guthrie County, one
stationed in Guthrie Center, one in Panora and one in Stuart.

PAGE 30
Map 2.14: Sac County Service Centers
Trip generators and spread throughout Sac County. WIT’s has vehicles
stationed in Auburn, Odebolt and 3 in Sac City to provide service in the county.

PASSENGER TRANSPORTATION PLAN
PAGE 31
Limited English Proficient Population
The total population of the 6-county Region XII COG service area is 74,671
according to the 2010 U.S. Census. The most current information regarding
languages spoken at home and language proficiency is available from the 2005-
2009 American Community Survey (ACS) 5-Year Estimates. (Please note that
there are differences in the total population estimates of counties compared to
the 2010 U.S. Census). The table below illustrates the percentage of the
population by county that speak only English.
Table 2.5: English-Only Language, Above 5 Years Old, Population
Estimate
Population
Estimate
Population
Speaking
Only
English
Percent of
Population
Speaking
Only English
Speak
English
Very
Well
Speak
English
Less Than
Very Well
Audubon
County
5,763 5,691 98.8% 47 20
Carroll
County
19,325 18,731 96.9% 437 157
Crawford
County
15,836 12,172 76.9% 1,621 2,040
Greene
County
8,808 8,554 97.1% 125 122
Guthrie
County
10,331 10,120 98.0% 132 79
Sac County 9,696 9,452 97.5% 177 60
Region XII
COG
69,759 64,720 92.8% 2,539 2,478
Source: 2008-2012 American Community Survey - U.S. Census
The ACS estimates the regional population to be 69,679 residents of which
93.87% of these residents speak only English. While the percent of English-only

PAGE 32
residents is high regionally, there are concentrations of populations that are of
limited English proficiency in the region, predominantly in Crawford County where
81.37% of residents speak only English.
Of the estimated 19,416 residents in Crawford County, 2,643 (17.30%) residents
speak Spanish or Spanish Creole, the overwhelming majority of those who speak
a language other than English. The American Community Survey then goes on
to estimate that 55% of Spanish speakers speak English less than “very well.”
According to the 2010 U.S. Census, 4,131 (24.2%) of the residents in Crawford
County were Hispanic or Latino origin. If the ACS percentages hold and these
residents of Hispanic or Latino origin are also Spanish speakers, there are
approximately 3,000 persons (17.5% of the current population) who may speak
limited English that currently reside in Crawford County.
Summary
Overall the population of the region is decreasing; although some areas are
seeing population growth. The median age is increasing and each county has a
higher median age than the median age for the State of Iowa. This increase in
the median age and the increasing number of person age 65 and older will
continue to increase the demand for specialized, accessible transportation. The
workforce of the region continues to evolve with workers willingly to travel greater
distances to find employments opportunities. This shift to longer commutes,
combined with increased travel costs, will maintain the demand for commuter
shuttles and van pools.

PASSENGER TRANSPORTATION PLAN
PAGE 33
Chapter III: Existing Passenger Transportation Operations The Region XII COG service area has several passenger transportation
operations in existence, including: Western Iowa Transit as the designated
public transit agency, Windstar Lines, All American Cab, Carroll Cab Company,
Diamond Cab, Manning Community Service, New Hope Village, Veteran’s Affairs
vans (Carroll and Crawford) Eventide Lutheran Homes, Thomas Rest Haven and
area community school districts. The following will provide a description of the
services provided by each entity, their location, eligibility for services and other
operational information.
Section A: Western Iowa Transit
Western Iowa Transit (WIT) is a service of Region XII Council of Governments.
WIT offers public transportation services to senior citizens, people with
disabilities and the general public throughout the region. WIT is funded in part by
the Iowa Department of Transportation, the Federal Transit Administration (FTA),
Elderbridge Area Agency on Aging, local governments, contracts, fares and
donations.
The mission of Western Iowa Transit is to provide safe, dependable, and efficient
public transit services for all citizens within its service area in a manner that will
help them maintain and improve their quality of life.
Location of Services
In 1994, the COG
constructed its central
office and transit facility.
Originally, this 11,000
square foot facility
consisted of
approximately 6,900

PAGE 34
square feet for a shop, wash bay, and vehicle storage and 4,600 square feet for
administrative offices. In 2000, a 1,800 square foot addition was constructed for
local assistance staff, administrative staff, and storage. Currently, an expansion
of both the office and transit facility for the Carroll location are under construction.
In 1999, Region XII COG constructed a
5,600 square foot satellite facility for WIT
in Denison in Crawford County. This
facility is used for vehicle storage and
contains a small office and storage area.
Thirteen units are housed and dispatched
from this facility.
In 2003, Region XII COG completed
a 5,600 square foot satellite facility
for WIT in Jefferson in Greene
County. Similar to the Crawford
County facility, this building is used
primarily for vehicle storage. The
building also an office and storage
area. Ten units are housed and dispatched from this facility.

PASSENGER TRANSPORTATION PLAN
PAGE 35
Fleet Availability
WIT operates 66 vehicles for public transit service and 1 vehicle for maintenance
and service. Table 3.1 illustrates the vehicle type by county.
Table 3.1: WIT Vehicles by County Total
Vehicles Mini Bus
Passenger Van
Station Wagon
Mini Van
Sedan Service Vehicle
Audubon County
4 3 0 0 1 0 0
Carroll County
28 23 1 0 2 1 1
Crawford County
16 6 4 0 5 1 0
Greene County
10 7 1 0 1 1 0
Guthrie County
3 2 0 0 1 0 0
Sac County
7 3 2 1 1 0 0
Source: WIT Fleet Inventory, 2013 Of the WIT fleet, all mini-buses are ADA accessible, 3 of the 8 passenger vans
are ADA accessible and 2 of the 11 mini-vans are ADA accessible. To operate
this fleet, WIT is staffed by 1 full-time transit director, 1 full-time transit assistant,
1 full-time service manager, 14 full-time drivers and 12 part-time drivers.
Types of Existing Services The public transit service offered through WIT is a “demand-response” service,
meaning rides must be scheduled by contacting the driver 24 hours in advance of
the needed ride. Rides can be scheduled by contacting the offices at Carroll,
Denison or Jefferson, through the local drivers directly or at most congregate
meal sites. WIT offers door to door transportation services with flexible
schedules to meet the needs of its riders.
WIT is especially suitable for the transportation of the disadvantaged, such as
persons with disabilities and senior citizens. Service is provided for: grocery
needs, personal care needs, medical and dental needs, Head Start, preschools,
day care centers, work commutes, community events and more. WIT also works

PAGE 36
with nursing homes, care centers, local rehabilitation agencies, and group
homes. The service is intended to compliment other transportation services in
the community.
Fare Structures
As of FY 2014, in-town service is $5.00 for a one way ride. This would mean a
round trip cost of $10.00 for regular service and $5.00 for each additional stop.
Out of Town Service and other service quoted on a per trip basis. Special
Trips/Group Outings Trips are based on a “time and mileage” cost. It is more
efficient to transport 3 or 4 people at a time.
The services offered by WIT are designed to be flexible in order to meet as many
transit needs as possible.
Clients
Service is available for use by all citizens within the local communities and the
surrounding areas. WIT is currently providing direct service to the following
agencies or operating under an indirect service arrangement.
Facilities Serving Clients with Disabilities County View Estates, Panora Department of Human Services Genesis Development, Jefferson Howard Center, Inc., Sac City New Hope Village, Carroll Wesco Industries, Denison
Care Centers and Nursing Homes Carroll Health Center, Carroll Regency Park Nursing and Rehab Center of Carroll Regency Park Nursing and Rehab Center of Jefferson Denison Care Center, Denison Friendship Home, Audubon Loring Care Center, Sac City Panora Nursing and Rehab, Panora Parkview Care Center, Sac City St. Anthony’s Nursing Home, Carroll Thomas Rest Haven, Coon Rapids

PASSENGER TRANSPORTATION PLAN
PAGE 37
Senior Contracts Elderbridge Agency on Aging Manning Community Services
Agencies Serving Children Buena Vista, Sac, Crawford Empowerment Community Opportunities, Carroll Job Corps of Denison Partnership for Families, Carroll West Central Development Corporation, Denison
School Districts Adair-Casey School District Denison Community Schools Jefferson-Scranton School District Sac Community Schools Southern Cal Schools
Employment Howard Center, Inc. – Job Access Program Job Corps of Denison – Job Access Program Workforce Investment Act SDA 08
Churches Abundant Life Ministries, Jefferson Carroll First United Methodist Church, Carroll

PAGE 38
Figure 3.1 shows the top 6 ride generators for WIT from 2009-2013.
Figure 3.1 WITS Rides by Generator
02,5005,0007,500
10,00012,50015,00017,50020,00022,50025,00027,50030,00032,50035,00037,50040,00042,50045,00047,50050,00052,50055,000
20
09
20
10
20
11
20
12
20
13
Fiscal Year
Rid
es
New Hope Village
GenesisDevelopment
New Opportunities,Inc.
West CentralWorkshop
Partnership 4Families
Source: WIT Year End Reports, 2009-2013
The majority of rides are generated by New Hope Village in Carroll averaging
50,350 rides annually. New Opportunities generated an average of 13,460 rides
per year through their HeadStart program in Audubon, Carroll, Greene, Guthrie
and Sac Counties. New Opportunities rides have decreased due to the reduction
in the number of out-of-town routes.

PASSENGER TRANSPORTATION PLAN
PAGE 39
Trips, Mileage and Rides
Figure 3.2 illustrates the total number of rides provided by WIT during fiscal year
2000 through 2013.
Figure 3.2: WITS Total Rides 2000-2008
265,614258,268255,279
267,605
252,526
231,876
254,452
243,734
220,250
210,250205,566
202,000
273,188
200,000
220,000
240,000
260,000
280,000
2000
2001
2002
2003
2004
2005
2006
2007
2008
2009
2010
2011
2012
2013
Fiscal Year
Rid
es
Source: WIT Year End Reports, 2000-2013
In 2000, WIT provided 273,188 rides, the highest number for the 9 year period.
Ridership levels neared this mark in 2004 with WIT providing 267,605 rides.
Decreases in ridership can likely be attributed to a rate increase for transit
services imposed during fiscal year 2001 and a Carroll County specific rate
increase in fiscal year 2002. The decrease in rides during fiscal 2006 can be
attributed to the reduction in the number of Head Start routes, the lack of the
Saint Anthony Hospital Shuttle service, and some clients have limited their use of
the service due to the increase in cost. The increase in ridership for 2007 is
directly related to the re-establishment of the Saint Anthony Hospital Shuttle and
the popularity of the Partnership 4 Families School to Work Service. The
decrease in ridership in 2008 can be attributed to the discontinuation of the Saint
Anthony Hospital Shuttle service.
Figure 3.3 graphs the revenue and vehicle miles traveled by WIT from 2000
through 2013.

PAGE 40
Figure 3.3: WITS Vehicle Miles
1,22
2,12
0
1,13
0,89
2
1,07
3,62
8
1,14
5,90
5
1,05
0,76
4
946,
741 1,
077,
299 1,
188,
040
1,21
9,96
0
971,
036
873,
433
1,03
1,76
6
1,00
0,69
8
1,05
5,97
21,
144,
982
1,09
4,54
2
991,
646
1,16
1,35
8
0
200,000
400,000
600,000
800,000
1,000,000
1,200,000
1,400,000
2005 2006 2007 2008 2009 2010 2011 2012 2013
Fiscal Year
Rev
enu
e M
iles
Total Vehicle Miles
Total Revenue Miles
Source: WIT Year End Reports, 2005-2013
In 2005, WIT generated 873,443 revenue miles from transit services and 946,741
vehicle miles. The number of revenue miles has risen to a high of 1,161,358
miles in 2008. Total vehicle miles have also followed this same trend; reaching a
high in 2013 with 1,222,120 vehicle miles traveled.
Future increases in ridership will dictate a need for an increase in the number of
vehicles to continue to provide the high quality service currently provided by WIT.
High mileage trips have increased and will likely to do so as WIT provides
transportation for clients to and from regional health centers and continues to
provide service to Job Corps in Denison. High mileage trips not only generate

PASSENGER TRANSPORTATION PLAN
PAGE 41
more miles (both revenue and non-revenue) but they require additional time
increasing both vehicle and driver hours.
Figure 3.4 illustrates the volume of revenue miles by major trip generators.
0
50,000
100,000
150,000
200,000
250,000
2009 2010 2011 2012 2013
Figure 3.4: Revenue Miles by Trip Generator
New Hope Village
GenesisDevelopment
Human Services
New OpportunitiesInc.
Job Corps
Source: WIT Year End Reports, 2009-2013
Job Corps of Denison generates the largest amount of revenue miles generating
over 245,000 miles in 2013 an increase of almost 60,000 miles from 2012. Job
Corps trips are generally large distances transporting Jobs Corps clients from
across the state as well as to Omaha and Kansas City. Human Services type
trips (DHS and Medicaid transportation) have risen from the 3rd highest revenue
mile generator since 2009 to the second highest in each year since that time.
The Headstart program administered by New Opportunities is also a major
revenue mile generator; although these miles have decreased due to the
decreased in the number of out-of-town routes. Genesis Development saw a
significant increase in the number of revenue miles in 2009 due to an increase in
demand for client services and this growth continues through 2013.

PAGE 42
Operational Costs
WIT generates revenue from a variety of sources and has numerous expenses
related to the operations and administration of the regional public transit system.
Figure 3.5 illustrates the overall operation expenses for WIT and the various
sources of revenue.
Figure 3.5: WITS Revenues and Expenses
$0
$500,000
$1,000,000
$1,500,000
$2,000,000
$2,500,000
2009 2010 2011 2012 2013
Passenger Revenue
Contract Revenue forOperations
Other Revenue forOperations
Local Tax for Operations
FTA for Operations
STA for Operations
Operation Expenses
Source: WIT Year End Reports, 2009-2013 WIT had operational expenses of $1,338,747 in fiscal year 2008 and these costs
grew to $1,936,061 in fiscal year 2013. Operational expenses have increased
from 2009 due primarily due to the high cost of fuel combined with an increase in
the length of trips. To offset operational expenses and leverage federal and state
funding for the system WIT receives, approximately $190,000 in passenger
revenue, $808,000 in contract revenue, $70,000 in other revenue and $60,000
from local governments. These funds leverage $360,000 in STA funds and
$545,000 in FTA funds for operations.

PASSENGER TRANSPORTATION PLAN
PAGE 43
Changes in Services
Challenges for passenger transportation vary greatly in scope and complexity.
Rising fuel prices has WIT staff shifting vehicles around the region to ensure that
the most efficient vehicles are used on every trip possible. Increases in
operational efficiencies enables WIT to maintain affordable rates for clients.
In 2011, a second JobJet vanpool service was established in Denison. This unit
mirrors the original JobJet van service; transporting workers in Denison to Tyson
Foods. In FY 2011, JobJet provided 7,333 rides and traveled 16,527 revenue
miles in the Denison and Crawford County area.
WIT has also established new contract services with East Sac Community
Schools and Denison Community Schools. In East Sac, WIT transports 2
children with special needs. One student is transported to Storm Lake
Community Schools and the other to New Hope Village in Carroll 3 days per
week. In Denison, WIT provides daily transportation to preschool children to the
Denison schools preschool program. This venture builds upon the long standing
relationship between WIT and the Denison Community School District in which
WIT has provided transportation for special needs students for several years.
AnyTime Cab Company was established in Carroll. AnyTime Cab is a private
cab company that operates 24-hours per day, 7-days a week. WIT entered into a
contract with AnyTime Cab allowing them to participate in the Taxi Ticket
program which subsidizes rides for seniors and the disabled in Carroll.
WIT has completed a full year of providing Medicaid transportation under the
administration of TMS. TMS is a new Medicaid brokerage transportation system
which schedules rides for those on Medicaid. Transitioning into the TMS process
originally caused a slight decrease in ridership but currently Medicaid ridership
has returned to previous levels and continues to increase. The TMS system has
been positive for WIT as the TMS process has shifted the responsibility of client

PAGE 44
eligibility verification from WIT staff to TMS. This has eliminated unpaid Medicaid
claims for WIT transportation. TMS has also streamlined the billing and
collection for Medicaid transportation services resulting in an increase in WIT
staff efficiencies.
Education, outreach and public awareness of issues are ongoing but continue to
be improved upon by the Transit Roundtable XII Committee and their continued
efforts for increased coordination and conversations about transit. Funding for
transit operations through State Transit Assistance and Federal Transit
Assistance continues to be a high priority for overall public transit operations.
Operational assistance through the New Freedoms and Job Access Reverse
Commute Program also continues to assist with targeted clientele groups that
are faced with transportation barriers.
Public transit service has seen several changes since Western Iowa Transit
System was formed in 1977. Originally started as a “handi-bus” for the elderly
and disabled; WIT has grown into a key transportation element for schools,
daycares, Headstart, sheltered workshops as well as the general public.
The effort to communicate and market the availability of public transit and
passenger transportation is ongoing. Region XII COG was awarded IDOT
Special Project grant funding to evaluate the value of the WIT brand and logo.
This project is complete as, BlueSpace Creative, the COG’s consultant has
recommended several brand changes and Region XII has opted to shorten the
old Western Iowa Transit System name to Western Iowa Transit. A new logo has
also been developed has been applied to 10 WIT vehicles and was launched in
the winter of 2014.

PASSENGER TRANSPORTATION PLAN
PAGE 45
Passenger Transportation Coordination Efforts
Passenger Transportation Coordination and planning is not new to Region XII
COG or to WIT. Since its inception until 2005, the WIT Transit Advisory
Committee met quarterly to discuss transit issues on a regional basis and the
need for additional services in the local areas. The WIT Transit Advisory
Committee oversaw the development of the Transit Development Planning
process as required by IDOT until the elimination of this requirement in the late
1993. WIT continued this planning process even though it was not required to
help provide better and more forward thinking delivering of service.
On June 1, 2006 over 30 individuals representing numerous transit users, human
service agencies and transportation providers met to discuss issues relating to
transportation services in the region. This Mobility Action Workshop identified
gaps in service, funding issues and other barriers facing the regional transit
infrastructure. Potential solutions were also identified to address these barriers.
This workshop served a kick-off meeting for the development of the Region XII
Coordinated Transit Development Plan and the regional Transit Development
Plan. This meeting was co-hosted by the Iowa Department of Transportation and
the Iowa Transportation Coordination Council as part of the national United We
Ride Campaign.
As part of the Mobility Action Workshop, a new WIT Transit Roundtable XII
Committee (TR XII) was formed to discuss transit coordination and need for
services. This group is made of up transit providers and users from across the
region. The TR XII Committee is charged with the oversight of the Region XII
Coordinated Passenger Transportation Plan as well as ways to increase
coordination and improve service.
Joint Use of Facilities
The Region XII COG facility is a joint use facility. Region XII COG operates WIT
but also a local assistance department and workforce development department

PAGE 46
jointly out of their facility in Carroll. As stated previously, this facility was
constructed in 1994 after Region XII COG spent several years growing in and out
of rented office spaces; with departments being housed in various locations
either jointly or separately.

PASSENGER TRANSPORTATION PLAN
PAGE 47
Section B: School Districts
Location of Services
There are 33 school districts that serve the Region XII COG area; although a
number of these districts do not have facilities within the 6 county area. Map 3.1
illustrates the public school districts in the region.
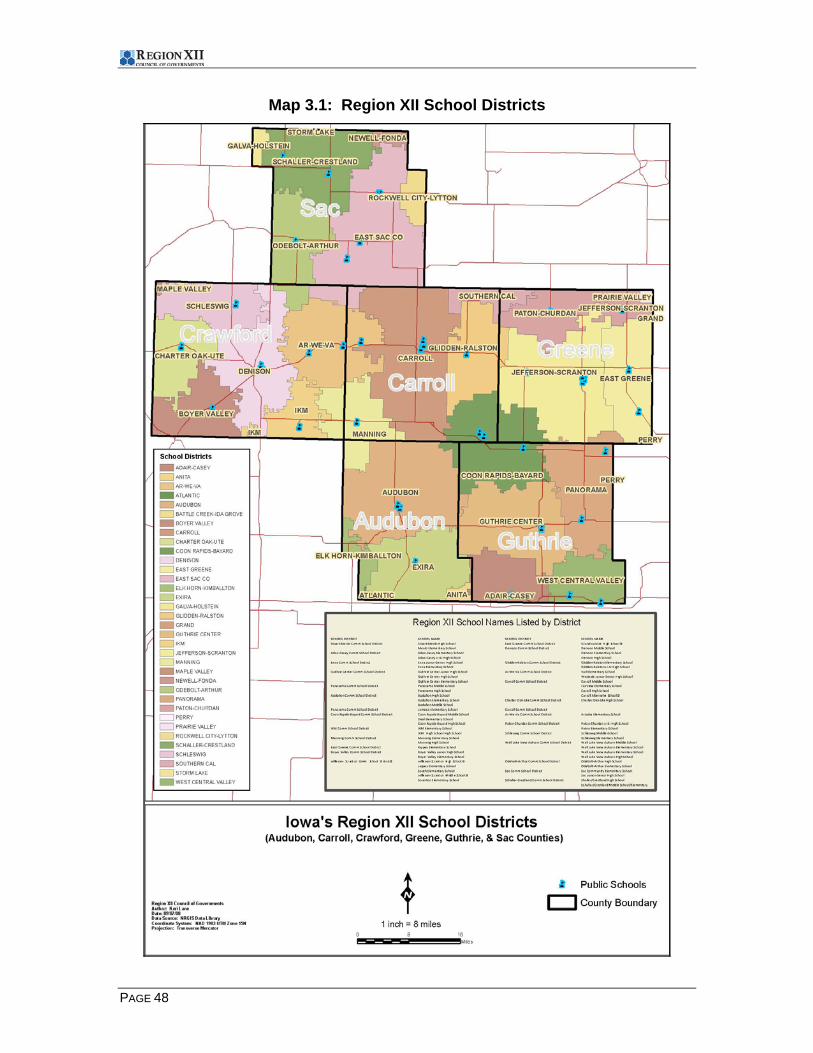
PAGE 48
Map 3.1: Region XII School Districts

PASSENGER TRANSPORTATION PLAN
PAGE 49
Availability
The 33 school districts that serve the Region XII COG area operate 355 buses.
Table 3.2 illustrates the numbers of units that each district operates by
passenger capacity. Each school district in the region was contacted to
determine the number of ADA accessible vehicles. This information is shown
also shown in Table 3.2 for those districts that responded.

PAGE 50
Table 3.2: Number of Units by Passenger Capacity
Passenger Size
District Name 10-12
17 -20
23-30
33 -38
44 -47
53 -59
60 -66
71 -84
ADA Vehicles Total
Adair-Casey 0 0 0 0 0 1 8 0 -* 9
Anita 1 0 1 0 0 6 0 0 -* 8
Ar-We-Va 0 0 1 0 1 4 4 0 1 10
Atlantic 0 0 0 0 1 1 15 0 -* 17
Audubon 0 0 0 0 0 6 2 0 1 8
Boyer Valley 0 1 0 0 1 2 7 2 1 13
Carroll 0 0 0 1 0 1 37 3 4 42
Charter Oak-Ute 0 0 2 0 0 5 1 1 -* 9 Coon Rapids-Bayard 0 0 0 0 0 2 5 0
1 7
Denison 0 0 0 0 0 0 10 9 1 19
East Greene 0 0 1 0 0 0 3 2 -* 6 Elk Horn-Kimballton 0 0 0 0 0 3 4 0
-* 7
Exira 0 0 0 0 0 2 3 0 0 5
Galva-Holstein 0 0 0 0 0 0 9 1 -* 10
Glidden-Ralston 0 0 0 0 0 0 6 0 1 6
Guthrie Center 0 0 0 0 0 2 4 1 1 7
IKM-Manning 0 0 0 0 0 10 8 0 2 18 Jefferson-Scranton 0 0 0 0 0 0 5 8
2 13
Kuemper Catholic 0 0 0 0 0 0 2 0
0 2
Newell-Fonda 0 0 0 0 1 1 5 2 -* 9
Odebolt-Arthur 0 0 0 0 0 5 2 0 -* 7
Panorama 0 0 0 1 0 10 3 1 1 15
Paton-Churdan 0 0 0 0 1 0 3 0 -* 4
Perry 0 1 0 0 0 0 8 8 -* 17
East Sac County 0 0 1 0 1 5 11 0 1 18 Schaller-Crestland 0 0 0 0 0 0 5 4
-* 9
Schleswig 0 0 0 0 1 2 5 0 0 8
Southern Cal 0 0 0 0 0 1 6 2 -* 9
Storm Lake 1 1 0 1 0 0 2 10 -* 15 Wall Lake View Auburn 1 0 0 0 0 2 7 0
-* 10
West Central Valley 0 1 0 0 0 1 14 0
-* 16
Total 3 4 7 3 7 72 205 54 17 355
Source: Iowa Department of Education and School Districts *-Indicates District Did Not Respond
PASSENGER TRANSPORTATION PLAN
PAGE 51
The Carroll Community School District operates the most vehicles with 42;
followed by the Denison School District which operates 19 buses. Conversely,
the Carroll Kuemper School system operates only 2 buses, and the Paton-
Churdan School District operates 4 buses.
Types of Existing Services
School districts provide student transportation to and from school, for activities
and special outings. Iowa school districts are allowed to make vehicles available
for community transportation although it is believed that none are doing so at this
time.
Clients
School bus transportation is established to serve school students and school
staff.
Trips, Mileage and Rides
Table 3.3 illustrates the number of students enrolled in each district, the number
of route miles and the average number of students transported. Parochial school
totals are included in their district of residence.

PAGE 52
Table 3.3: School District Enrollment, Miles and Rides
District Name
Enrollment (less
shared time students) Route Miles
Non-Route Miles
Average Number of Students
Transported
Adair-Casey 343.7 52,170.00 9,816.00 356.10
Anita 287.6 108,052.00 15,869.00 153.00
Ar-We-Va 400.5 85,513.00 20,945.00 361.10
Atlantic 1,491.0 101,194.00 46,538.00 362.60
Audubon 687.00 77,664.00 24,648.00 245.60
Boyer Valley 505.60 57,818.00 75,556.00 223.80
Carroll 1,793.20 310,073.00 99,409.00 2,239.50
Charter Oak-Ute 360.50 59,925.00 23,627.00 250.00
Coon Rapids-Bayard 522.50 59,546.00 19,571.00 174.00
Denison 1,892.10 127,948.00 39,021.00 1,558.40
East Greene 434.00 131,974.00 16,441.00 261.20
Elk Horn-Kimballton 303.00 35,162.00 12,771.00 196.60
Exira 331.40 41,545.00 10,852.00 130.60
Galva-Holstein 528.00 88,027.00 12,649.00 335.00
Glidden-Ralston 386.50 55,963.00 11,405.00 148.00
Guthrie Center 529.30 64,840.00 8,440.00 217.10
IKM 484.20 87,565.00 18,810.00 414.00
Jefferson-Scranton 1,119.70 190,706.00 30,929.00 912.30
Manning 479.00 87,651.00 8,268.00 361.80
Newell-Fonda 504.40 81,359.00 30,068.00 149.00
Odebolt-Arthur 384.70 54,248.00 11,991.00 223.80
Panorama 810.80 107,904.00 15,345.00 631.00
Paton-Churdan 233.60 63,223.00 6,129.00 92.00
Perry 1,836.40 89,301.00 33,316.00 690.90
Rockwell City-Lytton 548.30 101,278.00 7,879.00 255.40
Sac 476.30 44,009.00 19,057.00 207.00
Schaller-Crestland 465.50 89,049.00 22,736.00 210.00
Schleswig 289.30 61,815.00 5,739.00 129.70
Southeast Webster 470.60 144,592.00 58,129.00 286.00
Southern Cal 568.60 82,428.00 19,702.00 341.00
Storm Lake 1,882.70 55,887.00 58,420.00 1,426.80
Wall Lake View Auburn 564.30 88,702.00 22,735.00 307.00
West Central Valley 995.50 127,054.00 34,701.00 829.30
TOTALS & AVERAGES 22,894.90 2,946,379.00 865,579.00 14,661.2
Source: Iowa Department of Education Denison Community Schools has the highest enrollment, with 1,892 students
followed closely by Storm Lake and Perry. Paton-Churdan has the smallest
enrollment with 233 students followed by Schleswig Schools. Carroll Community
School District has the largest number of route miles with just over 310,000

PASSENGER TRANSPORTATION PLAN
PAGE 53
miles; this can be attributed to the size of the district and the high number of in-
town bus routes operated by the district. The Jefferson-Scranton School District
is also large in area. The Elk-Horn Kimballton School has the smallest number of
route miles with slightly over 35,000 miles. The Carroll Community School
District transports an average of 2,239 students while Paton-Churdan transports
92 students on average.
Operational Costs
Table 3.4 compares the cost of transportation for each school district in the
region. The Carroll Community School District has the largest net operational
cost for transportation spending nearly $473,000 although the district has one of
the lowest average cost of per-pupil transported and a below average cost-per-
mile. The Jefferson Scranton School District which spent over $461,000 on
transportation operations and was above average for both the cost per pupil and
average cost per mile. The Paton-Churdan School District had the lowest net
operational costs, spending just under $75,000 and had the lowest average cost
per mile at $1.18 yet had one of the highest average costs per pupil transported.

PAGE 54
Table 3.4: School District Transportation Costs
District Name
Enrollment (less
shared time students)
Net Operation Cost
Average Cost Per
Pupil Transported
Average Cost Per
Pupil Enrolled
Average Cost Per
Mile
District Square Miles
Adair-Casey 346.40 $165,443.64 $469.08 $477.61 $2.97 159
Anita 303.60 $103,301.40 $633.75 $340.25 $1.81 135
Ar-We-Va 417.30 $123,203.80 $363.54 $295.24 $1.94 164
Atlantic 1,440.60 $251,211.97 $698.20 $174.38 $2.45 206
Audubon 687.00 $155,289.10 $632.28 $226.04 $2.00 237
Boyer Valley 505.60 $99,372.63 $444.02 $196.54 $1.71 191
Carroll 1,793.20 $472,915.75 $211.17 $263.73 $1.53 269
Charter Oak-Ute 360.50 $119,476.75 $477.91 $331.42 $2.00 188
Coon Rapids-Bayard 522.50 $123,232.13 $708.23 $235.85 $2.07 183
Denison 1,892.10 $396,349.72 $254.33 $209.48 $3.10 172
East Greene 434.00 $133,533.00 $511.23 $307.68 $1.01 140
Elk Horn-Kimballton 303.00 $87,247.23 $443.78 $287.94 $2.48 84
Exira 331.40 $56,669.49 $433.92 $171.00 $1.36 165
Galva-Holstein 528.00 $145,865.46 $435.42 $276.26 $1.66 171
Glidden-Ralston 386.50 $78,677.03 $531.60 $203.56 $1.41 115
Guthrie Center 529.30 $116,065.15 $534.62 $219.28 $1.79 190
IKM 484.20 $147,589.56 $356.50 $304.81 $1.68 204
Jefferson-Scranton 1,119.70 $461,321.74 $505.67 $412.00 $2.42 248
Manning 479.00 $142,431.83 $393.68 $297.35 $1.63 118
Newell-Fonda 504.40 $162,438.71 $1,090.19 $322.04 $2.00 186
Odebolt-Arthur 384.70 $82,798.51 $369.97 $215.23 $1.53 149
Panorama 810.80 $313,800.57 $497.31 $387.03 $2.91 197
Paton-Churdan 233.60 $74,470.40 $809.46 $318.79 $1.18 125
Perry 1,836.40 $274,687.63 $397.58 $149.58 $3.08 123
Rockwell City-Lytton 548.30 $179,679.75 $703.52 $327.70 $1.77 201
Sac 476.30 $91,183.19 $440.50 $191.44 $2.07 98
Schaller-Crestland 465.50 $172,008.76 $819.09 $369.51 $1.93 165
Schleswig 289.30 $100,676.43 $776.23 $348.00 $1.63 123
Southeast Webster 470.60 $181,361.46 $634.13 $385.38 $1.26 150
Southern Cal 568.60 $168,597.31 $494.42 $296.51 $2.05 231
Storm Lake 1,882.70 $162,623.98 $113.98 $86.38 $2.90 85
Wall Lake View Auburn 564.30 $164,723.19 $536.56 $291.91 $1.86 185
West Central Valley 995.50 $363,679.59 $438.54 $365.32 $2.86 229
TOTALS & AVERAGES 22,894.90 $5,871,926.86 $400.51 $256.47 $1.99 5,586
Source: Iowa Department of Education Passenger Transportation Coordination Efforts
As stated previously, Region XII COG contracts with the Adair-Casey School
District, Denison Community Schools, Jefferson-Scranton School District, Sac
Community Schools, and Southern Cal Schools to provide additional or
specialized transportation services for students with disabilities.

PASSENGER TRANSPORTATION PLAN
PAGE 55
Section C: Elderly Care Facilities
Location of Services
There are a number of elderly care facilities located in the region. Only two
facilities reported owning and operating their own vehicles for client and resident
transportation: Eventide Lutheran Home in Denison and Thomas Rest Haven in
Coon Rapids.
Fleet Availability
Eventide Lutheran Home operates an ADA accessible bus with two wheelchair
positions driven by 2 part-time drivers. Thomas Rest Haven operates a 2005
Ford ADA accessible bus with two wheelchair positions with seating for 12.
Thomas Rest Haven uses 2 part-time drivers to provide service.
Types of Existing Services
Thomas Rest Haven utilizes their vehicle for group activity transportation only.
Eventide utilizes their vehicle for activities and individual appointments.
Fare Structures
Eventide does not charge for rides during business hours Monday through
Friday. After hours service is provide at a rate of $20 minimum plus $0.20 per
mile and $20 per hour. Thomas Rest Haven does not have an established fare
structure.
Clients
Bus usage is restricted to residents of each respective facility.
Trips, Mileage and Rides
Thomas Rest Haven reports that their bus is utilized approximately 2 hours per
week and is driven 6,000 miles per year.

PAGE 56
Passenger Transportation Coordination Efforts
Region XII COG contracts with the following elderly care facilities to provide
individual transportation for appointments as well as for group outings and
events: Carroll Health Center (Carroll), Regency Park Nursing and Rehab
Center of Carroll, Regency Park Nursing and Rehab Center of Jefferson,
Denison Care Center (Denison), Friendship Home (Audubon), Loring Care
Center (Sac City), Panora Nursing and Rehab (Panora), Parkview Care Center
(Sac City), St. Anthony’s Nursing Home (Carroll), Thomas Rest Haven (Coon
Rapids). WIT also provides service to clients at other elderly care facilities on an
as needed basis.
Section D: Facilities Serving People with Disabilities
Several facilities serve people with disabilities in the Region XII COG area
including: Country View Estates, Panora, New Hope Village (Carroll), Howard
Center (Sac City) Genesis Development (Jefferson) and Wesco Industries
(Denison). Region XII COG contracts with each of these agencies to provide
transportation for their clients, although New Hope Village also provides
transportation using their own vehicles and drivers.
New Hope Village
Location of Services
New Hope Village (NHV) is a not-for-profit 501(c)(3) community based
organization in Carroll, Iowa which began offering services to adults with
disabilities in 1977. NHV provides residential services at their main campus in
Carroll as well as individual or small group sites in Carroll, Manning and Glidden.
There are also several individual or small group sites rented directly by the
individual or residing with the family.
NHV also provides occupational services and operates thrift stores in Carroll,
Manning and Coon Rapids. Carroll Enterprise Systems provides a wide variety
of different types of work, including: direct and bulk mailing, packaging and

PASSENGER TRANSPORTATION PLAN
PAGE 57
assembly, car wash detailing, can crushing, shredding confidential documents,
and cleaning video cassette boxes.
Fleet Availability
New Hope Village owns and operates 35 vehicles.
Types of Existing Services
NHV provides transportation for clients to and from residential and works sites as
well as transportation for activities, shopping and medical appointments.
Trips, Mileage and Rides
NHV provides approximately 75,000 rides per year.
Passenger Transportation Coordination Efforts
While NHV owns and operates 35 vehicles of their own; Region XII COG
supplies NHV with 5 ADA accessible buses to provide transportation for NHV
clients. This contractual agreement has been in place since 1980. This
agreement allows NHV to have access to the WIT fleet. NHV employs their own
drivers, pays for vehicle maintenance and fuel and provides the local match for
newly purchased vehicles while WIT counts rides and revenue miles for inclusion
into STA and FTA funding formulas.
Section E: Veteran’s Affairs Transportation
Location of Services
Veteran’s Affairs (VA) offices are located in each county and can assist veterans,
their widows, widowers, wives and minor children with filling out forms to enroll in
VA Healthcare system as well as VA pensions, home loan assistance, education,
and burial benefits. The Carroll and Crawford County Veteran’s Affairs offices
offer transportation or transportation assistance.
Fleet Availability
Carroll County operates a standard mini-van to provide transportation for
veteran’s. This van is owned by the Disabled American Veteran’s organization.

PAGE 58
Crawford County leases a standard mini-van through the U.S. General Services
Administration and the Omaha Veteran’s Administration office. Carroll County
VA utilizes 6 volunteer drivers to provide service. Crawford County VA utilizes 24
volunteer drivers to provide service.
Types of Existing Services
Carroll County VA has provided transportation since August 2001 to qualified
veteran’s in Carroll, Crawford, Greene, Guthrie and Sac Counties as well as to
veteran’s in other neighboring counties. The Carroll VA van typically provides
service to Des Moines and Iowa City.
Crawford County VA provides transportation to the Omaha VA Hospital and VA
offices. Typically the Crawford County VA van operates 5 days per week.
Clients
The veteran must have been discharged from active military service under other
than dishonorable conditions to receive service. Active service means full-time
service as a member of the Army, Navy, Air Force, Marines Coast Guard, or as a
commissioned officer of the Public Health Service, the Environmental Services
Administration or the National Oceanic and Atmospheric Administration. Certain
VA benefits and medical care require wartime service.
Trips, Mileage and Rides
The Carroll County VA transportation service provides an average of 220 rides
per year. Volunteer drivers provide an average of 1,000 hours of service
annually. In 2013, the Crawford County VA provided 650 rides; normally 700
rides are given on an annual basis.

PASSENGER TRANSPORTATION PLAN
PAGE 59
Section F: Charter Bus Service
Location of Services
Windstar Lines began in 1995 and is headquartered in Carroll, Iowa with
terminals in Des Moines and Iowa City. “Windstar Lines has one simple goal in
mind: to provide superior motorcoach service with a strong emphasis on
meticulously clean, late model equipment, with drivers who are safe, friendly, and
above all, accommodating to “our” passenger needs.”1
Fleet Availability
Windstar Lines operates 35 buses and can provide ADA charter service.
Windstar Lines is staffed by 7 full-time administration staff, 9 full-time and 3 part-
time maintenance staff, and 4 full-time drivers and 45 part-time drivers.
Types of Existing Services
Windstar Lines provides charter service throughout the State of Iowa and to all
49 contiguous states and Canada. Windstar Lines provides convention shuttling
for groups in Des Moines, Iowa City, Cedar Rapids, Iowa and Omaha, Nebraska.
Windstar Lines also provides NASCAR tours, fishing tours and casino tours.
Fare Structures
Windstar Lines fares are based on a per-mile, per-hour or per-day rate.
Clients
Windstar customers include tour companies, high schools, colleges, universities,
senior citizen groups, government agencies, bank travel clubs, military,
community organizations, politicians, and sports teams.
Trips, Mileage and Rides
Windstar traveled 1,194,679 revenue miles last fiscal year.
1 www.gowindstar.com, Windstar Lines, 1903 US Hwy 71 North, Carroll, IA 51401, 712-792-4221
PAGE 60
Section F: Taxi-cab Companies
Location of Services
Three private taxi-cab companies currently provide passenger transportation in
the Region XII COG area: All-American Cab (Carroll), Carroll Cab Company
(Carroll) and Diamond Cab (Denison).
Fleet Availability
Each taxi-cab company operates a single non-ADA unit to provide service.
Types of Existing Services
Each taxi-cab provides passenger transportation during various hours throughout
the day and week.
Fare Structures
Cab companies operating in Carroll charge $5 per one way ride. In Denison,
Diamond Cab charges $4 per one way ride.
Trips, Mileage and Rides
Figure 3.7 illustrates the number of elderly rides, revenue miles and vehicle miles
that each company provided during fiscal year 2009-20013. On average the
regional cab companies travel nearly 28,000 revenue miles a year providing over
25,000 elderly and disabled rides per year.
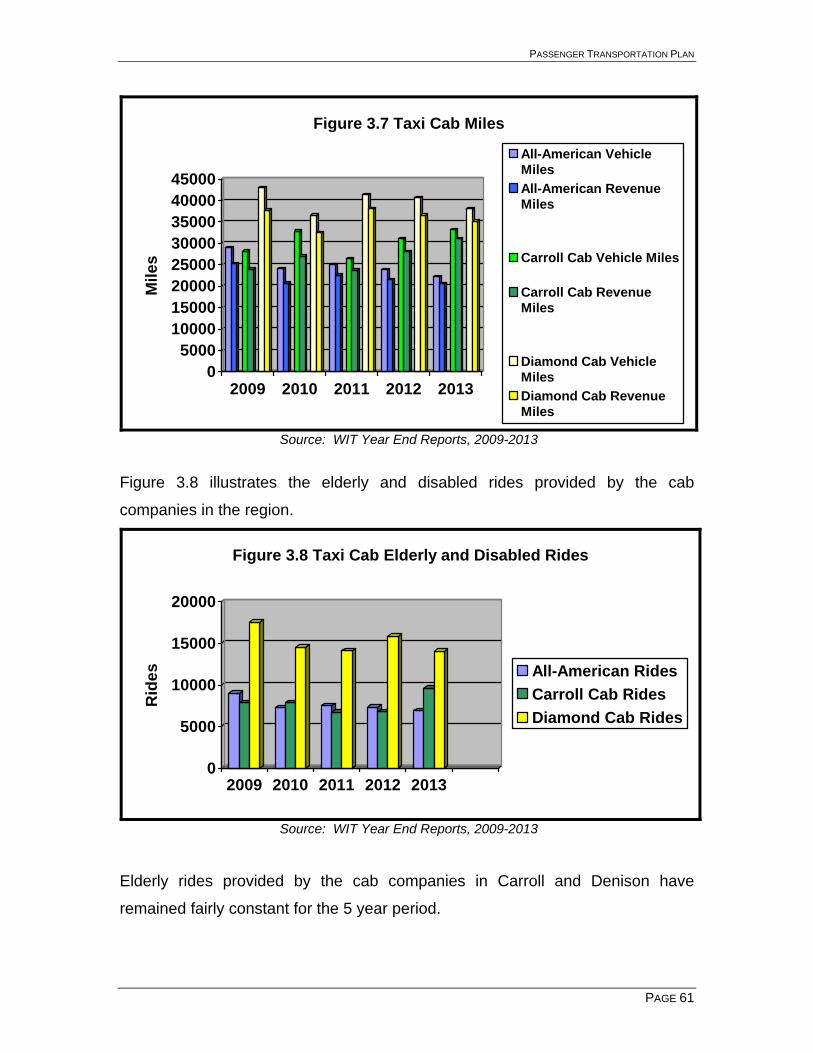
PASSENGER TRANSPORTATION PLAN
PAGE 61
05000
1000015000200002500030000350004000045000
Mil
es
2009 2010 2011 2012 2013
Figure 3.7 Taxi Cab Miles
All-American VehicleMiles
All-American RevenueMiles
Carroll Cab Vehicle Miles
Carroll Cab RevenueMiles
Diamond Cab VehicleMiles
Diamond Cab RevenueMiles
Source: WIT Year End Reports, 2009-2013
Figure 3.8 illustrates the elderly and disabled rides provided by the cab
companies in the region.
0
5000
10000
15000
20000
Rid
es
2009 2010 2011 2012 2013
Figure 3.8 Taxi Cab Elderly and Disabled Rides
All-American Rides
Carroll Cab Rides
Diamond Cab Rides
Source: WIT Year End Reports, 2009-2013
Elderly rides provided by the cab companies in Carroll and Denison have
remained fairly constant for the 5 year period.

PAGE 62
Passenger Transportation Coordination Efforts
Region XII COG works with local cab companies to provide discounted ride
tickets for elderly and disabled riders in the City of Carroll and Denison. This
enables WIT to offer additional rides at a reduced cost and gives passengers
more freedom of choice and flexibility in times for service. This agreement allows
both WIT and the private cabs to provide more service efficiently.
Section G: Manning Community Services
Location of Services
Manning Community Services (MCS) operates within the City of Manning in
southwest Carroll County. MCS provides transportation to the Manning Senior
Center for meals and activities as well as delivering meals to the homebound.
Fleet Availability
MCS operates a 12-passenger 1989 Ford Club Wagon to provide passenger
transportation.
Trips, Mileage and Rides
Figure 3.9 illustrates the rides and miles provided by MCS.
01000200030004000500060007000
2009 2010 2011 2012 2013
Figure 3.9 Manning Community Services Rides and Miles
Rides
Miles
Source: WIT Year End Reports, 2009-2013
MCS provides an average of 5,800 rides per year in the City of Manning while
traveling an average of 1,800 miles per year.

PASSENGER TRANSPORTATION PLAN
PAGE 63
Operational Costs
According to WIT Year End Reports, operating costs for MCS averages $9,750
per year this equates to an average cost per ride of $1.75.
Passenger Transportation Coordination Efforts
With MCS providing senior and disabled rides in Manning, WIT is able to use its
own bus stationed in Manning to provide service in the surrounding communities
for medical and other appointments. This coordination effort allows MCS to
obtain FTA and STA assistance while providing additional rides and miles for
WIT.

PAGE 64
Chapter IV: Passenger Transportation Needs, Goals and Objectives Accomplishments
Section A: Review of Previous Efforts
WIT has accomplished several missions in providing public transit service.
Operations
As stated previously, with the assistance of FTA 5311 funding, State Transit
Assistance funding, local government funding, contract revenue and fares, WIT
provided over 200,000 rides and traveled over 1,100,000 miles.
In cooperation with Job Corps of Denison, Partnerships 4 Families, and Howard
Center, Inc; WIT has provided additional transportation while filling gaps in
transportation for specific user groups to access and maintain jobs.
Denison Job Corps provides vocational and educational training for 300 students
in a residential campus setting. Vocational training in provided to students in the
following areas: Carpentry, Brick Masonry, Business Clerical, Culinary Arts,
Building and Apartment Maintenance, Painting, Welding, Health Occupations and
Unarmed Security Positions. The gap in transportation expense was a major
barrier in preventing Job Corps students from these working educational
experiences. The transportation program has and hopefully continues to,
eliminate this barrier for students needing employment opportunities, as well as
employers needing employees.
Vehicle Replacement
In FY 2014, Region XII is scheduled to replace 4 vehicles through the 5339
Capital Transit Fund. Replacement of vehicles remains a high priority for WIT.
Fleet Maintenance

PASSENGER TRANSPORTATION PLAN
PAGE 65
As stated previously Region XII is currently in process of constructing an addition
to the WIT transit shop and storage area. This addition was needed to provide
adequate space for additional equipment such as a transmission flusher,
refrigerant handling system, tire machine and balancer were purchased to lower
costs associated with out-sourcing vehicle maintenance. The top left photo
illustrates the expanded shop area compared to the previous shop area in the
photo to the right.
Driver Training
The agencies driver training program is on-going and has been expanded in
scope during recent years. Each new driver that is hired receives an extensive
driver training course. This course includes one-on-one instruction by the
operations manager or lead driver in the county as well as training by the service
manager on the characteristics of the vehicle that the drive will be using. Large
group driver training meetings are held at least twice per year to continually
improve the skill levels of the drivers.
Section B: Needs Assessment

PAGE 66
As an annual review of the Region XII Iowa Mobility Action Planning Workshop,
the TRXII committee reviews the identified needs for passenger transportation
service.
Table 4.3 lists the unmet needs and the challenges and potential solutions that
go along with these identified needs.

PASSENGER TRANSPORTATION PLAN
PAGE 67
Table: 4.3: Unmet Needs
Category: After Hours Services Challenges Solutions 1. Drivers often don’t want
evening hours 2. Inflexibility of schedules 3. Demand vs. supply 4. Resources (drivers, vehicles,
are they available?) 5. Cost to provide ride 6. Lack of knowledge / need to
share information (No Clearing House)
7. Insurance/Liability issues 8. Agency policies 9. State / Federal regulations 10. Supporting documentation to
justify need 11. Coordination of medical
appointments 12. Variables out of our control 13. Lack of transit shelters 14. Individualized needs 15. Lack of funding
Widen Job Search o Students o Incentives – shift differential pay o Donate funds/rides to transit providers o Use partner agency drivers o Partner w/ agencies who own vehicles
Create Partnerships with employers & community agencies – explore tax advantages for employers
Public education & coordination of ride needs o Community o Transit Providers o Businesses
Identify / List available drivers & vehicles – Diversify fleet to meet rider needs
Collaborate with other agencies who have the vehicles you need o Ask for businesses for funds or “in Kind”
Publicize o PSA’s o AD’s meetings o Religious Orgs. o Meal Sites o Flyers on buses o 211 o Family caregiver o Libraries o Word of mouth o Share information among agencies o Can someone take the lead in pulling all resources
together?? Public Transit already has coverage
o Volunteers – good Samaritan laws o Legislation changes needed? o Changes to insurance policy / laws
Creatively looking @ funding streams Surveys
o Incentives o Language barriers o Multiple formats o Short
Collaborate with medical providers o Demonstrate benefits o Get testimonials to share w/ potential funders
“We” need to be flexible in our planning o Education & outreach to public/consumers o Customer may need to use alternate transport
Encourage indoor “waiting areas”; Discuss creative options for businesses & employers
Be flexible but recognize that you might not be able to meet their needs. Involve individuals in problem solving.
Advocacy; Fund Raise; Grants; Taxes

PAGE 68
Category: Affordability and Funding Challenges Solutions Lack of Funding Competition for dollars Costs of doing Business Cost to Consumers Unfunded Mandates Regulations/Reporting tied to
funds More Time required for Senior
Rides
Networking Volunteers Private and Corporate Funding New dollars and Areas for dollars Coordination of Trips Company Sponsored Routes/Trips (i.e. Carroll Hy-Vee Route) Maintenance
Category: Availability of Services Challenges Solutions 1. Distance is a problem 2. Few users per trip 3. Cost 4. Timing / Timely 5. Users per area 6. Volunteers 7. Insurance 8. Background of drivers 9. Physical abilities 10. Salaries 11. Coordination 12. Licensing 13. Putting $$ into programs or
marketing 14. Targeting marketing 15. Understanding available
services 16. Language barriers 17. Social skills 18. Connections 19. Paper work – regulations 20. Specialized equipment 21. Available drivers 22. Cost
Combining trips ITS Website E-mail Promoting good design Drivers Ed support Private business support Part time drivers Collaboration Human service coalition Central point for information sharing Brochures +/- Making sure right people are getting the information Driver training / sensitivity Partner with private entities

PASSENGER TRANSPORTATION PLAN
PAGE 69
Category: Drivers Challenges Solutions Education of Whom You Are
Driving Qualified Insurable Honest Dependable Confidential Patience yet Firmness Capable, Safe Driver Physical Conditions (i.e. lifts,
tie-downs) License Requirements Hours Pay Expectations Training
Education and Training Vehicle Equipment Driving People Skills - Sensitivity
Physical – Wellness Program and Info Policies Money Supervision Recruitment
Category: Equipment Needs Challenges Solutions Funding Size Reliable Technology Comfort/Climate/Space Child Restraint Seating
Additional Funding ADA Revisions and Coordination Corporate and Private Funding Regulations Different Size Vehicles
Category: Information and Communication Challenges Solutions Proper Information to Targeted
Population Proper Outlet of Information Public Perception of the Bus Potential Passengers and Use
and Availability and Community Coordination
Networking Ride Information Flexibility
Bus – Good Advertisement Networking Community Education Flyers and Brochures Bigger Phone Number on the Bus Change Colors for Different Service
Category: Volunteers Challenges Solutions Availability Qualified and Capable Insurable Honest Dependable Confidential
Policies Screening Education Training Willingness to Take a Chance
Passenger transportation provider surveys were distributed to agencies through
the region that provide passenger transportation service; including: WIT (as the

PAGE 70
regional public transit agency), taxi-cab companies, care centers and nursing
homes, facilities serving persons with disabilities, and county veteran’s affairs
offices.
Section C: Existing Service Needs
Existing service needs for passenger transportation in the region are diverse in
nature and challenging to address.
Affordability/Funding
The most common need for existing service is affordability and funding.
Transportation is expensive. Why is this service so expensive, whether being
provided by the public or private sector? In recent years, fuel costs have risen
dramatically. Insurance costs continue to rise, which further increase costs.
Vehicle repair, maintenance and replacement cost need to be factored into the
cost equation as each vehicle in an agencies fleet need to be maintained and
eventually replaced.
Conversely, funding for all types of transportation is tight. Increases in FTA and
STA funding have helped offset some of the increases in transit costs but not
fully. High costs and limited funds wind up affecting the most important piece of
the passenger transportation system more, the passenger.
Drivers
Drivers are the crucial element in the transit industry. Given the low
unemployment rates in the region, the pool of potential candidates is limited. All
transit drivers are entrusted with a vehicle and passengers. Safe driving,
congeniality, physical work transporting wheelchair bound riders, and timeliness
are common expectations of transit drivers. These high expectations combined
with licensing requirements, various hours and training requirements make it
difficult to find quality drivers.

PASSENGER TRANSPORTATION PLAN
PAGE 71
Equipment Needs
Quality buses are always in short supply, whether for direct or in-direct service
provided through the leasing of vehicles. The average ADA accessible bus costs
approximately $60,000 depending upon size and equipment. WIT typically runs
its vehicles for 10 years and/or 200,000 miles or more. Depending upon
available funding, WIT purchases an average of 6 new units per year. These
units are placed throughout the region depending upon vehicle and service
needs.
Information/Communication
Marketing and dissemination of information regarding public transit service is
important to educate the public about the availability of service. A common issue
is that public transit is often perceived to be for the old and the individuals with
disabilities only. This has become less problematic with the increase in child and
student transportation being provided, but the perception still exists. The key is
getting the proper information that promotes WIT as a public transit provider for
the region into the hands of the people that can and will utilize the service.
Volunteers
Like paid drivers, volunteers are had to find. Training requirements and a high
level of responsibility make it even harder to find volunteers for transit or for
related activities such as meals on wheels. The Carroll and Crawford County
Veteran’s Affairs offices have been successful at utilizing volunteers to drive their
county VA vans, although they too struggle to find volunteers to cover all
necessary trips.

PAGE 72
Section D: Expanded Service Needs
Expansion of services concentrated on two areas: after hours service and
availability of service.
After Hours Service
Expanded hours of service are deemed a need. Evening and weekend service is
provided on an as needed or as available service by WIT. The taxi-cab
companies typically operate until 5:00 PM during the week and run limited
daytime hours on Saturday and Sunday. For WIT, and most likely the private
taxi-cabs, after hours and evening service is complicated due to the small
number of rides that can be provided combined with the high cost of having a
vehicle and driver available.
Availability of Services
Public transit is available to everyone and WIT has made efforts to promote this
service, although increasing the visibility and marketing of the system is
important. The taxi-cab companies in the region are also low profile and need to
increase their advertising to promote their businesses; neither of the cab
companies in Carroll are listed in the telephone book.
Quality of Life Activities and Needs
Recreational, shopping and social trips are important parts of everyone life and
even more so for those residing in care centers or other facilities. WIT provides
such trips on a weekly basis for the St. Anthony’s Nursing Home on a contract
basis. The Thomas Rest Haven in Coon Rapids purchased an ADA accessible
van just for this type of service, while continuing to contract with WIT for medical
transportation for residents.
Scheduling
WIT is a demand response system that typically needs 24-hour notice to
accommodate appointments. This advance notice is necessary to meet the

PASSENGER TRANSPORTATION PLAN
PAGE 73
needs of daily routes/rides and occasional requests for service. Immediate
service can be provided by the taxi-cab companies. WIT encourages this
practice through the taxi-cab subsidies provided for elderly and individuals with
disabilities taxi ticket program.
Connection to Intercity Bus Network
Burlington Trailways, Greyhound Lines and Jefferson Lines run scheduled bus
service throughout the State, although none through the Region XII area. Other
public transit agencies across the state have partnered with these inter-city bus
services to provide connector service; increasing ridership for both entities. All
three lines have a depot in Des Moines, while Burlington Trailways and Jefferson
Lines and Burlington Trailways have terminals in Ames; both are within close
proximity to the existing Region XII service area and WIT.
Section E: Fleet Needs
The lack of capital replacement funds forces WIT to use existing equipment for a
long term. Typically, WIT uses vehicles for at least 10 years and/or 200,000
miles. These units are designed to have a useful life of 4 years and/or 100,000
miles. WIT maintains the longer useful life of their vehicles to provide service.
WIT plans to replace approximately 6 to 8 vehicles per year depending upon the
availability of federal grant funds and local matching funds.

PAGE 74
Section F: Coordination
Coordination of transit service has always been a high priority for WIT. WIT has
been involved with several transit coordination efforts: Denison Schools,
Denison Job Corps, Howard Center, Partnership 4 Families, New Hope Village,
Southern Cal Schools and taxi-cab companies. These coordination efforts have
been successful, further efforts can and should be pursued. The revival of the
Region XII Transit Advisory Committee, now known as the Transit Roundtable
XII Committee will formulate and promote transit coordination efforts. The
Transit Roundtable XII Committee is comprised of representatives from
Elderbridge Agency on Aging, R.S.V.P., New Hope Village, Genesis
Development (both facilities serving persons with special needs) Partnership 4
Families (Empowerment Agency serving Audubon, Carroll, Greene and Guthrie
Counties), and Region XII COG staff. Membership of the TRXII Committee is
open and new members and transportation interest participation is welcomed.
PASSENGER TRANSPORTATION PLAN
PAGE 75
Chapter V: Financial Resources
Financial resources for the delivery of public transit services come from a variety
of federal, state and local sources.
Statewide Planning Program (Section 5304) - These funds are intended to
support transit planning in addition to what is conducted by the individual MPOs.
This program supports transit activities in rural areas and communities with less
than 50,000 population.
Non-urbanized Area Formula Program (Section 5311) - This federal program
supports transit activities in rural areas and communities with less than 50,000
population. These funds are allocated to Iowa based on the number of persons
living outside urbanized areas compared to other states.
Transit Capital Program (Section 5339) - This federal program supports transit
activities in rural areas and communities with capital bus replacement needs
through the Iowa Para-Transit Management System.
INDIVIDUALS WITH DISABILITIESIowa Clean Air Attainment Program
(ICAAP) –This program is one of the five core funding programs of the Federal
Highway Administration (FHWA) that can be flexed between highway, transit or
bicycle/pedestrian uses. Because Iowa does not have any area in violation of
transportation-related federal clean air standards, the state receives a minimum
allocation of CMAQ funding that can be used anywhere in the state for any
purpose for which STP funds can be used on the same 80% federal, 20% non-
federal basis.
Surface Transportation Projects (STP) - This is another of FHWA's core
programs. These funds come to the state based on a number of factors including
vehicle miles of travel, highway lane miles and the number and size of bridges.

PAGE 76
The funds can be used for roadway, transit capital projects, pedestrian/bikeway
projects, or intermodal planning projects on an 80% federal, 20% local basis.
The State of Iowa currently offers 6 programs providing financial assistance to
public transit systems.
State Transit Assistance (STA) - All public transit systems are eligible for
funding under the STA program. Since 1984, STA funding has been derived
from a dedicated portion (currently1/20th) of the first four cents of the state “use
tax” imposed on the sale of motor vehicles and accessory equipment. STA funds
are provided to support public transit services and may be used for either
operating or capital projects.
STA Special Projects - Up to $300,000 of the total STA funds are set aside to
fund special projects. These can include grants to individual systems to support
transit services which are developed in conjunction with human service agencies,
or statewide projects to improve public transit.
Coordination Special Projects are intended to assist with start-up of new
services that have been identified as needs by health, employment or human
service agencies participating in the Passenger Transportation Planning process.
Public Transit Infrastructure Grants –The Iowa Legislature established a new
program to fund some of the vertical infrastructure needs of Iowa’s transit
systems in 2006.
Local Funding
The majority of transit funding comes from local sources, particularly for
operating. Local funding typically includes passenger revenue/fees, contract
revenue and local taxes.
General Fund Tax Levy - Typically, local government support for transit services
is derived from general fund revenues

PASSENGER TRANSPORTATION PLAN
PAGE 77
Municipal Transit Levy – Iowa law authorizes municipalities to levy up to 95
cents per $1,000 assessed valuation to support the cost of a public transit
system. Of the 55 cities in the Region XII COG service area, only the City of
Denison has implemented a municipal transit levy to support public transit
services. In fiscal year 2013, the City of Denison levied $0.095 per $1,000
assess valuation which generated $12,500 to assist with public transit services.
As municipal budgets become more fiscally challenging, the municipal transit
levy is a tool that is available to assist local governments with funding public
transit while utilizing more of their municipal general fund dollars for city specific
projects and operations.

PAGE 78
Chapter VI: Goals and Implementation Goal: Increase Awareness of Public Transit
Action: Continue to promote and market the public transit system.
Marketing WIT has been an ongoing effort. Marketing efforts have included:
brochures, Region XII COG newsletter articles, community visits, community
service meeting presentations, newspaper ads, yellow page listings and the
internet. Arguably, some of these efforts have proven more fruitful than others.
But the need for continued marketing and promotion of the system continues.
Partners and Resources: Region XII COG staff (newsletter and website),
TRXII Committee, IDOT, IPTA, RSVP, local media, community service
organizations, health and human services organizations and providers.
Recommendations: Continue to work with the TRXII Committee members to
promoted and market public transit services through brochures, site visits to
chamber groups, community groups and senior centers.
Action: Communication
The best made plans are bound to fail if they are not communicated; this is true
for marketing as well. WIT needs to communicate the availability of the public
transit service to the public who need it. Generally, these people are the elderly
and those with special needs, but others can utilize and benefit from the system.
These groups or organizations may include: care centers, schools, congregate
meal sites, major employers or major retailers. While the message may be clear,
the message needs to be delivered to the proper potential user groups.
Partners: Region XII COG staff, TRXII Committee, local media, community
service organizations, health and human services organizations and providers.
Recommendations: Work with the TRXII Committee members and WIT staff to
develop printed material and low proficient English brochures to promote the use
of public transit to all citizens.

PASSENGER TRANSPORTATION PLAN
PAGE 79
Goal: Affordable Passenger Transit Service and Funding
Action: Educate Financial Partners about the Need for Adequate Funding
for Passenger Transit Service
Funding is critical for adequate delivery of passenger transportation services;
whether this service is provided by public transit or through another provider.
Education of legislators regarding the importance of passenger transportation is
the key.
Partners and Resources: IDOT, IPTA, Federal and State Legislators, County
and City Governments, Elderbridge Agency on Aging and United Way.
Recommendations: Work with federal and state legislative groups to promote
the awareness of funding for public transit.
Action: Increase Efficiency
Increased efficiency may not save money, but it may allow for better delivery of
service. Combining trips both internally and working to develop a system that will
allow for the combination of trips externally will improve efficiency and
coordination.
Partners and Resources: Region XII COG staff, IDOT, TRXII Committee, and
passenger transportation providers.
Recommendations: Coordinate trips and rides internally and with outside
organizations where possible.
Goal: Retain and Recruit Quality Drivers
Action: Retain Quality Drivers
Safe, honest, dependable and insurable drivers are at times difficult to find and
retain. Financial incentives, benefits and flexibility are all pieces of compensation
packages that will assist in the recruitment and retention of drivers. Driver
training programs and education are ongoing and should be combined with other
agencies when at all possible. These efforts will provide for better and more
efficient training.

PAGE 80
Partners and Resources: Region XII COG, IDOT, School Districts, and
transportation providers.
Recommendations: Continue to hire and retain quality drivers.
Action: Develop a Volunteer Driver Program
Training, licensing, time requirements, insurance, liability and a high level of
responsibility make it difficult to find volunteers for transit. The Carroll and
Crawford County Veteran’s Affairs offices have been successful at utilizing
volunteers. These drivers, and others, should try to be incorporated into the WIT
driver pool.
Goal: Provide Additional After Hours Service
Action: Evaluate the Need for Expanded Taxi-cab hours
Action: Evaluate the Need for Expand Public Transit after Hours Service
Expanded hours of service are deemed a need although some user surveys to
do not indicate that this need is high. Evening and weekend service is provided
on an as needed or as available service by WIT. The taxi-cab companies
typically operate until 5:00 PM during the week and run limited daytime hours on
Saturday and Sunday. For WIT, and most likely the private taxi-cabs, after hours
and evening service is complicated due to the small number of rides that can be
provided combined with the high cost of having a vehicle and driver available.
Partners and Resources: Region XII COG, IDOT, School Districts, and
transportation providers.
Recommendations: Pursue additional hours of service and quality of life trips in
communities throughout the region. Apply for National Senior Community
Transportation Funding for new service.

PASSENGER TRANSPORTATION PLAN
PAGE 81
Goal: Increase Availability of Services
Action: Develop Connection to Intercity Bus Network
Burlington Trailways, Greyhound Lines and Jefferson Lines run scheduled bus
service throughout the State, although none through the Region XII area. Other
public transit agencies across the state have partnered with these inter-city bus
services to provide connector service; increasing ridership for both entities. All
three lines have a depot in Des Moines, while Burlington Trailways and Jefferson
Lines have terminals in Ames; both are within close proximity to the existing
Region XII service area and WIT.
Partners and Resources: Region XII COG and intercity bus companies.
Recommendations: Pursue additional hours of service and quality of life trips in
communities throughout the region. Apply for National Senior Community
Transportation Funding for new service as well as New Freedoms funding
Action: Explore Quality of Life Shopping Route in Various Communities
Recreational, shopping and social trips are important parts of everyone life and
even more so for those residing in elderly care centers or other facilities. WIT
currently runs a Hy-Vee route in Carroll on a weekly basis and providing rides
from various senior housing and apartment complexes to Hy-Vee for shopping
and pharmacy needs. Hy-Vee subsidizes the route to encourage shopping at
their store which retained customers after their store relocation some years ago.
This route or service could be duplicated in other communities such as Jefferson
or Sac City where there are senior housing and apartment complexes that are
some distance from the local grocery store in each community.
In November 2007, Region XII COG applied for grant funding from the National
Center on Senior Transportation for operational assistance, marketing assistance
and promotion of quality of life trips and services throughout the region. This
application was not funded but Region XII staff continues to look for outside
funding to establish this type of service that would establish grocery and
shopping routes in each of the larger communities in the area on a weekly basis.

PAGE 82
Partners and Resources: Region XII COG, senior housing complexes, National
Center on Senior Transportation, and local retailers.
Recommendations: Pursue additional hours of service and quality of life trips in
communities throughout the region. Apply for National Senior Community
Transportation Funding for new service
Action: Investigate the interest in a regional van-pool commuter program
In the Spring of 2008, Region XII COG was awarded an Iowa Clean Air
Attainment Program grant to establish a commuter van pool in the region. This
program, known as JobJet, is the first rural commuter van pool program in the
State of Iowa. JobJet is currently operating two van-pools in Crawford County.
Commuter travel has increased as workers are willing to travel longer distances
to find quality jobs. Large multi-shift employers such as Pella Corporation,
Tyson, Farmland, and Farner Bocken draw employees from outside their local
community or county. These commuters will benefit from a rural commuter van
pool by providing cost savings for individual commuter trip, reduce emissions
from multiple vehicles trips, while providing rides and revenue for WIT.
Partners and Resources: Region XII COG, ICAAP and large employers.
Recommendations: Continue to recruit and promote the JobJet program with
local industries, economic development organizations and Workforce
Development to ensure its success.
Goal: Provide Quality Public Transit Operation through Region
XII COG/WIT
Action: WIT mission is to provide safe, dependable, and efficient public transit
services for all citizens within its service area in a manner that will help them
maintain and improve their quality of life.
Partners and Resources: Region XII COG, FTA, IDOT/FTA, local funds,
private funds and contract revenue.
Estimated Cost: $1,900,000

PASSENGER TRANSPORTATION PLAN
PAGE 83
Table 5.1: WIT Operational Budget 2015-2018 Service Fund Type 2015
Project Cost
2015 Fund Amount
2016 Project Cost
2016 Fund Amount
2017 Project Cost
2017 Fund Amount
2018 Project Cost
2018 Fund Amount
2019 Project Cost
2019 Fund Amount
Operations/ Maintenance/ Administration
5311 $1,640,300 $339,475 $1,650,000 $367,256 $1,700,000 $388,020 $1,710,000 $407,421 $1,720,000 $410,000
Operations/ Maintenance/ Administration
STA $330,075 $332,000 $334,000 $336,000 $336,000
Operations/ Maintenance/ Administration
Local $46,000 $46,000 $46,000 $46,000 $46,000
Operations/ Maintenance/ Administration
Contract $716,000 $716,000 $716,000 $716,000 $716,000
Operations/ Maintenance/ Administration
Elderbridge $38,000 $38,000 $38,000 $38,000 $38,000
Operations/ Maintenance/ Administration
Fares/ Donations
$166,000 $166,000 $166,000 $166,000 $166,000
Operations/ Maintenance/ Administration
United Way
$4,500 $4,500 $4,500 $4,500 $4,500

PAGE 84
Goal: Upgrade and Maintain Region XII COG/WIT Fleet
Action: WIT plans to replace approximately 3 to 6 vehicles per year. Depending
upon the availability of federal grant funds and local matching funds, 3 to 4
vehicles are normally replaced per year.
Table 5.2: WIT Short Term Capital Improvement Plan
Vehicle # Project
Federal Fund Type
Type of
Work
Estimated Total
Project Cost
Estimated Federal
Aid
9905 One 158" LDB, ADA, Surveillance 5339
Rep $70.500 $58.515
9706 One 158" LDB, ADA, Surveillance
5339 Rep
$70.500 $58.515
9707 One 158" LDB, ADA, Surveillance
5339 Rep
$70.500 $58.515
9910 One 176" LDB, ADA, Surveillance
5339 Rep
$75.500 $62.665
0506 ADA, Mini-van
5339 Rep
$42.000 $34.860
0507 Non-ADA Mini Van
5339 Rep
$29.000 $24.070
0304 One 158" LDB, ADA, Surveillance
5339 Rep
$70.500 $58.515
0305 One 158" LDB, ADA, Surveillance
5339 Rep
$70.500 $58.515
0506 Non-ADA Mini Van STP Rep
$29.000 $24.070
0507 Non-ADA Mini Van STP Rep
$29.000 $24.070
Goal: Service and Maintain the WIT Fleet Action: Building and Preventive Capital Equipment
Building and Preventive Capital Equipment needs continue to existing whether
these be major shop equipment such as a tire machine, transmission flusher or
welder or radio equipment; these purchases assist WIT maintain their existing
fleet and the existing facility.
Partners and Resources: Region XII COG and FTA
Estimated Cost: $45,000 ($37,719 FTA)

PASSENGER TRANSPORTATION PLAN
PAGE 85
Goal: Increase Passenger Transportation Coordination
Action: Coordination of transit service has always been a high priority for WIT.
WIT has been involved with several transit coordination efforts with: Denison
Schools, Denison Job Corps, Howard Center, Partnership 4 Families New Hope
Village, Southern Cal Schools and taxi-cab companies. These coordination
efforts have been successful, further efforts can and should be pursued. The
revival of the Region XII Transit Advisory Committee, now known as the Transit
Roundtable XII Committee will formulate and promote transit coordination efforts.
Partners and Resources: Region XII COG and Transit Roundtable XII
Committee
Estimated Cost: $30,000 ($20,000 FTA 5311, $4,000 IDOT SPR Funds and
$6,000 local match)
Action: Full utilization of vehicles would increase efficiency in passenger
transportation. Capital vehicle purchases are extremely expensive and these
units need to be utilized as much as possible. Buses and vans at elderly care
facilities, workshops, or Veteran’s Affair’s vans that provide less than a few rides
per week or travel less than a few thousand miles a month or year seem
inefficient. Coordination or management of these units by WIT would increase
the utilization of these vehicles, provide increased transportation coordination
and likely reduce costs.
Partners and Resources: WIT, Elderly Care facilities, and Veteran’s Affairs
Departments

Region XII Council of Governments, Inc. EXECUTIVE BOARD MINUTES
JUNE 12, 2014 Region XII COG Board Room, Carroll, IA
The meeting was called to order at 12:30 p.m. Board members present were Skoog, Drake, Danzer, and Caraher. Drake moved to approve the minutes of the May 15, 2014 meeting. Skoog seconded. Motion carried. Danzer asked the board if any members had a conflict or interest in regards to the agenda items. There were none reported. Vouchers for approval: 4M Auto Repair-28.00, Abila-2,475.00, Advanced Laser Technologies-244.85, All American Cab-1,165.00, Anytime Cab-4,485.00, Arnold Motor Supply-671.30, Audubon Co Advocate Journal-29.36, Bauer Built-37.20, Bee & Herald Publishing-27.01, Binkley Const-21,616.00, Bluespace Creative-3,233.25, Bob's Const-10,910.00, Bruner Bruner & Reinhart-53.75, BTC-481.45, Cadwell, Sophia & Trust Acct-1,349.74, Carroll Area Development Corp-9.50, Carroll Cab-2,715.00, Carroll Cleaning Supply-78.00, Casey's-564.95, Century Link-48.75, Char-Mac of Manning LLC-150,000.00, Computer Concepts IA-1,116.64, Connerley Const-32,820.00, Counsel Office & Document-250.43, Crawford Co Home Health-222.04, Crawford Co Recorder-7.00, Deist, Duane-32.48, Denison Bulletin/Review-310.76, Dept Ed-120.00, Diamond Taxi-3,104.00, Don's Ace Hardware-21.98, Drees Htg & Plbg-840.00, Dynamic Interface Systems-3,800.00, Engraph Software-18,500.00, Equifax Info Serv-167.94, FexSteve Limited Co-6,090.00, First United Methodist Church-190.00, Flynn, Shawn/Melissa-51.35, Frontier-189.51, Glidden Graphic-31.42, Godbersen, Joan-39.20, Graham Tire-29.45, Great-Dain Htg-2,444.00, Greene Co Med Ctr-33.00, Gus Automotive-20.00, Hanson Directory Serv-396.00, IA Workforce Development-1,437.46, Illinois Mutual Life-16.50, IMWCA-4,242.00, INRCOG-272.06, J&K Contracting-3,544.00, Jacobsen, Becky-33.60, Jefferson Telephone-145.80, Jefferson, City-45.25, Johnston Autostores-607.26, Kasperbauer Cleaners-86.32, Lemke Repair-3,350.00, Lidderdale Country Store-209.00, Manning Comm Serv Inc-2,019.75, McAtee Tire & Serv Ctr-93.14, Medicare Blue Rx-83.80, Metlife-290.65, Mohr Const-6,423.00, New Opportunities-4,550.00, Noll Collection Serv Inc-1,178.37, Ober, Jim-22.40, Olson Electric Plbg Htg-9,000.00, Ortner Const-14,710.00, Panora Oil Co-20.00, Performance Tire & Serv-42.95, Phil's Lawn & Landscaping-240.00, Pitney Bowes-562.00, Racom-2,331.64, Ray's Refuse-63.00, Richardson, Guy-33.60, Safelite Fulfillment-290.89, Sapp Bros Petroleum-266.00, Shell Fleet-585.75, Skoog, Eric-30.24, Smalley, Peggy-30.24, Stone Printing & Office Prod-1,373.23, Stuart Herald-63.18, Thomas Bus Sales-3,239.14, Tunning Lawn Care-885.00, Unitypoint Clinic-292.00, Wex Bank-43,224.68, Wittrock Motor Co-162.00, Zee Medical-100.20. Drake moved to approve payment of the vouchers as presented. Skoog seconded. Motion carried. FY2015 Budget was reviewed and discussed. Caraher moved and Skoog seconded to approve the budget as presented. Motion carried. FY2015-FY2019 Passenger Transportation Plan (PTP) was reviewed and discussed. Caraher moved to approve the PTP as presented. Drake seconded. Motion carried. Reports for each department were given. Drake moved and Caraher seconded to adjourn meeting. Motion carried. ___________________________________________________ Secretary
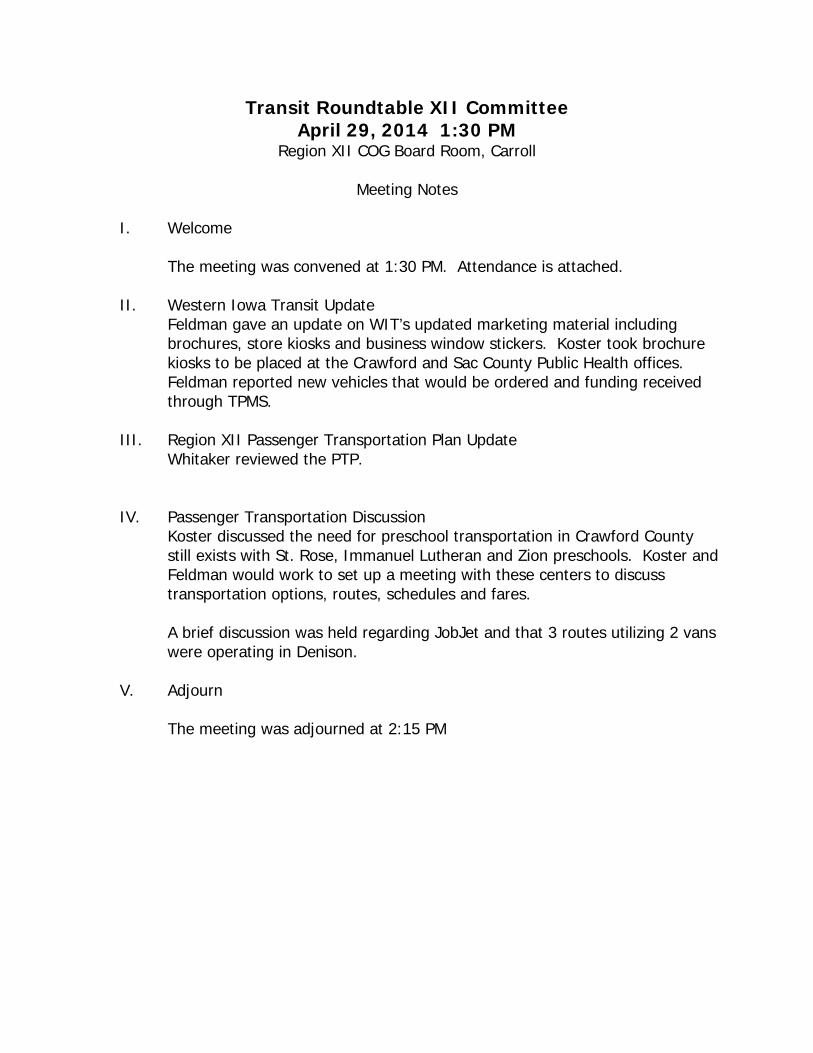
Transit Roundtable XII Committee April 29, 2014 1:30 PM
Region XII COG Board Room, Carroll
Meeting Notes
I. Welcome The meeting was convened at 1:30 PM. Attendance is attached.
II. Western Iowa Transit Update
Feldman gave an update on WIT’s updated marketing material including brochures, store kiosks and business window stickers. Koster took brochure kiosks to be placed at the Crawford and Sac County Public Health offices. Feldman reported new vehicles that would be ordered and funding received through TPMS.
III. Region XII Passenger Transportation Plan Update Whitaker reviewed the PTP.
IV. Passenger Transportation Discussion Koster discussed the need for preschool transportation in Crawford County still exists with St. Rose, Immanuel Lutheran and Zion preschools. Koster and Feldman would work to set up a meeting with these centers to discuss transportation options, routes, schedules and fares. A brief discussion was held regarding JobJet and that 3 routes utilizing 2 vans were operating in Denison.
V. Adjourn
The meeting was adjourned at 2:15 PM


Transit Roundtable XII Committee April 15, 2014 1:00 PM
Region XII COG, Carroll
Meeting Notes
I. Welcome The meeting was convened at 1:00 PM. Attendance: Tom Feldman, Western Iowa Transit Director and Becky Sporrer, Elderbridge Agency on Aging.
II. Feldman outlined the services provided by WIT and the importance of Elderbridge’s funding to assist with senior transportation.
Sporrer review Region XII/WIT’s request for funding, contract and program requirements.
III. Adjourn
The meeting was adjourned at 2:00 PM

Transit Roundtable XII Committee January 22, 2014 10:00 AM Region XII COG Board Room, Carroll
Meeting Notes
I. Welcome
The meeting was convened at 10:00 AM. Attendance is attached.
II. Region XII Passenger Transportation Plan Update
Whitaker reviewed the requirements for the PTP update. The committee discussed passenger transportation needs and barriers.
III. Western Iowa Transit Update Feldman gave an update on WIT’s services. Feldman reported on the updated name, logo and branding efforts for WIT. The new vehicle graphics and logo were discussed. Feldman reported upcoming marketing materials, store kiosks and advertising efforts.
IV. Other a. It was noted the Kim Barker had retired from Elderbridge. b. Duhrkopf discussed the family and child transportation in Manning that
was provided for pre-k during the mid-day. c. Steinkamp discussed the need at New Hope Village for after hours service
which is very difficult to provide for a single client. d. Discussion was held regarding the possibility for shopping routes in
Jefferson and in Denison.
V. Adjourn
The meeting was adjourned at 11:00 AM


Transit Roundtable XII Committee December 11, 2013 10:00 AM
Region XII COG Board Room, Carroll
Meeting Notes
I. Welcome The meeting was convened at 10:00 AM. Attendance is attached.
II. Region XII Fleet Needs Discussion
Fleet needs were discussed. Region XII COG staff facilitated a discussion and update of the WIT 5 year capital improvement plan.
III. TRXII Committee Transportation Discussion Due to the lack of attendance from outside of Region XII and WIT, this discussion was tabled.
IV. Adjourn
The meeting was adjourned at 11:00 AM


![LUANN REIS E SILVA ESTUDO DA CONFIABILIDADE DA ......Reis e Silva, Luann . €€€€€Estudo da confiabilidade da manutenção aplicada a tratores de esteira [manuscrito]: o caso](https://img.pdfslide.net/doc/110x75/6102e61f1e64745d165b28ba/luann-reis-e-silva-estudo-da-confiabilidade-da-reis-e-silva-luann-aaaaaestudo.jpg)


![Panora de riesgos_con_animacion1[1][1]](https://img.pdfslide.net/doc/110x75/54944b9cb47959cf7d8b461f/panora-de-riesgosconanimacion111.jpg)