Embed Size (px)
Citation preview
ADSORPTION STUDIES ON EVAPORATED METAL FILMS.
THESISsubmitted for the degree of
DOCTOR OF PHILOSOPHY of the
UNIVERSITY OF GLASGOW "by
Margaret H. Sheridan, B.Sc.
December, 1966.
ProQuest Number: 11011802
All rights reserved
INFORMATION TO ALL USERS The quality of this reproduction is dependent upon the quality of the copy submitted.
In the unlikely event that the author did not send a com p le te manuscript and there are missing pages, these will be noted. Also, if material had to be removed,
a note will indicate the deletion.
uestProQuest 11011802
Published by ProQuest LLC(2018). Copyright of the Dissertation is held by the Author.
All rights reserved.This work is protected against unauthorized copying under Title 17, United States C ode
Microform Edition © ProQuest LLC.
ProQuest LLC.789 East Eisenhower Parkway
P.O. Box 1346 Ann Arbor, Ml 48106- 1346
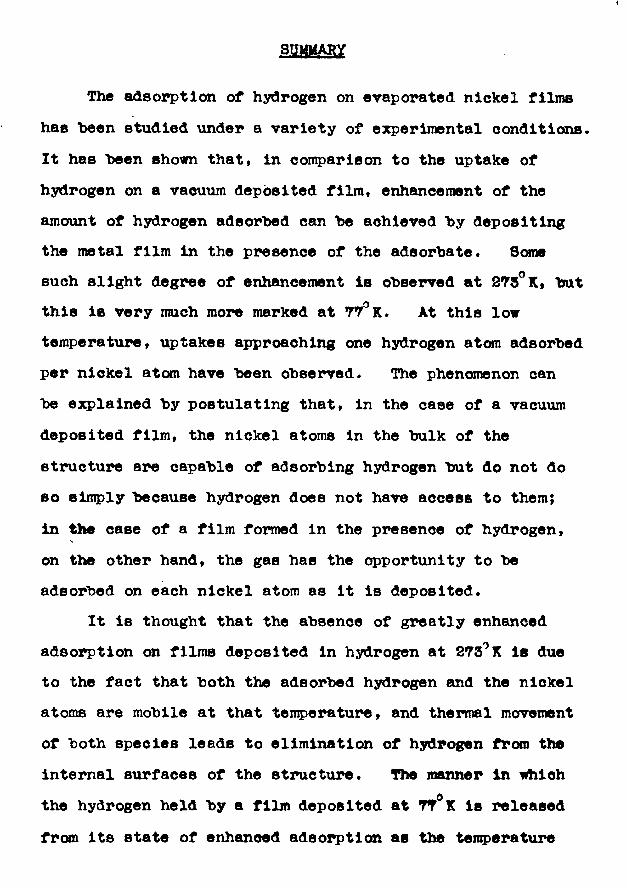
SSMM&BXThe adsorption of hydrogen on evaporated nickel films
has been studied under a variety of ea^erimental conditions. It has been shown that, in comparison to the uptake of hydrogen on a vacuum deposited film, enhancement of the amount of hydrogen adsorbed can be achieved by depositing the metal film in the presence of the adsorbate. Some such slight degree of enhancement is observed at 273° K, but thiB is very much more marked at 77°K. At this lowtemperature, uptakes approaching one hydrogen atom adsorbed per nickel atom have been observed. The phenomenon can be explained by postulating that, in the case of a vacuum deposited film, the nickel atoms in the bulk of the structure are capable of adsorbing hydrogen but do not do so simply because hydrogen does not have access to them; in the case of a film formed in the presence of hydrogen, on the other hand, the gas has the opportunity to be adsorbed on each nickel atom as it is deposited.
It is thought that the absence of greatly enhanced adsorption on films deposited in hydrogen at 273° K is due to the fact that both the adsorbed hydrogen and the nickel atoms are mobile at that temperature, and thermal movement of both species leads to elimination of hydrogen from the internal surfaces of the structure. The manner in which
othe hydrogen held by a film deposited at 77 K is released from its Btate of enhanced adsorption as the temperature
" •2"
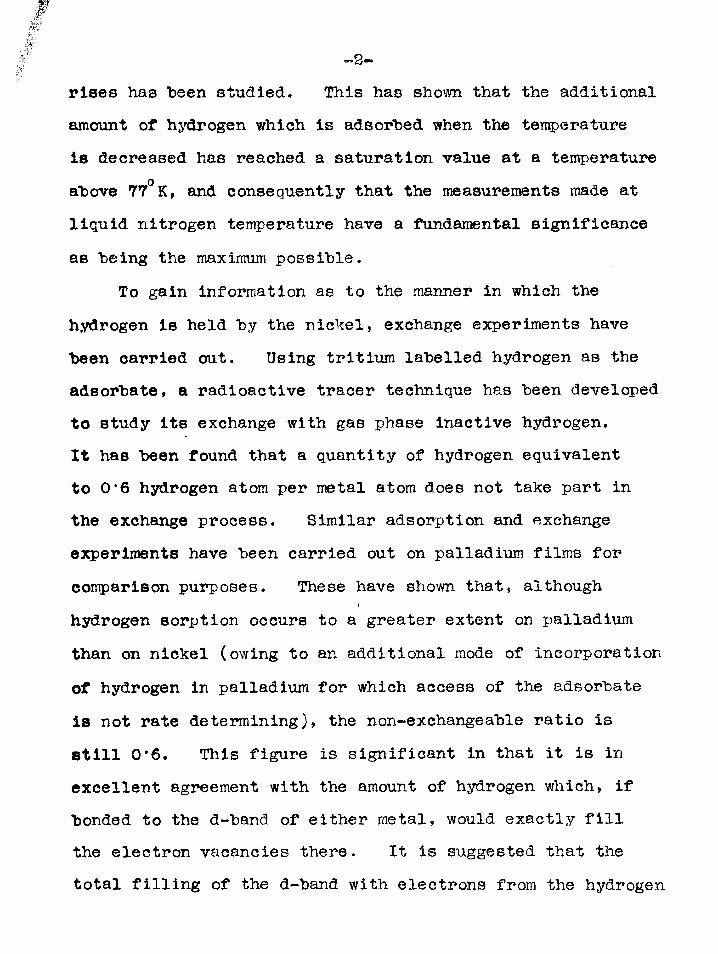
rises has been studied. This has shown that the additional amount of hydrogen which is adsorbed when the temperature is decreased has reached a saturation value at a temperature above 77° K, and consequently that the measurements made at liquid nitrogen temperature have a fundamental significance
as being the maximum possible.To gain information as to the manner in which the
hydrogen is held by the nickel, exchange experiments have been carried out. Using tritium labelled hydrogen as the adsorbate, a radioactive tracer technique has been developed to study its exchange with gas phase inactive hydrogen.It has been found that a quantity of hydrogen equivalent to 0*6 hydrogen atom per metal atom does not take part in the exchange process. Similar adsorption and exchange experiments have been carried out on palladium films for comparison purposes. These have shown that, although hydrogen sorption occurs to a greater extent on palladium than on nickel (owing to an additional mode of incorporation of hydrogen in palladium for which access of the adsorbate is not rate determining), the non-exchangeable ratio is still 0*6. This figure is significant in that it is in excellent agreement with the amount of hydrogen which, if bonded to the d-band of either metal, would exactly fill the electron vacancies there. It is suggested that the total filling of the d-band with electrons from the hydrogen
in this way results in the absence of a type C chemlsorbed component to act as an intermediate in exchange.
The extent of the present work has not enabled any definite conclusions to be drawn as to the manner in which the exchangeable hydrogen is held by the metal, but experimental observations have led to the elimination of certain possibilities (i.e. physical adsorption and type C ohemlsorption to the d-band) as being unlikely.
ACKNOWLEDGMENTS
I have pleasure in recording my grateful thanks to my supervisor, Dr. K.C. Campbell, for suggesting the research problem and for the helpful advice and encouragement which he willingly afforded to me throughout the work covered by this thesis.
I am also grateful to Dr. G.K.L. Cranstoun who constructed the adsorption apparatus which was adapted for the purposes of the investigation.
I also record my sincere thanks to Messrs. Lumsden and Mackintosh for their valuable help in the design and construction of the high frequency induction heater.
Finally, I acknowledge with gratitude the receipt of a maintenance grant from the University of Glasgow while I was engaged on this work.
Margaret H. Sheridan.
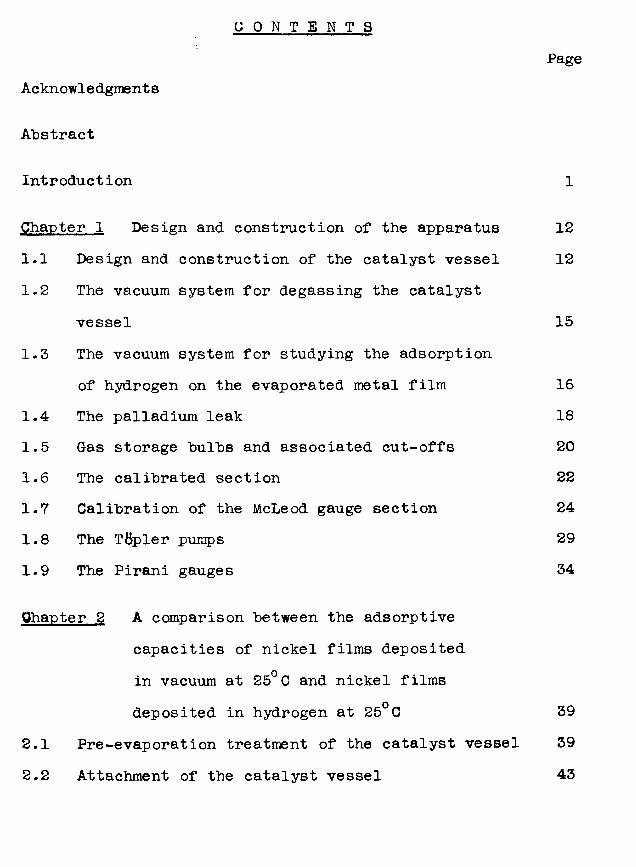
C O N T E N T SPage
Acknowledgments
Abstract
Introduction 1
Chanter 1 Design and construction of the apparatus 121.1 Design and construction of the catalyst vessel 121.2 The vacuum system for degassing the catalyst
vessel 151.3 The vacuum system for studying the adsorption
of hydrogen on the evaporated metal film 161.4 The palladium leak 181.5 Gas storage bulbs and associated cut-offs 201.6 The calibrated section 221.7 Calibration of the McLeod gauge section 241.8 The Tttpler pumps 291.9 The Pirani gauges 34
Qhanter 2 A comparison between the adsorptive capacities of nickel films deposited in vacuum at 25°C and nickel films deposited in hydrogen at 25°C 39
2.1 Pre-evaporation treatment of the catalyst vessel 392.2 Attachment of the catalyst vessel 43
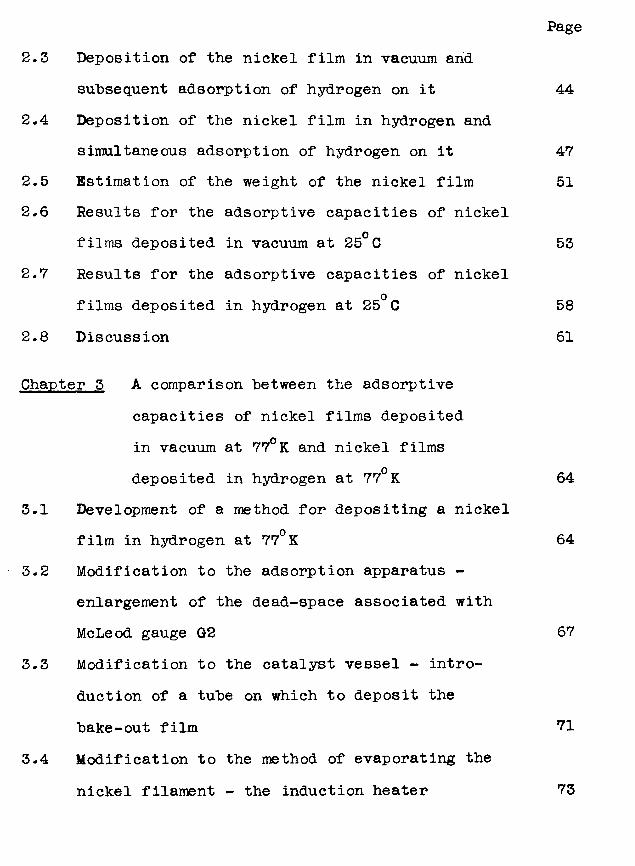
2.3 Deposition of the nickel film in vacuum andsubsequent adsorption of hydrogen on it
2.4 Deposition of the nickel film in hydrogen andsimultaneous adsorption of hydrogen on it
2.5 Estimation of the weight of the nickel film2.6 Results for the adsorptive capacities of nickel
films deposited in vacuum at 25°C2.7 Results for the adsorptive capacities of nickel
ofilms deposited in hydrogen at 25 C2.8 Discussion
Chapter 5 A comparison between the adsorptive capacities of nickel films deposited in vacuum at 77°K and nickel films deposited in hydrogen at 77°K
3.1 Development of a method for depositing a nickel film in hydrogen at 77°K
3.2 Modification to the adsorption apparatus - enlargement of the dead-space associated with McLeod gauge G2
3.3 Modification to the catalyst vessel - introduction of a tube on which to deposit the bake-out film
3.4 Modification to the method of evaporating the nickel filament - the induction heater
Page
44
4751
53
5861
64
64
67
71
73
3.5 Modification to the adsorption apparatus — further enlargement of the calibrated section
3.6 Results for the specific adsorptive capacities of nickel films deposited in hydrogen at 77° K, and discussion of the values obtained
3.7 Slow sorption3.8 Results for the specific adsorptive capacities
of nickel films deposited in vacuum at 77°K3.9 Result for the specific adsorptive capacity of
a nickel film deposited in 0*2mm pressure of argon at 77° K
3.10 Investigation into the possibility of physical adsorption
3.11 Summary
Chapter 4 Hydrogenation at room temperature ofethylene and cyclopropane on nickel films deposited in hydrogen at 77°K
4.1 Purification of the gases4.2 Design of the catalyst vessel for use in
hydrogenation experiments4.3 The experimental method4.4 Results for ethylene hydrogenation at room
temperature
Page4.5 Results for cyclopropane hydrogenation at room
temperature 1154.6 Discussion 120
Chapter 5 The counting equipment 1235.1 Design of the gas counter 1235.2 Preparation of tritiated hydrogen 1275.3 Preparation of the quenching agent 1305.4 Calibration of the manometer section 1315.5 A study of the characteristics of the gas
counter 1325.6 Determination of the specific activity of the
tritiated hydrogen 139
Chapter 6 Hydrogen/tritium exchange reactions onnickel films 148
6.1 Preliminary experiments 1496.2 The experimental procedure 1516.3 Exchange results on films deposited in the
presence of tritiated hydrogen at 77°K 1546.4 Exchange results on a film deposited in the
presence of tritiated hydrogen at 0°C 1546.5 Exchange results on a film deposited in vacuum
at 77°K with subsequent adsorption oftritiated hydrogen on it 154
6.6 The isotope effect6.7 Discussion
Chapter 7 Adsorption and exchange experiments on evaporated palladium films
7.1 The experimental method7.2 Estimation of the weight of the palladium film7.3 Adsorption results7.4 Exchange results7.5 Summary
Chapter 8 Effect of increase in temperature on the adsorptive capacities of metal films deposited in hydrogen at 77°K
8.1 Nickel films - effect of raising the temperaturefrom 77°K to room temperature in one stage
8.2 Modifications to the adsorption apparatus - introduction of an ejection pump, a mercury cut-off and a second Pirani gauge
8.3 Nickel film - gradual warming-up employingprecooled isopentane
8.4 Nickel film - gradual warming-up employingliquid argon and precooled isopentane
8.5 Nickel film - gradual warming-up employinga heat reservoir
Page154167
169169170 173 181 185
186
187
190
192
194
196
Page8.6 Palladium and rhodium films - gradual warming-
up employing the heat reservoir 1998.7 Discussion 206
Chapter 9 Discussion 2099.1 Review of results on extent of hydrogen
ads orp t i on 2099.2 The hand theory of metals 2159.3 Role of the d-band in catalysis and chemi-
s orp t ion 2179.4 Mode of incorporation of hydrogen in films
formed in hydrogen at 77°K 2269.5 Summary of conclusions and future work 231
Appendix A 234Appendix B 235Appendix C 241Appendix D 243Appendix E 246Appendix F 248
References 250
A B S T R A C T
The adsorption of hydrogen on evaporated nickel films has been studied under a variety of experimental conditions. It has been shown that, in comparison to the uptake of hydrogen on a vacuum deposited film, enhancement of the amount of hydrogen adsorbed can be achieved by depositing the metal film in the presence of the adsorbate. Some such slight degree of enhancement is observed at 273°K, but this is very much more marked at 77°K. At this low temperature, uptakes approaching one hydrogen atom adsorbed per nickel atom have been observed. The phenomenon can be explained by postulating that, in the case of a vacuum deposited film, the nickel atoms in the bulk of the structure are capable of adsorbing hydrogen but do not do so simply because hydrogen does not have access to them; in the case of a film formed in the presence of hydrogen, on the other hand, the gas has the opportunity to be adsorbed on each nickel atom as it is deposited.
It is thought that the absence of greatly enhanced adsorption on films deposited in hydrogen at 273°K is due to the fact that both the adsorbed hydrogen and the nickel atoms are mobile at that temperature, and thermal movement of both species leads to elimination of hydrogen from the internal surfaces of the structure. The manner in which the hydrogen held by a film deposited at 77°K is released
from its state of enhanced adsorption as the temperature rises has been studied. This has shown that the additional amount of hydrogen which is adsorbed when the temperature is decreased has reached a saturation value at a temperature above 77°K, and consequently that the measurements made at liquid nitrogen temperature have a fundamental significance as being the maximum possible.
To gain information as to the manner in which the hydrogen is held by the nickel, exchange experiments have been carried out. Using tritium labelled hydrogen as the adsorbate, a radioactive tracer technique has been developed to study its exchange with gas phase inactive hydrogen. It has been found that a quantity of hydrogen equivalent to 0*6 hydrogen atom per metal atom does not take part in the exchange process. Similar adsorption and exchange experiments have been carried out on palladium films for comparison purposes. These have shown that, although hydrogen sorption occurs to a greater extent on palladium than on nickel (owing to an additional mode of incorporation of hydrogen in palladium for which access of the adsorbate is not rate determining), the non-exchangeable ratio is still 0*6. This figure is significant in that it is in excellent agreement with the amount of hydrogen which, if bonded to the d-band of either metal, would exactly fill the electron vacancies there. It is suggested that the total filling of the d-band
with electrons from the hydrogen in this way results in the absence of a type C chemisorbed component to act as an intermediate in exchange.
The extent of the present work has not enabled any definite conclusions to be drawn as to the manner in which the exchangeable hydrogen is held by the metal, but experimental observations have led to the elimination of certain possibilities (i.e. physical adsorption and type C chemi- sorption to the d-band) as being unlikely.

-1-
I N T R O D U C T I O N
The phenomenon which is now known as heterogeneous catalysis was discovered almost a century and a half ago, when it was found that platinum possessed some property which enabled it to enhance, to a marked degree, the rate of many chemical reactions. Over the years following, other substances which acted as catalysts were discovered, and a great deal of empirical knowledge was gathered. Although extensive use was made of the phenomenon in industry, notably in the manufacture of sulphuric acid and ammonia, it was not until the early twentieth century that an attempt was made to develop the subject on a scientific basis.
The impetus for this further study was provided by Langmuir in 1916 (l), when he discovered the property of adsorption. It was only then realised that a catalyst functioned by enabling one or more of the reactants to be adsorbed on its surface, thereby providing a reaction pathway with a lower activation energy than would otherwise have been possible.
Experimental investigations of catalysis then progressed along three main lines of approach. Firstly, studies were made of the geometry of the catalyst surface, and the stereochemical implications of adsorption. Secondly, the nature of the chemical bond formed when
-2-an adsorbate was chemisorbed on the catalyst surface was studied. Lastly, investigations were carried out to determine whether the entire catalyst surface was homogeneous with respect to its adsorptive and catalytic ability, or whether these properties were restricted to active sites on a heterogeneous surface, A brief summary of our knowledge to date in each of these three fields is given in the following paragraphs.
There is both theoretical and experimental support for the operation of surface geometry in catalysis. The most important piece of theoretical evidence is due to Sherman and Eyring (2), who calculated the activation energy for hydrogen chemisorption on carbon as a function of the distance between the carbon atoms concerned.Results showed that the activation energy was very dependent on distance, and passed through a minimum at a spacing of 3»*6A° At larger distances the energy was high because the hydrogen molecule had effectively to be dissociated before adsorption could occurs at low separations it was again high because repulsion forces retarded adsorption.
Again on a theoretical basis, Twigg and Rideal (3) considered the adsorption of ethylene by two point contact on adjacent nickel sites. Prom a knowledge of the geometry of the ethylene molecule, they postulated that
-3-adsorption on a 2*47A° lattice spacing would be almost strain free, and would consequently be extremely stable. Adsorption on a 3,*50A° spacing, on the other hand, would involve considerable strain. The heat of adsorption of ethylene on a 3*50A° spacing would therefore be somewhat lower than on a 2,*47A° spacing, so the former might as a result be more active in the reactions of ethylene.
These theoretical predictions were later verified experimentally, as follows. It was found to be possible to prepare non-oriented catalyst films by evaporation of nickel in high vacuum, and oriented films by evaporation in argon at 1mm pressure. Oriented nickel films preferentially expose the (110) crystal plane, which contains a higher proportion of 3*50A° lattice spacings than the other primary crystal planes. Oriented nickel films were found experimentally to be five times more active in ethylene hydrogenation than non-oriented films (4).
Observations have been made on the way in which a catalyst’s lattice spacings can influence the course of a reaction, in systems where alternative products are possible. Adkins (5) discovered that ethyl acetate could be catalytically decomposed on alumina to yield either ethylene or acetone as the principal product, depending on the method of preparation of the catalyst.
-4-The formation of acetone required larger atomic spacings in the catalyst than did the formation of ethylene. It was concluded that the different modes of decomposition occurred because of the different possible ways of attachment of the ethyl acetate molecule to the catalyst surface.
These three examples suffice to show that the geometric factor plays an important part in heterogeneous catalysis, but it is not the only factor involved, as is evidenced by a study of the catalytic dehydrogenation of cyclohexane. In this reaction, cyclohexane is supposed to lie flat on the catalyst surface, adsorbed by six metal-to-carbon bonds (6). For such an adsorption to be feasible, the crystal face would have to show hexagonal symmetry, with the interatomic spacing lying between sharply defined limits. Only the (ill) planes of face-centred cubic and hexagonal close-packed crystals show this symmetry. Balandin (7) claimed that all metals which were active in this reaction did indeed crystallise in one or other of these habits, and possessed spacings falling between the limits 2*48A° and 2*74A°. However, copper and zinc, although they are just as favourable geometrically, are nevertheless quite inactive in cyclohexane dehydrogenation; this indicates that factors other than geometry must also be involved. It is thought that the inactivity of copper and zinc is due to the fact
-5-that they are non-transition metals, which leads to a consideration of another important aspect of catalysis - the electronic factor.
It has been shown (8) that the surface bond between metals and layers of the common gases (other than oxygen) is a covalence with atomic d-orbitals. It is also known (9) that the heat of adsorption is determined by the availability of these orbitals, which suggests that the catalytic activity of a metal might be determined by the structure of the d-band.
Several experiments were devised to test this hypothesis, most of which used binary alloys of varying composition as catalysts. The alloys consisted of solid solutions of a transition metal and a group lb metal, notably copper/nickel and palladium/gold. The metals in each pair were chosen to have approximately the same atomic radius, so that any variation in catalytic activity within a range of alloys could be ascribed solely to the electronic factor and not to the geometric factor.
Couper and Eley (10) studied the ortho-parahydrogen conversion by palladium/gold alloy filaments. They found that when just sufficient gold had been added to fill all the vacancies in palladium's d-band with s-electrons, there was a very sharp fall in the rate of the reaction.
Similar results were obtained by Dowden (ll) and Reynolds (12), who studied ethylene hydrogenation on
-6-copper/nickel alloy catalysts.
These examples make it evident that for efficient catalysis d-hand vacancies are essential, and the catalytic activity of pure transition metals is therefore at least partially determined hy their d-character.
As far as the question of surface homogeneity or heterogeneity is concerned, a great deal of conflicting evidence appears in the literature.
Taylor (13, 14) originated the idea of variations in the activity of adsorption sites, observing that active centres might be associated with surface defects or with the presence of impurities. Experimental evidence in support of this theory of relatively few active centres was provided by various workers, notably Maxted and Morrish (15), Yee and Emmett (16), and Pease and Stewart (17). Studying quite different reactions, they all found that the addition of a very small amount of poison to the reaction mixture was sufficient to stop the reaction altogether, although the quantity of poison required to destroy the catalytic activity was frequently not nearly sufficient to form a completed monolayer on the catalyst surface.
Calorimetric studies (18) also seemed to support the view of surface heterogeneity, when it was discovered that heats of chemisorption decreased markedly with the degree of surface coverage. One interpretation was that
-7-certain sites adsorbed more readily than others, with higher heats of adsorption. An alternative reason, however, was put forward "by Kwan (19), who suggested that the greater the degree of surface coverage, the closer the adsorbed molecules would he to one another, and the greater would he the effect of mutual repulsion forces,; thus the heat of chemisorption could also fall with increasing coverage on a homogeneous surface.
Herington and Rideal (20) have even shown that in some cases the great sensitivity of catalysts to small amounts of poison could he explained on the hasis of a homogeneous surface, if it were assumed that hoth the poison molecule and the reactant molecule required several sites for adsorption. Then, for geometrical reasons, the poison might prevent the reactant from using several sites which it itself did not actually cover.
The present state of our knowledge in this field therefore leads us to say that surface heterogeneity undoubtedly exists among catalysts, hut whether or not it is essential for catalytic activity is still uncertain.
A large number of the investigations mentioned so far were carried out on supported metal catalysts.These catalysts consisted of a metal supported on a finely divided or highly porous inert solid, and had the advantage of high activity because of the large surface area of the support over which the catalytically active

-8-material was spread. This property made them immensely useful as practical catalysts, hut for fundamental research work they suffered from the serious disadvantage that their surface was liable to be contaminated in an irreproducible way because of their method of preparation.
Other investigations have been carried out using metal wires as catalysts. These can be freed from contamination by foreign adsorbed gases by heating them electrically under conditions of high vacuum, but they have the serious disadvantage of a very small surface area, making accurate experimental measurements difficult.
A significant advance in chemisorption studies was made in 1935 (21) when work was begun on the investigation of the structure and properties of metal films, produced by evaporation of the metal under conditions of high vacuum. In this way, a catalyst was obtained which had an uncontaminated surface and a reasonable surface area. Although such systems are not even remotely useful in applied catalysis, they have been extensively used in academic studies as the basis of "clean" systems.
In 1940, Beeck, Smith and Wheeler (4) studied the adsorption of various gases and the hydrogenation of ethylene on evaporated films of nickel and iron, deposited either under conditions of high vacuum or in the presence of 1mm pressure of an inert gas. They found that their films were catalytically active in the hydrogenation of
-9-ethylene, and moreover that the rate of the hydrogenation was directly proportional to the film weight. The films were also capable of chemisorbing ethylene, hydrogen, carbon monoxide, nitrogen or oxygen, and in all cases the amount of gas adsorbed was again proportional to film weight. These results indicated that the evaporated films were presenting a porous structure to the adsorbing gas.
Investigations by electron diffraction confirmed that the films were indeed composed of tiny crystallites. Vacuum-deposited films were observed to have the crystallites randomly arranged with respect to the substrate,; argon-deposited films had the crystallites oriented with respect to the substrate so that the (110) plane in nickel and the (ill) plane in iron was preferentially exposed (22). Oriented nickel films were found to possess twice the surface area for adsorption per unit weight of film, and ten times the activity for ethylene hydrogenation, when compared with non-oriented films.
In the case of hydrogen adsorption on a vacuum- deposited nickel film, Beeck found that the quantities involved were such that 1*25 x 1017 atoms of hydrogen were adsorbed per mg of nickel; this corresponds to an adsorption of one hydrogen atom per eighty nickel atoms. There could be two possible reasons for such an adsorption
-10-ratio. Firstly, it could "be that the crystallites are, on the average, of a size such that there is only one in every eighty nickel atoms on the surface of the crystallites, the remainder "being in the "bulk and therefore inaccessible to the hydrogen. For this to be the case, the crystallites, on the average, would have to be of size equivalent to spheres of diameter about 1500A0 (see appendix A). The second possible reason for the adsorption ratio could be the nature of the chemisorption bond. If the ability to chemisorb is a property of the metallic state, and if, like electrical conduction, etc., it is due to the peculiar situation of electron mobility in metals, then it may well be that a large number of metal atoms is necessary to provide one surface bond.
An investigation to decide which of these two possibilities is correct is the subject of this thesis.If the first reason is correct, it should be possible to increase the adsorption ratio by improving the access of hydrogen to the bulk nickel. This could be achieved by evaporating the nickel in the presence of a small pressure of hydrogen rather than in vacuum. Then as each nickel atom is deposited, hydrogen will have the opportunity to adsorb on it. This technique should therefore allow adsorption to occur on atoms in the film which will subsequently be covered by more nickel, and hence would have been inaccessible to the hydrogen if it
-11-had been admitted after the film had been formed in vacuum. If under these conditions enhanced adsorption is observed it may reasonably be taken as evidence that the first reason given above is correct. If, however, the adsorption ratio still remains at one hydrogen per eighty nickel atoms, this will be an indication that the ability to chemisorb is a property of the metallic state, and a large number of atoms is necessary to provide one surface bond.
The experiments outlined should therefore produce an answer to the interesting question of whether an individual metal atom is independently capable of acting as an adsorption site for a potential reactant, or whether the property of adsorption, and hence of catalytic activity, is acquired only when the metal atoms are combined together to form the bulk metal.
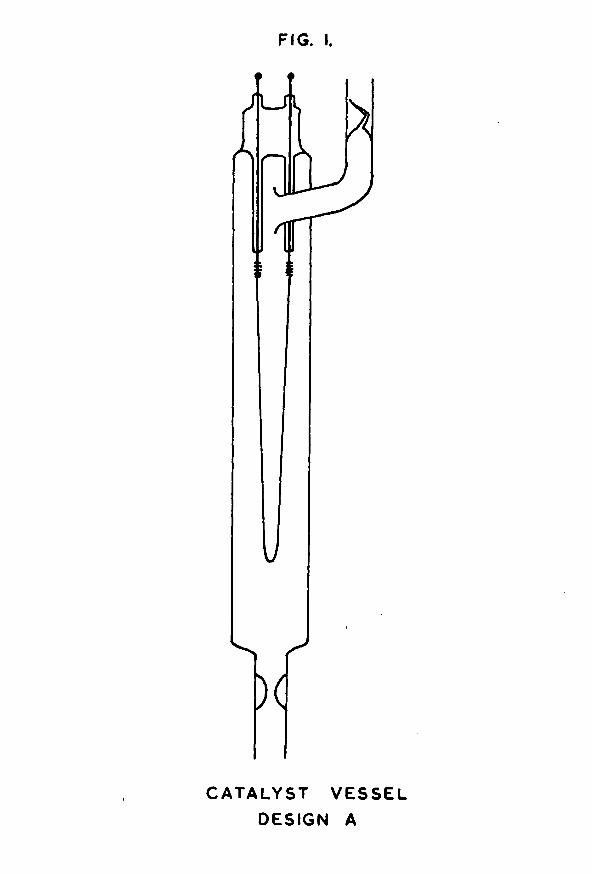
FIG. I.
CATA LYST VESSEL DESIGN A
-12-C H A P T E R 1
DESIGN Am) CONSTRUCTION OF THE APPARATUS.This chapter will be devoted to a description of the
apparatus used in the investigation, in the form in which it was constructed for the initial experiments. As the work progressed, modifications were introduced, but these will be dealt with in future chapters as they became necessary.
The apparatus used can be divided into three main parts: a) the catalyst vessels on the walls of which the nickel
films were deposited,, bj a high vacuum apparatus which was used to bake-out the
catalyst vessel and degas the nickel wire from which the film was later evaporated, and
c) a separate high vacuum apparatus which was used to study the adsorption of hydrogen on the nickel film.These three pieces of apparatus will now be discussed
in detail.
1.1 Design and construction of the catalyst vessel.The original design of the catalyst vessel is shown in
fig. 1. The main portion of each vessel was constructed from Pyrex tubing of outside diameter 20mm, and of length about 14cm. Into one end of this tube was sealed a metal assembly consisting of two tungsten leads attached to a hairpin loop of nickel wire. The tungsten leads were
prepared hy cutting two 7cm lengths of Iran annealed
-13-
tungsten wire supplied by Johnson Matthey & Co. Ltd., using the shearing action on the shoulder of a pair of pliers to prevent splitting of the laminae. The pieces of wire were cleaned by warming them to red heat in a soft oxygen flame, and then rubbing them with a stick of sodium nitrite. A violent exothermic reaction resulted. After the tungsten had been cooled and the excess nitrite washed away, the wire had a bright silvery appearance. This was carefully reoxidised to a deep purple colour by again heating it in a soft flame.Each piece of wire was sleeved by melting a 4cm length of 2mm bore Pyrex tubing on to the tungsten, using an oxygen flame. Care was taken to exclude air bubbles by heating the glass evenly from the centre outwards in both directions. When cool, the glass-to-metal seal had a characteristic bronze colour.
A suitable length of nickel wire was then attached to the tungsten leads by winding the nickel in a spiral round the end of the tungsten, and spot-welding it in position to obtain a good electrical contact. The nickel wire used was 0*02in in diameter, and was supplied by Johnson Matthey & Co. Ltd. It was spectroscopically pure, containing not more than 15 parts per million of metallic impurities, although the percentage of gaseous impurities was much higher (23).The length of wire chosen was such that in each catalyst vessel there was always about 15cm of free nickel filament.
This nickel/tungsten assembly was bent into a hairpin-
-14-shaped loop and was sealed into the end of the main Pyrex tube of the catalyst vessel by making a pinch seal on to the Pyrex coated tungsten leads. Before annealing the seal, the nickel filament was correctly aligned in the centre of the tube, and the protruding ends of tungsten wire were connected to electrical leads of 18 gauge copper wire by means of silver solder. The soldering was done in such a way that the exposed tungsten became completely coated with silver solder, thereby sealing the tungsten laminae against leakage of air when the vessel was later evacuated.
The catalyst vessel was further provided with two side- arms, constructed from 11mm Pyrex tubing, and attached in the positions shown in fig. 1. One of these side-arms contained a constriction, and the other a break-seal. These two devices were necessary because the catalyst vessel was baked-out and freed from contaminating gases on an apparatus completely separate from that on which the adsorption of hydrogen on the nickel film was studied. Transfer of the vessel from one apparatus to the other was effected by means of the constriction and break-seal. The vessel was first attached to the baking-out apparatus via the side-arm containing the constriction. When degassing was complete, the constriction was heated in an oxygen flame till it collapsed to form solid rod - the thickened glass of the constriction made this possible even under conditions of high vacuum. The rod was
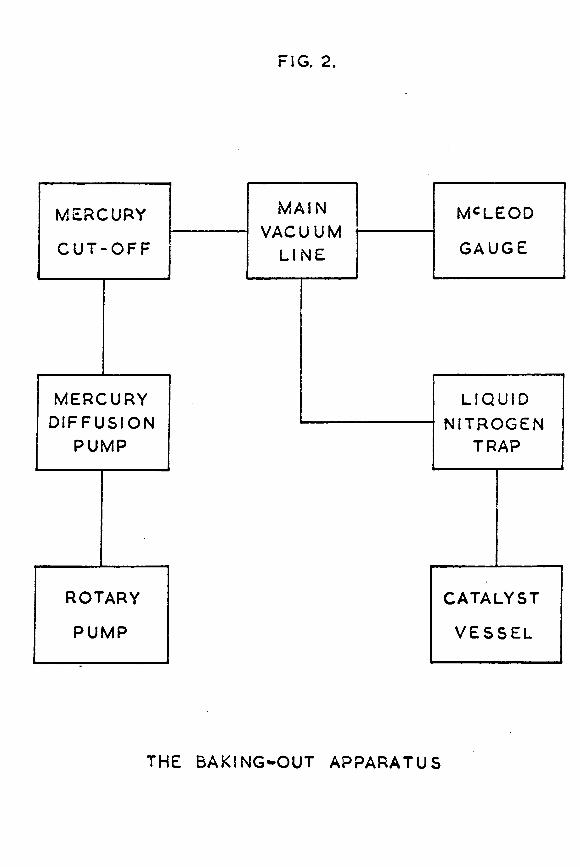
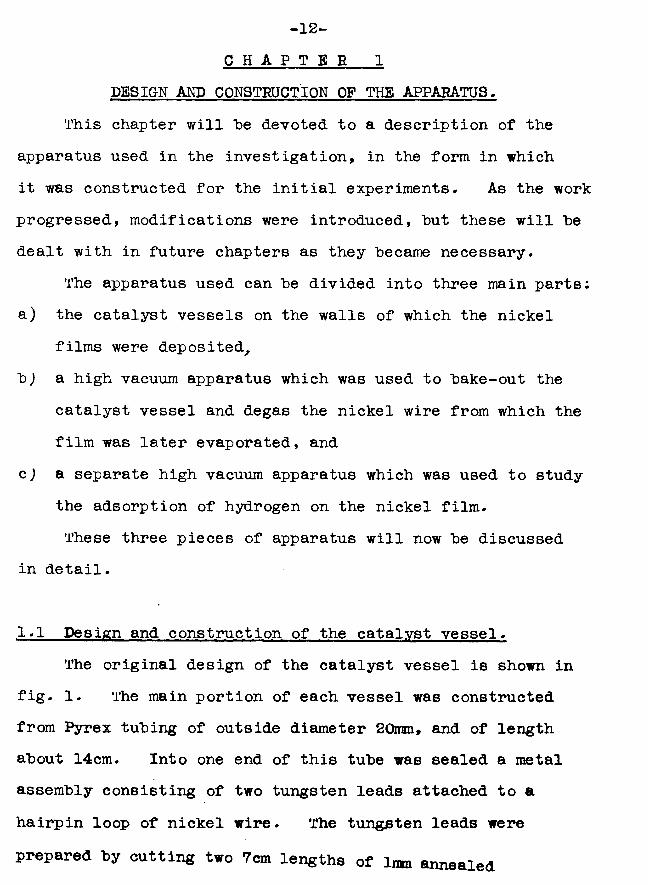
FIG. 2.
MAINVACUUM
NITROGENTRAP
GAUGE
MERCURY
C U T - O F F
CATALYST
V E S S E L
MERCURYDIFFU SIO N
PUMP
ROTARY
PUMP
THE BAKING-OUT APPARATUS
- 15-
then heated more strongly till the glass melted, and the catalyst vessel could he pulled away and completely detached from the haking-out apparatus. The vessel was next glass- hlown on to the adsorption apparatus via the side-arm containing the "break-seal. When the connecting tubing had "been evacuated, a steel hall could he dropped, hy means of a magnet, on to the hreak-seal, causing it to shatter. This provided a connection between the inside of the catalyst vessel and the adsorption apparatus.
1.2 The vacuum system for degassing the catalyst vessel.This was a conventional high vacuum apparatus, and is
illustrated schematically in fig. 2. It was constructed throughout from wide hore Pyrex tubing to give maximum pumping speeds. Pumping was carried out hy means of an Edwards 3-stage mercury diffusion pump ^model 2M3B), hacked hy an Edwards rotary pump (model 2820B). On the high vacuum side of the diffusion pump there were no greased taps* this made it easier to achieve and maintain a high vacuum. The system could he isolated from the pumps hy means of a mercury cut-off. To measure the pressure in the system a McLeod gauge was provided, of hulh capacity about 100ml and with a closed limb constructed from 1mm hore capillary tubing. Between the mercury-containing parts of the system and the catalyst vessel was a liquid nitrogen trap, to prevent any mercury vapour
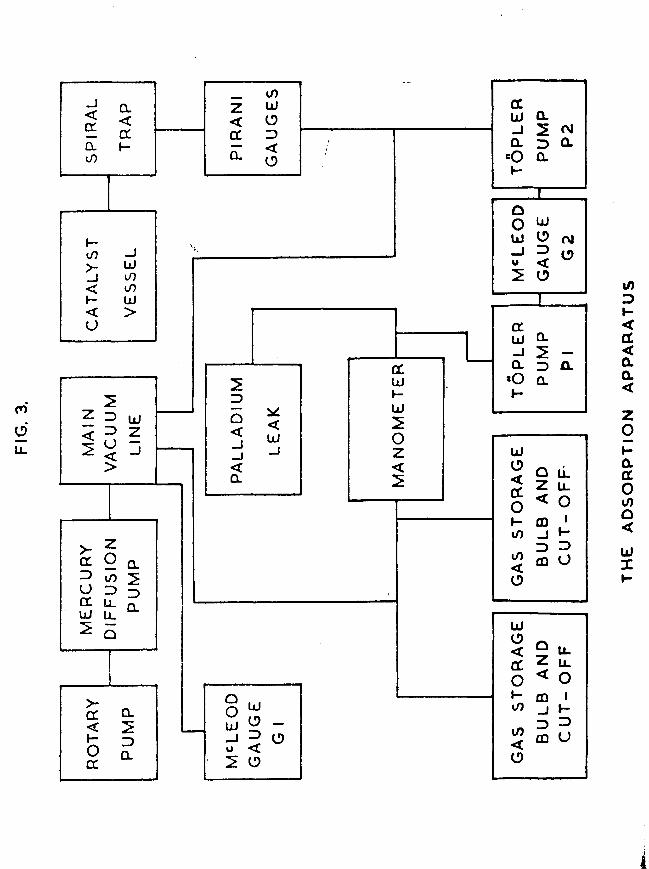
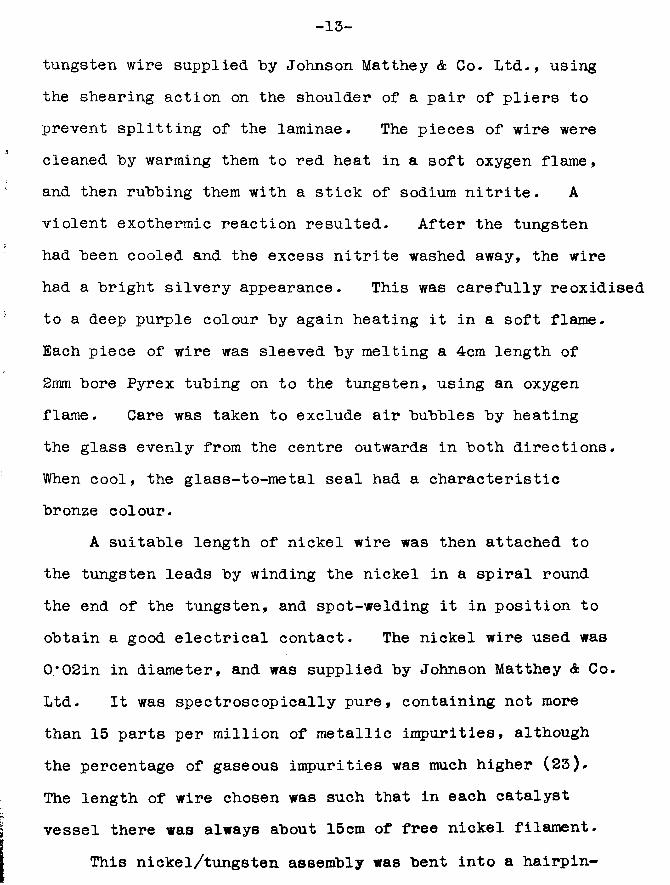
FIG. 3.
2 LL< O
i
THE
AD
SO
RP
TIO
N
AP
PA
RA
TU
S
-16-from reaching the catalyst vessel. Pressures of better than
-710 torr could be achieved with this system.
1.3 The vacuum system for studying the adsorption of hydrogenon the evaporated metal film.This also was a conventional high vacuum system, capable
of attaining pressures lower than 10 torr. It is shown schematically in fig. 3, in its original form.
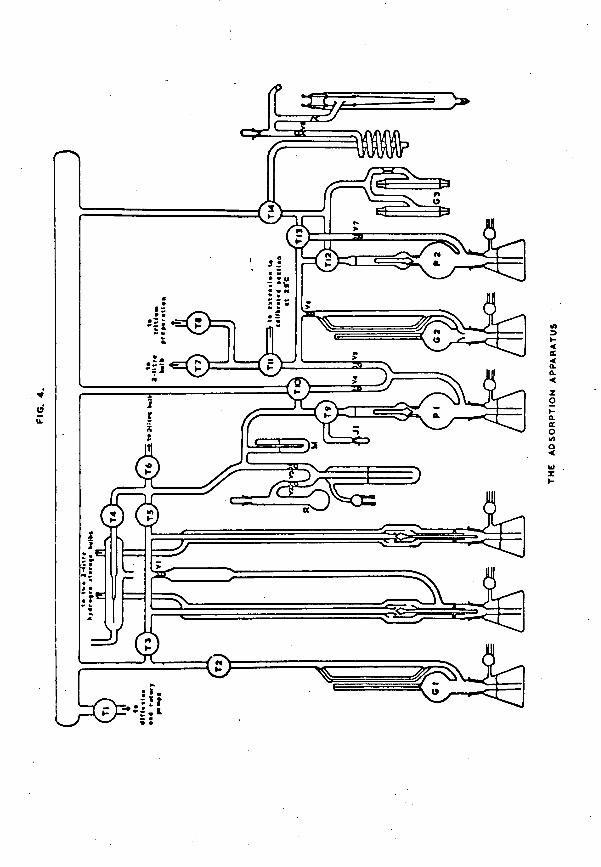
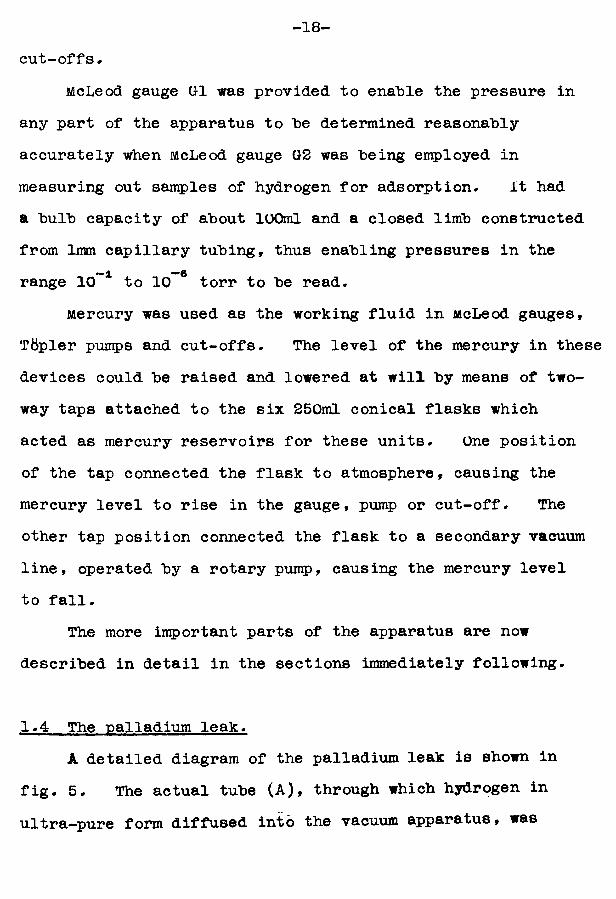
The apparatus was constructed throughout from wide bore Pyrex tubing, and the various sections could be isolated from one another by means of greased taps lubricated with Apiezon N high vacuum grease. Pumping was carried out with an Edwards 3-stage mercury diffusion pump (model EM2) backed by an Edwards rotary pump (model 2S20B). The pumps were connected to the main vacuum line of the apparatus via a liquid nitrogen trap and an 8mm tap. A Vacustat was attached to one end of the main vacuum line, thus enabling a quick estimate of the pressure in any part of the apparatus to be made. Leads were taken from the main vacuum line to other sections of the apparatus. The main sections, as required for the first few adsorption experiments, are shown diagrammatically in fig. 4.
Essentially, the rest of the apparatus consisted of a calibrated section, incorporating McLeod gauge G2, in which samples of hydrogen could be accurately measured out. These
s!l*Ky=fi*|S *<£>=!
1 >@H;
THE
AO
SOR
PT
ION
AP
PA
RA
TU
S
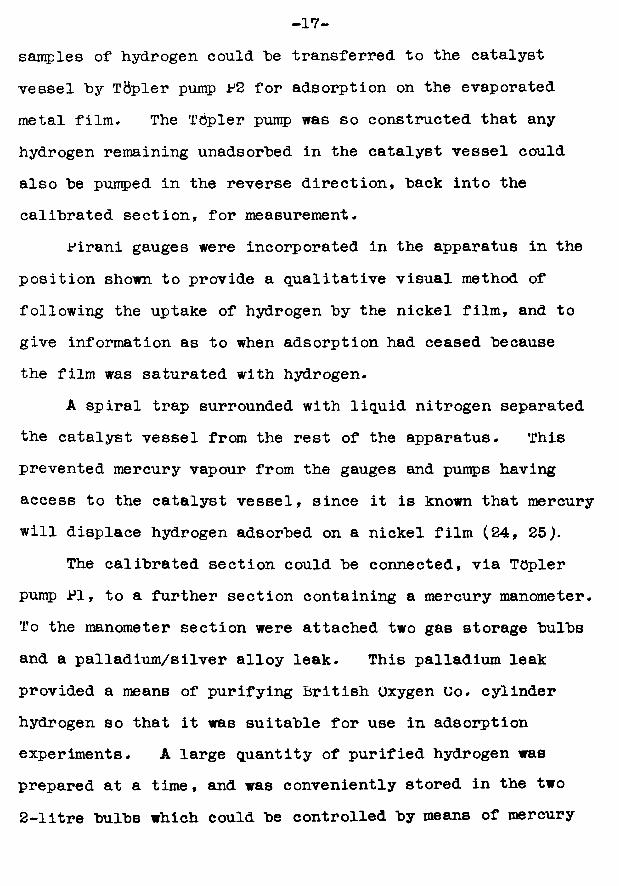
-17-samples of hydrogen could he transferred to the catalyst vessel hy Tttpler pump P2 for adsorption on the evaporated metal film. The Tdpler pump was so constructed that any hydrogen remaining unadsorhed in the catalyst vessel could also he pumped in the reverse direction, hack into the calibrated section, for measurement.
Pirani gauges were incorporated in the apparatus in the position shown to provide a qualitative visual method of following the uptake of hydrogen hy the nickel film, and to give information as to when adsorption had ceased because the film was saturated with hydrogen.
A spiral trap surrounded with liquid nitrogen separated the catalyst vessel from the rest of the apparatus. This prevented mercury vapour from the gauges and purnps having access to the catalyst vessel, since it is known that mercury will displace hydrogen adsorbed on a nickel film (24, 25).
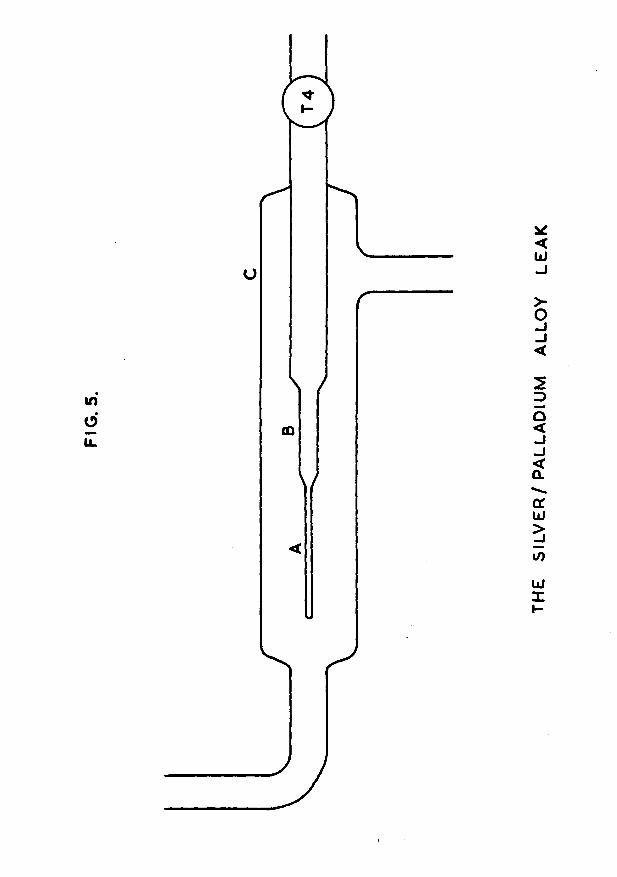
The calibrated section could he connected, via TOpler pump PI, to a further section containing a mercury manometer. To the manometer section were attached two gas storage bulbs and a palladium/silver alloy leak. This palladium leak provided a means of purifying British Oxygen Uo. cylinder hydrogen so that it was suitable for use in adsorption experiments. A large quantity of purified hydrogen was prepared at a time, and was conveniently stored in the two 2-litre bulbs which could be controlled by means of mercury
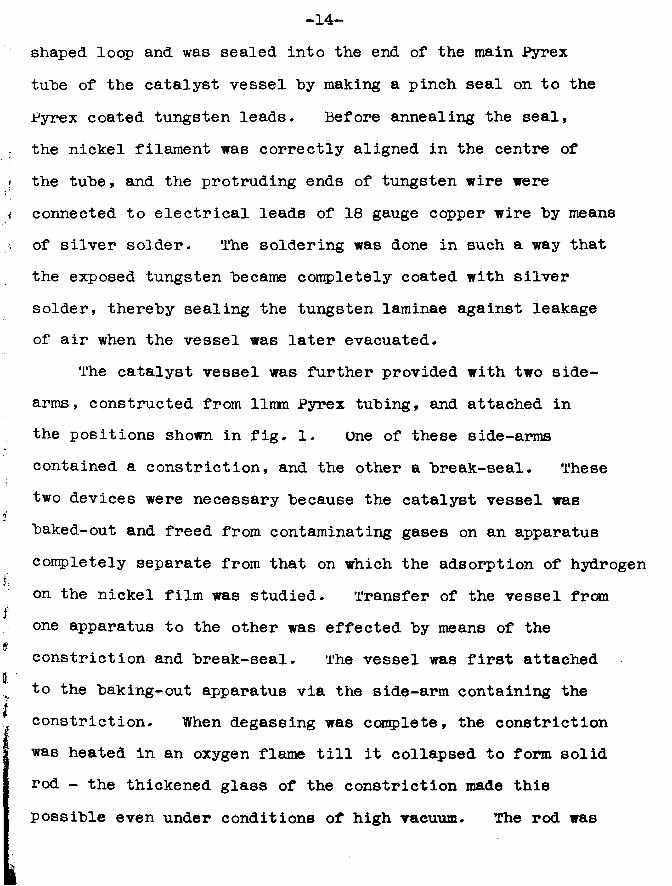
FIG
. 5.
THE
SIL
VE
R/P
ALL
AD
IUM
AL
LOY
LEA
K
-18-cut-offs.
McLeod gauge G1 was provided to enat>le the pressure in any part of the apparatus to he determined reasonably accurately when McLeod gauge G2 was being employed in measuring out samples of hydrogen for adsorption. it had a bulb capacity of about 100ml and a closed limb constructedfrom 1mm capillary tubing, thus enabling pressures in the
—1 —6range 10 to 10 torr to be read.Mercury was used as the working fluid in McLeod gauges,
Tdpler pumps and cut-offs. The level of the mercury in these devices could be raised and lowered at will by means of two- way taps attached to the six 250ml conical flasks which acted as mercury reservoirs for these units. One position of the tap connected the flask to atmosphere, causing the mercury level to rise in the gauge, pump or cut-off. The other tap position connected the flask to a secondary vacuum line, operated by a rotary pump, causing the mercury level to fall.
The more important parts of the apparatus are now described in detail in the sections immediately following.
1.4 The palladium leak.A detailed diagram of the palladium leak is shown in
fig. 5. The actual tube (A), through which hydrogen in ultra—pure form diffused into the vacuum apparatus, was
-19-cons trueted from a silver/palladium alloy containing 25% silver* The tube, supplied by Johnson Matthey &. Go. Ltd., was closed at one end, and was of length 2 in, outside diameter 0/065in and wall thickness 0/003in. The alloy, rather than pure palladium, was chosen because the former does not distort when repeatedly heated and cooled in hydrogen; mechanical distortion does occur with pure palladium tubes, and is a frequent cause of their failure.
The silver/palladium alloy tube was sealed to the copper end of a Jencons l/4in copper-to-Pyrex Housekeeper seal (B) by means of silver solder. The glass end of the seal was connected to the high vacuum apparatus via tap T4. This tap was always kept closed except when hydrogen was being prepared; this prevented contamination of the diffusion surface by mercury vapour, which drastically reduces the diffusion rate. The glass/metal assembly was enclosed in a glass envelope (C) by means of a ring seal, as shown in fig. 5. This envelope possessed two side-arms, an inlet and outlet for the gentle flow of British Oxygen Go. Ltd. cylinder hydrogen which passed over the alloy tube.
Round the glass envelope, for a length of about 3in in the vicinity of the alloy tube, a furnace was wound from nichrome tape to a cold resistance of llOohms. The temperature of this furnace was controlled ̂ raeans of
a Variac transformer, the settings of which were calibrated
3-C 0 =
mercury c u t -off
-20-against a borosilicate glass thermometer. it was found that a variac setting of 80volts heated the alloy tube to a temperature of about 200°0 . under these conditions, ultra-pure hydrogen diffused through the tube into an evacuated 2-litre storage bulb to a pressure of about 30cm in one hour.
1.5 Gas storage bulbs and associated cut-offs.Since it was convenient to prepare large quantities of
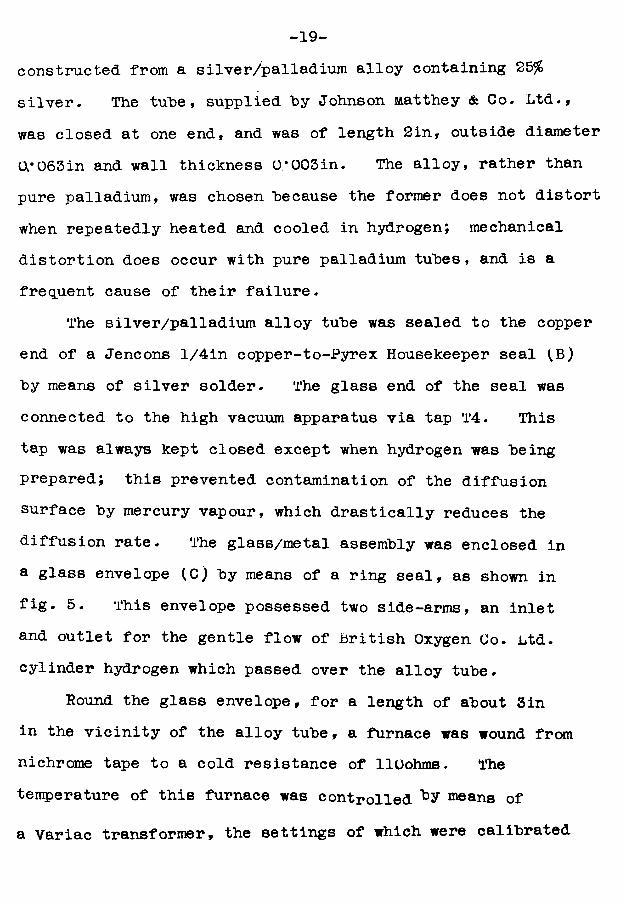
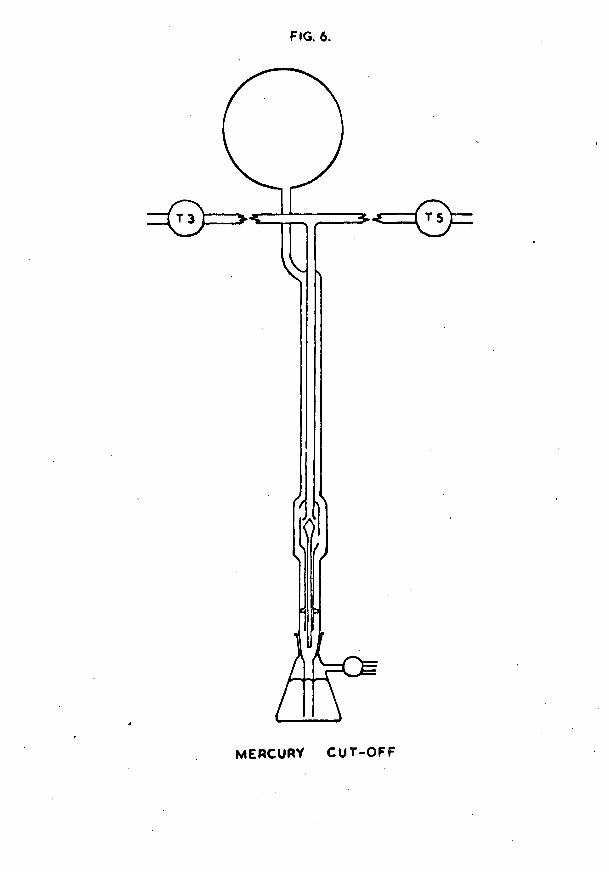
ultra-pure hydrogen at a time, and since only a comparatively small quantity was used in each adsorption experiment, a means of storing the gas without risk of contamination over a period of several months had to be found. The method adopted was that used by Uranstoun (26), and employed a mercury cut-off. The design of the cut-off is shown in fig. 6 , with a detail of the valve in fig. 7.
The cut-off consisted of an outer Pyrex tube (A), l**2cm in diameter and 70cm long. At its upper end this tube was connected to a 2-litre storage bulb; its lower end dipped into a reservoir of mercury. A second tube (B), U*6cm in diameter and concentric with the outer tube, was connected to the vacuum system via a ring seal at the top of the wider tube. This inner tube was thickened at its lower end, and a mercury float valve (C) was ground against it using fine carborundum powder. The float valve was constructed from a sealed 16cm length of 0/3cm diameter Pyrex tubing, with
FIG. 7
e
MERCURY C U T -O F F VALVE
DETAIL
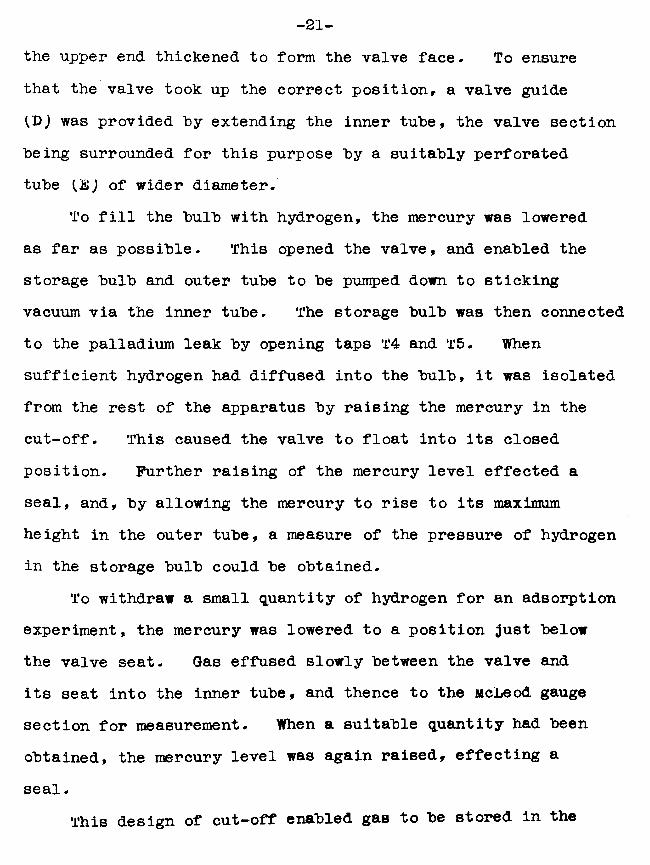
- 21-
the upper end thickened to form the valve face. To ensure that the valve took up the correct position, a valve guide
was provided "by extending the inner tube, the valve section being surrounded for this purpose by a suitably perforated tube tEJ of wider diameter.
To fill the bulb with hydrogen, the mercury was lowered as far as possible. This opened the valve, and enabled the storage bulb and outer tube to be pumped down to sticking vacuum via the inner tube. The storage bulb was then connected to the palladium leak by opening taps T4 and T5. When sufficient hydrogen had diffused into the bulb, it was isolated from the rest of the apparatus by raising the mercury in the cut-off. This caused the valve to float into its closed position. Further raising of the mercury level effected a seal, and, by allowing the mercury to rise to its maximum height in the outer tube, a measure of the pressure of hydrogen in the storage bulb could be obtained.
To withdraw a small quantity of hydrogen for an adsorption experiment, the mercury was lowered to a position just below the valve seat. Gas effused slowly between the valve and its seat into the inner tube, and thence to the McLeod gauge section for measurement. When a suitable quantity had been obtained, the mercury level was again raised, effecting a seal.
This design of cut-off enabled gas to be stored in the
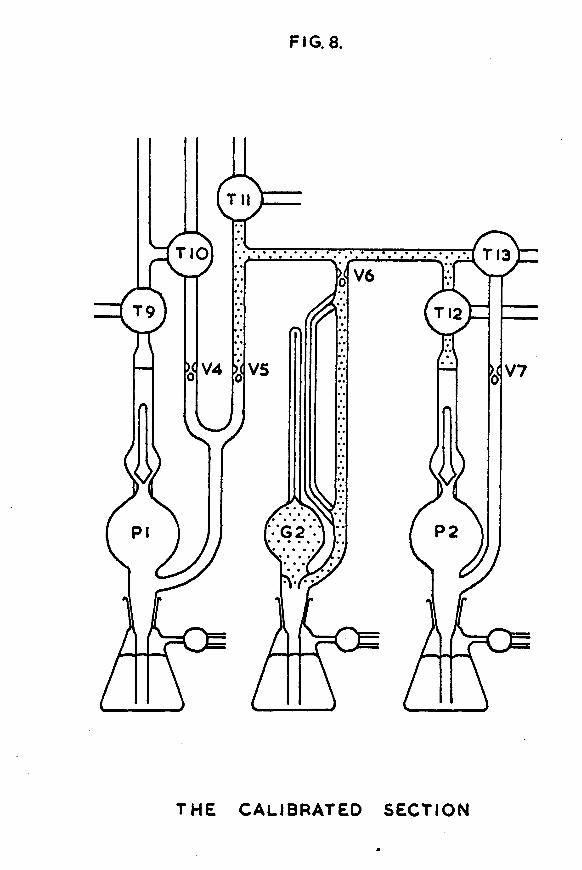
FIG. 8.
Til
TIO T 13,< V6
T9 T 12
>< V4 V5 V7
P 2G 2
T H E CALIBRATED SECTION
- 22-
bulb up to a pressure of 500torr, yet it was also possible to withdraw minute controlled amounts when required.
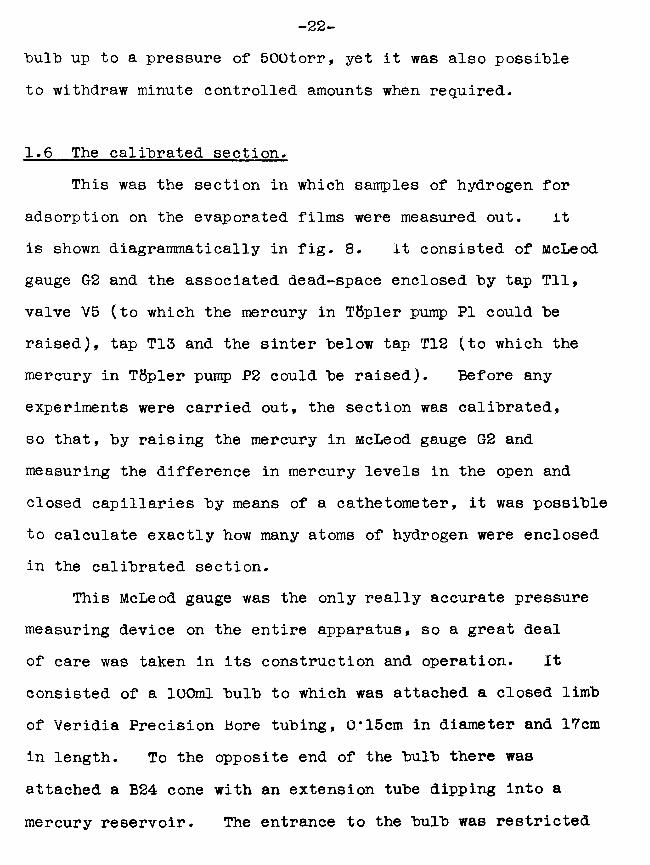
1.6 The calibrated section.This was the section in which samples of hydrogen for
adsorption on the evaporated films were measured out. it is shown diagrammatically in fig. 8 . It consisted of McLeod gauge G2 and the associated dead-space enclosed "by tap Til, valve V5 (to which the mercury in Tfipler pump PI could "be raised), tap T13 and the sinter "below tap T12 (to which the mercury in Tttpler pump P2 could "be raised). Before any experiments were carried out, the section was calibrated, so that, hy raising the mercury in McLeod gauge G2 and measuring the difference in mercury levels in the open and closed capillaries hy means of a cathetometer, it was possible to calculate exactly how many atoms of hydrogen were enclosed in the calibrated section.
This McLeod gauge was the only really accurate pressure measuring device on the entire apparatus, so a great deal of care was taken in its construction and operation. It consisted of a 100ml bulb to which was attached a closed limb of Veridia Precision Bore tubing, 0*15cm in diameter and 17cm in length. To the opposite end of the bulb there was attached a B24 cone with an extension tube dipping into a mercury reservoir. The entrance to the bulb was restricted
-23-by means of a 2cm length of O^cm diameter Pyrex tubing fitted hy a ring seal between the bottom of the bulb and the £24 cone. The side-arm of the gauge carrying the open compensating limb, also constructed from CV15cm Veridia precision £ore tubing, was attached directly below the ring seal.
To obtain accurate measurements on a MCi»eod gauge, it is absolutely necessary that both the glass and the mercury are perfectly clean ^27). Consequently, before use, the gauge was steeped overnight in concentrated nitric acid, and was then thoroughly washed, the washing process being completed with distilled water. After being dried overnight in a steam oven, the gauge was attached to the high vacuum apparatus, and was pumped on for several days till sticking vacuum was achieved. The mercury used to operate the gauge was triply distilled.
JSven after taking these precautions for extreme cleanliness, discrepancies in Mcieod gauge measurements can still arise because of the phenomenon of capillary depression. Porter ^28J has shown that capillary depression increases with decreasing capillary diameter, and is caused by variation of the angle of contact between the mercury and the glass,; in a gauge in which the mercury and the glass are perfectly clean, this angle can vary between 30° and 60°# Rosenberg (29) and Klemperer (30) have shown that roughening the inside
-24-of the capillaries considerably reduces the error due to capillary depression. It was for this reason that the capillaries of MCLeod gauge 02 were constructed from veridia Precision hore tubing. Apart from the fact that this product has a low coefficient of expansion and a tolerance of +(V01mm in bore diameter, it also has a roughened inside finish because of the manufacturing method of collapsing the glass on to a mandrel of precise diameter which is then dissolved away. figures quoted ^31; for the errors to be expected from carefully constructed McLeod gauges show that the error due to capillary depression is of the order of +0{6% at a pressure of 10 torr, and +2$ at 10 torr, but becomes very much higher at lower pressures. 1'his increase in the error at low pressures is unimportant in the investigation to be described in this thesis, as all the samples of hydrogenmeasured out for adsorption on the nickel films exerted
— l — apressures m the range 3x10 torr to 2x10 torr.
1.7 Calibration of the McLeod gauge section.A McLeod gauge depends on boyle’s Law for its operation.
As it has been shown 1,32, 33) that the deviation of hydrogen from hoyle*s Law at low pressures is slight, no significant error will be introduced by assuming that the pressure x volume product after compression of the gas in the closed capillary equals the pressure x volume product before
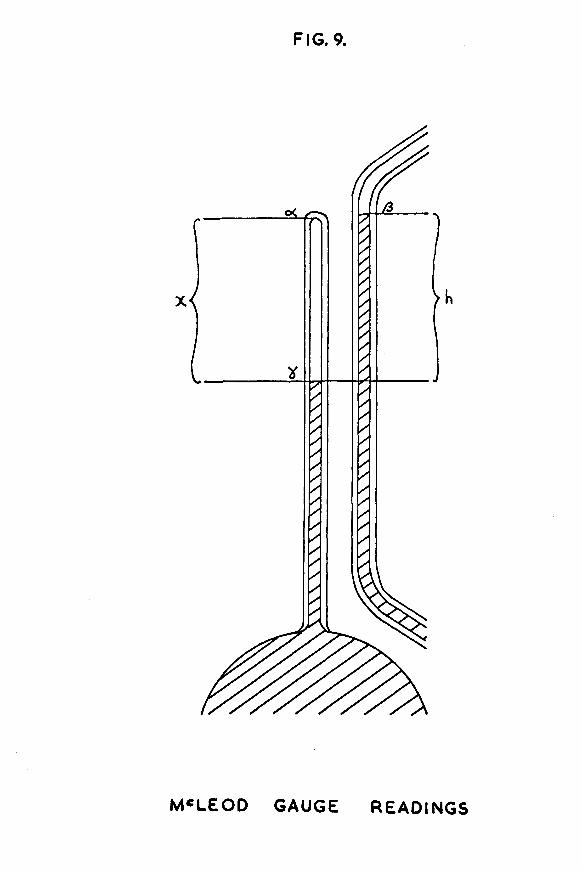
FIG. 9.
X
M cLEOD GAUGE READINGS
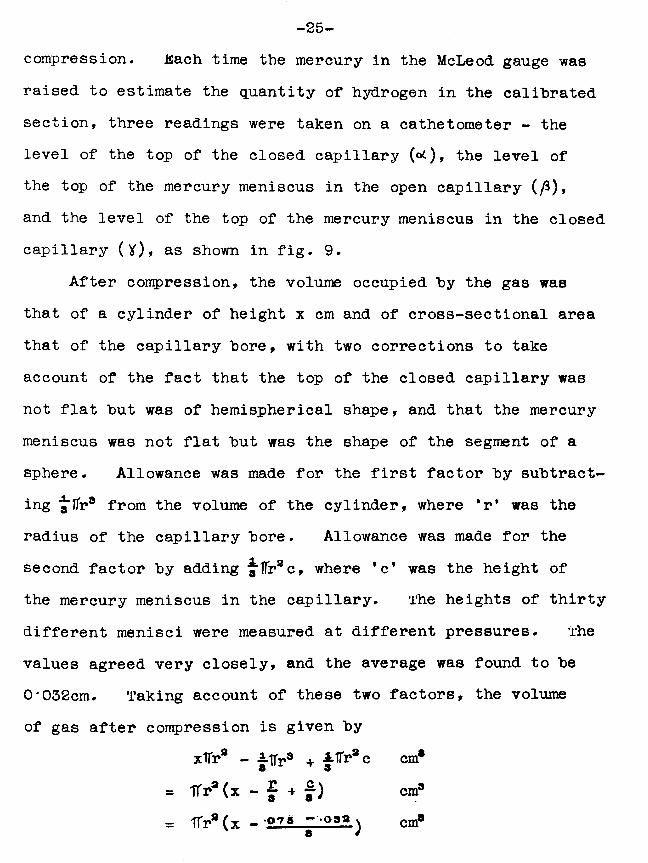
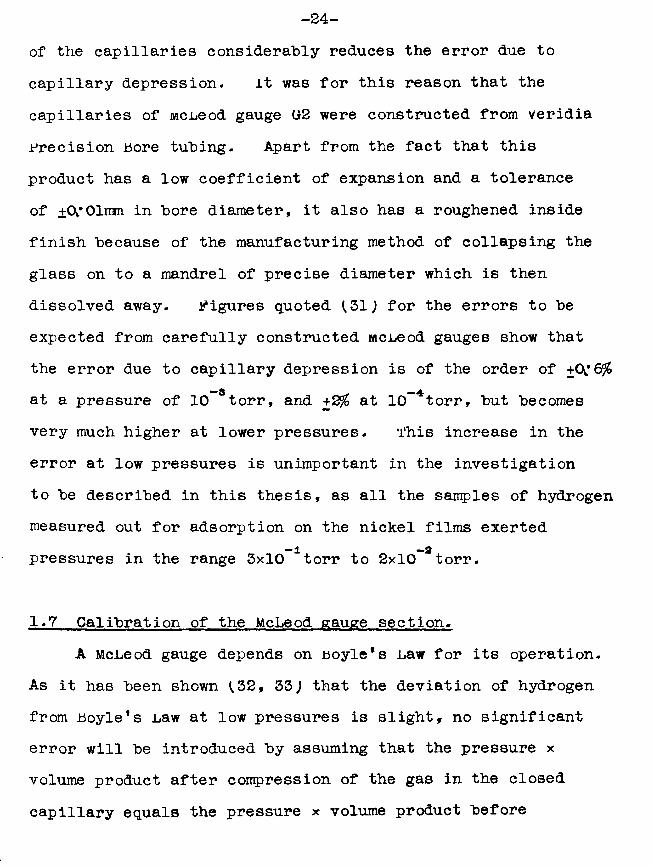
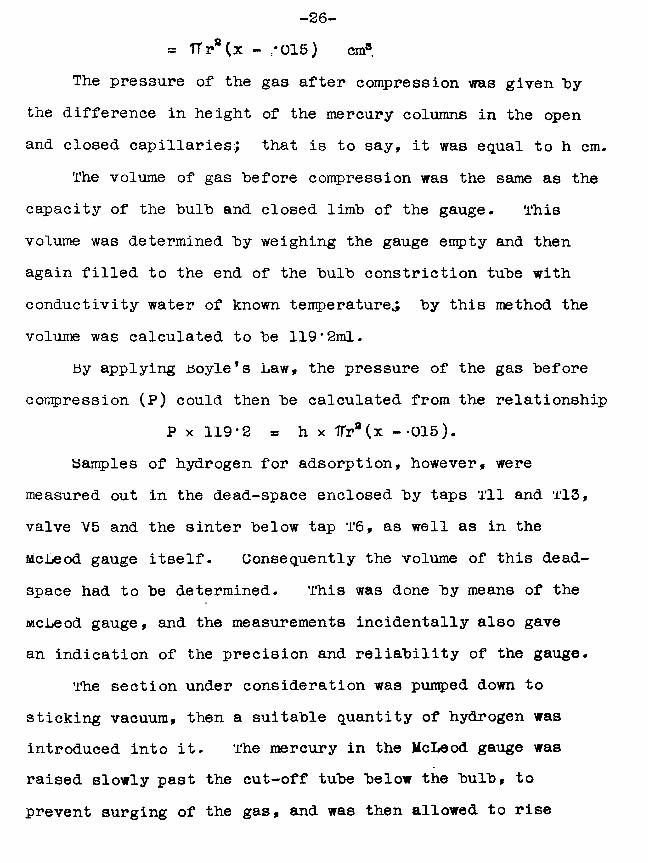
compression. Jfiach time the mercury in the McLeod gauge was raised to estimate the quantity of hydrogen in the calibrated section, three readings were taken on a cathetometer - the level of the top of the closed capillary (°0 , "the level of the top of the mercury meniscus in the open capillary (fi), and the level of the top of the mercury meniscus in the closed capillary (y), as shown in fig. 9.
After compression, the volume occupied hy the gas was that of a cylinder of height x cm and of cross-sectional area that of the capillary hore, with two corrections to take account of the fact that the top of the closed capillary was not flat hut was of hemispherical shape, and that the mercury meniscus was not flat hut was the shape of the segment of a sphere. Allowance was made for the first factor hy subtracting f̂lr8 from the volume of the cylinder, where *r* was the radius of the capillary hore. Allowance was made for the second factor hy adding where 1 c* was the height ofthe mercury meniscus in the capillary. The heights of thirty different menisci were measured at different pressures. The values agreed very closely, and the average was found to he 0*032cm. Taking account of these two factors, the volume of gas after compression is given hy
-26-= TTra(x - / 015) cm8.
The pressure of the gas after compression was given by the difference in height of the mercury columns in the open and closed capillaries; that is to say, it was equal to h cm.
The volume of gas before compression was the same as the capacity of the bulb and closed limb of the gauge. This volume was determined by weighing the gauge empty and then again filled to the end of the bulb constriction tube with conductivity water of known temperature^ by this method the volume was calculated to be 119*2ml.
by applying boyle's Law, the pressure of the gas before compression (P) could then be calculated from the relationship
P X 119-2 = h X 1Tra (x --015).Samples of hydrogen for adsorption, however, were
measured out in the dead-space enclosed by taps I'll and Tl3, valve V5 and the sinter below tap T6 , as well as in the McLeod gauge itself. Consequently the volume of this dead- space had to be determined. This was done by means of the mcLeod gauge, and the measurements incidentally also gave an indication of the precision and reliability of the gauge.
The section under consideration was pumped down to sticking vacuum, then a suitable quantity of hydrogen was introduced into it. The mercury in the McLeod gauge was raised slowly past the cut-off tube below the bulb, to prevent surging of the gas, and was then allowed to rise
-27-fur the r until a quantity of hydrogen, the exact amount ofwhich could he accurately measured, was trapped in the closedcapillary of the gauge* When the mercury levels had cometo rest, each limb was tapped gently several times to ensurethat the menisci had assumed their optimum positions. Thepressure and volume of the trapped gas were then measured,
(x — * 015)has also was the room temperature, three estimates of t---being made to test the reproducibility of the gauge measurements.
Keeping the mercury in the McLeod gauge G2 raised, the hydrogen in the dead-space was pumped away till sticking vacuum was achieved on McLeod gauge Gl. The mercury in gauge G2 was then lowered, permitting the hydrogen which had been trapped in the closed capillary to expand into the entire section. When equilibrium had been reached, the gauge mercury was again slowly raised, thus trapping a proportion of the hydrogen in the closed capillary. As before, three estimates of r- for the trapped hydrogen were made.
This procedure was carried out four times in all; that is, three times hydrogen in the bulb and closed capillary (of known volume) was allowed to expand into the entire section which was being calibrated (of unknown volume). Results are shown in table 1 .
in all cases, the agreement among the different( JT m m * 015 illestimates for a particular value of ' ■ 1 -j was better
than I%. The agreement among the three estimates of the
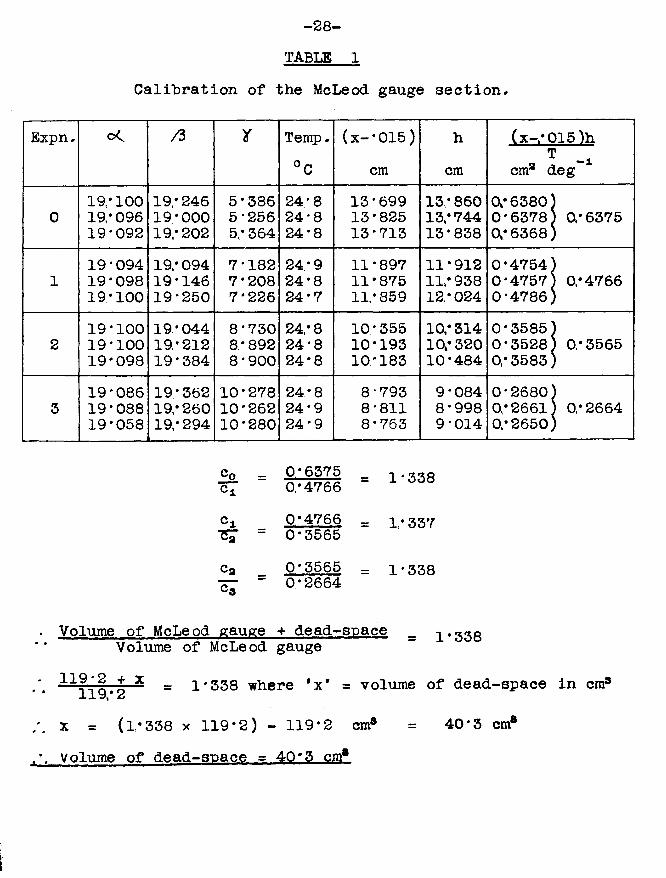
-28- TABLE 1
Calibration of the McLeod gauge section.
Expn. c< /3 Y Temp. °C
(x-*015) cm
hcm
(x-.-015)hT -1cm8 deg
019.* 100 19,* 096 19*092
19,* 246 19*000 19,* 202
5*386 5*256 5,* 364
24*824*824*8
13*69913*82513*713
13*86013/74413*838
0/6380)0*6378) 0*6375 0/6368)
119*09419*09819*100
19,* 094 19*146 19*250
7*1827*2087*226
24*924*824*7
11*897 11/875 11/859
11*91211/93812/024
0*4754)0*4757) 0/4766 0*4786)
219*10019*10019*098
19*04419*21219*384
8*7308*8928*900
24/824*824*8
10*35510*19310/183
10/31410/32010*484
0*3585)0*3528) 0/3565 0*3583)
319*08619*08819*058
19*362 19,* 260 19/294
10*27810*26210*280
24*824*924*9
8*7938*8118*763
9*0848*9989*014
0*2680)0/2661) 0/2664 0/2650)
£o = = 1*338c± 0*4766c± 0/4766 = 1,» 337757 = 0*3565c3 0* 3565 = 1*33877“ = 0*2664
Volume of McLeod gauge + dead-space = 1.333Volume of McLeod gauge
-x _ 1*338 where *x’ = volume of dead-space in cm3-L x y»# 2x = (1*338 X 119*2) - 119*2 cm3 = 40*3 cm8Volume of dead-soace - 40*3 cm8
-29-expansion ratio was also excellent, showing that the McLeod gauge, carefully manipulated, was an accurate and reproducible measuring device for the purposes for which it was to he used during the course of this work.
It was now possible to calculate the number of atoms in a sample of hydrogen admitted to the calibrated section from a knowledge of the room temperature and the three cathetometer readings , fb and y (from which x - /015 and h could be calculated). The procedure was as follows:Volume of gas trapped in closed capillary at h cm pressure and T°K temperature *= TTra(x - *015) cm3 Volume of gas in McLeod gauge + dead-space
= l*338lTr8(x - *015) cm®But 22*415 litres of gas at 76 cm pressure and 273*16°K.
9 3temperature contain 6*023 x 10 molecules.l*338TTra(x - *015)ml of gas at h cm pressure and T°K
temperature contain
. _.»3 l-338irr“(x - -015) h ,, 273‘16 „,2 x 6-023 x 10 x ------------------ x — * atoms
= 4-569 x 1018 x (y ~ ‘ 915)h atoms.
1.8 The Tfrpler pumps.TOpler pumps Bl and P2 were incorporated in the design
of the apparatus to enable samples of hydrogen to be punrped
-30-quant it at ively from one section of the apparatus to another. Tftpler pump PI was actually not used as such until experiments involving tritium were carried out, so its functions will he described in a later chapter- Tbpler pump P2 however was used in all experiments to transfer excess hydrogen which had not been adsorbed on the evaporated metal film back from the catalyst vessel and .rirani sections to the calibrated section for measurement by McLeod gauge U2.
Each TOpler punrp (fig. 4) had a bulb of capacity about 15uml. To the lower end of this bulb was attached a B24 cone with an extension tube which dipped into a mercury reservoir. A tube containing a ground glass non-return valve, which sat in a pool of mercury to effect a vacuum seal, was attached to the upper end of the bulb. Inside the stem of the valve there was a length of stainless steel, so that if desired it was possible to hold the valve open by means of a magnet- At a suitable height above the valve, there was a No.4 glass sinter; when pumping was completed, the mercury was always raised to this level, so that the volume of the calibrated section remained constant. The level to which the mercury in the pumps* side-arms could be raised was similarly limited by ball valves V4, V5 and V7. The side-arm in each pump entered the main portion at a point between the foot of the bulb and the B24 cone.
When Topler pump B2 was being used to transfer hydrogen
-31-from the catalyst vessel to the calibrated section, the two- way tap T13 was adjusted so that it connected the catalyst vessel and Hirani sections to the side-arm of the Topler pump. The two-way tap T12 was adjusted so that it connected the bulb of the Topler pump to the calibrated section. To commence purnping, the mercury level was lowered to its minimum. Hydrogen from the catalyst vessel section expanded into the Topler pump bulb via the pump's side-arm. The mercury level was then raised, forcing the hydrogen in the bulb past the non-return valve and into the calibrated section. Lowering the mercury level again created a vacuum in the bulb, until the level was so low that the side-arm was once more connected to the bulb. When this happened, more hydrogen from the catalyst vessel expanded into the bulb, and the entire process was repeated.
To test the efficiency of the Topler pump, the following blank experiment was performed. A "dummy11 catalyst vessel was constructed, attached to the apparatus, and evacuated.It was identical to an ordinary catalyst vessel in all respects except that it contained no nickel filament or evaporated nickel film, so that no adsorption of hydrogen would occur in it. A sample of hydrogen was introduced into the calibrated section and its quantity measured by means of McLeod gauge li2. Tap T13 was opened, allowing the hydrogen to expand into the catalyst vessel section. when equilibrium
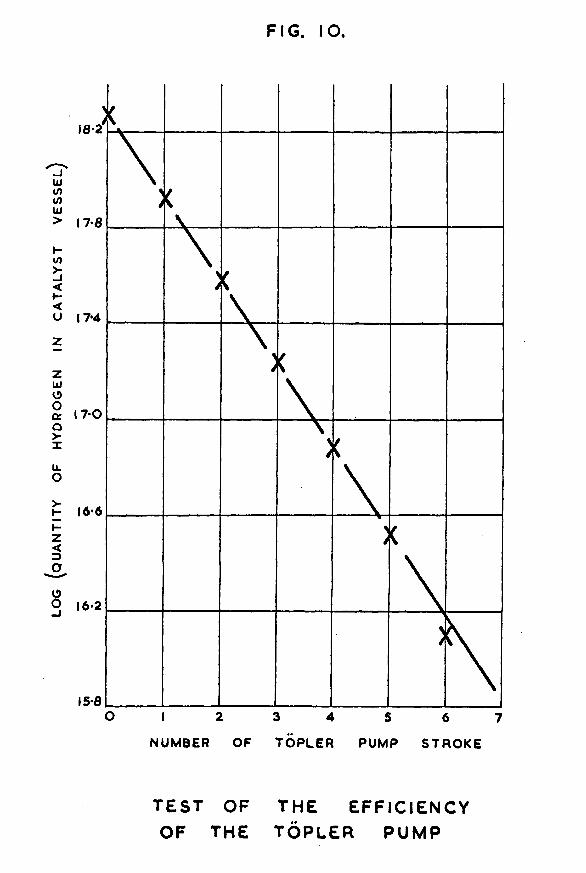
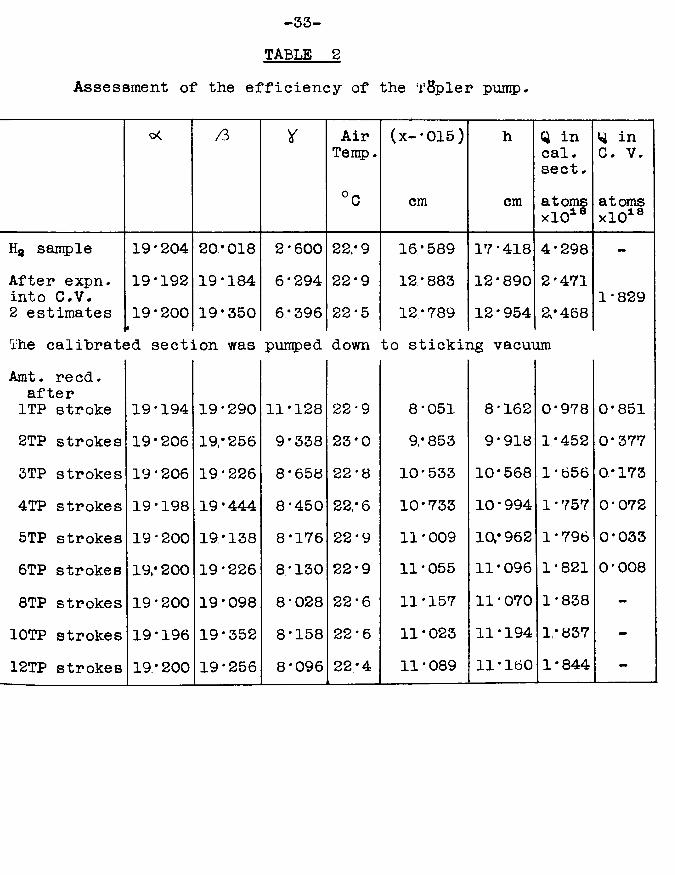
-32-had been reached, tap '1*13 was closed and the amount of hydrogen remaining in the calibrated section was measured, py subtraction, the quantity of gas in the catalyst vessel section could be calculated. une stroke of the fopler pump was then made from catalyst vessel to calibrated section, raising the mercury very slowly past the cut-off to avoid surging of the gas.; at each stage, time was allowed for equilibrium to be reached. The quantity of gas in the calibrated section after the first Topler puirrp stroke was measured. The process was repeated several times for further •ropier pump strokes. The results are shown in table 2.These results show that after six strokes of the Topler pump virtually all the hydrogen in the catalyst vessel had been recovered. A graph was plotted of ~log (quantity of hydrogen in catalyst vessel)” against "number of T8pler pump stroke?It is shown in fig. 10. The fact that the graph is a straight line proves that a constant fraction of the quantity of gas in the catalyst vessel is transferred at each stroke of the pump. The actual amount remaining after six strokes will hence depend on the ratio of the volume of the catalyst vessel and associated parts to the volume of the TSpler pump bulb. The amount will therefore vary slightly from catalyst vessel to catalyst vessel as these are bound to differ a little in size. However in all cases where the catalyst vessel is at room temperature, this blank experiment has
LOG
(QU
AN
TITY
OF
H
YDR
OG
EN
IN C
ATA
LYS
T V
ES
SE
L
FIG. IO.
18-2
17-8
17‘4
17-0
16*6
15*8O 3 42 5 6 7
NUMBER OF TO PLER PUMP STROKE
T E S T OF T H E E F F I C I E N C Y OF THE T O P L E R P U M P
-33- TABLE 2
Assessment of the efficiency of the u‘8pler pump*
c< /3 Y AirTemp.
°C
(x-*015)
cm
h
cm
Q in cal. sect *atomsxlO18
Q in C. V.
atomsxlO18
Ha sample 19*204 20/018 2*600 22/9 16/589 17*418 4*298 -After expn. 19*192 19*184 6/294 22*9 12/883 12*890 2*471into C.V.2 estimates 19*200 19/350 6/396 22*5 12/789 12*954 2/468
1*829
The calibrate3d section was pumped down to sticking vacuumAmt. r e cd. after 1TP stroke 19*194 19*290 11*128 22*9 8*051 8*162 0*978 0*8512TP strokes 19/206 19/256 9*338 23*0 9/853 9*918 1*452 0*3773TP strokes 19*206 19/226 8*658 22*8 10*533 10/568 1 * 656 0/1734TP strokes 19*198 19/444 8*450 22/6 10*733 10 * 994 1*757 0*0725TP strokes 19*200 19/138 8*176 22*9 11*009 10/962 1*796 0*0336TP strokes 19/200 19*226 8/130 22*9 11*055 11/096 1*821 0*008
8TP strokes 19*200 19*098 8*028 22*6 11*157 11 * 070 1*838 -
IOTP strokes 19*196 19*352 8*158 22*6 11*023 11*194 1/837 -
12TP strokes 19/200 19*256 8*096 22*4 11*089 11*160 1*844 -
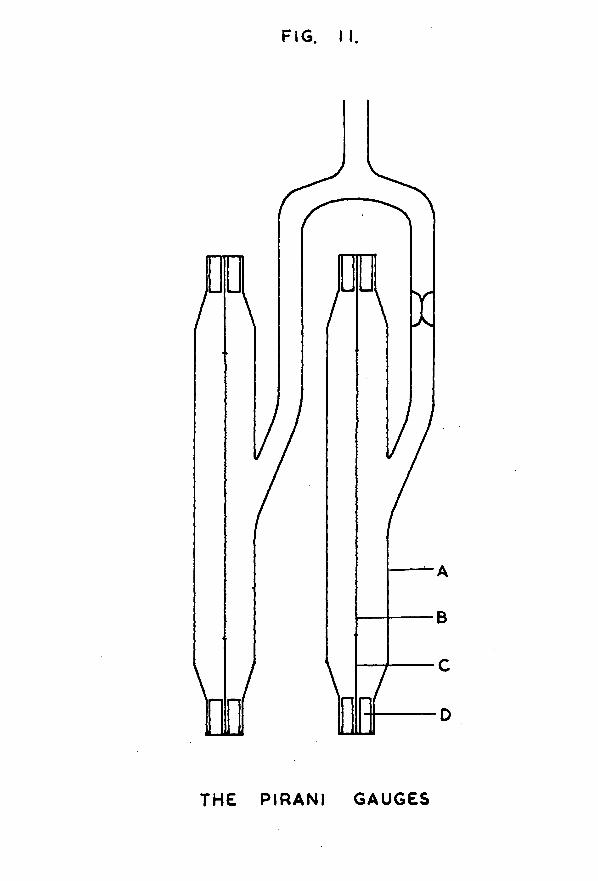
FIG. I I .
THE PIRANI GAUGES
-34-shown that six strokes of the T$pler pump will transfer more than 99$ of the gas phase hydrogen in the catalyst vessel to the calibrated section. If the catalyst vessel were at liquid nitrogen temperature, however, as it was for some experiments, more Tfipler pump strokes would he required, because, by the Gas Law, cooling a vessel from 20°C to 77°K increases its effective capacity for accommodating gas by a factor of about four (i.e. 77/293). in all the adsorption experiments, I'Spler pumping was always continued until the Pirani gauges indicated a negligible pressure in the catalyst vessel section; the purpose of the above blank experiment was merely to show that the Ttfpler pump was capable of transferring gas quantitatively from one section to another, without any loss by gas being trapped in the valve of the pump.
1»9 The Pirani gauges.These gauges were used to give a continuous qualitative
measure of the pressure of hydrogen in the catalyst vessel section.
t w o identical gauges were constructed, one to act as compensator for the other. Their design is shown in fig. 11. The glass envelope (A) containing each gauge was constructed "by joining together the Pyrex ends of two Jencons l/4in Pyrex- to-copper Housekeeper seals. A side-arm, connected half-way down the envelope, provided the connection to the high vacuum
-35-system; the side-arm on the compensating gauge carried a constriction for subsequent sealing off.
It is known (34) that the sensitivity of a Pirani gauge varies with the square root of the surface area of the filament. To obtain a sensitive instrument, the filaments for these gauges were constructed from a coiled coil of tungsten wire, obtained by halving the filament from a 25watt electric light bulb. Each gauge therefore had a filament of resistance about 100ohms.
Each filament (B) was inserted in its glass container, employing the following technique. To each end of the filament a 2cm length of 0*02in diameter silver wire (C) was attached by means of silver solder. These pieces of silver wire were then soft soldered in the centre of the copper ends of the Housekeeper seals, introducing thick- walled pieces of copper tubing (D) to help fill up the space between wire and seal. The length of the glass envelope was such that when the filament was in position, the coil of tungsten was slightly stretched.
When both gauges had been constructed, they were mounted close together vertically, and attached to the catalyst vessel section of the adsorption apparatus (fig. 4). They were evacuated, the degassing process being speeded up by surrounding the gauges with very warm water while pumping was being carried out. The soldered joints were tested for
-36-leaks, and the constriction on the compensating gauge was degassed hy heating it several times in an orange glass- blowing flame. When sticking vacuum had been achieved and maintained on McLeod gauge G2, the constriction was sealed off, and the gauges were ready for use.
When in use, the gauges were always immersed deep in a Dewar of liquid nitrogen because Ellet and Zabel (34) have shown that the sensitivity of such an instrument can be increased by keeping the wall temperature of the gauges low.It was also important to keep the gauges immersed deep in liquid nitrogen to prevent the thermal conductivity of the leads from adversely affecting the temperature stability of the device (35).
Pirani gauges depend for their operation on the fact that the heat conductivity of a gas at low pressure decreases linearly with decreasing pressure. Hence the amount of heat conducted away from the filament of the gauge depends on the pressure of gas filling the instrument. The temperature of the filament, and therefore its resistance, thus vary with gas pressure. It is these changes in the resistance of the filament that are actually observed.
The filaments of the above gauges were heated by current from a lead accumulator. It was found that if the voltage was set at 1 volt by means of a 250 ohm potentiometer, this was sufficient to keep the filaments at about room temperature.
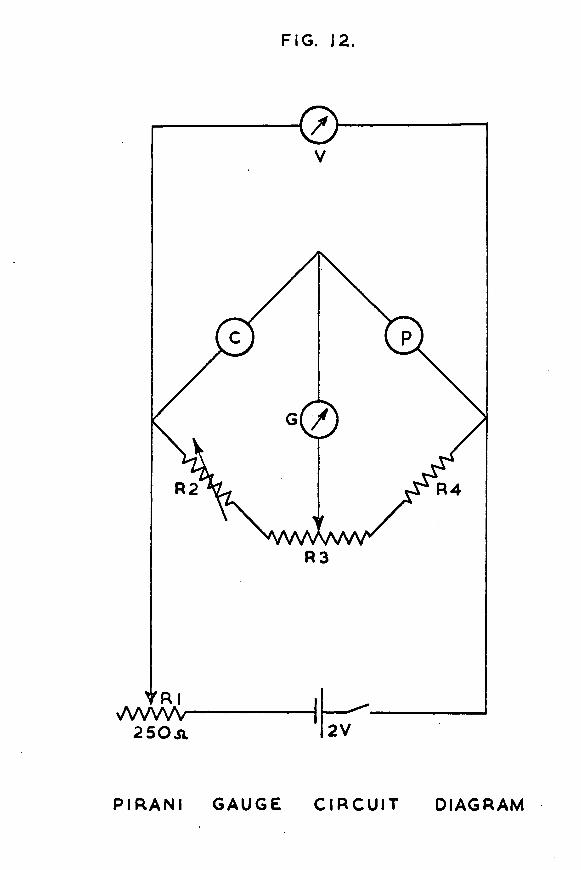
FIG. 12.
R2 R4
R 3
Y R l vVWVV 250 SL 2 V
P IR A N I GAUGE C I R C U I T DIAGRAM
-37-An adequate temperature gradient "between the filaments and the walls of the gauge was thus achieved.
The Pirani gauge circuit diagram is shown in fig. 12.Under conditions of high vacuum, the gauge P and its compensator C formed two arms of a balanced Wheatstone bridge circuit.The galvanometer G was used to measure the out-of-balance current obtained as the pressure of hydrogen in the gauge varied. The potentiometer R3 was a 50 ohm close tolerance unit supplied by Beckmann Instruments Ltd., and was used for adjusting the out-of-balance current. R4 was a 12 ohm resistor. R2, a 200 ohm close tolerance Beckmann potentiometer, was provided to balance the bridge initially. Both potentiometers were 10 turn instruments, and were fitted with multi-turn indicating dials reading to better than ±0*1% of the full resistance. The galvanometer G was a Pye Scalamp Galvanometer 7901/S, with a nominal resistance of 24 ohms. Its sensitivity could be varied in five steps by built-in shunts, but it was the least sensitive scale which was most commonly used.
The Pirani gauge was calibrated against McLeod gauge G2, so that the observed deflection of the galvanometer spot could Le interpreted in terms of the absolute pressure of hydrogen in the Pirani gauge and catalyst vessel sections. The Pirani gauge was found to have a useful pressure range in the region °f 10 to 10 *torr.
Before each adsorption experiment, the Pirani gauge was
-38-evacuated till sticking vacuum was achieved on the McLeod gauge, this corresponding to a pressure of about 10~6torr. Under these conditions, the galvanometer light beam was set in its zero position at the extreme left of the scale, by- adjusting R2. When hydrogen was admitted to the catalyst vessel section, the light beam was deflected to the right of the scale. As the hydrogen was adsorbed, the pressure in the Pirani gauge decreased, and the light beam gradually returned to its zero position. An indication that the nickel surface was saturated with hydrogen was obtained when the galvanometer spot did not return to its zero position after admission of a gas sample. As well as giving an indication of when the catalyst was saturated with hydrogen, the Pirani gauges were also employed in giving visual information about any slow sorption process which might occur after the main bulk of the hydrogen had been adsorbed. Lastly, they were useful in indicating when all the unadsorbed gas phase hydrogen had been Tttpler pumped from the catalyst vessel back into the calibrated section for measurement.
-39-
C H A P T E R 2 A COMPARISON BETWEEN THE ADSORPTIVE CAPACITIESOP NICKEL FILMS DEPOSITED IN VACUUM AT 25°C AND NICKEL FILMS DEPOSITED IN HYDROGEN AT 25°C.
The purpose of the investigation described in this thesis was to decide whether an individual metal atom was independently capable of acting as an adsorption site for a potential reactant in a catalytic reaction, or whether the property of adsorption was only acquired when the atoms combined together to form the bulk metal. The system chosen for study was the adsorption of hydrogen on an evaporated nickel film.For the reasons given in the introduction, the problem was approached by comparing the adsorptive capacity of a nickel film deposited in vacuum with that of a film deposited in the presence of hydrogen, and by searching for enhanced adsorption in the latter case.
2.1 Pre-evaooration treatment of the catalyst vessel.To obtain uncontaminated nickel films which would give
reproducible results (4), it was necessary, before depositing the film on the inside wall of the catalyst vessel, to ensure that the glass and the nickel wire itself had both been freed from adsorbed or occluded gases. This pre-evaporation treatment of the catalyst vessel was the same for every ©xperiment performed during the course of the investigation,
-40-and was carried out as follows.
The catalyst vessel, constructed to the design illustratedin fig. 1, was glass-blown on to the baking-out high vacuumapparatus in an upright position via the side-arm containingthe constriction. The apparatus was first evacuated by means
-2of the rotary pump. When a reasonable vacuum (about 10 torr) had been obtained by this method, the diffusion pump was switched on, and pumping was continued until sticking vacuum was achieved on the McLeod gauge, indicating a pressure lower than 10 torr.
The glass walls of the catalyst vessel were next degassed by surrounding the vessel with a tubular furnace capable of attaining a temperature of 500°C. The furnace was constructed from a piece of copper tubing just wide enough to fit closely round the vessel, and of approximately the same length. The tube was wound with a spiral of nichrome tape to a coldresistance of 130ohms, the tape being secured at each end,and connected to the electricity supply, by means of 18 gauge copper wire. The tape was insulated from the copper tube by several layers of asbestos paper. Asbestos string was wound closely round the furnace over the tape to insulateit thermally. The resistance of the furnace was chosen sothat, when operated directly from the mains electricity supply, a temperature of slightly greater than 500°C was attained.Finer temperature adjustment was achieved by the use of a
-41-Sunvic siramerstat, the settings of which were calibrated against a borosilicate thermometer.
The nickel filament was degassed by heating it electrically to just below its evaporation temperature. This was achieved by passing a current of 4 '(Damps through the filament when the furnace was at 500°C. The power supply used to heat the filament consisted of a 70arnp 12volt mains transformer, fed by a Yariac transformer. The current passing through the filament was measured on an A.C. ammeter which had a full scale deflection of lOarnps.
It was found that when the glass and filament of the catalyst vessel were heated in this way, the gas pressure in the apparatus, as measured by the McLeod gauge, rose
—3rapidly from 10 to 10 torr, showing that contaminatinggases were indeed being liberated by the treatment. Heatingand pumping were continued until the pressure returned to , . -6its original value of 10 torr, indicating that degassing was complete. It was then necessary to drive off gas adsorbed on the glass of the constriction. This was done by warming the constriction in a glass-blowing flame till the flame turned orange, indicating that the glass had been heated to its softening point. This procedure was repeated three or four times until no further gas was evolved. Any other portions of the catalyst vessel which protruded beyond the furnace were flamed out in a similar fashion. Finally, the current
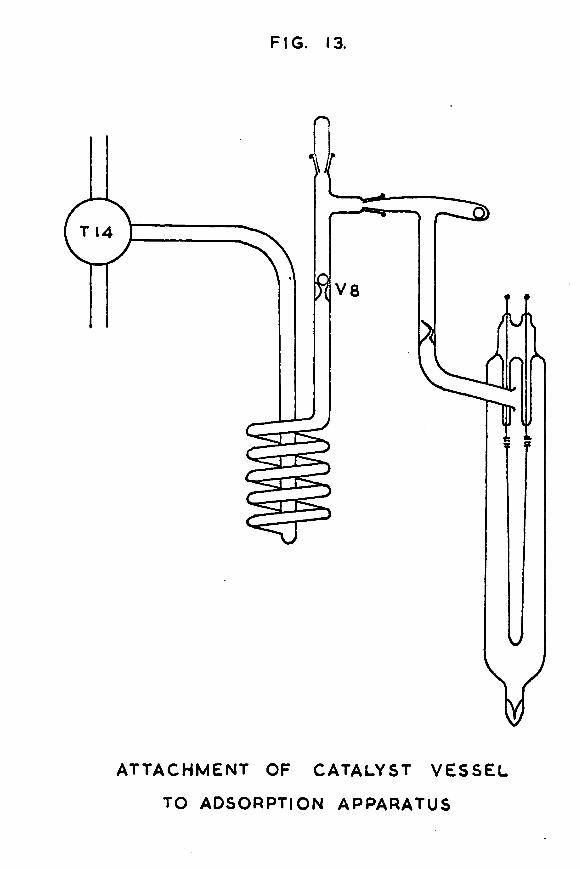
FIG. 13.
AT TACHM EN T OF CATALYST V E S S E L
TO ADSORPTION APPARATUS
-43-passing through the nickel filament was flashed up to 6*5amps several times for 10 seconds each time, to remove the last traces of adsorbed gas from the wire.
In every experiment, this degassing procedure was continued until the McLeod gauge recorded sticking vacuum even when the catalyst vessel, still being heated, was disconnected from the pumps by raising the mercury in the cut-off. Twelve to thirty hours normally elapsed before this completely degassed state was achieved. Having achieved it, the vessel was sealed off at the constriction and removed from the degassing apparatus, ready for the nickel film to be deposited.
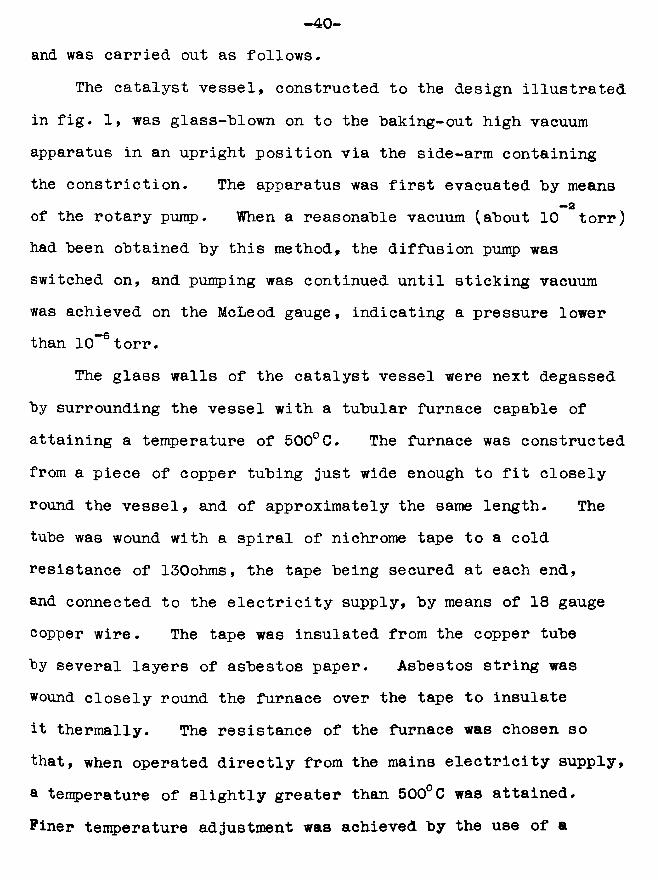
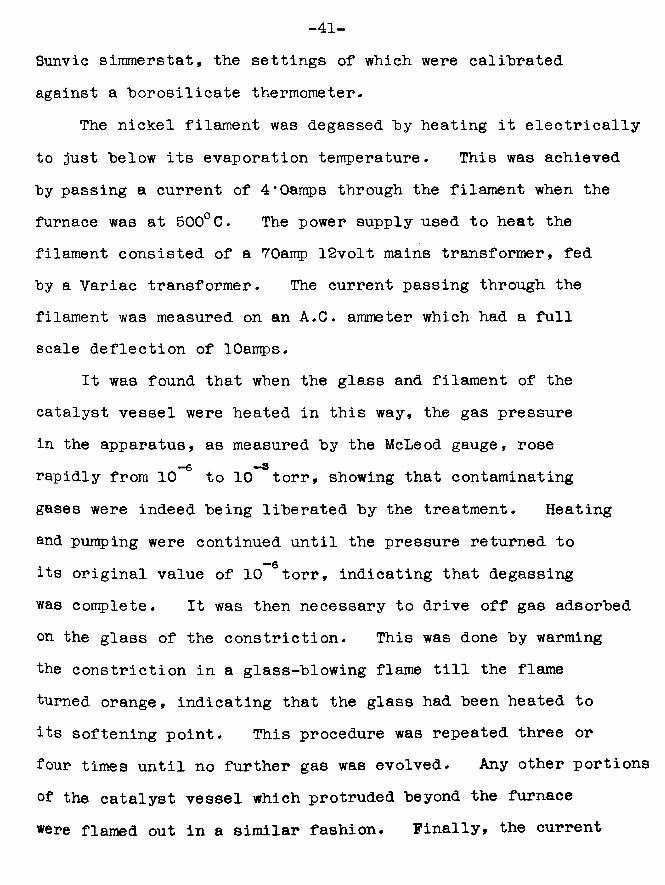
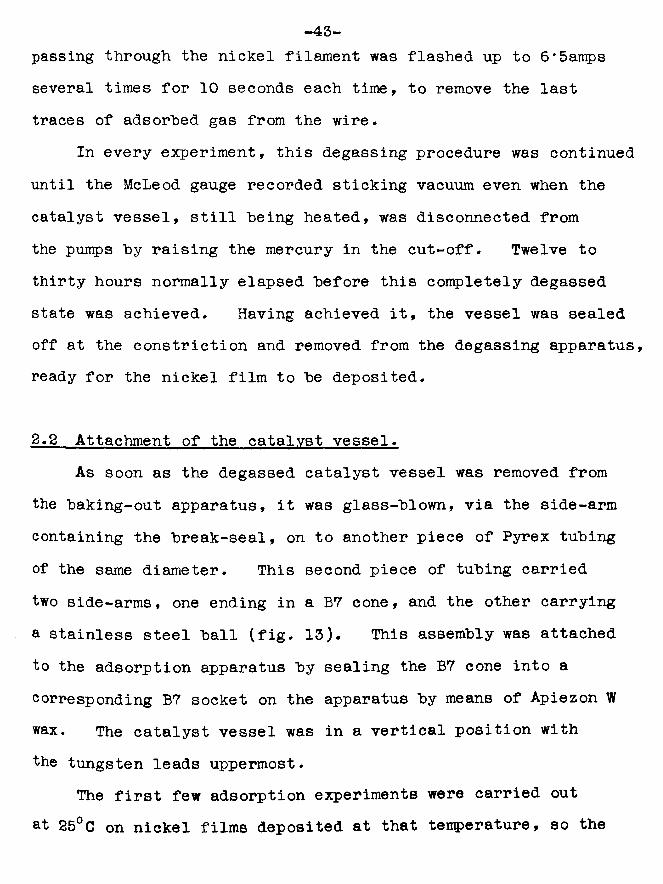
2.2 Attachment of the catalyst vessel.As soon as the degassed catalyst vessel was removed from
the baking-out apparatus, it was glass-blown, via the side-arm containing the break-seal, on to another piece of Pyrex tubing of the same diameter. This second piece of tubing carried two side-arms, one ending in a B7 cone, and the other carrying a stainless steel ball (fig. 13). This assembly was attached to the adsorption apparatus by sealing the B7 cone into a corresponding B7 socket on the apparatus by means of Apiezon W wax. The catalyst vessel was in a vertical position with the tungsten leads uppermost.
The first few adsorption experiments were carried out at 25°C on nickel films deposited at that temperature, so the
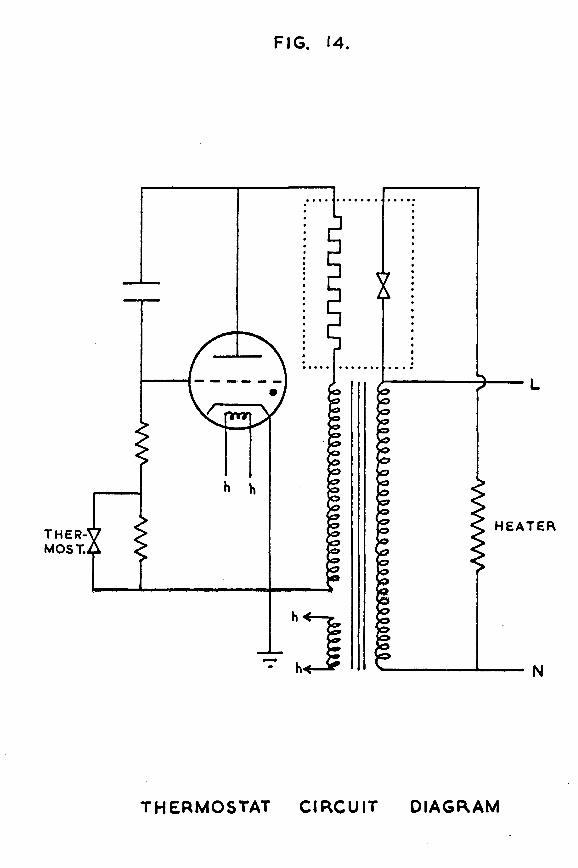
FIG. 14.
H E A T E R©T H E R- MOSTw
THERMOSTAT c i r c u i t DIAGRAM
-44-catalyst vessel was immersed in a thermostat tank filled with 40 litres of water at 25° C. The water temperature was controlled to + 0*1 degree hy a Jackson thermoregulator and an A.E.I. electronic relay type E.A.4. The water in the tank was stirred "by circulating it with a Stewart No. 10 electric pump. The heater was a lOOwatt electric light "bulb, and, for occasions when room temperature approached 25° C, a water cooling coil was also provided. The circuit diagram for the thermostat is shown in fig. 14.
The intervening tubing connecting the catalyst vessel to the adsorption apparatus was evacuated through tap T14 and the main vacuum line. When sticking vacuum on McLeod gauge 02 had been achieved, the spiral trap was surrounded with a Dewar of liquid nitrogen, and left for at least half an hour to ensure that all the mercury vapour in the section had condensed. The apparatus was then ready for the actual deposition of the nickel film.
2.3 Den os it ion of the nickel film in vacuum and subsequentadsorption of hydrogen on it.When it was desired to deposit a nickel film in vacuum
at 25°C, the following procedure was adopted. As soon as the catalyst vessel, immersed in the thermostat tank, had reached the temperature of its surroundings, a current of 6*5amps was passed through the nickel filament, using the
- 45-
same electrical equipment as in the degassing process. This caused the nickel filament to become almost white hot, and to evaporate slowly, depositing a nickel film on the inside of the glass wall of the catalyst vessel in the region of the filament. The actual magnitude of the evaporating current was rather important, because if it was a little too high, the filament tended to melt locally and break before a sufficiently heavy film had been formed. With a current of 6*5amps, the filament evaporated at the rate of about 40mg per hour, and the films deposited usually weighed between 20mg and 50mg.Nickel films, deposited under conditions of high vacuum, had a silvery mirror-like appearance.
Having prepared a nickel film in this way, its adsorptive capacity for hydrogen was determined as follows. A sample of ultra-pure hydrogen from the storage bulb was introduced into the calibrated section, and its quantity was measured by means of McLeod gauge G2. After adjusting the positions of taps T13 and T14 so that the calibrated section was connected directly to the side-arm of the catalyst vessel, the steel ball (fig. 13) was lifted by means of a magnet and dropped on to the break-seal, causing it to shatter. A connection was thus effected between the calibrated section and the inside of the catalyst vessel where the nickel film was deposited.As the hydrogen sample expanded from the calibrated section into the catalyst vessel, the galvanometer light beam associated
—46—with the Pirani gauge swung to the extreme right of the scale; the beam had previously been zeroed at the extreme left of the scale under conditions of sticking vacuum. However, as the hydrogen was adsorbed on the nickel film the beam gradually came back almost to its zero position, indicating that the residual pressure in the catalyst vessel after adsorption was less than 10 *torr. Tap T13 was then shut, and the quantity of hydrogen remaining in the calibrated section was measured,; this was usually a very small amount. The difference between the quantity of hydrogen originally measured out and the quantity remaining in the calibrated section gave the amount of hydrogen introduced into the catalyst vessel section.
A second sample of hydrogen was then measured out in the calibrated section, and tap T13 was again opened to allow the sample to expand into the catalyst vessel as before.This process was repeated until an appreciable residual pressure of hydrogen was detectable in the catalyst vessel section after equilibrium had been reached, showing that the nickel film was saturated with hydrogen. It was known when this state of affairs had been achieved, because the Pirani light beam did not return to its zero position, but remained at a reading corresponding to a much higher pressure. On watching the light beam very closely at this stage, it was observed that the beam was not entirely stationary but was actually moving extremely slowly towards the left of the scale.
-47-This was taken as an indication that a slow sorption process was occurring. Many reports of this phenomenon have already appeared in the literature (24, 36, 37, 38, 39). This slow sorption was allowed to proceed for about half an hour, after which time no further uptake could he detected. When the surface of the nickel film had been saturated in this way, the residual gas phase hydrogen remaining unadsorbed in the catalyst vessel section was transferred back into the calibrated section by means of Tttpler pump P2, where it was measured. It was found that six or eight strokes of the pump reduced the pressure in the catalyst vessel to 10 *torr, as indicated by the Pirani gauge. More strokes of the Tttpler pump did not reduce the pressure further.
Prom the McLeod gauge readings taken during the course of the experiment, it was possible to calculate the total number of hydrogen atoms adsorbed on the nickel film.
.2-4 Deposition of the nickel film in hydrogen and simultaneousadsorption of hydrogen on it.Considerable difficulty was encountered in developing
* technique for depositing a nickel film in the presence of hydrogen and measuring the adsorption occurring on it. Several methods were attempted, none of which was particularly satisfactory.
The first experimental procedure to be attempted involved
-48-attaching the degassed catalyst vessel to the adsorption apparatus and evacuating the connecting tubing as already described in detail in section 2.2. A sample of hydrogen was then measured out in the calibrated section. Immediately, the break-seal was broken and the hydrogen sample allowed to expand into the catalyst vessel as before. It was only at this stage, when a small pressure of hydrogen was in the catalyst vessel, that the nickel filament was heated to its evaporation temperature. It was found necessary in this case to apply an evaporating current of 6*8amps to achieve a deposition rate of about 40mg per hour, presumably because the hydrogen was conducting heat away from the filament. As soon as adsorption had started, tap T13 was shut, and the amount of hydrogen remaining in the calibrated section was estimated. As rapidly as possible, a second sample of hydrogen was measured out in the calibrated section, and then tap T13 was opened again, allowing the gas to expand into the catalyst vessel. This process was repeated, either until the filament broke or until it was deemed that a sufficiently heavy film had been deposited, when the evaporation current was switched off. As before, half an hour was allowed for any slow sorption to occur, then the unadsorbed hydrogen remaining in the catalyst vessel was transferred, by means of Tttpler pump P2, back into the calibrated section for measurement. Pumping was continued until the residual
-49-pressure in the catalyst vessel, as measured by the Pirani gauge, was lO'^torr.
Prom the appropriate McLeod gauge measurements, the total amount of hydrogen adsorbed on the nickel film could be calculated.
This was the method used in experiments 5,6 and 7 (see table 5 in section 2.7). While the method may appear satisfactory in theory, in practice it was sometimes found that all the gas phase hydrogen in the catalyst vessel from one sample had been adsorbed before another sample could be measured out and introduced. When this happened, part of the nickel film had effectively been deposited in vacuum. Although, with practice, the technique of knowing just when to measure out and introduce a fresh hydrogen sample was finally mastered, there was always an element of doubt as to whether sufficient hydrogen had been readily available throughout the entire deposition.
To overcome this difficulty, a second experimental procedure was developed. This was the method used in run 33 (see table 5 in section 2.7), and was essentially very similar to the first method with the following important difference. After a sample of hydrogen had been introduced into the catalyst vessel as usual, film deposition was started. However, when approximately two thirds of this first hydrogen sample had been adsorbed, the evaporation current was switched off, and
-50-tap T13 was shut. The amount of hydrogen remaining in the calibrated section was estimated, and then a second hydrogen sample was measured out. Tap T13 was opened to allow this fresh sample to expand into the catalyst vessel, then the evaporation current was switched on again and film deposition continued. This process was repeated until a sufficiently heavy nickel film had been formed. Thereafter, the experimental procedure was exactly as for the first method.
While this second method undoubtedly ensured that the film was always being deposited in the presence of hydrogen, the pressure of which varied between 3x10 1torr and lxlo 1torr, it still suffered from the serious disadvantage that deposition of the nickel film was not continuous. The evaporation current was always switched off while fresh samples were being measured out; when it was switched on again, a little time was required to stabilize it at the desired steady value of 6*8amps. Anderson, Baker and Sanders (40) have recently shown that the rate of deposition of a film has an influence on its adsorptive capacity, a low rate of condensation giving rise to films of high specific area. Hence variations in the magnitude of the evaporation current will affect the adsorptive capacity of the film being deposited.
Actually, this objection is valid for both the methods of film preparation outlined in this section. As hydrogen is adsorbed on the film, the pressure of gas phase hydrogen
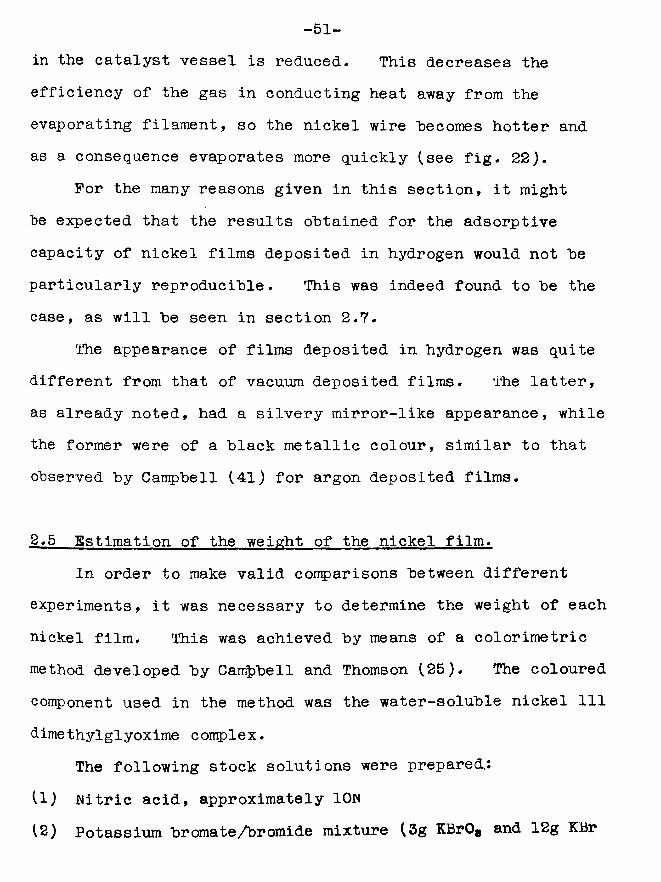
-51-in the catalyst vessel is reduced. This decreases the efficiency of the gas in conducting heat away from the evaporating filament, so the nickel wire becomes hotter and as a consequence evaporates more quickly (see fig. 22).
For the many reasons given in this section, it might be expected that the results obtained for the adsorptive capacity of nickel films deposited in hydrogen would not be particularly reproducible. This was indeed found to be the case, as will be seen in section 2.7.
The appearance of films deposited in hydrogen was quite different from that of vacuum deposited films. The latter, as already noted, had a silvery mirror-like appearance, while the former were of a black metallic colour, similar to that observed by Campbell (41) for argon deposited films.
2.5 Estimation of the weight of the nickel film.In order to make valid comparisons between different
experiments, it was necessary to determine the weight of each nickel film. This was achieved by means of a colorimetric method developed by Campbell and Thomson (25). The coloured component used in the method was the water-soluble nickel 111 dimethylglyoxime complex.
The following stock solutions were prepared,:(1) Nitric acid, approximately ION(2) Potassium br ornate/bromide mixture (3g KBrO# and 12g KBr
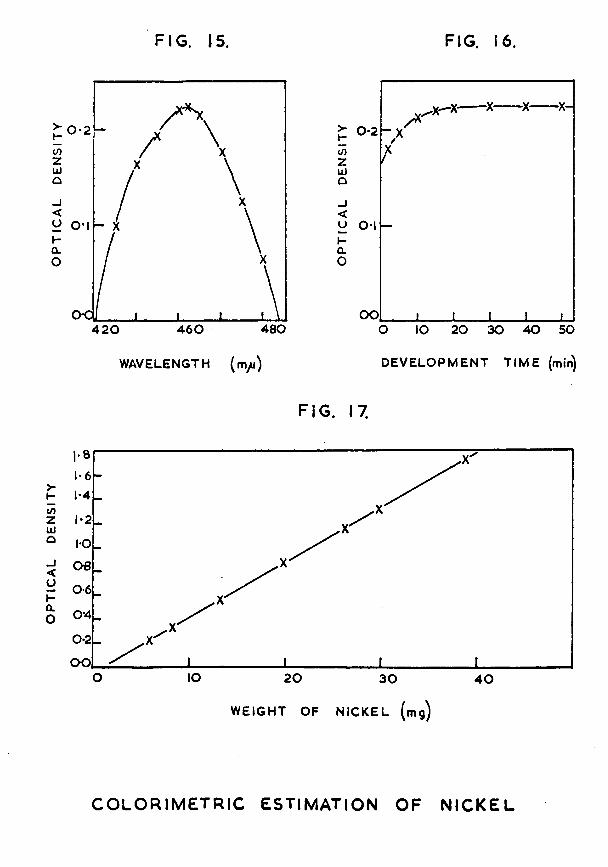
OP
TIC
AL
DE
NS
ITY
FIG. 15. FIG. 16.
•x-£ 0-2tozUJQ_J<o 0-1»-Q.o
ooIO 20 30 4 0 50O
£ 0-2inzUJQ<OHQ.o
4 6 0 4804 2 0
WAVELENGTH (m /j) DEVELOPMENT T IM E (min)
FIG. 17.
1*4
1-0OB0-60-4
OOO IO 20 3 0 4 0
WEIGHT OF NICKEL (mg)
C O L O R IM E T R I C ESTIMATION OF N IC K E L
- 52-
per litre, giving O'IJN "bromine on acidification)(3) Dimethylglyoxime, a 1% solution in ethanol(4) Ammonia solution, 0*88 ammonia diluted 1:10 with
distilled waterThe nickel film to he estimated was dissolved in 25ml
of warm IOim nitric acid, and the solution was diluted to 1 litre with distilled water. 10ml of this solution were measured out with a pipette, and transferred to a 50ml graduated flask. 10ml of the potassium hromate/hromide solution were then added to oxidise the nickel to the trivalent state.Excess "bromine was liberated, causing the solution to turn gradually yellow. 1 ml of the dimethylglyoxime solution was added, followed immediately by 10ml of the ammonia solution. A red colour developed in the solution, which was diluted to 50ml with distilled water.
Preliminary tests carried out by Campbell (41) showed that the absorption maximum of such a solution was at 465raji (fig. 15), and that the colour should be allowed to develop for 30 minutes (fig. 16).
Standard nickel solutions were prepared by weighing out specimens of the same nickel wire as was used for catalyst vessel filaments, dissolving the pieces of wire in 25ml warm 10M
citric acid, and making the total volume up to 1 litre with distilled water. 10ml samples of these standard solutions were used to prepare coloured complex solutions by the method
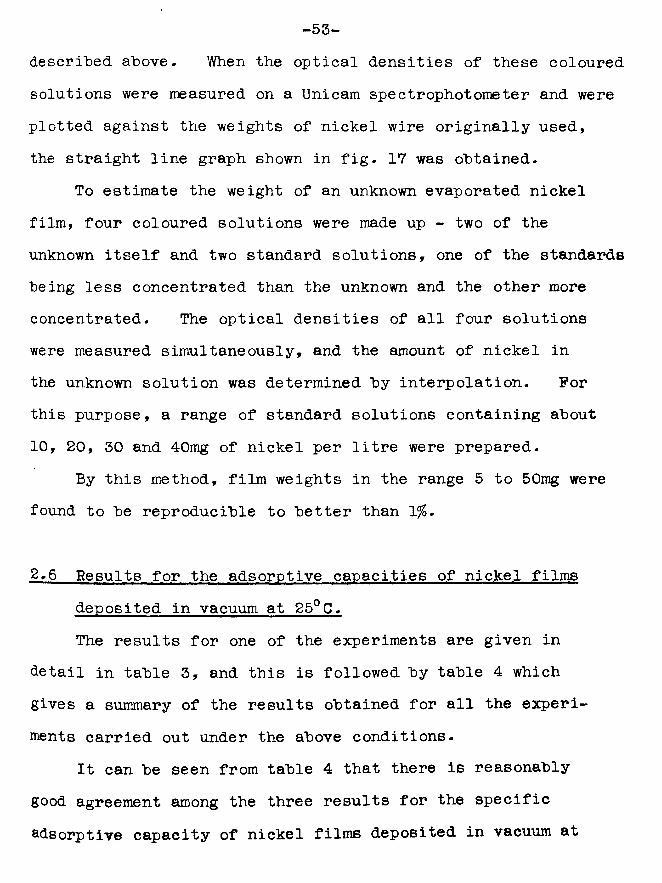
- 53-
described above. When the optical densities of these coloured solutions were measured on a Unicam spectrophotometer and were plotted against the weights of nickel wire originally used, the straight line graph shown in fig. 17 was obtained.
To estimate the weight of an unknown evaporated nickel film, four coloured solutions were made up - two of the unknown itself and two standard solutions, one of the standards being less concentrated than the unknown and the other more concentrated. The optical densities of all four solutions were measured simultaneously, and the amount of nickel in the unknown solution was determined by interpolation. For this purpose, a range of standard solutions containing about 10, 20, 30 and 40mg of nickel per litre were prepared.
By this method, film weights in the range 5 to 50mg were found to be reproducible to better than 1%.
2.6 Results for the adsorptive capacities of nickel films deposited in vacuum at 25°C.The results for one of the experiments are given in
detail in table 3, and this is followed by table 4 which gives a summary of the results obtained for all the experiments carried out under the above conditions.
It can be seen from table 4 that there is reasonably good agreement among the three results for the specific adsorptive capacity of nickel films deposited in vacuum at
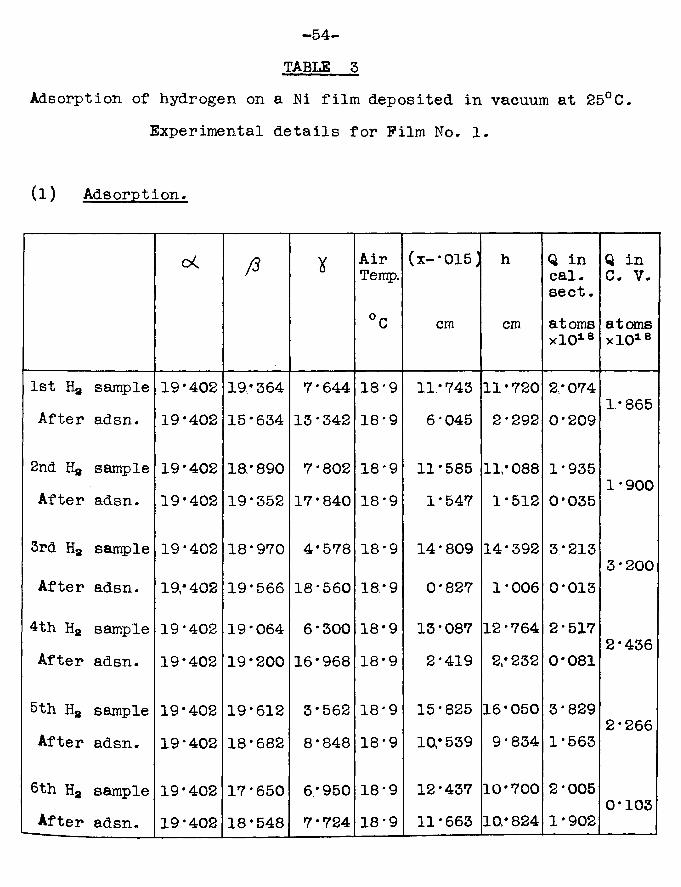
TABLE 5Adsorption of hydrogen on a Ni film deposited in vacuum at 25°C.
Experimental details for Film No- 1.
(l) Adsorption.
o< ft X AirTemp.
°C
(x-*015 J
cm
h
cm
Q in cal. sect.atoms xlO18
Q in C. V.
atomsxlO18
1st Ha After
sampleadsn.
19*40219*402
19 * 364 15*634
7*64413*342
18*918*9
11/7436*045
11/7202*292
2/0740*209
1/865
2nd Ha After
sampleadsn.
19*40219*402
18/89019*352
7*80217*840
18*918*9
11*5851*547
11/0881*512
1*9350*035
1*900
3rd Ha sample 19*402 18*970 4*578 18*9 14*809 14*392 3/2133*200
After adsn. 19/402 19/566 18*560 18/9 0*827 1*006 0*013
4th Ha After
sampleadsn.
19*40219*402
19*06419*200
6*30016*968
18*918*9
13*0872*419
12*7642/232
2*5170*081
2*436
5th Ha After
sampleadsn.
19*40219*402
19*61218*682
3*5628*848
18*918*9
15*82510/539
16*0509*834
3*8291*563
2*266
6th HaAfter
sampleadsn.
19*40219*402
17*65018*548
6/9507*724
18*918*9
12*43711*663
10*70010/824
2*0051*902
0*103
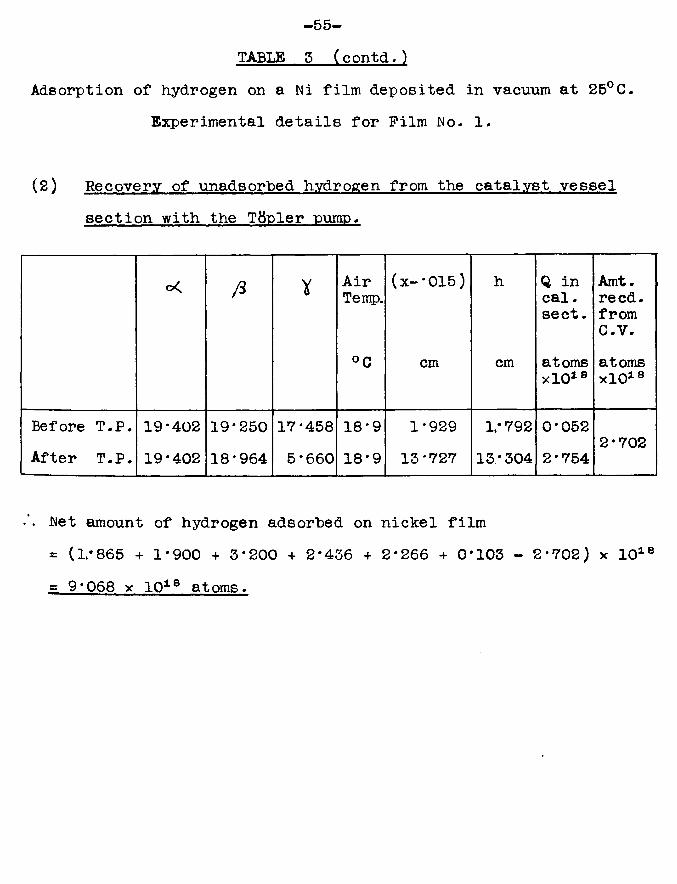
-55-TABLE 5 (contd.)
Adsorption of hydrogen on a hi film deposited in vacuum at 25°C. Experimental details for Film ho. 1.
(2) Recovery of unadsorhed hydrogen from the catalyst vessel section with the Tfrpler -pump.
C< ft Y AirTemp.
°C
(x-'015)
cm
h
cm
Q in cal. sect.
atomsxlO18
Amt. reed, from C.V.atomsxlO18
Before T.P. 19*402 19*250 17*458 18*9 1*929 1/792 0*0522*702
After T.P. 19*402 18*964 5*660 18*9 13*727 13*304 2*754
het amount of hydrogen adsorbed on nickel film= (1/865 + 1*900 + 3*200 + 2*436 + 2*266 + 0*103 - 2*702) x 1018 g 9*068 x 1018 atoms.
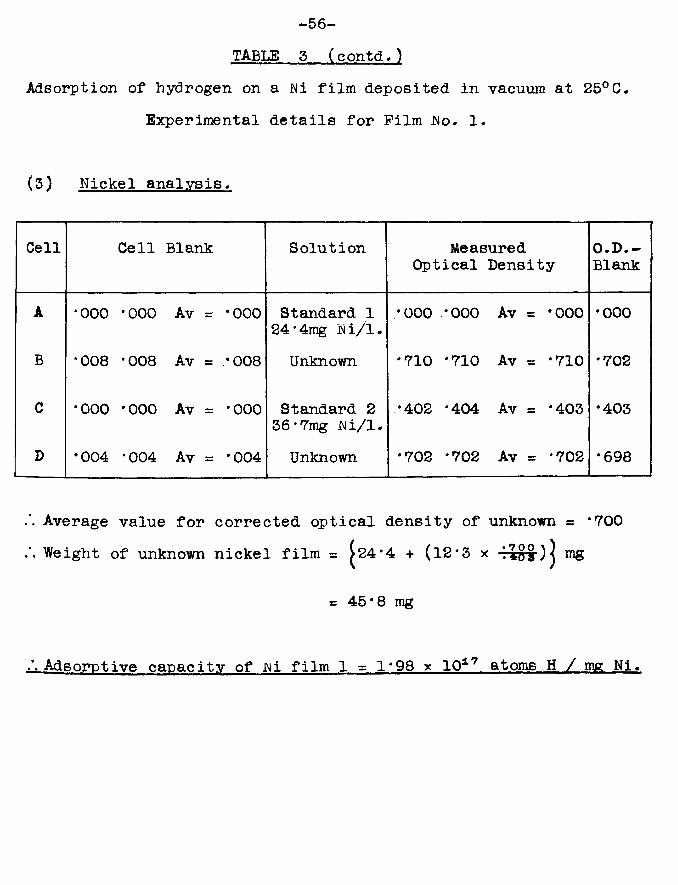
-56-TABLE 3 (contd.)
Adsorption of hydrogen on a Ni film deposited in vacuum at 25° C. Experimental details for Film .No. 1.
(3) Nickel analysis.
Cell Cell Blank Solution Measured Optical Density
O.D.—Blank
A *000 •000 Av = •000 Standard 1 24*4mg Ni/l.
•ooo -ooo Av = •ooo •000
B *008 •008 Av = •008 Unknown •710 -710 Av = •710 •702
C *000 *000 Av = •000 Standard 2 36•7mg Ni/1.
•402 -404 Av = •403 •403
D •004 *004 Av = •004 Unknown •702 -702 Av = *702 •698
Average value for corrected optical density of unknown = *700 Weight of unknown nickel film = ^24*4 + (12*3 x rog
= 45*8 mg
.’.Adsorptive capacity of Ni film 1 = 1*98 x 1017 atoms H / mg Ni.
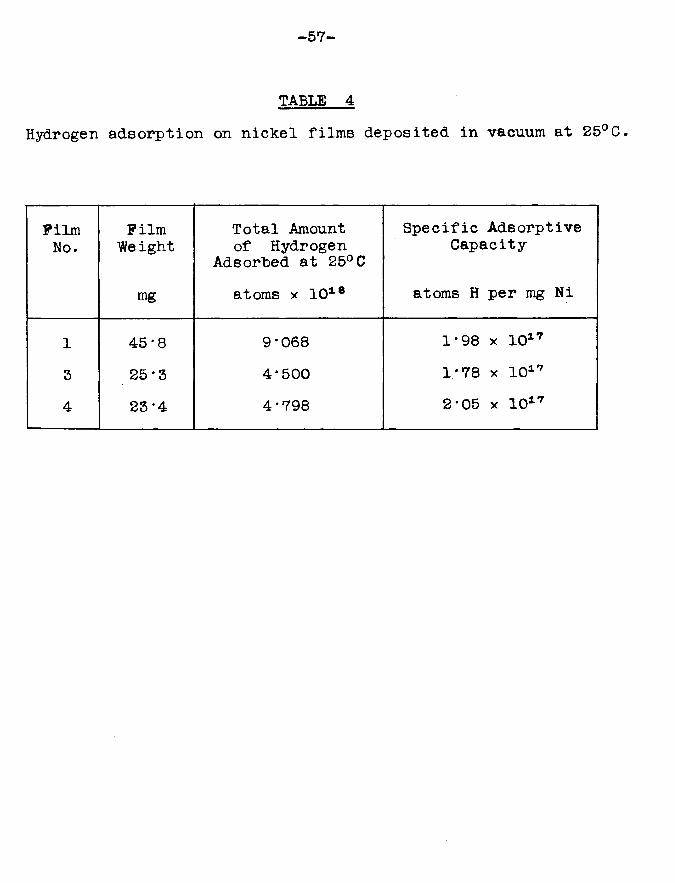
—57
TABLE 4Hydrogen adsorption on nickel films deposited in vacuum at 25°C.
FilmNo.
Film We ight
Total Amount of Hydrogen
Adsorbed at 25°C
Specific Adsorptive Capacity
mg atoms x 1018 atoms H per mg Ni
1 45*8 9*068 1*98 x 1017
3 25 '3 4*500 1/78 x 10174 23*4 4*798 2*05 x 1017
-58-25°C. This indicates that the amount of hydrogen adsorbed is proportional to the film weight, which is in accordance with the observations of Beeck, Smith and Wheeler (4). It also shows that the apparatus and experimental technique used in this investigation are capable of giving reproducible results.
The overall average for the amount of hydrogen adsorbed is 1*94 x 1017 atoms per mg of nickel. This is much higher than the value obtained by Beeck for vacuum deposited films (1*25 x 1017 atoms per mg nickel), and higher also than the results of Klemperer and Stone (42) and of Wahba and Kemball (43), but is in good agreement with Cranstoun*s results (26) (2*00 x 1017 atoms per mg nickel). Cranstoun attributes the higher adsorptive capacities of his films to more rigorous catalyst vessel and filament degassing processes. In 1962, support for this theory was provided by Anderson and Baker (23), who showed that the non-metallic impurities in the nickel wire were much higher than had previously been thought. They proved that these impurities could only be removed by the most rigorous degassing techniques, and expressed doubt as to whether previous procedures had been adequate.
.2,7 Results for the adsorptive capacities of nickel filmsdeposited in hydrogen at 25°C.The results obtained for the experiments carried out
-59-under the ahove conditions are shown in tahle 5- As predicted, these hydrogen deposited films show a much greater variation in their specific adsorptive capacities than did the vacuum deposited films. Possible reasons for the discrepancies have already been discussed in section 2.4, and may be briefly- summarised thus:a) Definitely for film 5, and possibly also for film 7,
the experimental technique resulted in hydrogen not being readily available for part of the time during the deposition of the film.
b) For all four films, variations in hydrogen pressure caused variations in the rate of evaporation of the nickel filament. It is known (40) that the adsorptive capacity of an evaporated film is influenced by its rate of deposition.The average of the four results for the amount of hydrogen
adsorbed is 3*16 x IO17 atoms per mg nickel, but obviously for the reasons given above, no great reliance can be put on the actual numerical value. Indeed, in view of the fact that film 5 is definitely known to have been deposited partly in vacuum, a better estimate of the specific adsorptive capacity of these hydrogen deposited films would probably be around 3*5 x 1017 atoms of hydrogen per mg of nickel.
It is of interest to compare these results with the results obtained by Beeck (4) (2*50 x 1017 atoms per mg nickel)
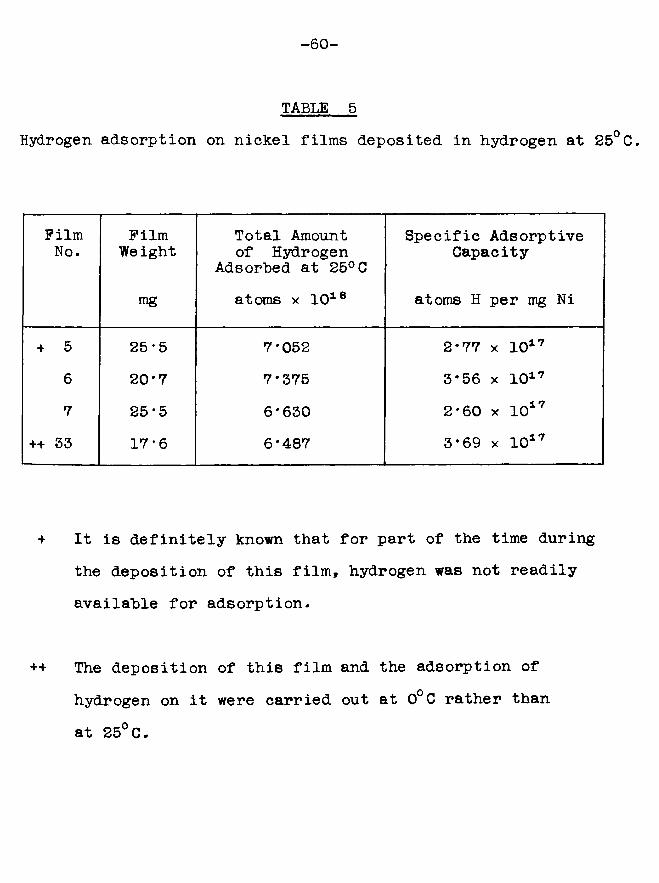
-60-
TABLE 5Hydrogen adsorption on nickel films deposited in hydrogen at 25° C.
FilmNo.
Film We ight
mg
Total Amount of Hydrogen
Adsorbed at 25°Catoms x 1018
Specific Adsorptive Capacity
atoms H per mg Ni
+ 5 25*5 7*052 2*77 x 10176 20-7 7*375 3*56 x 10177 25*5 6*630 2*60 x 1017
++ 33 17-6 6*487 3*69 x 1017
+ It is definitely known that for part of the time during the deposition of this film, hydrogen was not readily available for adsorption.
++ The deposition of this film and the adsorption of hydrogen on it were carried out at 0°C rather than at 25° C.
-61-and Cranstoun (26) (2*73 x 1017 atoms per mg nickel) for the adsorption of hydrogen on nickel films deposited in 1mm pressure of argon.
2.8 Discussion.The average value obtained for the specific adsorptive
capacity of a nickel film deposited in vacuum at 25°C was 1*94 x 1017 atoms of hydrogen adsorbed per mg of nickel,; this corresponds to 0*019 hydrogen atom adsorbed per nickel atom. The best estimate for the specific adsorptive capacity of a nickel film deposited at 25°C in the presence of hydrogen (at a pressure of 3 x 10~1torr and less) was considered to be about 3*5 x 1017 atoms of hydrogen adsorbed per mg of nickel; this corresponds to 0*034 hydrogen atom adsorbed per nickel atom.
These results indicate that depositing the nickel film in the presence of hydrogen has led to a slight enhancement of adsorption, by a factor of 1*8. The enhancement, however, is so slight that it need not necessarily be attributed to the fact that depositing the film in hydrogen improved the access of the adsorbate to the bulk metal. Beeck (4) and Cranstoun (26) have studied the relative adsorptive capacities of vacuum deposited and argon deposited films. Both found that argon deposited films had a larger surface area for hydrogen adsorption; Beeck estimated the factor involved as
-62-2*0, Cranstoun as 1*5. So it may "be that the enhanced adsorption observed above for hydrogen deposited films can simply be attributed to the fact that the presence of any gas during evaporation causes the film to be oriented and to have a larger surface area for hydrogen adsorption than a non-oriented vacuum deposited film.
It is known from experiments carried out on the field emission microscope (44J that hydrogen atoms adsorbed on a nickel surface are mobile at room temperature. It might therefore be expected that a hydrogen atom adsorbed on a nickel film at 25°C would move from site to site on the nickel lattice, presumably from a site where it was less strongly adsorbed to one where it was more strongly adsorbed.
While it is thought that a certain amount of lateral movement of hydrogen adsorbed on nickel is still possible even at 77°K (36), there is no doubt that the mobility will be considerably reduced at this lower temperature (45). So the hydrogen adsorption process at liquid nitrogen temperature might be quite different from the process at room temperature. Wot only might differences in the adsorption processes at the two temperatures be expected, but differences in the films themselves might also occur. Electron microscope studies of the structure of films deposited at different temperatures have shown that the lower the temperature of deposition, the smaller are the individual crystallites of which the film is
- 63-
comp osed, and hence the greater is the surface area (40).As the film is heated, closure of gaps between the crystals occurs, surface asperities are removed, and finally the small crystallites coalesce to form larger ones. This effect, known as sintering, reduces the surface area and hence also the adsorptive capacity of the film.
This then might afford an explanation of why greatlyenhanced adsorption is not really observed on a film deposited in hydrogen at room temperature. Thermal movement of boththe adsorbed hydrogen and the nickel would be expected tolead to elimination of hydrogen from the internal surfaces of the structure.
To test this theory, it was therefore decided to proceed to a series of experiments in which the film deposition and hydrogen adsorption were carried out at 77°K. These experiments are discussed in the next chapter*
-64-C H A P T E R 5
A COMPARISON BETWEEN THE ADSORPTIVE CAPACITIESOP NICKEL FILMS DEPOSITED IN VACUUM AT 77° K AMD 3NICKEL FILMS DEPOSITED IN HYDROGEN AT 77°K.
A comparison "between the adsorptive capacities of these two types of films was made, to see if greatly enhanced adsorption was observed on hydrogen deposited films, in which the adsorbate had access to the metal as it was being deposited. The studies were made at liquid nitrogen temperature to reduce the mobility of both the adsorbed hydrogen and the nickel atoms, thereby lessening the possibility of eliminating hydrogen from the internal surfaces of the structure.
5.1 Development of a method for denositing a nickel film in hydrogen at 77°K.The first experimental procedure to be tested was an
exact repeat of the method described in section 2.4 for depositing a film in hydrogen at 25°C, the only difference being that the catalyst vessel was immersed in a Dewar flask full of liquid nitrogen, rather than in a water thermostat at 25°C. This was the method employed in experiments 8 and 10 (see results in table 6, section 3.6), and was a complete failure. With the usual evaporating current of 6*8amps for hydrogen deposited films, adsorption was so rapid at 77° k
-65-that it was quite impossible to measure out and introduce a fresh hydrogen sample before the previous one had been completely adsorbed. Even if the evaporating current was switched off while samples were being measured out, it was still found that total adsorption of the fresh sample had occurred before the evaporation current had been readjusted to a steady value of 6*8amps. Either technique thus resulted in part of the film being deposited in vacuum. Table 6 shows the results obtained in experiments 8 and 10. Although of no real value in themselves, they were included for comparison with subsequent results to illustrate what an enormous difference partial evaporation of a film in vacuum made to its final adsorptive capacity.
In an attempt to eliminate the risk that part of the film would be deposited in vacuum, the following procedure was tested. In experiment 11, five samples of hydrogen were measured out in the calibrated section. After each sample had been estimated, it was transferred in its entirety, by means of Tdpler pump P2, into the catalyst vessel section.Only when all five samples had been transferred in this way was the evaporation current switched on. Because of the higher hydrogen pressure conducting heat away from the filament, it was found necessary to apply a current of 8*8amps before ihe film began to be deposited at approximately the usual rate. When about three quarters of the available hydrogen
- 66-
had been adsorbed, deposition was stopped, the system was left for 30 minutes to allow slow sorption to occur, then the unadsorbed hydrogen was pumped back into the calibrated section for measurement in the usual fashion. The adsorptive capacity of film 11 was calculated to be 58*80 x 1017atoms of hydrogen per mg of nickel. This is a reliable result, in so far as the film deposition was continuous and there was always hydrogen available for adsorption. Unfortunately, however, the weight of the nickel film was only 2*2mg; any slight inaccuracy in the nickel analysis would therefore lead to a large error in the estimated specific adsorptive capacity of the film. Attempts to repeat this experimental technique for heavier nickel films were unsuccessful. When only a three-fold increase was made in the quantity of hydrogen available by having 15 samples in the catalyst vessel at the same time, the maximum current obtainable from the power supply (more than lOamps) was insufficient to cause the nickel filament to evaporate.
In the third experimental procedure to be tested, that used in experiment 12 (see results in table 6, section 3.6), only one hydrogen sample was introduced at a time, but anevaporation current smaller than the usual 6*8amps was used.It was hoped by this means to reduce the rate of film deposition &nd hence of hydrogen adsorption. The method proved unsuccessful; it was found that the evaporation rate was too critically
-67-dependent on the current and the hydrogen pressure- Either no adsorption occurred at all, or else it was sudden and rapid, leading again to partial deposition of the film in vacuum, i'he situation was aggravated hy the way in which the temperature of the filament varied with the hydrogen pressure (see section 3.7). For the same evaporation current, the filament was coldest and the rate of deposition slowest when plenty of hydrogen was available; once the hydrogen pressure had been reduced owing to adsorption, the temperature of the filament increased, and so the rate of evaporation was greatest when there was least hydrogen available.
A method had to be found of enabling a reasonably heavy nickel film to be deposited in the presence of hydrogen, without having to interrupt the evaporation. It was also undesirable to increase the pressure of hydrogen so that more gas was available for adsorption, because then it was impossible to apply a sufficiently large current to evaporate the filament. It was realised that a larger quantity of hydrogen could be made available for adsorption, without increasing its pressure, if the volume of the calibrated section in which samples were measured out was increased. The way in which this was done is the subject of the next section.
Modification to the adsorption apparatus - enlargement of the dead-snace associated with McLeod gauge G2.It was decided to increase the volume of the calibrated
- 68-
section by attaching a 1 litre round-bottomed flask to the original dead-space via a connection at tap Til (fig. 4).The volume to be added (rather more than 1 litre) was chosen so that the hydrogen contained in the calibrated section at the usual pressure of 3 x 10*"itorr could not all be adsorbed, even by a reasonably heavy nickel film. This calculation was based on the specific adsorptive capacity obtained in experiment 11 for a nickel film deposited in hydrogen at 77°K.
Once again, the new section had to be calibrated. In view of the greatly increased volume, it was decided to carry out the calibration by weighing the various parts first of all full of air and then filled with a liquid (either distilled water or mercury) of known density. By this method, the volume added to the original McLeod gauge section was found to be 1163*3ml.
When the litre flask had been attached to the high vacuum apparatus, it was immersed in a water thermostat at 25°C.This was done to ensure that fluctuations in air temperature would not cause errors in the estimations of the quantities of hydrogen present, when samples were measured out in this larger section.
As a check on the liquid calibration, a second calibration, similar to that described in section 1.7, was carried out by repeatedly expanding hydrogen from the litre bulb and the tubing connecting it to tap Til into the original small
-69-calibrated section. The results obtained hy the two methods agreed to better than 1%.
Further measurements showed that, of the total volume of dead-spaee now associated with McLeod gauge G2 (1203*61111),69*0ml was at room temperature and the remaining 1134*6ml was at 25°C. As before, a table was drawn up which enabled the quantity of hydrogen in the calibrated section to be calculated from a knowledge of room temperature and the three McLeod gauge readings <x, ft and
The new calibrated section was purnped down to sticking vacuum, then more experiments were carried out to determine the specific adsorptive capacity of a nickel film deposited in hydrogen at 77°K. The modified technique involved introducing hydrogen to the new calibrated section till it exerted the usual pressure of 3 x 10 1torr. Leaving tap Til connected to the litre bulb, tap T13 was opened to allow hydrogen access to the catalyst vessel. When the evaporation current was turned up to 6*8amps, the usual value for that pressure, hydrogen had access to the film being deposited, but, because of the greater volume of hydrogen, much more gas could be adsorbed before a significant pressure drop was recorded.
This was the technique employed in experiments 15 and 16. Film 15 adsorbed 1*959 x IO19atoms of hydrogen at 77°K; the weight of the film was estimated to be 4*0mg, which gave a result for the specific adsorptive capacity of 48*98 x 1017
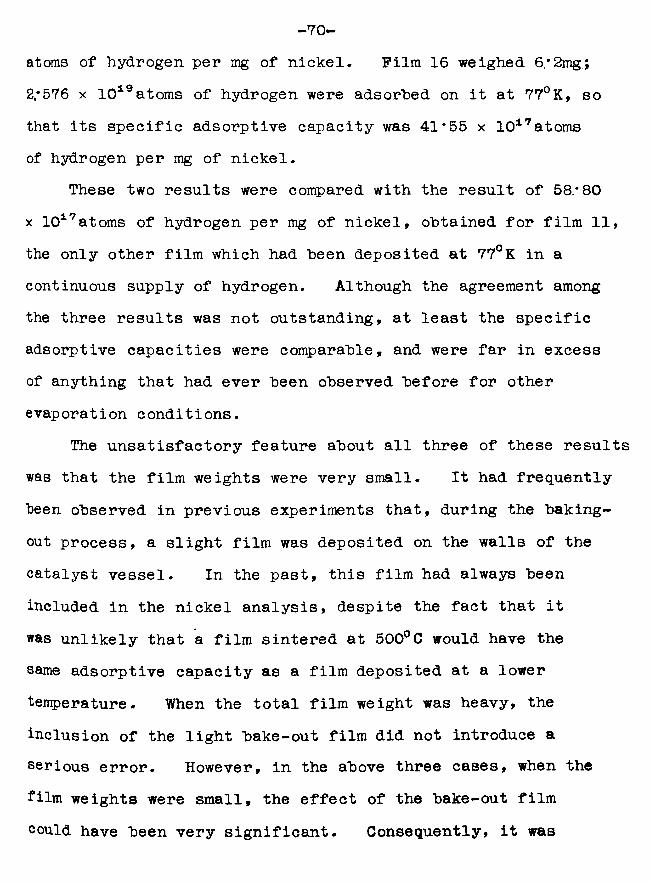
-70-atoms of hydrogen per mg of nickel. Film 16 weighed 6,*2mg; 2,*576 x 1019atoms of hydrogen were adsorbed on it at 77°K, so that its specific adsorptive capacity was 41*55 x 1017atoms of hydrogen per mg of nickel.
These two results were compared with the result of 58*80 x 1017atoms of hydrogen per mg of nickel, obtained for film 11, the only other film which had been deposited at 77°K in a continuous supply of hydrogen. Although the agreement among the three results was not outstanding, at least the specific adsorptive capacities were comparable, and were far in excess of anything that had ever been observed before for other evaporation conditions.
The unsatisfactory feature about all three of these results was that the film weights were very small. It had frequently been observed in previous experiments that, during the baking- out process, a slight film was deposited on the walls of the catalyst vessel. In the past, this film had always been included in the nickel analysis, despite the fact that it was unlikely that a film sintered at 500°C would have the same adsorptive capacity as a film deposited at a lower temperature. When the total film weight was heavy, the inclusion of the light bake-out film did not introduce a serious error. However, in the above three cases, when the film weights were small, the effect of the bake-out film could have been very significant. Consequently, it was
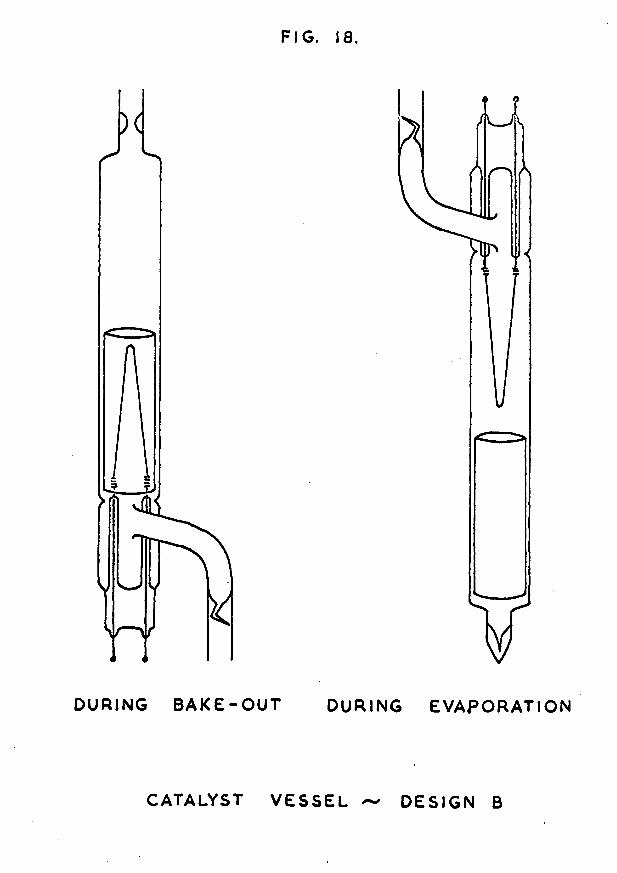
FIG. 18.
DURING B A K E - O U T DURING EVAPOR ATION
CATALYST V E S S E L ~ DESIGN B
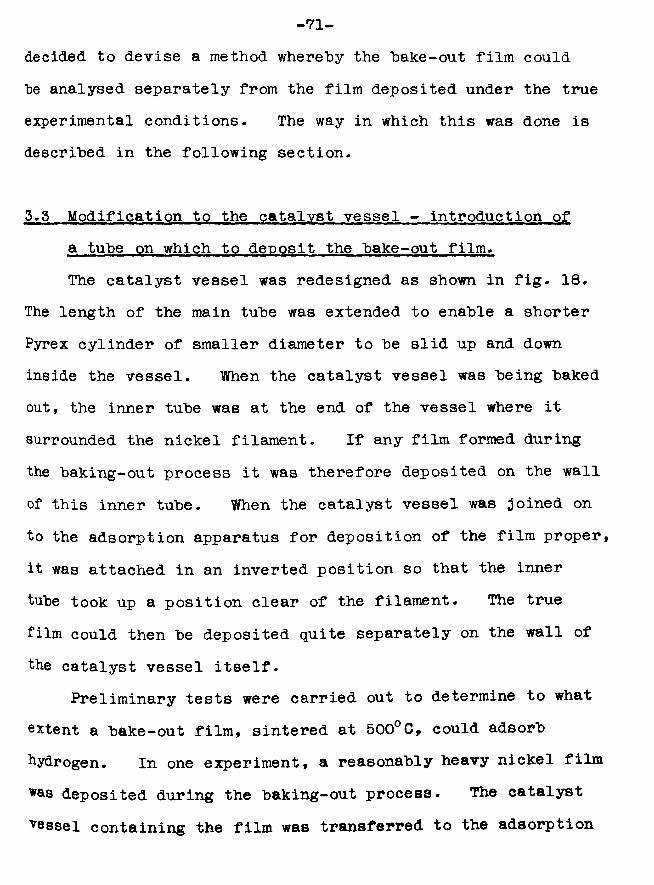
-71-decided to devise a method whereby the bake-out film could te analysed separately from the film deposited under the true experimental conditions. The way in which this was done is described in the following section.
5.3 Modification to the catalyst vessel - introduction ofa tube on which to denosit the bake-out film.The catalyst vessel was redesigned as shown in fig. 18.
The length of the main tube was extended to enable a shorter Pyrex cylinder of smaller diameter to be slid up and down inside the vessel. When the catalyst vessel was being baked out, the inner tube was at the end of the vessel where it surrounded the nickel filament. If any film formed during the baking-out process it was therefore deposited on the wall of this inner tube. When the catalyst vessel was joined on to the adsorption apparatus for deposition of the film proper, it was attached in an inverted position so that the inner tube took up a position clear of the filament. The true film could then be deposited quite separately on the wall of the catalyst vessel itself.
Preliminary tests were carried out to determine to what extent a bake-out film, sintered at 500°C, could adsorb hydrogen. In one experiment, a reasonably heavy nickel film was deposited during the baking-out process. The catalyst vessel containing the film was transferred to the adsorption
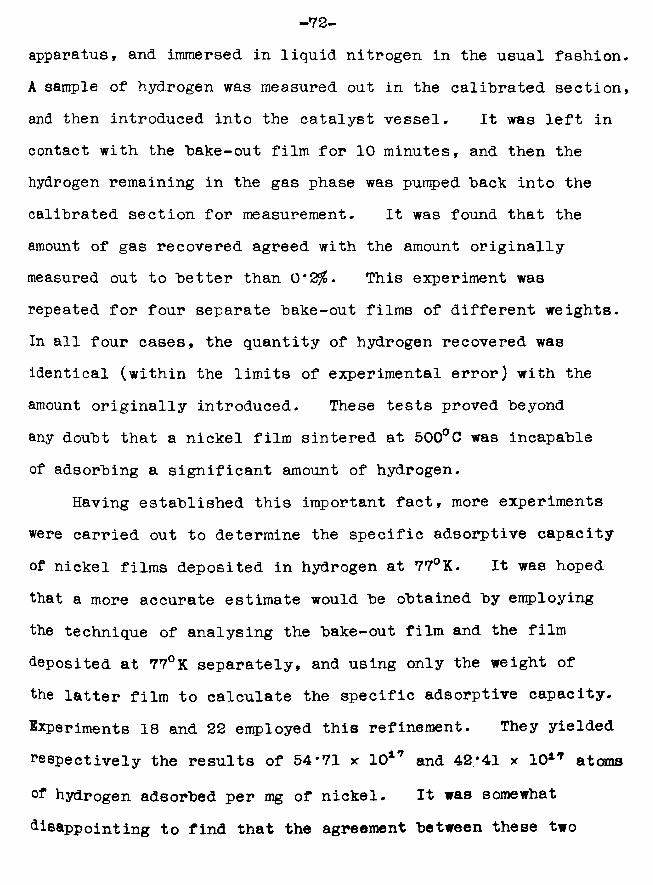
apparatus, and immersed in liquid nitrogen in the usual fashion A sample of hydrogen was measured out in the calibrated section and then introduced into the catalyst vessel. It was left in contact with the "bake-out film for 10 minutes, and then the hydrogen remaining in the gas phase was pumped "back into the calibrated section for measurement. It was found that the amount of gas recovered agreed with the amount originally measured out to better than 0*2%. This experiment was repeated for four separate bake-out films of different weights. In all four cases, the quantity of hydrogen recovered was identical (within the limits of experimental error) with the amount originally introduced. These tests proved beyond any doubt that a nickel film sintered at 500°C was incapable of adsorbing a significant amount of hydrogen.
Having established this important fact, more experiments were carried out to determine the specific adsorptive capacity of nickel films deposited in hydrogen at 77°K. It was hopedthat a more accurate estimate would be obtained by employing the technique of analysing the bake-out film and the film deposited at 77°K separately, and using only the weight of the latter film to calculate the specific adsorptive capacity. Experiments 18 and 22 employed this refinement. They yielded respectively the results of 54*71 x 1017 and 42*41 x 1017 atoms
of hydrogen adsorbed per mg of nickel. It was somewhat disappointing to find that the agreement between these two
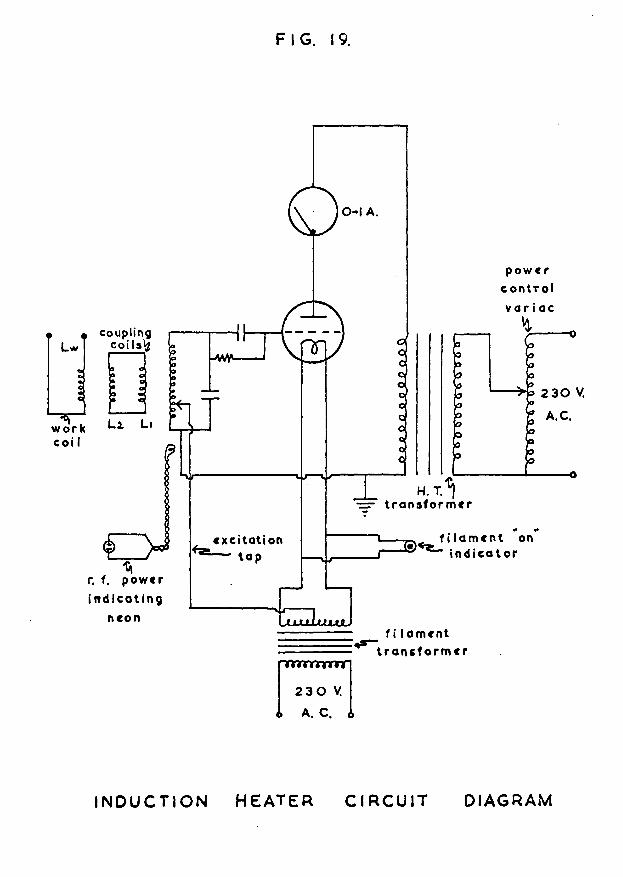
FIG. 19.
0-1 A.
p o w c r control v a r I a c
coupling coi lag o
n nLw
-H> 2 30 V, K A.C.
w o r k coi I
H. T. T transformer
filament on ' indicator
excitation — tap
r. f. power indicating
neon jlluJLllujlf i lament
transformerTffflYiimr
2 3 0 V
I N D U C T I O N HEATER C I R C U I T DIAGRAM
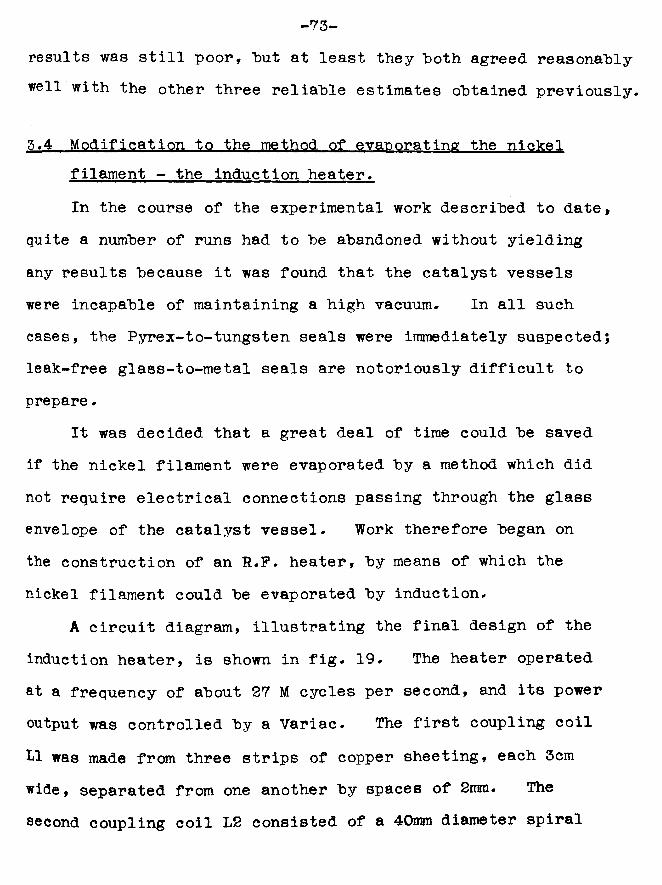
-73-results was still poor, but at least they hoth agreed reasonably well with the other three reliable estimates obtained previously.
5.4 Modification to the method of evaporating the nickelfilament - the induction heater.In the course of the experimental work described to date,
quite a number of runs had to be abandoned without yielding any results because it was found that the catalyst vessels were incapable of maintaining a high vacuum. In all such cases, the Pyrex-to-tungsten seals were immediately suspected; leak-free glass-to-metal seals are notoriously difficult to prepare.
It was decided that a great deal of time could be saved if the nickel filament were evaporated by a method which did not require electrical connections passing through the glass envelope of the catalyst vessel. Work therefore began on the construction of an R.F. heater, by means of which the nickel filament could be evaporated by induction.
A circuit diagram, illustrating the final design of the induction heater, is shown in fig. 19. The heater operated at a frequency of about 27 M cycles per second, and its power output was controlled by a Variac. The first coupling coil Ll was made from three strips of copper sheeting, each 3cm wide, separated from one another by spaces of 2rnm. The second coupling coil L2 consisted of a 40mm diameter spiral
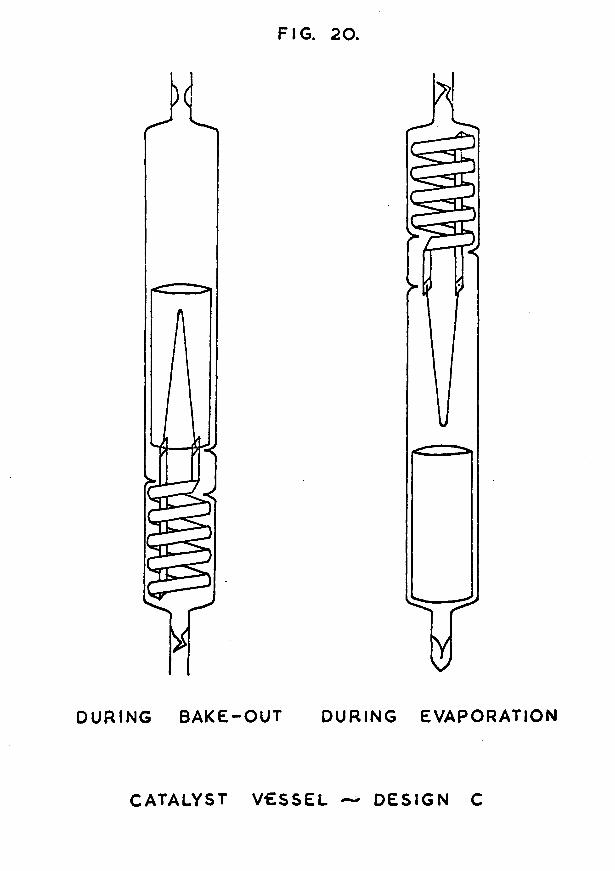
FIG. 20.
DURING BA KE-O UT DURING EVAPORATION
CATALYST V € S S £ L — DESIG N C
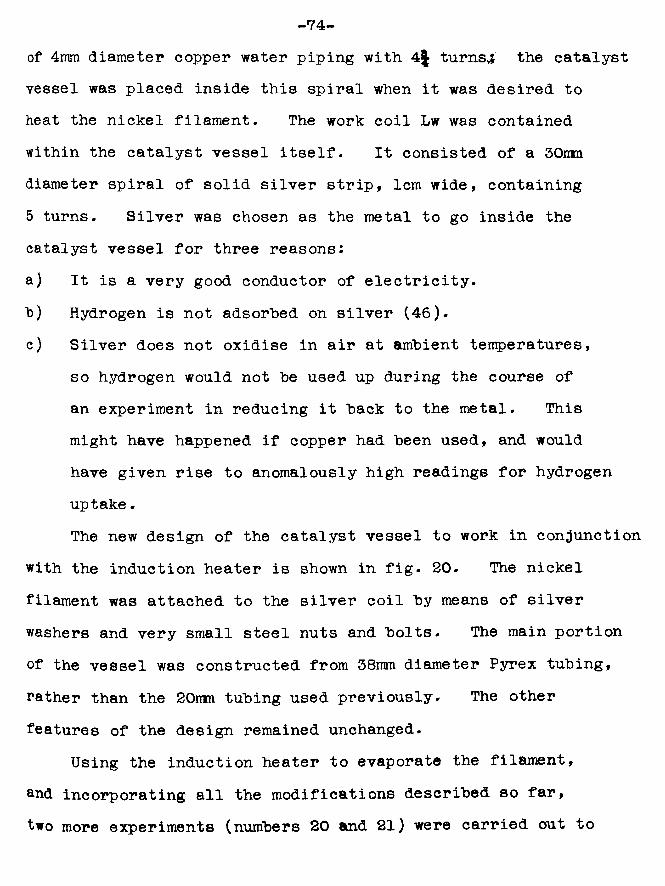
-74-of 4mm diameter copper water piping with 4| turns*; the catalyst vessel was placed inside this spiral when it was desired to heat the nickel filament. The work coil Lw was contained within the catalyst vessel itself. It consisted of a 30nxn diameter spiral of solid silver strip, 1cm wide, containing 5 turns. Silver was chosen as the metal to go inside the catalyst vessel for three reasons: a) It is a very good conductor of electricity, h) Hydrogen is not adsorbed on silver (46).c) Silver does not oxidise in air at ambient temperatures,
so hydrogen would not be used up during the course of an experiment in reducing it back to the metal. This might have happened if copper had been used, and would have given rise to anomalously high readings for hydrogen uptake.The new design of the catalyst vessel to work in conjunction
with the induction heater is shown in fig. 20. The nickel filament was attached to the silver coil by means of silver washers and very small steel nuts and bolts. The main portion of the vessel was constructed from 38mm diameter Pyrex tubing, rather than the 20mn tubing used previously. The other features of the design remained unchanged.
Using the induction heater to evaporate the filament, aad incorporating all the modifications described so far, two more experiments (numbers 20 and 21) were carried out to
-75-determine the specific adsorptive capacity of a nickel film deposited in hydrogen at 77°K.
As soon as hydrogen had been introduced into the catalyst vessel, and the induction heater switched on, a bright purple colouration, similar to a Tessla coil discharge, was observed in the catalyst vessel. This was attributed to ionisation of the hydrogen caused by the induction heater. The effect was observed in all experiments where the filament was evaporated in hydrogen by induction, but never when the filament was heated directly by passing a current through tungsten leads.
In these first two experiments, the power output of the induction heater was extremely low. Even with the Variac turned up to its maximum, an evaporation rate greater than about 1 mg per hour could not be achieved. This naturally resulted in extremely small film weights as evaporation could not be carried on indefinitely. Even with these light films, the amount of adsorption was so great under the above conditions that more than one sample of hydrogen had to be measured out in the “litre" calibrated section. While the amount of hydrogen in each fresh sample was being estimated, the induction heater was switched off to ensure that no film deposition occurred in vacuum. The effect of switching off and on the Power was no longer nearly so important as it had been when the small calibrated section was in use. Then, the time
-76-re quired to stabilise the current after switching it on again was quite a large proportion of the total time taken for all the hydrogen in the fresh sample to be adsorbed. Now, because of the much larger amount of hydrogen available in each sample, stabilisation of the current took only a negligible fraction of the total adsorption time.
The results of experiments 20 and 21 were as follows.Film 20 weighed l*74mg. (Because the film was so light, to obtain a more accurate result in the colorimetric analysis, the solution was made up to ten times the usual concentration.)
19 O2*039 x 10 atoms of hydrogen were adsorbed on it at 77 K, giving a value for the specific adsorptive capacity of 117*2 x 1017atoms of hydrogen per mg of nickel. Film 21 weighed 6*3mg; 4*948 x 1019atoms of hydrogen were adsorbedon it at 77°K, so that its specific adsorptive capacity wastj o 17”8,'54 x 10 atoms of hydrogen per mg of nickel.
These two values for the specific adsorptive capacity were very much higher than any of the five estimates previously obtained. Several reasons for this enhanced adsorption were considered.a) Evanoration rate.
In experiments 20 and 21, the rate of evaporation of the filament was very much slower than in any previous experiments. Anderson, Baker and Sanders (40) have shown that a low rate °f condensation gives rise to films of high specific area.
They were of course dealing with vacuum deposited films, hut it is possible that the condensation rate could have an even greater significance for hydrogen deposited films. It might he that a fast rate of evaporation of the nickel filament would cause the nickel atoms to arrive at the walls of the catalyst vessel faster than hydrogen molecules in the gas phase were colliding with the walls. If this happened, a nickel atom could quite easily he covered hy another nickel atom before chemisorption of hydrogen had a chance to take place. This question is considered in appendix B. The calculation there shows that even under the most unfavourable conditions (i.e. minimum pressure of hydrogen and maximum rate of deposition of nickel) the hydrogen molecules still arrived at the walls of the catalyst vessel almost 1000 times as fast as the nickel atoms. There was therefore never any fear that a film was being deposited so fast that hydrogen atoms did not have the opportunity to adsorb on each individual metal atom as it was deposited. If the rate of evaporation did affect the specific adsorptive capacity of a hydrogen deposited film, then it must have been in some other way.
Film weight.The second possible explanation for the higher specific
adsorptive capacities observed in experiments 20 and 21 was based on the weights of the films. Film 20, which showed by far the highest specific adsorption, weighed only l*74mg.
-78-
A light film, deposited on the same geometric area as a heavier film, would he more highly dispersed, and might therefore he expected to have a relatively greater surface area. Crawford, Roberts and Kemball (47) have observed this effect, again for vacuum deposited films,c) Filament-to-wall distance.
The catalyst vessels used in conjunction with the induction heater were constructed from wider Pyrex tubing (38mm diameter) than were the catalyst vessels built to the original design (20mm diameter). In the wider catalyst vessels, the film being deposited would be further from the hot nickel filament.If heat from the filament were causing the films to sinter, thereby reducing their surface area, the effect would be less pronounced in the wider vessels.
It was decided to test each of these three hypotheses in turn.
The power output of the induction heater was increased by readjustment of the excitation tap to improve anode efficiency, and by remaking the coupling and work coils to match the impedance of the nickel filament for optimum transfer of power. This made it possible to deposit nickel films at a much faster rate than had been feasible in experiments 20 and 21.
In the experiments which followed (numbers 23, 24, 25 and 29), the rate of deposition of the film was varied, as
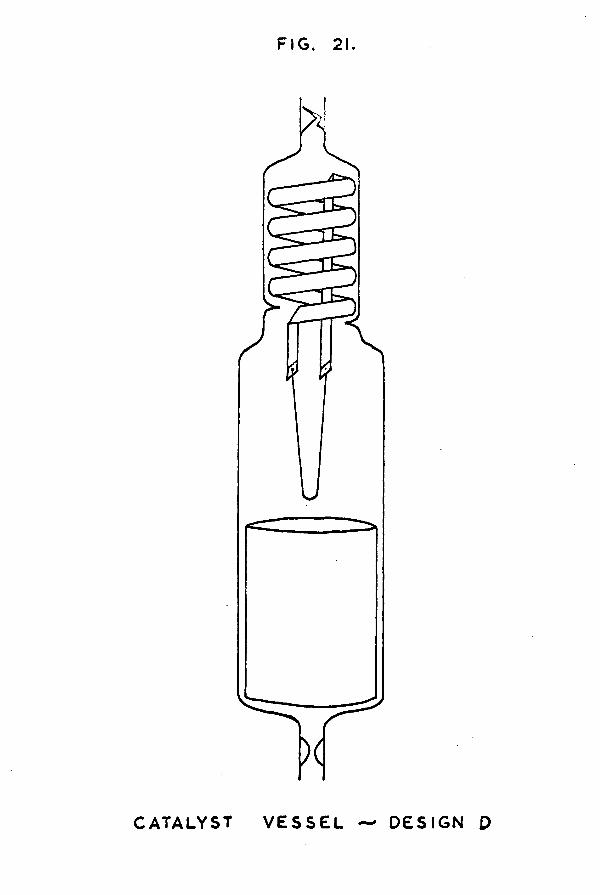
FIG. 21.
CATALYST V E S S E L — DES IG N D
-79-also was the film weight, in an attempt to correlate either of these variables with the specific adsorptive capacity of the appropriate film. In experiment 25, part of the catalyst vessel was constructed from 56mm diameter Pyrex tubing (fig. 21) so that the film would be deposited even further from the hot filament than usual. This experiment was designed to study the effect of filament-to-film distance on the adsorptive capacity of the film. The results of all these experiments, with the appropriate data concerning evaporation rate, etc., are given in the table of results in section 3.6. The conclusions which can be drawn are also discussed in that section.
5.5 Modification to the adsorption apparatus - furtherenlargement of the calibrated section.It has already been mentioned that the specific adsorptive
capacity of an induction evaporated nickel film, deposited in hydrogen at 77°K, was so great that as many as four samples of hydrogen, measured out in the "litre" calibrated section, could be adsorbed on a reasonably heavy film. Deposition of the film was always stopped while fresh samples were being measured out. To avoid the necessity of interrupting the evaporation, it was decided to replace the 1-litre flask in the calibrated section by three 2-litre flasks. Again, this ▼ery large section was calibrated by weighing the bulbs and
-80-connect ing tubing full of air and then full of distilled water at a known temperature. When in use, the bulbs were immersed in a thermostat tank at 25° C. The total volume of dead-space now associated with McLeod gauge G2 was calculated to be 7112* 6ml, of which 95.*3ml was at air temperature and 7017/ 3ml was at 25° C.
Using this “7 litre1' calibrated section, and all the other modifications mentioned in the text, four more experiments were carried out to determine the specific adsorptive capacity of a nickel film deposited in hydrogen at 77°K. These were experiments 30, 32, 39 and 40, the results of which are shown in table 6.
3.6 Results for the specific adsorptive capacities of nickel films deposited in hydrogen at 77°K, and discussion of the values obtained.The results of all the experiments mentioned in the text
are gathered together in table 6, together with other information which might be relevant to their interpretation.
A consideration of this table shows that the results fall naturally into three groups.
Group 1 - Films deposited partly in hydrogen and partly in vacuum.
The first group is comprised of films 8, 10 and 12.These results were obtained when the method of depositing
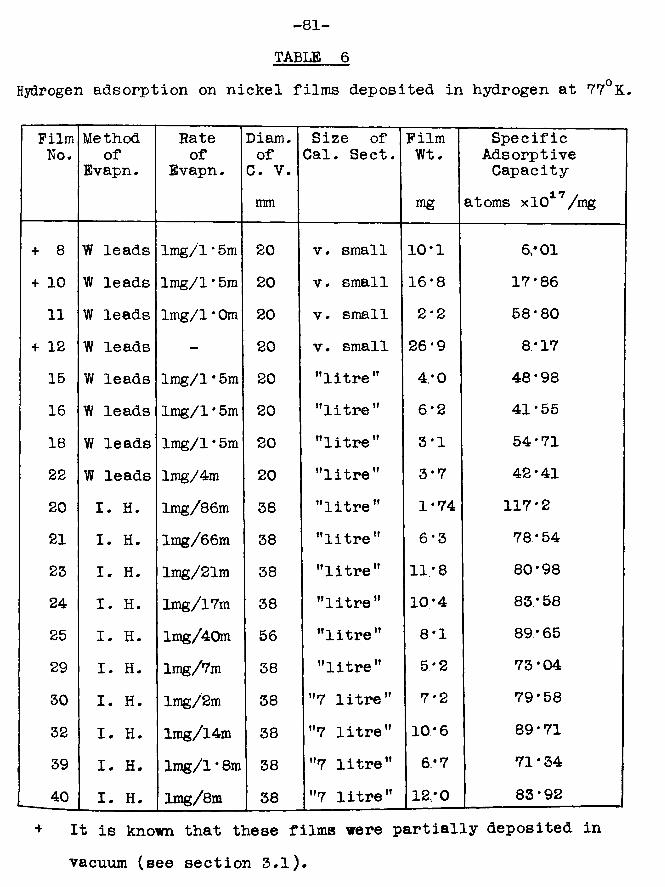
-81- TABLE 6
Hydrogen adsorption on nickel films deposited in hydrogen at 77°K.
FilmNo.
Method of
Evapn.Rate of
Evapn.Diam.of
C. V.mm
Size of Cal. Sect.
FilmWt.
mg
SpecificAdsorptiveCapacity
1 *7atoms xlO /mg
+ 8 W leads lmg/l* 5m 20 v. small 10*1 6:01+ 10 W leads lmg/1* 5m 20 v. small 16*8 17*8611 W leads lmg/l * 0m 20 v. small 2 * 2 58:80
+ 12 W leads - 20 v . small 26*9 8*1715 W leads lmg/l* 5m 20 "litre” 4,*0 48*9816 W leads lmg/l* 5m 20 "litre” 6*2 41*5518 W leads lmg/l* 5m 20 "litre" 3*1 54*71
22 W leads lmg/4m 20 "litre" 3*7 42*41
20 I. H. lmg/86m 38 "litre" 1-74 117*221 I. H. lmg/66m 38 "litre” 6-3 78*54
23 I. H. lmg/21m 38 "litre" 11.-8 80*9824 I. H. lmg/l7m 38 "litre" 10'4 83*58
25 I. H. lmg/40m 56 "litre" 8*1 89:65
29 I. H. lmg/7m 38 "litre" 5*2 73*04
30 I. H. lmg/2m 38 "7 litre" 7'2 79*58
32 I. H. lmg/l4m 38 "7 litre" 10: 6 89*71
39 I. H. lmg/l* 8m 38 "7 litre" 6:7 71*34
40 I. H. !mg/8m 38 "7 litre” 12:0 83*92
+ It is known that these films were partially deposited in vacuum (see section 3.1).
- 82-
a film in hydrogen at 77°K was "being developed. It is known that these films were partially deposited in vacuum. Their specific adsorptive capacities were very much lower than those of all the other films, and, as might "be expected, the variations among the three results were great. The values were only included in the table to show what an enormous difference even partial vacuum deposition made to the final adsorptive capacity. These results need not be considered further.b) Group 2 - Films deposited in hydrogen by "tungsten lead"
evaporation.The second group is comprised of the five films 11, 15,
16, 18 and 22. These films were deposited by passing a current through a nickel filament via tungsten leads. The deposition of each film was continuous, and hydrogen was always available for adsorption. The agreement among the five results for the specific adsorptive capacity is not particularly good, but they are all reasonably near the average value of 49*29 x 1017atoms of hydrogen adsorbed per mg of nickel.c) Group 3 - Films deposited in hydrogen by induction
evaporation.The third group is comprised of the ten films 20, 21,
23, 24, 25, 29, 30, 32, 39 and 40. These films were deposited by heating a nickel filament by induction. They can be
-83-fur the r divided into two sub-groups- In the first sub-group, the "litre" calibrated section was used for estimating hydrogen samples, and consequently deposition of the film had to be interrupted at intervals while fresh samples were measured out. In the second sub-group, the "7 litre" calibrated section was used, so only one hydrogen sample was required for adsorption, and film deposition was continuous.The results in table 6, however, show that interruption of the evaporation did not seem to make any difference to the final specific adsorptive capacity of the film, provided that hydrogen was always available throughout deposition. The ten estimates in this group for the specific adsorptive capacity of a nickel film deposited in hydrogen at 77°K range from 71*34 x 1017 to 117/2 x 1017atoms of hydrogen per mg of nickel, with an average value of 84*75 x 1017atoms of hydrogen per mg of nickel.
In section 3.4, possible reasons were put forward in an attempt to explain the variations among the fifteen estimates of the specific adsorptive capacity. These were;a) differences in the rates of deposition of the films,b) differences in the film weights, andc) differences in the distances between the hot filament
and the film.The results in table 6 show that neither the small
variations in the estimates within a group, nor the much
-84-larger difference between the average estimates of groups 2 and 3, can be correlated with either evaporation rate or film weight. When the evaporation rate or the film weight was varied in a certain manner, no corresponding trend could be observed in the values obtained for the specific adsorptive capacity. Any variations which did occur appeared to be quite random.
hor does it seem that the larger difference between the specific adsorptive capacities of films formed by "tungsten lead" evaporation and of films formed by induction evaporation can be attributed to having the film further from the hot filament in the latter case, thereby reducing the chance of sintering. When the film was deposited even further from the hot filament, the specific adsorptive capacity of the film did not increase correspondingly, as can be seen by comparing experiments 25 and 32. It is realised that this test is not entirely rigorous. JNo observations were made to see if the specific adsorptive capacity decreased when the diameter of the catalyst vessel was reduced to less than 38mm, still forming the film by induction evaporation. Such a test was not easily possible because of the size of the coupling and work coils required for induction heating.
Having exhausted all other possibilities, it appears that the different specific adsorptive capacities of group 2 and group 3 films must be attributed to the different methods of evaporation. As later experiments showed that the structure
-85-of the film itself as regards its adsorptive properties was not altered "by the method of evaporation Csee section 3.8J, it was concluded that the induction heater must have had some additional effect on the hydrogen. It could he that the heater caused breakdown of hydrogen molecules to yield ions,; this would explain the purple colouration observed in the catalyst vessel when the filament was evaporated in hydrogen by means of the induction heater. The ions thus formed might have had access to sites which would not be available for adsorption of molecules. Although it is known that a hot metal filament, whether heated directly or by induction, can cause a gas with which it is in contact to dissociate into atoms, the calculation given in appendix C shows that for an evaporating nickel filament in the type of system described in this thesis, the degree of atomisation is completely negligible - less than 0*002$ of the total number of collisions of hydrogen with the film are due to atoms, the remainder being molecular collisions. There is thus ample opportunity for the induction heater to increase appreciably the percentage breakdown of hydrogen molecules. Such an effect might well account for the greater specific adsorptive capacities of nickel films formed in hydrogen by induction evaporation rather than by passing a current directly through the filament via tungsten leads.
-86-3.7 Slow sorption.
In the experiments detailed above, a search was made for evidence of a slow sorption process similar to that observed on nickel films deposited at 25°C (section 2.3).As soon as evaporation was stopped, a measurement of the pressure of gas phase hydrogen in contact with the film was made on McLeod gauge G2. Pressure measurements were continued at 5 minute intervals thereafter for about an hour. In every case, a small pressure drop was observed over the first five or ten minutes after deposition had ceased, and then the pressure remained constant.
The possibility that this decrease in pressure might not have been due to a true sorption process was investigated. It was realised that when the nickel filament was allowed to cool down from its evaporation temperature, the temperature of the hydrogen surrounding it would also decrease, and any gas phase hydrogen atoms would recombine to form molecules, both of which processes would lead to a reduction in hydrogen pressure. A study was made of the effect of varying the temperature of a nickel filament between 77° K and just below its evaporation temperature in a ’’dummy" catalyst vessel containing no nickel film. When the hydrogen was enclosed in the catalyst vessel and the original small calibrated section the effect of the temperature of the filament on the pressure of the gas was just perceptible.;
-87-if the gas were enclosed in a larger volume (e.g. the "litre" or the "7 litre" calibrated section) no difference in the pressure of the gas could he detected as the filament cooled. As all the experiments described in this chapter were carried out in one or other of the larger calibrated sections, it was concluded that the decrease in hydrogen pressure observed immediately after film deposition had ceased was due to a genuine sorption process.
Prom a knowledge of the effective volumes of the catalyst vessel section and the appropriate calibrated section, it was possible to calculate what the observed pressure drop represented in terms of atoms of hydrogen adsorbed. In every case, the uptake by slow sorption after deposition was complete was found to be between 2% and 4% of the total quantity adsorbed. There was evidence to suggest, however, that the uptake observed after deposition was just the end of a process which had been occurring throughout. The evidence was provided by those experiments where evaporation was interrupted at intervals during deposition to enable fresh hydrogen samples to be measured out. Such was the case with film 23, the results of which are worth quoting in detail in connection with the phenomena discussed in this chapter.
By gas expansion, the ratio of effective volume of calibrated section to effective volume of catalyst vessel
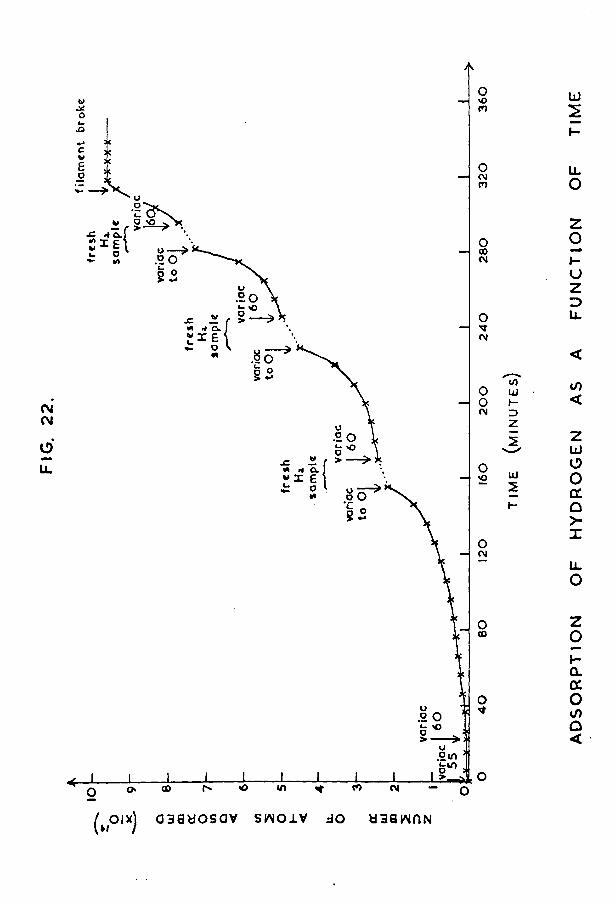
fila
men
t br
oke
*j *
.20
> •*
.2 0oLL * X £ o
oO
.2 O 'O
i o
aasuosav swoiv do baswriN
COLJ»-3Z
UJ2
AD
SO
RP
TIO
N
OF
HY
DR
OG
EN
AS
A
FUN
CTI
ON
OF
T
IME
-88-section was estimated. it was therefore possible, from McLeod gauge measurements, to calculate the total amount of gas phase hydrogen in both the calibrated and catalyst vessel sections at any time during the deposition. By subtraction from the amount originally present, the quantity of hydrogen adsorbed at any time could be calculated. The method of calculation was proved valid at the end of the experiment when the calculated value for the amount of hydrogen adsorbed was found to agree with the experimental value to better than 1%.
A graph was plotted of ’’quantity of hydrogen adsorbed” against ’’time”. It is shown in fig. 22. The following points are worthy of comment.a) The rate of adsorption of hydrogen, and hence the rateof deposition of nickel, was not constant. The graph showeda series of four loops corresponding to the four samples of hydrogen introduced in turn for adsorption.
Considering each loop individually, the rate of adsorptionat the beginning was much slower than at the end. Thisverified the idea that the rate of evaporation of the filament was controlled by the pressure of hydrogen in the gas phase, because of its effect in conducting heat.c) Considering all four loops together, it is obvious that the fourth hydrogen sample was adsorbed much more quickly than the first. In other words, the film was being deposited
-89-more quickly at the end of the experiment than at the beginning. This could have had nothing to do with the hydrogen pressure, because all four samples were introduced at very nearly the same initial pressure. it must he ascribed to the fact that the filament became thinner as it evaporated. The temperature of a wire increases with decreasing cross-sectional area, for passage of the same current, so the film would be deposited more quickly at the end of the evaporation.d) The graph showed no evidence whatever for enhanced adsorption in the initial stages of deposition when the film was more highly dispersed. This was further proof that the high specific adsorptive capacities observed in some experiments could not be attributed to light film weights.e) When fresh samples of hydrogen were being measured out, the induction heater was always switched off for the same length of time - 15 minutes. During these periods, it canbe seen from the graph that quite large quantities of hydrogen were taken up. It is reasonable to assume that the process occurring in these cases was the same as the slow sorption observed after film deposition in every other experiment.On this occasion, the total quantity of hydrogen adsorbed when the film was not being deposited was calculated to be 15% of the total - a much larger amount than the usual 2-4% observed at the very end of other experiments. To account for the difference, it is necessary to assume that the slow
-90-sorption process occurs along with the fast chemisorption during film deposition; more slow sorption was observed on film 23 than on any other film simply because the former was the only experiment in which the slow sorption process was studied in stages throughout the deposition, rather than just at the end when deposition was complete. A true estimate of the total amount of slow sorption occurring should therefore he even greater than 15%. This view is consistent with a report by Gundry and Tompkins (24j, who observed that, for vacuum deposited films, 20% of the total uptake occurred by a slow sorption process which proceeded at a measurable rate until equilibrium was established in a few hours.
5.8 Results for the specific adsorptive capacities of nickelfilms den os i ted in vacuum at 77° K.While it was most encouraging to observe the greatly
enhanced adsorption obtained by depositing a film in hydrogen at 77° K, it was thought advisable to carry out control experiments on films deposited in vacuum at 77°K. The method for determining the adsorptive capacity of such a film was as already described in section 2.3, the only difference being that the catalyst vessel was immersed in a Dewar flask filled with liquid nitrogen rather than in a water thermostat at 25°c. The results obtained for the three films of this type which were studied are shown in table 7.
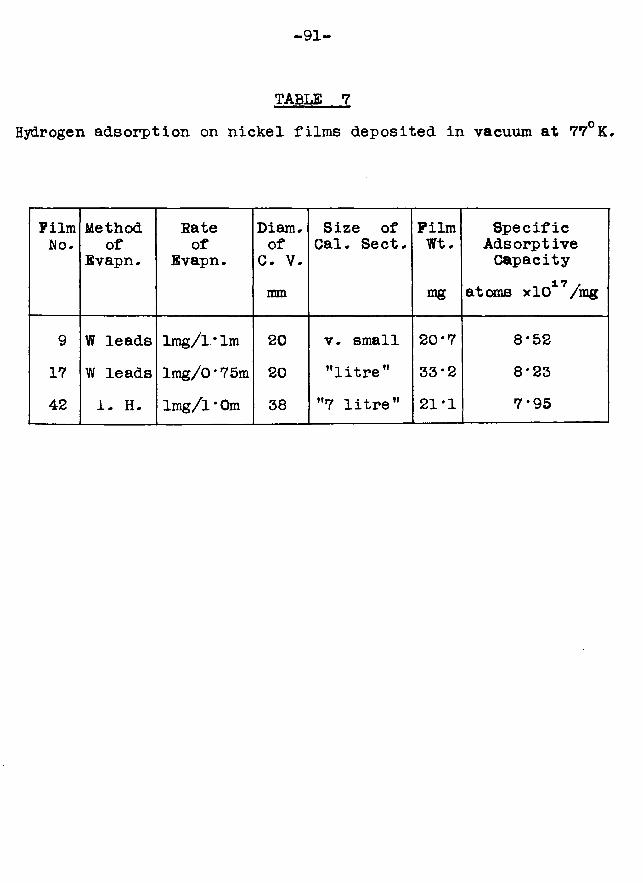
-91-
TABLE 7Hydrogen adsorption on nickel films deposited in vacuum at 77°K.
Filmflo.
Methodof
Bvapn.Bateof
Bvapn.Diam.of
C. V.mm
Size of Cal. Sect.
FilmWt.
mg
SpecificAdsorptiveCapacity
atoms xl017/mg
9 W leads lmg/l’lm 20 v. small 20*7 8*5217 W leads lmg/0*75m 20 "litre" 33*2 8*2342 I. H. lmg/l * Om 38 "7 litre" 21*1 7*95
-92-The agreement among the three results was reasonably
good. The overall average for the amount of hydrogen adsorbed was 8*23 x 1017atoms of hydrogen per mg of nickel. This was close to the value of 8'54 x 1017atoms of hydrogen per mg of nickel obtained by Gundry and Tompkins (24) for the specific adsorptive capacity of films deposited under identical conditions.
it was particularly heartening to observe that the film deposited by induction evaporation in a larger catalyst vessel had the same specific adsorptive capacity as the films deposited by "tungsten lead” evaporation in smaller catalyst vessels. This finally dispelled any doubts that might still have been lingering to the effect that the greater adsorptive capacity observed for induction evaporated films deposited in hydrogen at 77°K might in some way have been due to uptake of hydrogen by the silver coil itself. It also proved that the filament-to-film distance was unimportant in the range under consideration; heat from the evaporating filament could not have caused the films in the 20mm diameter catalyst vessels to sinter any more than the film in the 38mm catalyst vessel, otherwise the former would have shown smaller specific adsorptive capacities than the latter.Lastly it showed that the method of evaporation did not have any effect on the actual structure of the film itself, in so Tar as the structure affected the adsorption properties.
-93-The results quoted in tables 6 and 7 show that a nickel
film deposited at 77°K by induction heating in the presence of hydrogen has approximately 10 times the adsorptive capacity of a film deposited in vacuum at 77°K. However, for the investigation to be entirely rigorous, a comparison of the adsorptive capacities of both these types of films ought to be made with that of a film deposited in an inert gas at 77°K with subsequent adsorption of hydrogen on it.This was done on film 41, and is discussed in the next section.
5.9 Result for the specific adsorptive capacity of a nickel film deposited in U,2mm pressure of argon at 77°K.When a catalyst vessel, glass-blown to the design for
induction evaporation ^fig. 20), had been attached to the adsorption apparatus, a sample of British Oxygen Go. Ltd. spectroscopically pure argon was measured out in the "7 litre” calibrated section to the usual pressure of 3 x 10 ±torr.The argon was allowed to expand into the catalyst vessel at 77°K; after expansion, it was found to exert a pressure of
—i2 x 10 torr. The induction heater was then switched on, and a nickel film was deposited in this pressure of argon at the rate of about lmg/2min. On completion of film deposition, the argon was pumped back into the calibrated section for measurement. The amount recovered was found to be identical with the amount originally measured out,
-94-showing that no argon had either "been trapped or adsorbed by the nickel film as it was formed. This result was in agreement with observations made by Beeck, Smith and Wheeler (4). When all the argon had been pumped away, hydrogen, in measured amount, was allowed access to the film in the
19usual fashion. 4*116 x 10 atoms of hydrogen were required to saturate the film, which was later found by analysis to weigh 28*3rag. This gave a value of 14*54 x 1017atoms of hydrogen per mg of nickel for the specific adsorptive capacity of a nickel film deposited in 0*2mm pressure of argon at 77°K. This is an increase by a factor of 1*8 on the adsorptive capacity of a nickel film deposited in vacuum at 77°K (cf. section 2.8).
5.10 Investigation into the -possibility of -physical adsorption.A comparison of the results given in chapters 2 and 3
shows that the specific adsorptive capacities of films deposited at 77°K, whether in vacuum or in hydrogen, are very much higher than those of corresponding films deposited at 25°C. The first explanation which sprang to mind was that the lower temperature of deposition reduced the ease of surface migration of the condensing nickel atoms, and caused the film to be composed of smaller crystallites. This would therefore lead to a greater surface area per unit weight. However, the possibility was not overlooked that the greater adsorptive
-95-capacity of films deposited at 77°K might he due, in part at least, to physical adsorption. The nearer the deposition temperature approached the boiling point of hydrogen (14°K), the greater was the chance that the gas would be physically adsorbed on the metal.
Physical adsorption is reversible, and is dependent on the pressure of the gas above the adsorbed layer. A reduction in the gas phase pressure leads to desorption, an increase to further adsorption. This relationship provided the basis for the test for physical adsorption employed in the current investigation.
The test was made during the course of each experiment at the stage when the gas phase hydrogen remaining unadsorbed in the catalyst vessel was being pumped back into the calibrated section for measurement. This transfer was carried out in stages using TBpler pump P2. The quantity recovered after a known number of T8pler pump strokes was measured at various stages as pumping proceeded. When a sufficient number of such measurements had been made, pumping was continued until the Pirani gauge indicated that the gas phase pressure in the catalyst vessel was less than 10 *torr, and that this pressure did not rise to a higher value when pumping was stopped.
Let the total quantity of hydrogen recovered after pumping be denoted by Q. If no physical adsorption occurred on
-96-the nickel film, Q would simply represent the amount of hydrogen present in the gas phase in the catalyst vessel section before pumping was commenced. However, if physical adsorption did occur on the nickel film, then Q would be composed of the unadsorbed gas phase hydrogen originally present in the catalyst vessel section together with some hydrogen which had originally been physically adsorbed on the film but which had subsequently been desorbed owing to reduction in the gas phase pressure caused by pumping.
Since the TiJpler pump operated by transferring a constant fraction of the gas phase hydrogen in the catalyst vessel section at each stroke, the test for desorption (and hence for physical adsorption) was to plot "log (Q - quantity of hydrogen recovered)" against "number of Tfipler pump stroke".If no desorption occurred, the graph would be a straight line.If desorption did occur, the graph would gradually curve upwards away from the origin as the pressure was reduced, simply because the TBpler pump could not transfer as much hydrogen at each stroke in the early stages when a greater proportion of the gas was still physically adsorbed.
This test was carried out on a large number of nickel films, including films deposited in hydrogen at 77°K, in
vacuum at 77 K, in hydrogen at 25° C, and in vacuum at 25° C.
In every case, a good straight line graph was obtained, Indicating that physical adsorption of hydrogen did not occur
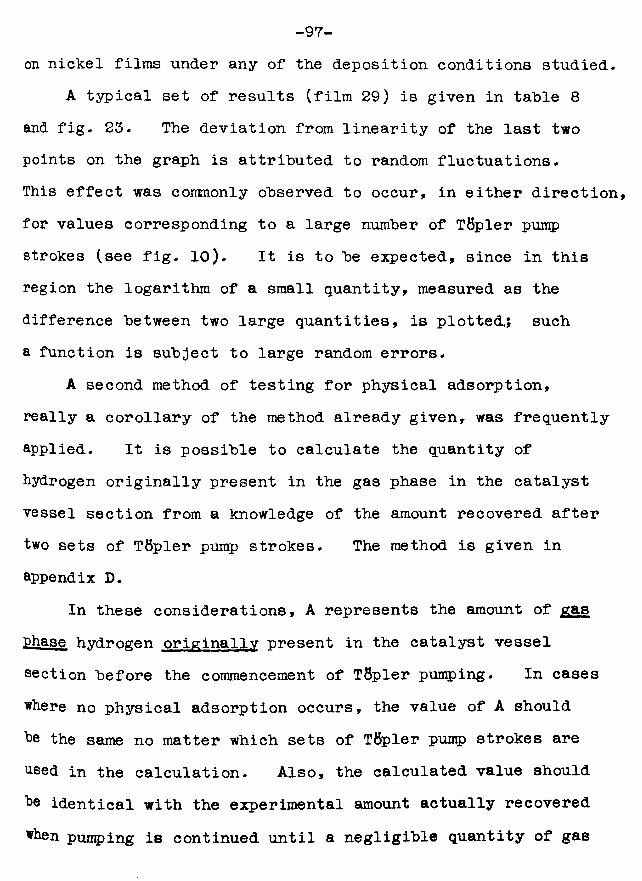
-97-on nickel films under any of the deposition conditions studied.
A typical set of results (film 29) is given in table 8 and fig. 23. The deviation from linearity of the last two points on the graph is attributed to random fluctuations.This effect was commonly observed to occur, in either direction, for values corresponding to a large number of Tttpler pump strokes (see fig. 10). It is to be expected, since in this region the logarithm of a small quantity, measured as the difference between two large quantities, is plotted,; such a function is subject to large random errors.
A second method of testing for physical adsorption, really a corollary of the method already given, was frequently applied. It is possible to calculate the quantity of hydrogen originally present in the gas phase in the catalyst vessel section from a knowledge of the amount recovered after two sets of Tfipler pump strokes. The method is given in appendix D.
In these considerations, A represents the amount of gas phase hydrogen originally present in the catalyst vessel section before the commencement of TBpler pumping. In cases where no physical adsorption occurs, the value of A should he the same no matter which sets of Tttpler pump strokes are used in the calculation. Also, the calculated value should he identical with the experimental amount actually recovered when pumping is continued until a negligible quantity of gas
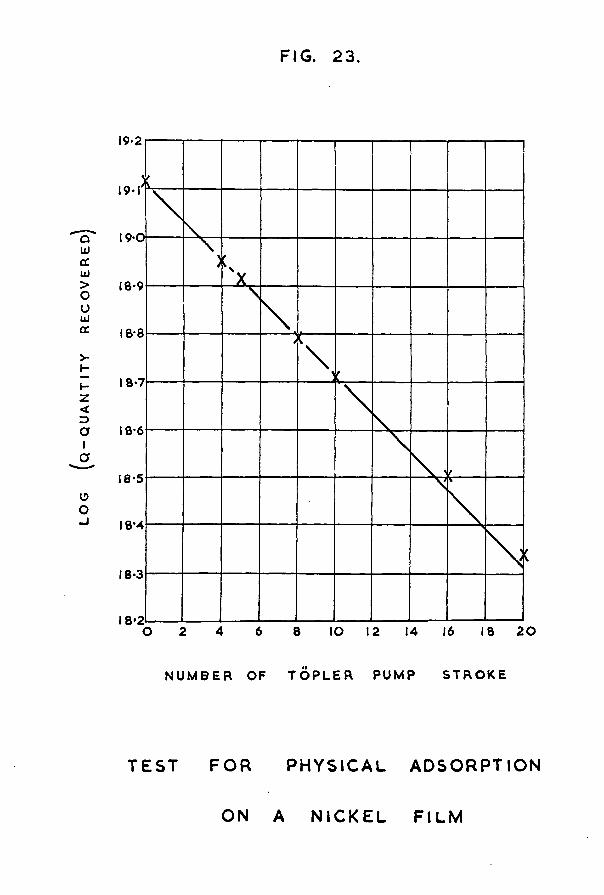
LOG
(Q
-QU
AN
TIT
Y
RE
CO
VE
RE
D
FIG. 23.
19*2
19-1
19-0
i 8*8
18-7
18-6
18*4
18*3
18*24 6 16 18 2 0O 8 IO 12 142
N U M B E R OF T O P L E R P U MP S T R O K E
T E S T F O R PH Y S IC A L A D S O R P T IO N
ON A N I C K E L F I L M
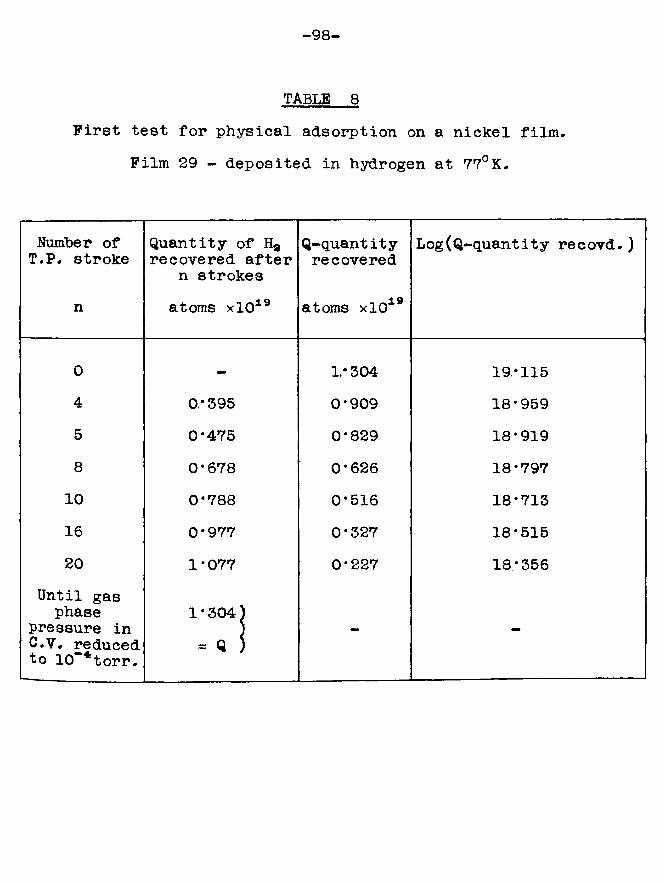
-98-
TABLE 8First test for physical adsorption on a nickel film.
Film 29 - deposited in hydrogen at 77°K.
Number of T.P. stroke
Quantity of Ha recovered after
n strokesQ-quantityrecovered
Log(Q-quantity recovd.)
n atoms xlO19 atoms xlO19
0 — 1/304 19*1154 0,* 395 0*909 18*9595 0*475 0*829 18*9198 0*678 0*626 18*79710 0*788 0*516 18*71316 0*977 0*327 18*51520 1*077 0*227 18*356
Until gas phase
pressure in C.V. reduced to 10“*torr.
1*304)
= Q )- -
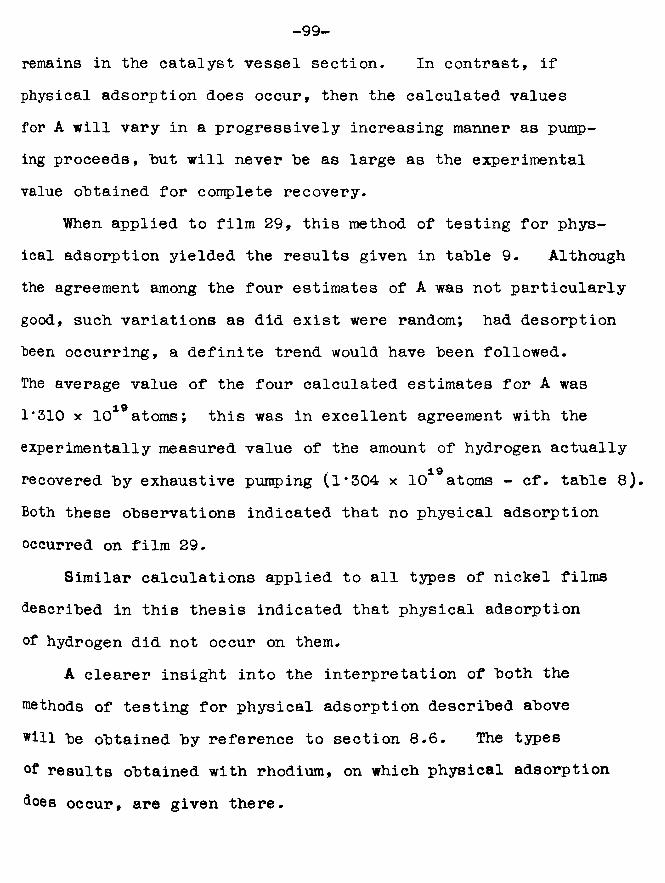
-99-remains in the catalyst vessel section. In contrast, if physical adsorption does occur, then the calculated values for A will vary in a progressively increasing manner as pumping proceeds, hut will never he as large as the experimental value obtained for complete recovery.
When applied to film 29, this method of testing for physical adsorption yielded the results given in tahle 9. Althoughthe agreement among the four estimates of A was not particularlygood, such variations as did exist were random; had desorption "been occurring, a definite trend would have heen followed.The average value of the four calculated estimates for A was
1.91*310 x 10 atoms; this was in excellent agreement with the experimentally measured value of the amount of hydrogen actually
/ 19 .recovered hy exhaustive pumping Cl*304 * io atoms - cf. tahle 8;.Both these observations indicated that no physical adsorptionoccurred on film 29.
Similar calculations applied to all types of nickel films described in this thesis indicated that physical adsorption of hydrogen did not occur on them.
A clearer insight into the interpretation of both the methods of testing for physical adsorption described above will be obtained by reference to section 8.6. The types of results obtained with rhodium, on which physical adsorption does occur, are given there.
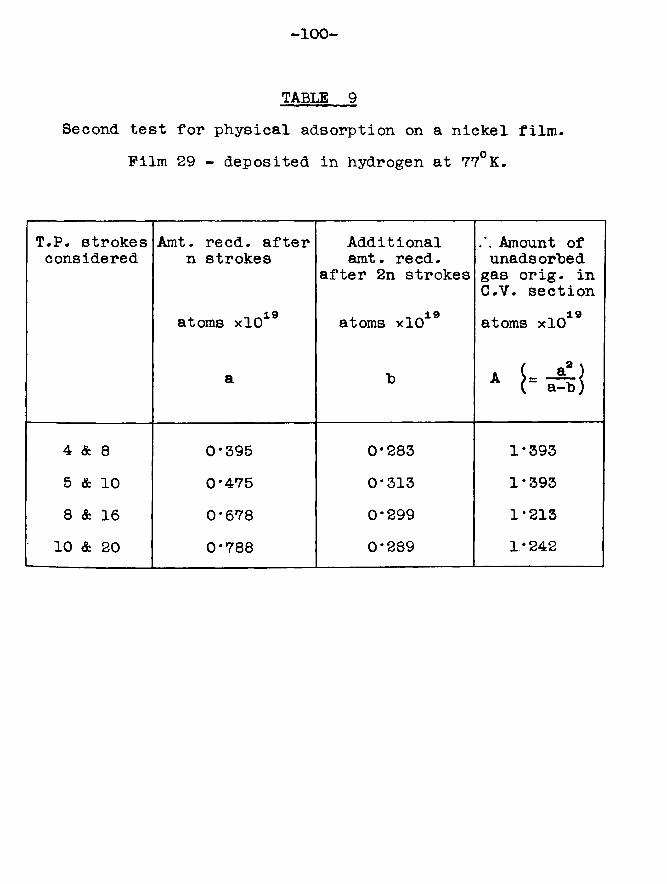
-100-
TABLE 9Second test for physical adsorption on a nickel film.
Film 29 - deposited in hydrogen at 77°K.
T.P. strokes considered
Amt. reed, after n strokes
atoms xlO19
a
Additional amt. reed,
after 2n strokes
atoms xlO19
h
Amount of unadsorbed gas orig. in C.V. sectionatoms xlO19
( a-h)
4 & 8 0*395 0*283 1*3935 & 10 0*475 0*313 1*3938 & 16 0*678 0*299 1*21310 & 20 0*788 0*289 1*242
-101-3.11 Summary.
The average value obtained for the specific adsorptive capacity of a nickel film deposited in vacuum at 77°K was
1 78*23 x 10 atoms of hydrogen adsorbed per mg of nickel; this corresponds to 0*080 hydrogen atom adsorbed per nickel atom.The same value was obtained regardless of whether the nickel film was formed by passing a current directly through the filament via tungsten leads, or by induction evaporation.
The specific adsorptive capacities of nickel films deposited in the presence of hydrogen at 77°K were very much higher, but the actual values depended on the method of evaporation of the filament. For "tungsten lead" evaporation,
17the average specific adsorptive capacity was 49*29 x 10 atoms of hydrogen adsorbed per mg of nickel, which corresponds to 0*48 hydrogen atom adsorbed per nickel atom. For induction evaporation, the average specific adsorptive capacity was
1 784/75 x 10 atoms of hydrogen per mg of nickel, or 0*83 hydrogen atom per nickel atom. The difference between the two values has been attributed to the fact that the induction heater caused breakdown of the gas phase hydrogen molecules to form ions, enabling adsorption to occur on sites which would not have been filled if only hydrogen molecules had "been available.
The specific adsorptive capacity of a nickel film deposited in 0*2mm pressure of argon at 77°K was 14*54 x 1017
-102-
atoms of hydrogen adsorbed per mg of nickel, which is equivalent to 0*14 hydrogen atom adsorbed per nickel atom.
These results show that there is absolutely no doubt that enhancement of adsorption occurs when the nickel film is deposited in the presence of hydrogen. The ten-fold increase in the adsorptive capacity of hydrogen deposited films over vacuum deposited films is a far greater effect than could possibly be explained on the basis that the presence of the hydrogen caused the film to be formed with a more porous structure, as would have been the case had any inert gas been present during deposition. The experiment on the argon deposited film showed that such an effect could only account for a 1/8-fold increase in adsorptive capacity.
These experiments have therefore provided an answer to the question originally set. By improving the access of hydrogen to the bulk nickel, the hydrogen j nickel adsorption ratio can be increased. This can only be interpreted by assuming that each nickel atom is capable of adsorbing hydrogen; whether or not it does so in a particular situation is determined by whether or not hydrogen has free access to it.
It is of interest to compare these results with the work of Spenadel and Boudart (48). These authors studied the adsorption of hydrogen on platinum supported on alumina. They found that by using a freshly prepared catalyst containing only 0*695 Pt, they achieved a very high dispersion of
the metal, such that it lay on the surface of the support in a monoatomic layer in two dimensional clusters. Gas phase hydrogen therefore had access to each platinum atom, and a hydrogen : platinum adsorption ratio as high as 0*99:1 was measured experimentally. When catalysts containing a higher percentage of platinum were used, the adsorption ratio was considerably reduced, and X-ray measurements showed that the metal was in the form of three dimensional crystallites(e.g. a 3*10% Pt on AlaOa catalyst, heated for 24 hours at_ _ o750 C, adsorbed 0*033 hydrogen atom per platinum atom, and the average platinum crystal size was 255A°).
These observations confirm the view expressed above that each metal atom is capable of acting as an adsorption site, and will do so if the adsorbate has free access to it.
It is interesting to consider why the maximum adsorption ratio observed on the nickel/hydrogen system was only 0*83H : INi when Spenadel and Boudart obtained the higher ratio of 0*99H : lPt. There could be two possible reasons for this difference. Both are based on the mobility of the adsorbed hydrogen. Firstly, since it is known that hydrogen is still mobile on a nickel surface even at 77°K (36), it may be that "the factors which caused displacement of hydrogen from the internal surfaces of the structure of films deposited in hydrogen at 25°C still operate to a more limited extent even
liquid nitrogen temperature. If so, it might be necessary
-104-to reduce the temperature of deposition even further before the maximum adsorption would be obtained. This question is considered in chapter 8. The experiments described there, however, indicate that a further decrease in the deposition temperature of hydrogen deposited nickel films would lead to only a very small increase in the amount of adsorption occurring on them.
Secondly, by statistical calculation, Roberts (49) has shown that for a diatomic molecule dissociating into atoms occupying adjacent sites on an immobile layer, some 8% of the sites will remain unoccupied at "complete" coverage; these exist as single sites, adjacent pairs only being effective in adsorption. This restriction would not operate on the catalysts studied by Spenadel and Boudart, because hydrogen is freely mobile on platinum at room temperature, and the hydrogen atoms, once adsorbed, could diffuse on the surface to fill the vacant sites. On the nickel films, however, because metal deposition and hydrogen adsorption occur simultaneously, it might be that, owing to the reduced mobility at 77° K, the adsorbed atoms would not have the opportunity to diffuse on to vacant sites before these were covered by more nickel atoms. Also, Roberts* theoretical calculation applied to a perfectly coherent infinite surface. Because of their method of preparation, the nickel films
deposited in hydrogen at 77°k are likely to have an incoherent
-105-surface, being made up of small islands each composed of comparatively few metal atoms. In such a case, the proportion of bare sites would be much greater than 8% owing to edge effects.
While the experiments described in this chapter have proved that at least nearly every nickel atom is independently capable of acting as an adsorption site, no information whatever has been gathered as to the nature of the chemi- sorption bond. It is not known whether all the nickel-to- hydrogen bonds are of the same type, or whether variations occur. This in turn leads to a consideration as to whether each nickel atom is capable of acting as a catalyst. If the adsorbate is bound too strongly to the metal, it cannot be removed from the surface during the course of a reaction, and consequently acts as a catalyst poison. It was therefore hoped to gain an insight into the types of bonding involved in the nickel/hydrogen system by studying various reactions, using both pure nickel films and nickel films saturated with hydrogen as catalysts. The reactions chosen for the investigation are described in chapters 4 and 6, and the interpretation of the results which they yielded is the subject of chapter 9.
-106- C H A P T E H 4
HYDROGENATION at room temperature of ethylene and cyclopropane ON NICKEL FILMS DEPOSITED IN HYDROGEN AT 77° K.
The experiments described in chapters 2 and 3 have shown that almost all the nickel atoms in an evaporated metal film can be regarded as potential adsorption sites. Whether or not they act as such depends solely on whether the adsorbate has free access to them. However, no information has so far been gathered concerning the more complex question of whether each nickel atom, as well as being capable of adsorption, is also capable of acting as a catalyst. •
Indeed, some observations recorded in the literature appear to indicate that metal films saturated with hydrogen like the ones under consideration might not be catalytically active at all. For example, Couper and Eley (10) have shown that the solution of hydrogen in a palladium catalyst greatly increases the activation energy for the parahydrogen conversion. Similarly, Bredig and Allolio (51) have found that films of platinum and palladium formed by sputtering in vacuum are good catalysts, but formed in hydrogen are quite inactive, it is thought that the poisoning effect exerted by the hydrogen raay be due to the fact that it is bonded to the metal in such 8- way that its s-electrons fill the vacancies in the d-band of the metal. It is believed that the existence of these vacancies is essential for catalytic activity among the
-107-transition metals.
It was decided to carry out experiments to see if the nickel films deposited in hydrogen at 77°K, as well as showing great enhancement in their adsorptive capacity for hydrogen, were still catalytically active. The reactions chosen for study were the hydrogenation of ethylene and the hydrogenation of cyclopropane. It was planned to measure the rate of each reaction on a film deposited in hydrogen at 77°K, and also, as a control for comparison purposes, on a film deposited in vacuum at 25° C.
Although a great deal of controversy is still extant in the literature as to the exact mechanism of ethylene hydrogenation (51-56), it is now generally accepted that at roomtemperature the reaction is zero order with respect to ethylene and first order with respect to hydrogen. This suggeststhat the ethylene is chemisorbed on the catalyst surface andthe hydrogen reacts either from the gas phase or from a van der Waals layer. In cyclopropane hydrogenation, on the other hand, the reaction has been shown (57) to be zero order with respect to hydrogen and first order with respect to cyclopropane, which suggests that in this case it is the hydrogen which is chemisorbed and the cyclopropane which forms the Physically adsorbed layer. It was because of this difference in the hydrogenation mechanisms that it was considered worth while to study both reactions.
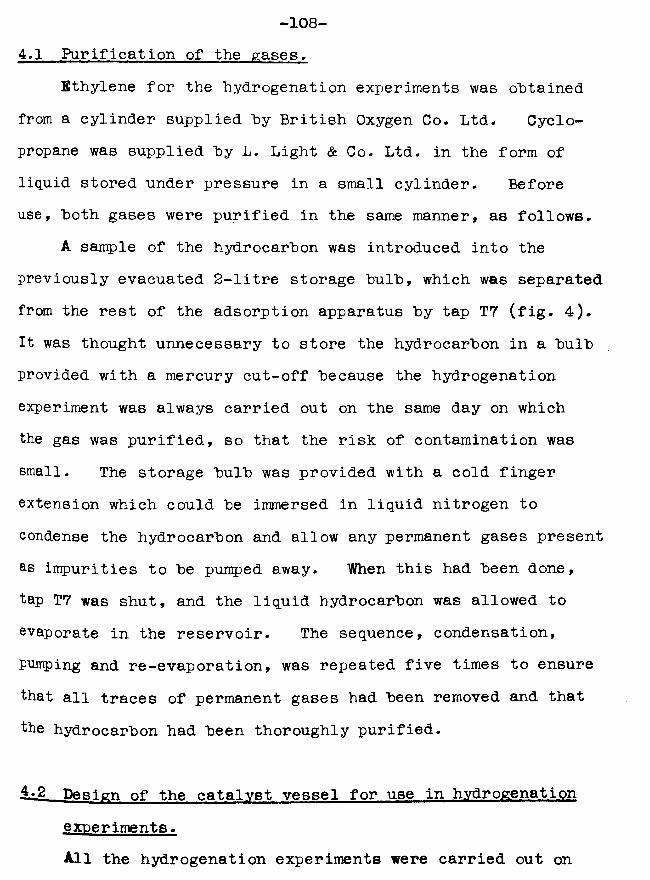
-108-4.1 Purification of the gases.
Ethylene for the hydrogenation experiments was obtained from a cylinder supplied by British Oxygen Co. Ltd. Cyclopropane was supplied by L. Light & Co. Ltd. in the form of liquid stored under pressure in a small cylinder. Before use, both gases were purified in the same manner, as follows.
A sample of the hydrocarbon was introduced into the previously evacuated 2-litre storage bulb, which was separated from the rest of the adsorption apparatus by tap T7 (fig. 4). It was thought unnecessary to store the hydrocarbon in a bulb provided with a mercury cut-off because the hydrogenation experiment was always carried out on the same day on which the gas was purified, so that the risk of contamination was small. The storage bulb was provided with a cold finger extension which could be immersed in liquid nitrogen to condense the hydrocarbon and allow any permanent gases present as impurities to be pumped away. When this had been done, tap T7 was shut, and the liquid hydrocarbon was allowed to evaporate in the reservoir. The sequence, condensation, pumping and re-evaporation, was repeated five times to ensure that all traces of permanent gases had been removed and that the hydrocarbon had been thoroughly purified.
^•2 Design of the catalyst vessel for use in hydrogenation experiments.All the hydrogenation experiments were carried out on
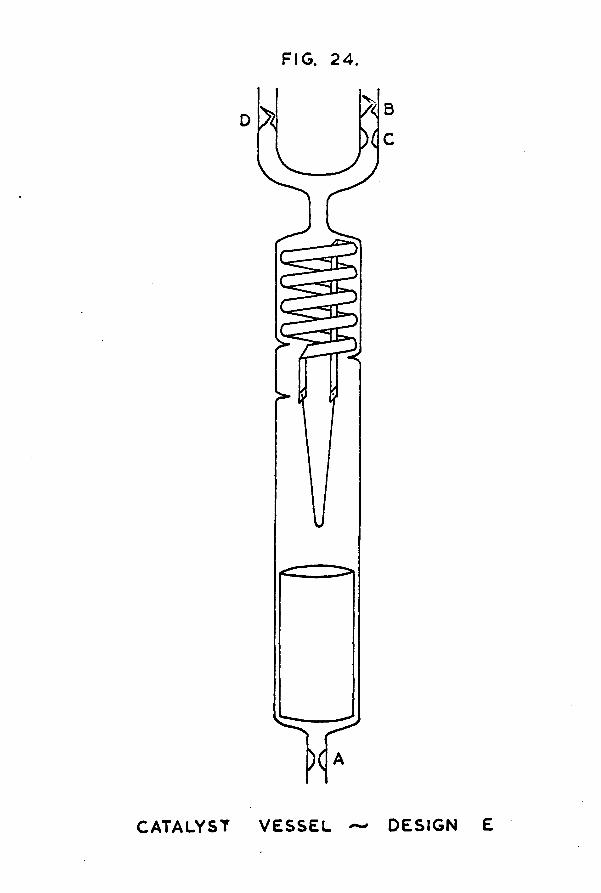
FIG. 24 .
CATALYST
)(A
VESSEL DESIGN E
-109-induction evaporated nickel films.
For the control experiments on films deposited in vacuum at 25°C, the catalyst vessel design required no alterations and was exactly as already shown in fig. 2 0 .
For the hydrogenation experiments carried out on films deposited in hydrogen at 77° K, however, a slight modification to the catalyst vessel design was necessary. Another break- seal and constriction were incorporated as shown in fig. 24. This enabled the catalyst vessel to he attached to the apparatus at one position for the deposition of the film at 77°K and simultaneous adsorption of hydrogen on it, and then to he removed and re-attached at another position for the hydrogenation part of the experiment.
4.3 The experimental method.
a) For films deposited in hydrogen at 77°K.The experimental technique was exactly the same for hoth
ethylene and cyclopropane hydrogenation. The catalyst vessel was degassed as usual ^section 2 .1 ), and then sealed off at constriction A (fig. 24). It was attached to the adsorption apparatus via the side-arm containing hreak-seal B, *nd film deposition with simultaneous hydrogen adsorption were carried out at 77°K as already described in section 3.4. When adsorption measurements had been completed, the vessel was sealed off at constriction C. It was then removed from
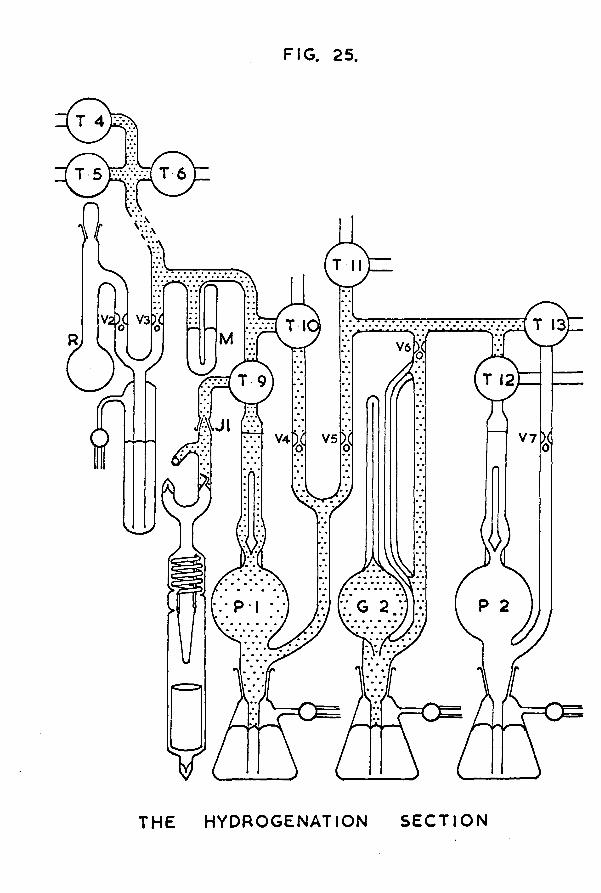
FIG. 25.
T 6T 5
T 13
T 12
V*V V5 V7
TH£ HYDROGENATION S E C TIO N
-110-the Dewar flask containing liquid nitrogen and allowed to warm up to room temperature* During this warming-up process, some of the hydrogen which had "been adsorbed at 77°K would be desorbed owing to sintering. This, however, could not be avoided, as the activation energies for the hydrogenation reactions are such that the reactions would have been immeasurably slow at 77°K, and in any case the ethylene or cyclopropane would have condensed to the solid state.
The catalyst vessel, now at room temperature, was reattached to the adsorption apparatus at joint J1 via the side-arm containing break-seal D (fig. 25). The connecting tubing was pumped down to sticking vacuum.
Ethylene (or cyclopropane) was then allowed to expand out of the storage bulb into the section incorporating TBpler pump PI and McLeod gauge G2 and enclosed by taps T4,T5, T6 , T10, Til, T12 and T13 and valve V3 (fig. 25) until a suitable pressure was recorded on the manometer M. The hydrocarbon was condensed on a convenient portion of tubing within the section by wrapping the tubing with cotton wool and pouring liquid nitrogen on it. When the manometer again recorded zero pressure, indicating that all the hydrocarbon had been condensed, hydrogen was introduced into the same section to approximately the same pressure by passing cylinder hydrogen over the heated palladium leak. When the hydrocarbon had been allowed to warm up to room temperature again, the
-111-two gases were thoroughly mixed together "by raising and lowering the mercury in T8pler pump PI six times. The total pressure exerted hy the hydrocarbon/hydrogen mixture was recorded on the manometer M.
The hydrogenation reaction was then started “by dropping a steel hall on break-seal D, shattering it, and thus allowing the hydrogenation mixture access to the nickel film. Initially, there was a fall in pressure, due simply to the expansion of the gas mixture into the catalyst vessel. Thereafter, the pressure continued to fall as the hydrogenation reaction proceeded according to the equation
CHa=CHa + Ha Mi j CH3-CH3
CHaor / \ + Hb Hi CH8—CHa—CH#.
CHa-CH,
For every two molecules of reactant used up, only one molecule of product was formed. Pressure versus time readings were taken at frequent intervals throughout the reaction.
In all the hydrogenation experiments it was observed that, after a short time, the pressure ceased to fall, indicating that the reaction had stopped, even although all the unsaturated hydrocarbon had not been hydrogenated. It was found that stirring the gas mixture by raising and lowering the mercury in the T8pler pump, thus presenting fresh gases
-112-to the catalyst surface, led to a renewal of the reaction for another short time. These observations suggested that the rate of the reaction was diffusion controlled, because there was not an efficient stirring system to circulate the gas mixture and remove the products of the reaction from the vicinity of the catalyst film. In all cases, only the pressure versus time measurements made until the reaction first stopped of its own accord were used to calculate the rate constant.
b) For films denosited in vacuum at 25°C.Essentially, the experimental technique was the same
for these films as for hydrogen deposited films. The only difference was that as soon as the catalyst vessel had been degassed and sealed off at the constriction, it was attached to the adsorption apparatus immediately at joint J1 via the side-arm containing the break-seal. While the connecting tubing was being evacuated, the nickel film was deposited in vacuum at 25°C. Thereafter, the experimental technique for the actual hydrogenation was exactly as has already been described.
4.4 Results for ethvlene hydrogenation at room temperature.
a) On a nickel film deposited in hydrogen at 77 K — film 20.The results for this experiment are given in table 10
and fig. 26.
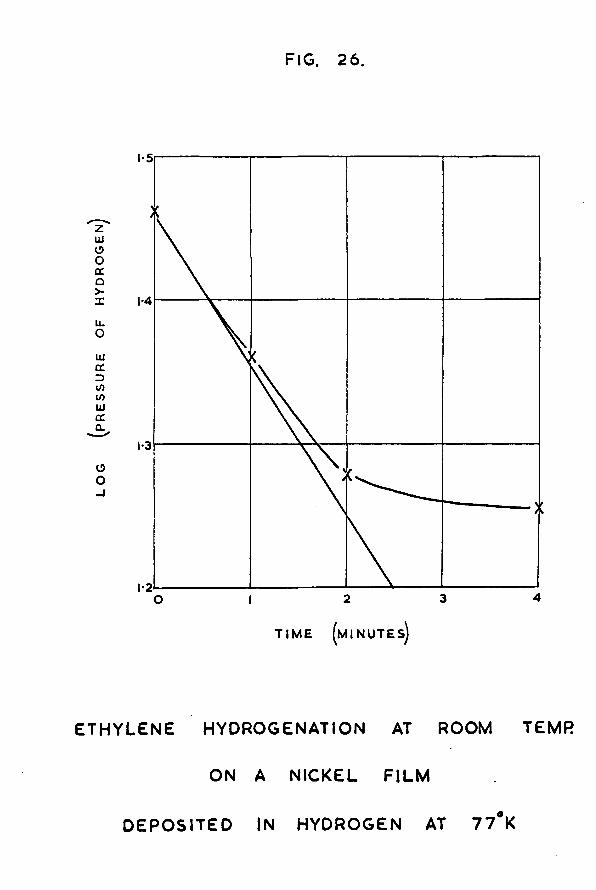
LOG
(P
RE
SS
UR
E
OF
HY
DR
OG
EN
FIG. 26.
1*4
1*3
ETHYLENE HYDROGENATION AT ROOM TEMR
ON A NICKEL F ILM
DEPOSITED IN HYDROGEN AT 77°K
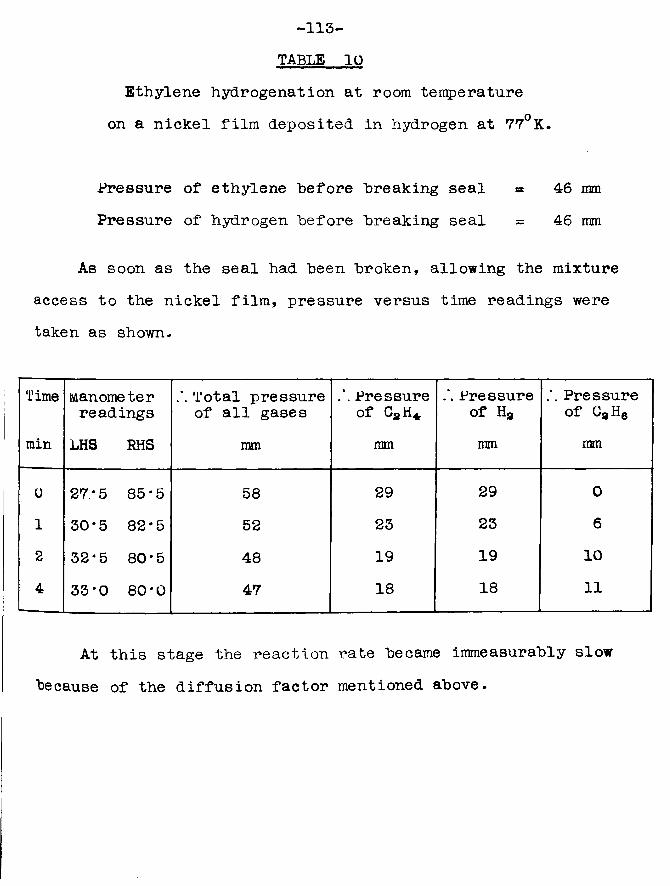
-113- TABLE 10
Ethylene hydrogenation at room temperatureon a nickel film deposited in hydrogen at 77° K.
Pressure of ethylene "before "breaking seal « 46 mmPressure of hydrogen "before Breaking seal = 46 mm
As soon as the seal had "been "broken, allowing the mixture access to the nickel film, pressure versus time readings were taken as shown.
Time Manometerreadings
Total pressure of all gases
Pressure of CaH*
Pressure of Ha
Pressure of CaHe
min LHS BHS mm mm mm ram
0 27*5 85*5 58 29 29 0
1 30*5 82*5 52 23 23 6
2 32*5 80*5 48 19 19 10
4 33*0 80*0 47 18 18 11
At this stage the reaction rate "became immeasurably slow "because of the diffusion factor mentioned above.
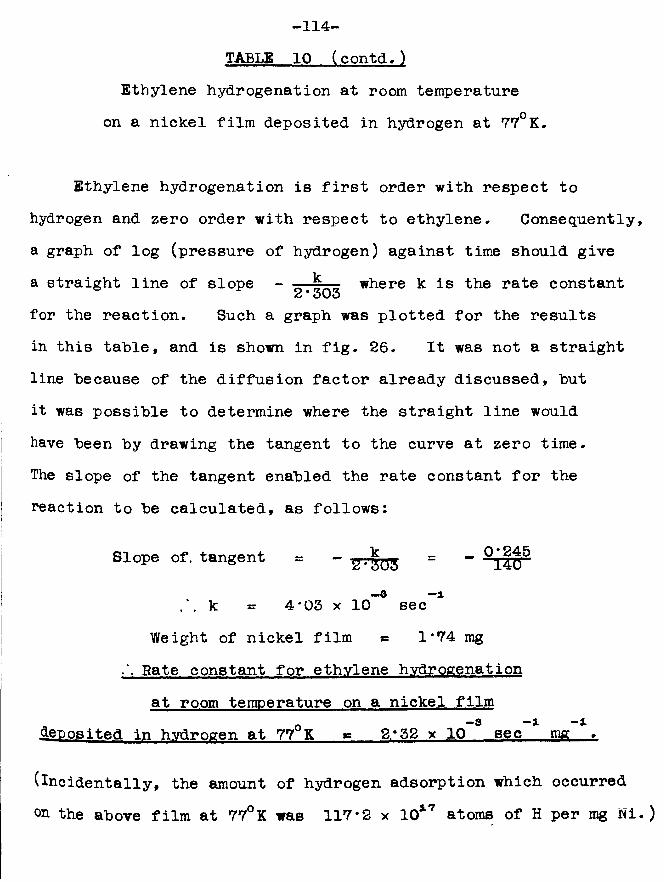
-114- TABLB 10 (contd.)
Ethylene hydrogenation at room temperature on a nickel film deposited in hydrogen at 77° K.
Ethylene hydrogenation is first order with respect to hydrogen and zero order with respect to ethylene. Consequently, a graph of log (pressure of hydrogen) against time should givea straight line of slope - ft■ ■ where k is the rate constant2# 303for the reaction. Such a graph was plotted for the results in this table, and is shown in fig. 26. It was not a straight line because of the diffusion factor already discussed, but it was possible to determine where the straight line would have been by drawing the tangent to the curve at zero time.The slope of the tangent enabled the rate constant for the reaction to be calculated, as follows:
Slope of, tangent = - “ 'S.'t'CT-3 -1. \ k as 4*03 x 10 sec
Weight of nickel film * 1*74 mgRate constant for ethylene hydrogenationat room temperature on a nickel film
o -a - 1 -*■deposited in hydrogen at 77 K «= 2.*32 x 10 sec mg
(incidentally, the amount of hydrogen adsorption which occurred on the above film at 77°K was 117*2 x 1017 atoms of H per mg Ni.)
-115-b) On a nickel film deposited In vacuum at 25°C - film 19.
The results for this experiment are given in table 11 and fig. 27.
c) Comparison between the two types of films.The results obtained in this section indicate that the
rate constant for ethylene hydrogenation for a film deposited in hydrogen is approximately twice that for a vacuum deposited film. Beeck (4) found that an oriented argon deposited film was ten times as active in ethylene hydrogenation as a nonoriented vacuum deposited film. This may or may not be significant, since very little reliance can be placed on the actual numerical values of the rate constants calculated above, in view of the somewhat inadequate experimental technique employed. The only conclusion that can be drawn with safety is that a nickel film deposited in hydrogen is catalytically active in ethylene hydrogenation at room temperature, and the rate constant for the reaction is of the same order of magnitude as for a vacuum deposited film.
4.5 Results for cyclopropane hydrogenation at room temperature.
a) On a nickel film deposited in hydrogen at 77°K - film 25.The results for this experiment are given in table 12
and fig. 28.
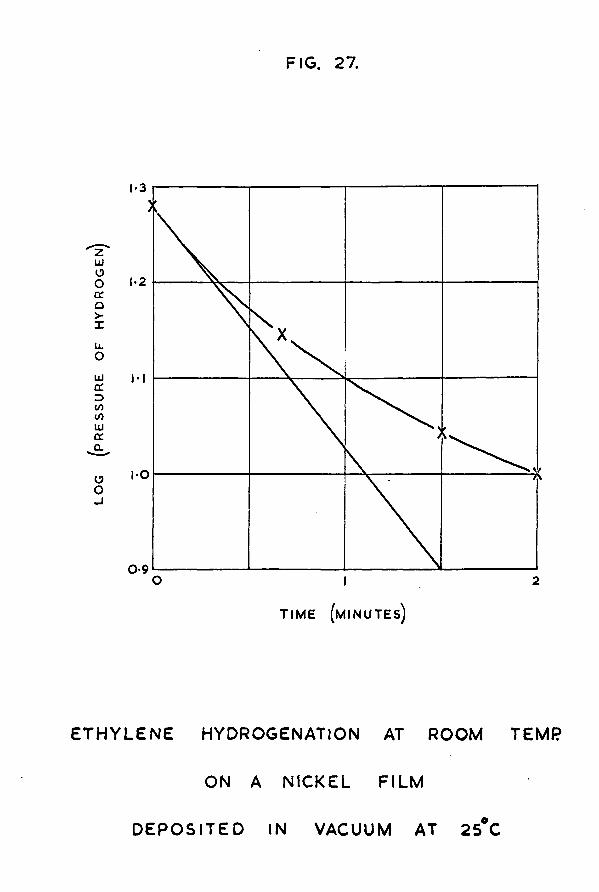
o IT IM E (MINUTES)
2
ETHYLENE HYDROGENATION AT ROOM
ON A NICKEL FILM
D EPO SITED IN VACUUM AT 25°
TEMP
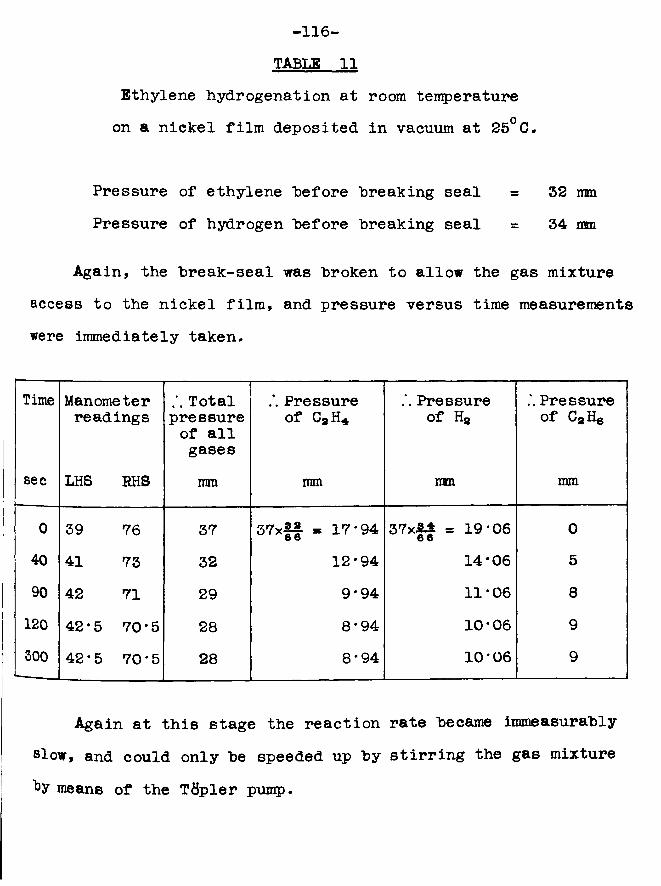
-116- TABLE 11
Ethylene hydrogenation at room temperatureon a nickel film deposited in vacuum at 25° C.
Pressure of ethylene "before "breaking seal = 52 mmPressure of hydrogen "before "breaking seal = 34 nm
Again, the "break-seal was "broken to allow the gas mixture access to the nickel film, and pressure versus time measurements were immediately taken.
Time Manometerreadings
Total pressure of all gases
Pressure of Cg H*
Pressure of Ha
Pressure of CaH6
sec LHS BHS mm mm mm mm
0 39 76 37 37xff « 17*94 37x54 = 19*06 6 6 0
40 41 73 32 12*94 14*06 590 42 71 29 9*94 11*06 8
120 42*5 70*5 28 8*94 10*06 9300 42*5 70*5 28 8*94 10*06 9
Again at this stage the reaction rate "became immeasurably slow, and could only "be speeded up by stirring the gas mixture
means of the Ttipler pump.
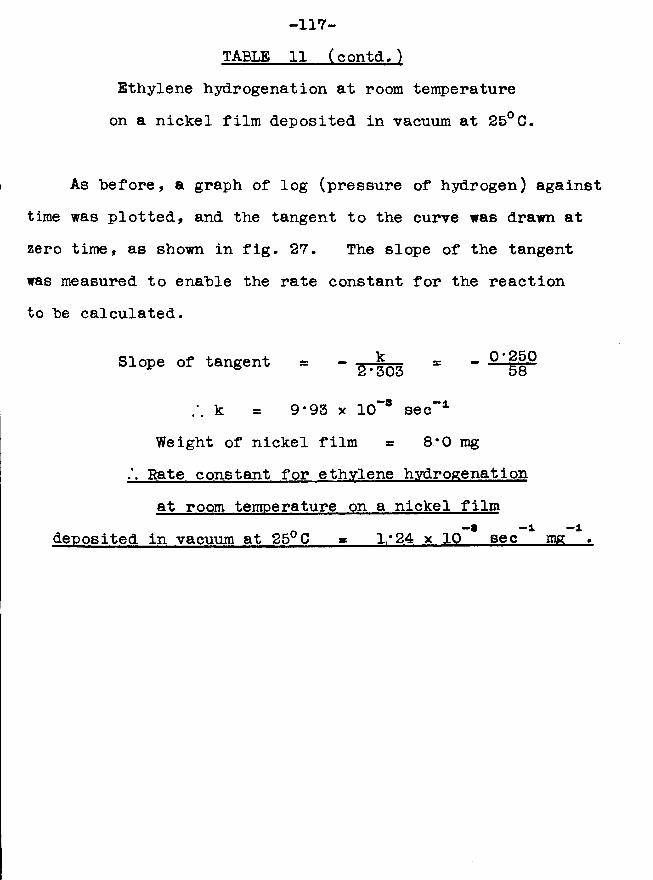
-117- TABLE 11 (contd.)
Ethylene hydrogenation at room temperature on a nickel film deposited in vacuum at 25°C.
As "before, a graph of log (pressure of hydrogen) against time was plotted, and the tangent to the curve was drawn at zero time, as shown in fig* 27. The slope of the tangent was measured to enable the rate constant for the reaction to be calculated.
Slope of tangent . - = - °^§°
k — 9*93 x 10 8 sec”1Weight of nickel film *s 8*0 mg Rate constant for ethylene hydrogenation at room temperature on a nickel film
- 8 -1 -ideposited in vacuum at 25 C * 1/24 x 10 sec mg
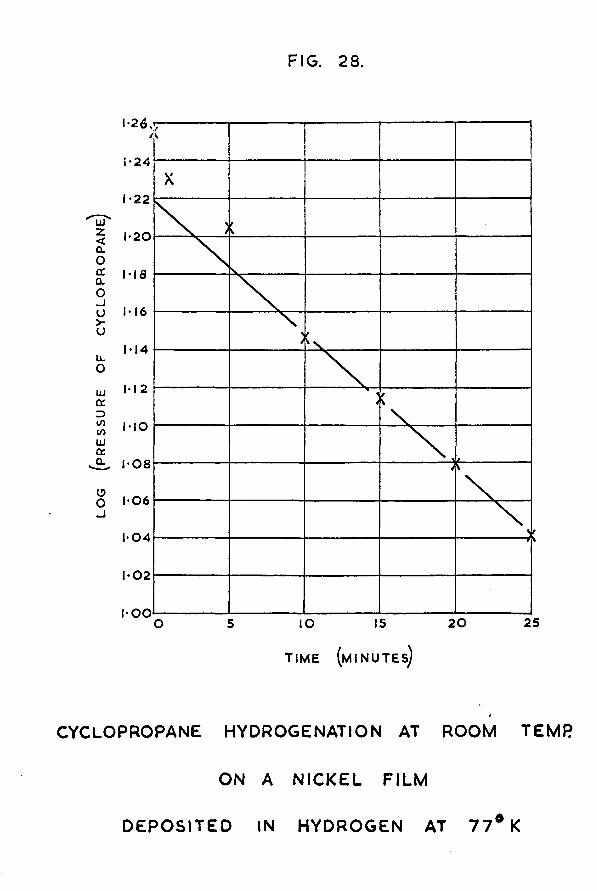
FIG. 28.
i-24
•22IX)Z<Q.OCCa.O.jo>•u
•20
u.Oixla:U)(/)UJQLCL •08OO-l •06
•04
•02
OO 20 25IO
T IM E (M IN U T Es )
CYCLOPROPANE HYDROGENATION AT ROOM TEMP
ON A NICKEL FILM
DEPOSITED IN HYDROGEN AT 7 7 * K
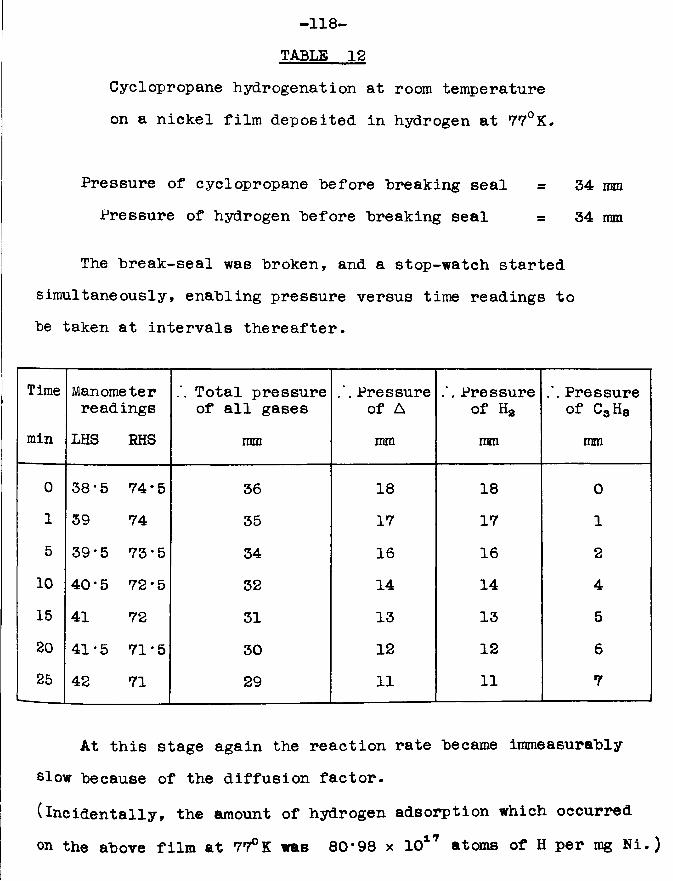
-118- TABLE 12
Cyclopropane hydrogenation at room temperature on a nickel film deposited in hydrogen at 77°K.
Pressure of cyclopropane before breaking seal = 34 mmPressure of hydrogen before breaking seal = 34 mm
The break-seal was broken, and a stop-watch started simultaneously, enabling pressure versus time readings to be taken at intervals thereafter.
Time Manometerreadings
Total pressure of all gases
Pressure of A
. Pressure of H*
Pressure of Ca Hq
min LHS RHS mm mm mm mm
0 38*5 74*5 36 18 18 01 39 74 35 17 17 15 39 • 5 73*5 34 16 16 210 40*5 72*5 32 14 14 415 41 72 31 13 13 520 41*5 71*5 30 12 12 625 42 71 29 11 11 7
At this stage again the reaction rate became immeasurably slow because of the diffusion factor.
(incidentally, the amount of hydrogen adsorption which occurred on the above film at 77°K was 80*98 x 1017 atoms of H per mg Ni.)
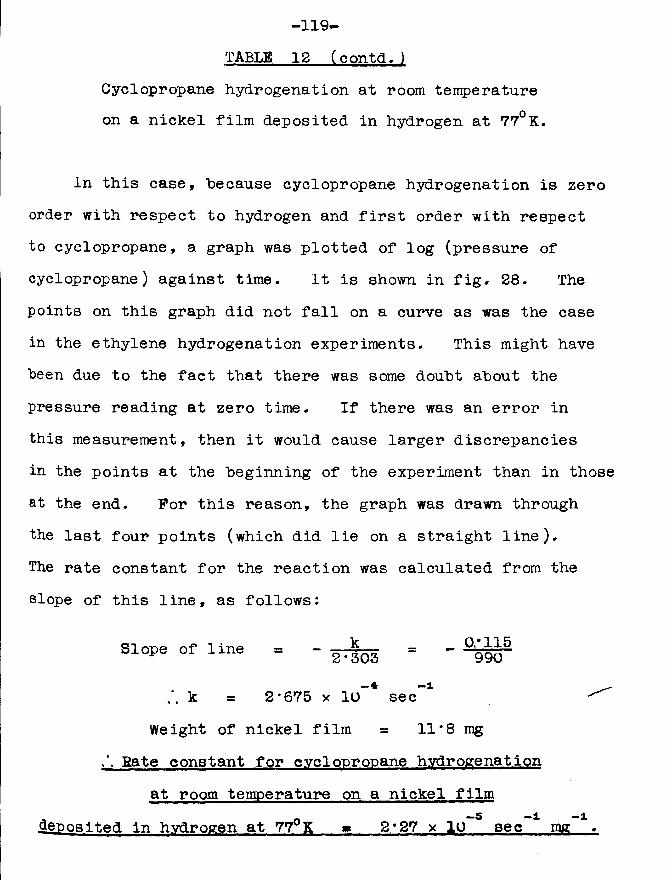
-119- TABLE 12 (contd.)
Cyclopropane hydrogenation at room temperatureon a nickel film deposited in hydrogen at 77° K.
In this case, because cyclopropane hydrogenation is zero order with respect to hydrogen and first order with respect to cyclopropane, a graph was plotted of log (pressure of cyclopropane) against time. It is shown in fig. 28. The points on this graph did not fall on a curve as was the case in the ethylene hydrogenation experiments. This might have been due to the fact that there was some doubt about the pressure reading at zero time. If there was an error in this measurement, then it would cause larger discrepancies in the points at the beginning of the experiment than in those at the end. For this reason, the graph was drawn through the last four points (which did lie on a straight line).The rate constant for the reaction was calculated from the slope of this line, as follows:
Slope of line = -
-4 -1 _k s 2*675 x 10 sec ^Weight of nickel film = 11*8 mg
Hate constant for cyclopropane hydrogenation at room temperature on a nickel film
deposited in hydrogen at 77°K ■ 2*27 x 10 sec mg
— 120-
b) On a nickel film deposited in vacuum at 25° C.Rather than carry out a control experiment, it was decided
to calculate the rate constant for cyclopropane hydrogenation on a nickel film deposited in vacuum at room temperature from the appropriate data in experiments described by Campbell (41). He had carried out six such hydrogenations in all, two on one film at different initial pressures, and four on another film at different initial pressures. The maximum variation among the six values was less than 3%, the average value for the rate constant being 2*22 x 10 8 sec 1 mg 1.
c) Comparison between the two types of films.—5 — ± — iCampbell’s value of 2*22 x 10 sec mg for the rate
constant for cyclopropane hydrogenation on a vacuum deposited nickel film was in excellent agreement with the result of
-5 -1 -1 ,2*27 x 10 sec mg obtained above for the rate constant on a hydrogen deposited nickel film. Again, this enabled the conclusion to be drawn that cyclopropane hydrogenation at room temperature proceeds equally well on nickel films deposited in hydrogen at 77°K as on films deposited in vacuum at 25°C.
4_»6 Discussion.The experiments outlined above proved that nickel films
which showed great enhancement in their adsorptive capacity
for hydrogen, because they had been deposited at 77 K in the
-121-presence of the adsorbate, were just as effective catalysts in hydrogenation reactions carried out at room temperature as were films deposited in vacuum at 25° C.
This is really the only conclusion to be drawn from these experiments, because it is particularly wished to emphasise that no great reliance be placed on the actual numerical values obtained for the rate constants. The experimental technique employed was not designed to yield accurate quantitative results. There was no method of stirring the gases to allow rapid access to the catalyst surface, nor was there adequate temperature control during the course of the reaction. Both of these refinements would be necessary for accurate kinetic work.
It was unfortunate that, because of the nature of the hydrogenation reactions chosen for study, it was necessary to allow the nickel films deposited in hydrogen at 77°K to warm up to room temperature, thereby causing desorption of some of the adsorbate. Even after warming up, however, the nickel films would still be as saturated with hydrogen as they possibly could be at 25°C, and it is significant that no poisoning of catalytic activity was observed.
Obviously, a more suitable reaction for studying the catalytic activity of nickel films deposited in hydrogen at 77°K would be one which could take place at liquid nitrogen temperature. Such a reaction is the exchange between the
-122-isotopic forms of hydrogen. Consequently, it was decided to proceed to a series of experiments in which the nickel film would he deposited at 77° K in the presence of tritiated hydrogen of known specific activity; inactive hydrogen would then he allowed access to the film, still at 77°K. The extent to which exchange occurred could then he determined hy measuring the activity of the recovered gas. These experiments, and the results which they yielded, are described in chapter 6.
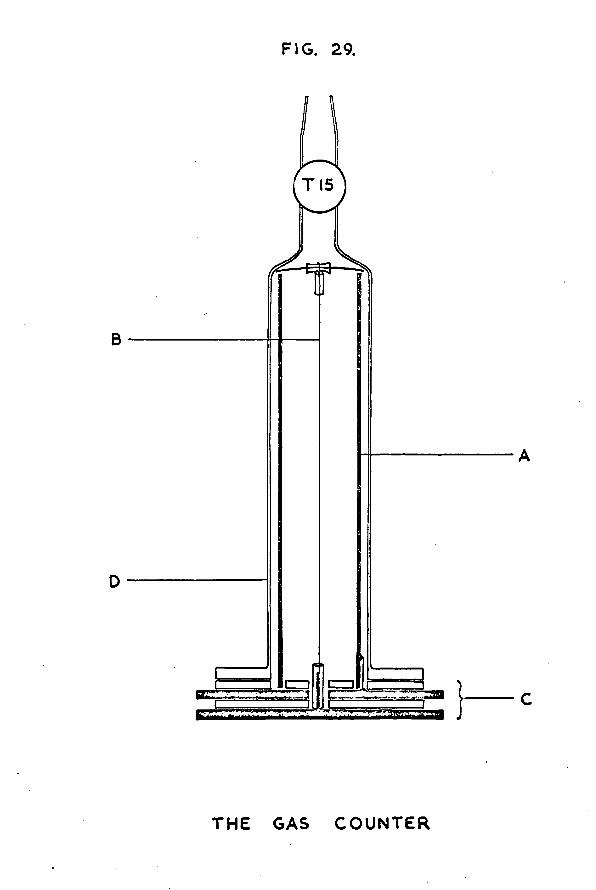
FIG. 29.
T 15
B
D
THE GAS C O U N TE R
-123- C H A P T E R 5
THE COUNTING EQUIPMENT,
5.1 Design of the gas counter.In view of the fact that previous workers, using similar
counters for the estimation of tritium, had reported (26, 41) that their equipment frequently developed faults owing to contamination of the cathode with mercury vapour, photosensitivity, etc., it was thought advisable to construct the present counter so that it could he easily dismantled and reassembled. If a fault did develop, then the appropriate part could either "be cleaned or replaced with a minimum of delay and trouble.
The final design of the counter is shown in fig. 29.The cathode (A) was constructed from a piece of copper
tubing of length 11cm, internal diameter 2cm and wall thickness 1mm. The cylinder was highly polished both internally and externally by rubbing it with Brasso-soaked cotton wool wound around a mandrel fitted in the chuck of an. electric drill. This treatment removed any scratches or roughness which might have caused spurious discharges when the counter was in use. The cathode was then placed in an oven at 130 G overnight; this oxidised the cojjper to a uniform golden colour. it was hoped that the oxide layer would increase the work function of the metal, thus lessening the chance
secondary discharges when positive ions were accelerated
towards the cathode.
-124-The anode (B) was constructed from a suitable length
of 0‘2mm tungsten wire. Again, any high spots which might have given rise to spurious discharges were removed by drawing a piece of fine emery paper along the wire. The anode was mounted lengthwise in the centre of the cathode cylinder.It was located at its upper end and held taut by being wrapped round a piece of glass capillary tubing which in turn passed around a watch spring which rested on the upper end of the cathode cylinder. The glass was necessary to insulate the anode from the watch spring which would be at cathode potential when the counter was in use. A second glass sleeve was provided to cover any sharp edges at the very top of the anode wire where the tungsten was twisted round on itself after passing over the watch spring.
Both anode and cathode were attached at their lower ends to the base plate (C). This base plate consisted of two copper discs, 6*5cm in diameter, insulated from one another by a glass disc. The lower copper disc had a 1cm length of 16 gauge copper wire silver soldered to its centre. The other end of this copper wire was soft soldered to the anode, another glass sleeve being provided to cover the sharp edges of the solder and so prevent spurious discharges. The lower copper disc was thus at anode potential when the counter was in use, and the appropriate electrical connection from the probe unit was soldered on to an extremity of it.
-125-The lower end of the cathode cylinder rested on the upper
copper disc, which was provided with a hole 0*5cm in diameter in its centre to enable the anode connection to pass through.To ensure a really good electrical contact between the cathode and its base plate, it was thought advisable to solder a short length of 22 gauge copper wire both to the outside of the cathode cylinder and to the upper copper disc. The upper copper disc was thus at cathode potential when the counter was in use, and the appropriate connection from the probe unit was soldered to its outer edge.
The two copper discs were insulated from one another by a glass disc of slightly smaller diameter, the latter also being provided with a central hole to enable the anode connection to pass. The three discs were attached together by means of Araldite adhesive; this provided a vacuum-tight seal, so that when the counter was in use, there was no risk of air leaking into it and contaminating the filling.
To the upper copper disc, there was sealed a second smaller glass disc, again with a hole in its centre. The diameter of this disc was such that it just fitted inside the copper cathode. Its purpose was three-fold. Firstly, it located the cathode so that the latter could not change its position by sliding after the counter had been assembled. Secondly, it covered scratches on the upper copper disc on which spurious discharges Night have occurred. Lastly, it eliminated the possibility ofthe occurrence of end effects because the upper copper disc
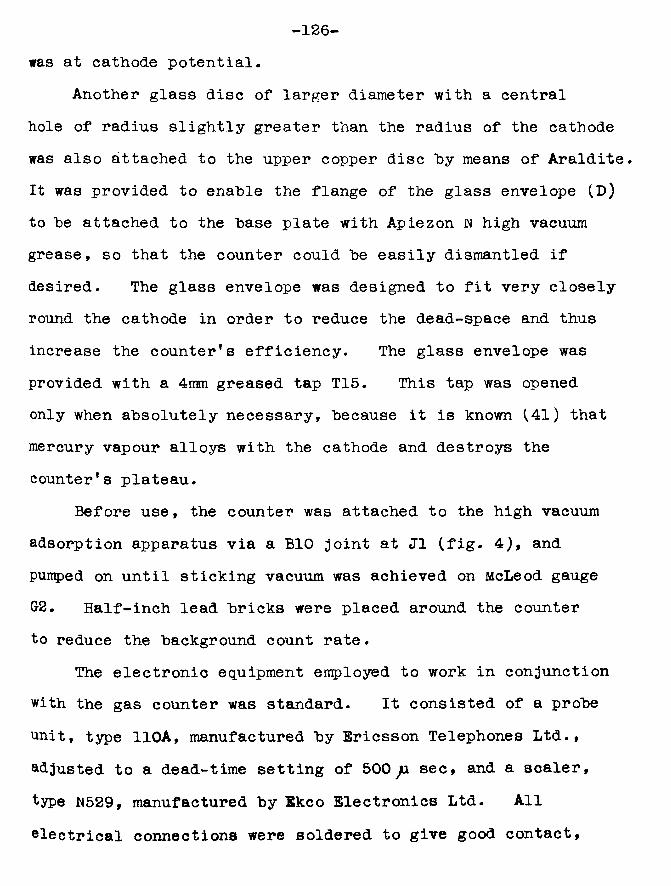
-126-was at cathode potential.
Another glass disc of larger diameter with a central hole of radius slightly greater than the radius of the cathode was also attached to the upper copper disc by means of Araldite. It was provided to enable the flange of the glass envelope (D) to be attached to the base plate with Apiezon N high vacuum grease, so that the counter could be easily dismantled if desired. The glass envelope was designed to fit very closely round the cathode in order to reduce the dead-space and thus increase the counter1s efficiency. The glass envelope was provided with a 4mm greased tap T15. This tap was opened only when absolutely necessary, because it is known (41) that mercury vapour alloys with the cathode and destroys the counter’s plateau.
Before use, the counter was attached to the high vacuum adsorption apparatus via a BIO joint at J1 (fig. 4), and purrrped on until sticking vacuum was achieved on McLeod gauge G2. Half-inch lead bricks were placed around the counterto reduce the background count rate.
The electronic equipment employed to work in conjunction with the gas counter was standard. It consisted of a probe unit, type 110A, manufactured by Ericsson Telephones Ltd., adjusted to a dead-time setting of 500 ̂u sec, and a scaler, type N529, manufactured by Ekco Electronics Ltd. All electrical connections were soldered to give good contact,
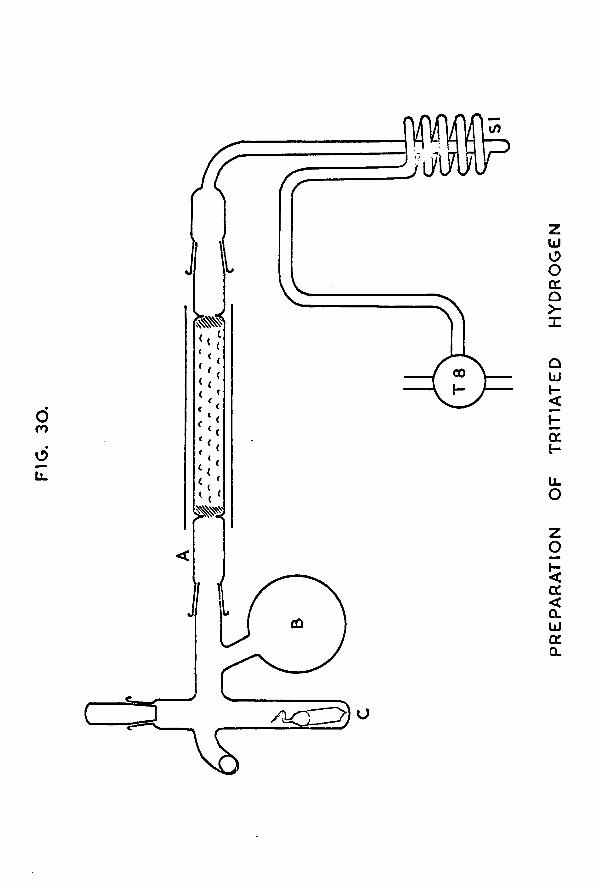
FIG
. 30
.
PREP
AR
ATI
ON
OF
TR
ITIA
TED
H
YD
RO
GE
N
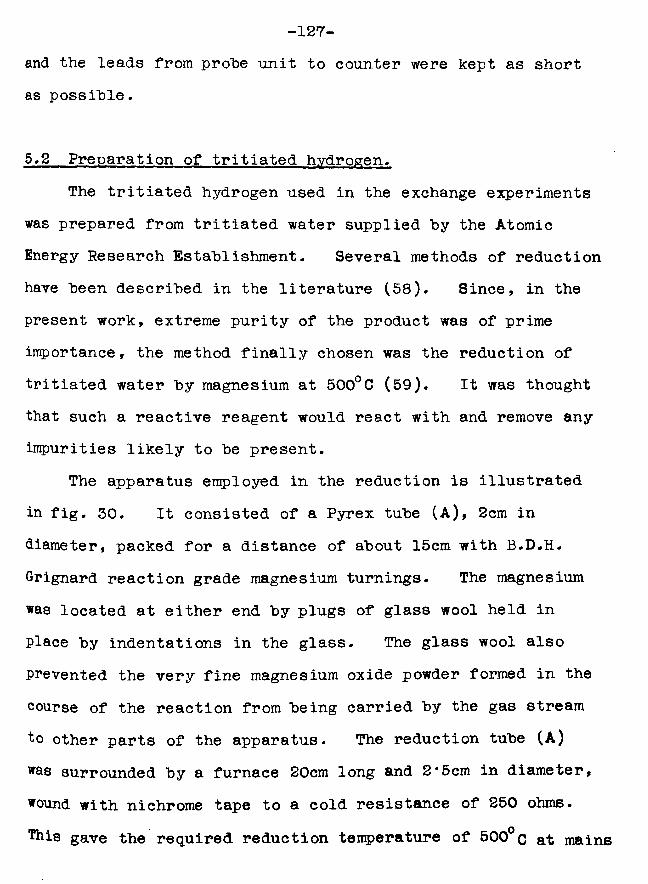
-127-and the leads from prohe unit to counter were kept as short as possible.
5*2 Preparation of tritiated hydrogen.The tritiated hydrogen used in the exchange experiments
was prepared from tritiated water supplied by the Atomic Energy Research Establishment, Several methods of reduction have been described in the literature (58), Since, in the present work, extreme purity of the product was of prime importance, the method finally chosen was the reduction of tritiated water by magnesium at 500°C (59), It was thought that such a reactive reagent would react with and remove any impurities likely to be present.
The apparatus employed in the reduction is illustrated in fig. 30. It consisted of a Pyrex tube (A), 2cm in diameter, packed for a distance of about 15cm with B.D.H. Grignard reaction grade magnesium turnings. The magnesium was located at either end by plugs of glass wool held in place by indentations in the glass. The glass wool also prevented the very fine magnesium oxide powder formed in the course of the reaction from being carried by the gas stream to other parts of the apparatus. The reduction tube (A) was surrounded by a furnace 20cm long and 2*5cm in diameter, wound with nichrome tape to a cold resistance of 250 ohms.This gave the required reduction temperature of 500°c at mains
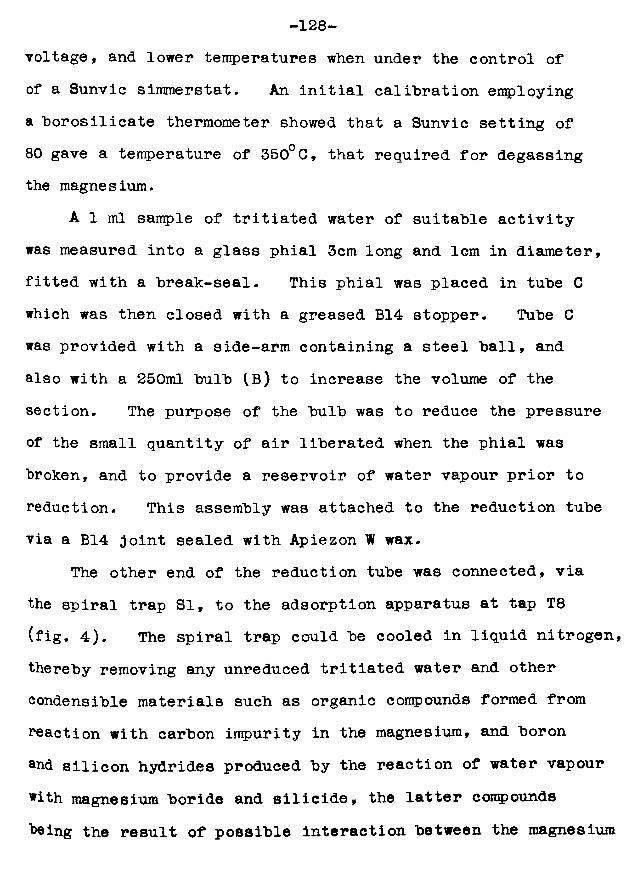
-128-voltage, and lower temperatures when under the control of of a Sunvic simmerstat. An initial calibration employing a borosilicate thermometer showed that a Sunvic setting of 80 gave a temperature of 350°C, that required for degassing the magnesium.
A 1 ml sample of tritiated water of suitable activity was measured into a glass phial 3cm long and 1cm in diameter, fitted with a break-seal. This phial was placed in tube C which was then closed with a greased B14 stopper. Tube C was provided with a side-arm containing a steel ball, and also with a 250ml bulb (B) to increase the volume of the section. The purpose of the bulb was to reduce the pressure of the small quantity of air liberated when the phial was broken, and to provide a reservoir of water vapour prior to reduction. This assembly was attached to the reduction tube via a B14 joint sealed with Apiezon W wax.
The other end of the reduction tube was connected, via the spiral trap SI, to the adsorption apparatus at tap T8 (fig. 4). The spiral trap could be cooled in liquid nitrogen, thereby removing any unreduced tritiated water and other condensible materials such as organic compounds formed from reaction with carbon impurity in the magnesium, and boron and silicon hydrides produced by the reaction of water vapour with magnesium boride and silicide, the latter compounds "baing the result of possible interaction between the magnesium
-129-and the borosilicate glass (41).
When it was desired to prepare tritiated hydrogen, the apparatus was assembled as described above, and evacuated via tap T8. The furnace was heated to 350°C to degas the magnesium turnings; the best pressure obtainable at this
— 5stage was 5 x 10 torr, and this was achieved by baking-out for 4 days. The furnace was switched off, and the magnesium allowed to cool to room temperature. Tube C containing the phial of tritiated water was then immersed in liquid nitrogen, and the seal on the phial broken. The ice condensed in the exit was removed by repeatedly dropping the steel ball on it; having freed the exit, the air enclosed in the phial was pumped away. The temperature of the furnace was then raised to 500°C, and pumping was continued for about half an hour until no residual pressure was indicated on the Vacustat on the main vacuum line. When this state had been achieved, the system was isolated from the pumps and the spiral trap SI was cooled in liquid nitrogen. The refrigerant was removed from tube C to allow the tritiated water to evaporate and pass over the hot magnesium.
Tfipler pump PI (fig. 4) was used to transfer the tritiated hydrogen thus prepared into the previously evacuated 2-litre storage bulb with associated mercury cut-off, where the gas was stored until required for an exchange experiment. The first 2cm of tritiated hydrogen were used to flush out
-130-the storage bulb, and were then discarded. Constant Tiipler pumping was continued for a period of two hours to obtain 2 litres of tritiated hydrogen at a pressure of 200 torr.
5.5 Preparation of the quenching agent.The quenching agent used in the counter was ethyl alcohol.
A sample of Burroughss ethyl alcohol was dried by shaking it with anhydrous magnesium sulphate. The dried alcohol was then distilled, using a semi-micro distillation outfit, and the fraction boiling at the literature value for the boiling point of ethyl alcohol (78*3°C) was collected. A few ml of this purified ethanol were transferred to the reservoir R (fig. 4), which was subsequently closed with a greased B7 stopper. The bulb of the reservoir was then immersed in liquid nitrogen, and the air which had been admitted to the system along with the alcohol was pumped away. The ethanol was allowed to warm up to room temperature, pumping being continued until bubbles of dissolved gases were no longer liberated. The mercury in the cut-off was then raised against ball valves V2 and V3 to isolate the reservoir. This procedure of condensing the alcohol, pumping on the reservoir, and allowing the alcohol to warm up was repeated until sticking vacuum was achieved on McLeod gauge 62 when the alcohol was condensed, and no bubbles of dissolved Bases were observed when the quenching agent was allowed to
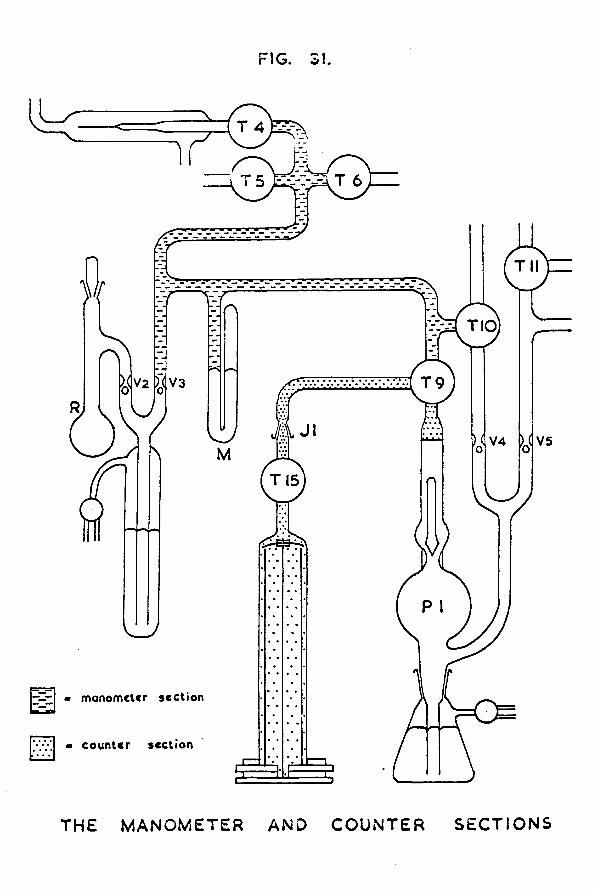
Iiiii
FIG. 3!.
T 4
T 6
Til
TIO,
T 9V3V2 ,u)< V4 V5
T 15
manometer section
■ counter section
THE MANOMETER AND COUNTER SECTIONS
-131-warm up.
5.4 Calibration of the manometer section.The filling for the gas counter always consisted of 8cm
pressure of hydrogen and 2cm pressure of ethyl alcohol vapour. While the quenching agent was introduced into the counter section by direct expansion, it was necessary to measure out the hydrogen in another section and transfer it to the counter by means of Tftpler pump PI. As the hydrogen was obtained by passing cylinder hydrogen through the heated palladium leak in the usual fashion, a section suitable for this purpose was that enclosed by taps T4, T5, T6, T9 and T10 and valve V3. This section was provided with a manometer M for measuring pressures, and will henceforth be referred to as the manometer section (fig. 31).
The manometer section and the counter section (which consisted of the counter itself, the volume between taps T15 and T9, and the volume between tap T9 and the sinter immediately below it to which the mercury in Tttpler pump PI could be raised) were calibrated with respect to one smother. This was done in order that the manometer M could be used to measure the pressure of hydrogen, which, when transferred to the counter section by Tfipler pump PI, would exert a pressure of 8cm.
The calibration was carried out by admitting carbon
-132-dioxide to the previously evacuated counter and manometer sections until a pressure of 8*Ocm was recorded on the manometer M. Tap T9 was then closed, and the gas in the manometer section was pumped away until no residual pressure was recorded on the manometer. A piece of cotton wool was wrapped round a convenient portion of tubing in the manometer section, and was soaked in liquid nitrogen. Tap T9 was then opened to enable the carbon dioxide which had been contained in the counter section to expand into the manometer section and be condensed on the cooled region of tubing. An indication that all the carbon dioxide had condensed was obtained when no residual pressure was observed on the manometer. When this state of affairs was achieved, tap T9 was again closed, and the cooled region of tubing was allowed to warm up. When equilibrium was reached, the pressure which the carbon dioxide exerted when enclosed in the manometer section was read directly on the manometer.
By this method, it was shown that gas which exerted a pressure of 14*2cm in the manometer section would exert a pressure of 8*Ocm when transferred to the counter section.
-5*5 A study of the characteristics of the gas counter.When it was desired to fill the counter with the
aPpropriate gas mixture, the following procedure was adopted. The counter, attached to the adsorption apparatus at joint J1
-133-
(fig. 4), was pumped on until sticking vacuum was achieved on McLeod gauge G2. The counter and manometer sections were then isolated from the pumps. The ethyl alcohol was cooled in liquid nitrogen in the reservoir R, and the mercury in the cut-off lowered. The ethyl alcohol was gradually warmed by blowing hot air on the bulb, until a pressure of 2cm of alcohol vapour, as measured on the manometer M, had expanded into the counter and manometer sections, when the mercury in the cut-off was again raised. Tap T9 was then turned anti-clockwise through 90° to retain the alcohol vapour in the counter section while the manometer section was evacuated by connecting tap T10 to the main vacuum line. Tap T10 was then shut, and hydrogen, purified by having been allowed to pass through the heated palladium leak, was introduced into the manometer section by opening tap T4.When the requisite pressure of 14*2cm of hydrogen had been admitted to the manometer section, tap T4 was again shut.The counter and manometer sections were reconnected together by turning tap T9 clockwise through 90°, and both sections were also connected to the original small calibrated section by suitably adjusting the position of tap T10. Before doing this, the mercury in McLeod gauge G2 had been raised against valve V6 to reduce the volume of dead-space. The ethyl alcohol vapour and the hydrogen were then thoroughly mixed together by circulating the gases round the counter, manometer
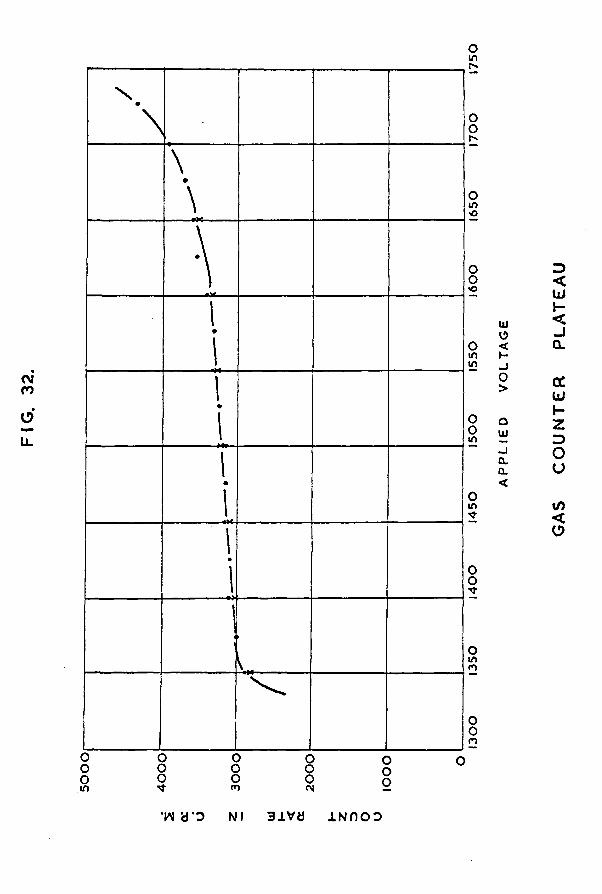
ooos
W b ’O NI 31V« 1NOOD
-134-and small calibrated sections "by raising and lowering the mercury in Tttpler pump PI six times. Tap T9 was again turned anti-clockwise through 90° to connect the Tfrpler pump to the counter alone, and pumping was continued to transfer the gas mixture to the counter section. It was found that after a further twelve TBpler pump strokes, no residual pressure was detectable on the manometer, indicating that all the gas mixture had been transferred to the counter section. Tap T15 was then shut to retain the appropriate inactive gas mixture of 2cm alcohol vapour and 8cm hydrogen in the counter.
The plateau of the counter was determined by filling it as above, and then positioning a radioactive source of cobalt-60 close to the glass envelope of the counter. The voltage applied across the counter’s electrodes was gradually increased until the threshold voltage was reached, when counts were first recorded on the scaler. The voltage was then increased at 25 volt intervals, five separate one-minute counts being taken at each voltage, until the counter began to go into continuous discharge. Immediately, the plateau was redetermined, this time coming back down the voltage scale, to see if hysteresis was observed. The two estimates of the plateau, however, agreed very well, as shown in fig. 32, where the average count rate at each voltage is represented by a circle when the voltage scale was being ascended and by
-135-a cross when it was being descended. Other tests were carried out, which involved allowing the counter to stand with the same gas filling in it for several days, redetermining the position of the plateau at intervals throughout this period of time. In all cases it was found that the plateaux wereidentical within the limits of statistical variations, so long as the position of the radioactive source relative to the counter remained unchanged. This proved that the counter was vacuum tight, as it is known that even a small amount of air contaminating the filling results in a drastic shortening in the length of the plateau, and an increase in its slope. Further tests also proved that the counter could be evacuated and refilled without altering the position of the plateau.Fig. 32 shows that the counter described had a long shallow plateau, over 200 volts in length and with a slope of 3*3% per 100 volts. A suitable operating voltage was 1450 volts.
While these plateaux determinations were being made, it was observed that, just before the counter went into continuous discharge when a high voltage was applied across the terminals, sparking occasionally occurred between the anode wire where it passed over the glass sleeve insulator and one side of the top of the cathode. As it was realised that these sparks would be bound to give rise to spurious counts, the phenomenon was investigated further. An oscilloscope was incorporated in the counting circuit, and it was shown that every time a
-136-spark was observed within the counter a double pulse appeared on the oscilloscope screen. An attempt was made to eliminate the sparking by completely covering the anode wire with Apiezon W wax where it passed over the insulator, but the attempt was unsuccessful. Further studies, however, showed that no sparking or double pulses ever occurred below an applied voltage of 1600 volts. As the above counter had been shown to have an optimum operating voltage of 1450 volts, it was realised that the sparking was unimportant. Indeed, a search of the literature showed that it was quite common for gas counters to give multiple pulses just before they went into continuous discharge (60).
To test if the counter was behaving statistically, fifty one-minute counts were taken at the operating voltage of 1450 volts. When counting was commenced immediately after the H.T. voltage had been switched on, it was observed that the first few counts were always higher than later counts, and that the count rate gradually fell over a period of about 10 minutes, after which time equilibrium was achieved and the count rate remained relatively steady. Other workers (61) have also observed an initial drop in counting efficiency with time, followed by stable operation. Consequently, before any counts were taken, either during an exchange experiment or when estimating the specific activity of the tritiated hydrogen, the H.T. supply was always switched on at 1450 volts
-137-at least 10 minutes "before any activity measurements were made. When this was done, it was found that the counter did indeed behave statistically. When sets of fifty one-minute counts were taken as estimates of the activity of a particular source, it was found that the standard deviation calculated on the fifty results always agreed very closely with the square root of the mean result. When a histogram was drawn of the distribution of a set of such results, this too had the shape expected on the basis of statistics.
It was thought advisable to carry out preliminary tests to observe how the counter reacted to variations in conditions which might occur during the course of an exchange experiment.
The first variable to be investigated was room temperature. A plateau determination was made when room temperature was 18°C. Warm air from a hair-drier was then blown on the counter until it was too warm to touch comfortably, and the plateau determination was repeated for the same source position. The two plateaux wer# identical, showing that variations in temperature did not have any effect either on the count rate or on the operating voltage.
The effect of variations in mains voltage was then studied. By connecting different loads to the same power point to which the scaler was attached, it was possible to vary mains voltage between 217 volts and 223 volts. Several one-minute counts
of the activity of the cobalt-60 source were made with the
-138-applied H.T. voltage set at 1450 volts, the value of* mains voltage being noted in each case. No correlation was observed between count rate and mains voltage, indicating that the control for stabilisation of the voltage incorporated in the design of the scaler was adequate to compensate for any small variations in mains voltage which might occur during the course of an exchange experiment.
It was thought that the high frequency induction heater and the thermostat might adversely affect the proper functioning of the counter if these were switched on at the same time as an activity determination was being made. To test this theory, a background estimation was made when both these devices were in operation, and again when both were switched off. The activity in both cases was found to be the same, and when the oscilloscope was connected in the counting circuit no spurious pulses could be detected on the screen when either the induction heater or the thermostat was in operation. This proved that neither device interfered with the operation of the counter.
Lastly, the effect of variations in the pressure of the 8fis mixture filling the counter was studied. The counter was evacuated and filled with 2cm ethyl alcohol vapour and 6*8cm hydrogen, the gases being mixed in the usual fashion. The external cobalt-60 source was placed near the counter, and a Voltage of 1450 volts applied. After allowing a 10 minute
-139-warming-up period, several counts were taken over one-minute intervals. The pressure in the counter section was then increased "by 0*3cm "by adding the appropriate amount of hydrogen, and more one-minute counts were taken at 1450 volts. The pressure was gradually increased in this fashion until the total hydrogen pressure was 9*7cm, one-minute counts "being taken at 1450 volts at all stages. It was found that the count rate decreased linearly with increasing hydrogen pressure. The magnitude of the effect was such that the count rate decreased "by 1*31% per cm of hydrogen added. This preliminary test showed that the counter could "be used with a hydrogen pressure of anything "between 7cm and 9cm, and the count rate recorded would not differ from the true count rate (i.e. what the count rate would have "been had the hydrogen pressure been 8cm) by more than 1*5$. As variations in the pressure of the gas filling the counter during the course of a normal exchange experiment were never likely to be of this magnitude, the effect of pressure on count rate could be neglected.
5_«6 Determination of the specific activity of the tritiatedhydrogen.Atomic disintegration is a random process, and hence
radioactive tracer measurements are subject to statistical errors. In order to reduce these statistical errors to a minimum, each estimation of the activity of a sample of
-140-tritiated hydrogen was continued until approximately 10,000 counts had been recorded. The standard deviation obtained was therefore /10,000 counts per 10,000 counts, or 1$. So that it would not be necessary to wait an inconveniently long time before the required 10,000 counts had been recorded, it was decided to prepare tritiated hydrogen of such an activity that an exchange sample might be expected to yield a count rate of approximately 10,000 counts per minute.
It was planned to carry out exchange experiments on three different types of nickel films:a) those deposited in tritiated hydrogen at 0°C,h) those deposited in vacuum at 77°K with subsequent adsorption
of tritiated hydrogen on them, and c) those deposited in tritiated hydrogen at 77°K.As the three types of films all adsorbed hydrogen to different extents, it was anticipated that the amount of exchange occurring on them would also differ, so it was thought advisable to have available three separate samples of tritiated hydrogen of different activity. Only the most active sample of tritiated hydrogen was actually prepared by reduction of tritiated water. The other two less active samples were obtained from the first by dilution with inactive hydrogen.
The tritiated water supplied by A.B.R.E., Harwell, had activity of 1 curie per 5ml. One drop of this stock
solution was diluted with distilled water to 10ml in a graduated
-141-flask, and the solution was thoroughly shaken to achieve homogeneity. This diluted tritiated water, which therefore had an approximate activity of 1 mC per ml, was reduced "by the hot magnesium to yield the most active sample of tritiated hydrogen, as described in section 5.2.
To determine the specific activity of this sample of tritiated hydrogen, the following procedure was adopted.The counter was filled with 2cm of ethyl alcohol vapour and 8cm of inactive hydrogen in the usual fashion, and a background estimation was made at 1450 volts over a period of one hour.The small calibrated section was pumped down to sticking vacuum. A sample of the tritiated hydrogen was introduced into it, and its amount measured. The counter filling was then allowed to expand into the calibrated section, and the gases were thoroughly mixed by circulating them six times round the manometer, counter and small calibrated sections by means of Ttipler pump PI. The mixture was then transferred to the counter by twelve Tttpler pump strokes. The sample was counted at 1450 volts, ten estimates being made of its activity.
After the small calibrated section had been pumped down to sticking vacuum again, a second sample of tritiated hydrogen w&s measured out in it. This second sample was added to the existing counter filling in the same manner as described above, end the total activity of the combined samples was measured.The process was finally repeated for the addition of a third
-142-sample of tritiated hydrogen. Calculation showed that the increase in pressure in the counter section caused by the addition of the three-samples of tritiated hydrogen to the existing filling was less than 2mm; the effect of this on the count rate would be negligible (section 5.5).
The counter section was then evacuated, and the entire experiment repeated twice more, to yield nine separate estimates of the specific activity of the tritiated hydrogen.The results are shown in table 13.
To obtain a less active sample of tritiated hydrogen, a portion of the original sample was diluted by a factor of about five'with pure inactive hydrogen. The mixture was left in a storage bulb for 48 hours to allow thorough mixing to occur, then its specific activity was determined by a method exactly analogous to that already described. Results are given in table 14.
To obtain a third batch of still less active tritiated hydrogen, a portion of the most active gas was diluted by a factor of about fifty with pure inactive hydrogen. The mixture was stored for at least 48 hours to achieve homogeneity Before any activity measurements were made. To obtain a reasonable count rate with this less active tritiated hydrogen, it was necessary to introduce a larger sample into the counter. Consequently, a sample was measured out in the "7 litre”
calibrated section. Calculation showed that gas which exerted
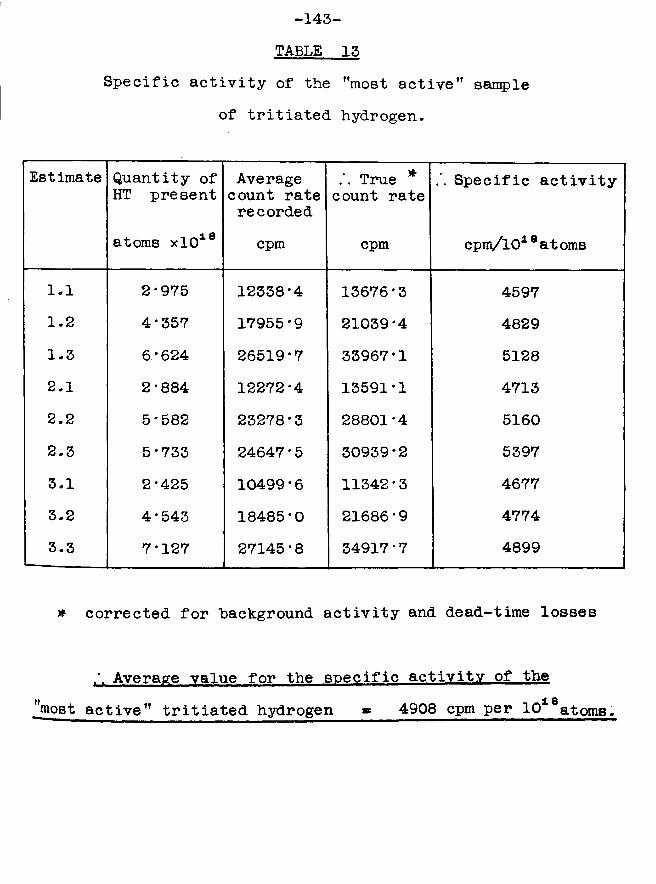
-143- TABLE 15
Specific activity of the "most active" sample of tritiated hydrogen.
Estimate Quantity of HT present
Average count rate recorded
. True * count rate
Specific activity
atoms xlO18 cpm cpm cpm/l018atoms
1.1 2*975 12338*4 13676*3 45971.2 4*357 17955*9 21039*4 48291.3 6*624 26519*7 33967*1 51282.1 2*884 12272*4 13591*1 47132.2 5*582 23278*3 28801*4 51602.3 5*733 24647 * 5 30939*2 53973.1 2*425 10499*6 11342 * 3 46773.2 4*543 18485*0 21686*9 47743.3 7*127 27145*8 34917*7 4899
* corrected for "background activity and dead-time losses
Average value for the specific activity of the "most active" tritiated hydrogen » 4908 cpm per 1018atoms.
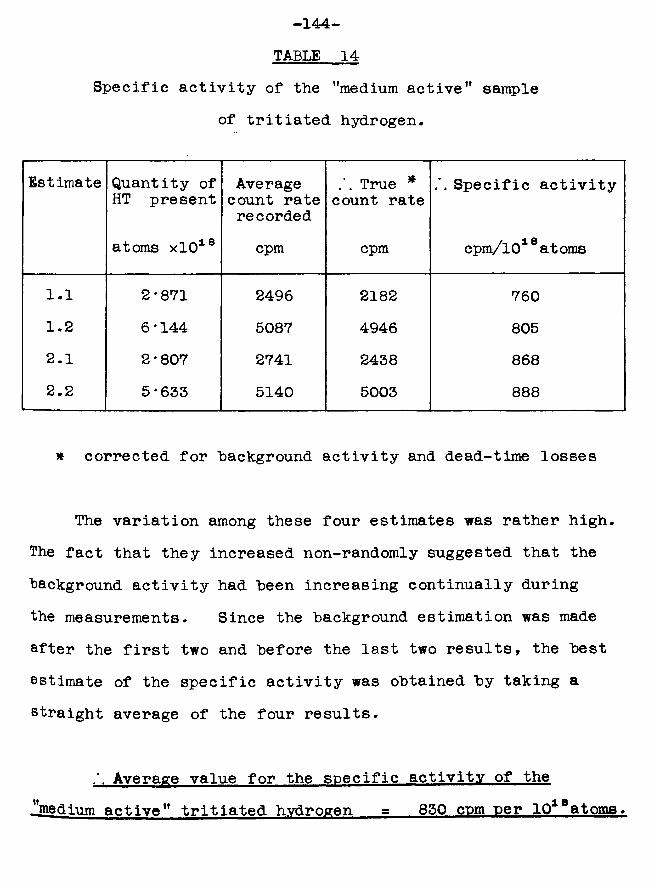
-144- TABLE 14
Specific activity of the "medium active" sample of tritiated hydrogen.
Estimate Quantity of HT present
Average count rate recorded
True * count rate
Specific activity
atoms xlO18 cpm cpm cpm/1018 at oms
1.1 2*871 2496 2182 7601.2 6*144 5087 4946 8052.1 2*807 2741 2438 8682.2 5*633 5140 5003 888
* corrected for background activity and dead-time losses
The variation among these four estimates was rather high. The fact that they increased non-randomly suggested that the background activity had been increasing continually during the measurements. Since the background estimation was made after the first two and before the last two results, the best estimate of the specific activity was obtained by taking a straight average of the four results.
Average value for the specific activity of the ■lljnedium active" tritiated hydrogen = 850 cpm per l.O18atoms*
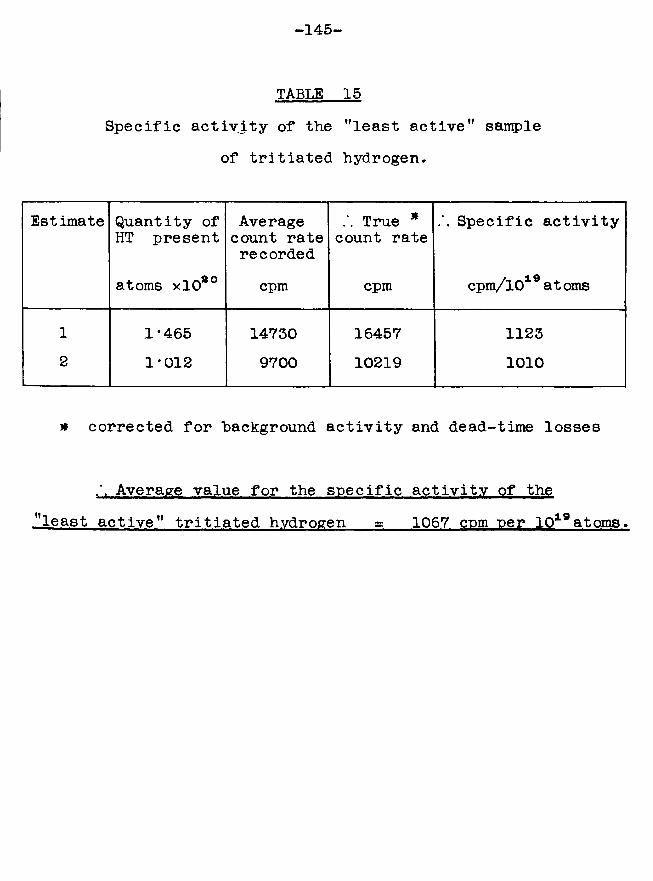
-145-
TABLE 15Specific activity of the "least active” sample
of tritiated hydrogen.
Estimate Quantity of HT present
Average count rate recorded
True * count rate
Specific activity
atoms xlO80 cpm cpm cpm/1019 atoms
1 1*465 14730 16457 11232 1*012 9700 10219 1010
* corrected for background activity and dead-time losses
Average value for the specific activity of the "least active" tritiated hydrogen a 1067 com per 1019atoms.
-146-- l
a pressure of 3 x 10 torr in a volume of approximately 7 litres would exert a pressure of 2*8cm when transferred to the counter section. For this reason, only 5*2cm of inactive hydrogen were added to bring the total hydrogen pressure up to the required 8cm. The gases were thoroughly mixed together, and were transferred quantitatively to the counter section, where an activity estimation was made at 1450 volts. The entire procedure was then repeated to yield the results given in table 15.
It was somewhat disturbing to note that, for all three samples of tritiated hydrogen, the agreement among the individual estimates of the appropriate specific activity was not particularly good. For this reason, a rapid specific activity determination was always carried out immediately "before and immediately after each exchange experiment, to check that the counter1s efficiency had not altered significantly during the course of the experiment or in the time interval between the accurate specific activity determination described above and the exchange experiment. If the two rapid determinations agreed well with one another and with the previous more accurate determination, then full reliance could be placed on the exchange results for that particular experiment.
The question of loss of activity owing to radioactive decay was also considered. The calculation set out in appendix S shows that the activity of tritium falls by 1% in
-147-9*3 weeks. As all the exchange experiments were completed within two months of the original specific activity determinations, this effect was small, hut was accounted for in any case by redetermining the specific activity immediately before and after each exchange experiment.
-148- C H A P T E 5 6
HYDROGEN/TRITIUM EXCHANGE REACTIONS ON NICKEL FILMS.
The results of the experiments detailed in chapter 3 suggested that each nickel atom in an evaporated metal film was capable of acting as an adsorption site for a hydrogen atom, provided the gas had free access to the metal. It was decided to investigate the more complex question of whether each individual nickel atom was also capable of acting as a catalyst by studying the exchange reaction between gas phase hydrogen and adsorbed tritium. It was also hoped that these investigations would throw some light on the manner in which the hydrogen was bound to the nickel surface.
Exchange between the isotopic forms of hydrogen was chosen as a reaction eminently suitable for the investigation for two reasons. Firstly, the reaction could be carried out at liquid nitrogen temperature; this enabled the films which exhibited the maximum adsorptive capacity for hydrogen (i.e. those deposited in the presence of hydrogen at 77°K) to be studied in their original form, without the necessity of allowing them to warm up to a higher temperature (cf. chapter 4). Secondly, the hydrogen/tritium exchange reactionbad the added advantage over other reactions which could occur at 77°K (e.g. the ortho-parahydrogen conversion, and e<luilibration between Hj and D* to yield HD) that, in the former, one of the reactants (tritium) was adsorbed on the
-149-surface at the beginning and was not replenished during the course of the reaction. The amount of tritium which appeared in the gas phase after exchange was therefore a direct measure of the quantity of adsorbed material which could participate in the reaction, and hence of the number of nickel atoms which acted as sites of catalytic activity. In the ortho- parahydrogen conversion and H2/Da equilibration reactions, on the other hand, the ultimate extent to which reaction occurred would be independent of the number of catalytically active sites available, although of course the rate at which equilibrium was reached would increase with increasing number of available sites.
6.1 Preliminary experiments.A series of experiments showed that, for all types of
nickel films, tritiated hydrogen was adsorbed to exactly the same extent, within the limits of experimental error, as inactive hydrogen. This proved that all three samples of tritiated hydrogen were of the same high degree of purity as the inactive hydrogen previously used.
In a preliminary exchange experiment, a nickel film was
deposited at 7 7 ° in ^he presence of tritiated hydrogen, and the amount of gas adsorbed on the film was measured in the usual fashion. All the gas phase tritiated hydrogen was then pumped away until McLeod gauge G2 registered sticking
-150-vacuum. A sample of ordinary inactive hydrogen was next introduced into the “litre” calibrated section, and its quantity measured. By opening tap T13 the hydrogen was allowed to expand into the catalyst vessel, where it was left in contact with the film for 10 minutes. The gas phase hydrogen was then transferred back into the McLeod gauge section for measurement, pumping being continued until the Pirani gauge registered a negligible pressure in the catalyst vessel section. This procedure was repeated for three separate inactive hydrogen samples, and in all cases the amount of gas recovered agreed with the quantity originally measured out for exchange to better than 0*2%. Yet when each sample recovered was individually transferred to the counter, it was found to be radioactive. This indicated that it contained tritium and hence that exchange had occurred when the inactive hydrogen was in contact with the film. The experiment proved that, during exchange, for every atom that was displaced from the surface another atom was adsorbed in its place. It further proved that the tritium measured in the gas phase after exchange was indeed due to a true exchange process; this confirmed that the trapping facilities for mercury were adequate - had mercury been displacing tritium adsorbed on the film, an increase in the number of gas phase atoms recovered would have been observed.
Having established by the above experiment that, in the
-151-exchange process, the same quantity of hydrogen was always recovered as had been originally introduced, it was realised that there was no longer any need to measure the quantity of inactive gas being made available for exchange. A large excess of inactive hydrogen (i.e. much more than the amount of tritiated hydrogen adsorbed on the film) could therefore be introduced, the only limiting factor being that the pressure of the inactive hydrogen should not exceed 8cm when enclosed in the counter section.
The experimental method described in detail in the next section was therefore developed, and was subsequently used in all the exchange reactions.
6.2 The experimental -procedure.Exchange reactions were studied on three different types
of nickel films:a) those deposited in the presence of tritiated hydrogen
at 77°K,b) those deposited in the presence of tritiated hydrogen
at 0°C, andc) those deposited in vacuum at 77°K with subsequent
adsorption of tritiated hydrogen on them.All films were deposited by induction evaporation on catalyst vessels of design C (fig. 20).
The experimental procedure followed during exchange was
-152-the same in all three cases. When the film had been deposited under the appropriate conditions, and the amount of tritiated hydrogen of suitable activity which was required to saturate it had been measured, the entire adsorption apparatus, except the catalyst vessel and Pirani gauge sections, was pumped down to sticking vacuum by the main diffusion and rotary pumps. The counter section was filled to a pressure of 2cm with alcohol vapour, and the excess quenching agent in the manometer section was pumped away. 14*2cm of inactive hydrogen, purified by passage through the palladium leak, were measured out in the manometer section. This hydrogen sample was allowed to expand into the catalyst vessel via the small calibrated section, where the mercury in McLeod gauge G2 had been raised to reduce the dead-space. The pressure exerted by the hydrogen after expansion was usually about 0*5cm. The inactive hydrogen was left in contact with the nickel film for 10 minutes to allow exchange to occur between it and the adsorbed tritiated hydrogen. The gas phase hydrogen was then pumped back into the small calibrated and manometer sections until the Pirani gauge indicated that a negligible gas pressure remained in the catalyst vessel section. Tap T9 (fig. 4) was opened, and the ethyl alcohol and recovered hydrogen samples were thoroughly mixed together by circulating them six times round the counter, manometer and small calibrated sections, using Tttpler pump PI. The
-153-mixture was then transferred to the counter (section 5.5) by further strokes of the Tttpler pump until McLeod gauge G2 recorded a negligible pressure in the calibrated section.
After a ten minute warming-up period to ensure stable operation of the counter (section 5.5), a rough plateau determination was usually made to establish that the optimum operating voltage had not altered from 1450 volts, then the activity of the exchange sample was measured, counting being continued until over 10,000 counts had been recorded to reduce the statistical error to less than 1%. To check the reproducibility of the count rate, a second count was taken immediately after the first. If the difference between the two estimates was more than 1%, further counts were taken until concordant results were obtained.
The entire apparatus, except the catalyst vessel and Pirani gauge sections, was then evacuated, and the whole process was repeated. This procedure was continued until the activity of the last exchange sample was very close to the background count rate. This indicated that the last hydrogen sample contained no tritium, and hence that all the originally adsorbed tritiated hydrogen which could exchange with gas phase inactive hydrogen had done so.
The results which were obtained by this method on the three different types of nickel films are given in the sections following.
-154-6.3 Exchange results on films deposited in the presence of
tritiated hydrogen at 77°K.This particular experiment was carried out twice, to
yield the results detailed in tables 16 and 17.
6.4 Exchange results on a film deposited in the presence of tritiated hydrogen at 0°C.Only one such experiment was carried out, the results
of which are given in table 18.
6.5 Exchange results on a film deposited in vacuum at 77°K with subsequent adsorption of tritiated hydrogen on it. Again, one experiment was carried out under these
conditions, and the results it yielded are laid out in table 19.
6.6 The isotope effect.Because of the experimental technique of estimating the
amount of tritiated hydrogen originally adsorbed by pressure and volume measurements on a McLeod gauge and the amount which exchanged by activity measurements on a Geiger counter,these exchange results are only valid if no isotope effect operates in the adsorption of tritiated hydrogen on nickel.In actual fact, Cranstoun and Thomson (62) have shown that
the distribution of tritium between the gas and the surface
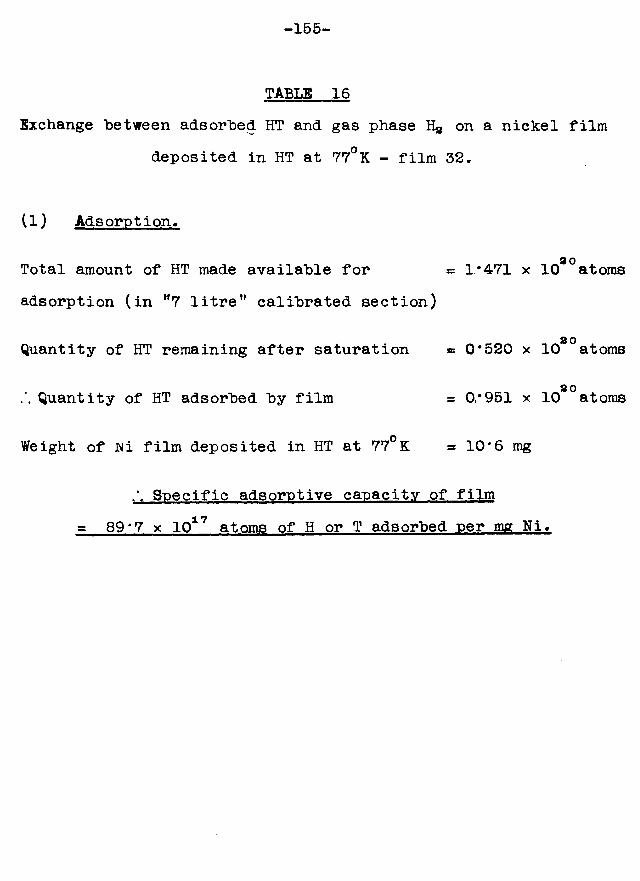
-155-
TABLE 16Exchange between adsorbed HT and gas phase Ha on a nickel film
deposited in HT at 77°K - film 32.
(1) Adsorption.
Total amount of HT made available for = 1*471 x 10*°atomsadsorption (in "7 litre” calibrated section)
2 0Quantity of HT remaining after saturation = 0*520 x 10 atoms
Quantity of HT adsorbed by film = 0/951 x 108°atoms
Weight of JNi film deposited in HT at 77°K * 10*6 mg
/. Specific adsorptive capacity of film = 89*7 x 1017 atoms of H or T adsorbed per mg Ni.
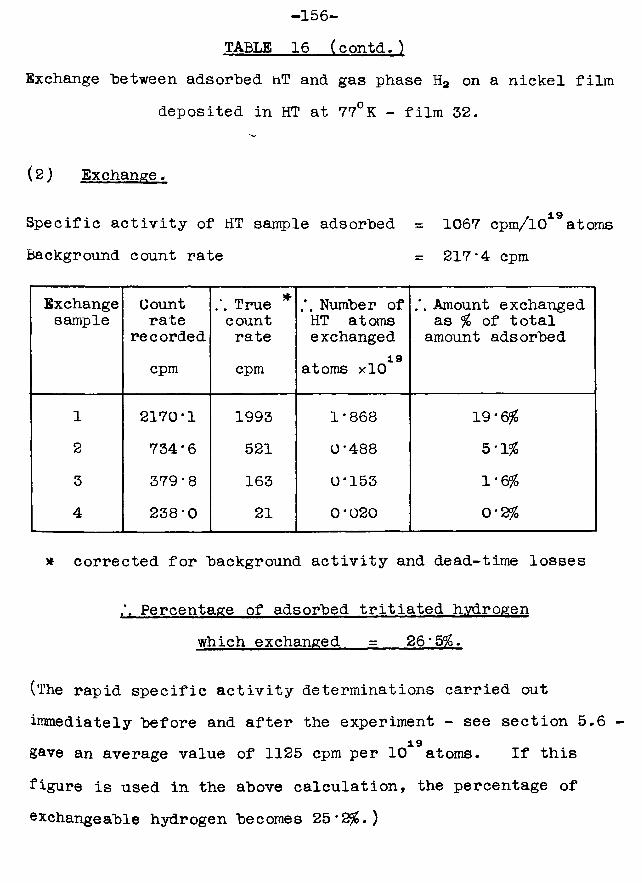
-156- TABLE 16 (contd.)
Exchange "between adsorbed HT and gas phase H2 on a nickel film deposited in HT at 77°K - film 32.
(2) Exchange.
Specific activity of HT sample adsorbed = 1067 cpm/1019atomsBackground count rate = 217*4 cpm
Exchangesample
Countrate
recordedTrue * count rate
Number of HT atoms exchanged
Amount exchanged as % of total amount adsorbed
cpm cpm 19atoms xlO
1 2170*1 1993 1*868 19*6%2 734*6 521 0*488 5*1%3 379*8 163 0*153 1*6%4 238*0 21 0*020 0*2%
* corrected for background activity and dead-time losses
Percentage of adsorbed tritiated hydrogen which exchanged = 26*5%.
(The rapid specific activity determinations carried out immediately before and after the experiment - see section 5.6 -
19gave an average value of 1125 cpm per 10 atoms. If this figure is used in the above calculation, the percentage of exchangeable hydrogen becomes 25*2%.)
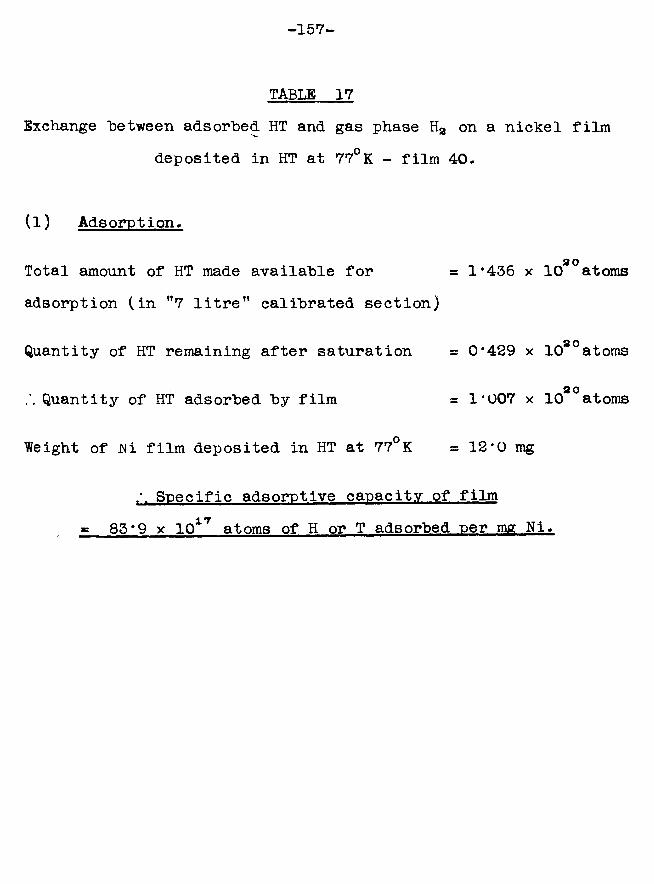
-157-
TABLE 17Exchange Between adsorbed HT and gas phase Ha on a nickel film
deposited in HT at 77°K - film 40.
(1) Adsorption-
Total amount of HT made available for = 1*436 x 108°atomsadsorption (in ”7 litre” calibrated section)
Quantity of HT remaining after saturation = 0*429 x 1080atoms
Quantity of HT adsorbed by film = 1*007 x 108°atoms
Weight of iNi film deposited in HT at 77°K = 12*0 mg
Specific adsorptive capacity of film g 83*9 x IQ17 atoms of H or T adsorbed per mg Ni.
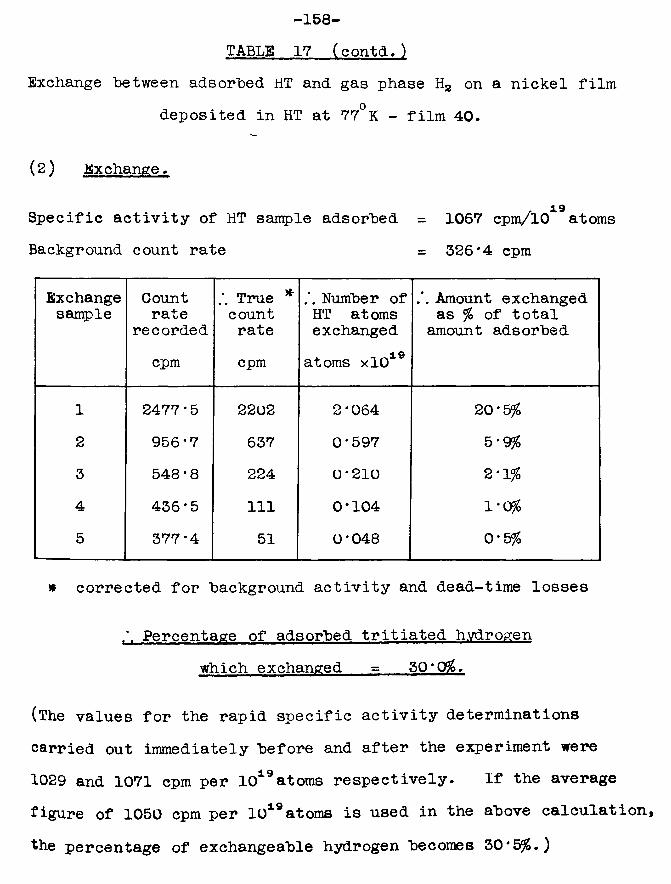
-158- TABLE 17 (contd.)
Exchange "between adsorbed HT and gas phase H2 on a nickel film deposited in HT at 77°K - film 40*
(2) Exchange -
19Specific activity of HT sample adsorbed = 1067 cpm/10 atomsBackground count rate = 326*4 cpm
Exchangesample
Countrate
recordedTrue * count rate
Number of HT at oms exchanged
/. Amount exchanged as % of total
amount adsorbedcpm cpm atoms xlO
1 2477 * 5 2202 2*064 20*5%2 956*7 637 0*597 5*9%3 548*8 224 0*210 2*1%4 436*5 111 0*104 1*0%5 377*4 51 0*048 0*5%
* corrected for "background activity and dead-time losses
/. Percentage of adsorbed tritiated hydrogen which exchanged = 50*0%.
(The values for the rapid specific activity determinations carried out immediately before and after the experiment were 1029 and 1071 cpm per 1019atoms respectively* If the average figure of 1050 cpm per 1019atoms is used in the above calculation,
the percentage of exchangeable hydrogen becomes 30*5%.)
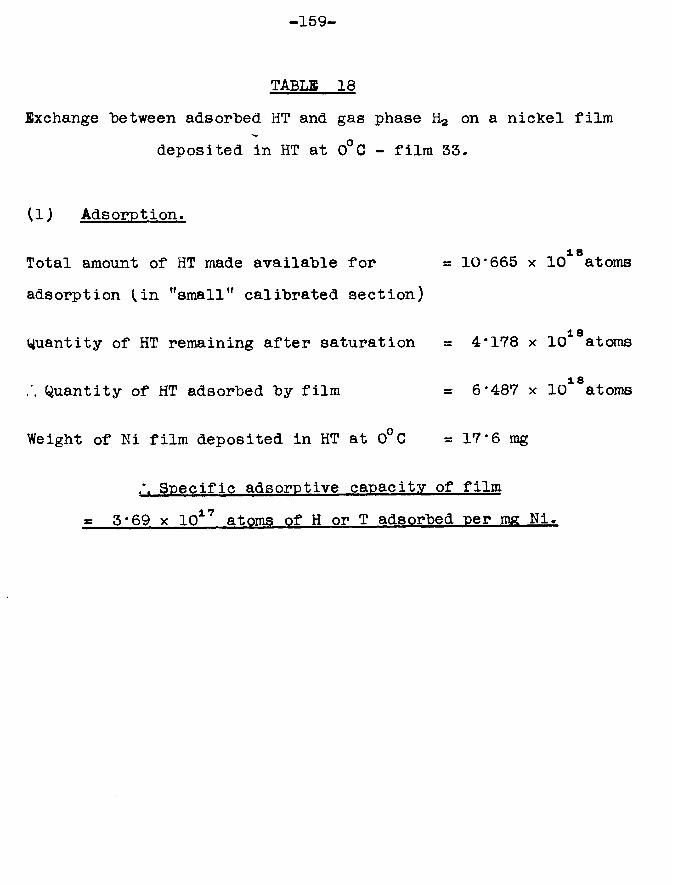
-159-
TABLB 18Exchange "between adsorbed HT and gas phase H2 on a nickel film
deposited in HT at 0°C - film 33.
(1) Adsorption.
18Total amount of HT made available for = 10*665 x 10 atomsadsorption {in "small” calibrated section)
1 8Quantity of HT remaining after saturation = 4*178 x 10 atoms
18Quantity of HT adsorbed by film = 6*487 x 10 atoms
Weight of Ni film deposited in HT at 0°C = 17*6 mg
/. Specific adsorptive capacity of film g 3*69 x 1017 atoms of H or T adsorbed per mg Ni.
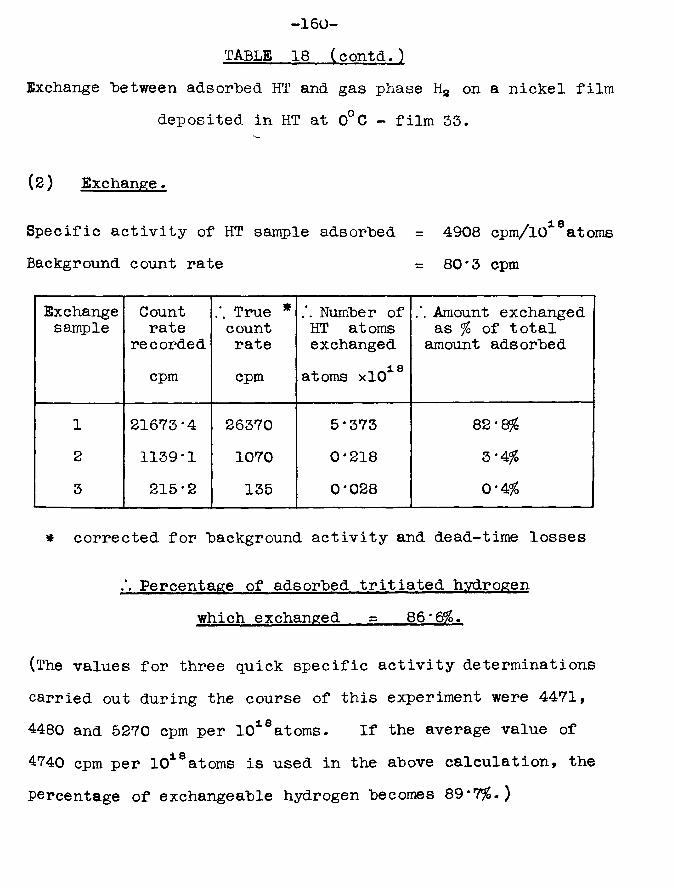
- 160-
TABLE 18 (contd.)Exchange "between adsorbed HT and gas phase Ha on a nickel film
deposited in HT at 0°C - film 35.
(2) Exchange.
dL 8Specific activity of HT sample adsorbed = 4908 cpm/10 atoms Background count rate = 80*3 cpm
Exchangesample
Countrate
recordedTrue * count rate
Number of HT atoms exchanged
Amount exchanged as % of total
amount adsorbedcpm cpm atoms xlO18
1 21673*4 26370 5*373 82*8%2 1139*1 1070 0*218 3*4%3 215*2 135 0*028 0*4%
* corrected for background activity and dead-time losses
Percentage of adsorbed tritiated hydrogen which exchanged = 86*6%.
(The values for three quick specific activity determinations carried out during the course of this experiment were 4471, 4480 and 5270 cpm per 1018atoms. If the average value of 4740 cpm per 1018atoms is used in the above calculation, the percentage of exchangeable hydrogen becomes 89*7%. )
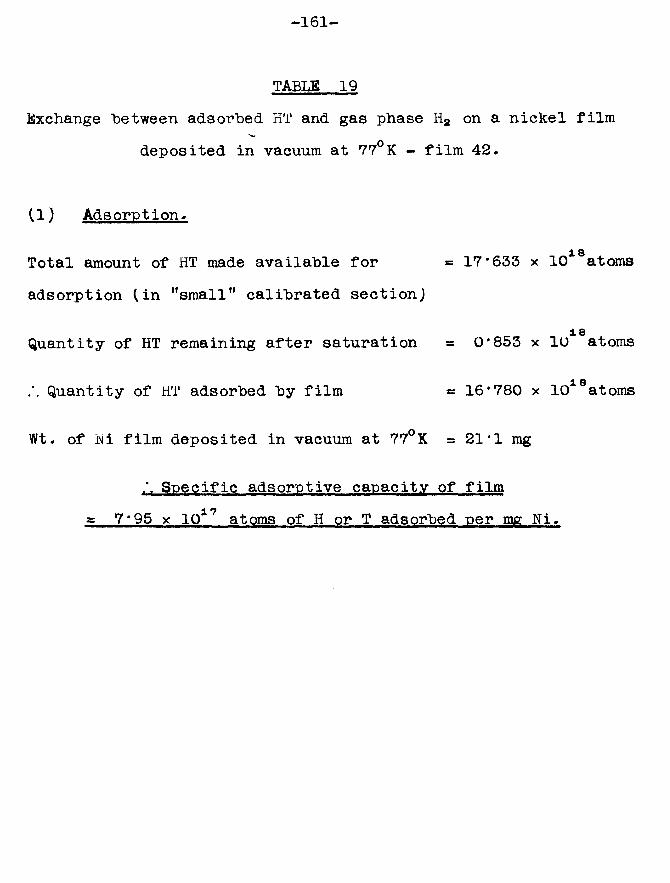
-161-
TABLE 19Exchange "between adsorbed HT and gas phase Ha on a nickel film
deposited in vacuum at 77°K - film 42.
(1) Adsorption.
Total amount of HT made available for = 17*633 x 10i8atomsadsorption "small” calibrated section,)
18Quantity of HT remaining after saturation = 0*853 x 10 atoms
Quantity of HT adsorbed by film = 16*780 x 1018atoms
Wt. of i\ii film deposited in vacuum at 77°K = 21*1 mg
Specific adsorptive capacity of film g 7*95 x 1017 atoms of H or T adsorbed per mg Ni.
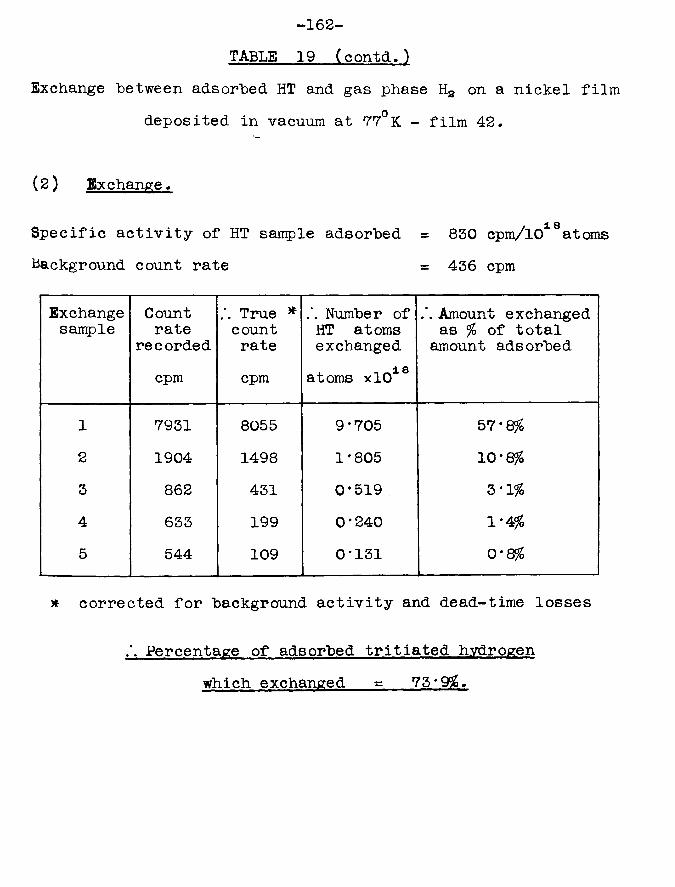
-162- TABLE 19 (contd.)
Exchange Between adsorbed HT and gas phase H2 on a nickel film deposited in vacuum at 77°K - film 42.
(2) Exchange.
1> 8Specific activity of HT sample adsorbed = 830 cpm/10 atoms Background count rate = 436 cpm
Exchangesample
Countrate
recordedTrue * count rate
Number of HT atoms exchanged
Amount exchanged as $ of total amount adsorbed
cpm cpm atoms xlO18
1 7931 8055 9*705 57*8$2 1904 1498 1-805 10*8$3 862 431 0-519 3*1$4 633 199 0*240 1*4$5 544 109 0*131 0'8$
* corrected for background activity and dead-time losses
Percentage of adsorbed tritiated h.vdrogen which exchanged = 75*9%.
-163-is not uniform, and that tritium is preferentially adsorbed according to the relationship at equilibrium
T gasH ads “ H gas
leading to a reduction in the specific activity of the gas phase tritiated hydrogen, and an increase in the specific activity of the adsorbed tritiated hydrogen.
In all cases where an isotope effect is operative, its magnitude depends on the extent to which the reaction is allowed to go to completion. In the experiments described in this chapter, the magnitude of the effect would therefore depend on the quantity of tritiated hydrogen remaining unadsorbed when film deposition was stopped. As this varied for all four films, four separate calculations were necessary to estimate in each case what the actual specific activity of the adsorbed tritiated hydrogen would have been at equilibrium.
Film 3280Quantity of tritiated hydrogen adsorbed = 0*951 x 10 atoms80Quantity of HT remaining in gas phase = 0*520 x 10 atoms
t'i . T ads T gasBut ■rv2 = 1*17 x tj g---H ads H gasThe activity of the tritiated hydrogen was such that only onein approximately 1010atoms could have been a tritium atom,so no error is introduced by assuming that the number of
-164-H atoms was the same as the total number of atoms.
• T T gas' ' 0-951 x 10*° 1 17 x 0 .52o x 10“u
*-d'S~ = 1-17 x = 2-140T gas 0*520
T cas — ^ ads.. 1 gas - 2.140
The total amount of tritium originally admitted would produce1 *471 * l o80 a count rate of 1067 x ----— ■ ■— cpm.
T ads + T gas *= 1067 x 14*71 cpm
T ads x |l + 2 ^ 1 4 0] * 1067 x 14*71 cPm
1*468 x T ads *= 1067 x 14*71 cpm• « 1067 x 14*71 __. . T ads = 1' *4~68 ^ = 10690 cpm
The amount of tritium adsorbed would give rise to a count rate of 10690 cpm.But total amount of HT adsorbed = 0*951 x 10*°atoms
Specific activity of adsorbed gas at equilibrium
= cpm/1019atoms
1124 cpm/10*9 atcniEIf this value for the specific activity is used to calculatethe percentage of adsorbed gas which exchanged on film 32,the result becomes 25*2$.
-165-Film 40
Using the figures given in table 17, a calculation similar to the one presented in detail above showed that the specific activity of the adsorbed tritiated hydrogen at equilibrium would have been 1115 cpm/1019 atoms on this film.If this value is used to calculate the percentage of adsorbed gas which exchanged, the result becomes 28*7$.
Film 53The specific activity of the adsorbed tritiated hydrogen
at equilibrium in this case would have been 5303 cpm/1018atoms, and the percentage exchange 80*2$.
Film 42In this case, the specific activity of the adsorbed gas
1. 8at equilibrium would have been 837 cpm/10 atoms, and the percentage exchange based on this value 73*3$.
The values calculated in this section for the specific activities of the samples of adsorbed tritiated hydrogen show the maximum possible variations which could occur as a result of the isotope effect. Even assuming the isotope effect to achieve equilibrium, the calculated values for the specific activities do not differ from the estimations recorded in chapter 5 by much more than the individual estimations differed from the average. In practice, the isotope effect would
-166-neve r reach equilibrium for the following reasons:a) The calculations were based on the assumption that all
of the gas phase tritiated hydrogen remaining unadsorbed would have the opportunity to equilibrate with the adsorbed tritiated hydrogen. In fact, this would never be the case; purely for reasons of accessibility, only the gas phase hydrogen which entered the catalyst vessel itself would have this opportunity. This point is particularly important with regard to films 32 and 40 where the hydrogen occupied the ”7 litre" calibrated section as well as the catalyst vessel and Pirani gauge sections; the vast majority of gas phase hydrogen remaining unadsorbed was therefore never near the catalyst vessel, and consequently never had the opportunity to equilibrate with the adsorbed hydrogen.
b) The calculations also assumed that sufficient time was allowed for equilibrium to be set up between the adsorbed and gas phase isotopes. In actual fact, this may not have been the case, particularly at low temperatures (films 32, 40 and 42), because, shortly after it was observed that the nickel film was saturated, the hydrogen remaining in the gas phase in the catalyst vessel was transferred to the calibrated section for measurement.These two considerations indicate that the true values
for the specific activities of the samples of adsorbed tritiated
-167-hydrogen are probably* closer to the determinations recorded in chapter 5 than those given in this section. No appreciable error is therefore introduced by ignoring the isotope effect in the adsorption process. In the actual exchange process, the isotope effect need not be considered at all, because the exchange reaction was always allowed to go to completion - that is, all the adsorbed gas which could exchange was permitted to do so.
6.7 Discussion.On those nickel films which were prepared under conditions
such that the uptake of hydrogen was limited, eithera) by depositing the film in vacuum at 77°K and then admitting
hydrogen, orb) by depositing the film in hydrogen at 0°C,a large percentage of the adsorbed gas was found to be exchangeable. In neither case, however, did 100$ exchange occur, and a possible reason is that some of the hydrogen originally adsorbed on the nickel was bound so strongly to the metal that it could not be released to take part in the exchange process. Similar effects have been observed by other workers. For example, Thomson and Wishlade (63) found that when ethylene was preadsorbed on a vacuum deposited nickel film only a fraction of it took part in a hydrogenation
reaction, the rest remaining firmly held on the surface. The
-168-phenomenon has been attributed to heterogeneity of the nickel surface.
In the case of films which showed enhanced adsorption of hydrogen because they had been deposited at 77°K in the presence of the adsorbate, the exchange behaviour was quite different. Although the total amount of hydrogen originally adsorbed was much greater than in the case of the other types of films, the proportion which was exchangeable was much less. This suggests that the hydrogen which was adsorbed during the deposition was largely trapped within the structure of the film in such a way that it was inaccessible to the gas phase inactive hydrogen introduced for exchange. The two estimates for the percentage of adsorbed tritiated hydrogen which did exchange from this type of film were 26*5$ and 30*0$, giving an average value of 28*25$. It has been shown (chapter 3) that the best estimate for the hydrogen : nickel atomic adsorption ratio is 0*83. Of this, therefore, 28*25$ or 0*23 of the hydrogen is exchangeable, the remaining 0*60 forming a non-exchangeable fraction. A possible explanation as to why the hydrogen should behave in this way is given in chapter 9.
-169- ‘ C H A P T E R 7
ADSORPTION AND EXCHANGE EXPERIMENTSON EVAPORATED PALLADIUM FILMS.
It was decided to perform, on palladium films, adsorption and exchange experiments similar to those already carried out on nickel films to observe any differences caused by changing the metal. It was hoped that it might be possible to draw correlations between the behaviour of the two metals which would throw some light on the manner in which the adsorbed hydrogen was bound to the metal. Palladium was chosen because of its peculiar ability to take up hydrogen in larger quantities than are adsorbed by any other transition metal, and because of the extensive studies of this phenomenon which have been made.
7.1 The experimental method.The only types of palladium films studied were those
deposited in the presence of hydrogen at 77°K. All films were formed by the induction evaporation of a filament of spectroscopically pure 0*02in diameter palladium wire supplied by Johnson Matthey & Co. Ltd. All catalyst vessels were constructed to the design illustrated in fig. 20. The hydrogen samples were measured out in the "7 litre" calibrated section, so that evaporation of the palladium filament was
continuous in all the experiments, and there was plenty of
-170-hydrogen available for adsorption throughout the entire deposition.
The actual experimental procedure during the adsorption and exchange was exactly as has already been described for nickel in sections 3.5 and 6.2 respectively.
7.2 Estimation of the weight of the palladium film.Many methods have been reported in the literature for
the colorimetric estimation of palladium (64), the main difference among them being in the concentration range over which Beer’s Law is obeyed. The method finally selected as being most suitable for the present work employed p-nitroso- dimethylaniline as the complexing reagent (65).
The following stock solutions were prepared:(1) p-nitrosodimethylaniline solution (25mg p-NO-diMe-aniline
dissolved in 50ml of 95$ ethanol and diluted to 1 litre with distilled water)
(2) buffer solution, pH 4*8 (80ml of 1:11 concentrated HC1 added to 200ml of 8$ anhydrous sodium acetate solution, diluted to 1 litre with distilled water)The palladium film to be estimated was dissolved in 10ml
aqua regia, and the solution was boiled. A 10ml portion of concentrated nitric acid was added, and the solution evaporated to remove the chlorine. This was repeated for a further 10ml sample of concentrated nitric acid, then 20ml
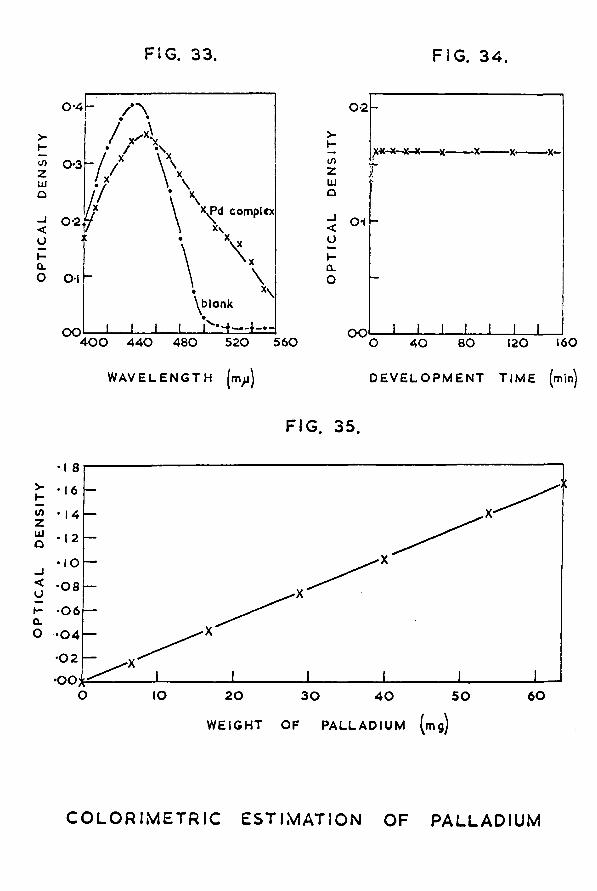
OPTI
CAL
DENS
ITY
OPTI
CAL
DENSITY
FIG. 33. FIG. 34 .
0-4k /">I / '•
/ x̂ X\7 // X
0-3
0-2
CM
O O
if \x^d complex X\
\^blonk
4 0 0 4 4 0 480 520 560
W A V E L E N G T H (m^)
0*2>-h- x-x-x—X-X-----x- X -1nzHIQJ 0-1oI-CLo
0 080 1204 0
D E V E L O P M E N T T I M E (min)
FIG. 35.
0 8
0 6
0 4
IO 20 6 03 0 4 0 5 0
W EIGHT OF PALLADIUM (ms)
C O L O R IM E T R IC EST IM A TIO N OF PALLADIUM
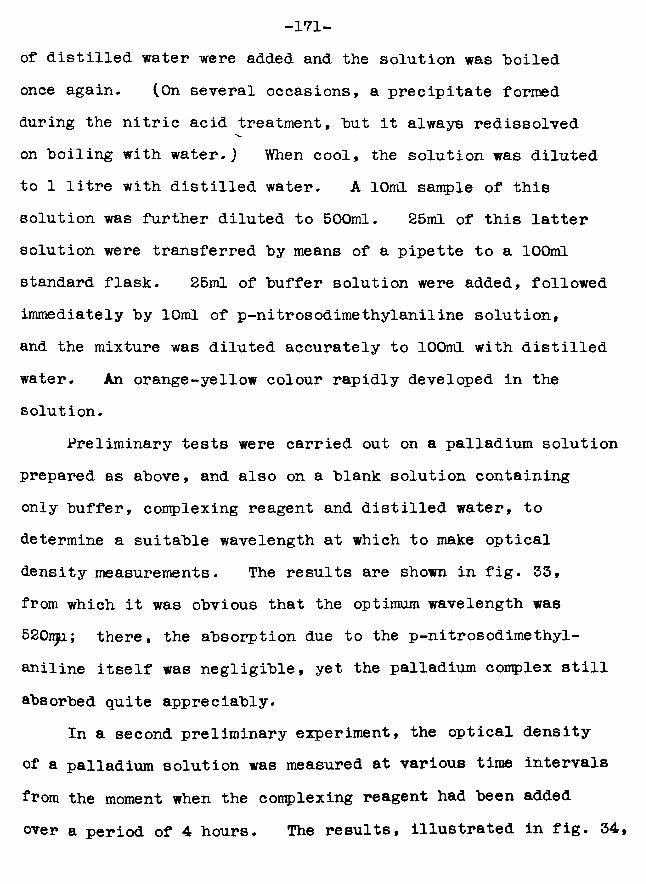
-171-of distilled water were added and the solution was boiled once again- (On several occasions, a precipitate formed during the nitric acid treatment, "but it always redissolved on "boiling with water.) When cool, the solution was diluted to 1 litre with distilled water. A 10ml sample of this solution was further diluted to 500ml. 25ml of this latter solution were transferred by means of a pipette to a 100ml standard flask. 25ml of buffer solution were added, followed immediately by 10ml of p-nitrosodimethylaniline solution, and the mixture was diluted accurately to 100ml with distilled water. An orange-yellow colour rapidly developed in the solution.
Preliminary tests were carried out on a palladium solution prepared as above, and also on a blank solution containing only buffer, complexing reagent and distilled water, to determine a suitable wavelength at which to make optical density measurements. The results are shown in fig. 33, from which it was obvious that the optimum wavelength was 520nju; there, the absorption due to the p-nitrosodimethylaniline itself was negligible, yet the palladium complex still absorbed quite appreciably.
In a second preliminary e2T>eriment, the optical density of a palladium solution was measured at various time intervals from the moment when the complexing reagent had been added over a period of 4 hours. The results, illustrated in fig. 34,
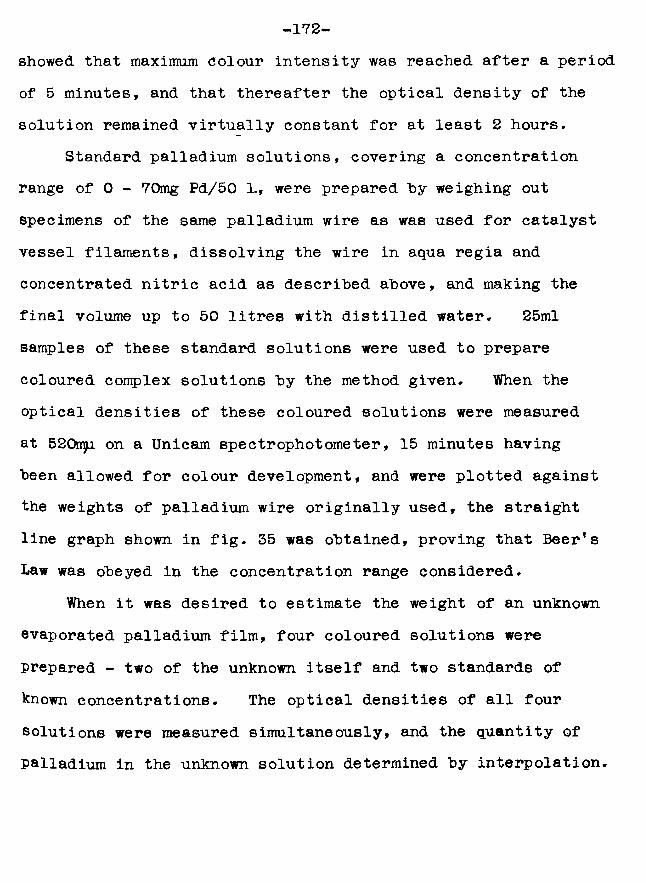
-172-showed that maximum Colour intensity was reached after a period of 5 minutes, and that thereafter the optical density of the solution remained virtually constant for at least 2 hours.
Standard palladium solutions, covering a concentration range of 0 - 70mg Pd/50 L, were prepared by weighing out specimens of the same palladium wire as was used for catalyst vessel filaments, dissolving the wire in aqua regia and concentrated nitric acid as described above, and making the final volume up to 50 litres with distilled water. 25ml samples of these standard solutions were used to prepare coloured complex solutions by the method given. When the optical densities of these coloured solutions were measured at 5201190. on a Unicam spectrophotometer, 15 minutes having been allowed for colour development, and were plotted against the weights of palladium wire originally used, the straight line graph shown in fig. 35 was obtained, proving that Beer’s Law was obeyed in the concentration range considered.
When it was desired to estimate the weight of an unknown evaporated palladium film, four coloured solutions were prepared - two of the unknown itself and two standards of known concentrations. The optical densities of all four solutions were measured simultaneously, and the quantity of palladium in the unknown solution determined by interpolation.
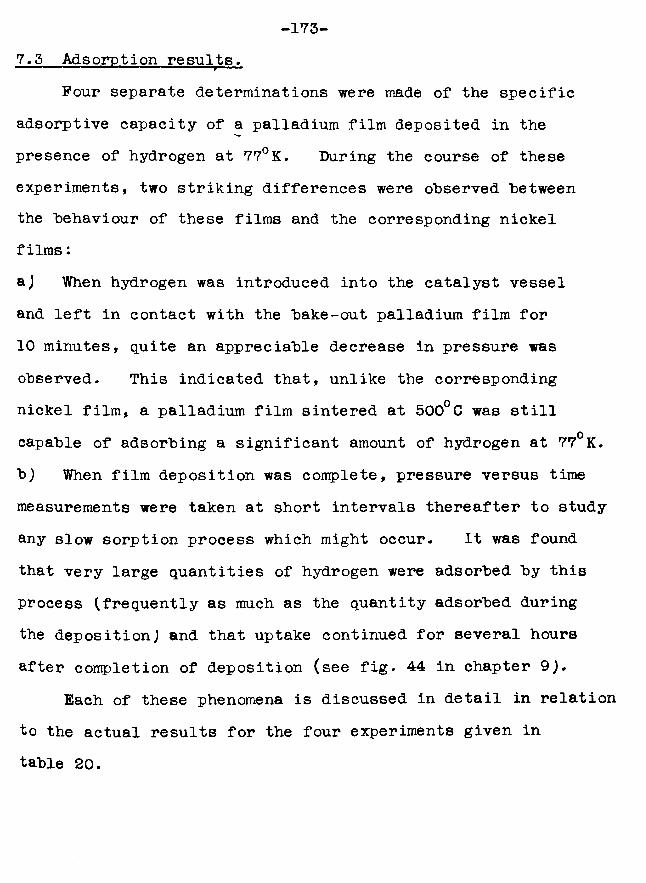
-173-7.5 Adsorption results.
Pour separate determinations were made of the specific adsorptive capacity of a palladium film deposited in the presence of hydrogen at 77°K. During the course of these experiments, two striking differences were observed between the behaviour of these films and the corresponding nickel films:a) When hydrogen was introduced into the catalyst vessel and left in contact with the bake-out palladium film for 10 minutes, quite an appreciable decrease in pressure was observed. This indicated that, unlike the corresponding nickel film, a palladium film sintered at 500°C was still capable of adsorbing a significant amount of hydrogen at 77°K.b) When film deposition was complete, pressure versus time measurements were taken at short intervals thereafter to study any slow sorption process which might occur. It was found that very large quantities of hydrogen were adsorbed by this process (frequently as much as the quantity adsorbed during the deposition) and that uptake continued for several hours after completion of deposition (see fig. 44 in chapter 9).
Each of these phenomena is discussed in detail in relation to the actual results for the four experiments given in table 20.
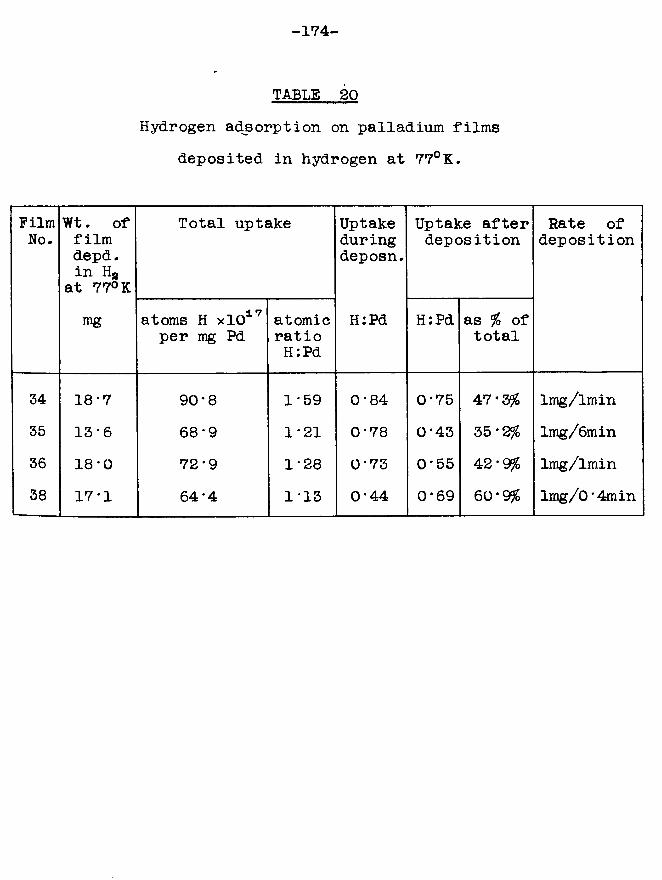
-174-
TABLE 20Hydrogen adsorption on palladium films
deposited in hydrogen at 77°K.
FilmNo.
Wt. of film depd. in Ha
at 77°K
Total uptake Uptakeduringdeposn.
Uptake after deposition
Rate of deposition
mg atoms H xlO17 per mg Pd
atomicratioH:Pd
H:Pd H:Pd as % of total
34 18*7 90*8 1*59 0*84 0*75 47 * 3% lmg/lmin35 13*6 68*9 1*21 0*78 0*43 35*2% Img/ 6min36 18*0 72*9 1*28 0*73 0*55 42*9% lmg/lmin38 17*1 64*4 1*13 0*44 0*69 60*9% lmg/0*4min
-175-a) Adsorption on the hake-out film.
In the first three experiments (numbers 34, 35 and 36) it was assumed that the hake-out film would he saturated with hydrogen after it had heen exposed to the gas for 10 minutes, it was thought that after this preliminary treatment, no further uptake of hydrogen hy the hake-out film would occur to interfere with the adsorption taking place on the film being deposited in hydrogen at 77°K. However, on observing the lengthy slow sorption process which occurred on the films deposited in hydrogen at 77°K, it was realised that the above assumption might not he entirely valid.
Consequently, a detailed study was made of the adsorptive properties of the hake-out film formed during the course of experiment 38. After the hake-out film had heen cooled to 77°K, a sample of hydrogen, measured out in the original small calibrated section and therefore containing approximately 3 x I018atoms, was allowed to expand into the catalyst vessel. The Pirani gauge showed that it was adsorbed almost instantaneously hy the hake-out film. Further samples were introduced, and these too were adsorbed, hut the length of time taken for adsorption gradually increased in a regular fashion. For example, the 11th sample took 20 minutes to he adsorbed. On introduction of a 12th sample, the light beam associated with the Pirani gauge did not move from its position at the high pressure end of the scale over a period of one hour; this
-176-was taken as an indication that saturation of the hake-out
ifilm had finally heen achieved. Calculation showed that the total quantity of hydrogen adsorbed at 77°K on the hake-out film was 3*570 x 1019atoms. Analysis of the hake-out film after the experiment showed that it weighed 13*8mg; this gave a value for the specific adsorptive capacity at 77°K of a palladium film sintered at 500°C of 2*59 x 10i8atoms of hydrogen adsorbed per mg of palladium, which is equivalent to an atomic adsorption ratio H:Pd of 0*46.
It was found that when the liquid nitrogen was removed from around the catalyst vessel, and the hake-out film was allowed to warm up to room temperature, all the hydrogen which had heen adsorbed at the low temperature was desorbed. This phenomenon could not have heen connected with sintering of the hake-out film, which had already heen heated to 500°C during deposition. The process was found to he entirely reversible; all the hydrogen was readsorhed when the film was cooled hack down to liquid nitrogen temperature. Desorption and readsorption could he continued indefinitely simply hy altering the film temperature.
These observations showed that in the first three experiments (films 34, 35 and 36) a sufficient length of time had not heen allowed for complete saturation of the hake-out film with hydrogen at 77°K. Consequently, when deposition of the film proper was commenced in the presence of hydrogen at liquid
-177-nitrogen temperature, it is probable that some of the observed uptake of hydrogen actually occurred on the bake-out film.As the average palladium bake-out film was much heavier than the corresponding nickel film (Pd = 5-15mg; Ni = 0-3mg), this effect could have been quite considerable. It would have led to an apparent uptake on the hydrogen deposited 77°K film greater than actually occurred, and hence affords an explanation of why the specific adsorptive capacities of films 34, 35 and 36 appear to be greater than that of film 38. The result for film 38 is therefore the most reliable; it was the only experiment in which it was absolutely certain that the bake- out film was saturated with hydrogen before deposition of the film proper was commenced.
b) Study of the sorption -process after completion of filmdeposition.It can be seen by reference to table 20 that vast quantities
of hydrogen were taken up by the palladium films after deposition bad ceased. This occurred even although ample opportunity was given for access of the hydrogen to the palladium while the film was being deposited at 77°K (appendix B). It points to some slow incorporation process for which access of hydrogen is not rate determining. Table 20 shows that the percentage of the total adsorption occurring after deposition bears a definite relation to the rate at which the film was formed, a fast rate of film formation being associated with a large
-178-percentage uptake after deposition. This suggests that the slow incorporation plrocess occurs during deposition as well as after it, and consequently when deposition is carried out over a long period of time not so much uptake is observed afterwards.
Tests for physical adsorption, similar to those already described in section 3.10 for nickel, were carried out on all four palladium films. In no case was there any evidence for desorption of hydrogen from the palladium when the gas phase pressure above the film was reduced.
Although a great deal of work has been published in the literature on the solution of hydrogen in palladium, none of the systems studied was comparable to the one described above. Most of the work was carried out on finely divided samples of palladium powder at gas phase hydrogen pressures varying between 0 and 76cm Hg pressure and at temperatures ranging from 70°K to 650°K. All reports state that hydrogen dissolves in palladium to yield two solid solutions - a palladium-rich or ©(-phase, and a hydrogen-rich or /3-phase*, both phases have the same face-centred cubic structure as pure palladium, but when the /3-phase is formed, expansion of the lattice occurs (66). By altering the pressure and temperature of the system, it is possible to prepare palladium hydride containing widely variable concentrations of hydrogen; this uptake is entirely reversible, but marked hysteresis occurs depending on whether
-179-the equilibrium concentration of hydrogen in palladium at a given temperature and pressure is approached from the high pressure or low pressure side (67). The maximum hydrogen content reported was H:Pd = 2, and this was achieved at a temperature of 77°K (68).
A considerable amount of controversy exists in the literature as to the nature of the bonding in these palladium hydrides. Ubbelohde (69) and Worsham, Wilkinson and Shull (70) favour the solution of the hydrogen as atoms, a portion of which is ionised to yield electrons and protons. The gas atoms occupy the octahedral positions in the face-centred cubic lattice. Nace and Aston (71) envisage the existence of covalently bound PdH4 molecules at low temperatures; as the temperature is raised, dissociation occurs to yield interstitial hydrogen atoms vibrating and rotating relative to the palladium lattice, and diffusing by changing the palladium atom which they have as their centre of rotation. This is in contrast to the free proton model of Lacher (72) who postulates that the hydrogen is in the form of positive ions assembled in regular monolayers.
Although these systems showed the same sort of upper limit for hydrogen uptake as did the hydrogen deposited palladium films described in this chapter, this was really their only point in common. Irreversible hydrogen uptake at very low gas pressures (less than lO^torr) on an uncontaminated film
-180-is hardly comparable to reversible solution at high hydrogen
»pressures on palladium powders.Work reported in the literature on the adsorption of
hydrogen on palladium films, however, is somewhat limited.In common with our observations, all authors agree that afast chemisorption process is followed by a slow uptake whichcontinues for several hours (36). Stephens (73), workingwith palladium films deposited in vacuum at 0°C, found evidence
o -2for three kinds of sorbed hydrogen at 0 C and 10 torr pressure;a) firmly held hydrogen (8*4 x 1016atoms H per mg Pd)
which could not be removed by pumping,b) loosely held hydrogen (6*0 x 1016atoms H per mg Pd)
which could easily be removed by pumping or by raisingthe temperature of the film, and
c) interstitial hydrogen (0*4 x 1016atoms H per mg Pd)sorption of which was also pressure and temperaturedependent,
giving a total sorption of 1*48 x 1017atoms of hydrogen per mg of palladium, or 0*026 hydrogen atom adsorbed per palladium atom.
Matsuda and Nakata (74), working with a palladium film deposited in vacuum by induction evaporation and sintered at 400 observed a saturation uptake at 77° K of 2*3 x 10 atoms of hydrogen adsorbed per mg of palladium, which corresponds to 0*04 hydrogen atom adsorbed per palladium atom.
-181-These two results show very much smaller hydrogen uptakes
than was observed on the hydrogen deposited palladium films described in this thesis. It therefore appears that depositing the film in the presence of hydrogen leads to an enhanced uptake comparable to that achieved previously only when the gas phase hydrogen pressure above the palladium was very much higher.
In an attempt to gain information as to the manner in which the hydrogen was bound to the metal in these hydrogen deposited films, an exchange experiment was performed, as described in the next section.
7.4 Exchange results.Only one reliable experiment was performed to determine
the percentage of adsorbed tritiated hydrogen which could exchange with gas phase inactive hydrogen on a palladium film deposited in hydrogen at 77°K. The results which the experiment yielded are given in table 21, and they show another striking difference between the behaviour of palladium and nickel films. With nickel films, the quantity of adsorbed tritiated hydrogen which exchanged with gas phase inactive hydrogen decreased in a definite manner with successive exchange samples. With palladium films, no such trend was followed; by far the most exchange occurred with the first inactive sample introduced, but thereafter the amount of
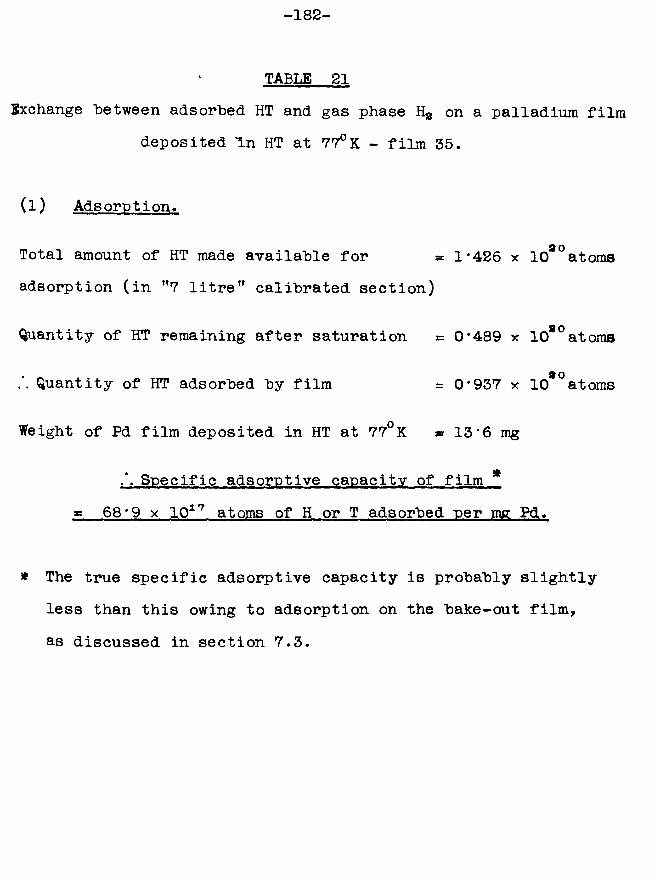
-182-
TABLE 21Exchange between adsorbed HT and gas phase Ha on a palladium film
deposited "In HT at 77°K - film 35.
(l) Adsorption.
Total amount of HT made available for s= 1*426 x 108°atomsadsorption (in "7 litre” calibrated section)
Quantity of HT remaining after saturation = 0*489 x 10*°atoms
Quantity of HT adsorbed by film = 0*937 x 10*°atoms
Weight of Pd film deposited in HT at 77°K * 13*6 mg
Specific adsorptive capacity of film *« 68*9 x 1017 atoms of H or T adsorbed per mg Pd.
* The true specific adsorptive capacity is probably slightly less than this owing to adsorption on the bake-out film, as discussed in section 7.3.
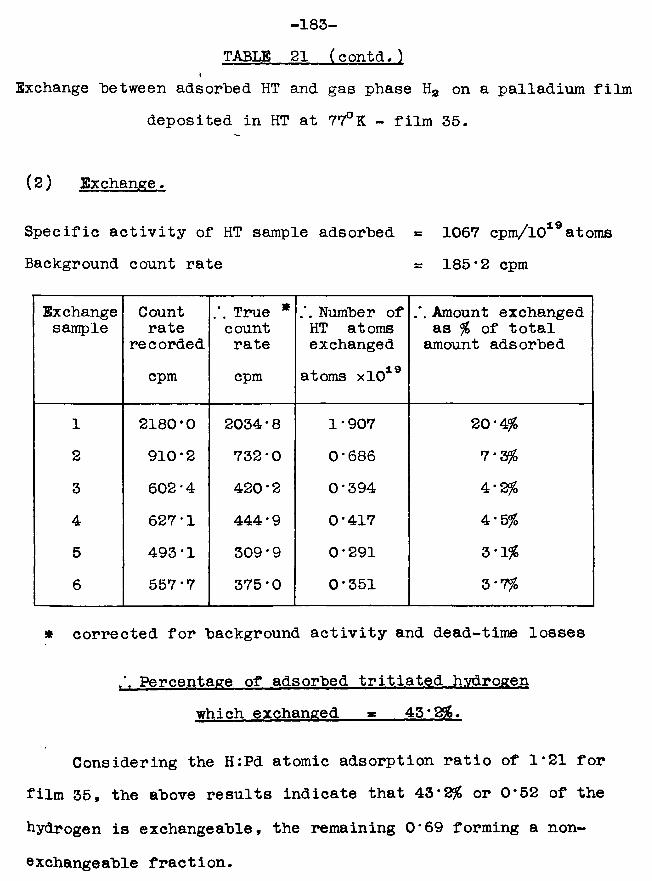
-183- TABLE 21 (contd.)
*Exchange "between adsorbed HT and gas phase H2 on a palladium film
deposited in HT at 77°K - film 35.
(2) Exchange.
Specific activity of HT sample adsorbed * 1067 cpm/lO19atomsBackground count rate = 185*2 cpm
Exchangesample
Countrate
recordedcpm
True * count ratecpm
Number of HT atoms exchangedatoms xlO19
Amount exchanged as % of total amount adsorbed
1 2180*0 2034*8 1*907 20*4%2 910*2 732*0 0*686 7*3%3 602*4 420*2 0*394 4*2%4 627*1 444*9 0*417 4*5%5 493*1 309*9 0*291 3*1%6 557*7 375*0 0*351 3*7%
* corrected for background activity and dead-time losses
Percentage of adsorbed tritiated hydrogen which exchanged « 43*296.
Considering the H:Pd atomic adsorption ratio of 1*21 for film 35, the above results indicate that 43*2# or 0*52 of the
hydrogen is exchangeable, the remaining 0*69 forming a non
exchangeable fraction.
-184-exchange with successive samples varied in a random manner. This was a genuine effect, because similar random variations were observed during exchange in another experiment, the results of which are not quoted because the specific activity of the tritiated hydrogen originally adsorbed was quite unsuitable to give accurate results. It seems reasonable to assume that the long and gradual exchange process on the palladium film could be controlled by the same factors which governed the original slow uptake of hydrogen on the film as it was being deposited.
The actual numerical value of 43*2% for the amount of exchange which occurred on film 35 is unlikely to be very accurate for two reasons:a) The experiment was stopped before exchange was complete. 3*7% exchange occurred with the last inactive sample introduced, so it is probable that if sufficient time had been available to introduce further samples, more exchange could have occurred. 43*2% is therefore a minimum value for the percentage exchange.b) In the calculations in table 21 it was assumed that all the exchange which occurred did so on the palladium film deposited in hydrogen at 77°K. This film, however, had a hake-out film associated with it on which some adsorption of tritiated hydrogen occurred, and there is no reason why exchange should not have taken place on both films. The
-185-error introduced by ignoring this factor, however, will be partially compensated for by the fact that some of the original adsorption of tritiated hydrogen attributed to the film deposited at 77°K probably occurred on the bake-out film (see section 7.3).
7.5 Summary.For the reasons given throughout the text of this chapter,
it is obvious that a large number of refinements to the experimental technique would be necessary before the adsorption and exchange results on palladium films could be put on a precise quantitative basis. However, it is true to say that, although hydrogen is adsorbed on a palladium film to a greater extent than on a nickel film (H:metal for Pd = 1*13 and for Ni = 0*83), the amount of adsorbed hydrogen which cannot exchange with gas phase hydrogen is very nearly the same in both cases (approximately 0*6). The possible significance of this fact is discussed in chapter 9.
-186- C H A P T B B 8
EFFECT OF INCREASE IN TEMPERATURE ON THE ADSORPTIVE CAPACITIES OF METAL FILMS DEPOSITED IN HYDROGEN AT 77° K.
The experiments described in this thesis have proved that nickel films deposited in the presence of hydrogen at liquid nitrogen temperature have a very much greater adsorptive capacity for hydrogen than films deposited in vacuum at any temperature, or in hydrogen at a temperature higher than 77°K. The marked enhancement in adsorption has been attributed to two factors:a) By depositing the film in hydrogen, the adsorbate had free access to the internal structure of the film, and hydrogen had the opportunity to be adsorbed on each nickel atom as it was deposited.b) At the low temperature of 77°K, the thermal movement of both the adsorbed hydrogen and the nickel was markedly reduced, and the chance of hydrogen being eliminated from the internal surfaces of the structure was consequently
lessened.As a result of this second reason, it was thought that
it would be interesting to study the way in which hydrogen was released from the state of enhanced adsorption as the temperature was allowed to rise from 77°K to room temperature.
-187-8.1 Nickel films - effect of raising the temperature from
io77 K to room temperature in one stage.Preliminary information on this question had already
been gathered from measurements made on nickel films during the course of experiments described in chapter 3. In some cases, when the adsorptive capacities of films deposited in hydrogen at 77°K had been measured in the usual fashion, the Dewar flask of liquid nitrogen was removed from around the catalyst vessel to permit the nickel film to warm up to room temperature. When temperature equilibrium was achieved, the hydrogen which had been desorbed was transferred quantitatively by means of Tttpler pump P2 to the calibrated section for measurement on McLeod gauge G2. From a knowledge of the quantity of hydrogen originally adsorbed and of the quantity desorbed by increasing the temperature, it was possible to calculate the amount of hydrogen remaining adsorbed on the nickel film at room temperature.
The results obtained by this method are given in table 22. The agreement among the five estimates of the specific adsorptive capacity at room temperature is not particularly good, but concordant results were not expected because of the unsatisfactory experimental method of trying to estimate the value of a small quantity (the amount of hydrogen remaining adsorbed at room temperature) by measuring the
difference between two very much larger quantities.
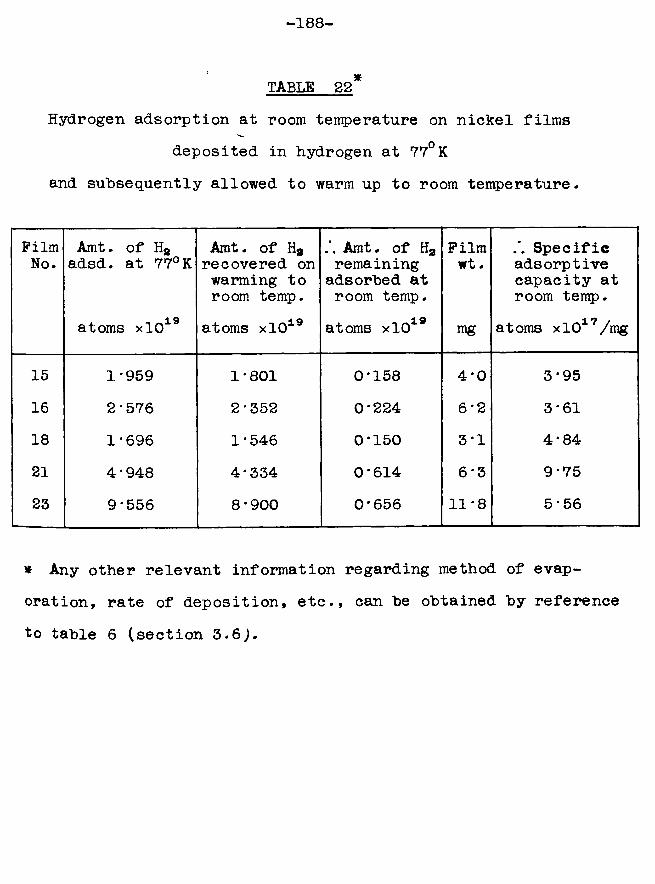
-188-
TABLE 22*Hydrogen adsorption at room temperature on nickel films
deposited in hydrogen at 77°K and subsequently allowed to warm up to room temperature.
FilmNo.
Amt. of Ha adsd. at 77°K
Amt. of Ha recovered on warming to room temp.
Amt. of Ha remaining adsorbed at room temp.
Filmwt.
Specific adsorptive capacity at room temp.
19atoms xlO atoms xlO19 19atoms xlO mg atoms xlOi7/mg
15 1 *959 1*801 0*158 4*0 3*9516 2*576 2*352 0*224 6*2 3*6118 1*696 1*546 0*150 3*1 4*8421 4*948 4*334 0*614 6*3 9*7523 9*556 8*900 0*656 11*8 5*56
* Any other relevant information regarding method of evaporation, rate of deposition, etc., can he obtained by reference to table 6 (section 3.6J.
-189-It is of interest to compare these values with the values
given in table 5 (section 2.7) for the specific adsorptivecapacity at 25°C of nickel films deposited in hydrogen atthat temperature. Although, for reasons already given inthe text, no great reliance can be placed on the actual numericalvalues recorded, the general trend is obvious - films depositedat 77°K and subsequently sintered at about 25°C have a slightlyhigher adsorptive capacity than films initially deposited at o25 C. These results for hydrogen deposited films are in
agreement with work published by Anderson, Baker and Sanders (40) for vacuum deposited films. These authors found that films deposited at an elevated temperature had a surface area considerably less than a film deposited at a lower temperature and subsequently sintered at the elevated temperature. They attributed the effect to the fact that the former films were composed of larger crystals owing to the increased ease of surface migration of the condensing atoms at the elevated temperature. The work of Knor and Ponec (75) is also relevant to the discussion. They have shown that the presence of adsorbed hydrogen on a film reduces the rate at which it sinters on thermal treatment.
These results, although of interest in themselves, really yielded no information as to the manner in which the hydrogen was released from its state of enhanced adsorption as the temperature of the film increased. Consequently, it was
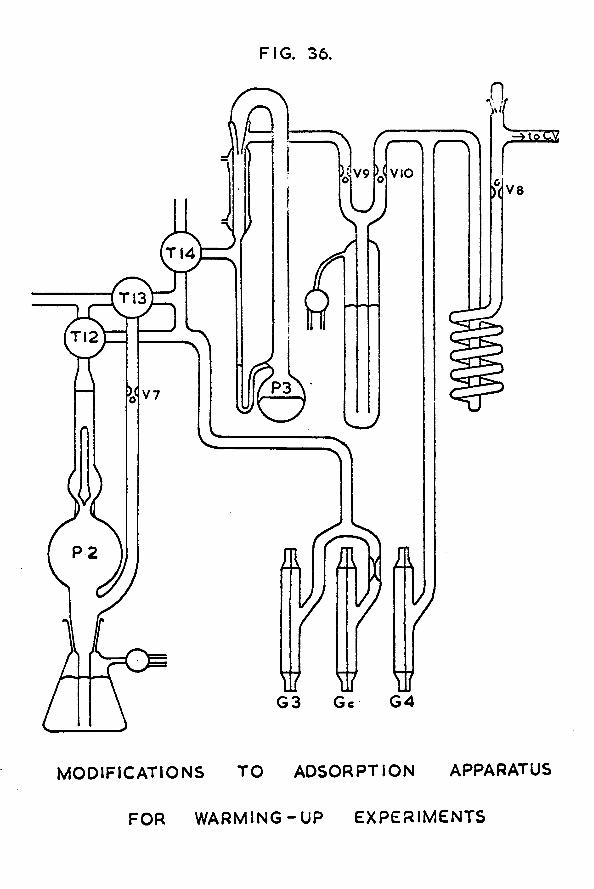
MODIFICATIONS TO ADSORPTION APPARATUS
FOR W A R M IN G -U P EXPERIMENTS
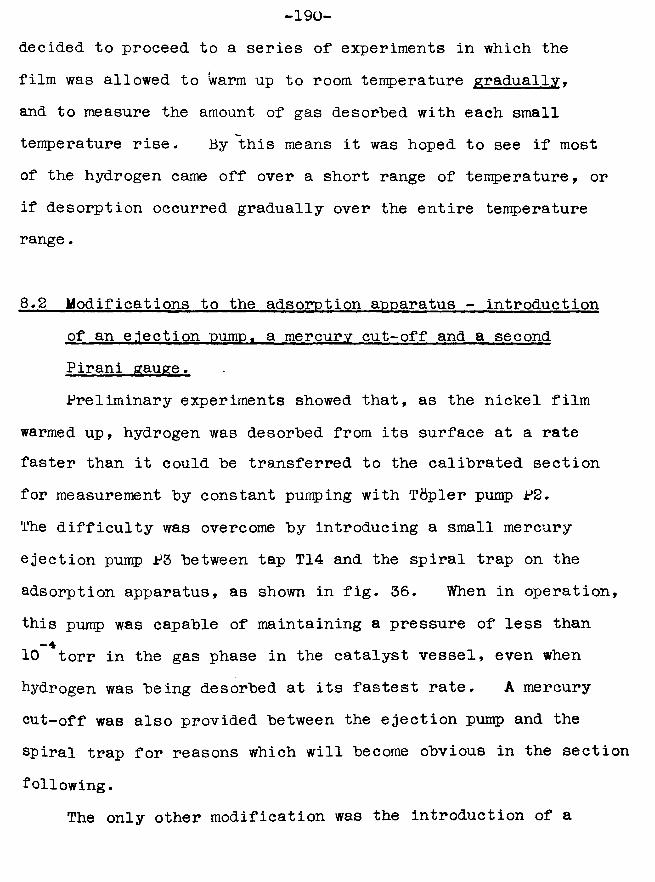
-190-decided to proceed to a series of experiments in which the film was allowed to Warm up to room temperature gradually, and to measure the amount of gas desorbed with each small temperature rise. By this means it was hoped to see if most of the hydrogen came off over a short range of temperature, or if desorption occurred gradually over the entire temperature range.
8.2 Modifications to the adsorption apparatus - introduction of an e.iection pump, a mercury cut-off and a second Pirani gauge.Preliminary experiments showed that, as the nickel film
warmed up, hydrogen was desorbed from its surface at a rate faster than it could "be transferred to the calibrated section for measurement by constant pumping with Tftpler pump P2.The difficulty was overcome by introducing a small mercury ejection pump P3 between tap T14 and the spiral trap on the adsorption apparatus, as shown in fig. 36. When in operation, this pump was capable of maintaining a pressure of less than 10 torr in the gas phase in the catalyst vessel, even when hydrogen was being desorbed at its fastest rate. A mercury cut-off was also provided between the ejection pump and the spiral trap for reasons which will become obvious in the section following.
The only other modification was the introduction of a
FIG. 37.
IOO KSXGc i o o hVWVWWVWV
G 4 ^ I O O A
2V
CIRCUIT DIAGRAM
FOR COMBINED PIRANl GAUGES
-191-second Pirani gauge G4 to monitor the hydrogen pressure on
2
the catalyst vessel side of the ejection pump. This gauge was built to exactly the same design as the original Pirani gauge G3 which measured the pressure on the TBpler pump side of the ejection pump. The bridge circuits for the two Pirani gauges were combined so that the compensating Pirani Gc and resistor Rc were common to both circuits, as shown in fig. 37. This design resulted in the feature that the sensitivities of the gauges could be balanced so that they responded to a given gas pressure in an identical manner, as follows. The natural zeroes of the two galvanometers were first adjusted to a setting of 1*0 at the left hand ends of their scales.The circuits were then switched on, the galvanometers were set on their most sensitive scale, and the bridges were balanced under conditions of high vacuum by means of potentiometers A and B so that the galvanometers indicatedno flow of current. Hydrogen, at a pressure of 10 '̂torr as measured by McLeod gauge G2, was admitted to both Pirani gauges. Potentiometer C was adjusted so that each galvanometer gave the same deflection, and the magnitude of this deflection was altered by means of potentiometer D to give galvanometer scale readings of 14*0. The Pirani gauges were calibratedin terms of absolute hydrogen pressure by reducing the quantity of hydrogen present in gradual stages, and taking corresponding McLeod gauge G2 and galvanometer deflection measurements.
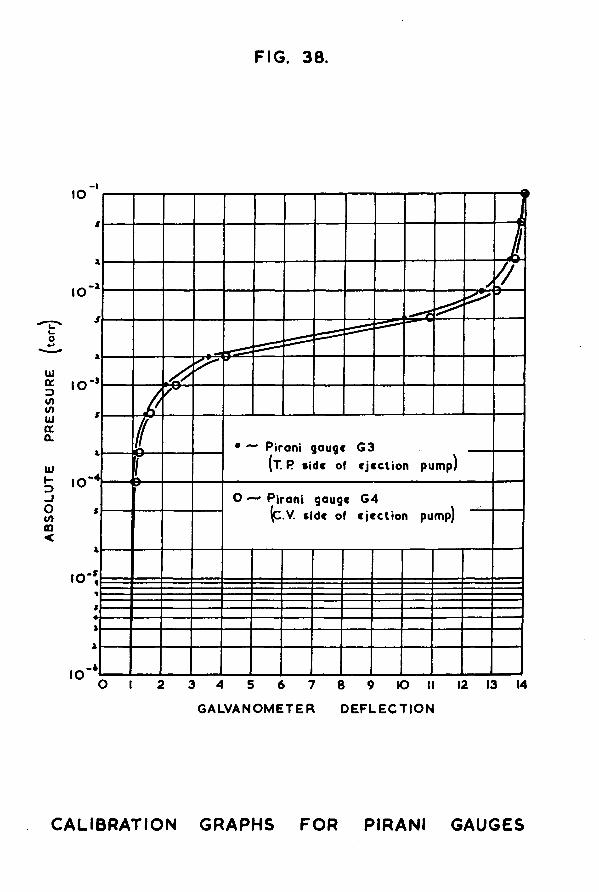
AB
SOLU
TE
PR
ES
SU
RE
FIG. 38.
10
uL.O*-*
~ Pirani gauge G3(t. P side of ejection pump)
IO“O Pirani gauge G4
(p.V. side of ejection pump)
-5
-ft
GALVANOMETER D EFLE C TIO N
CALIBRATION GRAPHS FOR PIRANI GAUGES
-192-The calibration curves are given in fig. 38, and show thatthe gauges had a useful pressure range in the region 10 1torr to 10 *torr.
8.5 Nickel film - gradual warming-up employing precooledisopentane.A means had to he devised of allowing the nickel film
to warm up gradually and uniformly from 77°K to room temperature. The first method to he tested employed isopentane because of its very long liquid range. In a preliminary experiment, a Dewar flask was filled with isopentane. A large test tuhe was placed in the centre of the isopentane, and this was kept filled with liquid nitrogen until the isopentane had heen cooled to such an extent that it hegan to solidify round the sides of the test tuhe. The liquid nitrogen was then allowed to evaporate, and it was found that the rate at which the temperature of the precooled isopentane rose hack up to roan temperature was ideal for the proposed warming-up experiment on the nickel films.
The actual experimental procedure during the warming-up run was then as follows. The nickel film was deposited in the presence of hydrogen at 77°K, and the quantity of hydrogen adsorbed on it was measured. The Dewar flask of liquid nitrogen was then removed from around the catalyst vessel, find was replaced, as rapidly as possible, by a Dewar flask
-193-full of isopentane precooled to its freezing point. After
Ithis treatment, it was observed that the galvanometer spots associated with Pirani gauges G3 and G4 had moved to the extreme right of the scale, indicating an increase in gas phase pressure owing to desorption of hydrogen because the temperature of the nickel film had been raised. The ejection pump P3 was switched on to transfer the gas phase hydrogen in the catalyst vessel into the small section enclosed by the outlet of the ejection pump, taps T14, T13 and T12, and valve V7 (fig. 36). When Pirani gauge G4 indicated a negligible hydrogen pressure in the catalyst vessel, the mercury in the cut-off attached to the ejection pump was raised against valves V9 and V10 to prevent further transfer of gas. Simultaneously, after thorough stirring, the temperature of the isopentane was read by means of a previously calibrated copper/constantan thermocouple which was attached by means of Sellotape to the catalyst vessel adjacent to the region where the nickel film was deposited.The desorbed hydrogen was then transferred at leisure by means of TBpler pump P2 into the calibrated section for measurement. Pumping was continued until Pirani gauge G3 indicated that the hydrogen pressure in the small section between the ejection pump and Tttpler pump P2 was negligible. By this means, a measurement was obtained of the quantity of hydrogen desorbed as a result of increasing the temperature of the nickel film
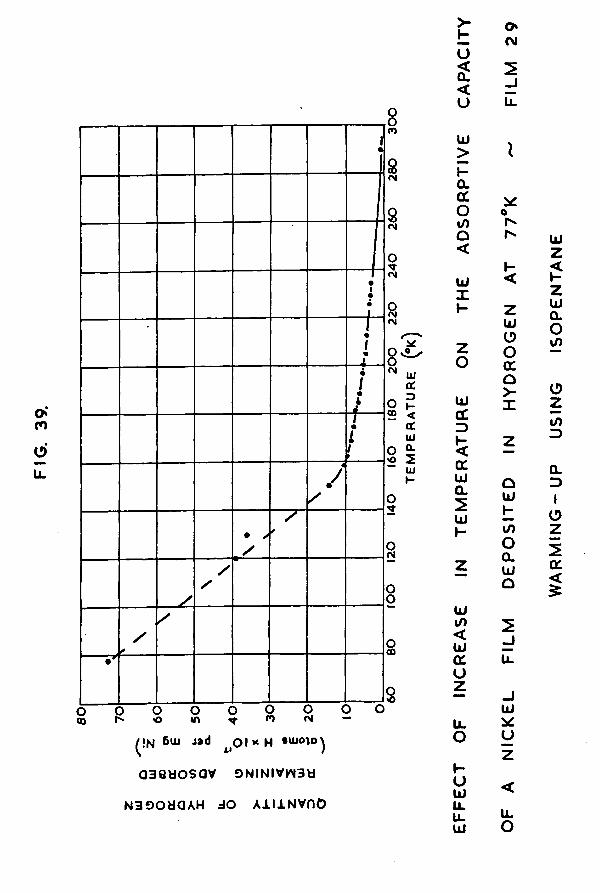
FIG
. 39
.
1•
•i••
___ | ._1•/•
_
/•4f _J•i/>
A
/
✓
• /
/
*
/
//
/f
CO
oegeg*OO" uicc.
8 - ® <(£.UJ
O % o 2~ UJ I-O
8in <o cm
6uj J>d t|O I * H • wo'id ^
aaatiosav 9NiNivw3d NBOOdOAH dO A ll lN V O O
>-Ko<C L<uU J>HOLQCOt Oa<U JX»-zo
Uia:3»-<CCU JGL2U JI-
U Ji/><U JccuzU l
ohoU JLLLLUJ
oC M
2uu.
*or*r*l-<zU J
OOCCa>X
QU JHt O
oGLU JO2-ju.
U J*U
U Jz<I-zU JQ.Ot O
e>zt/)3C L3IOz2cc<
u.O
-194-to the value noted.
2
The mercury in the cut-off was then lowered, and the entireprocedure was repeated jfor a further small increase intemperature, the process "being continued until the isopentane had warmed up to room temperature.
By subtracting the quantity of hydrogen desorbed from the amount originally adsorbed at 77°K, it was possible to calculate the quantity of hydrogen remaining adsorbed on the film at each particular temperature. The results which the experiment yielded are depicted graphically in fig* 39. The graph indicated that most of the desorption of hydrogen occurred at temperatures lower than 160°K; thereafter the desorption was slow and gradual. Unfortunately, only two measurements in the temperature range 80°K to 150°K had been obtained, and hence there was no real justification for drawing a straight line graph through them - desorption might have occurred in stages in that region. For this reason, the experiment was repeated with the introduction of a modification to enable more measurements to be made in the low temperature region, as described in the following section.
8.4 Nickel film - gradual warming-un employing liquid argonand nrecooled isopentane.In the repeat experiment, after the adsorption of hydrogen
at 77°K had been measured, a small quantity of liquid argon
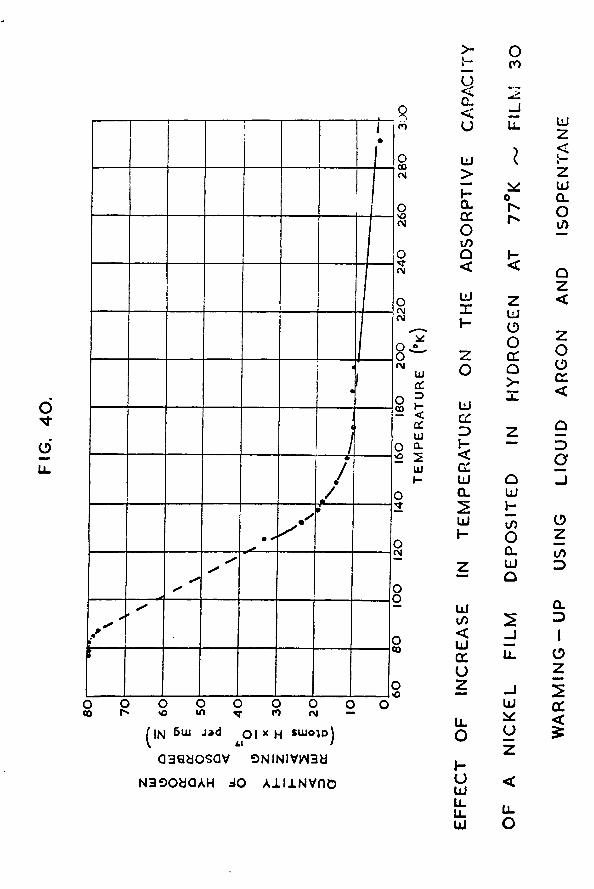
FIG
. 4
0.
i I•
j
4
«14
/i
•/•/*yS
\•\ »
s's'
s's'
(
s
• <I
<
o00
O O<o Oin O oc*> o<N^1N 6uj j»d oi x H *ujo*dJ a3saosav ONiNivwsa
NSOOdGAH 30 A1I1NVDD
UJ(£,3H<CLUJa2UJH
I<o
U>K-GLGLoI/)Q<UXH2Oucc3<CLUQ.2UJH
UJi/><ucno2LlOHOujLlLLUJ
oCO
3Ll
o
H<2UJOOa:a>
QUHi/>OCLLJO
2-j
-jUJu
UJ2<1 «2 UJ CLO\jn
Q2<2OO
CL<
g3a3
O2in3
a3O22CL<£
LLo
-195-was poured into the Dewar flask and thoroughly mixed with the liquid nitrogen already there. Frequent repetition of this treatment with further small quantities of liquid argon yielded a series of mixtures ranging in temperature from the hoiling point of liquid nitrogen (77°K) to the "boiling point of liquid argon (87°K), and enabled the quantity of hydrogen desorbed from the nickel film to be measured at several temperatures within this range. Thereafter, the Dewar flask of liquid argon was removed and was replaced by one of precooled isopentane; the rest of the warming-up was then carried out as already described in the previous section.
The results of this experiment are shown in fig. 40.The graph had the same general shape as in fig. 39, but it yielded the additional information that no desorption of hydrogen from the nickel film occurred with the first few degrees of temperature rise above 77°K. This observation led to a consideration as to whether the temperature of the nickel film during deposition was really that of the liquid nitrogen surrounding it (i.e. 77°K) or whether it might not have been slightly higher owing to the effect of radiant heat from the evaporating filament. This question is considered in appendix F, where the calculation there set out indicates that the true film temperature during deposition was probably about 83° K rather than 77°K. This then
afforded an explanation of why no hydrogen desorption was
-196-observed in the warming-up process until the temperature of
othe liquid nitrogen/liquid argon mixture had reached 83 K. Above this temperature, as in the previous experiment, it had not been possible to take sufficient measurements to determine the true shape of the warming-up curve in the temperature range where desorption was occurring at its fastest rate.
Because of this difficulty of obtaining sufficient measurements in the low temperature region, and also because of the unsatisfactory experimental technique of exchanging Dewar flasks in the middle of the warming-up process thereby running the risk that, during transfer, the film might attain a temperature higher than that of the precooled isopentane, this method of allowing a film to warm up gradually was abandoned, and a new method was devised employing a heat reservoir.
8.5 .Nickel film - gradual warming-uu employing a heat reservoir.The heat reservoir consisted of a copper cylinder, 9in
in length (i.e. about 6in longer than the usual length of a metal filament) and of diameter such that it fitted very closely round the catalyst vessel. About one inch from either end of the cylinder there were soldered two constantan wires which formed thermocouples with the copper cylinder;
-197-a calibration curve for each of these was determined. Copper was chosen for the cylinder material because it is a good conductor of heat, and would therefore help maintain uniformity of temperature over the entire film area. Round the copper cylinder was wrapped a piece of aluminium mesh, and round this again several layers of sheet aluminium. The idea of the mesh was to leave spaces where the liquid nitrogen couldpenetrate freely. The aluminium was used to increase the heat capacity of the reservoir; the actual weight used wascalculated to give a suitable rate of warming-up.
The procedure during a warming-up experiment was as follows. The heat reservoir was placed round the catalyst vessel in such a position that the glass on which the film would be deposited was an equal distance from the ends of the copper cylinder, and the thermocouples were slightly above and below the limits of the film. The catalyst vessel and heat reservoir were then surrounded by a Dewar flask of liquid nitrogen, and evaporation and adsorption studies at 77°K were carried out as usual. When it was desired to allow the film to warm up gradually, the external induction coil was slipped over the catalyst vessel out of the way, and the position of the heat reservoir was accurately adjusted. The neck of the Dewar flask was plugged with cotton wool soaked in liquid nitrogen, and the liquid nitrogen was sucked out of the Dewar into a flask evacuated by means
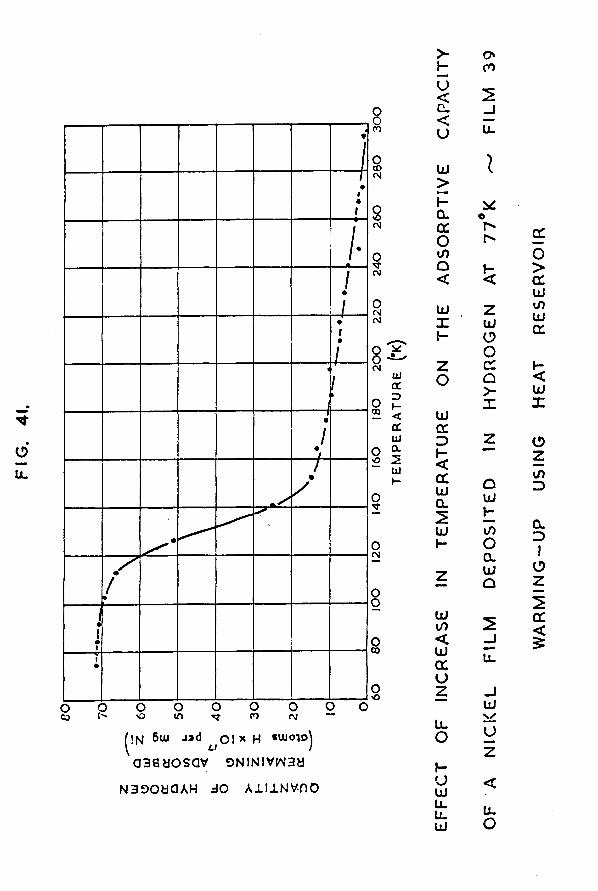
oLl
o D
UJCCDJ-<CCUJa2UJ
aasaosav oNiNivwaa NSOOWOAH 3 0 A J L I lN V n O
>HU<CL<uUJ>»-a.a:OtOQ<UJX
ZoUJa:3I—<a:UJOL2UJH
UJ
<UJa:uzLl
OI—UUJLlLluj
O'n
-J
r*r-
55
zUJOoccQ>■X
aLJH</)OCLUJO
Ll
-JUJvOz
LlO
O>CCUJtOUJcc
J-<UIX
oz3
Ql3IOz2X<
-198-of a rotary pump. Preliminary experiments showed that the heat reservoir warmed up very gradually in the cooled Dewar, and also that it maintained very nearly the same temperature throughout its length - the two thermocouples never indicated temperatures differing "by more than two degrees; in such cases when a small temperature difference did exist, the average of the two readings was taken as the "best estimate of the temperature of the film.
This method of controlling the rate at which the film warmed up enabled readings to he taken at all temperatures. There was no gap between the boiling point of liquid argon (87°K) and the freezing point of isopentane (113°K), as there had been in previous experiments.
The results obtained by this method for the effect of temperature on the adsorptive capacity of a nickel film deposited in hydrogen at 77°K are shown in fig. 41. The graph shows that no desorption at all occurred until the temperature of the film reached 83°K; the reason for this has already been given. Thereafter, only a very little desorption took place as the temperature rose to 100°K.This very gradual desorption suggested that, even if the film had been deposited at a temperature lower than 77° K, not very much more hydrogen would have been adsorbed on it. This is important, because it shows that the results quoted in this thesis are the maximum values, or are extremely close to the
-199-maximum values, for the specific adsorptive capacities ofnickel films, and that the adsorption would not have "beenappreciably increased by lowering the temperature ofdeposition. The graph also shows that the greatest amount
o oof desorption occurred in the temperature range 115 K to 150 K; in fact, 70$ of the total amount of hydrogen originally adsorbed was desorbed in this range. Between 160°K and room temperature, the remainder of the hydrogen was desorbed gradually in an almost linear relationship with temperature rise.
In an attempt to correlate this desorption pattern with some other physical property of the metal, similar experiments were carried out on evaporated films of palladium and rhodium.
8.6 Palladium and rhodium films - gradual warming-up employing the heat reservoir.Palladium and rhodium were the metals chosen for
comparison purposes for definite reasons - palladium because of its peculiar ability to dissolve hydrogen, and rhodium because it is a metal with a much higher melting point than either nickel or palladium.
Before valid comparisons among the three metals could be made, it was necessary to establish two facts for each,:a) whether the bake-out film, sintered at 500°C, was capable
of adsorbing any hydrogen, and
-200-b) whether any physical adsorption occurred on the metal
film deposited at 77°K.It was quite possible that hydrogen, adsorbed under either of the above two conditions, might be released from its state of adsorption as the temperature rose in a manner quite different from hydrogen chemisorbed on the film as it was being deposited at 77° K.
NICKELa) No significant amount of adsorption occurs on a bake-out nickel film sintered at 500°C (section 3.3).b) Physical adsorption does not occur on a nickel film deposited in hydrogen at 77°K (section 3.10).
PALLADIUMa) A bake-out palladium film, sintered at 500°C, is capable of taking up large quantities of hydrogen at 77°K (section 7.3). The palladium film on which the effect of temperature was studied was the one on which the adsorption on the bake-out film had been followed to saturation (film 38). Consequently, the exact ratio in which the total amount of hydrogen adsorbed at 77°K was divided between the bake-out and 77°K films was accurately known. Having established that all the hydrogen adsorbed on the bake-out film was desorbed when the film warmed up to room temperature (section 7.3), it was reasonable to assume that, in the warming-up experiment, the quantity
-201-of hydrogen desorbed with each small temperature rise couldbe divided in the ratio of the adsorptive capacities of the two films at 77° K. This was done, to yield the graph shownin fig. 43, where only the desorption from the palladium film deposited in hydrogen at 77°K is plotted.b) Physical adsorption does not occur on a palladium film deposited in hydrogen at 77°K (section 7.3).
RHODIUMOnly one experiment (number 37) was carried out on a
rhodium film. The rhodium film, as was the case with thenickel and palladium films, was formed by the inductionevaporation of a filament of 0'02in diameter spectroscopicallypure wire supplied by Johnson Matthey & Co. Ltd. The samecompany performed the analysis of the rhodium film deposited,
the weight of which they estimated to be 30*2mg.a) When a sample of hydrogen was left in contact with thebake-out rhodium film, presintered at 500°C but cooled to n o77 K for the experiment, no decrease in gas pressure was observed. This indicated that the bake-out rhodium film was incapable of adsorbing a significant amount of hydrogen, h) After the rhodium film proper had been deposited in hydrogen at 77°K, the system was left for half an hour to allow any slow sorption to occur. No further uptake was observed in this time interval, so it was concluded that,
-202-unlike palladium, no significant amount of slow sorption occurs on a rhodium film after deposition is complete.
When the unadsorhed gas phase hydrogen in the catalyst vessel section was being transferred back into the ”7 litre" calibrated section by Tttpler pump P2 for measurement, tests for physical adsorption were made similar to those already described in detail for nickel in section 3.10. The results of the first test are given in table 23 and fig. 42. The graph of "log (Q - quantity of hydrogen recovered)" against "number of Tftpler pump stroke" took the form of a smooth curve, indicating that desorption was occurring as the gas phase pressure was reduced by pumping; this in turn pointed to physical adsorption, or some similar type of reversible adsorption.
The results for the second test for physical adsorption on the rhodium film are given in table 24. The calculated values for A, the amount of gas phase hydrogen originally present in the catalyst vessel section before Tfipler pumping, increased progressively as pumping proceeded, but never became as large as the experimental value obtained for complete
1L 8recovery (9*508 x 10 atoms). These observations again indicated that reversible adsorption did occur on a rhodium film deposited in hydrogen at 77°K. However, the gas which was reversibly adsorbed (about 5% of the total adsorption at 77°K) was not included in the estimate of the total quantity
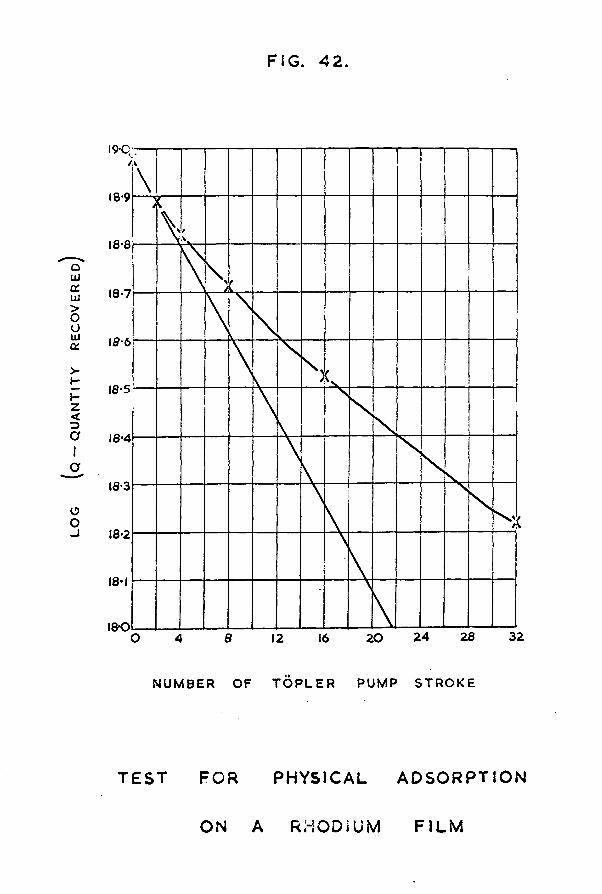
LOG
IQ-Q
UA
NT
ITY
R
EC
OV
ER
ED
FIG. 42.
18-9
18-8
18-7
18-5
18-4
18-2
18-0 28 3224O 208 164 12
NUM BER OF T O P L E R PUMP STRO KE
TEST FOR PHYSICAL A D SO R PTIO N
ON A RHODIUM F IL M
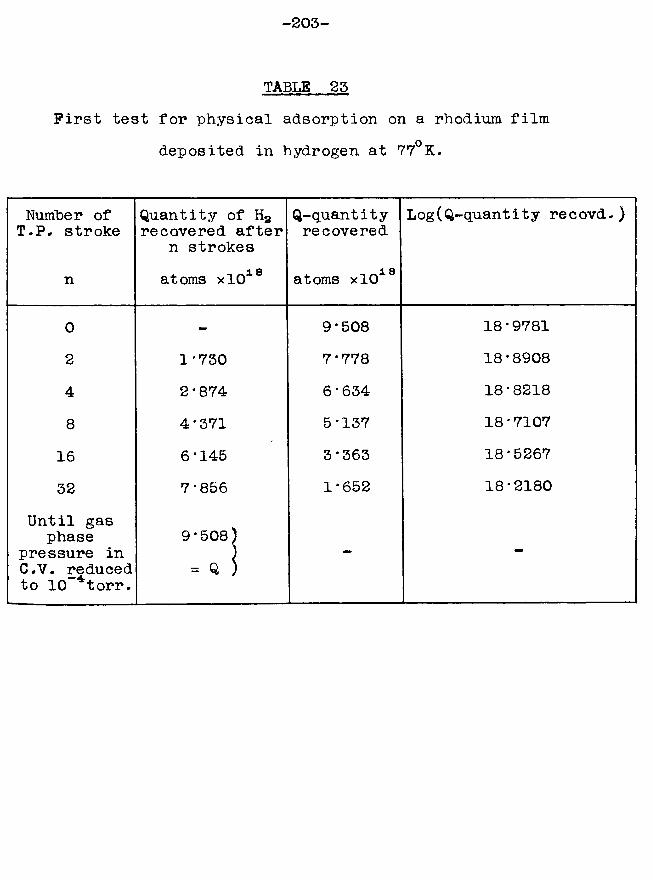
-203-
TABLE 25First test for physical adsorption on a rhodium film
deposited in hydrogen at 77° K.
Number of T.P. stroke
Quantity of Ha recovered after
n strokesQ-quantityrecovered
Log(Q-quantity recovd.)
n at oms x 10* 8 atoms xlO18
0 - 9*508 18*97812 1*730 7*778 18*89084 2*874 6*634 18*8218
8 4*371 5*137 18*7107
16 6*145 3*363 18*5267
32 7*856 1*652 18*2180
Until gas phase
pressure in C.V. reduced to 10~*torr.
9*508)
= Q )- -
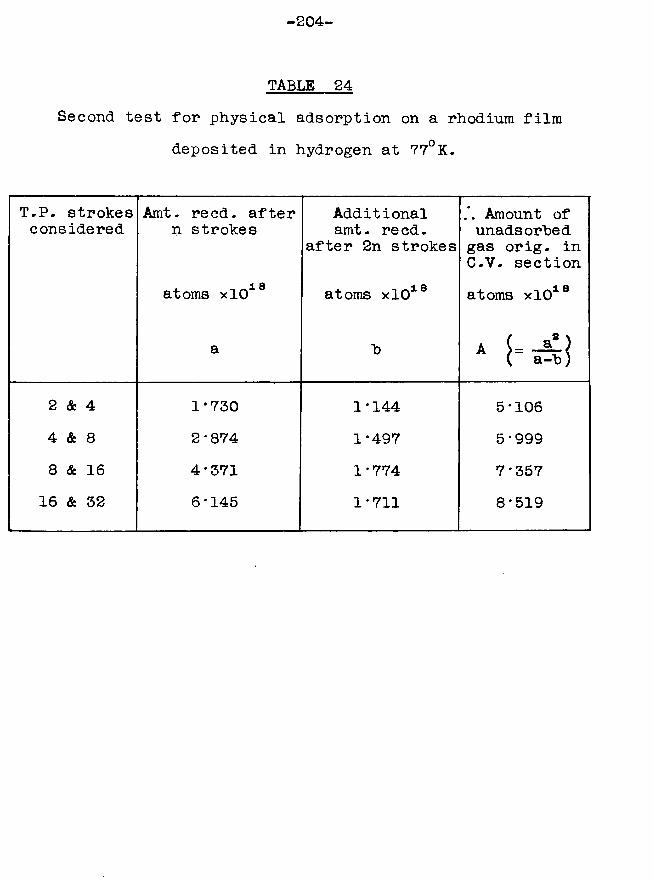
-204-
TABLE 24Second test for physical adsorption on a rhodium film
deposited in hydrogen at 77°K.
T.P. strokes considered
Amt. reed, after n strokes
Additional amt. re cd.
after 2n strokesAmount of unadsorbed gas orig. in C.V. section
atoms xlO18 atoms xlO18 atoms xlO18
a h * j - *
2 & 4 1*730 1*144 5*1064 & 8 2*874 1*497 5*9998 & 16 4*371 1*774 7*357
16 & 32 6*145 1*711 8*519
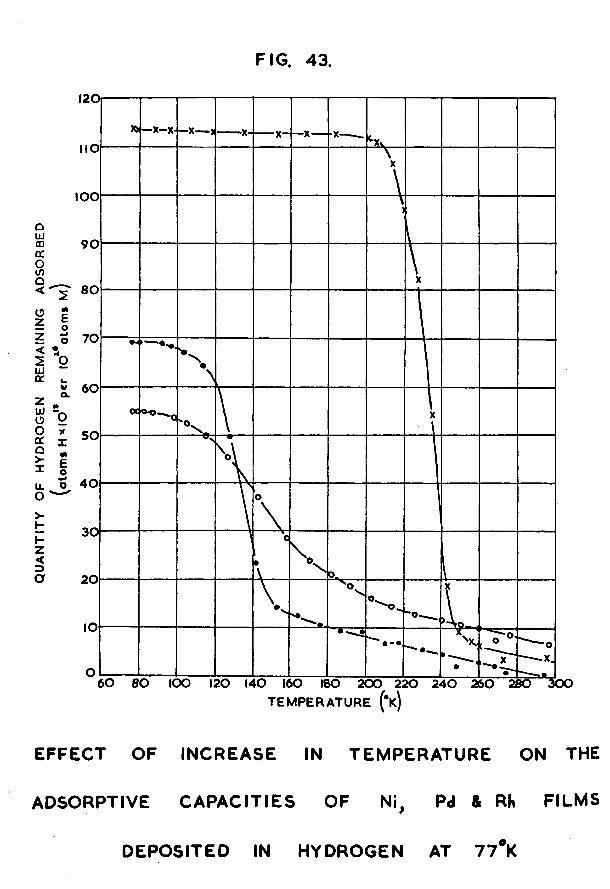
QU
AN
TITY
OF
H
YDR
OG
EN
REM
AINI
NG
AD
SOR
BED
FIG. 43.
I20i•x—x- —:
IOO
9 0
MEo«->
wQ l 60
O* 5 0•»Eoo 4 0
30-
20
60 8 0TEMPERATURE (*k)
EFFECT OF INCREASE IN TEMPERATURE ON THE
ADSORPTIVE CAPACITIES OF Ni, Pd & Rh FILMS
DEPOSITED IN HYDROGEN AT 77*K
-205-adsorbed (9*76 x 1019atoms of hydrogen on a 30*2rag rhodium film); the amount recovered from the catalyst vessel after exhaustive pumping with the ejection pump until the pressure
—4was reduced to less than 10 torr was subtracted from the total amount of hydrogen presented to the film. The specific adsorptive capacity of the rhodium film deposited in hydrogen at 77°K (32*32 x 1017atoms of hydrogen adsorbed per mg of rhodium) was therefore calculated solely on the basis of chemisorbed hydrogen.
Having made the appropriate allowances, therefore, for adsorption on the bake-out film in the case of palladium and for physical adsorption in the case of rhodium, a study was made of the way in which the hydrogen chemi sorbed on the film deposited in hydrogen at 77°K was released from its state of of adsorption as the temperature rose. The experimental technique for the palladium and rhodium films was exactly as already described in section 8.5 for nickel, and employed the heat reservoir as the method of allowing the films to warm up gradually to room temperature. The results obtained are shown in fig. 43, along with the results already presented in fig. 41 for nickel. In this graph, however, the ordinate gives the quantity of hydrogen remaining adsorbed per 108° metal atoms rather than per mg of metal, to facilitate comparison between the different metals.
-206-8.7 Discussion.
The results of these warming-up experiments may he briefly summarised thus:a) Atom for atom, palladium was capable of taking up by far the most hydrogen, while the specific adsorption on rhodium was the least of the three metals.b) In all three cases, a certain similarity was observed in the manner in which the hydrogen was released from its state of adsorption as the temperature rose. Initially, very little desorption occurred; this was followed by a period of rapid desorption over a short temperature range, then finally the desorption became slow and gradual once again as room temperature was approached.c) In the cases of palladium and nickel, the release ofhydrogen was not appreciable until the temperature had risen
oby a considerable amount above 83 K - the deposition temperature of the film (appendix P). This was significant, in that it meant that the hydrogen : metal atomic adsorption ratios recorded for these two metals were very near the maximum possible, and would not have been greatly increased by lowering the temperature of film deposition to a value less than 77°K. In the case of rhodium, however, quiteconsiderable desorption was observed as soon as the temperature
orose above 83 K; this meant that more adsorption would probably have occurred at lower temperatures, but the point
-207-was not pursued because of the practical difficulties that would have been encountered owing to physical adsorption, d) The ease with which the hydrogen was released from its state of adsorption on the metal film as the temperature rose was in the order Rh > Ni » Pd. This order is the reverse of the order of magnitude of the latent heat of sublimation values for the three metals (Pd, Ni, Rh have respectively Ls values of 91, 101, 138 Kcal/mole). Since the latent heat of sublimation is a measure of the metal-metal bond strength, the ease of release of hydrogen appears to be controlled by the tendency of the structure to make metal-metal bonds, thus eliminating hydrogen. For example, the Pd-Pd bond is the weakest of the three, so it has the least tendency to be remade, and hence the temperature must be increased to the greatest extent before adsorbed hydrogen is eliminated from the structure.
It is perhaps also significant that, atom for atom, the the amount of adsorption of hydrogen occurring on the three metals is also in the inverse order of the latent heat of sublimation values. This suggests that the weaker are the metal-metal bonds, the greater is the ease with which metal-hydrogen bonds are formed.
These observations are summarised in table 25.
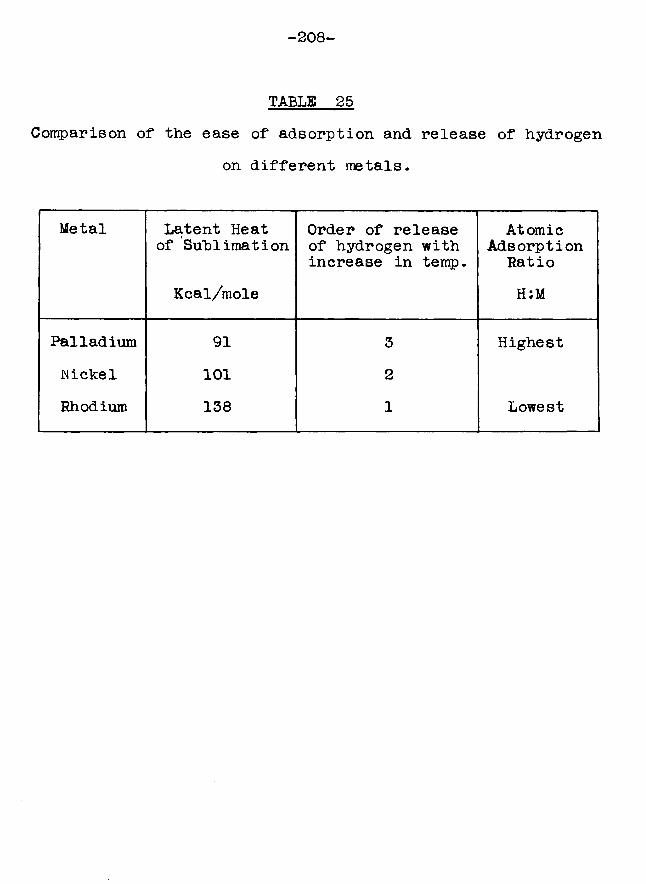
-208-
TABLE 25Comparison of the ease of adsorption and release of hydrogen
on different metals.
Metal Latent Heat of Sublimation
Kcal/mole
Order of release of hydrogen with increase in temp.
Atomic Adsorption
RatioH:M
Palladium 91 3 HighestMckel 101 2Rhodium 138 1 Lowest
-209- C H A P T E R 9
DISCUSSION.
9.1 Review of results on extent of hydrogen adsorption.The experiments described in this thesis have shown that
the extent to which hydrogen is adsorbed on an evaporated metal film is dependent on at least four variables:a) whether or not hydrogen has free access to the metal
film as it is being deposited,b) the temperature at which film deposition and hydrogen
adsorption are carried out,c) the state of the gas phase hydrogen presented to the
film for adsorption, andd) the metal of which the film is composed.
A summary of the appropriate adsorption data is given in table 26, and each of the above four criteria is discussedin detail in relation to the results presented there,a) Freedom of access of hydrogen to the bulk metal.
Evaporated nickel films deposited in the presence of hydrogen at 77° K have a very much higher adsorptive capacity for hydrogen than have vacuum deposited films. This fact can only be explained by assuming that, in a vacuum deposited film, the nickel atoms contained within the bulk of the film are capable of adsorbing hydrogen, but do not do so simply because the hydrogen does not have access to them. When
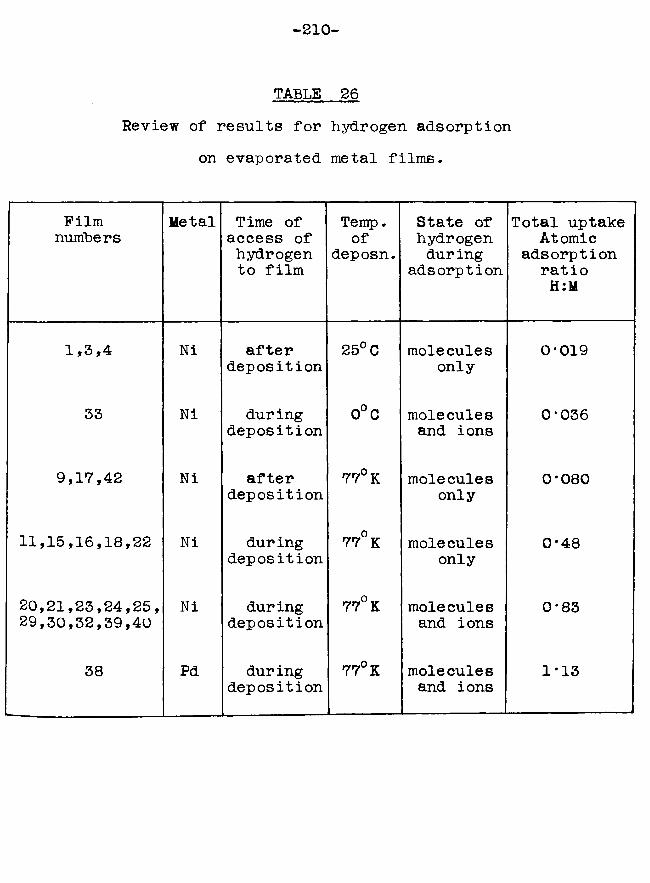
-210-
TABLE 26Review of results for hydrogen adsorption
on evaporated metal films.
Filmnumbers
Metal Time of access of hydrogen to film
Temp. of
deposn.State ofhydrogenduring
adsorption
Total uptake Atomic
adsorption ratio H:M
1,3,4 Ni afterdeposition
25° C moleculesonly
0-019
33 Ni duringdeposition
0°C molecules and ions
0*036
9,17,42 Ni afterdeposition
77° K moleculesonly
0*080
11,15,16,18,22 Ni duringdeposition
_,_0 77 K moleculesonly
0*48
20,21,23,24,25,29,30,32,39,40
Ni duringdeposition
77° K molecules and ions
0*83
38 Pd duringdeposition
77° K molecules and ions
1*13
-211-the film is formed in the presence of hydrogen, access of the adsorbate to the nickel is not restricted, and chemisorption has a chance to occur on each nickel atom as it is deposited.
The marked enhancement in the hydrogen:nickel adsorption ratio of hydrogen deposited films compared with vacuum deposited films, however, was not observed at room temperature. This leads to a consideration of the second factor which controls the adsorptive capacity of an evaporated film - the deposition temperature.b ) The deposition temperature.
The deposition temperature has an effect on the adsorptive capacity of all evaporated metal films, be they formed in vacuum or in the presence of a gas. The lower the temperature of deposition, the less mobile are the condensing metal atoms; the film is therefore composed of smaller crystallites, and consequently has a larger surface area and greater specific adsorptive capacity (23, 40).
However, for films formed in the presence of the adsorbate, the deposition temperature has a further significance. At room temperature, for example, thermal movement of both the adsorbed hydrogen and the nickel atoms leads to elimination of the adsorbate from the internal surfaces of the structure (chapter 2). It is not until the mobility of both species has been considerably reduced by lowering the deposition temperature that the hydrogen atoms remain adsorbed on nickel
-212-in the hulk of the structure, and enhancement of the adsorptive capacity of the film is observed (chapter 3).
It would have been interesting to lower the deposition temperature below 77°K until the hydrogen was completely immobile on the surface, to see if greater enhancement of adsorption was observed under these conditions. However, the practical difficulties involved in carrying out an experiment at such a low temperature would have been great owing to the onset of physical adsorption of hydrogen. This would have made the interpretation of the hydrogen:metal atomic adsorption ratio extremely difficult. An insight into the type of behaviour which might have been observed at temperatures lower than 77°K was obtained by the backwards extrapolation of results procured at a succession of higher temperatures (chapter Q). These results, depicted in fig. 43, indicated that lowering the deposition temperature below 77°K would have led to only a very slight increase in the adsorptive capacity of hydrogen deposited nickel films, and would have had no effect on hydrogen deposited palladium
films.c) The state of the hydrogen.
The experiments described in chapter 3 showed that nickel films deposited in the presence of hydrogen at 77°K had a greater adsorptive capacity if they were formed by induction evaporation rather than by passing a current directly through
-213-the filament via tungsten leads. This was briefly explained in chapter 3 by saying that the induction heater might cause
breakdown of the gas phase hydrogen molecules, and the ions or atoms thus formed might be adsorbed on sites which would have been left vacant by molecules. There are two possiblereasons why this could be the case. The first is concernedwith the geometry of the metal surface, the second with theenergetics of the adsorption process. The energy considerations are discussed at length in section 9.3 and fig. 46; the geometry considerations will be discussed in detail now.
It is known that, for the adsorption of a diatomic hydrogen molecule, the transition to the adsorbed state involves dissociation. it is therefore generally assumedthat two adjacent vacant sites are required on the catalystsurface. Roberts (49) has shown theoretically that if molecules arrive in a random manner at an infinite surface, some 8% of the sites will be left bare at "complete" coverage, simply because they will be isolated as single sites if mobility of the adsorbed species is not possible. On an incoherent structure made up of small islands of metal atoms, such as exists in an unsintered nickel or palladium film, the proportion of bare sites will be even greater than 8$ owing to edge effects. There is no barrier, however, to the adsorption of atoms of hydrogen on these isolated sites, if such hydrogen atoms could be made in the gas phase, every
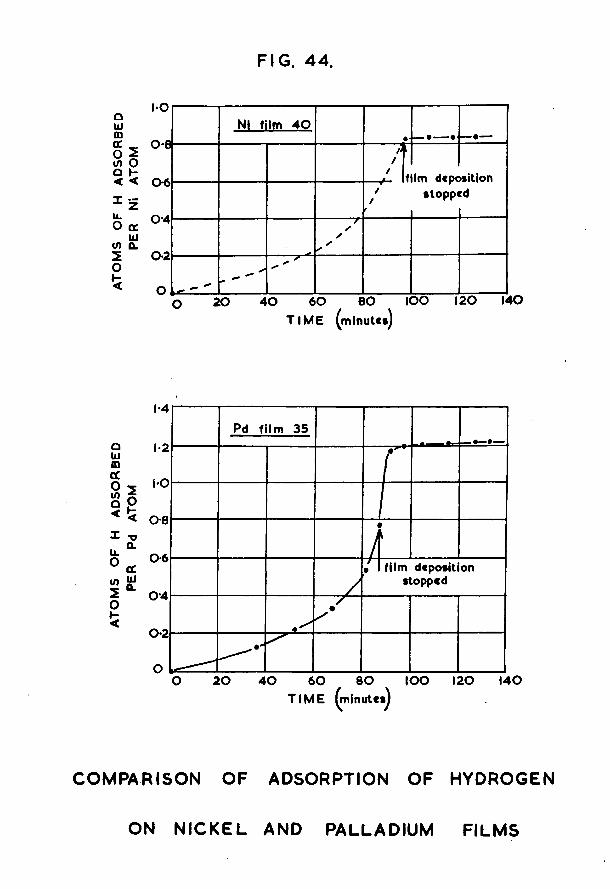
ATOM
S OF
H ADSORBED
ATOMS
OF H
ADSO
RBED
PER
Pd
ATOM
PER
Ni AT
OM
FIG. 44 .
NI film 40 •— •— • — •—A
/
/ film dcpc stoppi
xitiontd//
t7✓
AS
•>*
20 40 60 60 IOO 120 140TIME (minutes)
1-4
1*2
1-0
0-8
0*6
0*4
0-2
Pd film 35
A• film deposition stopped
O 20 40 60 80 IOO 120 140TIME (ninutcs)
COMPARISON OF ADSORPTION OF HYDROGEN
ON N IC K E L AND PALLADIUM FILMS
-214-available site on the catalyst surface could "be filled, and this would account for the enhanced adsorption on induction evaporated films,d) The nature of the metal.
A comparison of the specific adsorptive capacities of nickel films (chapter 3) and palladium films (chapter 7), both formed "by induction evaporation in the presence of hydrogen at 77°K, shows that, atom for atom, the uptake of hydrogen on palladium is greater than on nickel. Typical adsorption graphs for each metal are depicted in fig. 44.From them, it can be seen that a much larger fraction of the total hydrogen adsorbed was taken up after film deposition had ceased in the case of palladium than in the case of nickel. This happened even although ample opportunity was given for access of hydrogen while the film was being deposited, and points to some slow incorporation process for which access of hydrogen is not rate-determining. This indicates that there is some additional mode of incorporation of hydrogen in palladium which does not operate in the case of nickel or rhodium, and may account for the greater uptake on palladium.
Having discussed the various factors which control the extent of chemisorption of hydrogen on an evaporated metal film, it is now relevant to proceed to a consideration of
-215-the manner in which the hydrogen is held by the metal. Because of the high hydrogen:metal adsorption ratio in the case of films deposited in hydrogen at 77°K, it is hardly justifiable to discuss the phenomenon in terms of a surface adsorption - there is likely to be a fairly homogeneous distribution of hydrogen atoms among the metal atoms. As this is a situation similar to that existing in a binary metal alloy, it is relevant to consider studies reported in the literature of the catalytic properties of such alloy systems.
9.2 The band theory of metals.Metals differ markedly from other solids in their physical
properties. It is thought that these differences arise because the valency electrons in metals are not localised around individual atoms, but instead are free to move throughout the whole mass of each metal crystal. Because of this unrestricted mobility, the electrons are shared among the metal atoms, and, as a consequence of the Pauli exclusion principle, the discrete energy levels associated with individual atoms cease to exist and are replaced by bands of energies. Bach energy band consists of a range of energy levels, each level differing in energy from other levels in the band. Thus, for example, in individual aluminium atomsthe 3s and 3p electrons occupy orbitals corresponding to discrete levels of definite energy; when the atoms are brought
-216-together to form a metal crystal, however, the levels lose their identity and are replaced Toy the 3s and 3p hands of permitted energies which overlap on one another (76). Electrons occupy the energy levels in these hands in order of increasing energy, and it is the partial filling of the hands which is responsible for the electrical properties of the metal.
In electrical conduction, only those electrons which occupy the highest of the energy levels can participate, i.e. those electrons near the Fermi surface in momentum-space (77, 78). The reason for this is that electrons occupying lower energy levels would have to acquire too large an amount of energy in order to be promoted to a vacant level at the Fermi surface; promotion to a level below the Fermi surface is impossible as these levels already contain their full complement of electrons. Thermal promotion of electrons is therefore possible only from those energy levels which are just below the Fermi surface.
In chemisorption, in order that an electron pair bond can be formed between adsorbate and metal, it is also necessary that unpairing of electrons in the metal takes place. For the reasons given in the preceding paragraph, the possibility of entering into bond formation in chemi- sorption will therefore be restricted to those electrons
occupying energy levels near the Fermi surface.
-217-The magnetic properties of metals also arise from the
existence of unpaired electrons in the d-band; s-electrons are thought to make no contribution to the magnetic moment (79). Consequently, pronounced magnetic properties are shown notably by the transition metals, which are characterised by their possession of incompletely filled, overlapping d- and s-bands. It is from magnetic susceptibility measurements that information has been obtained about the extent to which the d- and s-bands are filled with electrons in different transition metals. Results indicate that there are vacancies in the d-band corresponding to 0*6 electron per metal atom in the case of nickel (80), and perhaps rather more (0*6 to 0*7 electron vacancies per metal atom) in the case of palladium (80, 81).
9.5 Role of the d-band in catalysis and chemisorption.There is-a great deal of evidence in the literature to
support the view that bonding with the d-band of the metal is important in chemisorption - and in particular, in chemi- sorption which can result in catalytic activity.
Dilke, Eley and Maxted (82) studied the adsorption of dimethyl sulphide on palladium. They concluded from magnetic susceptibility measurements that electrons from the sulphur atom entered the d-band of the metal. This is relevant to studies of the catalytic activity of palladium, because, by
-218-its chemical nature, dimethyl sulphide acts as a catalyst poison by being more strongly adsorbed on palladium than typical reactants would be in, for example, a hydrogenation reaction.
More quantitative evidence illustrating the importance of d-band vacancies in catalysis was obtained from the result of work carried out on binary metal alloys. The alloy systems studied have been notably palladium/gold and nickel/copper. These particular systems were chosen because they possess certain properties which eliminate the possibility of ambiguity in the interpretation of their catalytic behaviour, viz:a) The amount of d-band vacancies can be varied by altering the composition of the alloy, because, in each case, the transition metal possesses some such vacancies, whereas the group lb metal has its d-band completely filled.b) Both alloys form solid solutions over the entire composition range.c) The two metals in each alloy have very similar atomic radii, so that the lattice parameter changes only very slightly with alloy composition. The effect of the geometric factorin catalysis arising from this will therefore be negligible.
The catalytic activity of palladium/gold alloys in the parahydrogen conversion was studied by Couper and Eley (10). They found that the activation energy for the conversion was
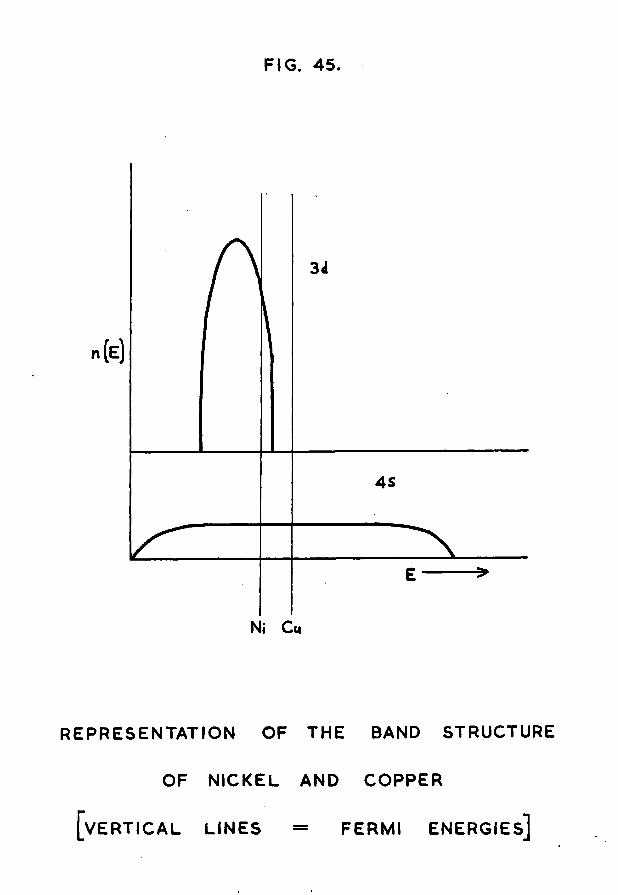
FIG. 45.
AS
Ni Cu
REPRESENTATION OF THE BAND STRUCTURE
OF NICKEL AND COPPER
[ v e r t i c a l L INES = FERM I ENERGIES]
-219-3*5 Kcal/mole on pure palladium- Progressive addition of gold had no effect on the catalytic activity until the gold content of the alloy reached 60 atomic per cent, when a sudden rise in activation energy to 8*5 Kcal/mole was observed. Further enrichment in gold resulted in alloys which showed the same high activation energy.
In the hydrogenation of styrene (12) and the decomposition of formic acid or methanol (83) on copper/nickel alloys, a similar state of affairs was found to exist. Again, the activation energy for the reaction showed a marked increase when 60 or more atomic per cent of copper was present in the alloy.
These findings can he explained quantitatively in the following manner. A copper atom has only one electron more than a nickel atom, so it may he assumed that the relative positions on the energy scale of the 3d and 4s hands will he the same in the two metals, although the extent to which the hands are filled will he less in nickel than in copper, as represented in fig. 45. When an alloy is formed between the two metals, any electrons in the s-levels of the copper which have an energy greater than that corresponding to the highest value in the d-hand will he ahle to fill vacancies in the d-hand of the nickel. Magnetic measurements show that the nickel atoms in the metal have the average electronic
9 * 4 0 * 6configuration 3d 4s , while in copper the configuration
-220-is 3d10 4s1. The density of energy levels in the d-hand is much higher than in the s-hand, and the d-hand as a whole is relatively very narrow, so it is reasonable to make the approximation that the progressive addition of electrons to nickel will result in their incorporation entirely within the d-hand until this is completely filled. This reasoning leads to the conclusion that there is an average of 0*4 electron per copper atom which can lower its energy state by falling into "holes" in the d-hand of the nickel when alloy formation occurs. Consequently, the alloy composition at which the d-hand is just filled will he 60 Cu : 40 Ni.This is in good agreement with the experimental observations on the variation with alloy composition of catalytic activity (as measured by the activation energy of a typical reaction), and confirms the correlation between d-hand vacancies and catalytic activity.
It is difficult to explain the behaviour of the palladium/gold system on a similar basis because of the large difference in the atomic numbers of palladium (At. No. = 46) and gold (At. No. =79). It may he that quite fortuitously the palladium 4d and gold 6s hands have a similar energy relationship to one another as have the 3d and 4s hands in nickel and copper. This view is at least supported by magnetic measurements on palladium/gold alloys (80); these show that the magnetic susceptibility of the alloy gradually
-221-decreases with increasing gold content, and falls to zero at a composition of about 60 atomic per cent gold.
It is significant that the activation energy of a catalytic reaction changes sharply with alloy composition at the point when the d-band is just filled. This can be explained in the following way. Although the average electronic configuration of, for example, nickel is 3d9’ * 4s0*6, the metal may be considered as an assembly of nickel atoms each of which at any instant has either the configuration 3d10 4s° or the configuration 3d9 4s1,; it is only atoms with the latter configuration which can participate in chemisorption when bond formation occurs between an adsorbate and the d-band of the metal. Since, however, the valency electrons in a metal are free to move throughout the whole crystal, the nickel structure will be able to adapt itself so that d-vacancies are presented at the surface of the crystal where chemisorption of reactants may occur. These surface d-vacancies will therefore be the last to be filled by s-electrons from the copper, and consequently the catalytic activity of the alloy will be maintained until all the d-vacancies within the bulk of the alloy have been filled.
The validity of considering that it is possible for the atoms of a metal to adopt two (or more in the case of some metals) discrete electronic configurations is supported by the fact that nitrogen can be chemisorbed on iron, but not
-222-on cobalt or nickel. Iron is the only metal among these three which possesses sufficient electron vacancies in its d-band to enable some of the atoms to take up a d configuration, and hence to hold a nitrogen atom in chemisorption by means of a triple bond (84).
In the work described in this thesis, in those systems which showed very high uptakes of hydrogen, it is probable that the vacancies in the energy bands of the nickel and palladium would be extensively filled by electrons donated by the hydrogen for the formation of electron pair bonds.To gain an insight into the relative strengths of these metal-to-hydrogen bonds, it is useful to consider the magnitude of the energy scale on the band diagram. Values are available for the d to s electron promotion energies for the group lb metals; they are 3*0eV for copper (85), 3*25eV for gold (86), and 4*0eV for silver (87) - these values, incidentally, account for the colours of the metals. It might therefore be expected that the Fermi level in copper would be about 3'0eV (or 70 Kcal/mole) higher than in nickel. A chemisorption bond formed between an adsorbate and nickel might consequently be stronger to the extent of 70 Kcal/mole than the corresponding bond with copper. This difference in the chemisorption bond energy would account for the ease with which hydrogen, presented to the metal as molecules, is chemisorbed on nickel and palladium, in contrast to the
-223-absence of chemisorption on copper, silver and gold. However, chemisorption of atomic hydrogen has frequently been reported on group lb metals. For example, Ponec, Knor and Cerny (88) have measured the adsorption of atomised hydrogen on copper, and have studied its reaction with oxygen. Similarly, Pritchard and Tompkins (89) have investigated the adsorption of hydrogen atoms on evaporated films of copper, silver and gold, by making surface potential measurements. Sachtler and de Boer (90) have recently studied the decomposition of formic acid on gold powders, and have obtained evidence that hydrogen atoms are produced and are adsorbed on the gold during the course of the reaction. By means of an elegant tracer technique, they have shown that this hydrogen is not exchangeable with molecular hydrogen in the gas phase.
All this evidence suggests that the energetics of the hydrogen adsorption process on group lb metals are such that dissociation of a molecule of hydrogen in the transition state prior to chemisorption cannot be effected; adsorption of hydrogen will only occur if dissociation of the molecule can be brought about before adsorption by some external means. The potential energy diagram illustrated in fig. 46 will make this clear (91, 92).
Although the above conclusions are concerned with the metals copper, silver and gold, similar considerations may apply to nickel for uptakes of hydrogen as high as those
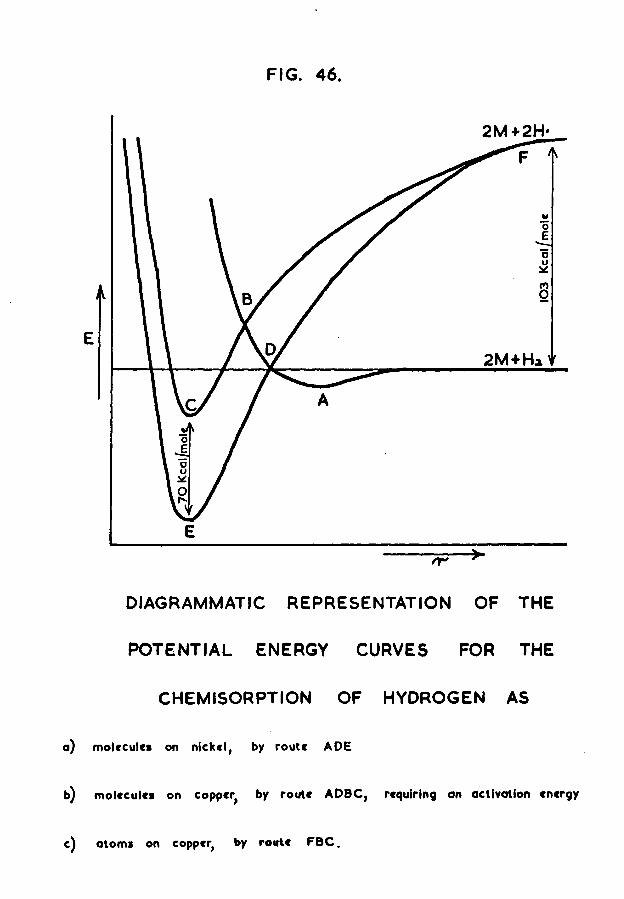
FIG. 46.
2M + 2H-
E
DIAGRAMMATIC REPRESENTATION OF THE
POTENTIAL ENERGY CURVES FOR THE
CHEMISORPTION OF HYDROGEN AS
a) molecules on nickel, by route ADE
b) molecules on coppe^ by route ADBC, requiring an activation energy
c) atoms on copper, by route FBC.
-224-observed in the present work. As the hydrogen ,s nickel atomic adsorption ratio increases, the d-hand will he progressively filled,; the Permi surface of the nickel will therefore he raised in energy, and consequently the potential energy trough (fig. 46) will become shallower (i.e. the point E will move to higher energy values)• The potential energy curve PDE, modified in this way, may eventually intersect curve ADB in such a position that adsorption from molecules becomes an activated process; a limit is therefore imposed on the uptake of hydrogen if this is presented at the surface as molecules. Wo such limitation will apply to preformed hydrogen atoms, so this is a further possible reason for the enhanced uptake of hydrogen observed when the induction heater was used as the method of evaporating the metal filament (see section 9.1.C).
The rise in the Permi level as the extent of chemisorption increases will be a contributory factor to the well known phenomenon of decrease in heat of chemisorption with increasing coverage. This, together with the appearance of an activation energy for adsorption as explained above, will lead to a chemisorption limit. Previously, it has always been assumed that this limit coincides with the filling of the d-band.While it is possible that, purely by chance, this may be the case, it is tempting to seek a more fundamental reason why chemisorption should not continue into the s-levels. This
-225-reason is possibly to be found in type C chemisorption.Bowden (93) has drawn a fundamental distinction betweend-type metals (having partially filled d-bandsJ and sp-typemetals (in which there are no partially filled d-bands;. Hehas proposed that these d-orbitals are able to participatein a special type of weak molecular chemisorption with certainmolecules. This has been designated ’’Type C chemisorption”.It has been postulated (91) that the type C chemisorbedhydrogen on d-type metals is able to act as an intermediatein the transition to conventional chemisorption as atoms(designated type A), and that type A chemisorption frommolecular hydrogen by sp-type metals is not observed becauseof the absence of this intermediate. In other words, theeffect of the type C state is to avoid the formidableactivation energy which would otherwise be encountered.
If these principles are applied to the system resultingfrom the deposition of nickel in the presence of hydrogen
oat 77 K, it may be seen that type A chemisorption will proceed through a type C intermediate state until the d-band is gradually filled together with levels of similar energy in the s-band. When the d-band is full, further adsorption into the s-band will not be possible because the available levels there will be higher in energy than the type C state.
-226-9.4 Mode of incorporation of hydrogen in films formed in
hydrogen at 77° K.It now remains to show how the results obtained in the
present work fit the evidence from other sources which has been described in the previous section.
For metal films prepared in the presence of hydrogen at 77°K, it was found that, atom for atom, the uptake on palladium was considerably greater than on nickel (HiPd = 1*13, H;wi = 0*83). The exchange results showed that the proportion of hydrogen on the palladium which was exchangeable was also greater than on nickel. As a consequence of this, the amount of non-exchangeable hydrogen on the two metals was very similar, and corresponded to a ratio of 0*60 hydrogen atom per nickel atom and 0*69 hydrogen atom per palladium atom.When some reasonable allowance is made for the incompleteness of exchange on palladium, owing to the slow rate at which it proceeded, a value slightly lower than 0*69 and probably close to 0*60 is predictable. The significance of these figures in relation to the d-band structure of palladium and nickel leads to the postulate that this non-exchangeable hydrogen is held by bonds to the d-band, and that the d-band of the metal is filled by electrons from the hydrogen participating in the bonds. Although there is some uncertainty in the palladium results owing to experimental difficulties, the estimates made are as good as the physical data available
-227-for assessing the d-hand vacancies.
Two possible reasons may be advanced as to why this hydrogen does not exchange when gas phase molecular hydrogen is allowed access to the film.(l) Firstly, the hydrogen is almost certainly held in the interstices between the metal atoms to form a structure similar to that of the well known palladium hydride system.In the case of nickel at least, the adsorbed hydrogen within the structure will be inaccessible to gas phase hydrogen, because of the absence of the marked diffusion of hydrogen which is observed in palladium. Were the situation otherwise, there is no reason why, given reasonable time, the same enhanced uptake should not be observed when hydrogen is admitted to a vacuum deposited nickel film. It is realised that this postulate of non-accessibility is not a valid reason for explaining the lack of exchange occurring on palladium films, where diffusion is possible. However, it may be that at the low temperature of 77°K the rate of diffusion is considerably reduced, and in the relatively short time intervals allowed for exchange in the experiments described in this thesis, no appreciable diffusion from the internal surfaces of the structure had the opportunity to occur. The fact that exchange on palladium was a much slower and more gradual process than on nickel (table 21 cf.
tables 16 & 17) supports this view. It might therefore be
-228-profitable to study exchange on palladium over much longer t ime inte rvals.(2) The second reason to explain the lack of exchange between hydrogen bonded to the d-band of the metal and gas phase molecular hydrogen may arise from the fact that the d-band of the metal is completely filled. The precise reason asto why this should preclude exchange is not very clear, but observations on other experimental systems having completely filled d-bands are in general accord with this idea, viz:a) Couper and Eley (10) have shown that hydrogen dissolved in palladium inhibits the catalytic activity of the metalin the parahydrogen conversion. In this respect, dissolved hydrogen behaves in the same manner as gold in its alloys with palladium. The similarity extends to the magnetic properties, since it is found that the paramagnetic susceptibility of palladium is lowered by dissolved hydrogen (81). Resulting from this is the curious anomaly that hydrogen which is bonded to the d-band of the palladium inhibits the parahydrogen conversion reaction, in spite of the fact that this is the very situation in which it would be expected to be a potential reactant rather than a catalyst poison.b) Sachtler and de Boer (90) have found a complete lack of isotopic exchange between deuterium molecules and adsorbed hydrogen resulting from formic acid decomposition on gold.This last piece of evidence shows that the exchange of adsorbed

-229-hydrogen on gold by a Rideal-Eley mechanism is not possible; that is, exchange does not take place between chemisorbed atoms and impinging hydrogen molecules. If this possibility can be ruled out also for hydrogen dissolved in palladium, and for hydrogen incorporated in nickel in the films under discussion in the present work, the absence of reactivity of the hydrogen can be explained on the basis of the lack of availability of additional bonds for reacting hydrogen owing to the completely filled d-band.
It is not possible to obtain any direct evidence from the present work concerning the manner in which the exchangeable hydrogen is held by the metal, and this must be the subject of further investigation. The experimental observations, however, do enable certain conclusions to be drawn about its properties, viz:a) The adsorption is not readily reversible, because the hydrogen in question was not removed by pumping with the ejection pump to a pressure of lower than 10 torr.b) On nickel, the exchange proceeded readily at 77°K.c) On palladium, the exchange was much slower than in thecase of nickel (see table 21 cf. tables 16 & 17). This lastfact is complementary to the observations described insection 9 .1 .d, since the exchangeable hydrogen would be comprised, in part, of the hydrogen which was taken up slowly after film deposition ceased. This confirms the view that
-230-on palladium there is some mode of* adsorption of hydrogen which is not possible on the other metals studied.
There is a rapidly growing body of evidence that chemisorption is not a simple process, and that more than one kind of chemisorption is possible. The experimental evidence which leads to this conclusion has been extensively reviewed by Bond (94), but the present state of the subject is such that no unifying concepts can be deduced from this evidence. Two possible modes of incorporation of the exchangeable hydrogen in the present work, however, may be eliminated as being unlikely:a) type C chemisorption with the d-band - this is unlikely to make a major contribution to the exchangeable hydrogen because of the limited extent to which it could occur.b) physical adsorption - because the experimental investigation has produced no evidence for this except in the case of rhodium.
It is not impossible that the exchangeable hydrogen may be accommodated by bonding to the s-band of the metal, in energy levels higher than the top of the d-band, by adsorption as atoms pre-formed in the gas phase by the action of the induction heater. Although similarly held hydrogen on gold is not exchangeable with gas phase molecular hydrogen (90), the situation may be different for nickel and palladium because of type C chemisorption as a possible intermediate. Owing
-231-to the higher potential energies of these s-levels, chemisorption with them will "be correspondingly weaker than with the d-band. Further differences in the heats of adsorption of hydrogen with the two bands may arise because of the different shapes of d- and s-orbitals which would give rise to different degrees of overlap.
It must be freely admitted that this suggestion of bonding to the s-band is purely speculative, and a decision as to its validity must await further evidence.
9.5 Summary of conclusions and future work.The major conclusions of the present work may be
summarised as follows. Enhancement of the sorption of hydrogen on nickel and palladium films has been observed when the films are deposited in the presence of the adsorbate. The extent of this sorption at low temperatures (c.77°K) is such that the conclusion that every metal atom can adsorb a hydrogen atom, given the opportunity, is substantially correct. Isotopic exchange experiments have shown that part of the adsorbed hydrogen will not exchange with gas phase molecular hydrogen. The quantity of hydrogen exhibiting this behaviour is such as to suggest that it is adsorbed by bonds to the d-band of the metal.
It is suggested that the present work might be fruitfully
continued along two main lines of investigation.
-232-(1) The technique of depositing metal films in the presence of the adsorbate could be further exploited. Valuable contribution to the ideas concerning the electronic configuration of individual atoms in metals might be made by depositing iron films in the presence of nitrogen, since adsorption may be possible only with iron atoms with a 3d7 4s1 electronic configuration (see section 9.3). The unusually high bond energy in the nitrogen molecule should prevent its dissociation into atoms in the gas phase, and the practical difficulties which arose as a result of dissociation in the case of hydrogen would be avoided.(2) Further studies could be made of the isotopic exchange between adsorbed and gas phase hydrogen on films deposited in hydrogen
a) at 77°K by an evaporation technique which did not give rise to atoms of hydrogen in the gas phase (i.e. "tungsten lead" evaporation in the case of nickel and palladium), and
b) at temperatures intermediate between 77°K and 273°K.The author considers that the application of this isotopic exchange technique in fundamental studies of chemisorption is valuable, since it yields information concerning the extent to which the adsorbed hydrogen is active in exchange. In contrast, studies of the parahydrogen conversion and deuterium equilibration reactions merely show qualitatively that there is some such active fraction. It would seem,
-233-therefore, to be of value to extend the studies to hydrogen adsorbed on conventional vacuum deposited metal films, and to other gases as adsorbates using appropriate radioactive tracer techniques. There is reasonable hope that this work would advance our knowledge of the relationship between chemisorption and catalysis.
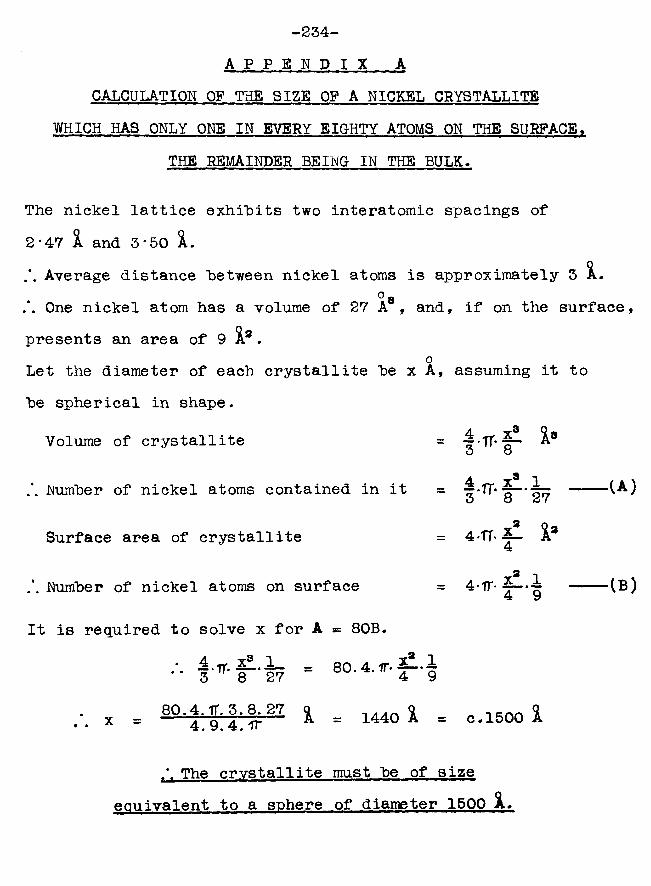
-234- A P P E N D I X A
CALCULATION OF THE SIZE OP A NICKEL CRYSTALLITEWHICH HAS ONLY ONE IN EVERY EIGHTY ATOMS ON THE SURFACE,
THE REMAINDER BEING IN THE BULK.
The nickel lattice exhibits two interatomic spacings of2*47 1 and 3*50 5LAverage distance between nickel atoms is approximately 3
°8One nickel atom has a volume of 27 A , and, if on the surface, presents an area of 9 •
oLet the diameter of each crystallite be x A, assuming it to be spherical in shape.
Volume of crystallite = o o
Number of nickel atoms contained in it = q— 27 ----
Surface area of crystallite 4.TT.S1 a4
Number of nickel atoms on surface = 4-ir- 1®)
It is required to solve x for A = 80B.♦ 4 w X® 1___ _ or\ A 3C .1'• 13 8 27 " 80^^'4: 9
x = 8 0 -4 ,9 ^ ; ^ 27 ^ = 1440 ^ = 0*1500 %
/. The crystallite must be of sizeequivalent to a sphere of diameter 1500
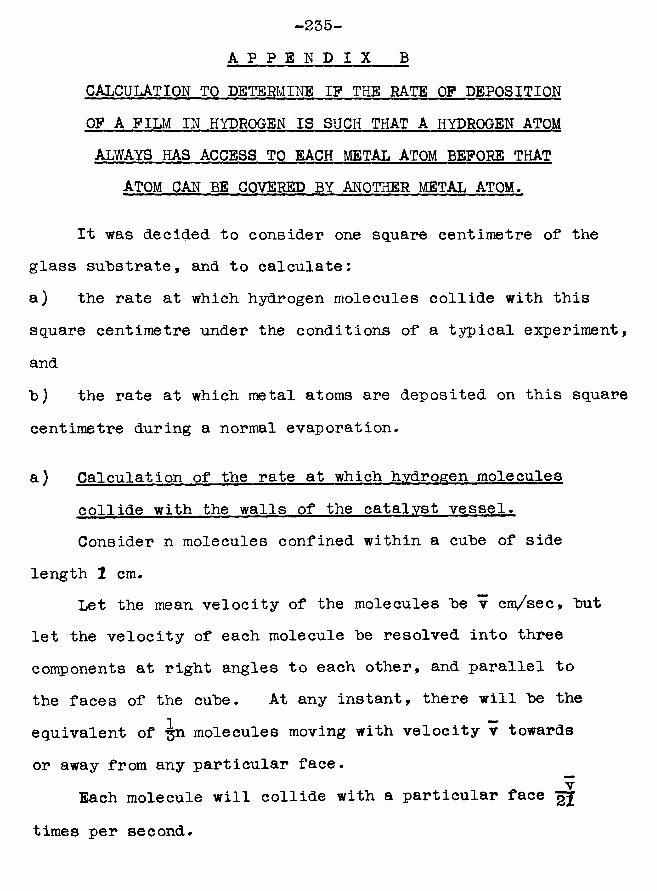
-235- A P P E N D I X B
CALCULATION TO DETERMINE IP THE RATE OP DEPOSITION OF A FILM IN HYDROGEN IS SUCH THAT A HYDROGEN ATOM ALWAYS HAS ACCESS TO EACH METAL ATOM BEFORE THAT
ATOM CAN BE COVERED BY ANOTHER METAL ATOM.
It was decided to consider one square centimetre of* the glass substrate, and to calculate:a) the rate at which hydrogen molecules collide with this square centimetre under the conditions of a typical experiment, andb) the rate at which metal atoms are deposited on this square centimetre during a normal evaporation.
a ) Calculation of the rate at which hydrogen molecules collide with the walls of the catalyst vessel.Consider n molecules confined within a cube of side
length 2 cm.Let the mean velocity of the molecules be v cm/sec, but
let the velocity of each molecule be resolved into three components at right angles to each other, and parallel to the faces of the cube. At any instant, there will be the equivalent of molecules moving with velocity v towards or away from any particular face.
vEach molecule will collide with a particular face gj
times per second.
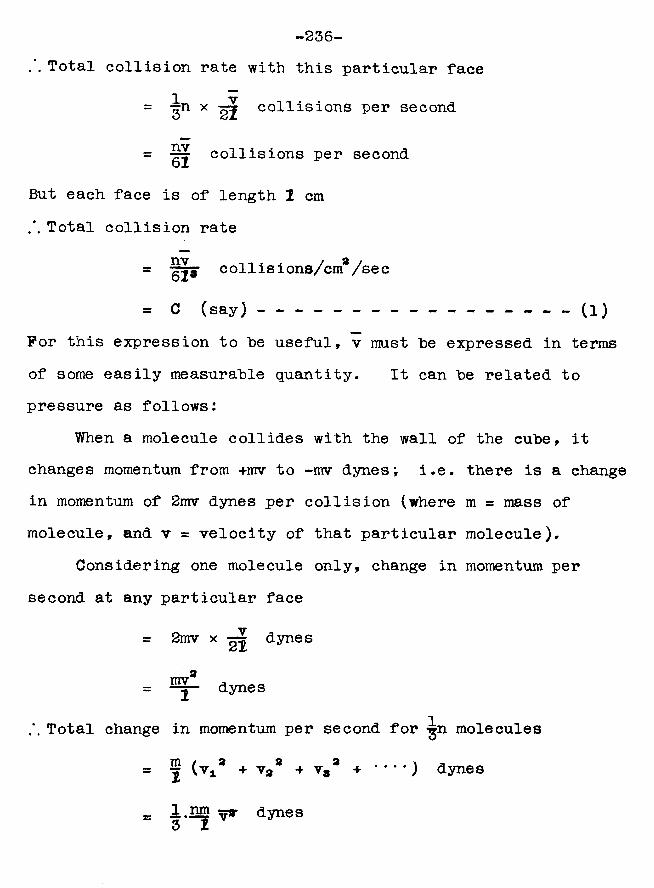
-236-. . Total collision rate with this particular face
1 v= 3n x gj collisions per second
= collisions per second
But each face is of length 2 cm Total collision rate
= collisions/cm2/sec
= C (say)--------------------------------- (l)For this expression to he useful, v must he expressed in terms of some easily measurable quantity. It can he related to pressure as follows:
When a molecule collides with the wall of the cuhe, it changes momentum from -t-mv to -mv dynes; i.e. there is a change in momentum of 2mv dynes per collision (where m = mass of molecule, and v = velocity of that particular molecule).
Considering one molecule only, change in momentum per second at any particular face
= 2mv x -gj dynes
_ , . 3
= —j- dynes
Total change in momentum per second for *̂ n molecules
= § (v±2 + va8 + v8a + --- ) dynes
- A.J22J dynes ~ 3 2 V
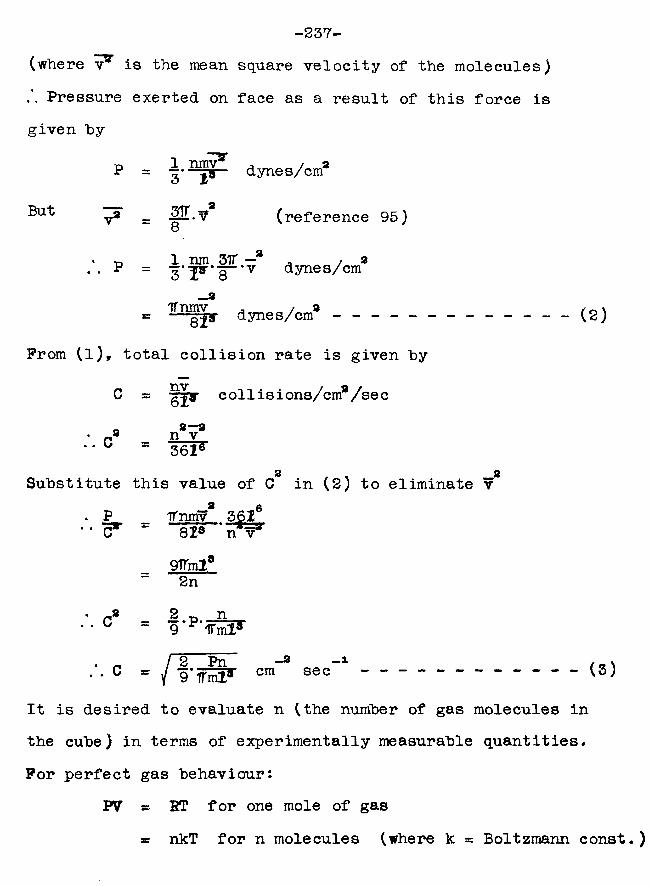
-237-(where v3* is the mean square velocity of the molecules) .. Pressure exerted on face as a result of this force is given hy
P = dynes/cm8
Bu"k (reference 95)8
P = 1 nm 31T -2— *v dynes/cm
= dynes/cma - - - - - - - - - - - - - ( 2 )
From (l)f total collision rate is given hy
C = collisions/cms/sec_ a—a• ra n v• ‘ u = 361*
2 2Substitute this value of C in (2) to eliminate v2 6. P ifnmv 362
■■Cr ‘ ~ 8 f T ' ^
9flmla2n
• n2 2 „ n.. c = 9 -P-fj3s-. - r 2 Pn -» -i• • 0 = / T f S F cm sec --------------------- (3)
It is desired to evaluate n (the number of gas molecules in the cube) in terms of experimentally measurable quantities.For perfect gas behaviour:
FV * RT for one mole of gas* nkT for n molecules (where k = Boltzmann const.)
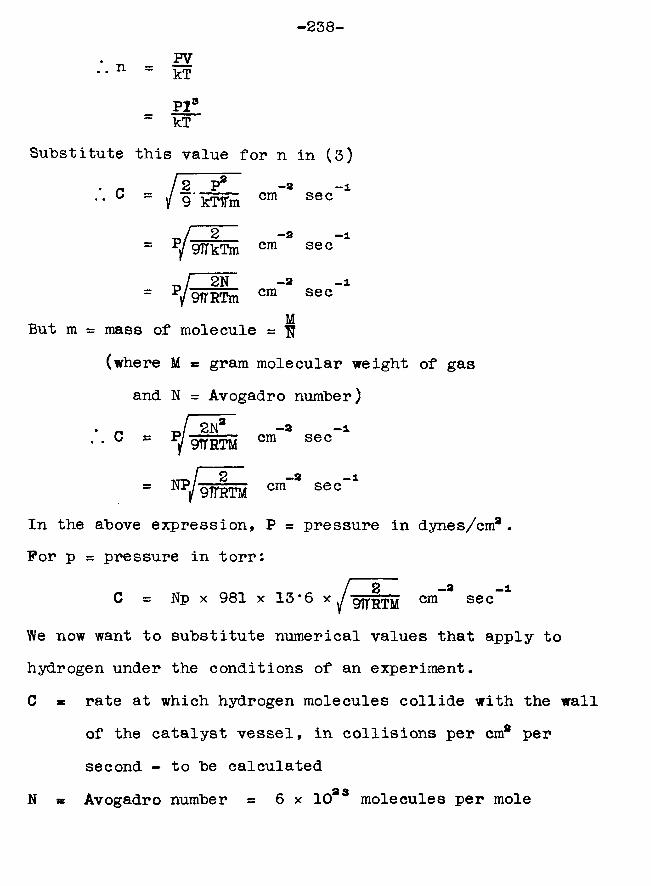
Substitute this value for n in (3)2 Pa -2 -i
c = / 9'mii ora sec
_ / 2 -2 -1 = p/g----91TkTm cm sect,/ 2 M -a -i
_ P/ 9fTKTm cm secMBut m = mass of molecule = ft
(where M » gram molecular weight of gas and N = Avogadro number)
. « J 2JN3 -2 -i• • c = J W r a i cm sec
-1= OT/ 9TTRTM cm sec
In the above expression, P = pressure in dynes/cm8 . For p = pressure in torr:
f 2 - 2 _iC sb Np x 981 x 13*6 xygffgrg cra sec
We now want to substitute numerical values that apply to hydrogen under the conditions of an experiment.C * rate at which hydrogen molecules collide with the wall
of the catalyst vessel, in collisions per cm8 per second - to be calculated
N * Avogadro number = 6 x 10²³ molecules per mole
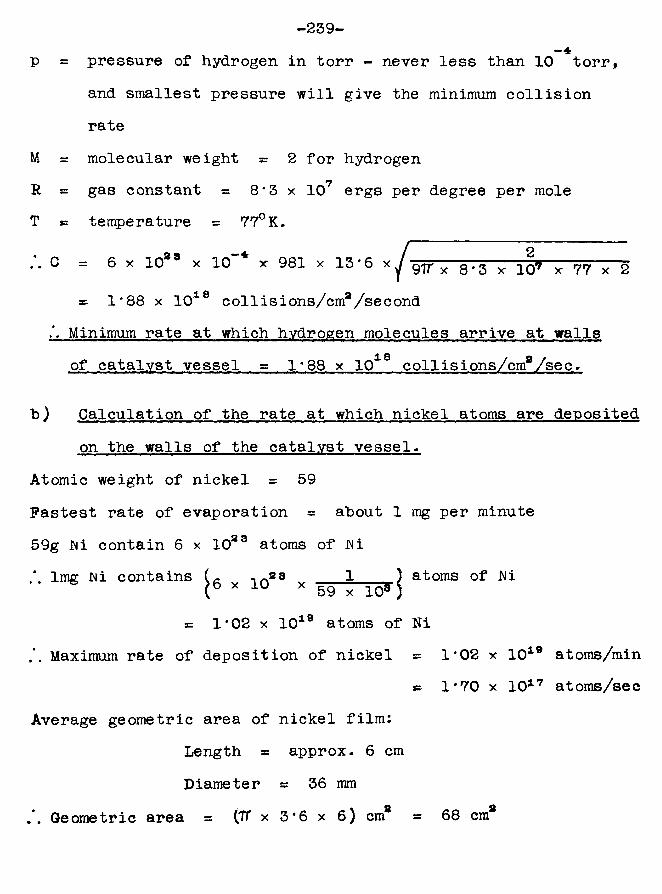
p = pressure of hydrogen in torr - never less than 10 torr, and smallest pressure will give the minimum collision rate
M s= molecular weight = 2 for hydrogenR c gas constant = 8*3 x 107 ergs per degree per moleT *= temperature = 77° K.
.. C = 6 x 1038 x 10 x 981 x 13*6 * ^ 977* x 8 *'3 x 10* x 77 x l
at 1*88 x 1018 collisions/cma/second /. Minimum rate at which hydrogen molecules arrive at walls
of catalyst vessel = 1*88 x IQ18 collisions/cm3/sec.
h) Calculation of the rate at which nickel atoms are depositedon the walls of the catalyst vessel.
Atomic weight of nickel = 59Fastest rate of evaporation = about 1 mg per minute59g 3S1 i contain 6 x 1033 atoms of iNi
Img JNi contains m 23 1 ) atoms of Ri(b * 1U x 59 x 10* )
= 1*02 x 1019 atoms of Ni, . Maximum rate of deposition of nickel = 1*02 x 1019 atoms/min
*s 1*70 x 1017 atoms/secAverage geometric area of nickel film:
Length « approx. 6 cm Diameter = 36 mm
Geometric area = (IT x 3*6 x 6) cm3 = 68 cm3
-240-/. Maximum rate of deposition of nickel
= ^ ^68 — atoms/cm8/sec1 5 o= 2*50 x 10 atoms/cm /sec
Maximum rate at which nickel atoms arrive at walls of catalyst vessel = 2*50 x 1015 collisions/cm8/sec.
These figures show that even under the most unfavourable conditions obtainable in an experiment (i.e. minimum pressure of hydrogen and maximum rate of deposition of nickel atoms) the hydrogen molecules still arrive at the walls of the catalyst vessel almost 1000 times as fast as the nickel atoms. There is therefore never any fear that the film is being deposited so fast that hydrogen atoms do not have access to each individual nickel atom before it can be covered by another metal atom.
-241- A P P E N D I X C
CALCULATION OP THE PERCENTAGE ATOMISATION OF HYDROGENCAUSED BY A NICKEL FILAMENT AT ITS EVAPORATION TEMPERATURE.
An electrically heated metal filament can cause a gas with which it is in contact to dissociate into atoms.
It has been shown (96) that the number of hydrogen atoms produced per cm8 of tungsten filament per second is given by the relationship 45000
24 R$n = 2*5 x 1 0 x p x ewhere p is the pressure of hydrogen in torr
R is the gas constantT is the temperature of the tungsten filament.
If it is assumed that a nickel filament causes the sameamount of atomisation of hydrogen as a tungsten filament atthe same temperature, the relationship can be applied tothose experiments in which a nickel filament was evaporatedin the presence of hydrogen.Diameter of nickel filament = 0*02 in *s 0*5Length of typical nickel filament = 15 cmSurface area of typical nickel filament = 2*4 cm8Temp, of evaporating nickel filament = 1800°KNumber of hydrogen atoms produced per second
45000n = 2/5 x 10*4 x p x e 8 * 1800 x 2*4
where p is the pressure of hydrogen in torr.
mm
-242-.2*In n = In (6 X 10 x p) - -45000' 2 x 1800
log n = log(6 x 10² 4 x p) - _____45000_____' 2 x 1800 x 2*303= log p + 24*7782 - 5*428= log p + 19*350
1 Q. , n = 2*24 x 10 x p. . 2*24 x 1019 x p atoms of hydrogen are produced per second.
If it is assumed that all these atoms interact with the film (area 68 cm8 - see appendix B), then collision rate of hydrogen atoms with film
* ft --- — £ at oms/ cm3 /secD O
But collision rate of hydrogen molecules with film (see appendix B)
3= 1*88 x 1033 x p molecules/cm3/secwhere p is the pressure of hydrogen in torr.
Therefore, of the total number of collisions of hydrogen with the nickel film,
(2-24 x 1019 x p . -------1_^ . look = O'0018$( 68 1-88 x 10*“ x p )
are due to hydrogen atoms, the remainder being due to molecules.This calculation has therefore shown that the effect of
an evaporating nickel filament in producing hydrogen atoms is utterly negligible under the experimental conditions considered in this thesis.
-243- A P P E N D I X D
METHOD OF CALCULATING THE AMOUNT OP GAS PHASE HYDROGENIN THE CATALYST VESSEL FROM A KNOWLEDGE OF THE AMOUNT
RECOVERED AFTER TWO SETS OP TOPLER PUMP STROKES.
Let Vcv = effective volume of catalyst vessel and associated dead-space.
Let Vtp = effective volume of Tfipler pump.After one Ttipler pump stroke:
Volume in Tttpler pump = ■ ■ -— andVtp + Vcv
volume in C.V. section = ---— Y--—Vtp + Vcv.Let r “be the fraction remaining in the catalyst vessel section after each Tfipler pump stroke.
i e r = Vcv - -Vtp + Vcvi.e. Effective volume of C.V. section = r x total volume. Let A = total amount of unadsorbed gas originally in the
C.V. section.Hence, the table on the following page can he drawn up.
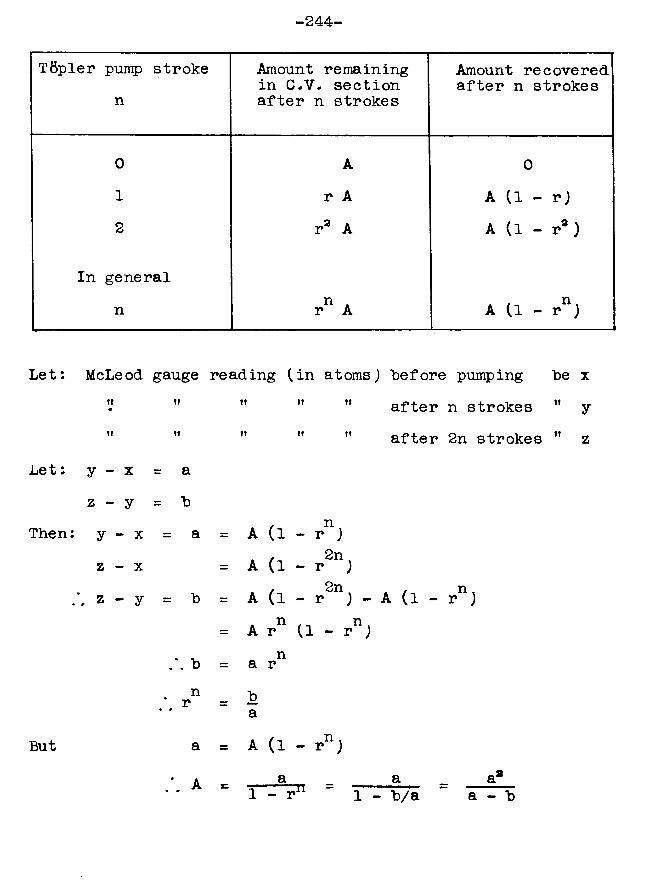
-244-
TBpler pump stroke n
Amount remaining in C.V* section after n strokes
Amount recovered after n strokes
0 A 01 r A A (1 - r)2 ra A A (1 - ra )
In general n 11 Ar A A (1 - r11)
Let: McLeod gauge reading (in atoms) Before pumping "be xff ff ft H it after n strokes " ytf If ft if tf after 2n strokes " z
Let: y - x = az - y = "b
Then: y - x = a = A (1 n- r )z - X = A (1 2n - r )z - y = h = A (1 2n- r ) - A (1 - r11)
= A nr (1 - rn )h = a nrn* r» hi. a
But a S= A (1 - r n )
A = a a a81 - r" 1 - Va a - Id
Hence A, the amount of unadsorhed gas originally in the catalyst vessel section, can "be calculated from a knowledge of three sets of McLeod gauge readings.
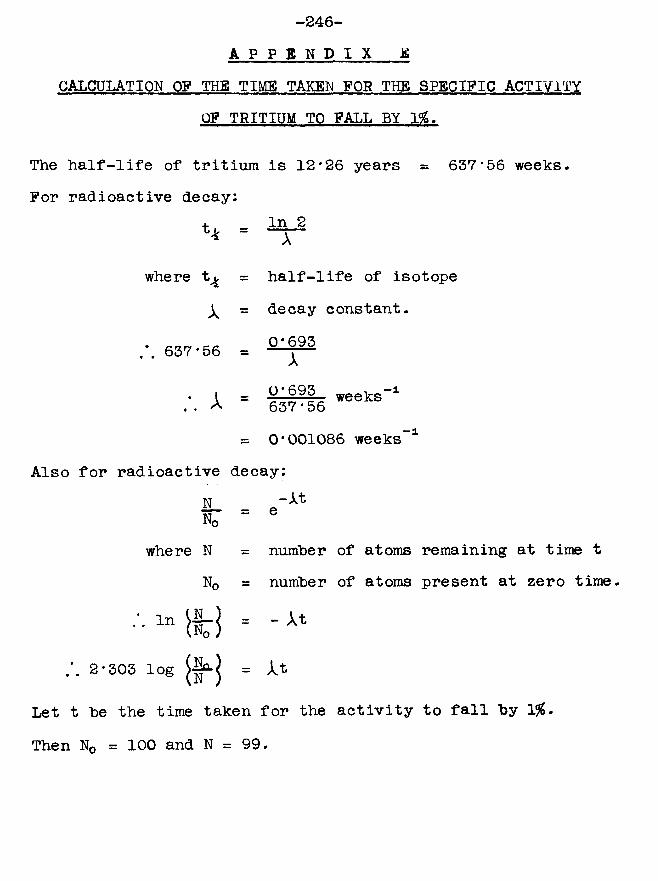
-246- A P P B N D I X B
CALCULATION OF THE TIME TAKEN FOR THE SPECIFIC ACTIVITYOF TRITIUM TO PALL BY 156.
The half-life of tritium is 12*26 years = 637*56 weeks.For radioactive decay:
In 2 Awhere tj, = half-life of isotope
\ = decay constant.0*693637*56 = A
l = weeks"1637*56 = 0 * 001086 weeks
Also for radioactive decay:
-l
NN, = e-At
where N = number of atoms remaining at time tN0 a number of atoms present at zero time.
• ' ■ M i ! ■ -**
2-303 log = At
Let t be the time taken for the activity to fall by 1%.
Then N0 = 100 and N = 99.
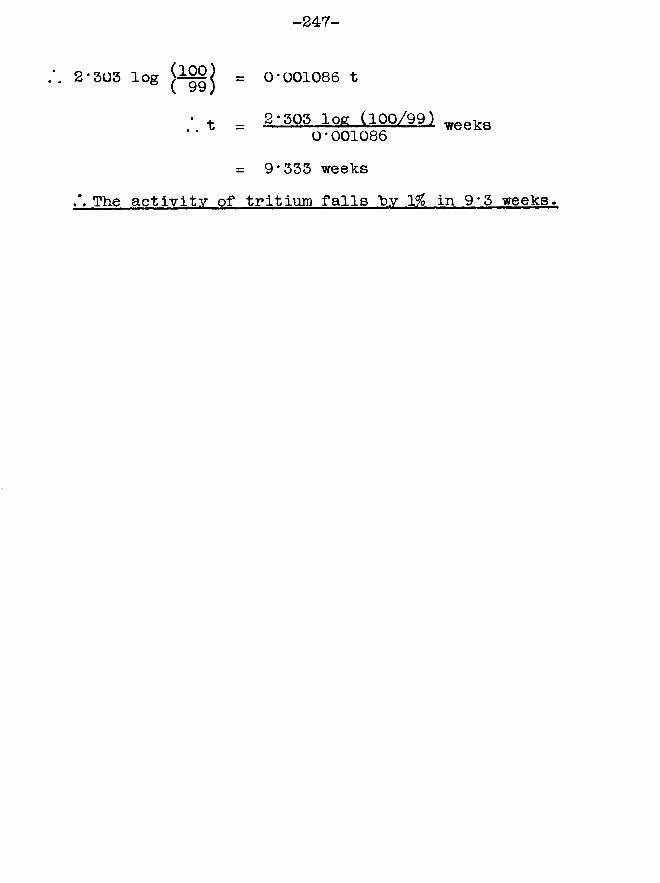
2-303 log = 0-001086 t
• t = 2-503 log ,(.10,0/99j weeks0•001086
= 9*333 weeksThe activity of tritium falls by 1% in 9*5 weeks.
-248- A P P E N D I X F
CALCULATION OF THE TEMPERATURE OF A NICKEL FILM DURING DEPOSITION WHEN SURROUNDED BY LIQUID NITROGEN.
Assumptions:(,1) All the heat from the filament is dissipated through that area of glass upon which the film is deposited. These are the worst possible conditions which could exist, andwill give the maximum temperature obtainable during deposition.^2) The thermal conductivity of Pyrex glass at temperatures near 77° K is 1*181 x 10 3cgs. Although this informationis not available in the literature, it is a valid assumptionfor the following reason:Thermal conductivity of Pyrex glass = 2*7 x 10 cgs at 2U C(manufacturers1 data on physical properties).Eucken (97) gives the following values for the thermal conductivity of a borosilicate crown glass
2*796 x 10“acgs at 0°C 2*532 x 10"3cgs at - 78°C1*181 x 10‘8cgs at -190°C.
As the value for this glass at 0°C is comparable with the value for Pyrex at 20°C, it is reasonable to assume that the thermal conductivities will also be similar at -190°C.
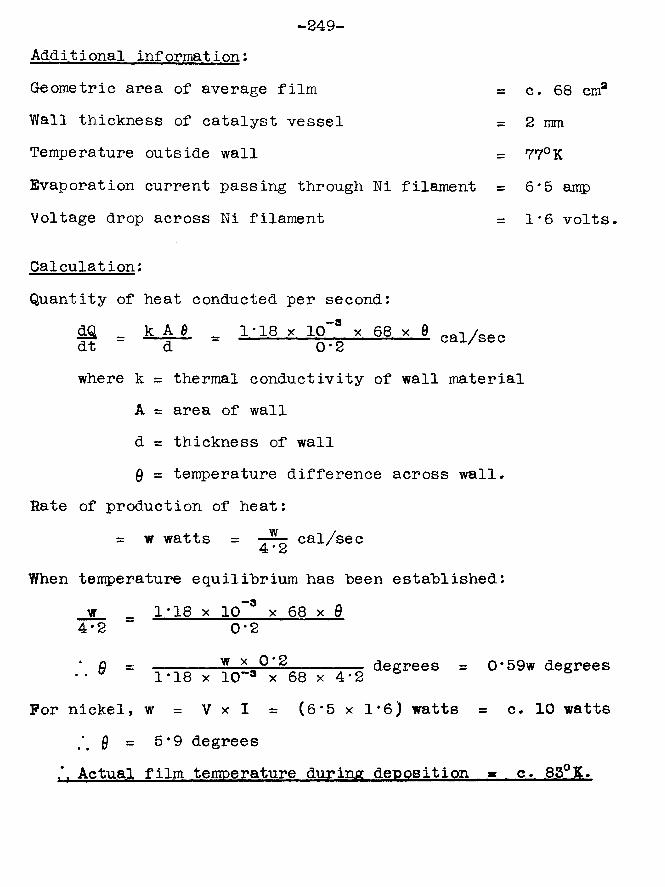
-249-Additional information:Geometric area of average film = c. 68 cm3Wall thickness of catalyst vessel = 2 mmTemperature outside wall = 77°KEvaporation current passing through Ni filament = 6*5 ampVoltage drop across Ni filament = 1*6 volts.
Calculation:Quantity of heat conducted per second:
= k A i . . i:i8. x . , m ° ^ , 68_x_e cal/secdt d 0*2where k = thermal conductivity of wall material
A = area of wall d = thickness of wall0 = temperature difference across wall.
Rate of production of heat:= w watts = cal/sec4*2
When temperature equilibrium has been established:w _ 1*18 x 10~8 x 68 x Q4*2 *" 0*2
‘ Q = y. *.Q*.Sj---- degrees = 0*59w degrees•* ° 1*18 x 10“3 x 68 x 4*2 *For nickel, w = V x l = (6*5xl*6) watts = c. 10 watts
* 0 = 5*9 degreesActual film temperature during deposition ■ c. 83°K.
-250-R E F E R E N C E S
1. Langmuir, J. Amer. Chem. Soc., 1916, 38, 2221.2. Sherman & Eyring, J. Amer. Chem. Soc., 1932, 54, 2661.3. Twigg <fc Rideal, Trans. Faraday Soc., 1940, J56, 533.4. Beeck, Smith & Wheeler, Proc. Roy. Soc., 1940, A177, 62.5. Adkins, J. Amer. Chem. Soc., 1922, 44, 2175.6. Trapnell, Advances in Catalysis, 1951, j5, 19.7. Balandin, Z. physik. Chem., 1929, B2, 289.8. Trapnell, "Chemisorption", Butterworths Scientific
Puhlications, London, 1955, p.225.9. Beeck, Faraday Soc. Discussions, 1950, 8, 118.10. Couper & Eley, Faraday Soc. Discussions, 1950, 8, 172.11. Dowden, J. Chem. Soc., 1950, 242.12. Reynolds, J. Chem. Soc., 1950, 265.13. Taylor, Proc. Roy. Soc., 1925, A108, 105.14. Taylor, J. Phys. Chem., 1926, 30, 145.15. Maxted & Morrish, J. Chem. Soc., 1941, 134.16. Yee & Emmett, Ind. Eng. Chem., 1931, 23, 1090.17. Pease & Stewart, J. Amer. Chem. Soc., 1925, 47, 1235.18. de Boer, Advances in Catalysis, 1956, 8, 107.19. Kwan, Advances in Catalysis, 1954, 6, 93.20. Herington & Rideal, Trans. Faraday Soc., 1944, 40, 505.21. Ahlesova & Roginskii, Z. physik. Chem., 1935, 174, 449.22. Beeck <!fc Ritchie, Faraday Soc. Discussions, 1950, 8, 159.
-251-23. Anderson & Baker, J. Phys. Chem., 1962, 66, 482.24. Gundry & Tompkins, Trans. Faraday Soc., 1956, 52, 1609.25. Campbell & Thomson, Trans. Faraday Soc., 1959, 55, 306.26. Cranstoun, Ph.D. Thesis, Glasgow, 1962.27. Dushman, "Vacuum Technique", Chapman & Hall, Ltd.,
London, 1955, p.267.28. Porter, Trans. Faraday Soc., 1933, 29, 702.29. Rosenberg, Rev. Sci. Instr., 1938, 9, 258.30. Klemperer, J. Sci. Instr., 1944, 21, 88.31. Rosenberg, Rev. Sci. Instr., 1939, 10, 131.32. Rayleigh, Phil. Trans., 1901, A196, 205.33. Gaede, Ann. Physik., 1913, 41, 289.34. Ellett & Zabel, Phys. Rev., 1931, 37, 1102.35. von Ubisch, Analyt. Chem., 1952, 24, 931.36. Beeck, Advances in Catalysis, 1950, 2, 151.37. Baker, Jenkins <fc Rideal, Trans. Faraday Soc., 1955, 51, 1592.38. Singleton, J. Phys. Chem., 1956, 60, 1606.39. Sachtler & Dorgelo, Bull. Soc. Chim. Belg., 1958, 67, 465.40. Anderson, Baker & Sanders, J. Catalysis, 1962, 1, 443.41. Campbell, Ph.D. Thesis, Durham, 1958.42. Klemperer & Stone, Proc. Roy. Soc., 1957, A245, 375.43. Wahba <fc Kemball, Trans. Faraday Soc., 1953, 49, 1351.44. Gomer, Faraday Soc. Discussions, 1959, .28, 23.45. Lennard-Jones, Trans. Faraday Soc., 1932, 28, 333.
-252-46. Bond, "Catalysis By Metals", Academic Press Inc.,
London, 1962, p.66.47. Crawford, Roberts & Kerriball, Trans. Faraday Soc.,
1962, 58, 1761.48. Spenadel <fc Boudart, J. Phys. Chem., 1960, 64, 204.49. Roberts, Proc. Cambridge Phil. Soc., 1938, 34, 388.50. Bredig # Allolio, Z. physik. Chem., 1927, 126, 41.51. Horiuti & Polanyi, Trans. Faraday Soc., 1934, 30, 1164.52. Farkas, Trans. Faraday Soc., 1939, J35, 906.53. Twigg & Rideal, Proc. Roy. Soc., 1939, A171, 55.54. Beeck, Rev. Mod. Physics, 1945, 17, 61.55. Wagner, Wilson, Otvos & Stevenson, J. Chem. Phys.,
1952, 20, 338.56. Markham, Wall & Laidler, J. Chem. Phys., 1952, 20, 1331.57. Bond & Sheridan, Trans. Faraday Soc., 1952, 48, 713.58. Kamen, "Radioactive Tracers in Biology", Academic Press
Inc., JMew York, 1947.59. Thomson & Walton, Trans. Faraday Soc., 1957, 53, 821.60. Eidinoff, J. Amer. Chem. Soc., 1947, 69, 2504.61. Brown <3c Grummitt, Canad. J. Chem., 1956, 34, 220.62. Cranstoun & Thomson, Trans. Faraday Soc., 1963, ,59, 2403.63. Thomson & Wishlade, Trans. Faraday Soc., 1962, 58, 1170.64. Beamish, Talanta, 1965, 12, 743.65. Yoe & Overholser, J. Amer. Chem. Soc., 1939, 61, 2058.;
1941, 63, 3224.
- 253-
66. Owen & Jones, Proc. Phys. Soc., 1937, 49, 587 dc 603.67. Lambert & Gates, Proc. Roy. Soc., 1925, A108, 456.68. Lewis, Platinum Metals Review, 1960, 4, 132.69. Uhbelohde, Proc. Roy. Soc., 1937, A159, 295.70. Worsham, Wilkinson dc Shull, J. Phys. Chem. Solids,
1957, 3, 303.71. Nace & Aston, J. Amer. Chem. Soc., 1957, 79, 3627.72. Lacher, Proc. Roy. Soc., 1937, A161, 525.73. Stephens, J. Phys. Chem., 1959, 63, 188.74. Matsuda & Nakata, J. Res. Inst. Catalysis Hokkaido,
1958, 6, 88.75. Knor & Ponec, Coll. Czech. Chem. Comm., 1963, 28, 942. .76. Bond, "Catalysis "by Metals", Academic Press Inc.,
London, 1962, p.17.
77. Harrison, Science, 1961, 134, 915.78. Mackintosh, Scientific American, 1963, 209, 110.79. Selwood, "Adsorption and Collective Paramagnetism",
Academic Press Inc., New York, 1962, p.30.80. Mott dc Jones, "The Theory of the Properties of Metals
and Alloys", Oxford University Press,1936, pp.194-200.
81. Wucher, J. Ann. Phys., Paris, 1952, 7, 317.82. Dilke, Eley & Maxted, Nature, 1948, 161, 804.83. Dowden dc Reynolds, Faraday Soc. Discussions, 1950, 8, 184.
-254-84. Trapnell, Proc. Roy. Soc., 1953, A218, 566.85. Krutter, Phys. Rev., 1935, 48, 664.86. Goos, Z. Phys., 1936, 100, 95.87. Meier, Ann. Phys., Lpz., 1910, 31, 1017.88. Ponec, Knor & Cerny, J. Catalysis, 1965, 4, 485.89. Pritchard «& Tompkins, Trans. Faraday Soc., 1960, 56, 540.90. Sachtler efc de Boer, J. Phys. Chem., 1960, 64, 1579.91. Bond, "Catalysis hy Metals", Academic Press Inc.,
London, 1962, p.69.92. de Boer, Advances in Catalysis, 1956, 63, 51.93. Dowden, "Chemisorption", edited hy Garner, Butterworths
Scientific Publications, London, 1957, p.3.94. Bond, "Catalysis hy Metals", Academic Press Inc.,
London, 1962, p.93.95. Glasstone, "Textbook of Physical Chemistry", Macmillan
<Sc Co. Ltd., London, 1956, p.253.96. Miller, "The Adsorption of Gases on Solids", Cambridge
University Press, 1949, p.66.97. Eucken, Ann. Physik., 1911, 34, 185.