Embed Size (px)
Citation preview

Adult Offenders
& Crime in Erie County
Analysis of Arrest Data from 2001-2009
George Fickenworth, Assistant Director
Ben Singletary, Graduate Assistant

I. Executive Summary
This report illustrates comparative arrest data for Erie County and other Pennsylvania urban third-class counties, as well as
select state and national figures, for the years 2001 through 2009. Urban third-class counties used in this report are
consistent with those used in previous years’, and include Berks, Dauphin, Erie, Lackawanna, Lehigh, Luzerne, and
Northampton. Adult arrests in Erie County have steadily decreased from a seven year high of 9,355 in 2005 to 7,804 in
2009. These 7,804 adult arrests in 2009 accounted for 81% of the total 9,631 arrests of that year (the remaining 19% being
juvenile arrests). The proportion of adult arrests has risen slightly from the previous year. Relative to other urban third
class counties in Pennsylvania, Erie County holds the fourth highest adult arrest rate.
Violent crime arrest data in Erie County fell sharply in 2009, after remaining stable from 2005 through 2008. Among the
third class urban counties studied, Erie County’s arrest rate per 1,000 adults 18 and over (further referred to rate per 1000)
is well below both the Pennsylvania and National rates per 1,000.
Property crime in Erie County experienced a net increase of only 50 arrests over the last year, to 1,101. This is the only
category in which arrests in Erie County increased. Between 2001 and 2009, Erie County’s property crime arrest rate has
closely followed Pennsylvania’s property crime arrest rate. In 2009, Erie County’s property crime arrests per 1,000 ended
slightly higher than that of Pennsylvania.
Overall non-index crimes in Erie County have dropped from a high of 8,170 in 2005 to 6,549 in 2009, which is the lowest
point in the measured period. While drug arrests continued their decline in 2009 for both Erie City and Erie County,
weapons charges have continued to increase in Erie City and Erie County, after a sizeable drop in 2006. Among other urban
third class counties, Erie County is rated in the middle regarding non-index crime arrests per 1000.
Notes: various tables include within this report include racial breakdown and comparisons of arrest rates. It should be
noted that both the PA unified crime report system and the US Census does not include Hispanic as a race; rather this is
categorized as ethnicity. Therefore, the tables do not include Hispanic as a subcategory, as those who identify themselves
as Hispanic are also included in the Black or White categories.
It is also imperative to reaffirm that the data pertains to arrests, not actual offenses committed. The information should
not be interpreted as implying a specific region is doing better or worse than others, or even compared to itself. Other
variables not included in this report could be used to make a more substantive comparison. The data here only illustrates
arrest data for each year.

II. Summary of 2009 Adult Arrest Data
Sections II through VI relate adult arrest data for Erie County and other Pennsylvania third-class counties identified in the
Executive Summary. Data was taken from the Pennsylvania Uniform Crime Report online query system in the summer of
2010 to compile this report. Rate per 1,000 data was calculated using the previous mentioned arrest data as well as the
latest population data available from the US census website, www.census.gov. 2009’s adult arrests are the lowest of the
nine year period studied, down from a high of 9,355 in 2005. The 7,804 adult arrests comprise 81% of the total 9,631 Erie
County arrests in 2009.
Figure 1:
Figure 1 shows total adult arrests for Erie County, Erie City, and Erie County Only (Erie County total minus Erie City total).
These areas are utilized throughout the report for comparison purposes. Erie County Only, or the Erie County Minus Erie
City total, consists of those areas outside Erie city limits. The number of adult arrests in the County Only area increased
slightly in 2009; however, the rate fell to its lowest point in both the Erie City and Erie County measures over the course of
the time periods compared.
2001 2002 2003 2004 2005 2006 2007 2008 2009
County minus City 4,86 4,73 4,51 4,96 5,085 5,210 4,619 4,895 5,035
Erie City 3,37 3,84 3,95 3,98 4,270 3,550 3,572 3,118 2,769
Erie County 8,24 8,57 8,47 8,95 9,355 8,760 8,191 8,013 7,804
-
2,500
5,000
7,500
10,000
Total Adult Arrests

Figure 2:
Figure 2 shows total adult arrests as a rate per 1,000. In 2009, the rates of Erie County, Erie City, and County minus City
areas converged near 36 arrests per 1,000. 2009’s arrest rate for both Erie County and Erie City reached its lowest point in
2009.
2001 2002 2003 2004 2005 2006 2007 2008 2009
County minus City 36.16 34.87 32.99 36.64 37.52 37.64 33.25 35.06 36.06
Erie City 43.64 49.65 51.14 51.50 55.19 46.74 47.02 41.05 36.45
Erie County 38.89 40.23 39.55 42.04 43.94 40.86 38.12 37.17 36.20
0.00
10.00
20.00
30.00
40.00
50.00
60.00
Total Adult Arrests - Rate per 1,000

Figure 3:
The state of Pennsylvania classifies Erie County as a third class urban county. Figure 3 illustrates total adult arrests in the
seven urban third class counties. Erie, Lehigh, Luzerne, and Berks Counties all saw decreases in adult arrests from 2008 to
2009. Erie County’s rank among the measured counties fell to third in terms of total arrests in 2009, with Lackawanna and
Northampton Counties reporting lower numbers of arrests.
Berks Dauphin Erie Lackawanna Lehigh Luzerne Northampton
2001 10,382 9,744 8,245 5,348 10,194 5,407 6,039
2002 11,045 10,271 8,578 5,276 9,474 8,484 6,357
2003 11,510 10,597 8,473 5,174 9,989 8,832 6,246
2004 12,564 11,301 8,950 5,442 9,631 9,535 6,230
2005 11,918 11,439 9,355 5,378 9,130 9,875 7,036
2006 12,683 12,080 8,760 6,135 8,880 10,512 7,089
2007 13,231 11,250 8,191 5,312 8,610 10,273 7,508
2008 13,775 11,709 8,013 5,857 8,632 10,692 7,487
2009 12,849 11,844 7,804 6,179 8,475 10,196 7,623
-
2,000
4,000
6,000
8,000
10,000
12,000
14,000
16,000
Total Adult Arrests, PA Third Class Counties

Figure 4:
Erie County’s adult arrest rate per 1,000 continued to decline in 2009 to its lowest point, 36.3, from a high in 2005 of 46.52,
as shown in Figure 4. Similar declines occurred in Berks, Lehigh, and Luzerne counties. Dauphin retained the highest rate
of compared counties at 60.6 arrests per 1,000, and Lehigh’s 2009 rate (32.9) claimed the lowest rate among the third class
counties compared in the analysis. Erie County’s position in this category fell to third lowest among the measured counties.
Berks Dauphin Erie County Lackawanna Lehigh Luzerne Northampton
2001 28.42 51.11 40.74 32.05 42.94 21.44 29.49
2002 29.89 53.88 42.39 31.62 39.91 33.64 31.04
2003 30.88 55.69 41.87 31.01 42.08 35.02 30.50
2004 33.71 59.28 44.23 32.61 40.57 37.81 30.42
2005 41.10 61.11 46.52 33.96 37.53 41.57 32.89
2006 41.28 62.15 40.94 36.91 34.49 42.00 31.06
2007 43.06 57.88 38.30 31.96 33.45 41.05 32.90
2008 45.00 59.90 37.30 35.28 33.51 42.87 32.81
2009 41.98 60.60 36.30 37.22 32.90 40.88 33.40
0.00
10.00
20.00
30.00
40.00
50.00
60.00
70.00
Total Adult Arrests, rate per 1,000, PA Third Class Counties

III. Summary of Adult Violent Crime Data
Figure 5:
Violent crimes are classified as homicide, robbery, rape, or aggravated assault. As shown in Figure 5, arrests for Violent
Crimes throughout Erie County and Erie City fell drastically in 2009, over 40%. Erie City accounted for exactly half of the
154 violent crimes committed in 2009. Violent Crime arrests in both Erie City and Erie County fell to their lowest point in
the nine-year study period, largely due to the 53% drop in violent crime arrests in Erie City.
2001 2002 2003 2004 2005 2006 2007 2008 2009
County minus City 67 82 90 91 123 75 83 103 77
Erie City 165 167 192 184 185 170 166 171 77
Erie County 232 249 282 275 308 245 249 274 154
0
50
100
150
200
250
300
350
Total Adult Violent Crime Arrests

Figure 6:
Figure 6 shows that Erie County’s violent crime rate is consistently lower than national and state averages, and has
remained stable except for a spike from 2003 to 2005. Erie County’s 2006 violent crime rate per 1,000 dropped to 1.14,
where it remained through 2007. After a slight increase in 2008, 2009’s violent crime rate fell to its lowest point in the nine
year period (.72). Erie City’s violent crime rate follows a similar pattern. The rate increased greatly from 2003, to 2005,
where it peaked at 2.73, before dropping to just 1.01 in 2009 (less than half of the previous low 2001’s rate of 2.13).
National violent crime rate data was unavailable for 2009 at time of publication.
2001 2002 2003 2004 2005 2006 2007 2008 2009
Erie City 2.13 2.16 2.48 2.38 2.73 2.14 2.14 2.25 1.01
Erie County 1.15 1.23 1.39 1.36 1.53 1.14 1.14 1.27 0.72
Pennsylvania 2.60 2.53 2.41 2.50 2.16 2.13 2.09 2.15 2.05
National 2.20 2.15 2.05 6.35 4.69 4.74 4.67 4.55
0.00
1.00
2.00
3.00
4.00
5.00
6.00
7.00
Violent Crime - Arrest Rate per 1000
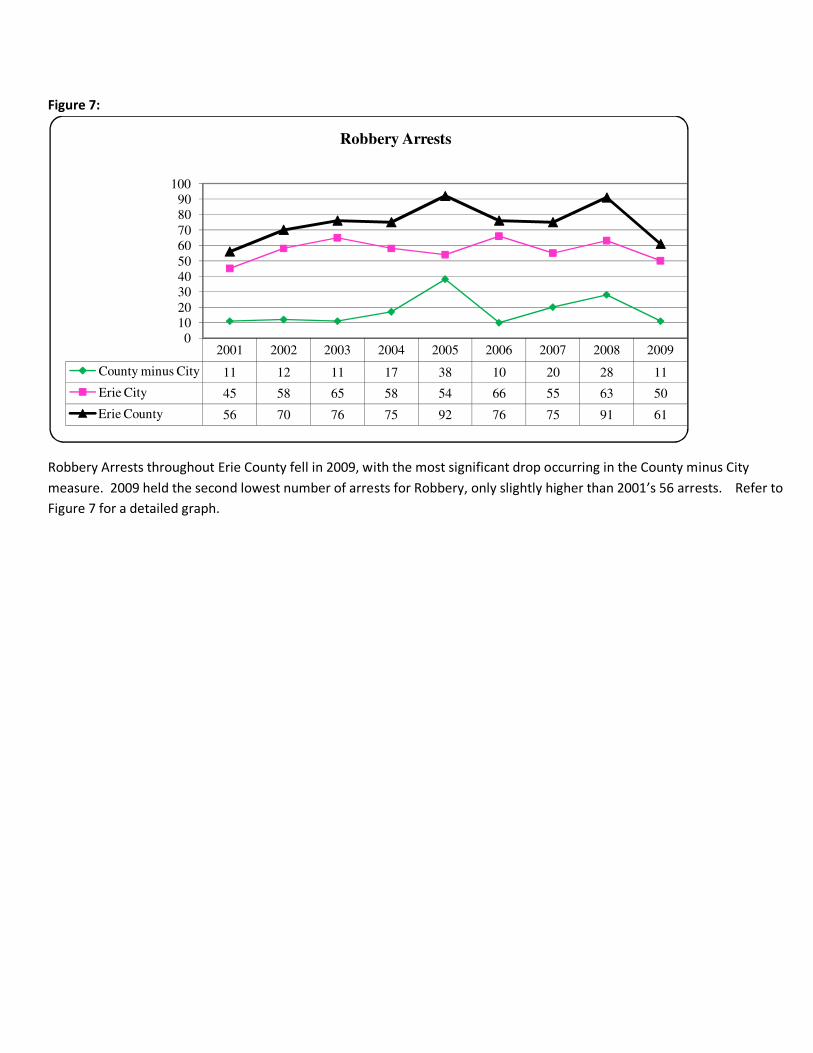
Figure 7:
Robbery Arrests throughout Erie County fell in 2009, with the most significant drop occurring in the County minus City
measure. 2009 held the second lowest number of arrests for Robbery, only slightly higher than 2001’s 56 arrests. Refer to
Figure 7 for a detailed graph.
2001 2002 2003 2004 2005 2006 2007 2008 2009
County minus City 11 12 11 17 38 10 20 28 11
Erie City 45 58 65 58 54 66 55 63 50
Erie County 56 70 76 75 92 76 75 91 61
0
10
20
30
40
50
60
70
80
90
100
Robbery Arrests

Figure 8:
After dropping from a nine year high of 14 in 2001, the number of murder/manslaughter arrests has remained relatively
stable. There were 6 murde/manslaughter arrests in Erie County in 2009, 5 of which occurred within Erie City. While the
number of murder/manslaughter arrests has fallen since 2007, 2009’s arrests remain near the nine year average of 6.9.
2001 2002 2003 2004 2005 2006 2007 2008 2009
County minus City 4 1 4 1 0 3 2 2 1
Erie City 10 4 4 5 3 2 6 5 5
Erie County 14 5 8 6 3 5 8 7 6
0
2
4
6
8
10
12
14
16
Murder / Manslaughter Arrests

Figure 9: Violent Crime Arrests, Erie County (Male vs. Female, by age)
18-20 21-29 30-39 40-49 50-59 60+
Fem
ale
s
Male
s
Fem
ale
s
Male
s
Fem
ale
s
Male
s
Fem
ale
s
Male
s
Fem
ale
s
Male
s
Fem
ale
s
Male
s
2000 # 14 77 9 71 7 59 4 21 4 8 0 2
% 5% 28% 3% 26% 3% 21% 1% 8% 1% 3% 0% 1%
2001 7 54 10 82 6 42 4 18 0 6 0 3
3% 23% 5% 35% 3% 18% 2% 8% 0% 3% 0% 1%
2002 2 59 14 84 8 41 2 27 1 4 0 7
1% 24% 6% 34% 3% 16% 1% 11% 0% 2% 0% 3%
2003 7 42 15 88 19 50 11 37 2 5 1 5
2% 15% 5% 31% 7% 18% 4% 13% 1% 2% 0% 2%
2004 9 64 17 72 17 38 5 36 2 13 0 2
3% 23% 6% 26% 6% 14% 2% 13% 1% 5% 0% 1%
2005 16 62 13 97 10 47 6 44 1 9 0 3
5% 20% 4% 31% 3% 15% 2% 14% 0% 3% 0% 1%
2006 5 52 16 72 7 50 6 29 0 8 0 0
2% 21% 7% 29% 3% 20% 2% 12% 0% 3% 0% 0%
2007 13 46 10 53 10 39 6 35 0 8 0 5
5% 18% 4% 21% 4% 16% 2% 14% 0% 3% 0% 2%
2008 6 88 15 91 6 58 7 34 2 7 0 2
2% 32% 5% 33% 2% 21% 3% 12% 1% 3% 0% 1%
2009 1 29 13 55 3 31 4 11 0 2 0 2
1% 19% 8% 36% 2% 20% 3% 7% 0% 1% 0% 1%
Figure 9 illustrates violent crime arrests in terms of age, comparing male and female arrests. As an example, in 2009, there
were 55 arrests of males aged 21-29 for violent crimes. This accounts for 36% of all violent crime arrests in 2009.
Proportionally, this age group represents the highest number of violent crime arrests, and has traditionally done so
throughout all reporting periods in this report.

Figure 10: Violent Crimes, Erie County (Male vs. Female, by race)
White Black Native Pacific
Fem
ale
s
Male
s
Fem
ale
s
Male
s
Fem
ale
s
Male
s
Fem
ale
s
Male
s
2000 # 26 144 12 93 0 0 0 1
% 9% 52% 4% 34% 0% 0% 0% 0%
2001 11 107 16 98 0 0 0 0
5% 46% 7% 42% 0% 0% 0% 0%
2002 17 127 10 94 0 0 0 1
7% 51% 4% 38% 0% 0% 0% 0%
2003 31 139 23 88 0 0 1 0
11% 49% 8% 31% 0% 0% 0% 0%
2004 26 142 24 83 0 0 0 0
9% 52% 9% 30% 0% 0% 0% 0%
2005 25 150 21 111 0 0 0 1
8% 49% 7% 36% 0% 0% 0% 0%
2006 18 137 16 69 0 0 0 5
7% 56% 7% 28% 0% 0% 0% 2%
2007 25 118 13 91 0 1 1 0
10% 47% 5% 37% 0% 0% 0% 0%
2008 23 142 14 95 0 0 0 0
8% 52% 5% 35% 0% 0% 0% 0%
2009 13 87 8 46 0 0 0 0
8% 56% 5% 30% 0% 0% 0% 0%
Figure 10 illustrates violent crime arrests broken down by sex and race. Latino-descent populations are recorded in the US
Census as either white or black, so it is not known what rates apply to this population.

Figure 11:
Figure 11 shows the number of violent crime arrests reported for urban third class counties. Arrests in Erie County fell 44%,
while 2009 arrests in other urban third class counties remained stable or increased. Only Lackawanna County had a lower
number of violent crime arrests in 2009.
Berks Dauphin Erie Lackawanna Lehigh Luzerne Northampton
2001 508 510 232 188 336 198 234
2002 535 479 249 189 339 239 186
2003 482 475 282 167 328 282 180
2004 514 502 275 155 305 350 207
2005 529 535 308 173 269 370 252
2006 568 666 245 166 287 352 247
2007 541 645 249 132 278 374 186
2008 622 582 274 124 234 350 243
0
100
200
300
400
500
600
700
Total Violent Crime Arrests, PA Third-Class Counties

Figure 12:
In 2009, as shown in Figure 12, Erie County’s arrest rate fell to the lowest position among the urban third class counties
studied, about half of its highest rate in 2005.
Berks Dauphin Erie Lackawanna Lehigh Luzerne Northampton
2001 1.39 2.68 1.15 1.13 1.42 0.83 1.14
2002 1.45 2.51 1.23 1.13 1.43 1.01 0.91
2003 1.29 2.49 1.39 1.00 1.38 1.19 0.88
2004 1.38 2.63 1.36 0.93 1.28 1.47 1.01
2005 1.82 2.85 1.53 1.09 1.11 1.56 1.18
2006 1.84 3.42 1.14 0.99 1.11 1.40 1.08
2007 1.76 3.31 1.14 0.79 1.08 1.49 0.81
2008 2.03 2.98 1.27 0.75 0.91 1.40 1.06
2009 1.96 3.31 0.72 0.82 1.02 1.56 0.87
0.00
0.50
1.00
1.50
2.00
2.50
3.00
3.50
4.00
Violent Crime Arrests - Rate per 1000, PA Third Class Counties

IV. Summary of Adult Property Crimes
Figure 13:
Figure 13 illustrates that property crimes (burglary, larceny-theft, motor vehicle theft, or arson) remained mostly stable
between 2001 and 2007, with the exception of spikes in 2004 and 2006. After 2007, however, adult property crime arrests
in both Erie County and County minus City rose to their highest levels of the nine year period, while property crime arrests
in Erie City neared their lowest point.
2001 2002 2003 2004 2005 2006 2007 2008 2009
County minus City 547 578 555 672 586 724 616 769 874
Erie City 306 302 229 380 291 311 335 282 227
Erie County 853 880 784 1052 877 1035 951 1051 1101
0
200
400
600
800
1000
1200
Total Adult Property Arrests

Figure 14:
Historically, the property crime rates of Erie City, Erie County, and Pennsylvania have followed similar trends. Notably, Erie
City’s property crime rate has fallen 29% since 2007, placing it well below both Pennsylvania’s and Erie County’s rate. Since
2007, Erie County’s rate has been similar to Pennsylvania’s. The arrest rates for property crimes in Erie City, Erie County,
and Pennsylvania have remained higher than the national average, as shown in Figure 14. 2009 National arrest rates were
not available at time of publication.
2001 2002 2003 2004 2005 2006 2007 2008 2009
Erie City 3.95 3.90 2.96 4.91 4.31 3.92 4.22 3.71 2.99
Erie County 4.22 4.35 3.87 5.20 4.36 4.83 4.44 4.89 5.12
Pennsylvania 4.29 4.18 4.21 4.42 4.64 4.43 4.60 4.96 5.00
National 5.68 5.59 5.51 3.52 3.43 3.33 3.26 3.21
0.00
1.00
2.00
3.00
4.00
5.00
6.00
Property Crime Arrests - Rate per 1,000

Figure 15:
In 2009, burglary arrests in Erie County remained unchanged from 2008, as shown in Figure 15. Though the number of
arrests throughout Erie County was stable, burglaries in Erie City fell by 50%, while burglary arrests in non city areas rose by
46%.
2001 2002 2003 2004 2005 2006 2007 2008 2009
Erie County 160 202 136 238 177 228 195 217 217
Erie City 88 96 54 116 83 90 100 105 53
County minus City 72 106 82 122 94 138 95 112 164
0
50
100
150
200
250
Burglary Arrests

Figure 16: Property Crime Arrests, Erie County (Male vs. Female, by age)
18-20 21-29 30-39 40-49 50-59 60+
Fem
ale
s
Male
s
Fem
ale
s
Male
s
Fem
ale
s
Male
s
Fem
ale
s
Male
s
Fem
ale
s
Male
s
Fem
ale
s
Male
s
2001 # 74 211 77 209 54 110 19 59 18 18 2 2
% 9% 25% 9% 25% 6% 13% 2% 7% 2% 2% 0% 0%
2002 58 303 69 188 43 96 25 68 9 13 2 6
7% 34% 8% 21% 5% 11% 3% 8% 1% 1% 0% 1%
2003 65 219 80 170 44 89 28 51 12 16 4 6
8% 28% 10% 22% 6% 11% 4% 7% 2% 2% 1% 1%
2004 106 312 96 190 61 102 44 80 8 34 10 9
10% 30% 9% 18% 6% 10% 4% 8% 1% 3% 1% 1%
2005 77 204 83 187 55 96 31 93 12 28 7 4
9% 23% 9% 21% 6% 11% 4% 11% 1% 3% 1% 0%
2006 55 166 98 218 82 114 48 92 13 35 2 12
5% 16% 9% 21% 8% 11% 5% 9% 1% 3% 0% 1%
2007 75 182 91 214 50 138 34 101 16 40 3 7
8% 19% 10% 23% 5% 15% 4% 11% 2% 4% 0% 1%
2008 106 243 117 265 58 112 40 59 11 25 8 7
10% 23% 11% 25% 6% 11% 4% 6% 1% 2% 1% 1%
2009 86 216 192 263 62 112 41 73 18 29 7 6
8% 20% 17% 24% 6% 10% 4% 7% 2% 3% 1% 1%
Figure 17: Property Crime Arrests, Erie County (Male vs. Female, by race)
White Black Native Pacific
Fem
ale
s
Male
s
Fem
ale
s
Male
s
Fem
ale
s
Male
s
Fem
ale
s
Male
s
2001 # 188 463 52 144 0 0 4 2
% 22% 54% 6% 17% 0% 0% 0% 0%
2002 142 583 63 89 0 0 1 2
16% 66% 7% 10% 0% 0% 0% 0%
2003 192 441 40 109 1 0 0 1
24% 56% 5% 14% 0% 0% 0% 0%
2004 226 569 99 154 0 1 0 3
21% 54% 9% 15% 0% 0% 0% 0%
2005 200 492 65 119 0 0 0 1
23% 56% 7% 14% 0% 0% 0% 0%
2006 245 502 61 133 1 0 1 2
24% 49% 6% 13% 0% 0% 0% 0%
2007 203 520 66 159 0 1 0 2
21% 55% 7% 17% 0% 0% 0% 0%
2008 234 598 102 111 0 0 4 2
22% 57% 10% 11% 0% 0% 0% 0%

2009 307 574 94 123 0 0 1 2
28% 52% 9% 11% 0% 0% 0% 0%
Figures 16 and 17 relate to property crimes categorized by age group and race. In Figure 16, 263 property crime arrests
were attributed to males aged 21-29. This number represents 24% of all property crime arrests in 2009. Again, males in
the 21-29 age group represents the largest proportion of arrests. 2006 was the first year in the study period in which the
absolute number of property crime arrests was not highest in the 18-20 age group. This trend continued through 2009,
when 216 arrests were attributed to males 18-20. For figure 17, Hispanics are categorized as either white or black, and so
is not included in this measure.
Figure 18:
As shown in Figure 18, Erie County ranks fifth among the studied urban third-class counties in this report. This ranking has
declined since 2007, when Erie County held the third highest number of property crime arrests.
Berks Dauphin Erie Lackawanna Lehigh Luzerne Northampton
2001 1,130 1,079 853 366 813 462 621
2002 1,334 1,024 880 470 866 697 542
2003 1,276 945 784 425 1,139 848 646
2004 1,489 1,027 1,052 477 994 973 618
2005 1,487 1,227 877 488 888 1,025 710
2006 1,469 1,300 1,035 589 837 989 844
2007 1,288 1,032 951 586 902 1,211 796
2008 1,557 1,208 1,051 677 991 1,407 847
2009 1,517 1,316 1,101 641 1,168 1,234 1,086
0
200
400
600
800
1,000
1,200
1,400
1,600
1,800
Total Property Crime Arrests, PA Third-Class Counties

Figure 19:
Figure 19 shows that Erie County holds the second highest property crime arrest rate of the urban third class counties
studied. After increasing since 2007, Erie County’s arrest rate for property crimes is approaching 2004’s peak of 5.20.
Dauphin, Lehigh, and Northampton all had similar increases, while the rates of Luzerne, Lackawanna, and Berks all declined
in 2009.
Berks Dauphin Erie Lackawanna Lehigh Luzerne Northampton
2001 3.09 5.66 4.22 2.19 3.42 1.95 3.03
2002 3.61 5.37 4.35 2.82 3.65 2.94 2.65
2003 3.42 4.96 3.87 2.55 4.80 3.57 3.15
2004 3.99 5.39 5.20 2.86 4.19 4.10 3.02
2005 5.13 6.56 4.36 3.08 3.63 4.32 3.32
2006 4.78 6.68 4.83 3.54 3.25 3.95 3.69
2007 4.19 5.30 4.44 3.22 3.50 4.83 3.48
2008 5.09 6.18 4.89 4.08 3.85 5.64 3.71
0.00
1.00
2.00
3.00
4.00
5.00
6.00
7.00
8.00
Property Crimes - Rate per 1,000, PA Third Class Counties

V. Non-Index Crimes
Figure 20:
Illustrated in Figure 20, non-index crime arrests (i.e. drug use, simple assault, etc.) fell in both Erie County and Erie City, and
increased slightly for the second consecutive year in County minus City areas. In Erie City and Erie County, 2009 marked the
nine-year low non-index arrests.
2001 2002 2003 2004 2005 2006 2007 2008 2009
County minus City 4,254 4,076 3,871 4,202 4,376 4,411 3,920 4,023 4,084
Erie City 2,906 3,373 3,536 3,421 3,794 3,069 3,071 2,665 2,465
Erie County 7,160 7,449 7,407 7,623 8,170 7,480 6,991 6,688 6,549
0
1,000
2,000
3,000
4,000
5,000
6,000
7,000
8,000
9,000
Non Index Crime Arrests

Figure 21:
After the arrest rates for non-index crimes in both Erie County and Erie City peaked in 2005, they have fallen steadily,
converging on the average for all of Pennsylvania in 2009. Erie City’s rate has experienced the most dramatic decline,
falling 42% between 2009 and 2005 (32.5 from 56.21), as shown in Figure 21.
2001 2002 2003 2004 2005 2006 2007 2008 2009
Erie City 37.56 43.59 45.70 44.21 56.18 55.66 38.75 35.08 32.45
Erie County 35.38 36.81 36.60 37.67 40.63 34.96 32.67 31.11 30.47
Pennsylvania 17.87 18.24 18.07 18.86 32.62 32.44 33.09 33.39 32.35
0.00
10.00
20.00
30.00
40.00
50.00
60.00
Non Index Crime Arrestss - Rate per 1,000

Figure 22: Non-Index Crime Arrests, Erie County (Male vs. Female, by age)
18-20 21-29 30-39 40-49 50-59 60+
Fem
ale
s
Male
s
Fem
ale
s
Male
s
Fem
ale
s
Male
s
Fem
ale
s
Male
s
Fem
ale
s
Male
s
Fem
ale
s
Male
s
2000 # 397 1624 387 1,761 409 1,305 236 803 76 355 17 112
% 5% 22% 5% 24% 5% 17% 3% 11% 1% 5% 0% 1%
2001 419 1380 395 1,622 383 1,394 217 835 83 291 28 113
6% 19% 6% 23% 5% 19% 3% 12% 1% 4% 0% 2%
2002 343 1375 459 1,945 339 1,335 204 919 90 310 22 108
5% 18% 6% 26% 5% 18% 3% 12% 1% 4% 0% 1%
2003 341 1298 504 1,967 394 1,227 243 905 86 303 18 121
5% 18% 7% 27% 5% 17% 3% 12% 1% 4% 0% 2%
2004 383 1326 504 1,888 393 1,163 302 1,039 79 385 21 140
5% 17% 7% 25% 5% 15% 4% 14% 1% 5% 0% 2%
2005 427 1530 528 2054 444 1222 309 1026 76 429 20 105
5% 19% 6% 25% 5% 15% 4% 13% 1% 5% 2 1%
2006 471 1333 576 1938 416 1114 286 911 61 339 21 104
6% 18% 8% 26% 6% 15% 4% 12% 1% 5% 0% 1%
2007 377 1045 512 1794 408 1113 264 889 85 376 23 105
5% 15% 7% 26% 6% 16% 4% 13% 1% 5% 0% 2%
2008 344 960 419 1428 350 827 227 647 64 336 19 105
5% 14% 6% 21% 5% 12% 3% 10% 1% 5% 0% 2%
2009 355 875 400 1355 351 729 222 729 69 352 24 85
5% 13% 6% 21% 5% 11% 3% 11% 1% 5% 0% 1%
Figure 23: Non-Index Crime Arrests, Erie County (Male vs. Female, by race)
White Black Native Pacific
Fem
ale
s
Male
s
Fem
ale
s
Male
s
Fem
ale
s
Male
s
Fem
ale
s
Male
s
2001 # 1260 4,405 264 1,205 0 3 1 22
% 18% 62% 4% 17% 0% 0% 0% 0%
2002 1158 4,686 293 1,286 0 3 6 17
16% 63% 4% 17% 0% 0% 0% 0%
2003 1208 4,400 375 1,407 0 2 3 12
16% 59% 5% 19% 0% 0% 0% 0%
2004 1320 4,601 352 1,322 0 1 10 17
17% 60% 5% 17% 0% 0% 0% 0%
2005 1384 4701 416 1639 1 8 3 18
17% 58% 5% 20% 0% 0% 0% 0%
2006 1446 4417 378 1303 3 6 4 13
19% 59% 5% 17% 0% 0% 0% 0%
2007 1303 4017 358 1285 3 3 5 17

19% 57% 5% 18% 0% 0% 0% 0%
2008 1065 3325 258 966 0 1 0 10
16% 50% 4% 14% 0% 0% 0% 0%
2009 1116 3290 201 827 1 2 3 6
17% 50% 3% 13% 0% 0% 0% 0%
Figures 22 and 23 illustrate non-index crime arrests categorized by age and race. The tables relate both absolute numbers,
and the number of arrests as a percentage of total non-index arrests. In 2009, males aged 18-20 accounted for 875 non-
index arrests, representing 13% of all non-index arrests committed that year. Throughout the study period, the age group
accounting for the largest number of non-index arrests in absolute terms is 21-29, for both males and females.
Proportionally, the 18-20 age group accounts for the largest number of non-index arrests, as it is the smallest overall group.
Figure 24:
Weapons charges in Erie County and Erie City continued to increase in 2009, rising 23% and 41%, respectively to their
highest points in the compared nine year period. Weapons charges in the County minus City category have remained
steady since their peak in 2005, as shown in Figure 24.
2001 2002 2003 2004 2005 2006 2007 2008 2009
County minus City 9 9 8 11 16 12 11 13 12
Erie City 13 12 7 11 26 5 14 22 31
Erie County 22 21 15 22 42 17 25 35 43
0
5
10
15
20
25
30
35
40
45
50
Weapons charges

Figure 25:
Drug arrests in Erie County continued to decrease in 2009 to their lowest point of 371, from 2006’s high of 751. The
sharpest decrease came in Erie City, which fell 61% from 2008 to 2009. This data is shown in Figure 25.
Figure 26:
2001 2002 2003 2004 2005 2006 2007 2008 2009
County minus City 292 416 291 313 352 452 238 285 308
Erie City 175 186 239 214 390 299 256 162 63
Erie County 467 602 530 527 742 751 594 447 371
0
100
200
300
400
500
600
700
800
Drug Arrests
2001 2002 2003 2004 2005 2006 2007 2008 2009
County minus
City735 620 675 804 807 762 732 755 842
Erie City 262 291 222 169 173 144 184 187 197
Erie County 997 911 897 973 980 906 916 942 1,039
0
200
400
600
800
1,000
1,200
DUI Arrests

As shown in Figure 26, DUI arrests have been steady in Erie County during the first seven years of the study period, but
increased to their highest point in 2009. Most of these recent arrests occurred outside of Erie City, where DUI arrests have
remained stable since 2007, and increased only slightly in 2009.
Figure 27:
Erie County ranked fifth in overall Non-index arrests in 2009, with 6,549. Erie County falls behind Berks, Dauphin, Lehigh,
and Luzerne counties in non-index crime arrests. These totals fell slightly in every county studied in 2009, with the largest
drop in Berks County (7.5%), who also had the highest overall number of non-index crimes, as shown in Figure 27.
Berks Dauphin Erie Lackawanna Lehigh Luzerne Northampton
2001 8,744 8,155 7,160 4,794 9,045 4,747 5,184
2002 9,176 8,768 7,449 4,617 8,269 7,548 5,629
2003 9,752 9,177 7,407 4,582 8,522 7,702 5,420
2004 10,561 9,772 7,623 4,810 8,332 8,212 5,405
2005 9,902 9,672 8,170 4,717 7,978 8,480 6,074
2006 10,646 10,114 7,480 5,380 7,756 9,171 5,545
2007 11,402 9,573 6,991 4,644 7,430 8,688 5,685
2008 11,596 9,919 6,688 5,056 7,407 8,935 6,397
0
2,000
4,000
6,000
8,000
10,000
12,000
14,000
Non Index Crime Arrests, PA Third Class Counties

Figure 28:
Of the seven counties studied in 2009, Erie ranked in the middle, shown in Figure 28. Erie County currently rates behind
Berks, Dauphin, and Luzerne Counties. Every county compared saw decreases in non-index crime arrest rates in 2009, the
largest occurring in Berks County (7.5%). The highest overall non-index crime rate occurs consistently in Dauphin County.
Dauphin County’s rate in 2009 was 50.57. Lehigh had the lowest rate in 2009, with 27.34.
Berks Dauphin Erie Lackawanna Lehigh Luzerne Northampton
2001 23.94 42.78 35.38 28.73 38.10 20.00 25.31
2002 24.83 45.99 36.81 27.67 34.83 31.79 27.49
2003 26.16 48.14 36.60 27.46 35.90 32.44 26.46
2004 28.33 51.26 37.67 28.83 35.10 34.59 26.39
2005 34.15 51.67 40.63 29.79 32.80 35.70 28.39
0.00
10.00
20.00
30.00
40.00
50.00
60.00
Non Index Crime Arrests - Rate per 1,000, PA Third Class Counties

References
Pennsylvania Uniform Crime Report Online Query Stem.
Retrieved May 31, 2010. http://ucr.psp.state.pa.us/UCR/ComMain.asp