Embed Size (px)
Citation preview

Adv. Makhosini S. Msibi, CEO: RTMC
Date: Tuesday, 4th February 2014
1
Overview
Introduction
Road Traffic Environmental Scan
Crash Statistics for 2011 / 2012
Road Safety Interventions – Brief Overview • National Rolling Enforcement Plan
• Operation Tshwara Setagwa
• Weigh Bridge overview
• Scholar patrols
• Participatory Educational Techniques
• National School Debate Competition
• Professional Driving Programme
• Junior Traffic Training Centres
• “Get There – No Regrets Campaign
2
Road Safety Interventions: Continue: • National Traffic Anti Corruption Unit
• National Traffic Police (NTP)
• 365 Days Road Safety Programmes
• Name and Shame Campaign
• Operation Juggernaut
• Driver Wellness Campaign
• International Road Assessment Programme
• Crash Information Management System
• Traffic Training Academy – Proposed
• National Road Traffic Law Enforcement Code (NRTLEC)
Limitation and Gaps - Negative impact on delivery of Mandate
3
Tuesday , 4th Februray 2014
Time 10hoo – 13h.00
“ to provide a detailed report on safer roads” :
• Report on safer roads
• Profle of all provinces
• Provincial weigh-bridges
4

Road safety is every bodies responsibility
What we seek to do:
• Change driver behavioural patterns
• Road safety education to the people
• In calcate responsible behaviour on the roads
• Moblize and coordinate public and private partnerhips
Signatories to UN Decade of action :
5
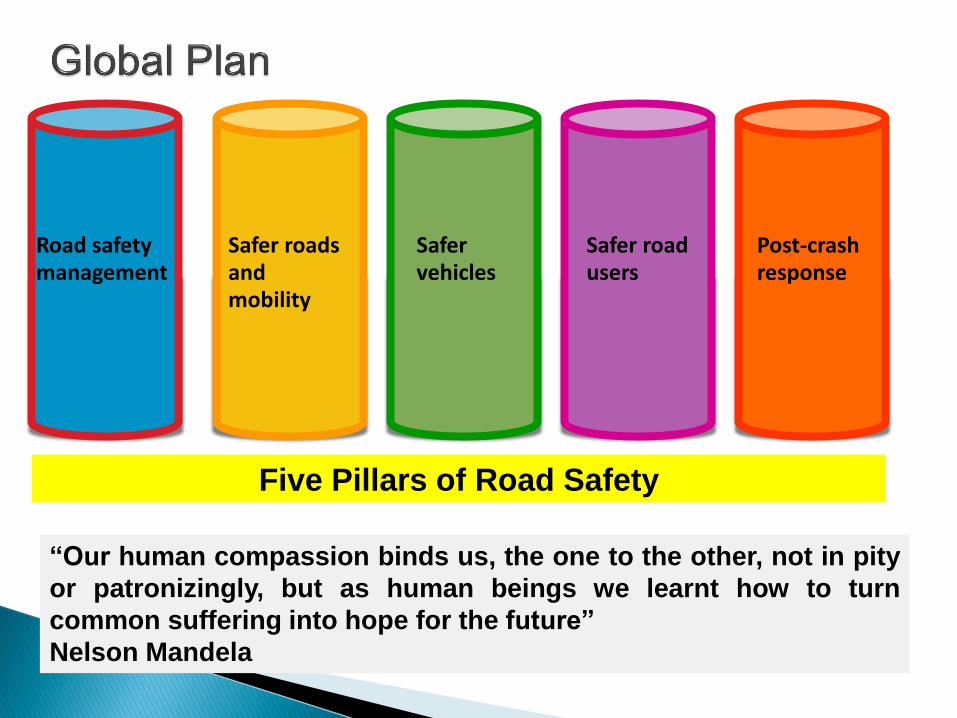
Five Pillars of Road Safety
Road safety management
Safer roads and mobility
Safer vehicles
Safer road users
Post-crash response
“Our human compassion binds us, the one to the other, not in pity
or patronizingly, but as human beings we learnt how to turn
common suffering into hope for the future”
Nelson Mandela

World-wide, over 1.3 million people die and up to 50 million are injured
annually.
Approximately 14 000 people die on South African roads annually with
more than 140 000 being injured.
The cost of crashes to the South African economy, according to the World
Health Organization formula (WHO) is estimated at R307 billion rand per
annum.
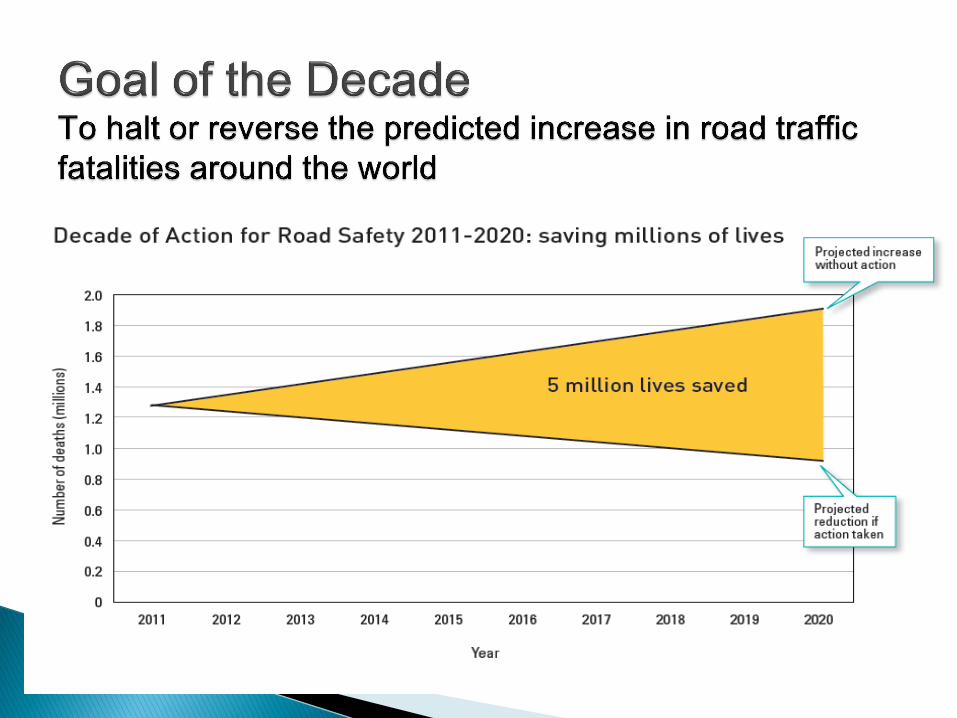
South Africa is a member of the Decade of Action (DOA): 2011-2020 which
aims to halve road crash fatalities by 2020.
The Road Traffic Management Corporation is an agency of the Department
of Transport mandated to provide for cooperative and co-ordinated strategic
planning, regulation, facilitation and law enforcement in respect of road
traffic matters across the three tiers of government.
8
Part 1
Road Traffic Environmental Scan
9
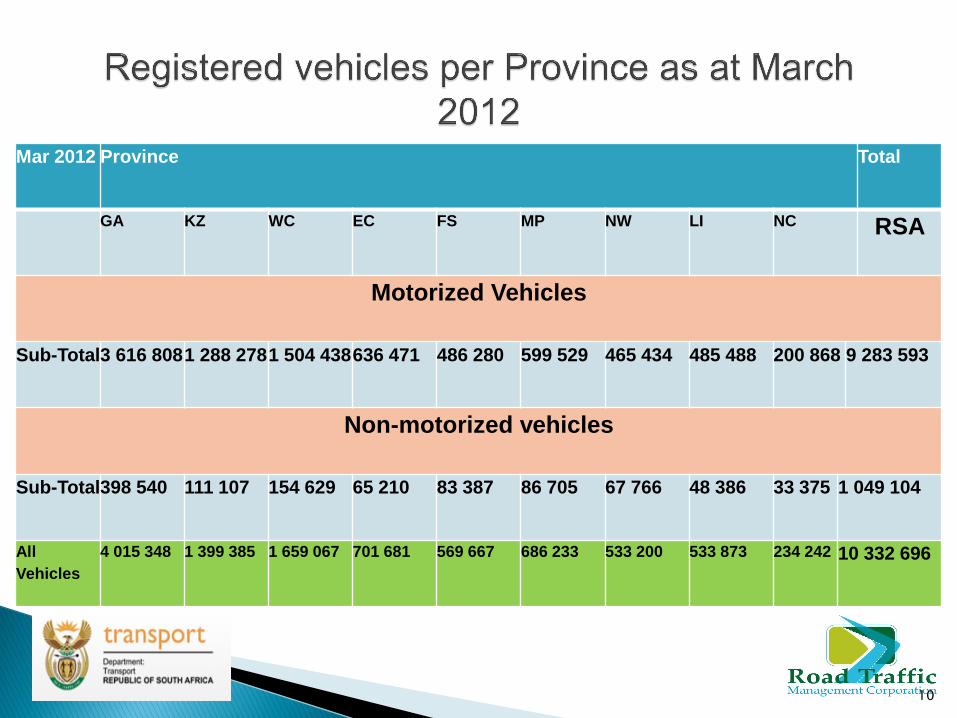
Mar 2012 Province Total
GA KZ WC EC FS MP NW LI NC RSA
Motorized Vehicles
Sub-Total 3 616 808 1 288 278 1 504 438 636 471 486 280 599 529 465 434 485 488 200 868 9 283 593
Non-motorized vehicles
Sub-Total 398 540 111 107 154 629 65 210 83 387 86 705 67 766 48 386 33 375 1 049 104
All
Vehicles
4 015 348 1 399 385 1 659 067 701 681 569 667 686 233 533 200 533 873 234 242 10 332 696
10
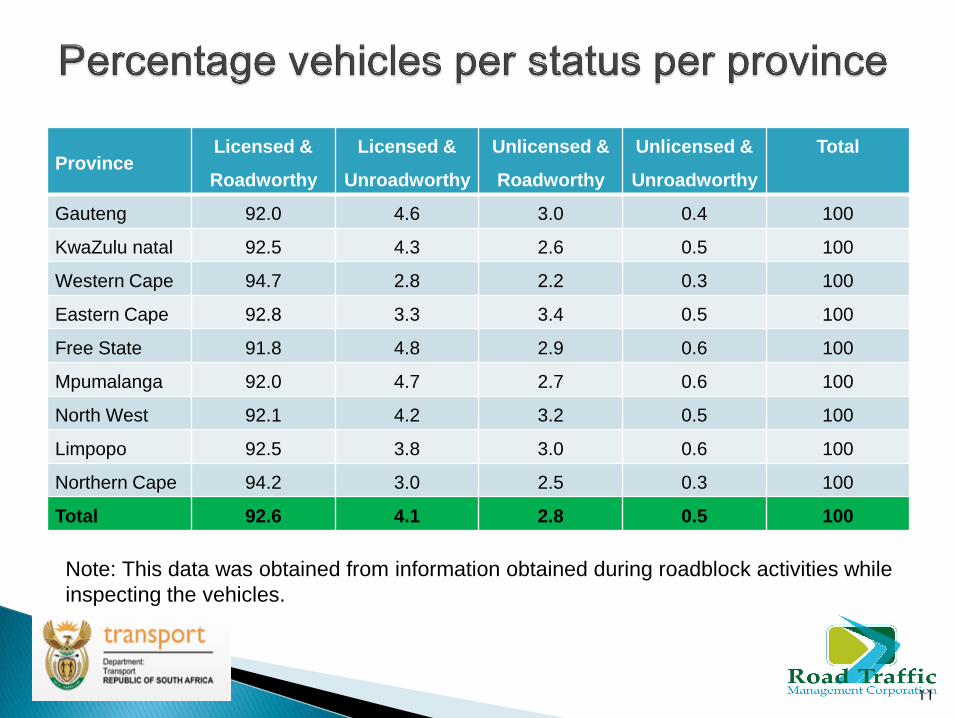
Province Licensed &
Roadworthy
Licensed &
Unroadworthy
Unlicensed &
Roadworthy
Unlicensed &
Unroadworthy
Total
Gauteng 92.0 4.6 3.0 0.4 100
KwaZulu natal 92.5 4.3 2.6 0.5 100
Western Cape 94.7 2.8 2.2 0.3 100
Eastern Cape 92.8 3.3 3.4 0.5 100
Free State 91.8 4.8 2.9 0.6 100
Mpumalanga 92.0 4.7 2.7 0.6 100
North West 92.1 4.2 3.2 0.5 100
Limpopo 92.5 3.8 3.0 0.6 100
Northern Cape 94.2 3.0 2.5 0.3 100
Total 92.6 4.1 2.8 0.5 100
11
Note: This data was obtained from information obtained during roadblock activities while
inspecting the vehicles.
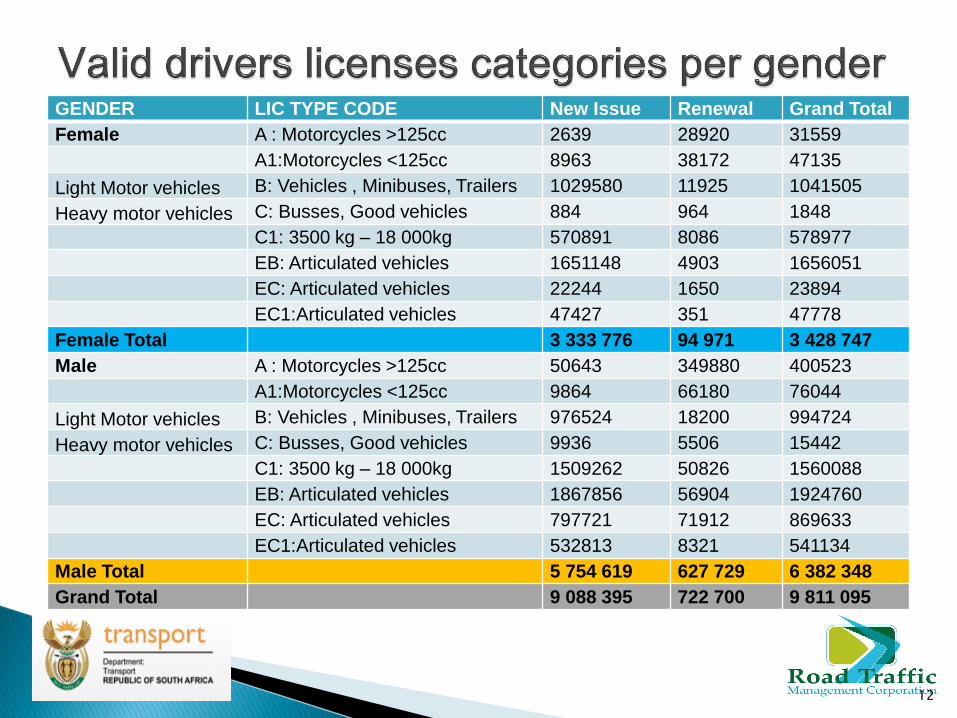
GENDER LIC TYPE CODE New Issue Renewal Grand Total
Female A : Motorcycles >125cc 2639 28920 31559
A1:Motorcycles <125cc 8963 38172 47135
Light Motor vehicles B: Vehicles , Minibuses, Trailers 1029580 11925 1041505
Heavy motor vehicles C: Busses, Good vehicles 884 964 1848
C1: 3500 kg – 18 000kg 570891 8086 578977
EB: Articulated vehicles 1651148 4903 1656051
EC: Articulated vehicles 22244 1650 23894
EC1:Articulated vehicles 47427 351 47778
Female Total 3 333 776 94 971 3 428 747
Male A : Motorcycles >125cc 50643 349880 400523
A1:Motorcycles <125cc 9864 66180 76044
Light Motor vehicles B: Vehicles , Minibuses, Trailers 976524 18200 994724
Heavy motor vehicles C: Busses, Good vehicles 9936 5506 15442
C1: 3500 kg – 18 000kg 1509262 50826 1560088
EB: Articulated vehicles 1867856 56904 1924760
EC: Articulated vehicles 797721 71912 869633
EC1:Articulated vehicles 532813 8321 541134
Male Total 5 754 619 627 729 6 382 348
Grand Total 9 088 395 722 700 9 811 095
12
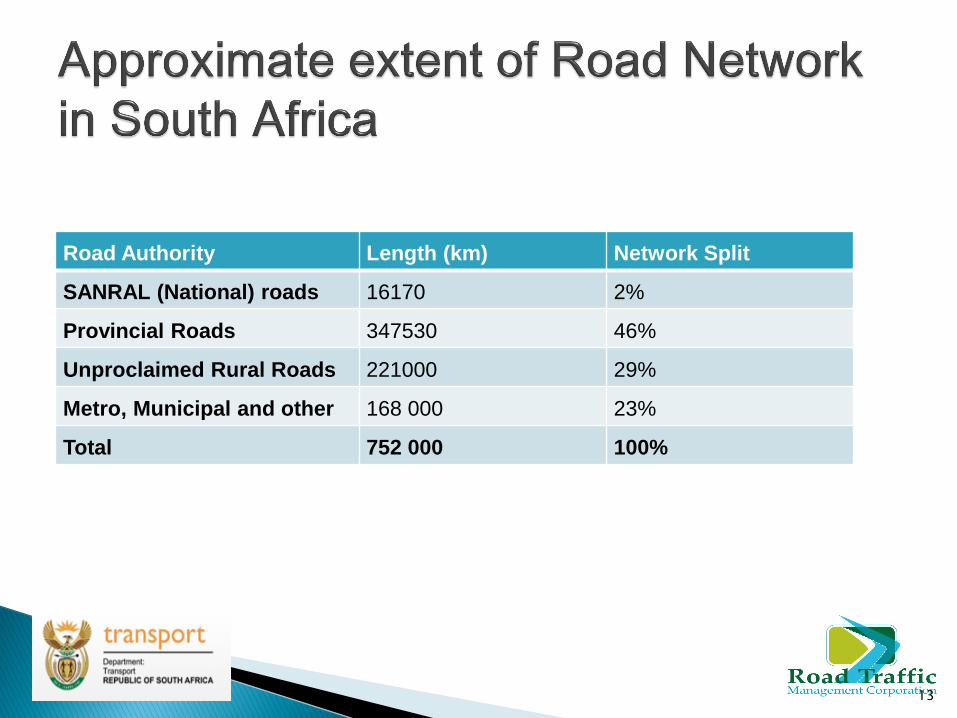
Road Authority Length (km) Network Split
SANRAL (National) roads 16170 2%
Provincial Roads 347530 46%
Unproclaimed Rural Roads 221000 29%
Metro, Municipal and other 168 000 23%
Total 752 000 100%
13

Description Total length (km)
Dual carriageway-tarred 3728
4-Lane Undivided-tarred 1490
2-Lane single-tarred 76846
2-Lane single gravel 284800
Total rural road network 366 872
Total Urban road network 168 000
Total road network (proclaimed) 535 000
14
15
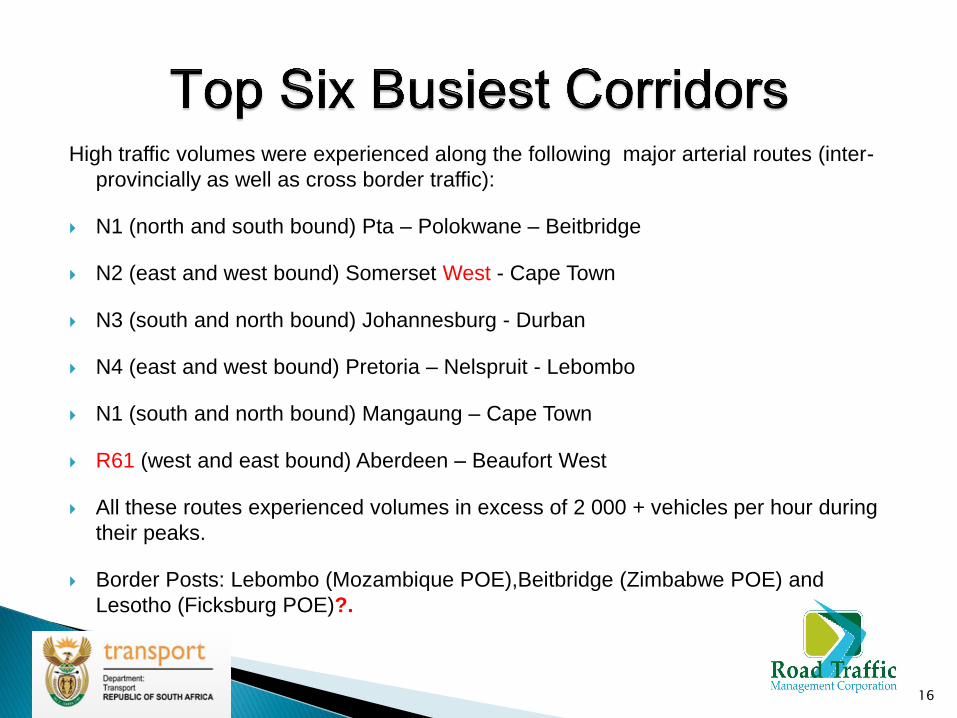
High traffic volumes were experienced along the following major arterial routes (inter-
provincially as well as cross border traffic):
N1 (north and south bound) Pta – Polokwane – Beitbridge
N2 (east and west bound) Somerset West - Cape Town
N3 (south and north bound) Johannesburg - Durban
N4 (east and west bound) Pretoria – Nelspruit - Lebombo
N1 (south and north bound) Mangaung – Cape Town
R61 (west and east bound) Aberdeen – Beaufort West
All these routes experienced volumes in excess of 2 000 + vehicles per hour during
their peaks.
Border Posts: Lebombo (Mozambique POE),Beitbridge (Zimbabwe POE) and
Lesotho (Ficksburg POE)?.
16
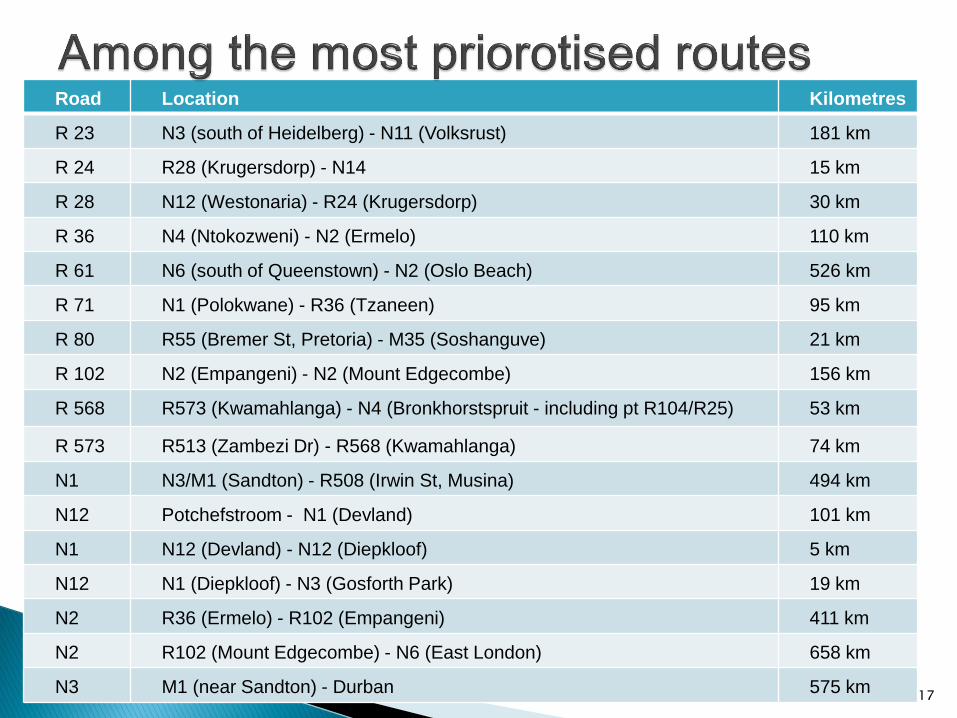
Road Location Kilometres
R 23 N3 (south of Heidelberg) - N11 (Volksrust) 181 km
R 24 R28 (Krugersdorp) - N14 15 km
R 28 N12 (Westonaria) - R24 (Krugersdorp) 30 km
R 36 N4 (Ntokozweni) - N2 (Ermelo) 110 km
R 61 N6 (south of Queenstown) - N2 (Oslo Beach) 526 km
R 71 N1 (Polokwane) - R36 (Tzaneen) 95 km
R 80 R55 (Bremer St, Pretoria) - M35 (Soshanguve) 21 km
R 102 N2 (Empangeni) - N2 (Mount Edgecombe) 156 km
R 568 R573 (Kwamahlanga) - N4 (Bronkhorstspruit - including pt R104/R25) 53 km
R 573 R513 (Zambezi Dr) - R568 (Kwamahlanga) 74 km
N1 N3/M1 (Sandton) - R508 (Irwin St, Musina) 494 km
N12 Potchefstroom - N1 (Devland) 101 km
N1 N12 (Devland) - N12 (Diepkloof) 5 km
N12 N1 (Diepkloof) - N3 (Gosforth Park) 19 km
N2 R36 (Ermelo) - R102 (Empangeni) 411 km
N2 R102 (Mount Edgecombe) - N6 (East London) 658 km
N3 M1 (near Sandton) - Durban 575 km 17
Part 2
Crash Statistics for 2011 / 2012
18
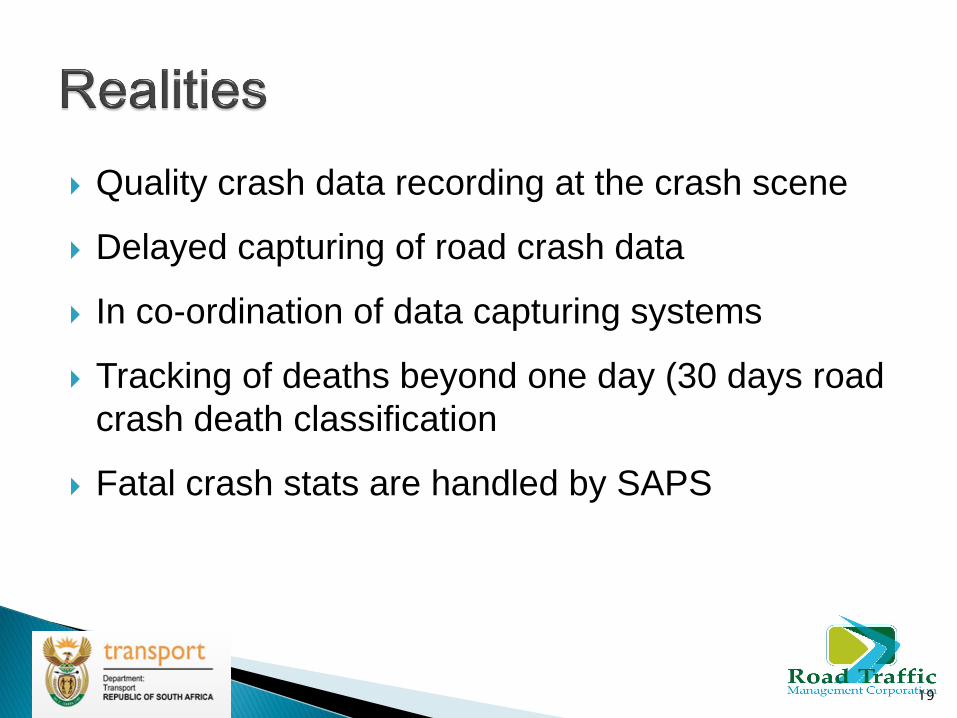
Quality crash data recording at the crash scene
Delayed capturing of road crash data
In co-ordination of data capturing systems
Tracking of deaths beyond one day (30 days road
crash death classification
Fatal crash stats are handled by SAPS
19
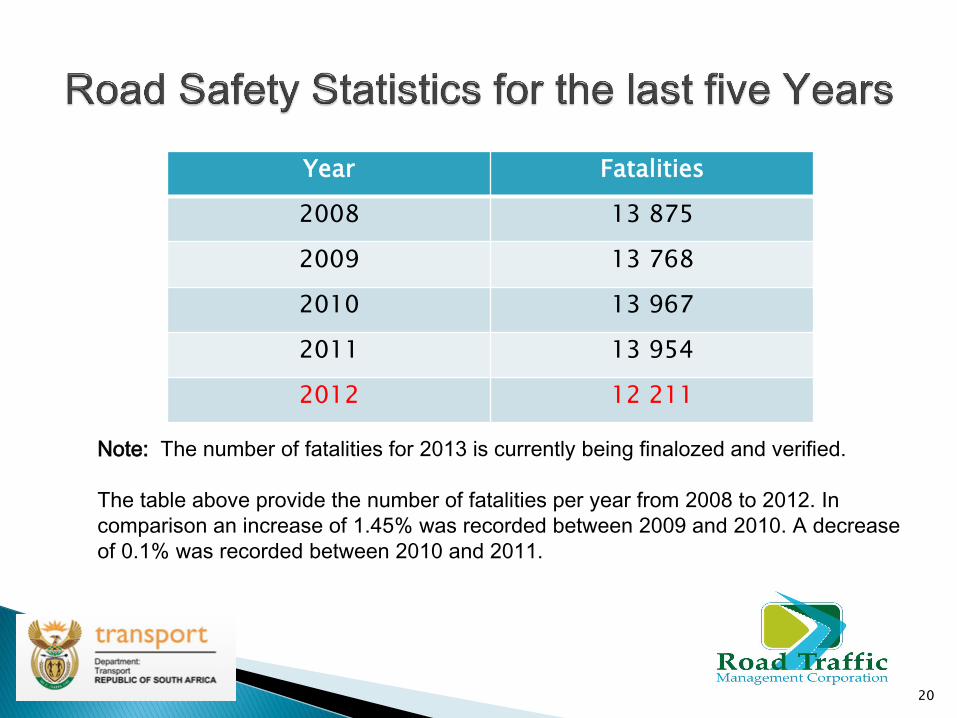
Note: The number of fatalities for 2013 is currently being finalozed and verified.
The table above provide the number of fatalities per year from 2008 to 2012. In
comparison an increase of 1.45% was recorded between 2009 and 2010. A decrease
of 0.1% was recorded between 2010 and 2011.
Year Fatalities
2008 13 875
2009 13 768
2010 13 967
2011 13 954
2012 12 211
20
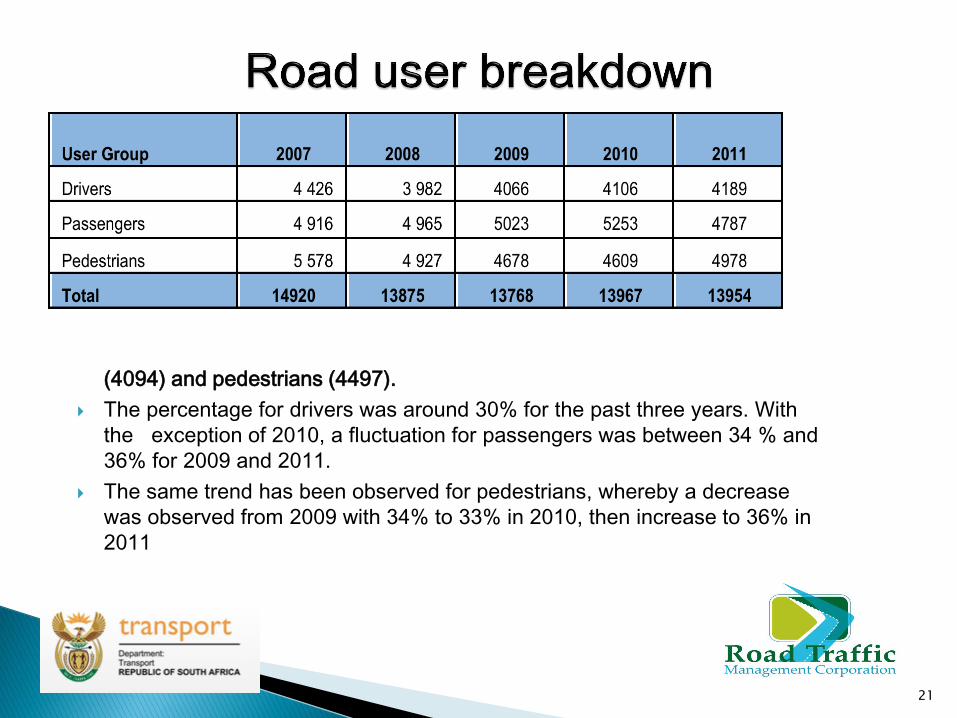
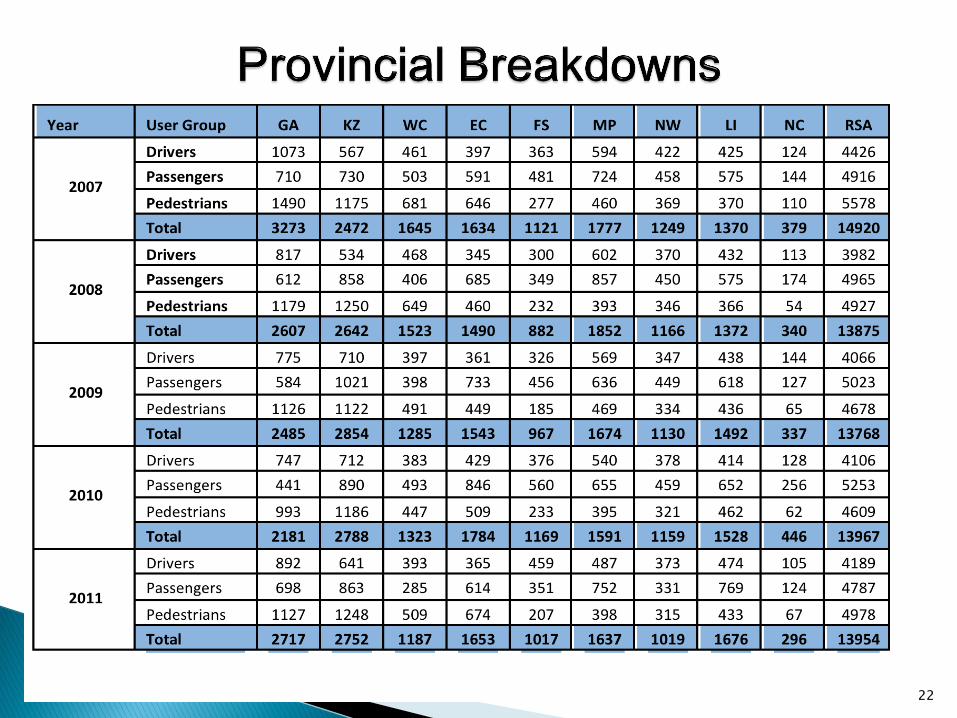
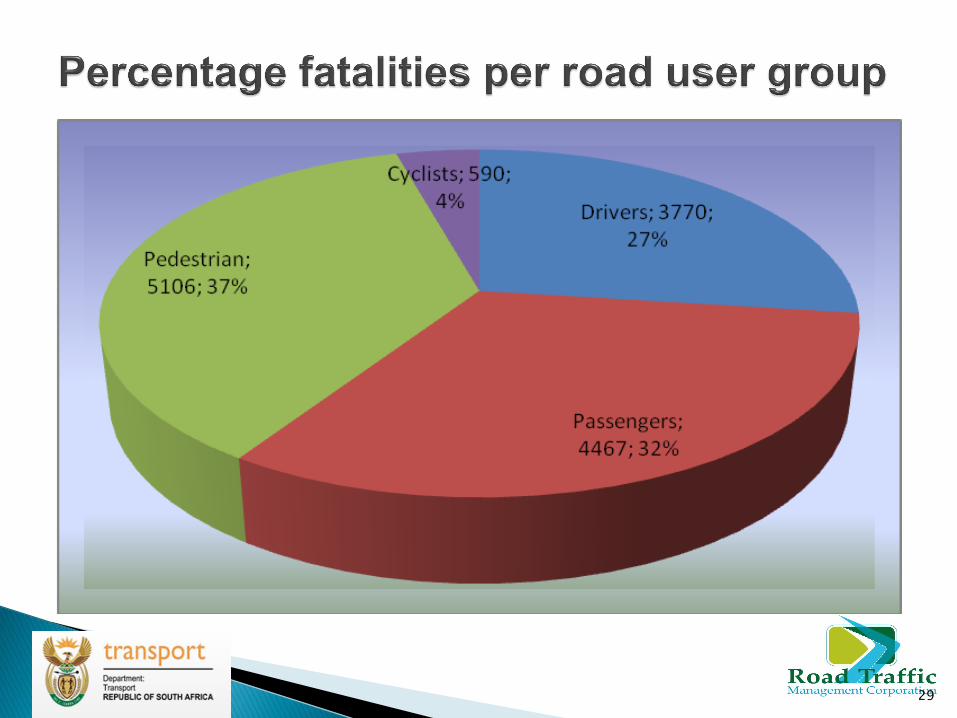
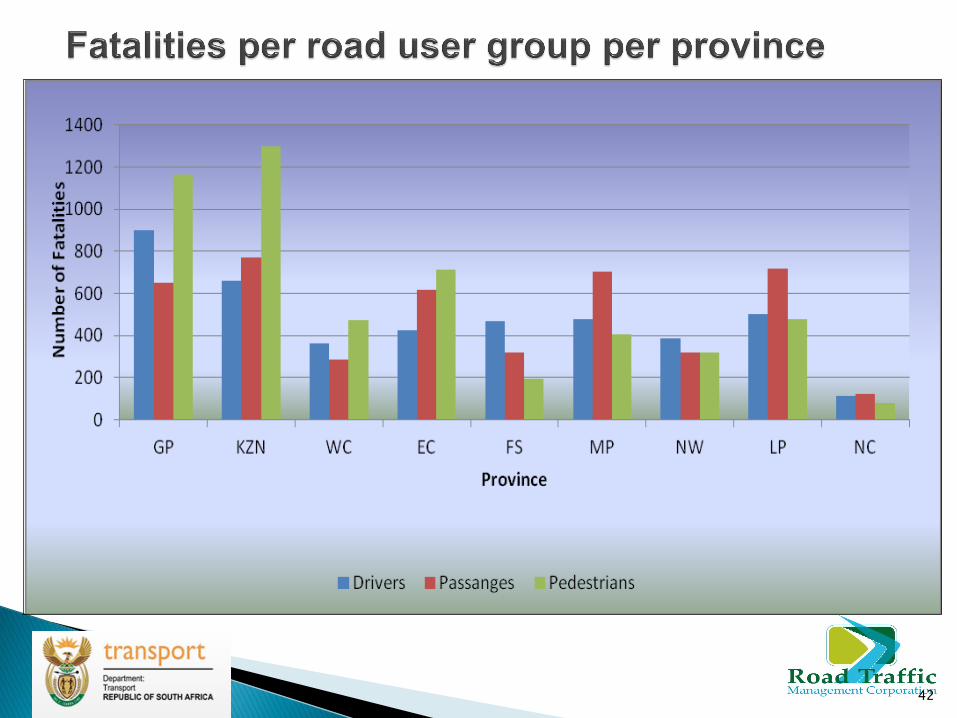
Preliminary for 2012: Total – 12 211 made up of drivers (3620), passengers
(4094) and pedestrians (4497).
The percentage for drivers was around 30% for the past three years. With
the exception of 2010, a fluctuation for passengers was between 34 % and
36% for 2009 and 2011.
The same trend has been observed for pedestrians, whereby a decrease
was observed from 2009 with 34% to 33% in 2010, then increase to 36% in
2011
21
22
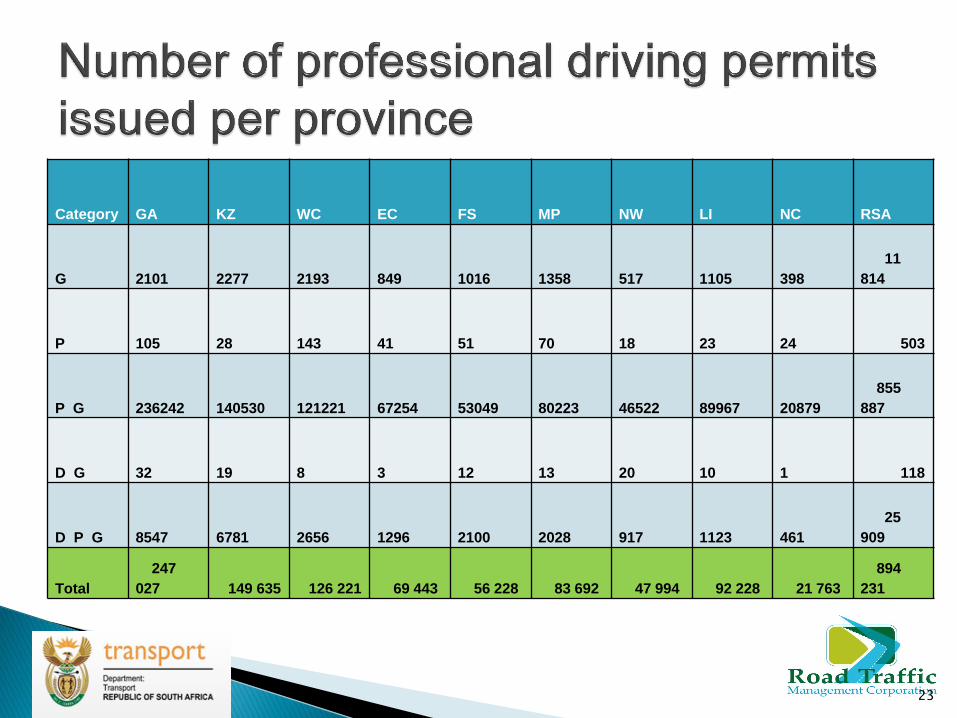
Category GA KZ WC EC FS MP NW LI NC RSA
G 2101 2277 2193 849 1016 1358 517 1105 398
11
814
P 105 28 143 41 51 70 18 23 24 503
P G 236242 140530 121221 67254 53049 80223 46522 89967 20879
855
887
D G 32 19 8 3 12 13 20 10 1 118
D P G 8547 6781 2656 1296 2100 2028 917 1123 461
25
909
Total
247
027 149 635 126 221 69 443 56 228 83 692 47 994 92 228 21 763
894
231
23
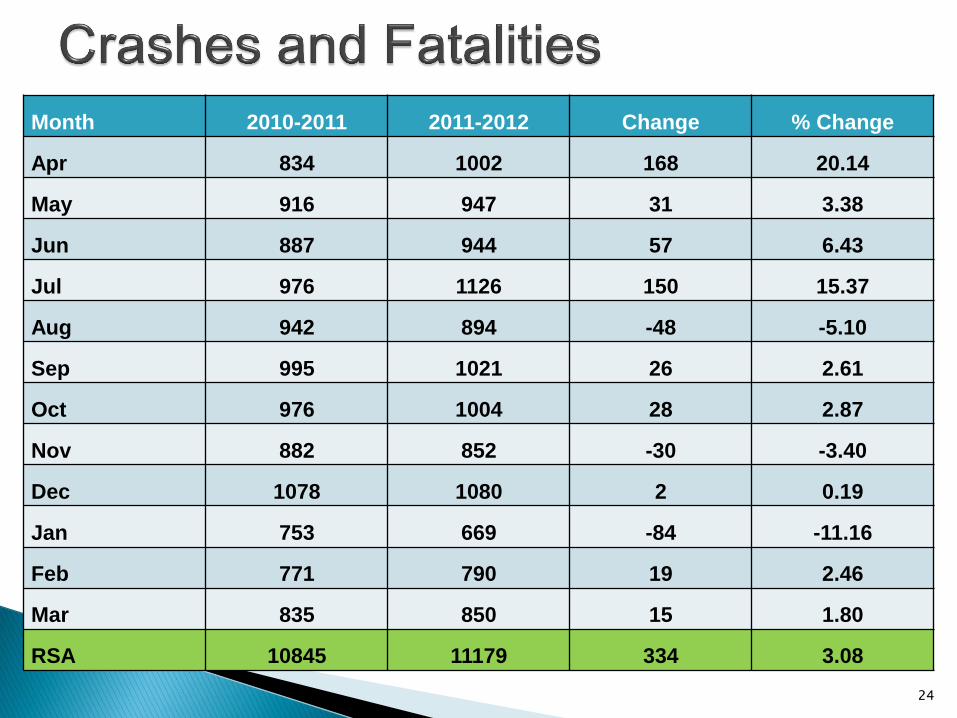
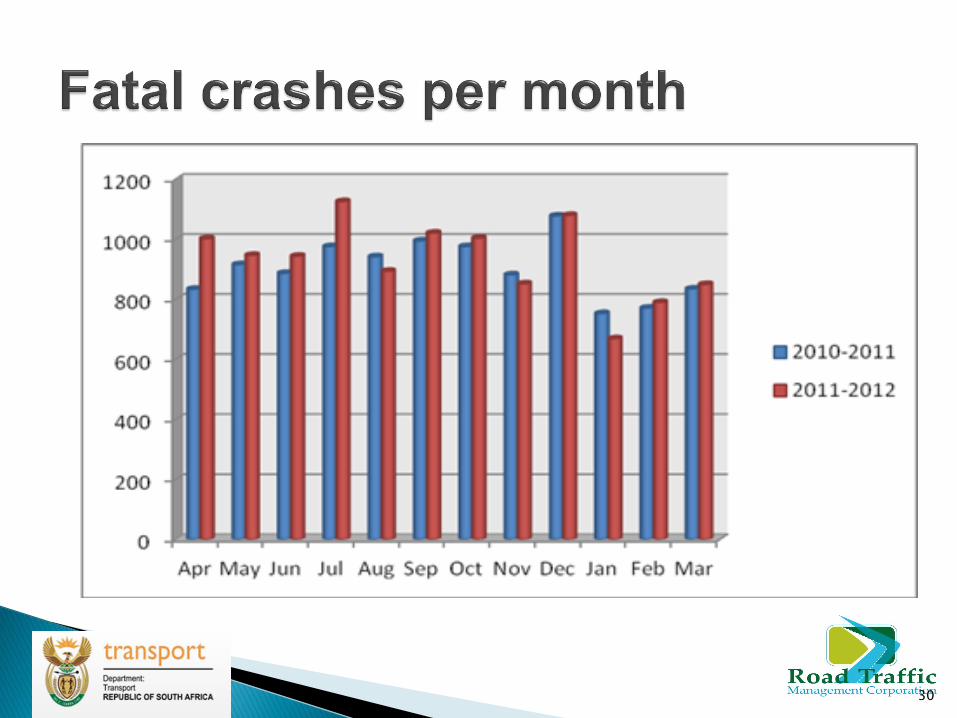
Month 2010-2011 2011-2012 Change % Change
Apr 834 1002 168 20.14
May 916 947 31 3.38
Jun 887 944 57 6.43
Jul 976 1126 150 15.37
Aug 942 894 -48 -5.10
Sep 995 1021 26 2.61
Oct 976 1004 28 2.87
Nov 882 852 -30 -3.40
Dec 1078 1080 2 0.19
Jan 753 669 -84 -11.16
Feb 771 790 19 2.46
Mar 835 850 15 1.80
RSA 10845 11179 334 3.08
24
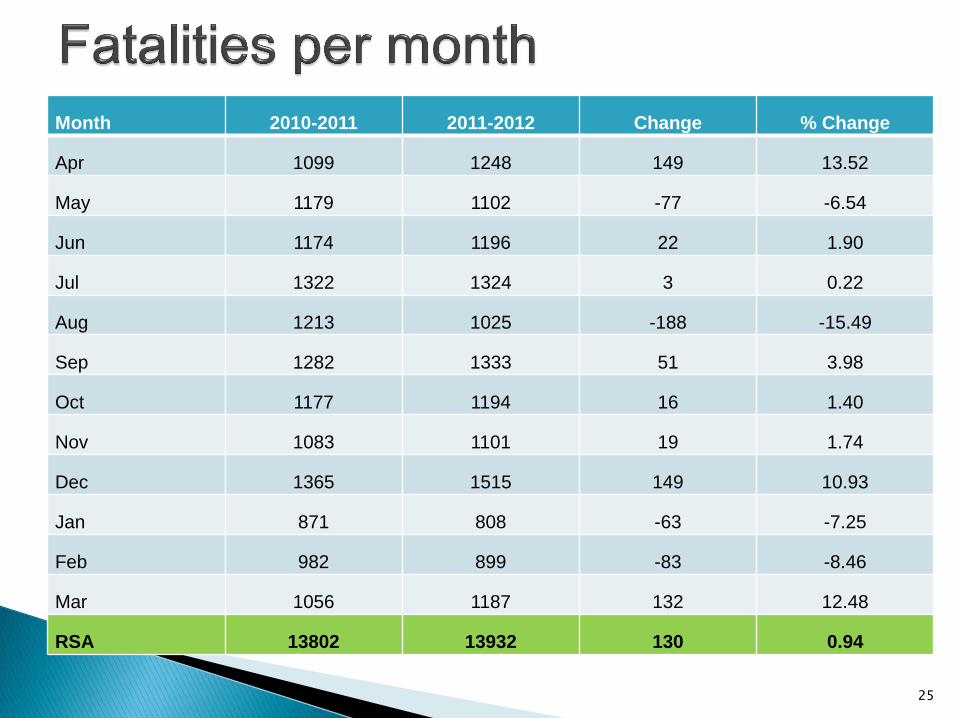
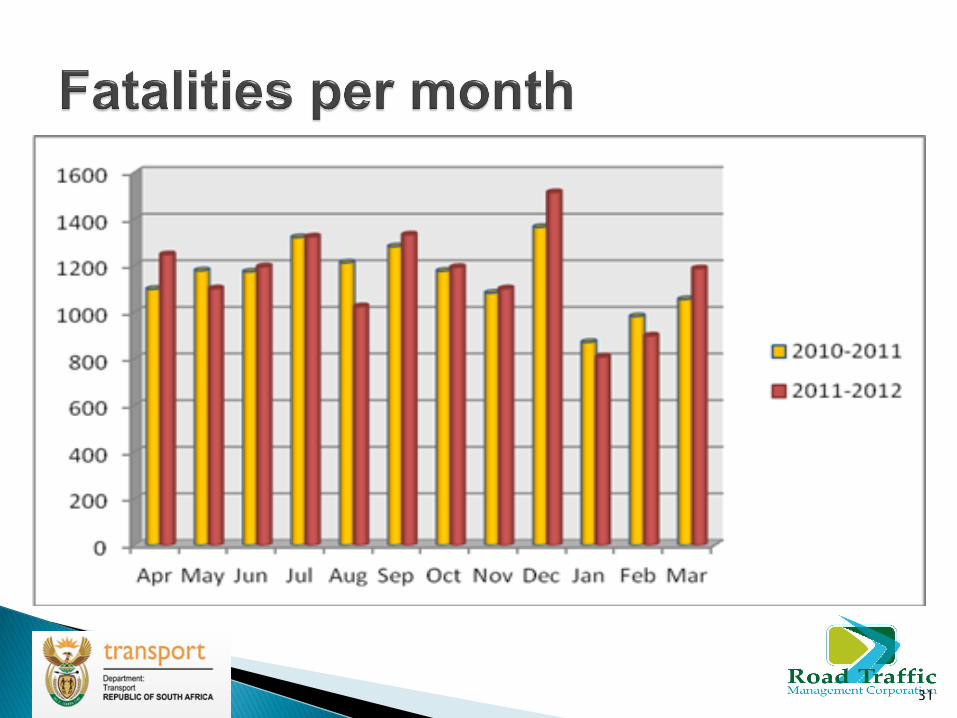
Month 2010-2011 2011-2012 Change % Change
Apr 1099 1248 149 13.52
May 1179 1102 -77 -6.54
Jun 1174 1196 22 1.90
Jul 1322 1324 3 0.22
Aug 1213 1025 -188 -15.49
Sep 1282 1333 51 3.98
Oct 1177 1194 16 1.40
Nov 1083 1101 19 1.74
Dec 1365 1515 149 10.93
Jan 871 808 -63 -7.25
Feb 982 899 -83 -8.46
Mar 1056 1187 132 12.48
RSA 13802 13932 130 0.94
25
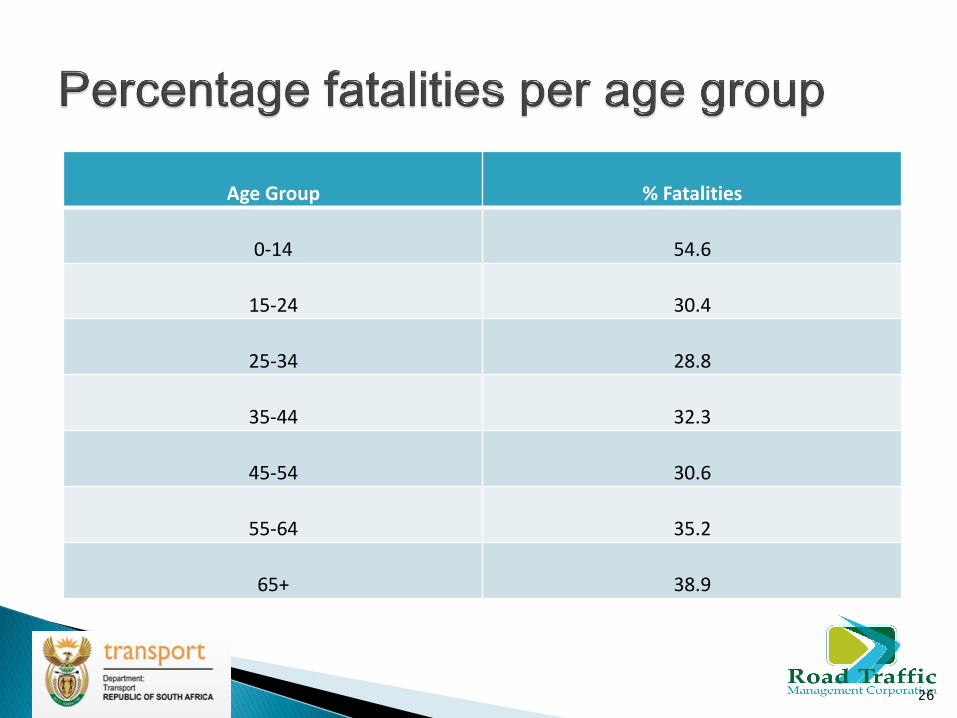
Age Group % Fatalities
0-14 54.6
15-24 30.4
25-34 28.8
35-44 32.3
45-54 30.6
55-64 35.2
65+ 38.9
26
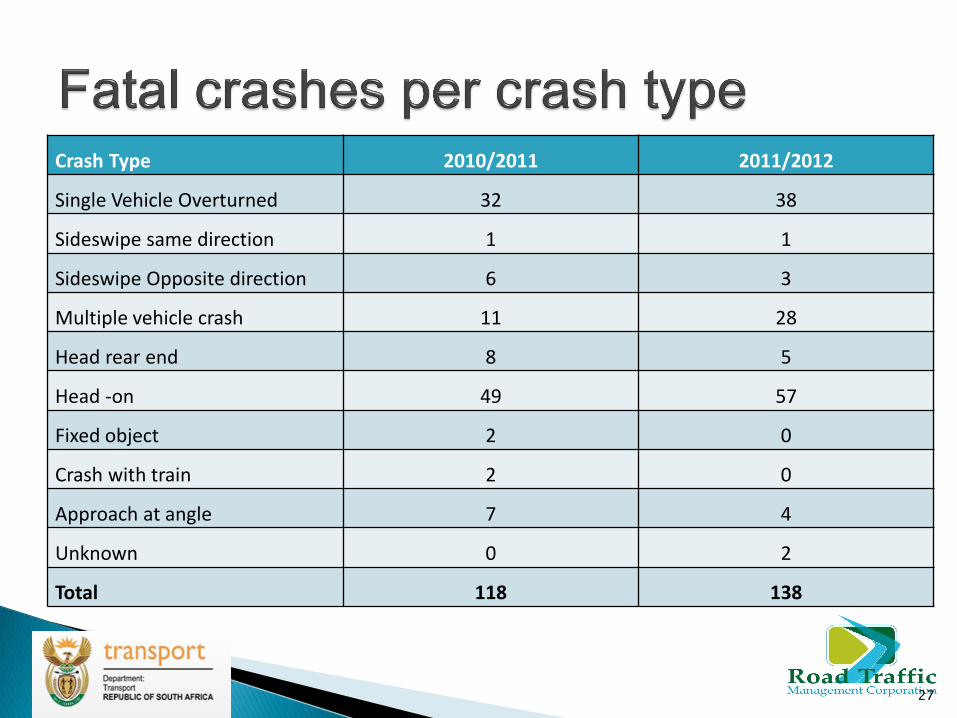
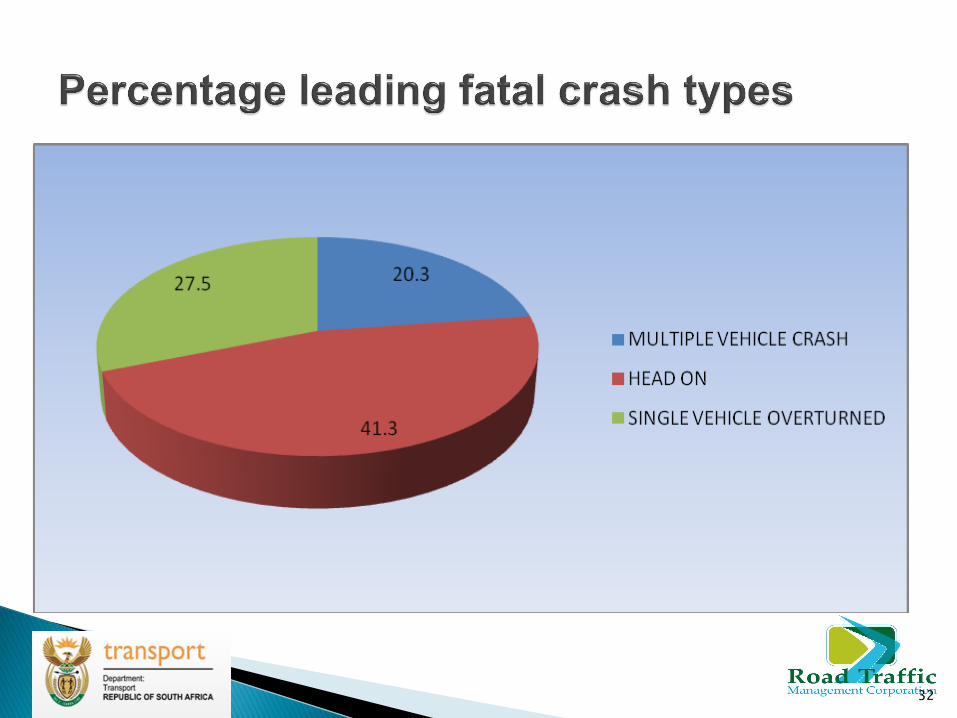
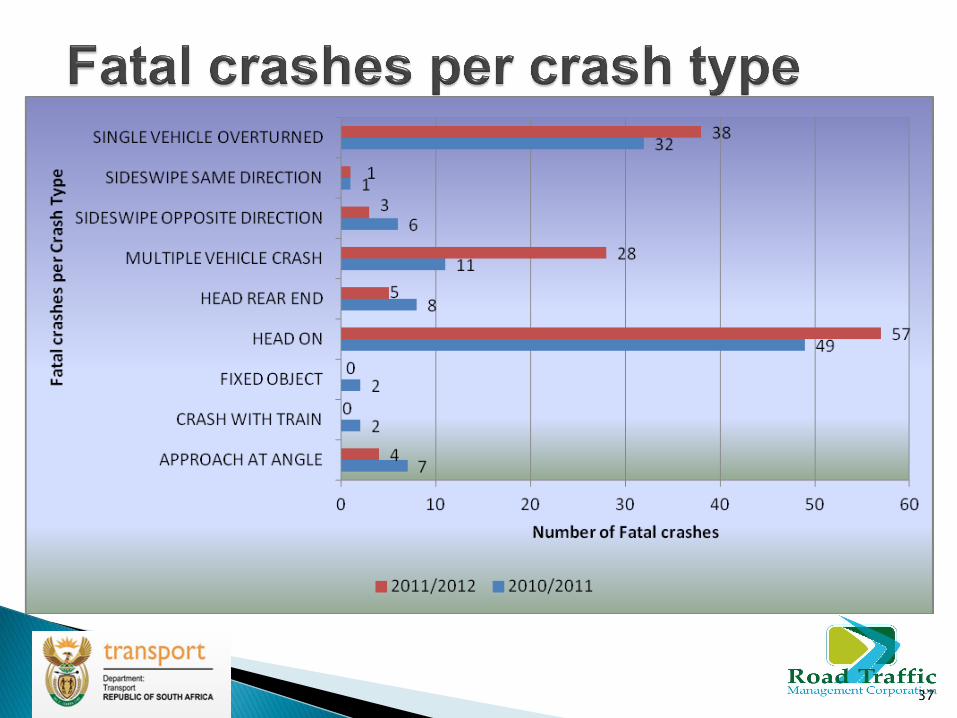
Crash Type 2010/2011 2011/2012
Single Vehicle Overturned 32 38
Sideswipe same direction 1 1
Sideswipe Opposite direction 6 3
Multiple vehicle crash 11 28
Head rear end 8 5
Head -on 49 57
Fixed object 2 0
Crash with train 2 0
Approach at angle 7 4
Unknown 0 2
Total 118 138
27
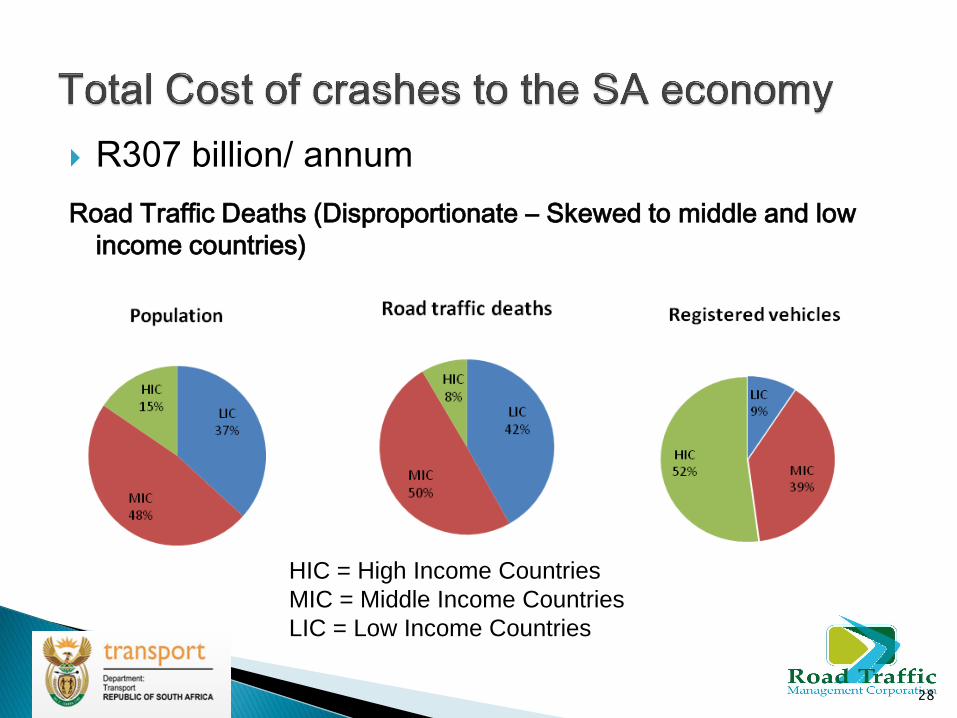
R307 billion/ annum
Road Traffic Deaths (Disproportionate – Skewed to middle and low
income countries)
28
HIC = High Income Countries
MIC = Middle Income Countries
LIC = Low Income Countries
29
30
31
32
33
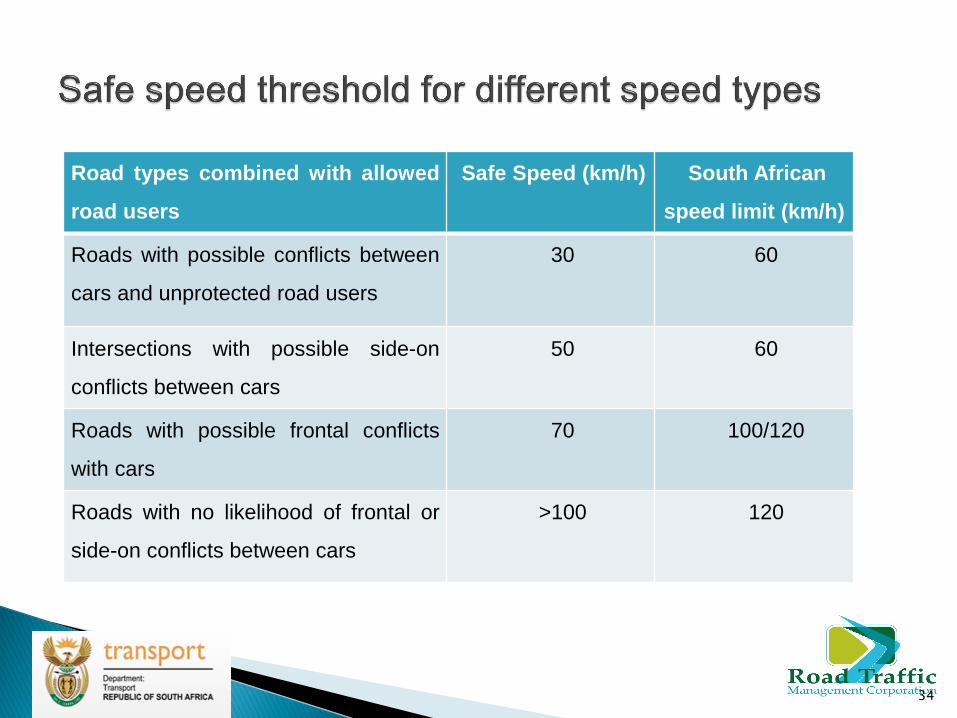
Road types combined with allowed
road users
Safe Speed (km/h) South African
speed limit (km/h)
Roads with possible conflicts between
cars and unprotected road users
30 60
Intersections with possible side-on
conflicts between cars
50 60
Roads with possible frontal conflicts
with cars
70 100/120
Roads with no likelihood of frontal or
side-on conflicts between cars
>100 120
34
35
36
37
38
39
40
0
2
4
6
8
10
12
0- 4
5- 9
10-14
15-19
20-24
25-29
30-34
35-39
40-44
45-49
50-54
55-59
60-64
65-69
70-74
75-79
80+
Female Male
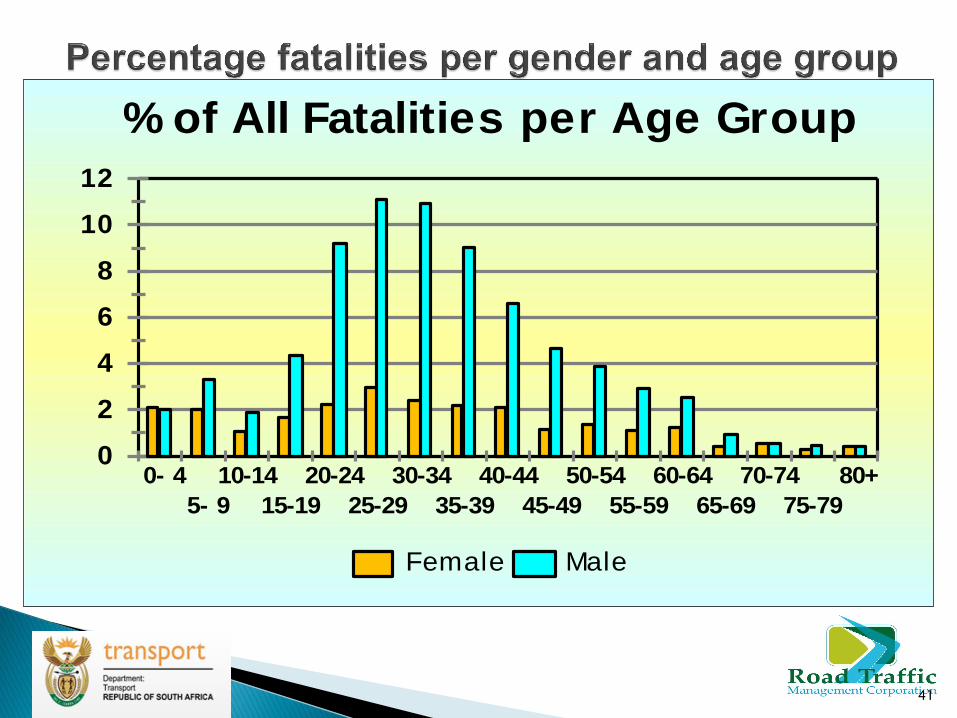
% of All Fatalities per Age Group
41
42
0
2
4
6
8
10
1
2
3
4
5
6
7
8
9
10
11
12
13
14
15
16
17
18
19
20
21
22
23
24
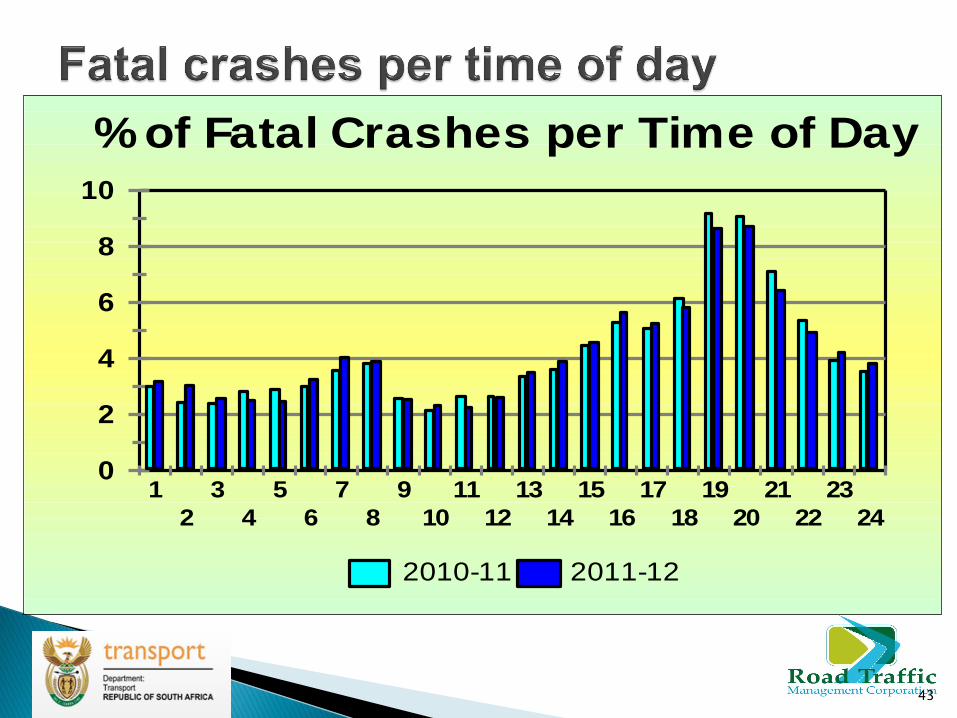
2010-11 2011-12
% of Fatal Crashes per Time of Day
43
0
5
10
15
20
25
Sun Mon Tue Wed Thu Fri Sat
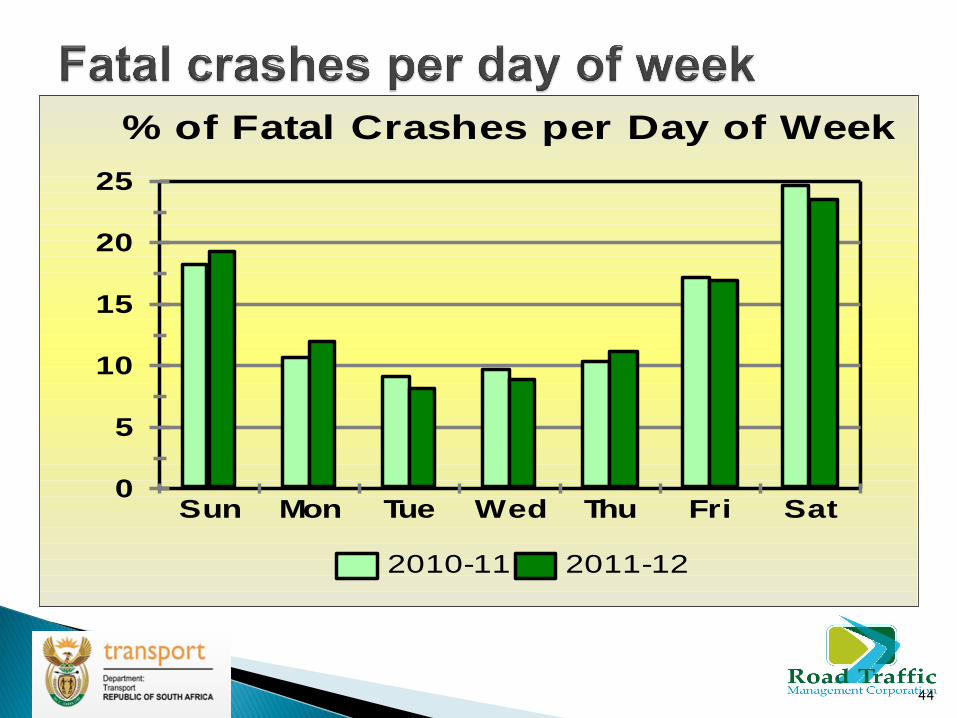
2010-11 2011-12
% of Fatal Crashes per Day of Week
44
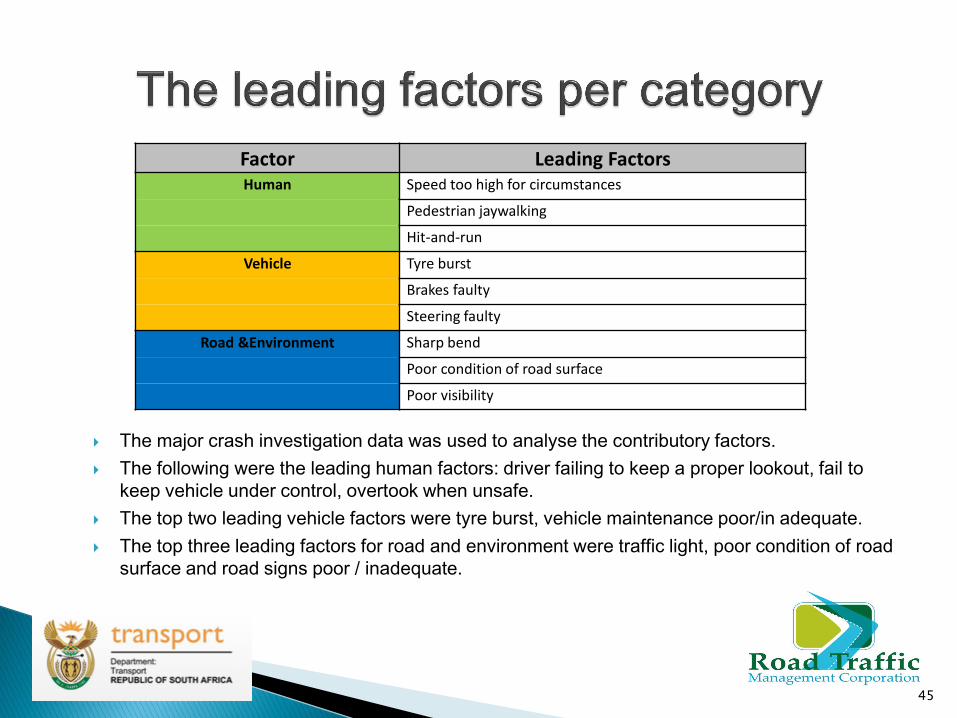
Factor Leading Factors Human Speed too high for circumstances
Pedestrian jaywalking
Hit-and-run
Vehicle Tyre burst
Brakes faulty
Steering faulty
Road &Environment Sharp bend
Poor condition of road surface
Poor visibility
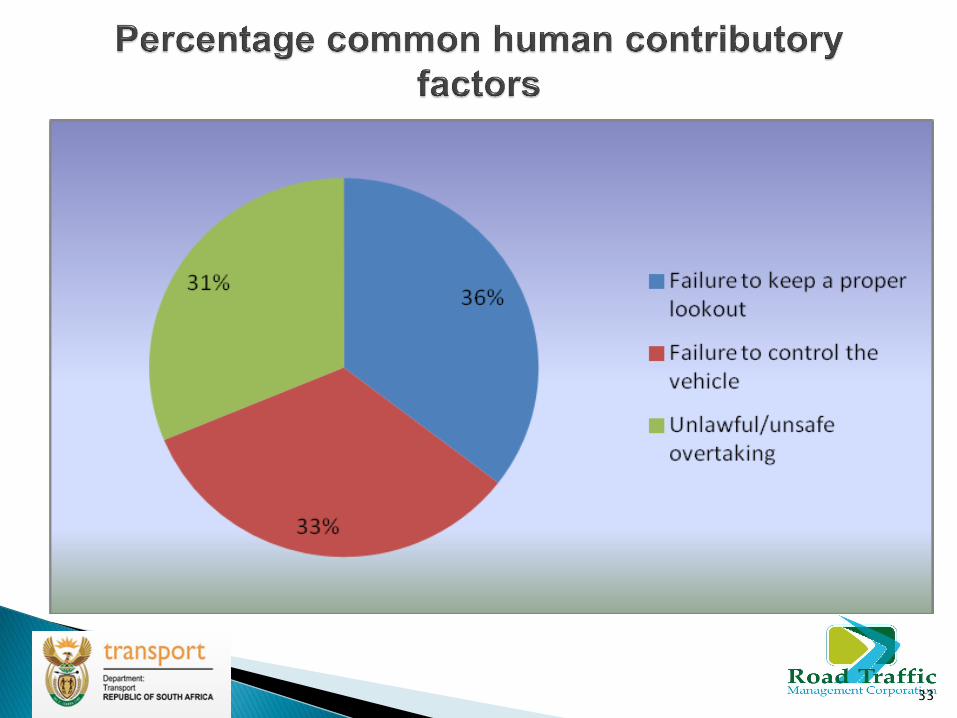
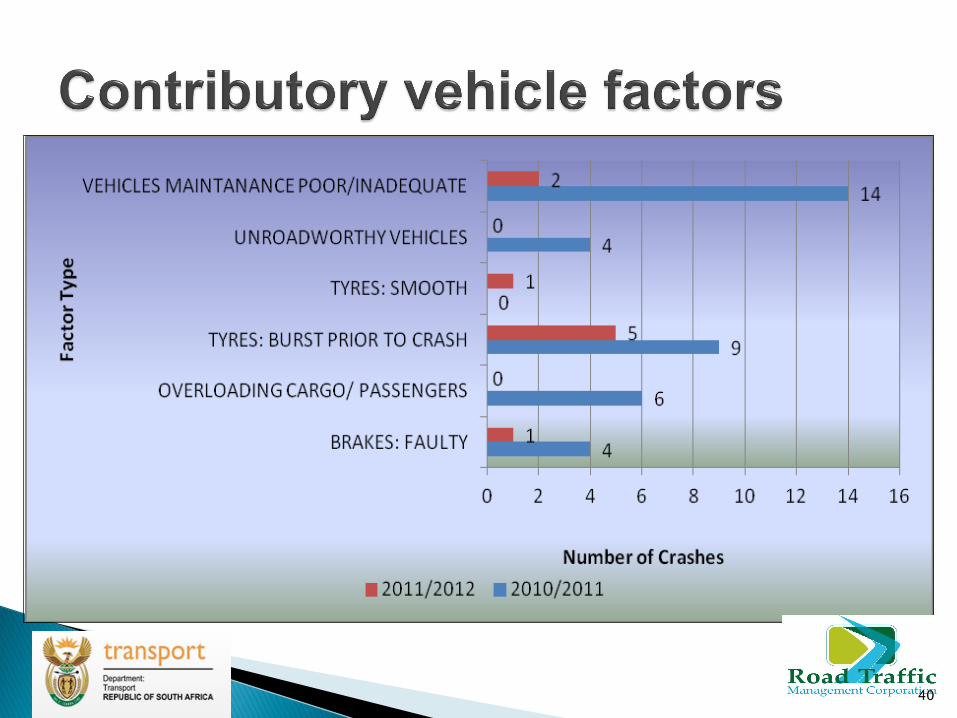
The major crash investigation data was used to analyse the contributory factors.
The following were the leading human factors: driver failing to keep a proper lookout, fail to
keep vehicle under control, overtook when unsafe.
The top two leading vehicle factors were tyre burst, vehicle maintenance poor/in adequate.
The top three leading factors for road and environment were traffic light, poor condition of road
surface and road signs poor / inadequate.
45
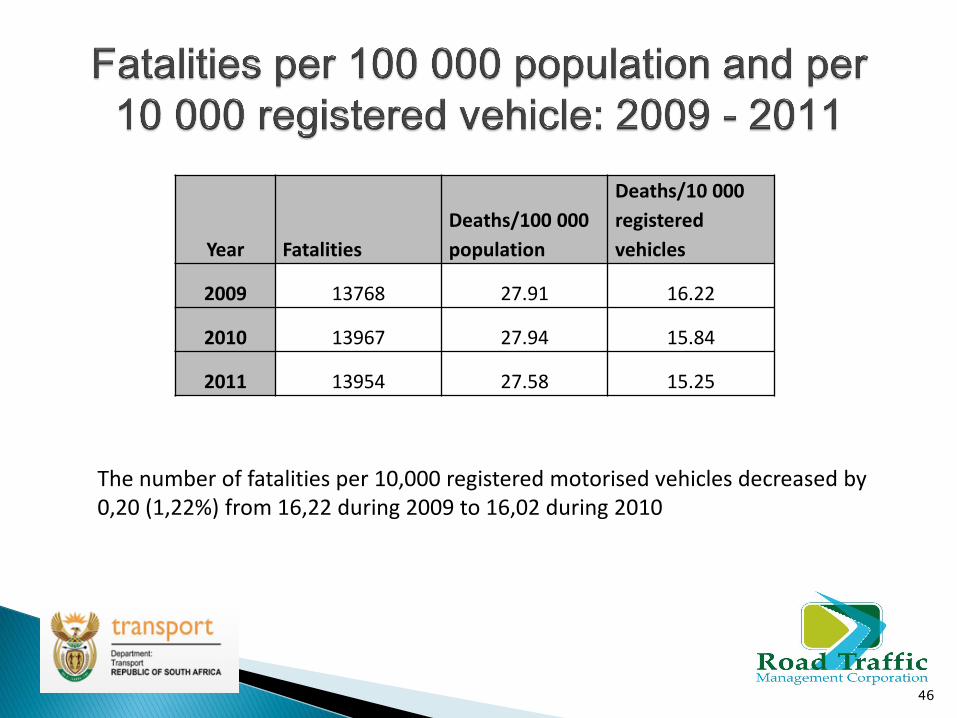
Year Fatalities
Deaths/100 000
population
Deaths/10 000
registered
vehicles
2009 13768 27.91 16.22
2010 13967 27.94 15.84
2011 13954 27.58 15.25
The number of fatalities per 10,000 registered motorised vehicles decreased by 0,20 (1,22%) from 16,22 during 2009 to 16,02 during 2010
46

With the exception of Gauteng, KwaZulu-Natal, Mpumalanga and Limpopo, all other Provinces recorded increases in the number of fatalities per 10,000 vehicles.
0
5
10
15
20
25
30
35
40
GA KZ WC EC FS MP NW LI NC RSA
2009
2010
47

The number of fatalities per 100,000 human population increased by 0,03 (0,09%) from 27,91 during 2009 to 27,94 during 2010.
0
10
20
30
40
50
GA KZ WC EC FS MP NW LI NC RSAProvince
2009 2010
Fatalities per 100,000 Human Pop
48
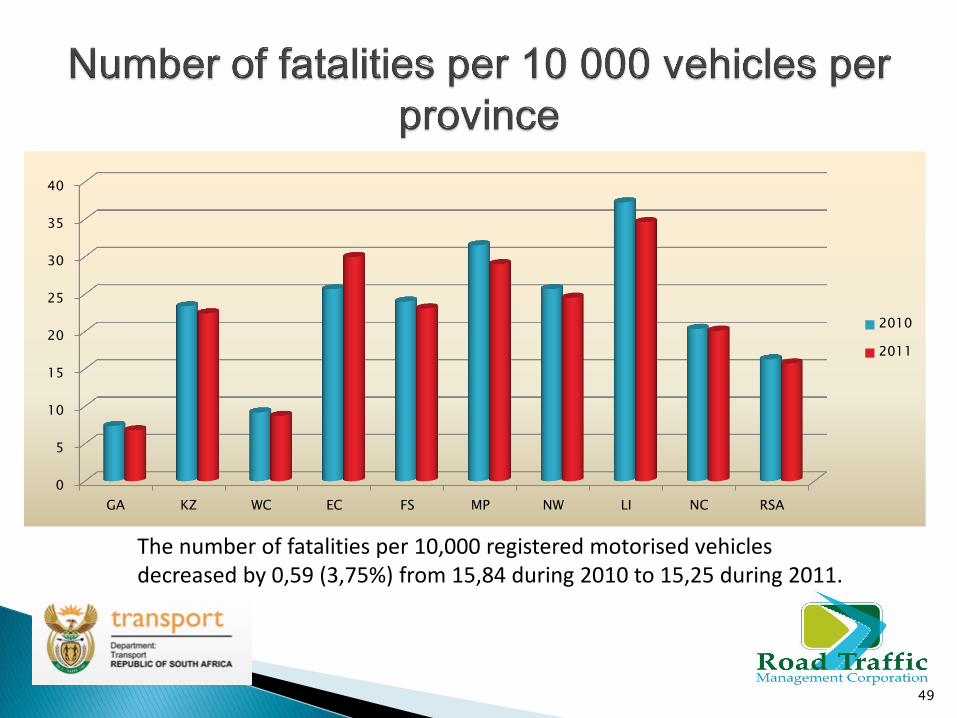
The number of fatalities per 10,000 registered motorised vehicles decreased by 0,59 (3,75%) from 15,84 during 2010 to 15,25 during 2011.
0
5
10
15
20
25
30
35
40
GA KZ WC EC FS MP NW LI NC RSA
2010
2011
49

The national number of fatalities per 100,000 human population decreased by
0,36 (1,27%) from 27,94 during 2010 to 27,58 during 2011
With the exception of Gauteng, Mpumalanga and Limpopo, all other Provinces
recorded decreases in this regard.
0
5
10
15
20
25
30
35
40
45
50
GA KZ WC EC FS MP NW LI NC RSA
2010
2011
50
Part 3
Road Safety Interventions
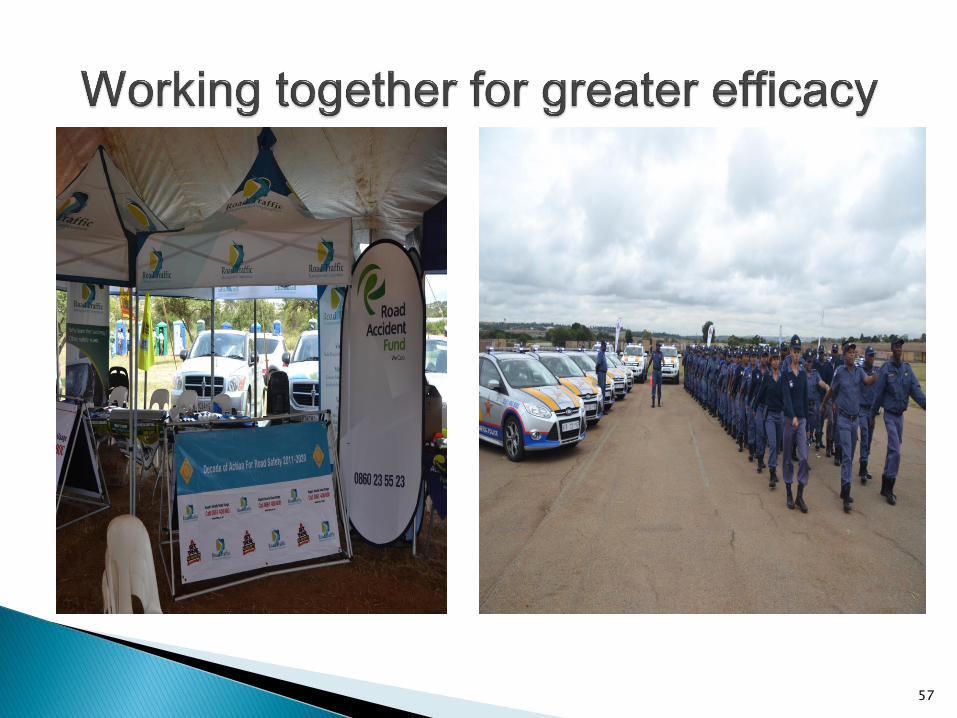
51
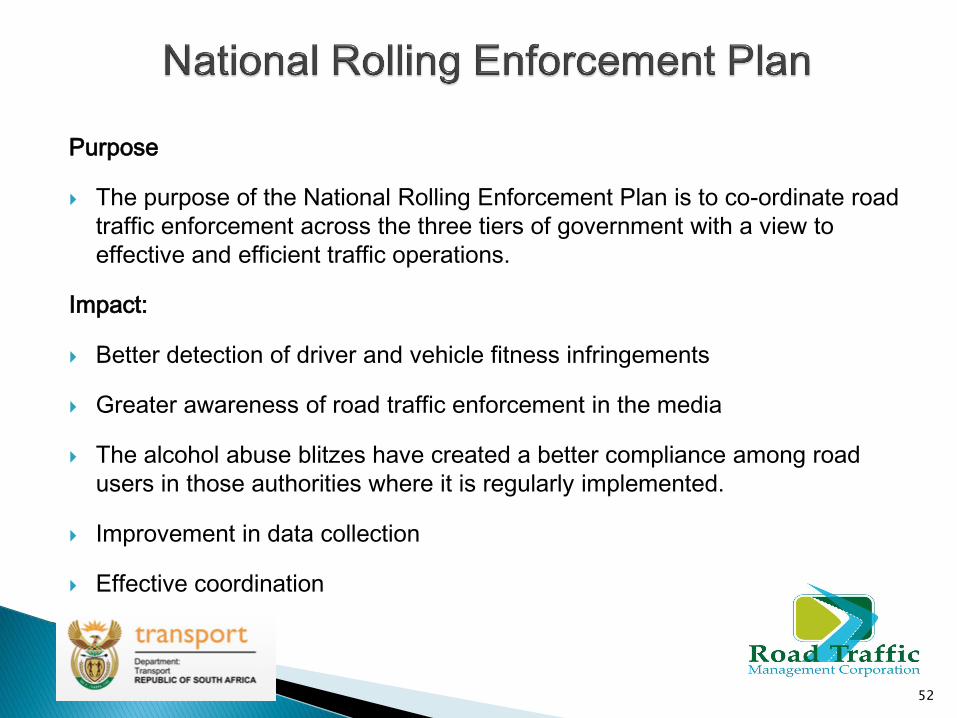
Purpose
The purpose of the National Rolling Enforcement Plan is to co-ordinate road
traffic enforcement across the three tiers of government with a view to
effective and efficient traffic operations.
Impact:
Better detection of driver and vehicle fitness infringements
Greater awareness of road traffic enforcement in the media
The alcohol abuse blitzes have created a better compliance among road
users in those authorities where it is regularly implemented.
Improvement in data collection
Effective coordination
52
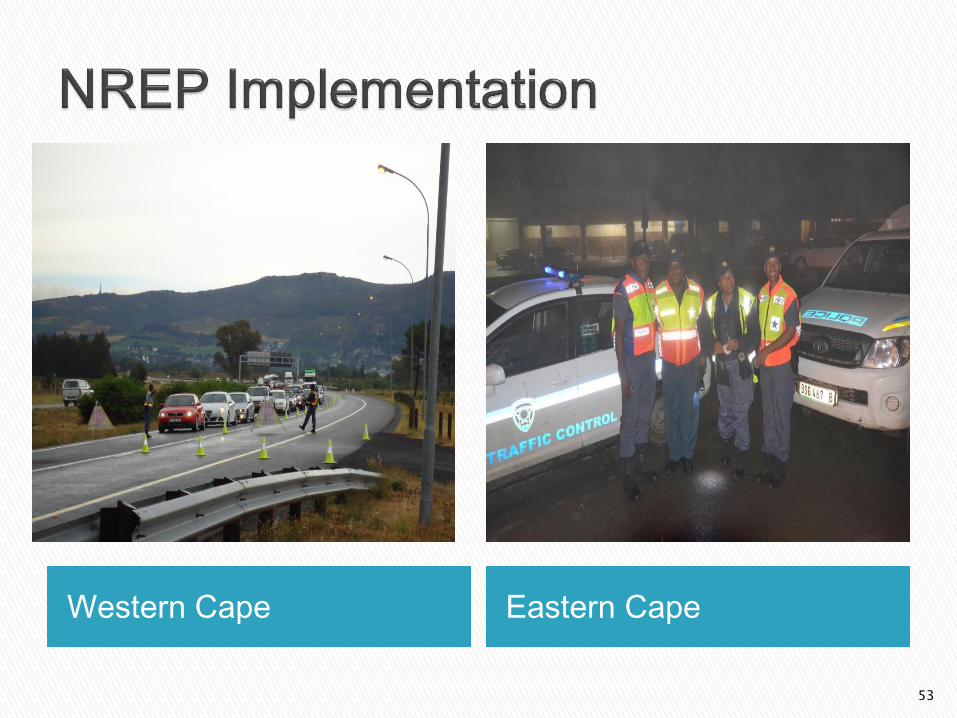
Western Cape Eastern Cape
53
Challenges:
Lack of commitment by some authorities
Lack of uniformity and standardization
Ineffectual implementation and limited monitoring and evaluation
Insufficient public awareness/education in road safety
Future Plans:
Underscoring the plan to stop and check a minimum of 1 million vehicles;
Perform a minimum of 10 000 screenings for alcohol nationwide per month.
Blitzes to be conducted nation-wide by all authorities on exactly
the same focal areas and same dates stipulated on the plan.
Ongoing analysis of crash data and HAZLOCS for strategic ops planning.
54
Purpose
The intervention is aimed at combating alcohol abuse on our roads. The
innovative aim of this operation is for each uniformed officer to arrest a
minimum of one drunkard per month.
Reach:
The principle of a minimum of “one drunkard, per officer, per month” MUST
be enforced in order to rid our roads of drunken drivers who cause fatal
crashes.
Impact:
It is expected that 17 000 drunken driver/pedestrians will be arrested per
month. It has NEVER been done before and sustainability to this assures
the reduction of offence and fatality figures.
Challenges: Lack of support from all authorities.
55
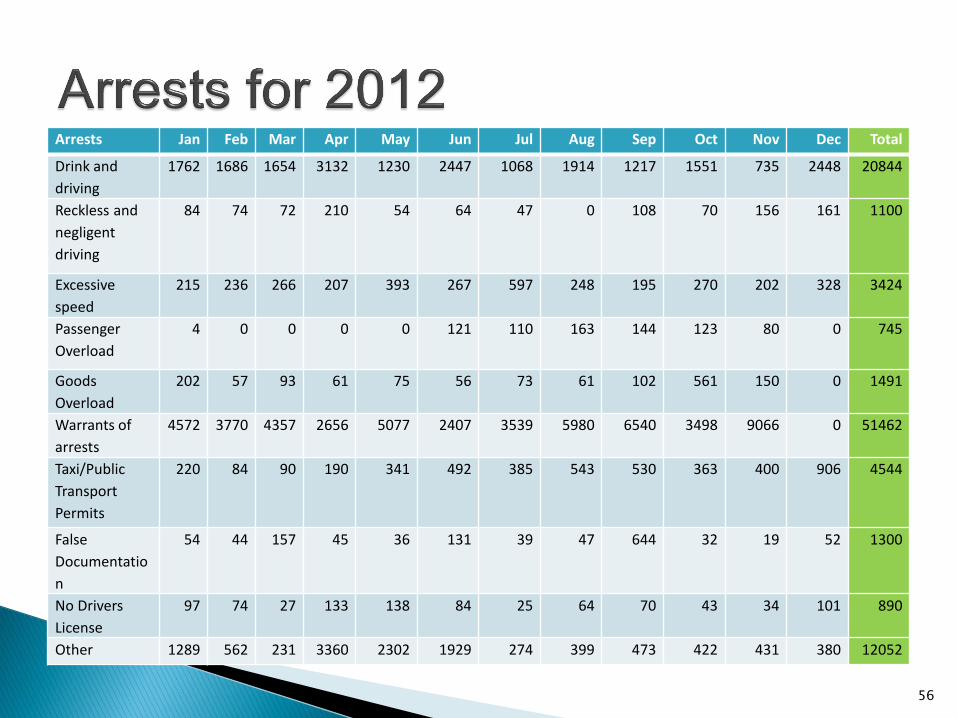
Arrests Jan Feb Mar Apr May Jun Jul Aug Sep Oct Nov Dec Total
Drink and
driving
1762 1686 1654 3132 1230 2447 1068 1914 1217 1551 735 2448 20844
Reckless and
negligent
driving
84 74 72 210 54 64 47 0 108 70 156 161 1100
Excessive
speed
215 236 266 207 393 267 597 248 195 270 202 328 3424
Passenger
Overload
4 0 0 0 0 121 110 163 144 123 80 0 745
Goods
Overload
202 57 93 61 75 56 73 61 102 561 150 0 1491
Warrants of
arrests
4572 3770 4357 2656 5077 2407 3539 5980 6540 3498 9066 0 51462
Taxi/Public
Transport
Permits
220 84 90 190 341 492 385 543 530 363 400 906 4544
False
Documentatio
n
54 44 157 45 36 131 39 47 644 32 19 52 1300
No Drivers
License
97 74 27 133 138 84 25 64 70 43 34 101 890
Other 1289 562 231 3360 2302 1929 274 399 473 422 431 380 12052
56
57
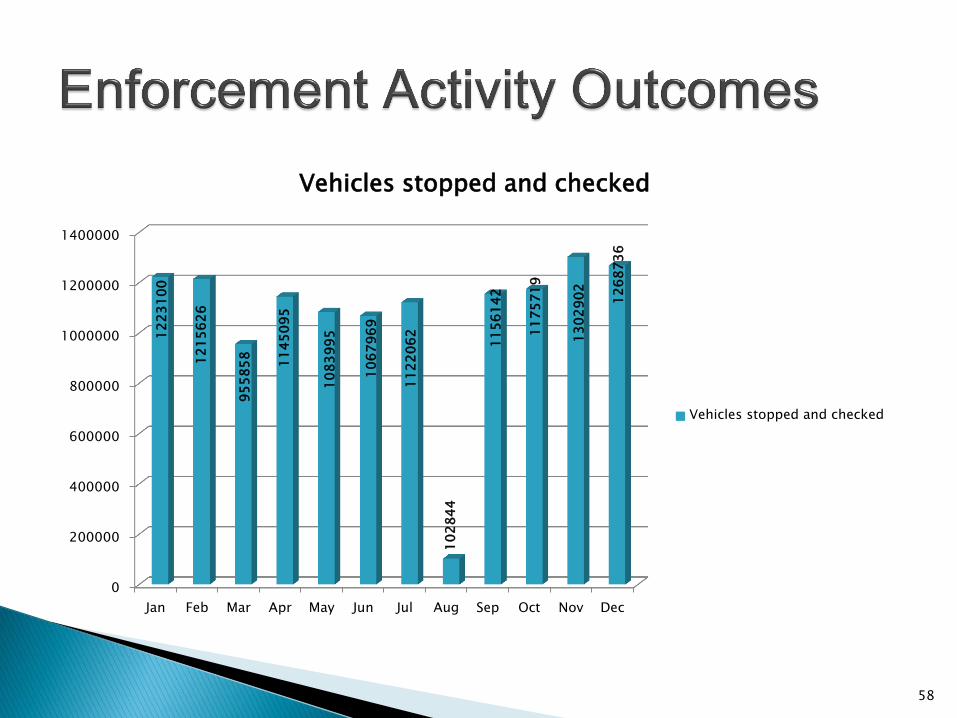
0
200000
400000
600000
800000
1000000
1200000
1400000
Jan Feb Mar Apr May Jun Jul Aug Sep Oct Nov Dec
12
23
10
0
12
15
62
6
95
58
58
11
45
09
5
10
83
99
5
10
67
96
9
11
22
06
2
10
28
44
11
56
14
2
11
75
71
9
13
02
90
2
12
68
73
6
Vehicles stopped and checked
Vehicles stopped and checked
58
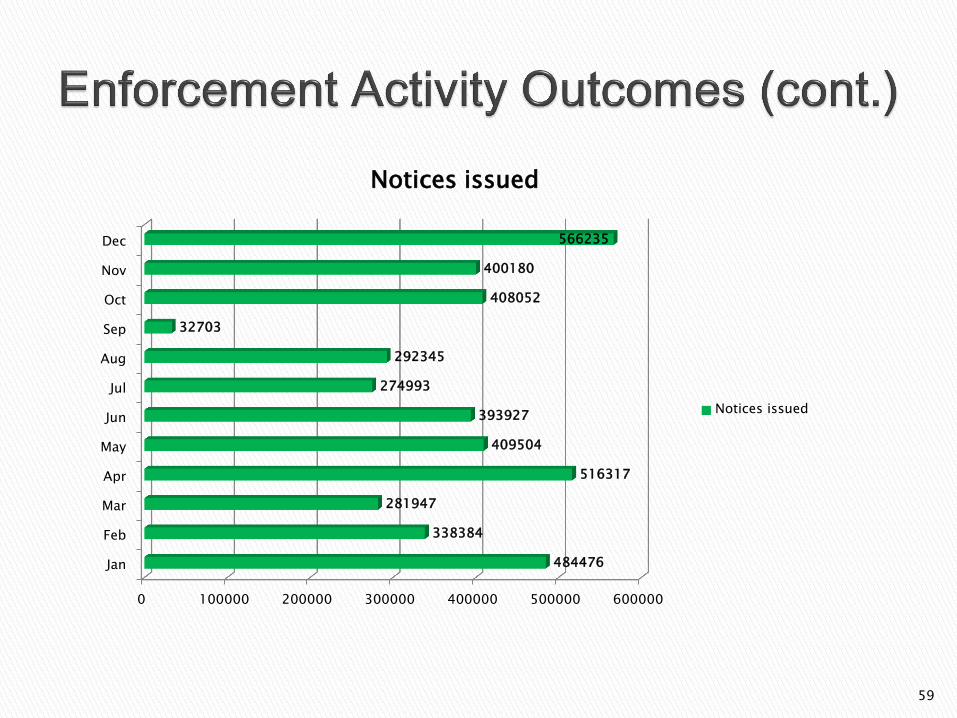
0 100000 200000 300000 400000 500000 600000
Jan
Feb
Mar
Apr
May
Jun
Jul
Aug
Sep
Oct
Nov
Dec
484476
338384
281947
516317
409504
393927
274993
292345
32703
408052
400180
566235
Notices issued
Notices issued
59
60
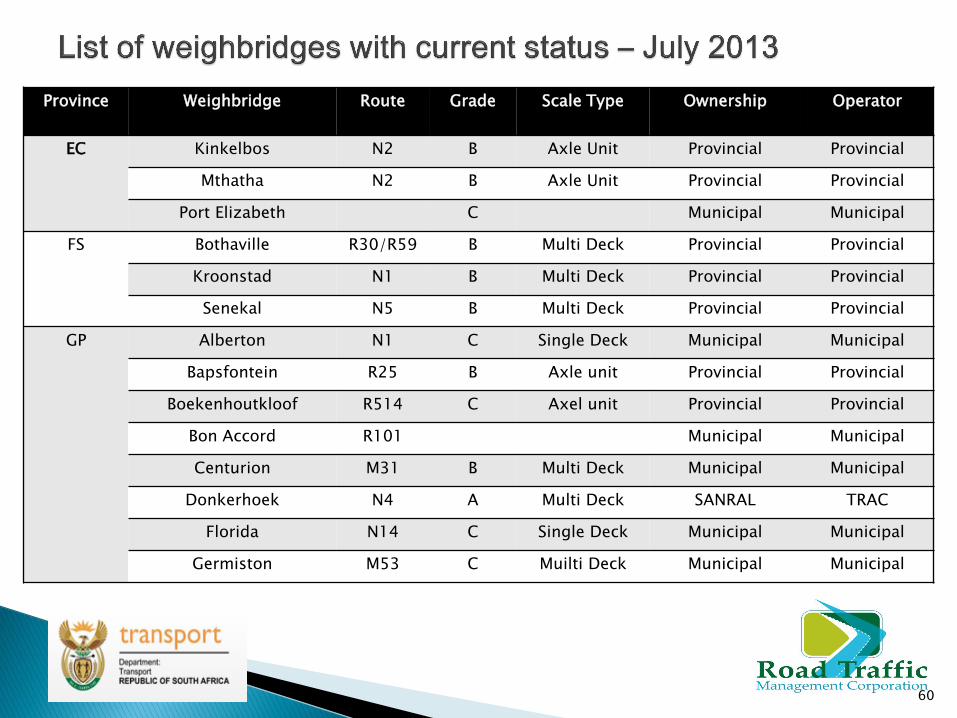
Province Weighbridge Route Grade Scale Type Ownership Operator
EC Kinkelbos N2 B Axle Unit Provincial Provincial
Mthatha N2 B Axle Unit Provincial Provincial
Port Elizabeth C Municipal Municipal
FS Bothaville R30/R59 B Multi Deck Provincial Provincial
Kroonstad N1 B Multi Deck Provincial Provincial
Senekal N5 B Multi Deck Provincial Provincial
GP Alberton N1 C Single Deck Municipal Municipal
Bapsfontein R25 B Axle unit Provincial Provincial
Boekenhoutkloof R514 C Axel unit Provincial Provincial
Bon Accord R101 Municipal Municipal
Centurion M31 B Multi Deck Municipal Municipal
Donkerhoek N4 A Multi Deck SANRAL TRAC
Florida N14 C Single Deck Municipal Municipal
Germiston M53 C Muilti Deck Municipal Municipal
61
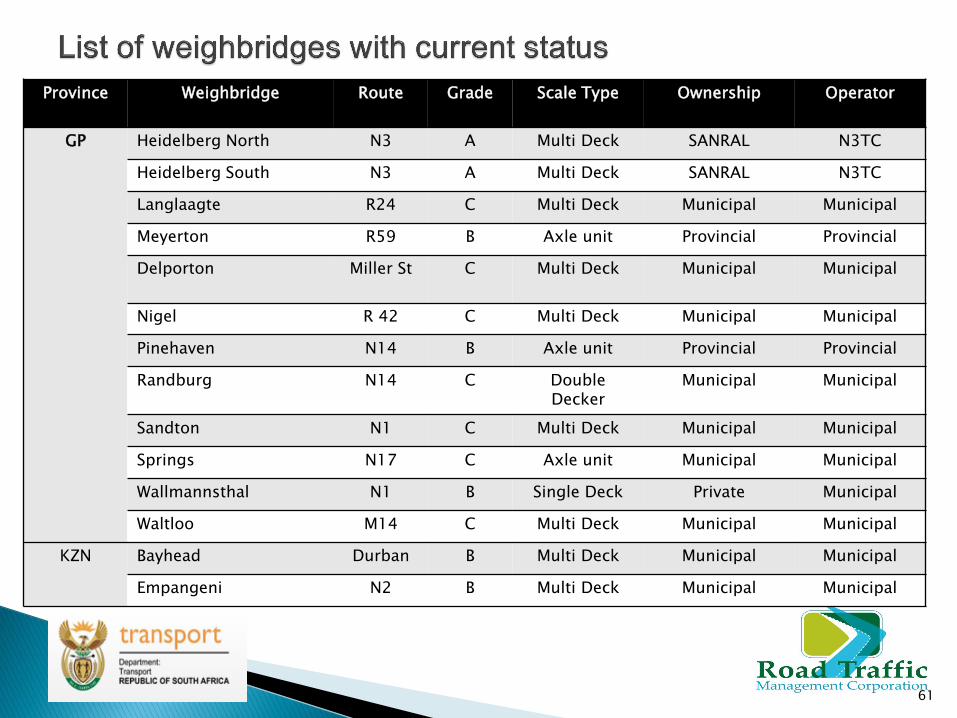
Province Weighbridge Route Grade Scale Type Ownership Operator
GP Heidelberg North N3 A Multi Deck SANRAL N3TC
Heidelberg South N3 A Multi Deck SANRAL N3TC
Langlaagte R24 C Multi Deck Municipal Municipal
Meyerton R59 B Axle unit Provincial Provincial
Delporton Miller St C Multi Deck
Municipal Municipal
Nigel R 42 C Multi Deck Municipal Municipal
Pinehaven N14 B Axle unit Provincial Provincial
Randburg N14 C Double Decker
Municipal Municipal
Sandton N1 C Multi Deck Municipal Municipal
Springs N17 C Axle unit Municipal Municipal
Wallmannsthal N1 B Single Deck Private Municipal
Waltloo M14 C Multi Deck Municipal Municipal
KZN Bayhead Durban B Multi Deck Municipal Municipal
Empangeni N2 B Multi Deck Municipal Municipal
62
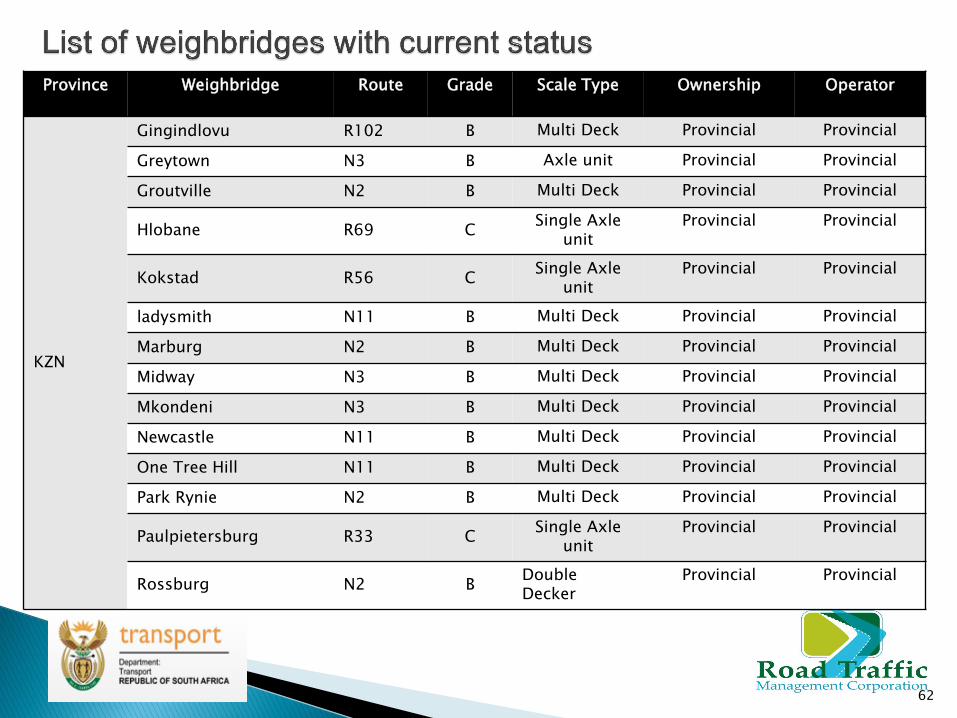
Province Weighbridge Route Grade Scale Type Ownership Operator
KZN
Gingindlovu R102 B Multi Deck Provincial Provincial
Greytown N3 B Axle unit Provincial Provincial
Groutville N2 B Multi Deck Provincial Provincial
Hlobane R69 C Single Axle
unit Provincial Provincial
Kokstad R56 C Single Axle
unit Provincial Provincial
ladysmith N11 B Multi Deck Provincial Provincial
Marburg N2 B Multi Deck Provincial Provincial
Midway N3 B Multi Deck Provincial Provincial
Mkondeni N3 B Multi Deck Provincial Provincial
Newcastle N11 B Multi Deck Provincial Provincial
One Tree Hill N11 B Multi Deck Provincial Provincial
Park Rynie N2 B Multi Deck Provincial Provincial
Paulpietersburg R33 C Single Axle
unit Provincial Provincial
Rossburg N2 B Double Decker
Provincial Provincial
63
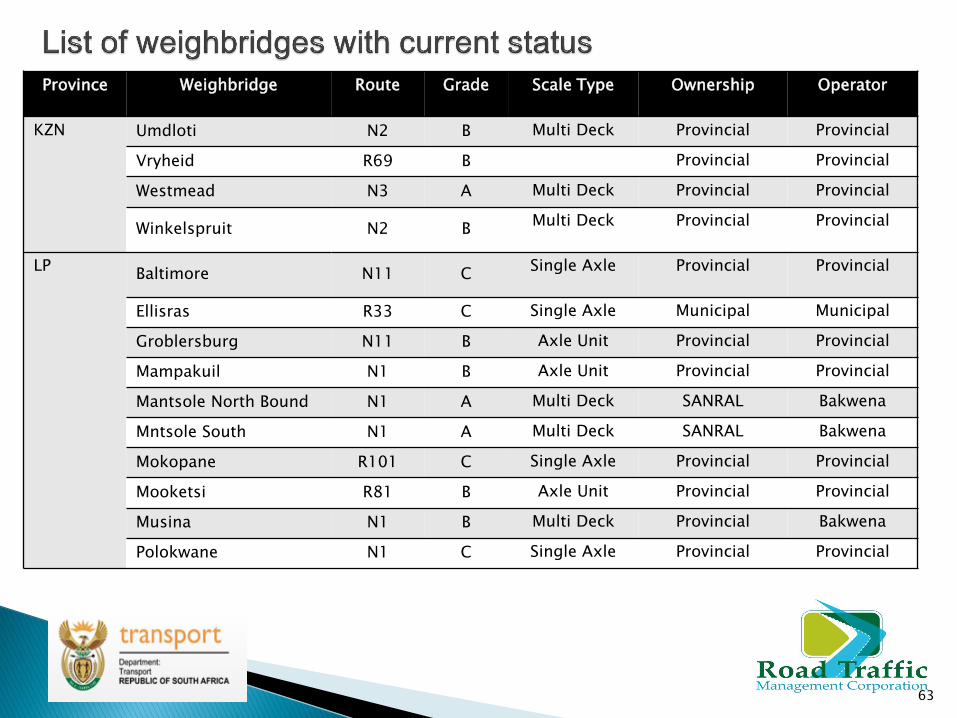
Province Weighbridge Route Grade Scale Type Ownership Operator
KZN Umdloti N2 B Multi Deck Provincial Provincial
Vryheid R69 B Provincial Provincial
Westmead N3 A Multi Deck Provincial Provincial
Winkelspruit N2 B Multi Deck Provincial Provincial
LP Baltimore N11 C
Single Axle Provincial Provincial
Ellisras R33 C Single Axle Municipal Municipal
Groblersburg N11 B Axle Unit Provincial Provincial
Mampakuil N1 B Axle Unit Provincial Provincial
Mantsole North Bound N1 A Multi Deck SANRAL Bakwena
Mntsole South N1 A Multi Deck SANRAL Bakwena
Mokopane R101 C Single Axle Provincial Provincial
Mooketsi R81 B Axle Unit Provincial Provincial
Musina N1 B Multi Deck Provincial Bakwena
Polokwane N1 C Single Axle Provincial Provincial
64
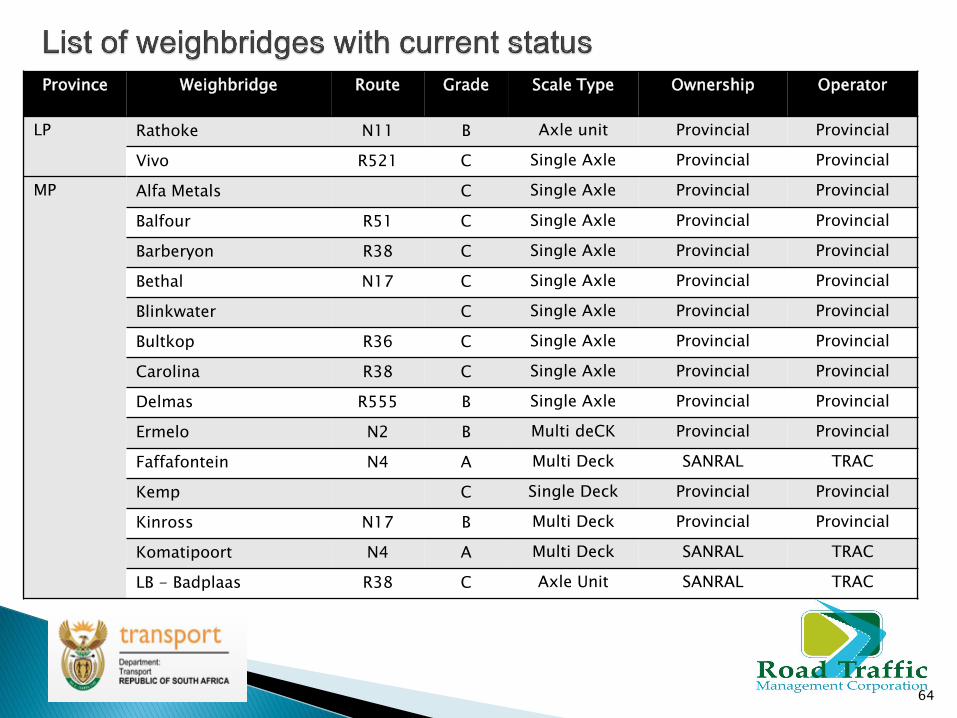
Province Weighbridge Route Grade Scale Type Ownership Operator
LP Rathoke N11 B Axle unit Provincial Provincial
Vivo R521 C Single Axle Provincial Provincial
MP Alfa Metals C Single Axle Provincial Provincial
Balfour R51 C Single Axle Provincial Provincial
Barberyon R38 C Single Axle Provincial Provincial
Bethal N17 C Single Axle Provincial Provincial
Blinkwater C Single Axle Provincial Provincial
Bultkop R36 C Single Axle Provincial Provincial
Carolina R38 C Single Axle Provincial Provincial
Delmas R555 B Single Axle Provincial Provincial
Ermelo N2 B Multi deCK Provincial Provincial
Faffafontein N4 A Multi Deck SANRAL TRAC
Kemp C Single Deck Provincial Provincial
Kinross N17 B Multi Deck Provincial Provincial
Komatipoort N4 A Multi Deck SANRAL TRAC
LB - Badplaas R38 C Axle Unit SANRAL TRAC
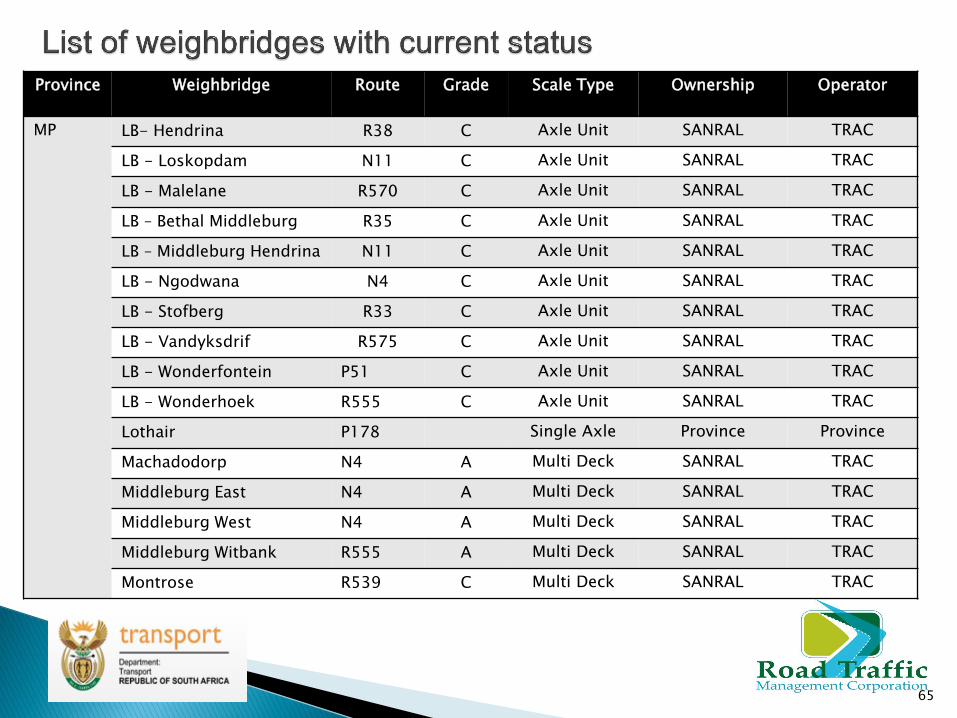
65
Province Weighbridge Route Grade Scale Type Ownership Operator
MP LB- Hendrina R38 C Axle Unit SANRAL TRAC
LB - Loskopdam N11 C Axle Unit SANRAL TRAC
LB - Malelane R570 C Axle Unit SANRAL TRAC
LB – Bethal Middleburg R35 C Axle Unit SANRAL TRAC
LB – Middleburg Hendrina N11 C Axle Unit SANRAL TRAC
LB - Ngodwana N4 C Axle Unit SANRAL TRAC
LB - Stofberg R33 C Axle Unit SANRAL TRAC
LB - Vandyksdrif R575 C Axle Unit SANRAL TRAC
LB - Wonderfontein P51 C Axle Unit SANRAL TRAC
LB - Wonderhoek R555 C Axle Unit SANRAL TRAC
Lothair P178 Single Axle Province Province
Machadodorp N4 A Multi Deck SANRAL TRAC
Middleburg East N4 A Multi Deck SANRAL TRAC
Middleburg West N4 A Multi Deck SANRAL TRAC
Middleburg Witbank R555 A Multi Deck SANRAL TRAC
Montrose R539 C Multi Deck SANRAL TRAC
66
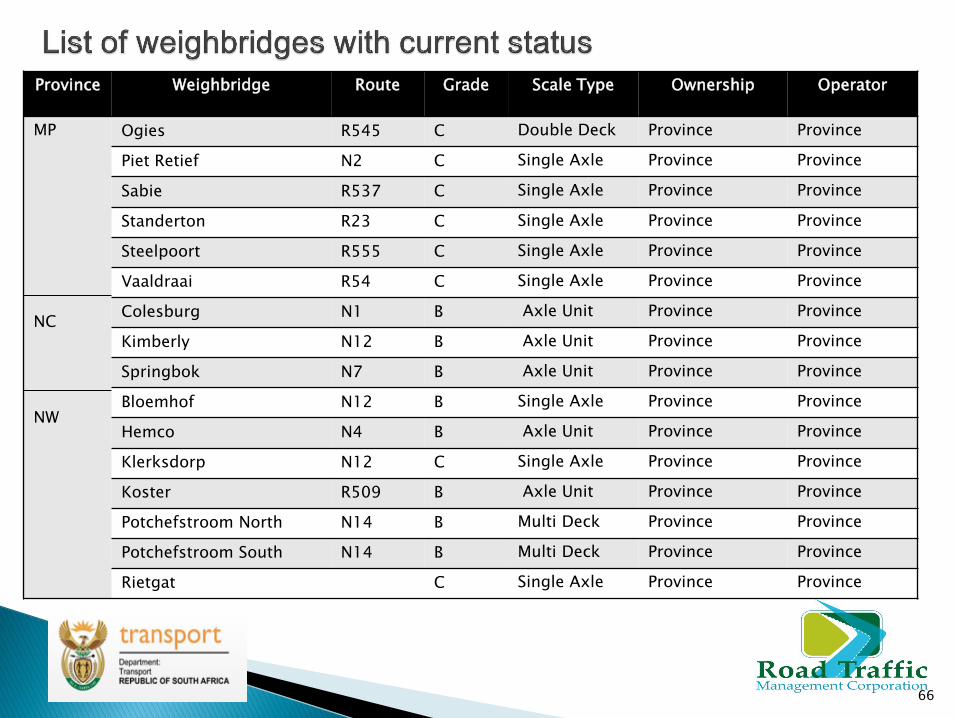
Province Weighbridge Route Grade Scale Type Ownership Operator
MP NC NW
Ogies R545 C Double Deck Province Province
Piet Retief N2 C Single Axle Province Province
Sabie R537 C Single Axle Province Province
Standerton R23 C Single Axle Province Province
Steelpoort R555 C Single Axle Province Province
Vaaldraai R54 C Single Axle Province Province
Colesburg N1 B Axle Unit Province Province
Kimberly N12 B Axle Unit Province Province
Springbok N7 B Axle Unit Province Province
Bloemhof N12 B Single Axle Province Province
Hemco N4 B Axle Unit Province Province
Klerksdorp N12 C Single Axle Province Province
Koster R509 B Axle Unit Province Province
Potchefstroom North N14 B Multi Deck Province Province
Potchefstroom South N14 B Multi Deck Province Province
Rietgat C Single Axle Province Province
67
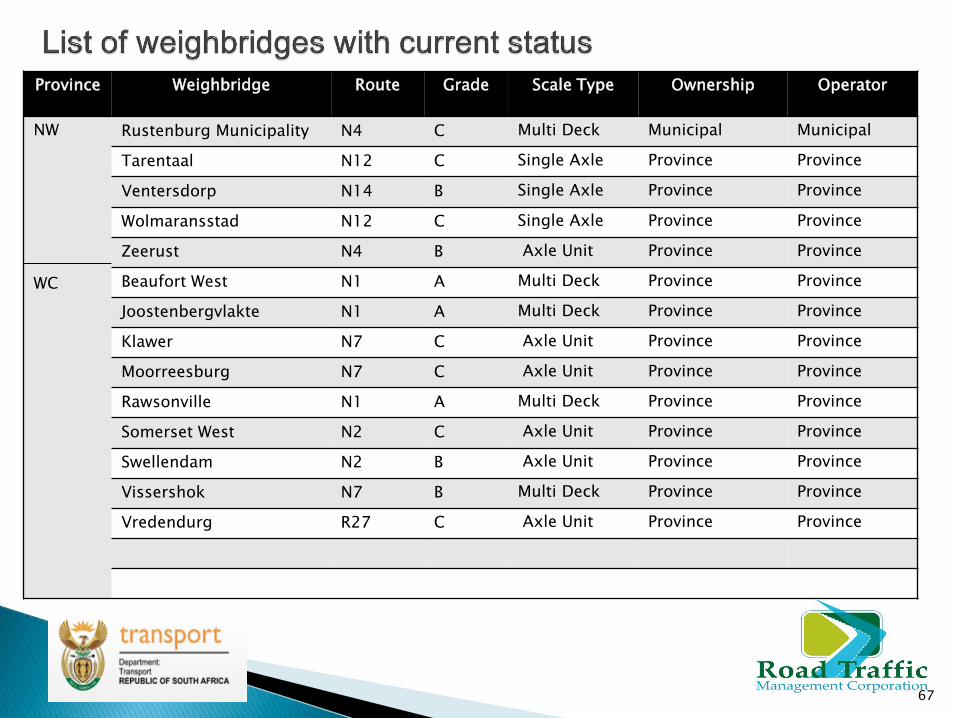
Province Weighbridge Route Grade Scale Type Ownership Operator
NW WC
Rustenburg Municipality N4 C Multi Deck Municipal Municipal
Tarentaal N12 C Single Axle Province Province
Ventersdorp N14 B Single Axle Province Province
Wolmaransstad N12 C Single Axle Province Province
Zeerust N4 B Axle Unit Province Province
Beaufort West N1 A Multi Deck Province Province
Joostenbergvlakte N1 A Multi Deck Province Province
Klawer N7 C Axle Unit Province Province
Moorreesburg N7 C Axle Unit Province Province
Rawsonville N1 A Multi Deck Province Province
Somerset West N2 C Axle Unit Province Province
Swellendam N2 B Axle Unit Province Province
Vissershok N7 B Multi Deck Province Province
Vredendurg R27 C Axle Unit Province Province

47588 62944
68230 60271
74585
115875
225045
126224
175335
1312360
156432
171031
Vehicles weighed
Jan Feb Mar
Apr May Jun
Jul Aug Sep
Oct Nov Dec
68
Purpose:
To create a safe environment for learners to cross the road next to their schools.
To inculcate leadership skills amongst learners.
Reach:
Schools that fall within the ambit of the Department of Basic Education.
Impact:
A decrease in learner road injuries/fatalities around the school zones
The creation of safe road environment within school zones
Raised awareness of learners on pedestrian safety
Raised awareness of drivers to be cautious around school zones
Challenges:
There are still incidences of learner fatalities/injuries as a result of reckless
drivers.
The scholar patrol database is currently not reliable
The scholar patrol programme need to be managed in a coordinated manner.
69
Future Plans:
To develop and implement a web-based system that all relevant role players
can utilise for seamless capturing, updating and reporting of
incidents/fatalities.
To embark on a database audit to verify the current database.
To strengthen the coordination processes with regard to
sponsorships/initiatives by interested parties, eg; uniform and equipment
sponsorships.
To involved the Road Accident Fund on reported cases of learner
injuries/fatalities.
70
Purpose:
To change learner attitude towards road safety through participatory education.
Schools are invited to enter a competition where they should identify road safety
problems within their communities, and propose an implementable solution to
address the problem. They use miniature models/displays to depict the
problems and solutions.
Reach:
The competition is open to all national High Schools.
Impact:
Enhanced understanding and application of technology to solve problems in
own communities
Promotion of teamwork and participatory learning
Learners are equipped with analysis skills
71

Challenges:
Only schools that can afford to purchase material for the building of a model
participate
No involvement of those responsible for road infrastructure and design to assist
the learners with their project and to try and implement proposed solutions.
Proposed solutions from learners are never implemented
Future Plans:
This programme will be merged with a new programme called Photovoice by
Safe kids worldwide.
72

73
Purpose
To encourage learners to be aware and take responsibility of road safety
issues/problems within their environment.
To develop, enhance and empower learners with practical research, communications
and presentation skills.
Reach:
All school learners in grade 10 and 11.
Impact:
Learners come out being able to express their perspectives on the road environment
Learners are able to identify potential dangers in road traffic.
Improved confidence in presentation and communication skills of learners.
Prizes won such as laptops provide learners with opportunities they would not have
had.
74

Challenges:
Minimum learner assistance in preparation for the competition from the Provincial level learners
The competition tends to favour those learners that are confident in expressing themselves in English
Debate topics are sometimes not appropriate for the competitors age group
Only schools that can afford to pay for their travels attend the competitions.
The winning teams not involved in road safety initiatives and programmes
Future Plans:
Registered bodies such as the Toast Masters SA and South African National
Debating Council will be approached to be involved in the process.
Travelling costs for the learners to be paid by the Corporation and sponsors
Programmes for engaging and utilising the winners as road safety advocates for
the youth to be developed.
75
Purpose:
To encourage continuous training and development of professional
drivers in order to improve driver skills and knowledge in the heavy
vehicle category.
To encourage companies to develop internal driver programmes to
enhance driver skills.
Reach:
Aimed at heavy vehicle drivers
Impact:
Drivers are exposed to international professional driving standards
76
Challenges:
Failure to effectively address the needs of the freight industry such as economical driving and load
safety issues
Poor communication about the competition, as a result the same participants enter the competition
every year.
Success largely depends on private sector participation
Small business disadvantaged
Future Plans:
To ensure that the competitions incorporate the SAQA certified unit standards for professional drivers.
This will expose the drivers to a more controlled education and training environment.
To engage with the Transport Education and Training Authority for this training to form part of skills
development initiative.
To put measures in place in order to encourage transfer of skills to new/developing drivers
To influence SADC to adopt this programme
77

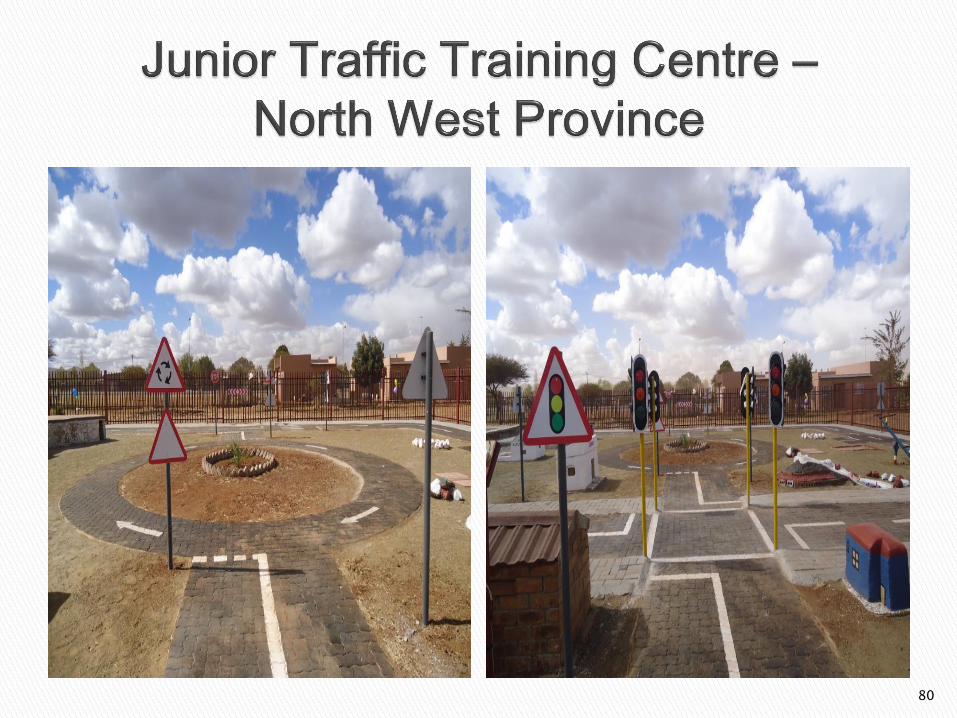
Purpose:
To educate young road users on road safety through the utilisation of a
simulated road environment.
Reach:
All schools under the Department of Basic Education.
Impact:
Quicker understanding of the road environment because of the participatory
nature of the programme.
It re-enforces lessons learnt in the classroom
Future Plans:
78
Challenges:
The infrastructure is not properly maintained and as a result becomes
dilapidated.
Mainly benefits the learners of the school in which it is located, as it not
always feasible for other schools to arrange for the learners to go the
centres (travelling costs, seeking permission from parents, time to travel).
Future Plans:
Invest in mobile JTCC’S-
All schools will have at least one JTCC that will be enrich the learners
understanding of the theory they have learned in class.
Maintenance costs are very minimal
79
80
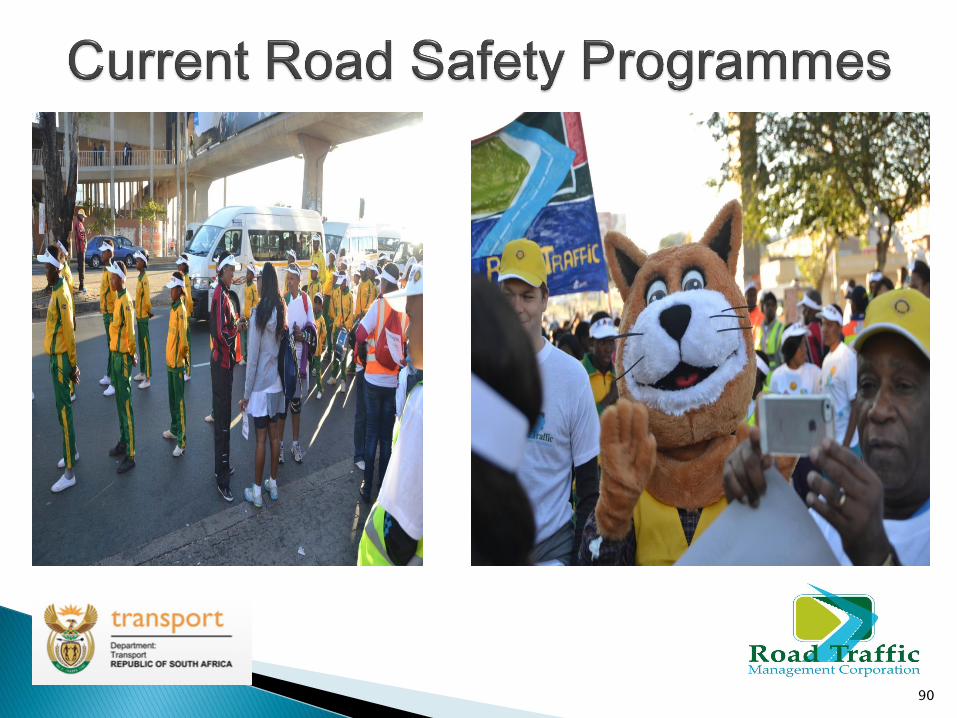
Purpose:
To create road safety awareness amongst all road users, using a variety of
platforms
Reach:
Road users of different ages and modes. Communication platforms include
website for two way communication, social media for everyday interaction,
print, television and radio as well as face to face interactions in the form of
exhibitions.
Impact:
Bring about greater awareness and safer road user conduct.
81

Challenges:
Eleven official languages, demographics and competing social causes
Campaign is only 6 months old and is still to be further marketed
Future Plans:
Expansion of media campaign to include outdoor billboards, moving
billboards, road-shows, street theatre and exhibitions.
82
Purpose: To address alleged corrupt activities, bribery and corruption within
the traffic policing fraternity, in all sectors, nationally. To restore confidence,
order and dignity to the profession.
Reach: Nationally, investigate and implement operations to arrest all
alleged corrupt traffic police officials. Engage in special operations involving
agencies eg: DPCI, Crime Intelligence, SARS, DOJ, Provinces, etc
Impact: Since inception in November 2012 the unit has achieved the
following with a staff component of 4 officers:
Operation Joyride: in conjunction with the HAWKS:
26 x Examiners Arrested (Private test stations)
152 x Traced and suspended, Vehicles examined for Fraudulently issued
CRW’s: KZN, MPG, GP.
Total Arrests: 26, 152 Wanted vehicles traced and suspended.
83
Operation: Leihlo: Focus on all corrupt traffic officials.
Arrests to date:
3 X Extortion:
7 X Bribery and Corruption:
2 x Fraud: Lyttleton (PTA) and Umhlali(KZN)
2 x t/o’s; Drunk on duty, charged and dismissed.
1 x t/o: Drunk Driving, Suspended, Resigned.
1 x t/o: Firearms Control Act related. Charged, Resigned.
7 X Cases pending decision and internal hearings:
Total: 16 arrests, 7 pending internal disciplinary hearing cases.
84
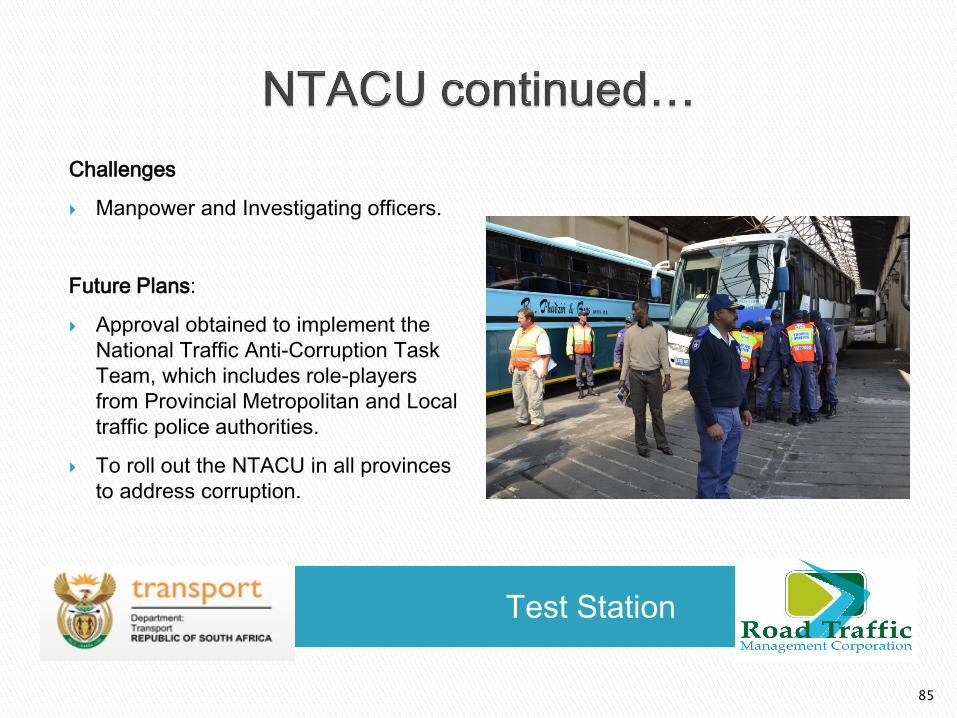
Test Station
Challenges
Manpower and Investigating officers.
Future Plans:
Approval obtained to implement the
National Traffic Anti-Corruption Task
Team, which includes role-players
from Provincial Metropolitan and Local
traffic police authorities.
To roll out the NTACU in all provinces
to address corruption.
85

86
Purpose
National Traffic Police was formed to be an intervention unit to assist provincial and
local authorities with law enforcement in hazardous locations. The aim of the
deployment was to reduce accidents and fatalities in identified hazardous locations in
those provinces.
Output
A total of 100 traffic officers were deployed in the provinces of Western Cape,
Eastern Cape, Free State, Mpumalanga and Limpopo. 10 supervisors, with 6
vehicles per province were deployed.
Outcome
No major accident was reported in the areas where the National Traffic Police was
deployed
Roll-out
There is plan to roll-out this process to all hazardous areas on a monthly basis to
increase visibility and consistency throughout the year
87
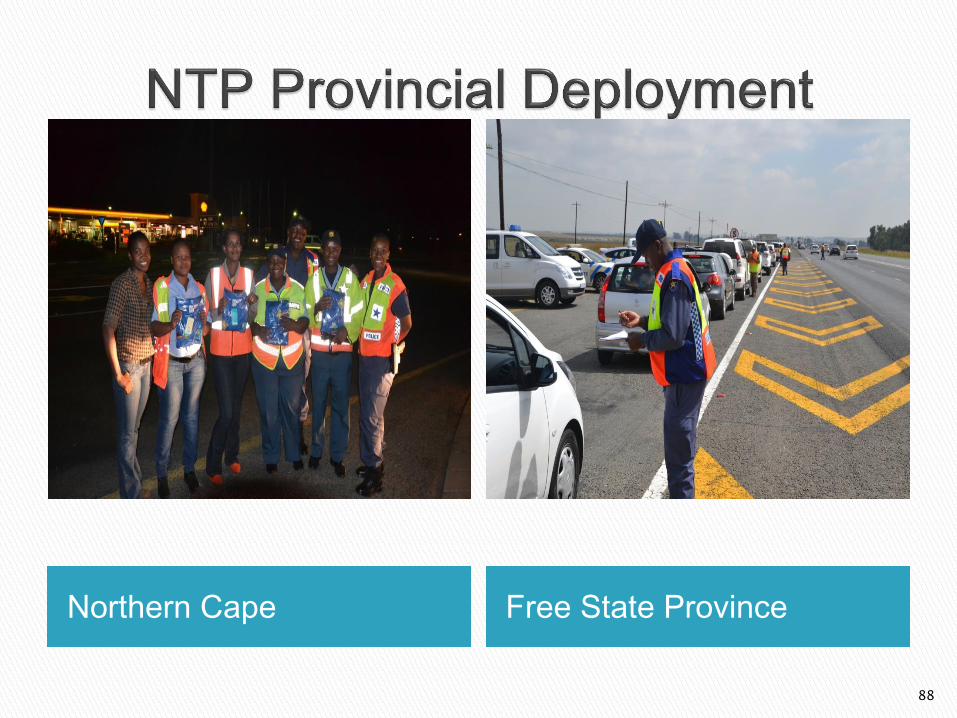
Northern Cape Free State Province
88
Purpose:
To integrate the efforts of all the Transport Agencies involved in road safety with
the aim of minimising resources and maximising effort.
To eliminate duplication of efforts on road safety matters.
To have sustainable road safety programmes throughout the year.
Target Audience:
All road users.
Envisaged Impact:
Elimination of duplication in efforts by Transport Agencies
Co-ordinated high impact programmes and campaigns
Year round sustainable road safety programmes
89
90
Aim
To reduce the incidence of habitual offenders by shaming them on public
platforms. (Print, electronic and social media). The will include the shaming
of any driver who was found guilty by a court of law, of one or more of the
following arrestable offences:
Driving under the influence of alcohol and other substances with narcotic
effects (section 65), Reckless, negligent and inconsiderate driving (section
63), Excessive speeding (section 59)
Outcome
Greater awareness and compliance
91
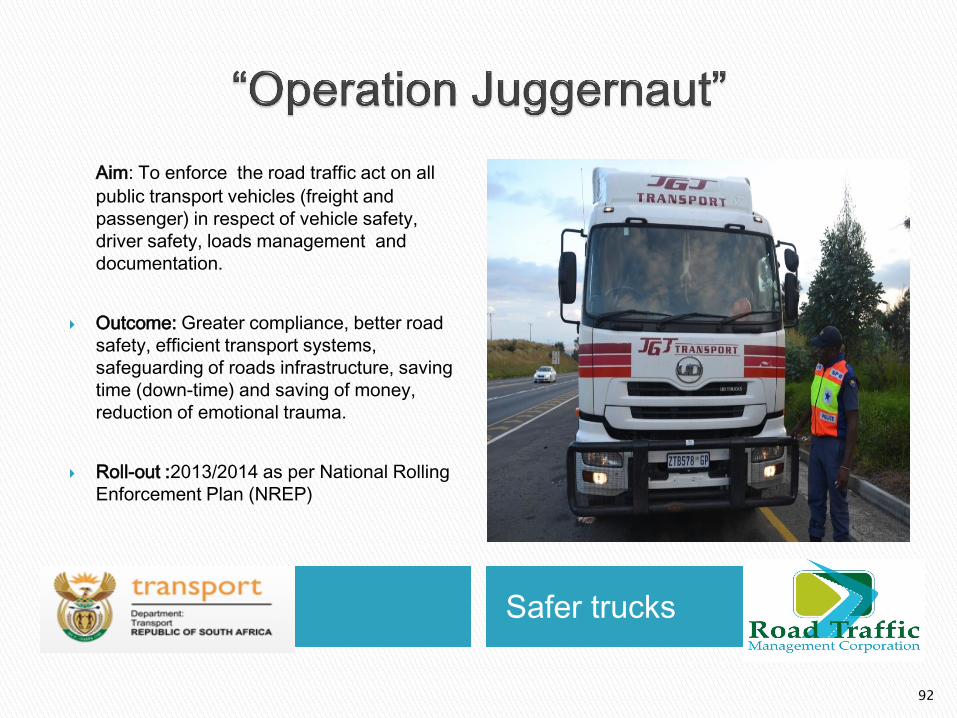
Safer trucks
Aim: To enforce the road traffic act on all
public transport vehicles (freight and
passenger) in respect of vehicle safety,
driver safety, loads management and
documentation.
Outcome: Greater compliance, better road
safety, efficient transport systems,
safeguarding of roads infrastructure, saving
time (down-time) and saving of money,
reduction of emotional trauma.
Roll-out :2013/2014 as per National Rolling
Enforcement Plan (NREP)
92
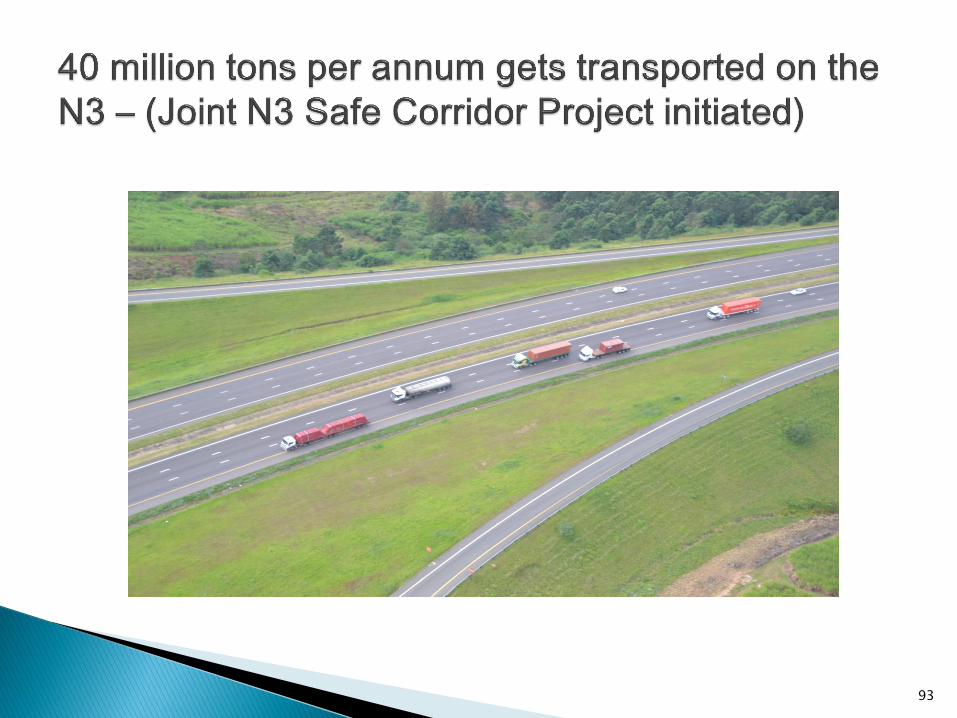
93
November 2013 Port Elizabeth
National Traffic Chiefs’
Summit:
Share best practices;
Raise issues as
resolutions
Harmonize and
collaborate
National Road Safety
Awards’ Function
Five disciplines
11 categories
Morale booster
Great incentive
94
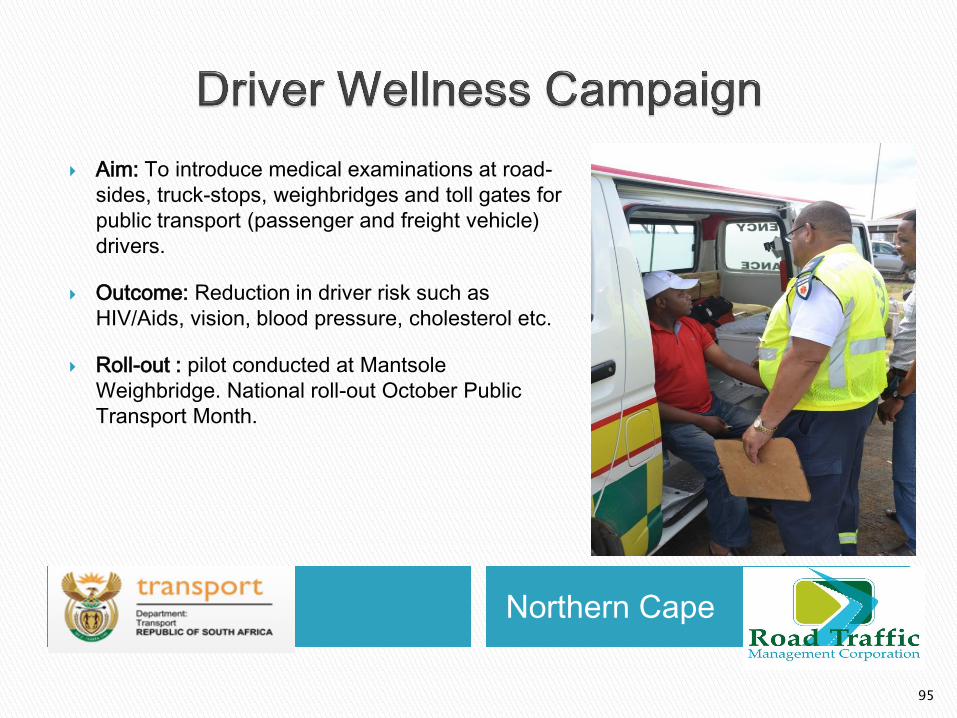
Northern Cape
Aim: To introduce medical examinations at road-
sides, truck-stops, weighbridges and toll gates for
public transport (passenger and freight vehicle)
drivers.
Outcome: Reduction in driver risk such as
HIV/Aids, vision, blood pressure, cholesterol etc.
Roll-out : pilot conducted at Mantsole
Weighbridge. National roll-out October Public
Transport Month.
95
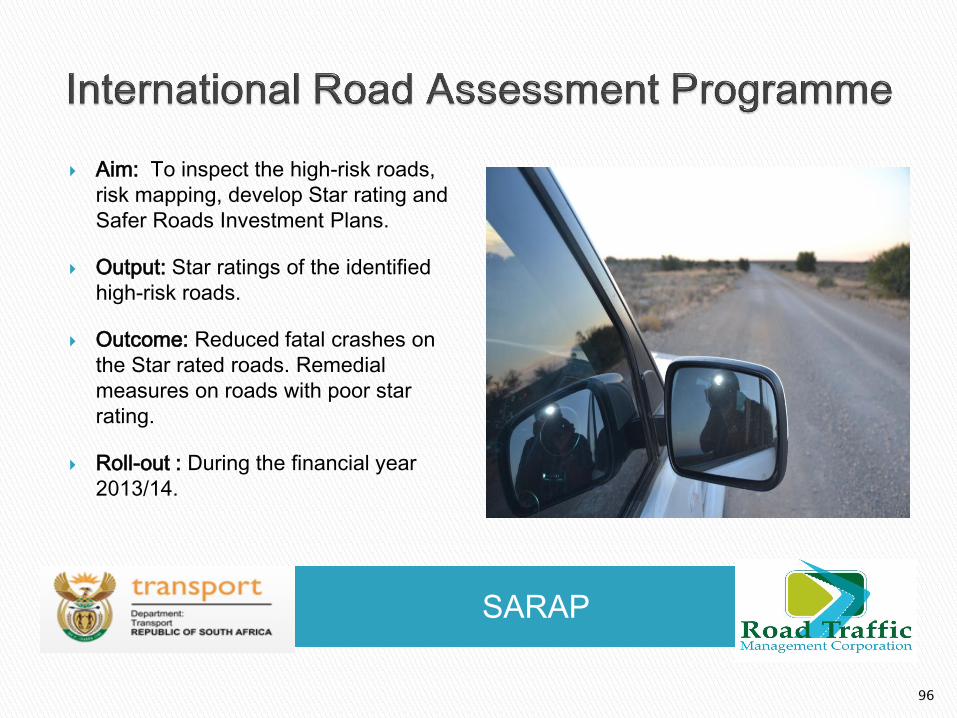
SARAP
Aim: To inspect the high-risk roads,
risk mapping, develop Star rating and
Safer Roads Investment Plans.
Output: Star ratings of the identified
high-risk roads.
Outcome: Reduced fatal crashes on
the Star rated roads. Remedial
measures on roads with poor star
rating.
Roll-out : During the financial year
2013/14.
96
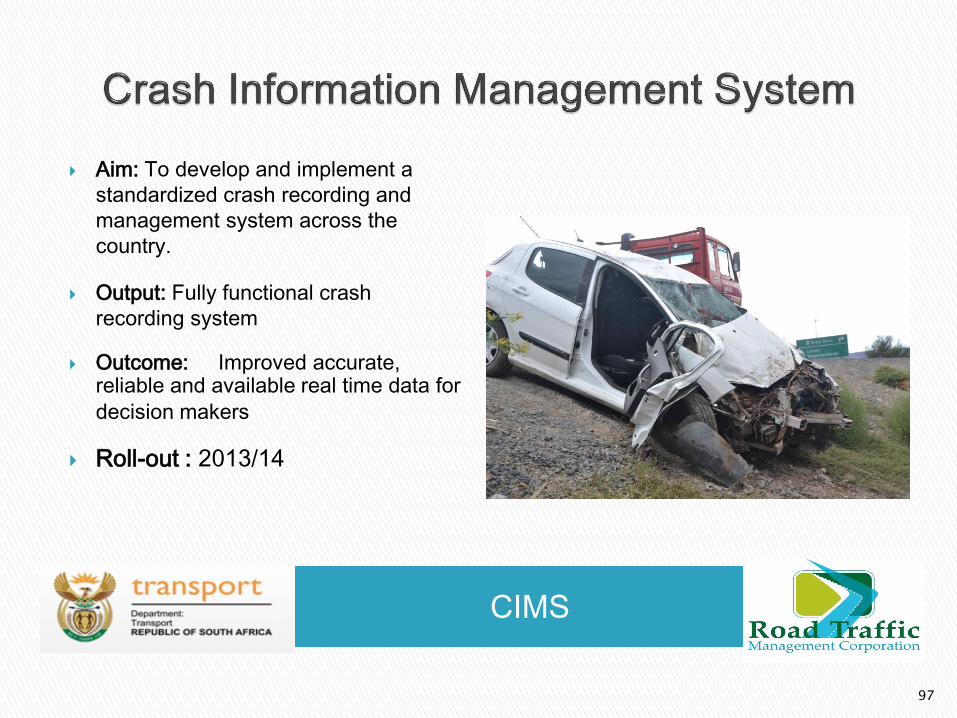
CIMS
Aim: To develop and implement a
standardized crash recording and
management system across the
country.
Output: Fully functional crash
recording system
Outcome: Improved accurate, reliable and available real time data for
decision makers
Roll-out : 2013/14
97
Aim
To establish a National Traffic Academy that can capacitate officials beyond the
current basic training programmes with specific focus on specialized training courses.
Output
Well trained officials who can deal effectively with the carnage on our roads.
Outcome
Trained - supervisors, crash investigators, college facilitators, road safety officers,
road safety auditors and special traffic enforcement units.
Roll-out
Awaits the completion of the CSIR feasibility study and draft business plan for this
Academy. May be situated in Gauteng Province and courses may be presented
through out the country.
98
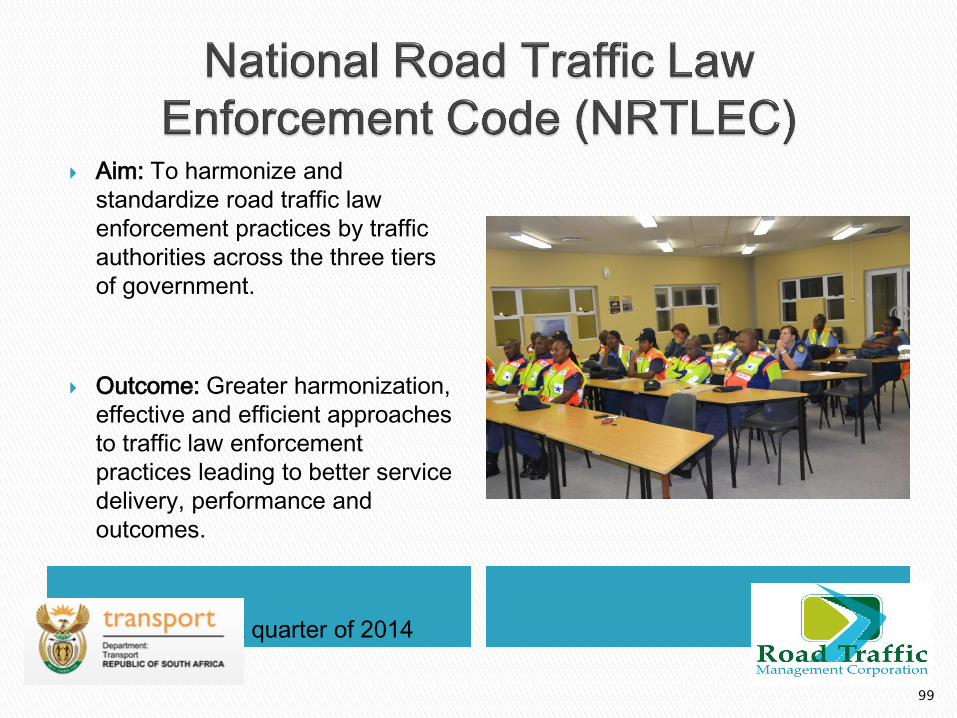
Aim: To harmonize and
standardize road traffic law
enforcement practices by traffic
authorities across the three tiers
of government.
Outcome: Greater harmonization,
effective and efficient approaches
to traffic law enforcement
practices leading to better service
delivery, performance and
outcomes.
Roll-out : First quarter of 2014
99
100
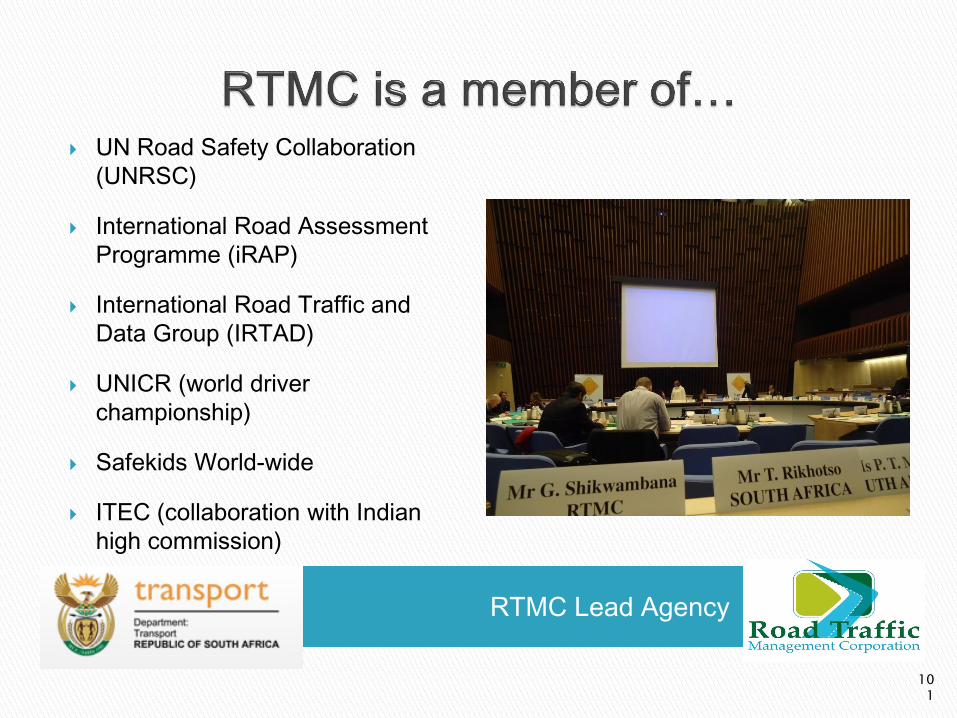
RTMC Lead Agency
UN Road Safety Collaboration
(UNRSC)
International Road Assessment
Programme (iRAP)
International Road Traffic and
Data Group (IRTAD)
UNICR (world driver
championship)
Safekids World-wide
ITEC (collaboration with Indian
high commission)
101
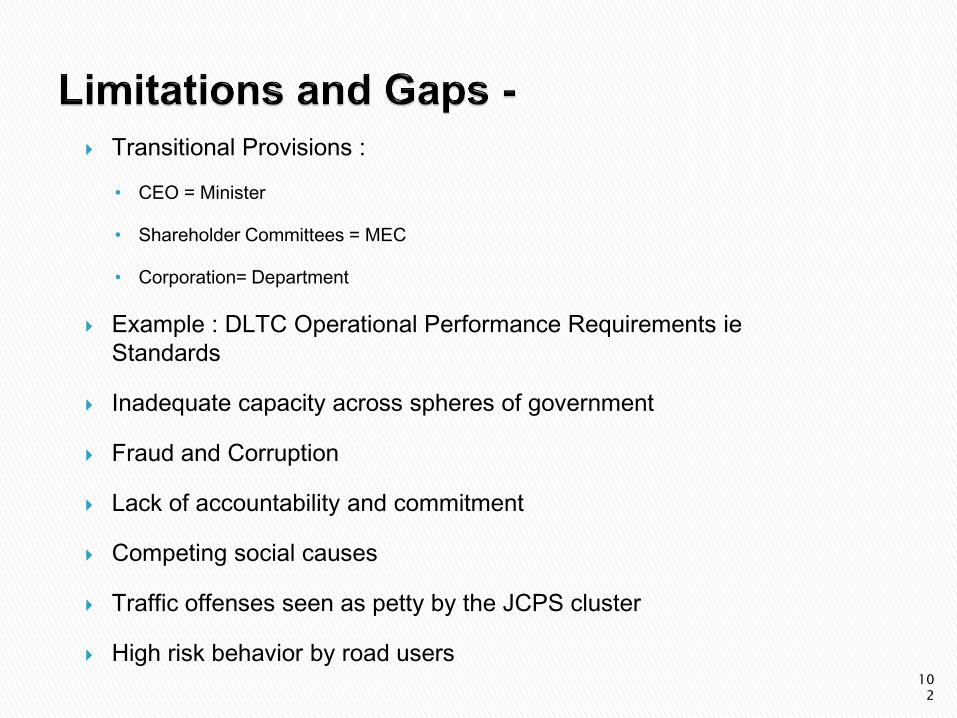
Transitional Provisions :
• CEO = Minister
• Shareholder Committees = MEC
• Corporation= Department
Example : DLTC Operational Performance Requirements ie
Standards
Inadequate capacity across spheres of government
Fraud and Corruption
Lack of accountability and commitment
Competing social causes
Traffic offenses seen as petty by the JCPS cluster
High risk behavior by road users
102
103
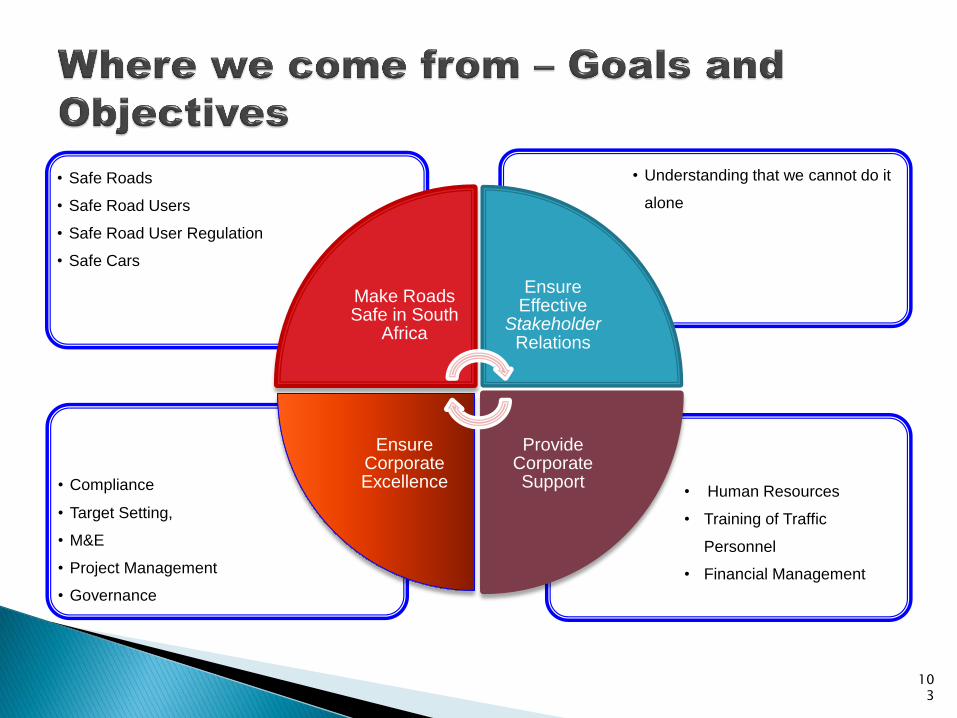
• Human Resources
• Training of Traffic
Personnel
• Financial Management
• Compliance
• Target Setting,
• M&E
• Project Management
• Governance
• Understanding that we cannot do it
alone
• Safe Roads
• Safe Road Users
• Safe Road User Regulation
• Safe Cars
Make Roads Safe in South
Africa
Ensure Effective
Stakeholder Relations
Provide Corporate Support
Ensure Corporate Excellence

104
•Improve revenue generation
•Effective management of operational costs
•Develop funding model
• Develop a 21 century curriculum and cadership for the traffic fraternity
• Establishment of the centre of excellence for high performance
• Create a learning Organisation
• Enhance public confidence and trust in road traffic information
• Implement Innovative Technologies
• Regulation of the road traffic environment
• Enforcement of road traffic management
•Promote and support road safety
•Mobilise and sustain relations with other spheres of government
•Promote private sector participation
•Combat fraud and corruption
•Collaboate with DOT on road safety
IMPROVED AND INSTITUTIONALISED
STAKEHOLDER RELATIONS
ENABLING LEGISLATION TO PROMOTE ROAD
SAFETY
ENSURED FINANCIAL
SUSTAINABILITY
DYNAMIC AND TRANSFORMED ORGANISATION
105
“My blood will nourish the trees that will bear the fruits of
freedom, tell my people that I love them, they must continue to
fight.” Solomon Mahlangu