Embed Size (px)
Citation preview
October 2, 2017 1October 2, 2017 1
Advanced Distribution Management
Systems and Distribution Automation
Distribution Systems and Planning Training for New England Conference of Public Utility Commissioners, Sept. 27-29, 2017
Murali Baggu (NREL) and Kevin Schneider (PNNL)
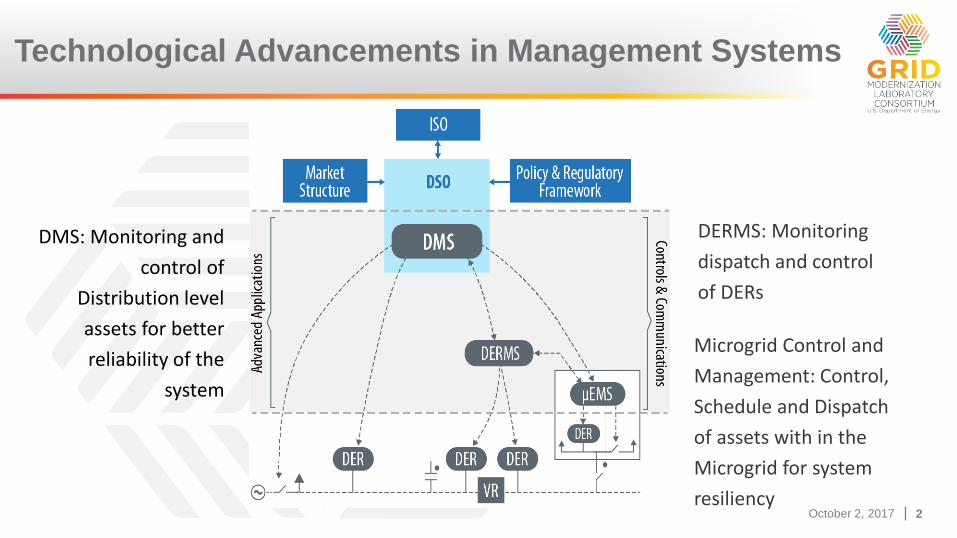
October 2, 2017 2October 2, 2017 2
DMS: Monitoring and
control of
Distribution level
assets for better
reliability of the
system
Technological Advancements in Management Systems
DERMS: Monitoring
dispatch and control
of DERs
Microgrid Control and
Management: Control,
Schedule and Dispatch
of assets with in the
Microgrid for system
resiliency
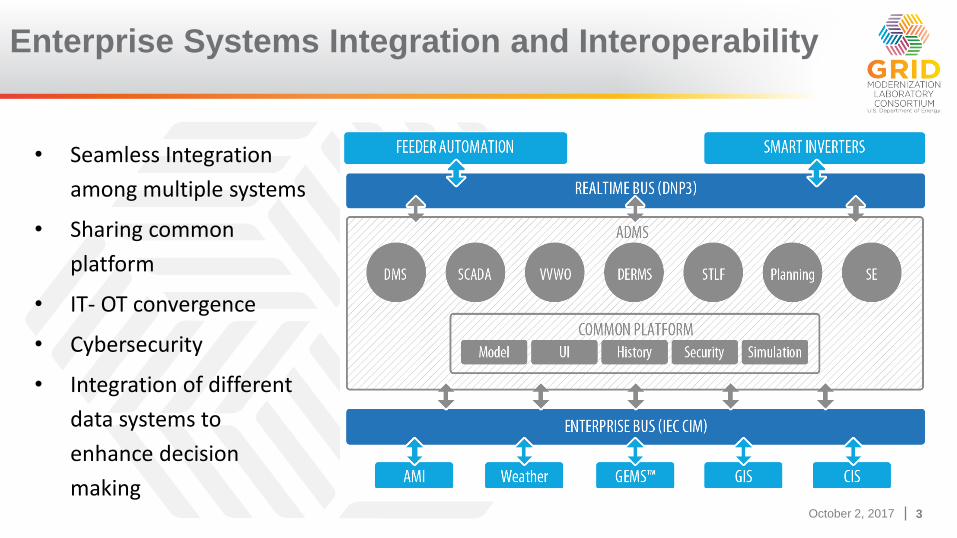
October 2, 2017 3October 2, 2017 3
• Seamless Integration
among multiple systems
• Sharing common
platform
• IT- OT convergence
• Cybersecurity
• Integration of different
data systems to
enhance decision
making
Enterprise Systems Integration and Interoperability
October 2, 2017 4October 2, 2017 4
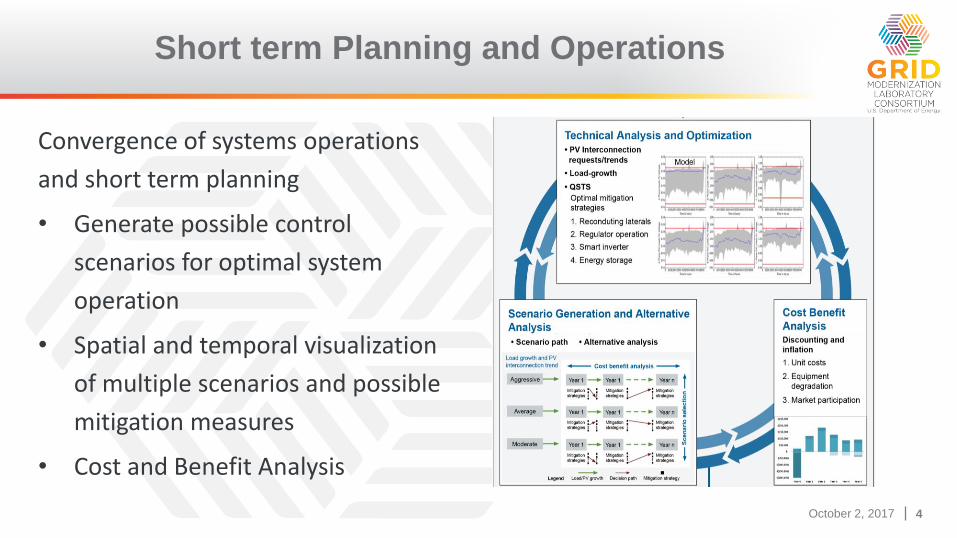
Short term Planning and Operations
Convergence of systems operations
and short term planning
• Generate possible control
scenarios for optimal system
operation
• Spatial and temporal visualization
of multiple scenarios and possible
mitigation measures
• Cost and Benefit Analysis
October 2, 2017 5October 2, 2017 5
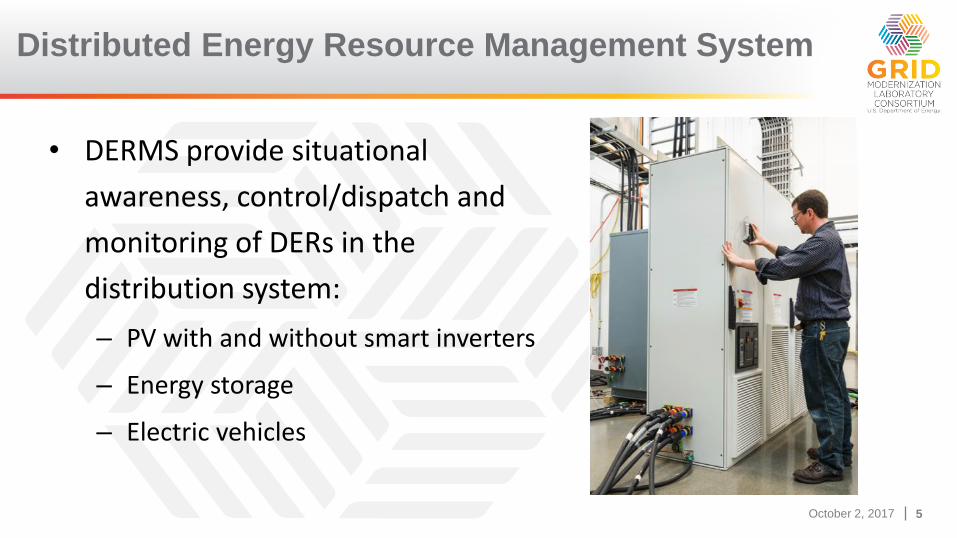
• DERMS provide situational
awareness, control/dispatch and
monitoring of DERs in the
distribution system:
– PV with and without smart inverters
– Energy storage
– Electric vehicles
Distributed Energy Resource Management System
October 2, 2017 6October 2, 2017 6
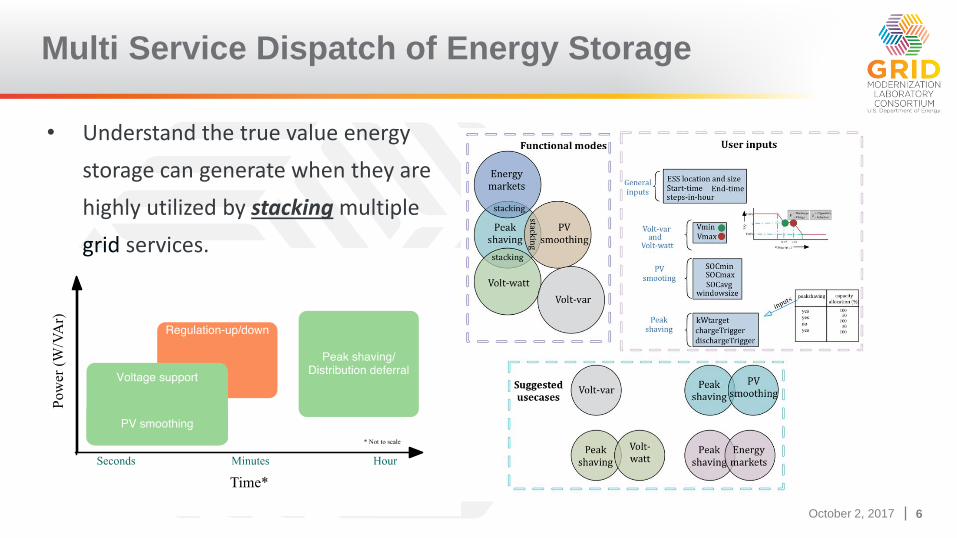
• Understand the true value energy
storage can generate when they are
highly utilized by stacking multiple
grid services.
Multi Service Dispatch of Energy Storage
October 2, 2017 7October 2, 2017 7
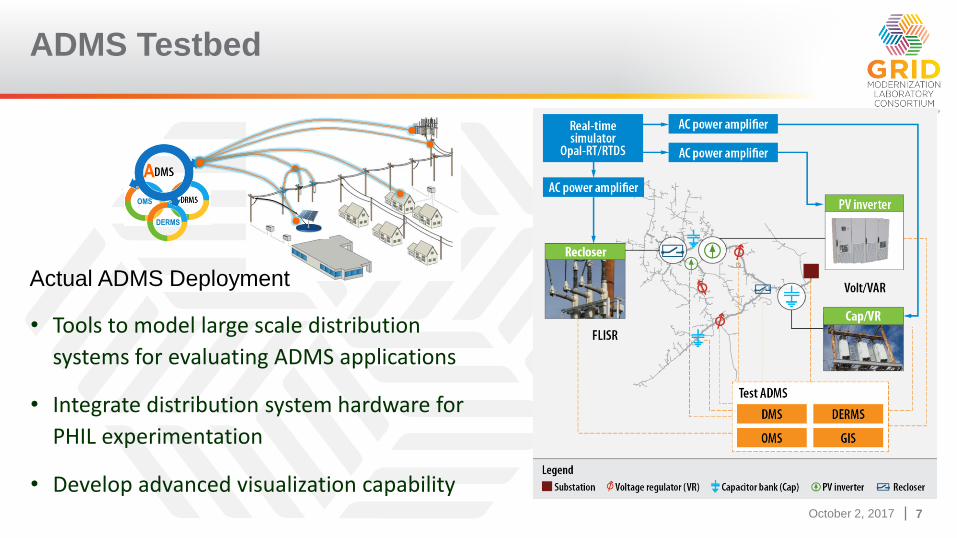
• Tools to model large scale distribution
systems for evaluating ADMS applications
• Integrate distribution system hardware for
PHIL experimentation
• Develop advanced visualization capability
ADMS Testbed
OMS
DERMS
A
Actual ADMS Deployment
October 2, 2017 8October 2, 2017 8
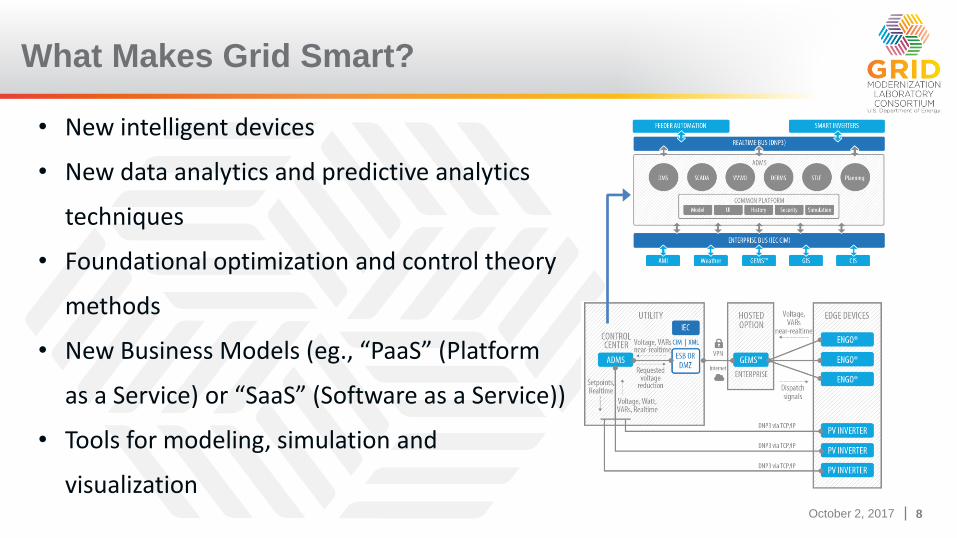
What Makes Grid Smart?
• New intelligent devices
• New data analytics and predictive analytics
techniques
• Foundational optimization and control theory
methods
• New Business Models (eg., “PaaS” (Platform
as a Service) or “SaaS” (Software as a Service))
• Tools for modeling, simulation and
visualization
October 2, 2017 9October 2, 2017 9
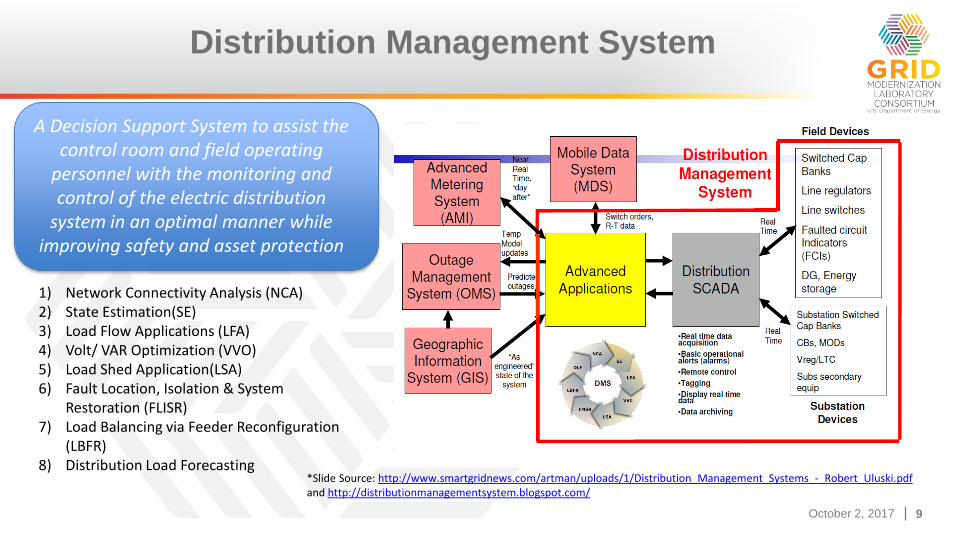
A Decision Support System to assist the control room and field operating
personnel with the monitoring and control of the electric distribution
system in an optimal manner while improving safety and asset protection
Distribution Management System
1) Network Connectivity Analysis (NCA)2) State Estimation(SE)3) Load Flow Applications (LFA)4) Volt/ VAR Optimization (VVO)5) Load Shed Application(LSA)6) Fault Location, Isolation & System
Restoration (FLISR)7) Load Balancing via Feeder Reconfiguration
(LBFR)8) Distribution Load Forecasting
*Slide Source: http://www.smartgridnews.com/artman/uploads/1/Distribution_Management_Systems_-_Robert_Uluski.pdfand http://distributionmanagementsystem.blogspot.com/
October 2, 2017 10
Distribution Grid Modernization – Advanced
Distribution Management Systems Applications
October 2, 2017 11October 2, 2017 11
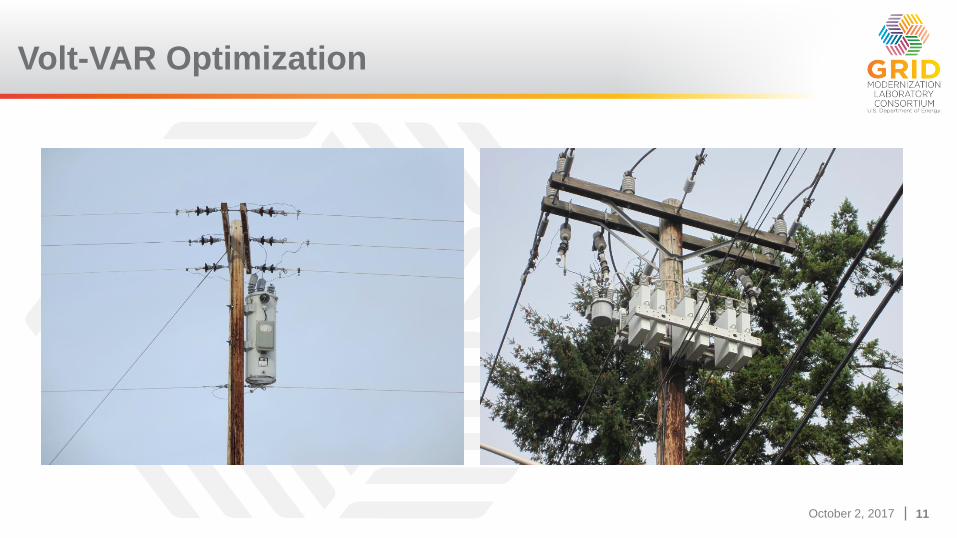
Volt-VAR Optimization
October 2, 2017 12October 2, 2017 12
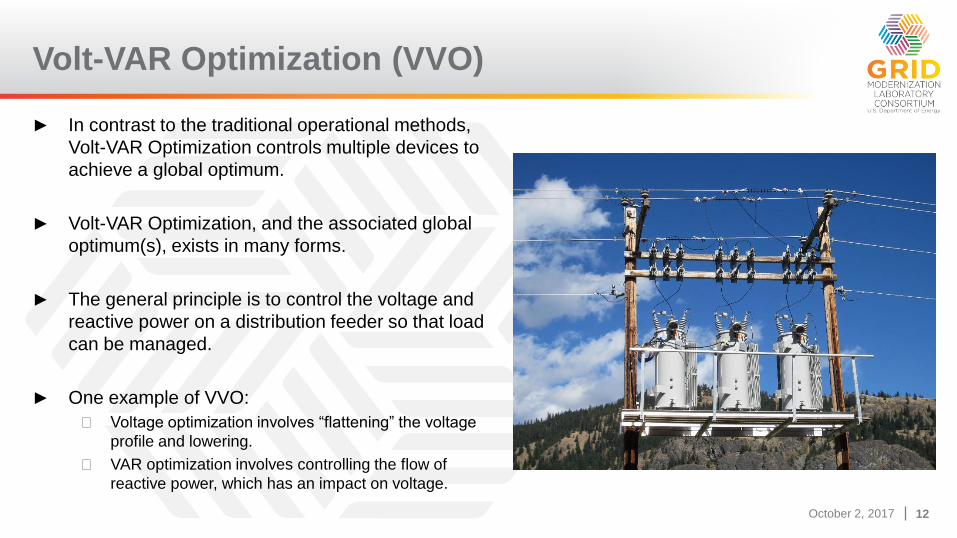
Volt-VAR Optimization (VVO)
► In contrast to the traditional operational methods,
Volt-VAR Optimization controls multiple devices to
achieve a global optimum.
► Volt-VAR Optimization, and the associated global
optimum(s), exists in many forms.
► The general principle is to control the voltage and
reactive power on a distribution feeder so that load
can be managed.
► One example of VVO:
◼ Voltage optimization involves “flattening” the voltage
profile and lowering.
◼ VAR optimization involves controlling the flow of
reactive power, which has an impact on voltage.
October 2, 2017 13October 2, 2017 13
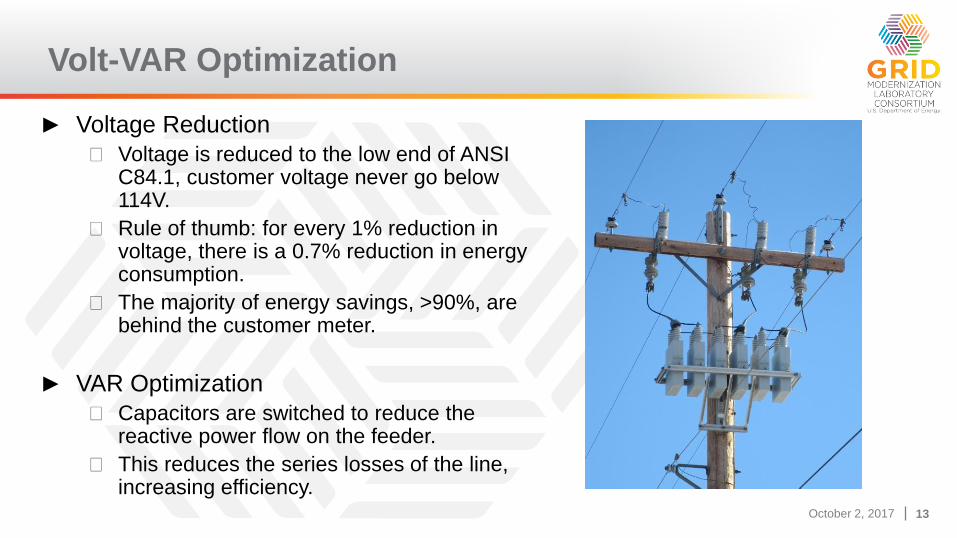
Volt-VAR Optimization
► Voltage Reduction
◼ Voltage is reduced to the low end of ANSI C84.1, customer voltage never go below 114V.
◼ Rule of thumb: for every 1% reduction in voltage, there is a 0.7% reduction in energy consumption.
◼ The majority of energy savings, >90%, are behind the customer meter.
► VAR Optimization
◼ Capacitors are switched to reduce the reactive power flow on the feeder.
◼ This reduces the series losses of the line, increasing efficiency.
October 2, 2017 14October 2, 2017 14
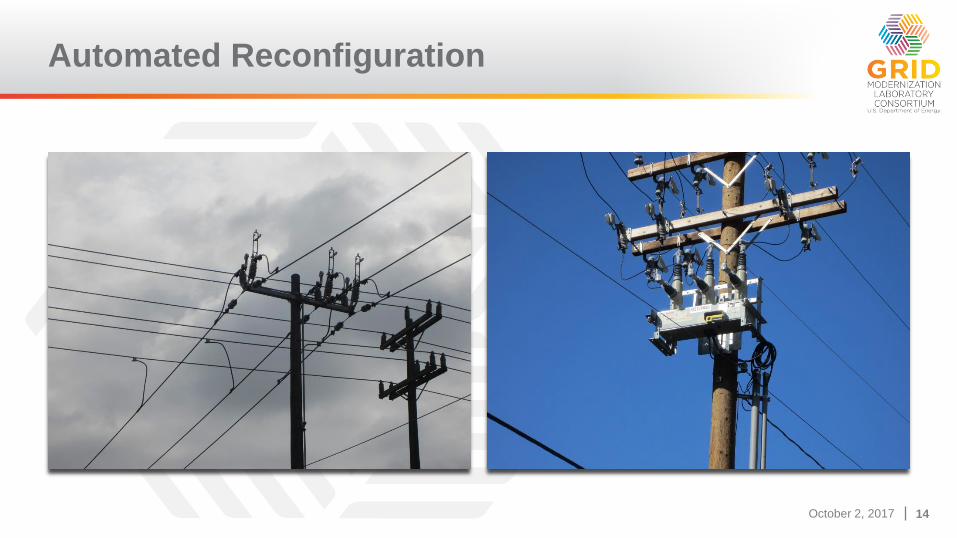
Automated Reconfiguration
October 2, 2017 15October 2, 2017 15
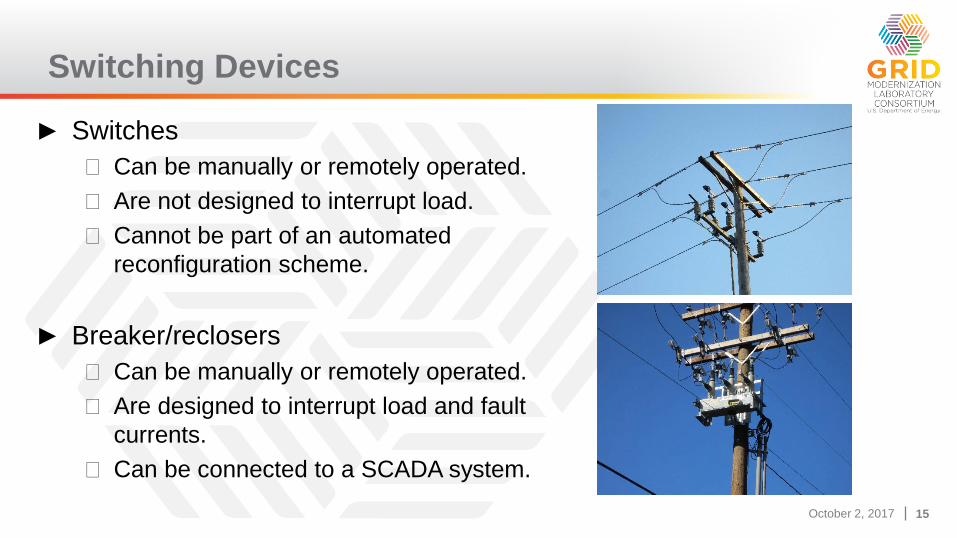
Switching Devices
► Switches
◼ Can be manually or remotely operated.
◼ Are not designed to interrupt load.
◼ Cannot be part of an automated
reconfiguration scheme.
► Breaker/reclosers
◼ Can be manually or remotely operated.
◼ Are designed to interrupt load and fault
currents.
◼ Can be connected to a SCADA system.
October 2, 2017 16October 2, 2017 16
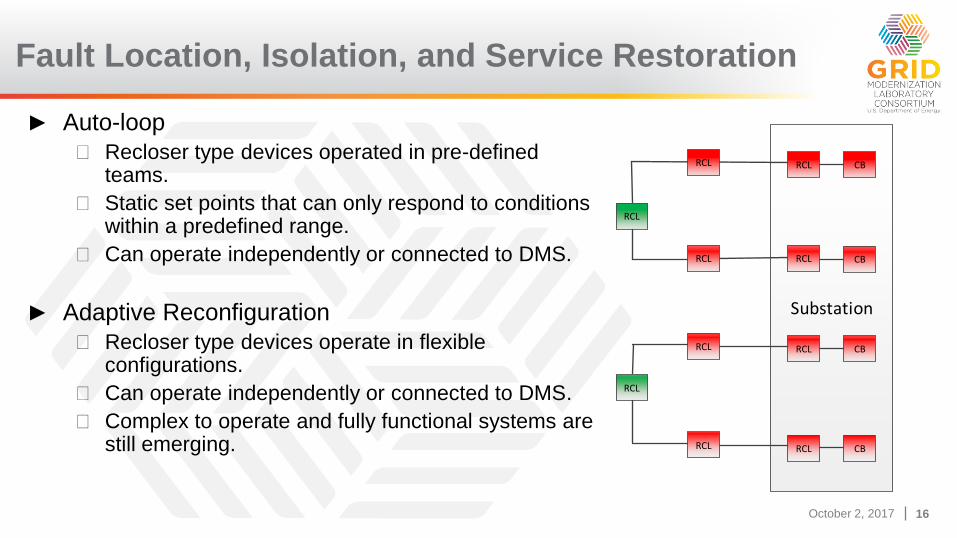
Fault Location, Isolation, and Service Restoration
► Auto-loop
◼ Recloser type devices operated in pre-defined teams.
◼ Static set points that can only respond to conditions within a predefined range.
◼ Can operate independently or connected to DMS.
► Adaptive Reconfiguration
◼ Recloser type devices operate in flexible configurations.
◼ Can operate independently or connected to DMS.
◼ Complex to operate and fully functional systems are still emerging.
Substation
CB
CB
RCL
RCL
CB
CB
RCL
RCL
RCL
RCL
RCL
RCL
RCL
RCL
October 2, 2017 17October 2, 2017 17
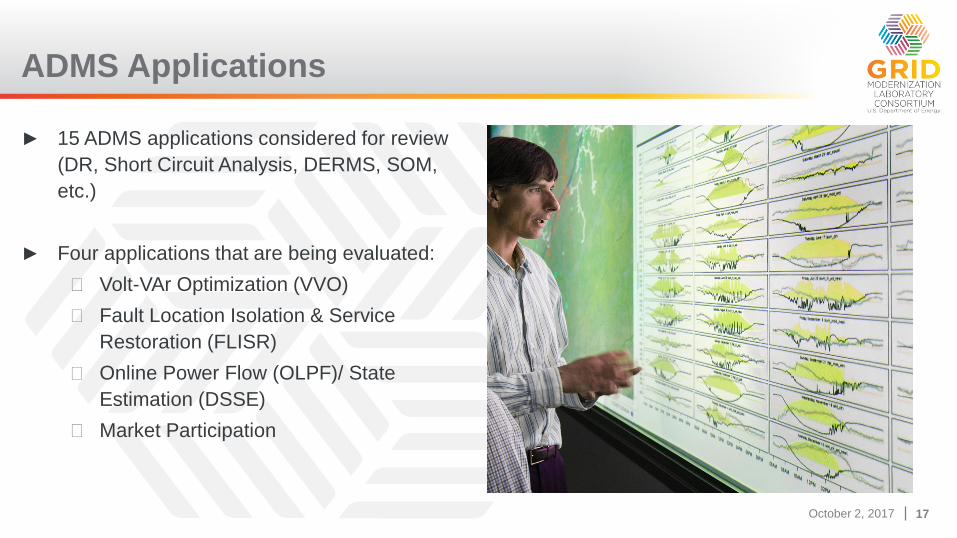
► 15 ADMS applications considered for review
(DR, Short Circuit Analysis, DERMS, SOM,
etc.)
► Four applications that are being evaluated:
◼ Volt-VAr Optimization (VVO)
◼ Fault Location Isolation & Service
Restoration (FLISR)
◼ Online Power Flow (OLPF)/ State
Estimation (DSSE)
◼ Market Participation
ADMS Applications
October 2, 2017 18October 2, 2017 18
► Model Improvement
◼ data needs for feeder models; specs and locations for adding new telemetry points; evaluate
impact on ADMS applications
► Calibrate OLPF/DSSE functions
◼ Compare the states testbed measurements, tune algorithms
► Evaluate performance of hierarchical distributed sensing
◼ Integrating sensing technologies like AMI, OpenFMB, OpenADR, grid-edge smart controls,
distribution PMUs
► Modeling loss of PV
◼ Behavior of behind-the-meter components (PV), net load allocation, integrate forecasting,
customer facility data, load models, etc.
OLPF/DSSE Use Cases
October 2, 2017 19October 2, 2017 19
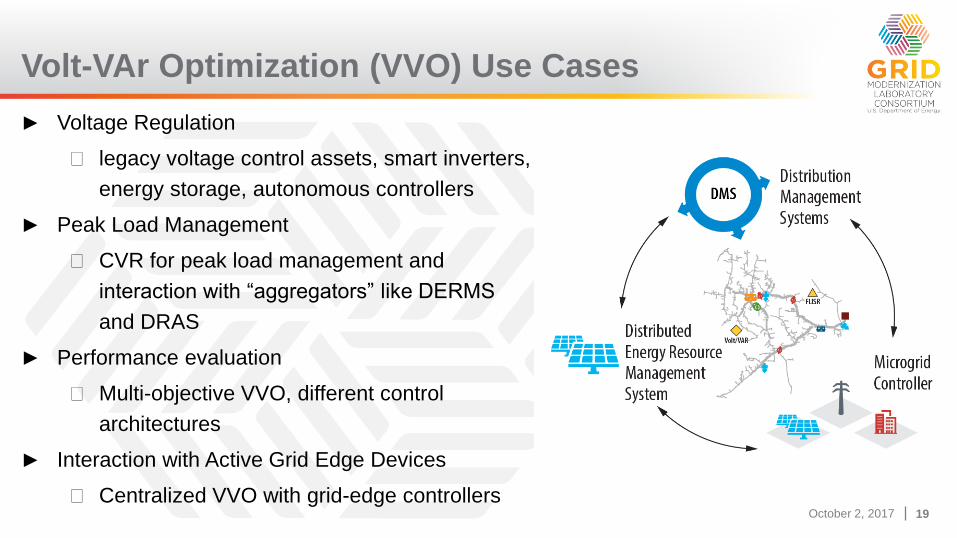
► Voltage Regulation
◼ legacy voltage control assets, smart inverters,
energy storage, autonomous controllers
► Peak Load Management
◼ CVR for peak load management and
interaction with “aggregators” like DERMS
and DRAS
► Performance evaluation
◼ Multi-objective VVO, different control
architectures
► Interaction with Active Grid Edge Devices
◼ Centralized VVO with grid-edge controllers
Volt-VAr Optimization (VVO) Use Cases
October 2, 2017 20October 2, 2017 20
► High Penetration of DERs
◼ Upstream & downstream DERs; line loading before and after fault; intermittency &
visibility challenges
► Interaction with Microgrids
◼ Impact of temporary fault, black start, need for direct comm
► Very High Loading Conditions
◼ Unnecessary backup feeder trip, Use of load forecasting
► Multiple Simultaneous Faults
◼ Thunderstorms leading to multiple faults, feeder re-tripping & lockouts
► Widespread Outages
◼ Uncertain distribution configurations, comm status and feeder outages
Fault Location Isolation & Service Restoration
(FLISR) Use Cases
October 2, 2017 21October 2, 2017 21
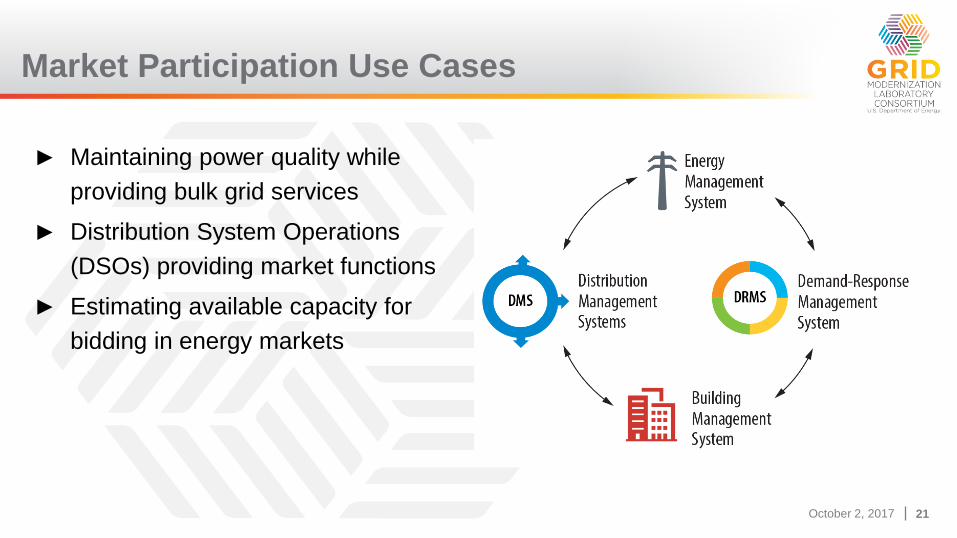
► Maintaining power quality while
providing bulk grid services
► Distribution System Operations
(DSOs) providing market functions
► Estimating available capacity for
bidding in energy markets
Market Participation Use Cases

October 2, 2017 22
ADMS Case Studies
October 2, 2017 23October 2, 2017 23
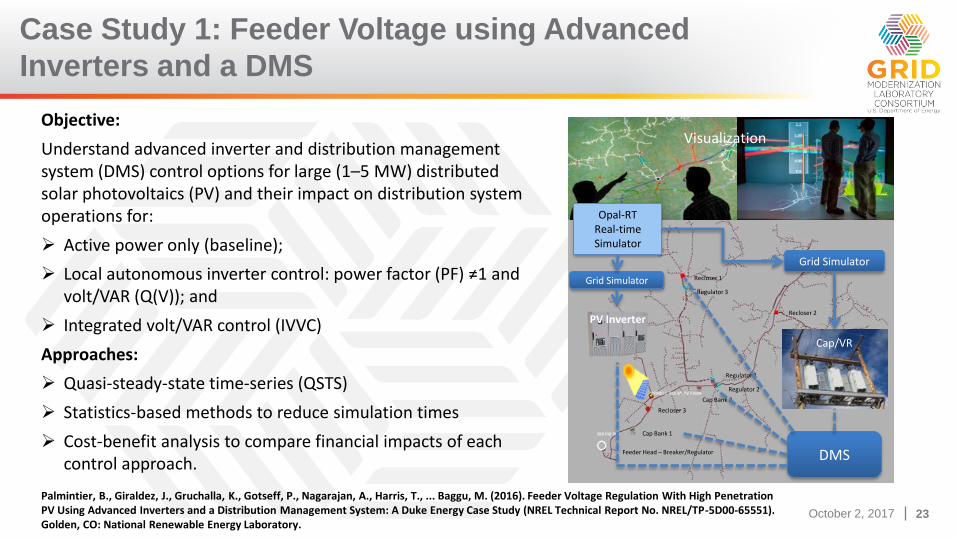
Case Study 1: Feeder Voltage using Advanced
Inverters and a DMS
Objective:
Understand advanced inverter and distribution management system (DMS) control options for large (1–5 MW) distributed solar photovoltaics (PV) and their impact on distribution system operations for:
Active power only (baseline);
Local autonomous inverter control: power factor (PF) ≠1 and volt/VAR (Q(V)); and
Integrated volt/VAR control (IVVC)
Approaches:
Quasi-steady-state time-series (QSTS)
Statistics-based methods to reduce simulation times
Cost-benefit analysis to compare financial impacts of each control approach.
Energy Systems
Integration
Recloser 1
Recloser 2
Recloser 3
Cap Bank 1
Cap Bank 2
Regulator 1
Regulator 2
Regulator 3
Feeder Head – Breaker/Regulator DMS
Opal-RTReal-time Simulator
Grid Simulator
Grid Simulator
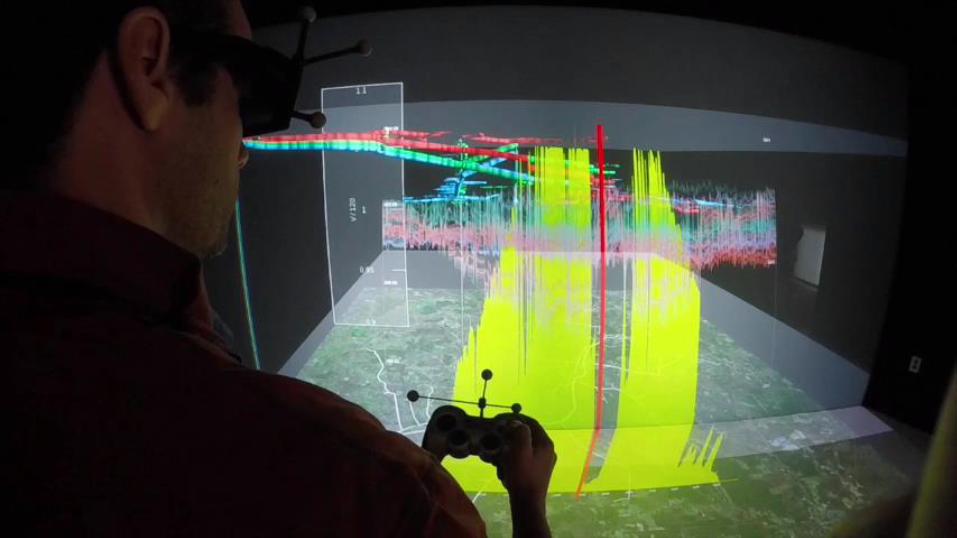
Visualization
PV Inverter
Cap/VR
Palmintier, B., Giraldez, J., Gruchalla, K., Gotseff, P., Nagarajan, A., Harris, T., ... Baggu, M. (2016). Feeder Voltage Regulation With High Penetration PV Using Advanced Inverters and a Distribution Management System: A Duke Energy Case Study (NREL Technical Report No. NREL/TP-5D00-65551). Golden, CO: National Renewable Energy Laboratory.
October 2, 2017 24October 2, 2017 24
The Problem!
October 2, 2017 25October 2, 2017 25
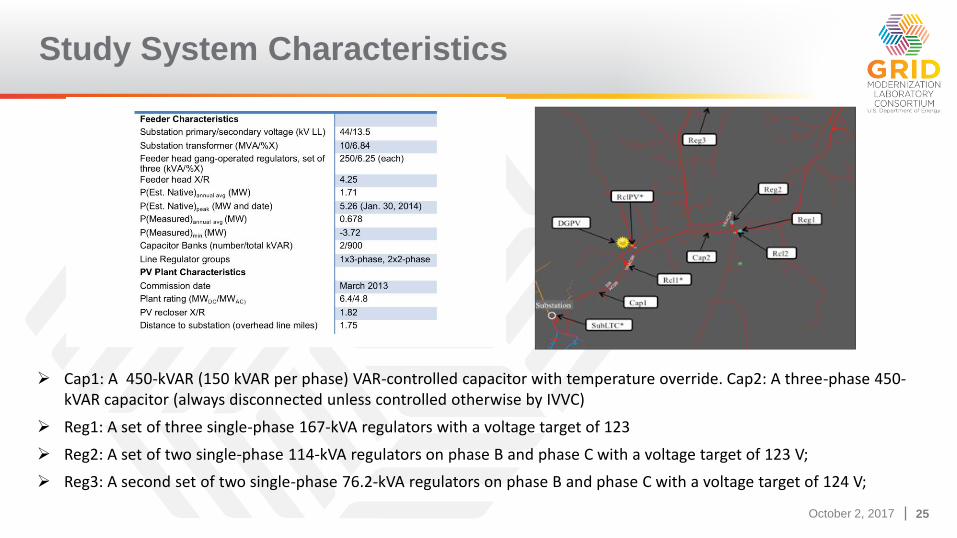
Study System Characteristics
Cap1: A 450-kVAR (150 kVAR per phase) VAR-controlled capacitor with temperature override. Cap2: A three-phase 450-kVAR capacitor (always disconnected unless controlled otherwise by IVVC)
Reg1: A set of three single-phase 167-kVA regulators with a voltage target of 123
Reg2: A set of two single-phase 114-kVA regulators on phase B and phase C with a voltage target of 123 V;
Reg3: A second set of two single-phase 76.2-kVA regulators on phase B and phase C with a voltage target of 124 V;
October 2, 2017 26October 2, 2017 26
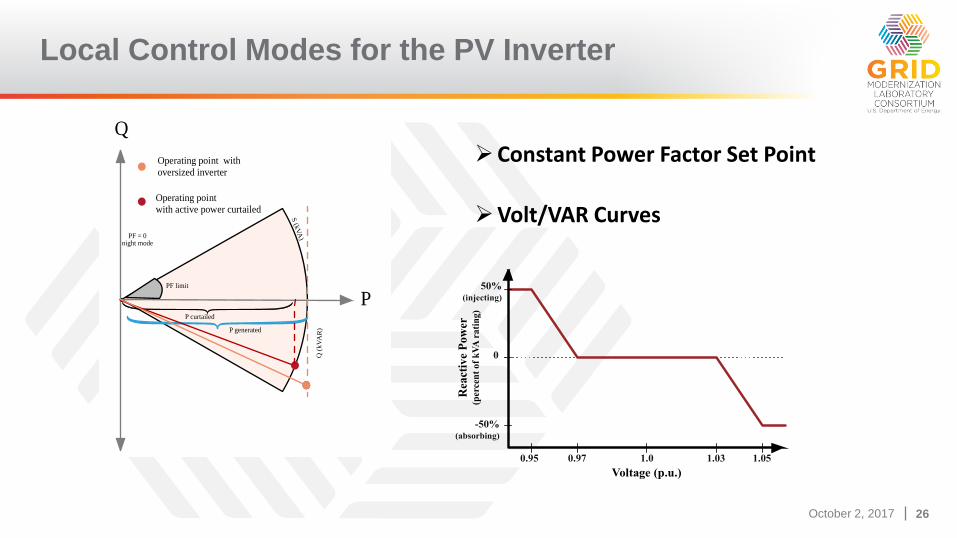
PF limit
P generated
P curtailedQ
(k
VA
R)
S (k
VA
)
Q
P
PF = 0 night mode
Operating point
with active power curtailed
Operating point with
oversized inverter
0.97 1.03
Voltage (p.u.)R
eact
ive
Po
wer
(per
cen
t of
kV
A r
ati
ng)
0
0.95 1.051.0
-50%(absorbing)
50%(injecting)
Constant Power Factor Set Point
Volt/VAR Curves
Local Control Modes for the PV Inverter
October 2, 2017 27October 2, 2017 27
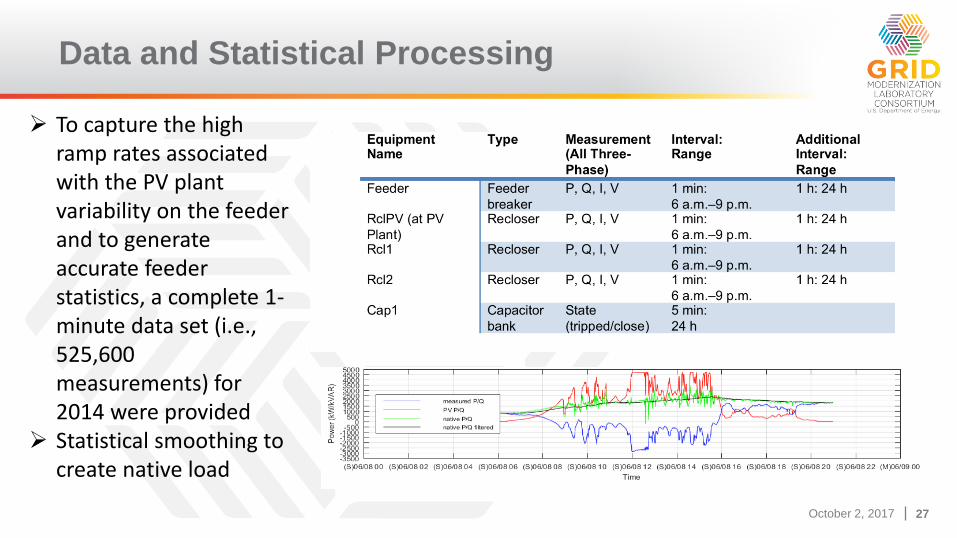
Data and Statistical Processing
To capture the high ramp rates associated with the PV plant variability on the feeder and to generate accurate feeder statistics, a complete 1-minute data set (i.e., 525,600 measurements) for 2014 were provided
Statistical smoothing to create native load
October 2, 2017 28October 2, 2017 28
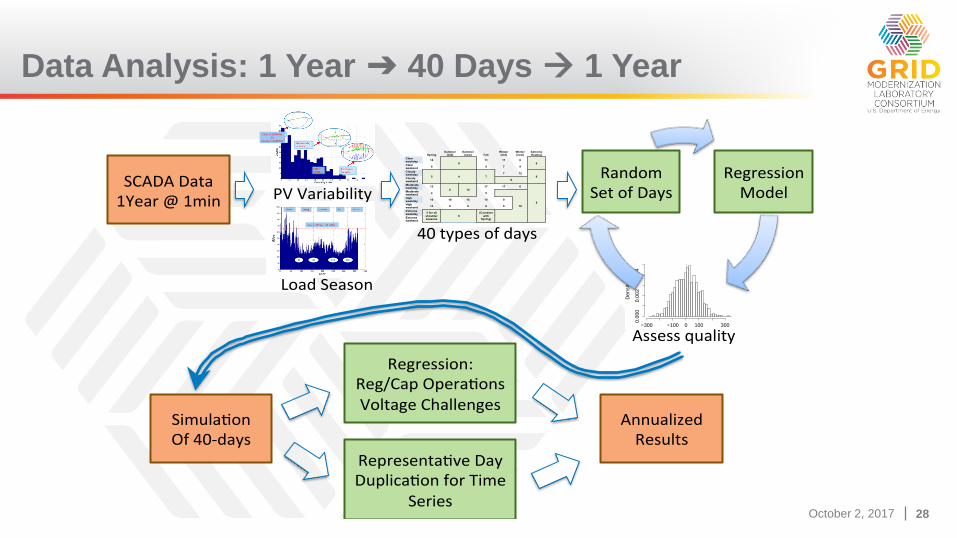
Data Analysis: 1 Year ➔ 40 Days 1 Year
Clear(>35MWh)Or
Cloudy(<10MWh)
Spring Summer
(old) Summer
(new) Fall Winter (old)
Winter (new)
Extreme Heating
Clear weekday
14
9
11 11 6
6 Clear weekend
5 5 7 9
Cloudy weekday
5 4 7
7 12
8 Cloudy weekend
8
Moderate weekday
13
6 14
17 17 6
5
Moderate weekend
4 5
High weekday
16 19 15 15 9
High weekend
13 8 9 6 6 16
Extreme weekday
5 for all
shoulder seasons
6
(Combine
with Spring)
Extreme weekend
Histogram of t
t*
De
nsity
−300 −100 0 100 300
0.0
00
0.0
02
0.0
04
−3 −2 −1 0 1 2 3
−2
00
02
00
Quantiles of Standard Nor mal
t*
SCADAData1Year@1min
RandomSetofDays
RegressionModel
Simula onOf40-days
Regression:Reg/CapOpera onsVoltageChallenges
AnnualizedResults
Representa veDayDuplica onforTime
Series
PVVariability
Assessquality
LoadSeason
40typesofdays
October 2, 2017 29October 2, 2017 29
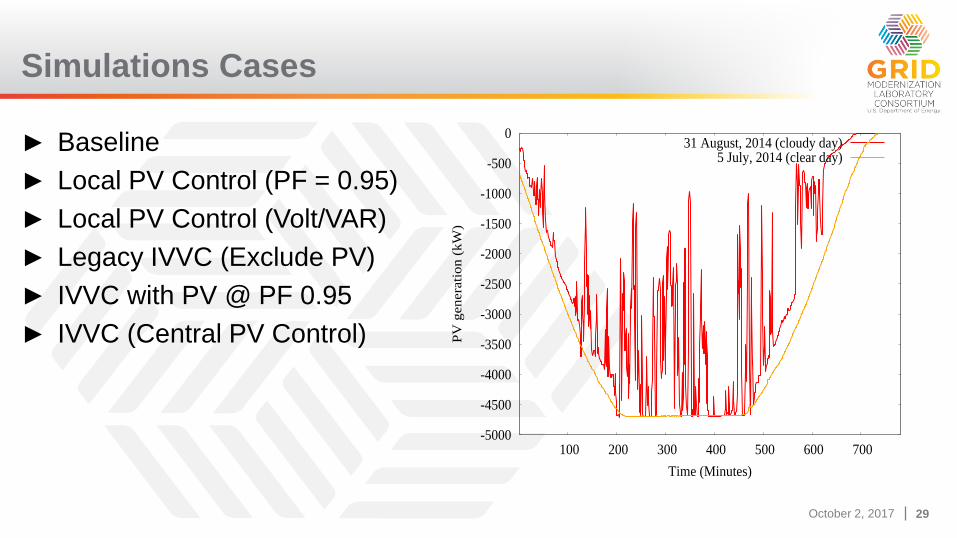
Simulations Cases
► Baseline
► Local PV Control (PF = 0.95)
► Local PV Control (Volt/VAR)
► Legacy IVVC (Exclude PV)
► IVVC with PV @ PF 0.95
► IVVC (Central PV Control)
-5000
-4500
-4000
-3500
-3000
-2500
-2000
-1500
-1000
-500
0
100 200 300 400 500 600 700P
V g
enera
tio
n (
kW
)
Time (Minutes)
31 August, 2014 (cloudy day)5 July, 2014 (clear day)
October 2, 2017 30October 2, 2017 30
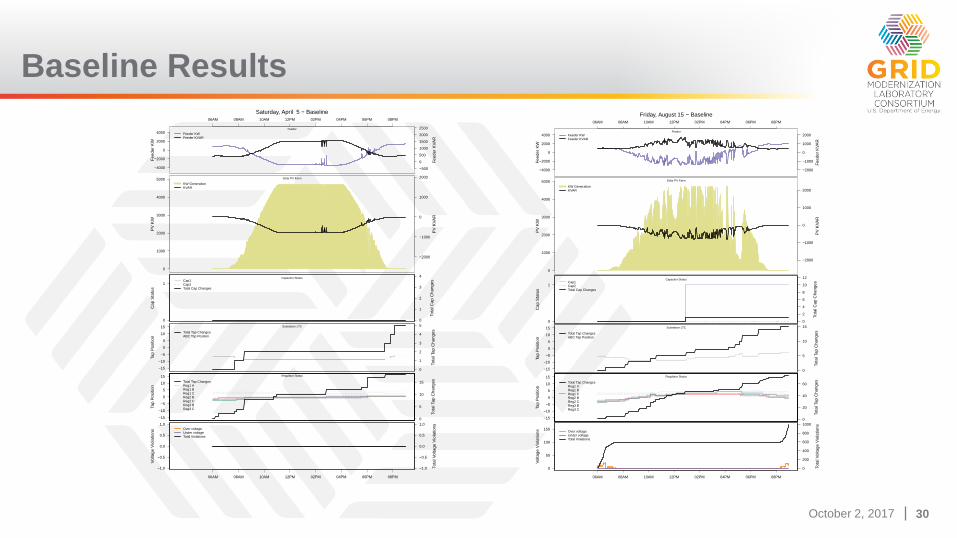
Baseline Results
−4000
−2000
0
2000
4000
06AM 08AM 10AM 12PM 02PM 04PM 06PM 08PM
Saturday, April 5 − Baseline
Fe
ede
r K
W
Fe
ed
er
KV
AR
KV
AR
−500
0
500
1000
1500
2000
2500
Feeder KWFeeder KVAR
Feeder
0
1000
2000
3000
4000
5000
PV
KW
PV
KV
AR
KV
AR
−2000
−1000
0
1000
2000
KW GenerationKVAR
Solar PV Farm
0
1
0
1
2
3
4Cap1Cap2Total Cap Changes
Capacitor Status
Ca
p S
tatu
s
To
tal C
ap
Ch
ang
es
−15
−10
−5
0
5
10
15
Total Tap ChangesABC Tap Position
0
1
2
3
4
5Substation LTC
Ta
p P
ositio
n
To
tal Tap C
han
ge
s
−15
−10
−5
0
5
10
15
Total Tap ChangesReg1 AReg1 BReg1 CReg2 BReg2 CReg3 BReg3 C
0
5
10
15
Regulator Status
Ta
p P
ositio
n
Tota
l Tap
Cha
ng
es
−1.0
−0.5
0.0
0.5
1.0Over voltageUnder voltageTotal Violations
−1.0
−0.5
0.0
0.5
1.0
06AM 08AM 10AM 12PM 02PM 04PM 06PM 08PM
Volta
ge
Vio
lation
s
To
tal V
olta
ge V
iola
tion
s
−4000
−2000
0
2000
4000
06AM 08AM 10AM 12PM 02PM 04PM 06PM 08PM
Friday, August 15 − Baseline
Fe
ede
r K
W
Fe
ed
er
KV
AR
KV
AR
−2000
−1000
0
1000
2000Feeder KWFeeder KVAR
Feeder
0
1000
2000
3000
4000
5000
PV
KW
PV
KV
AR
KV
AR
−2000
−1000
0
1000
2000KW GenerationKVAR
Solar PV Farm
0
1
0
2
4
6
8
10
12Cap1Cap2Total Cap Changes
Capacitor Status
Ca
p S
tatu
s
To
tal C
ap
Ch
ang
es
−15
−10
−5
0
5
10
15
Total Tap ChangesABC Tap Position
0
5
10
15Substation LTC
Ta
p P
ositio
n
To
tal Ta
p C
ha
nge
s
−15
−10
−5
0
5
10
15
Total Tap ChangesReg1 AReg1 BReg1 CReg2 BReg2 CReg3 BReg3 C
0
20
40
60
Regulator Status
Ta
p P
ositio
n
Tota
l Ta
p C
ha
ng
es
0
50
100
150Over voltageUnder voltageTotal Violations
0
200
400
600
800
1000
06AM 08AM 10AM 12PM 02PM 04PM 06PM 08PM
Volta
ge
Vio
lation
s
To
tal V
olta
ge V
iola
tion
s
October 2, 2017 31October 2, 2017 31
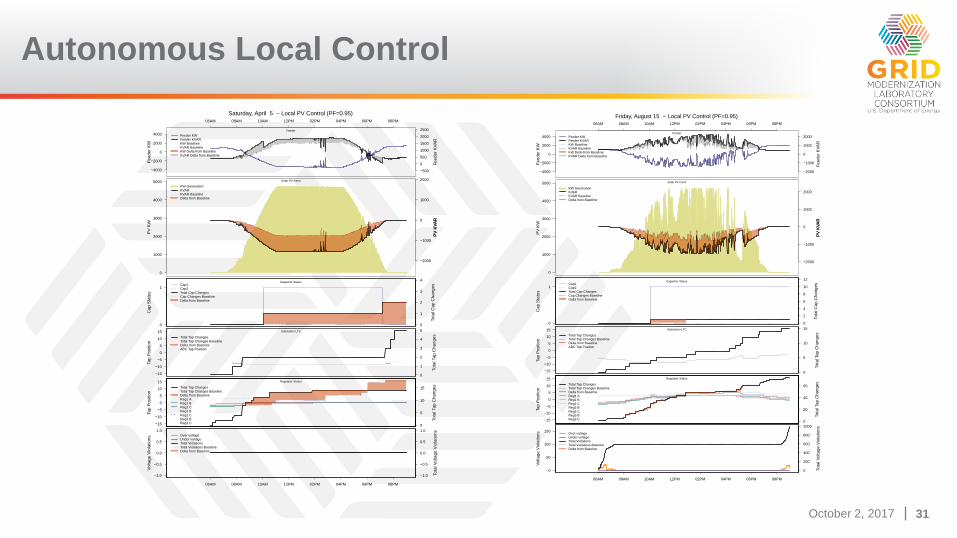
Autonomous Local Control
−4000
−2000
0
2000
4000
06AM 08AM 10AM 12PM 02PM 04PM 06PM 08PM
Saturday, April 5 − Local PV Control (PF=0.95)
Fee
de
r K
W
Fe
ed
er
KV
AR
KV
AR
−500
0
500
1000
1500
2000
2500
Feeder KWFeeder KVARKW BaselineKVAR BaselineKW Delta from BaselineKVAR Delta from Baseline
Feeder
0
1000
2000
3000
4000
5000
PV
KW
PV
KV
AR
KV
AR
−2000
−1000
0
1000
2000
PV
KV
AR
KW GenerationKVARKVAR BaselineDelta from Baseline
Solar PV Farm
0
1
0
1
2
3
4Cap1Cap2Total Cap ChangesCap Changes BaselineDelta from Baseline
Capacitor Status
Ca
p S
tatu
s
To
tal C
ap C
ha
ng
es
−15
−10
−5
0
5
10
15
Total Tap ChangesTotal Tap Changes BaselineDelta from BaselineABC Tap Position
0
1
2
3
4
5Substation LTC
Ta
p P
ositio
n
To
tal Tap C
han
ge
s
−15
−10
−5
0
5
10
15
Total Tap ChangesTotal Tap Changes BaselineDelta from BaselineReg1 AReg1 BReg1 CReg2 BReg2 CReg3 BReg3 C
0
5
10
15
Regulator Status
Ta
p P
ositio
n
Tota
l Tap
Chan
ges
−1.0
−0.5
0.0
0.5
1.0Over voltageUnder voltageTotal ViolationsTotal Violations BaselineDelta from Baseline
−1.0
−0.5
0.0
0.5
1.0
06AM 08AM 10AM 12PM 02PM 04PM 06PM 08PM
Volta
ge
Vio
lation
s
To
tal V
olta
ge V
iola
tion
s
−4000
−2000
0
2000
4000
06AM 08AM 10AM 12PM 02PM 04PM 06PM 08PM
Friday, August 15 − Local PV Control (PF=0.95)
Fe
ede
r K
W
Fe
ed
er
KV
AR
KV
AR
−2000
−1000
0
1000
2000Feeder KWFeeder KVARKW BaselineKVAR BaselineKW Delta from BaselineKVAR Delta from Baseline
Feeder
0
1000
2000
3000
4000
5000
PV
KW
PV
KV
AR
KV
AR
−2000
−1000
0
1000
2000
PV
KV
AR
KW GenerationKVARKVAR BaselineDelta from Baseline
Solar PV Farm
0
1
0
2
4
6
8
10
12Cap1Cap2Total Cap ChangesCap Changes BaselineDelta from Baseline
Capacitor Status
Ca
p S
tatu
s
To
tal C
ap
Ch
ang
es
−15
−10
−5
0
5
10
15
Total Tap ChangesTotal Tap Changes BaselineDelta from BaselineABC Tap Position
0
5
10
15Substation LTC
Ta
p P
ositio
n
To
tal Ta
p C
ha
nge
s
−15
−10
−5
0
5
10
15
Total Tap ChangesTotal Tap Changes BaselineDelta from BaselineReg1 AReg1 BReg1 CReg2 BReg2 CReg3 BReg3 C
0
20
40
60
Regulator Status
Ta
p P
ositio
n
Tota
l Ta
p C
ha
ng
es
0
50
100
150Over voltageUnder voltageTotal ViolationsTotal Violations BaselineDelta from Baseline
0
200
400
600
800
1000
06AM 08AM 10AM 12PM 02PM 04PM 06PM 08PM
Volta
ge
Vio
lation
s
To
tal V
olta
ge V
iola
tion
s
October 2, 2017 32October 2, 2017 32
−4000
−2000
0
2000
4000
06AM 08AM 10AM 12PM 02PM 04PM 06PM 08PM
Saturday, April 5 − Local PV Control (Volt−Var)
Fee
de
r K
W
Fe
ed
er
KV
AR
KV
AR
−500
0
500
1000
1500
2000
2500
Feeder KWFeeder KVARKW BaselineKVAR BaselineKW Delta from BaselineKVAR Delta from Baseline
Feeder
0
1000
2000
3000
4000
5000
PV
KW
PV
KV
AR
KV
AR
−2000
−1000
0
1000
2000
PV
KV
AR
KW GenerationKVARKVAR BaselineDelta from Baseline
Solar PV Farm
0
1
0
1
2
3
4Cap1Cap2Total Cap ChangesCap Changes BaselineDelta from Baseline
Capacitor Status
Ca
p S
tatu
s
To
tal C
ap C
ha
ng
es
−15
−10
−5
0
5
10
15
Total Tap ChangesTotal Tap Changes BaselineDelta from BaselineABC Tap Position
0
1
2
3
4
5Substation LTC
Ta
p P
ositio
n
To
tal Tap C
han
ge
s
−15
−10
−5
0
5
10
15
Total Tap ChangesTotal Tap Changes BaselineDelta from BaselineReg1 AReg1 BReg1 CReg2 BReg2 CReg3 BReg3 C
0
5
10
15
Regulator Status
Ta
p P
ositio
n
Tota
l Tap
Chan
ges
−1.0
−0.5
0.0
0.5
1.0Over voltageUnder voltageTotal ViolationsTotal Violations BaselineDelta from Baseline
−1.0
−0.5
0.0
0.5
1.0
06AM 08AM 10AM 12PM 02PM 04PM 06PM 08PM
Volta
ge
Vio
lation
s
To
tal V
olta
ge V
iola
tion
s
−4000
−2000
0
2000
4000
06AM 08AM 10AM 12PM 02PM 04PM 06PM 08PM
Friday, August 15 − Local PV Control (Volt−Var)
Fee
de
r K
W
Fe
ed
er
KV
AR
KV
AR
−2000
−1000
0
1000
2000Feeder KWFeeder KVARKW BaselineKVAR BaselineKW Delta from BaselineKVAR Delta from Baseline
Feeder
0
1000
2000
3000
4000
5000
PV
KW
PV
KV
AR
KV
AR
−2000
−1000
0
1000
2000
PV
KV
AR
KW GenerationKVARKVAR BaselineDelta from Baseline
Solar PV Farm
0
1
0
2
4
6
8
10
12Cap1Cap2Total Cap ChangesCap Changes BaselineDelta from Baseline
Capacitor Status
Ca
p S
tatu
s
To
tal C
ap C
ha
ng
es
−15
−10
−5
0
5
10
15
Total Tap ChangesTotal Tap Changes BaselineDelta from BaselineABC Tap Position
0
5
10
15Substation LTC
Ta
p P
ositio
n
To
tal Tap C
han
ge
s
−15
−10
−5
0
5
10
15
Total Tap ChangesTotal Tap Changes BaselineDelta from BaselineReg1 AReg1 BReg1 CReg2 BReg2 CReg3 BReg3 C
0
20
40
60
Regulator Status
Ta
p P
ositio
n
Tota
l Tap
Chan
ges
0
50
100
150Over voltageUnder voltageTotal ViolationsTotal Violations BaselineDelta from Baseline
0
200
400
600
800
1000
06AM 08AM 10AM 12PM 02PM 04PM 06PM 08PM
Volta
ge
Vio
lation
s
To
tal V
olta
ge V
iola
tion
s
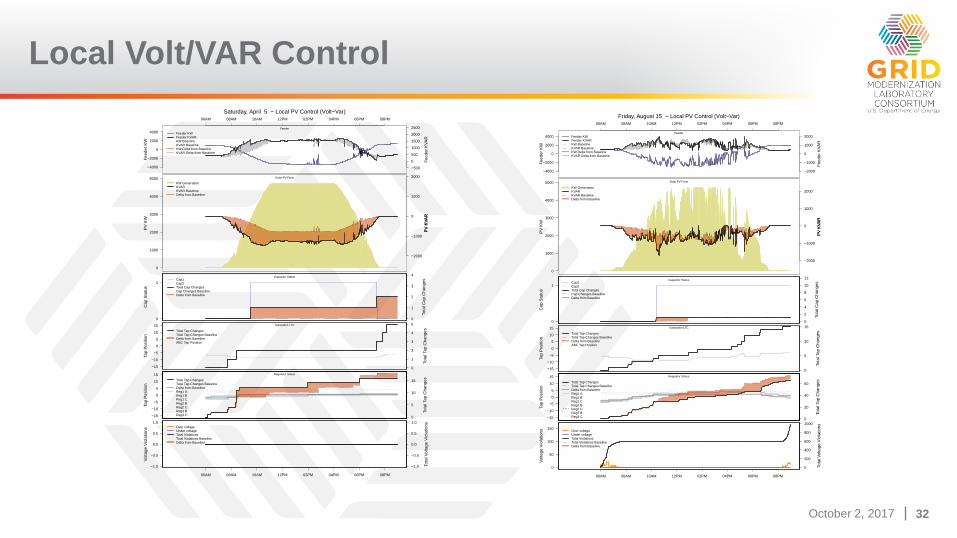
Local Volt/VAR Control
October 2, 2017 33October 2, 2017 33
−4000
−2000
0
2000
4000
06AM 08AM 10AM 12PM 02PM 04PM 06PM 08PM
Saturday, April 5 − Legacy IVVC (exclude PV)
Fee
de
r K
W
Fe
ed
er
KV
AR
KV
AR
−500
0
500
1000
1500
2000
2500
Feeder KWFeeder KVARKW BaselineKVAR BaselineKW Delta from BaselineKVAR Delta from Baseline
Feeder
0
1000
2000
3000
4000
5000
PV
KW
PV
KV
AR
KV
AR
−2000
−1000
0
1000
2000
PV
KV
AR
KW GenerationKVARKVAR BaselineDelta from Baseline
Solar PV Farm
0
1
0
1
2
3
4Cap1Cap2Total Cap ChangesCap Changes BaselineDelta from Baseline
Capacitor Status
Ca
p S
tatu
s
To
tal C
ap C
ha
ng
es
−15
−10
−5
0
5
10
15
Total Tap ChangesTotal Tap Changes BaselineDelta from BaselineABC Tap Position
0
1
2
3
4
5Substation LTC
Ta
p P
ositio
n
To
tal Tap C
han
ge
s
−15
−10
−5
0
5
10
15
Total Tap ChangesTotal Tap Changes BaselineDelta from BaselineReg1 AReg1 BReg1 CReg2 BReg2 CReg3 BReg3 C
0
5
10
15
Regulator Status
Ta
p P
ositio
n
Tota
l Tap
Chan
ges
−1.0
−0.5
0.0
0.5
1.0Over voltageUnder voltageTotal ViolationsTotal Violations BaselineDelta from Baseline
−1.0
−0.5
0.0
0.5
1.0
06AM 08AM 10AM 12PM 02PM 04PM 06PM 08PM
Volta
ge
Vio
lation
s
To
tal V
olta
ge V
iola
tion
s
−4000
−2000
0
2000
4000
06AM 08AM 10AM 12PM 02PM 04PM 06PM 08PM
Friday, August 15 − Legacy IVVC (exclude PV)
Fe
ede
r K
W
Fe
ed
er
KV
AR
KV
AR
−2000
−1000
0
1000
2000Feeder KWFeeder KVARKW BaselineKVAR BaselineKW Delta from BaselineKVAR Delta from Baseline
Feeder
0
1000
2000
3000
4000
5000
PV
KW
PV
KV
AR
KV
AR
−2000
−1000
0
1000
2000
PV
KV
AR
KW GenerationKVARKVAR BaselineDelta from Baseline
Solar PV Farm
0
1
0
2
4
6
8
10
12Cap1Cap2Total Cap ChangesCap Changes BaselineDelta from Baseline
Capacitor Status
Ca
p S
tatu
s
To
tal C
ap C
ha
ng
es
−15
−10
−5
0
5
10
15
Total Tap ChangesTotal Tap Changes BaselineDelta from BaselineABC Tap Position
0
5
10
15Substation LTC
Ta
p P
ositio
n
To
tal Ta
p C
ha
nge
s
−15
−10
−5
0
5
10
15
Total Tap ChangesTotal Tap Changes BaselineDelta from BaselineReg1 AReg1 BReg1 CReg2 BReg2 CReg3 BReg3 C
0
20
40
60
Regulator Status
Ta
p P
ositio
n
Tota
l Tap
Cha
ng
es
0
50
100
150Over voltageUnder voltageTotal ViolationsTotal Violations BaselineDelta from Baseline
0
200
400
600
800
1000
06AM 08AM 10AM 12PM 02PM 04PM 06PM 08PM
Volta
ge
Vio
lation
s
To
tal V
olta
ge V
iola
tion
s
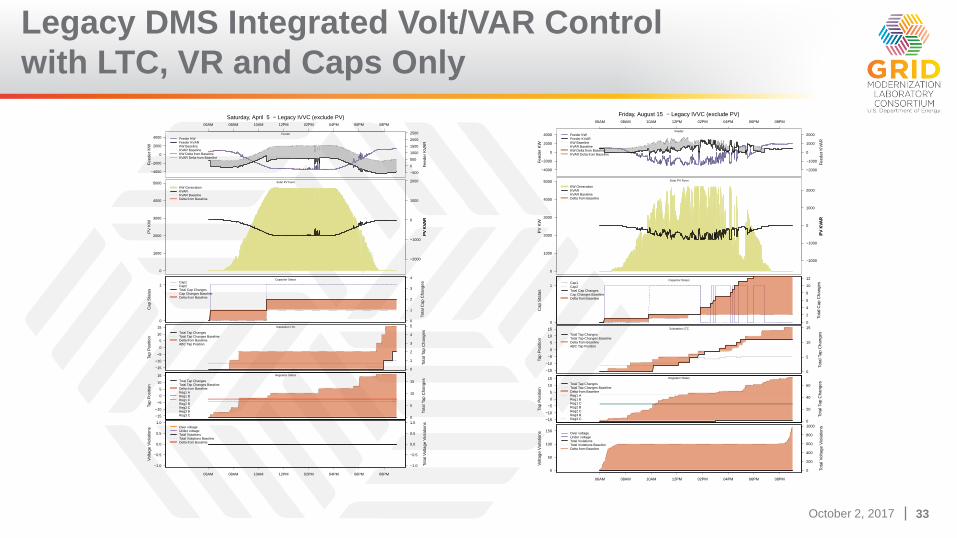
Legacy DMS Integrated Volt/VAR Control
with LTC, VR and Caps Only
October 2, 2017 34October 2, 2017 34
−4000
−2000
0
2000
4000
06AM 08AM 10AM 12PM 02PM 04PM 06PM 08PM
Saturday, April 5 − IVVC (central PV control)
Fee
de
r K
W
Fe
ed
er
KV
AR
KV
AR
−500
0
500
1000
1500
2000
2500
Feeder KWFeeder KVARKW BaselineKVAR BaselineKW Delta from BaselineKVAR Delta from Baseline
Feeder
0
1000
2000
3000
4000
5000
PV
KW
PV
KV
AR
KV
AR
−2000
−1000
0
1000
2000
PV
KV
AR
KW GenerationKVARKVAR BaselineDelta from Baseline
Solar PV Farm
0
1
0
1
2
3
4Cap1Cap2Total Cap ChangesCap Changes BaselineDelta from Baseline
Capacitor Status
Ca
p S
tatu
s
To
tal C
ap C
ha
ng
es
−15
−10
−5
0
5
10
15
Total Tap ChangesTotal Tap Changes BaselineDelta from BaselineABC Tap Position
0
1
2
3
4
5Substation LTC
Ta
p P
ositio
n
To
tal Tap C
han
ge
s−15
−10
−5
0
5
10
15
Total Tap ChangesTotal Tap Changes BaselineDelta from BaselineReg1 AReg1 BReg1 CReg2 BReg2 CReg3 BReg3 C
0
5
10
15
Regulator Status
Ta
p P
ositio
n
Tota
l Tap
Chan
ges
−1.0
−0.5
0.0
0.5
1.0Over voltageUnder voltageTotal ViolationsTotal Violations BaselineDelta from Baseline
−1.0
−0.5
0.0
0.5
1.0
06AM 08AM 10AM 12PM 02PM 04PM 06PM 08PM
Volta
ge
Vio
lation
s
To
tal V
olta
ge V
iola
tion
s
−4000
−2000
0
2000
4000
06AM 08AM 10AM 12PM 02PM 04PM 06PM 08PM
Friday, August 15 − IVVC (central PV control)
Fe
ede
r K
W
Fe
ed
er
KV
AR
KV
AR
−2000
−1000
0
1000
2000Feeder KWFeeder KVARKW BaselineKVAR BaselineKW Delta from BaselineKVAR Delta from Baseline
Feeder
0
1000
2000
3000
4000
5000
PV
KW
PV
KV
AR
KV
AR
−2000
−1000
0
1000
2000
PV
KV
AR
KW GenerationKVARKVAR BaselineDelta from Baseline
Solar PV Farm
0
1
0
2
4
6
8
10
12Cap1Cap2Total Cap ChangesCap Changes BaselineDelta from Baseline
Capacitor Status
Ca
p S
tatu
s
To
tal C
ap
Ch
ang
es
−15
−10
−5
0
5
10
15
Total Tap ChangesTotal Tap Changes BaselineDelta from BaselineABC Tap Position
0
5
10
15Substation LTC
Ta
p P
ositio
n
To
tal Ta
p C
ha
nge
s
−15
−10
−5
0
5
10
15
Total Tap ChangesTotal Tap Changes BaselineDelta from BaselineReg1 AReg1 BReg1 CReg2 BReg2 CReg3 BReg3 C
0
20
40
60
Regulator Status
Ta
p P
ositio
n
Tota
l Ta
p C
ha
ng
es
0
50
100
150Over voltageUnder voltageTotal ViolationsTotal Violations BaselineDelta from Baseline
0
200
400
600
800
1000
06AM 08AM 10AM 12PM 02PM 04PM 06PM 08PM
Volta
ge
Vio
lation
s
To
tal V
olta
ge V
iola
tion
s
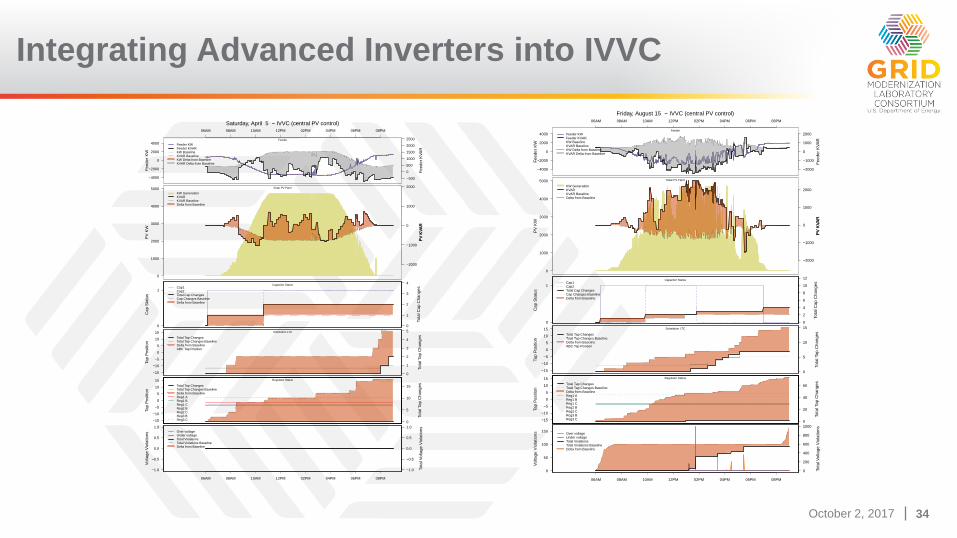
Integrating Advanced Inverters into IVVC
October 2, 2017 35October 2, 2017 35
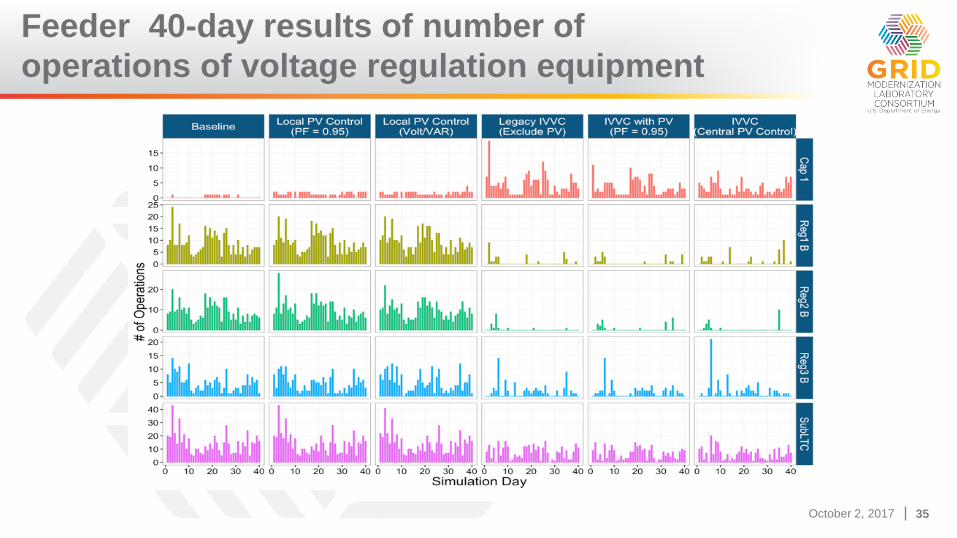
Feeder 40-day results of number of
operations of voltage regulation equipment
October 2, 2017 36October 2, 2017 36
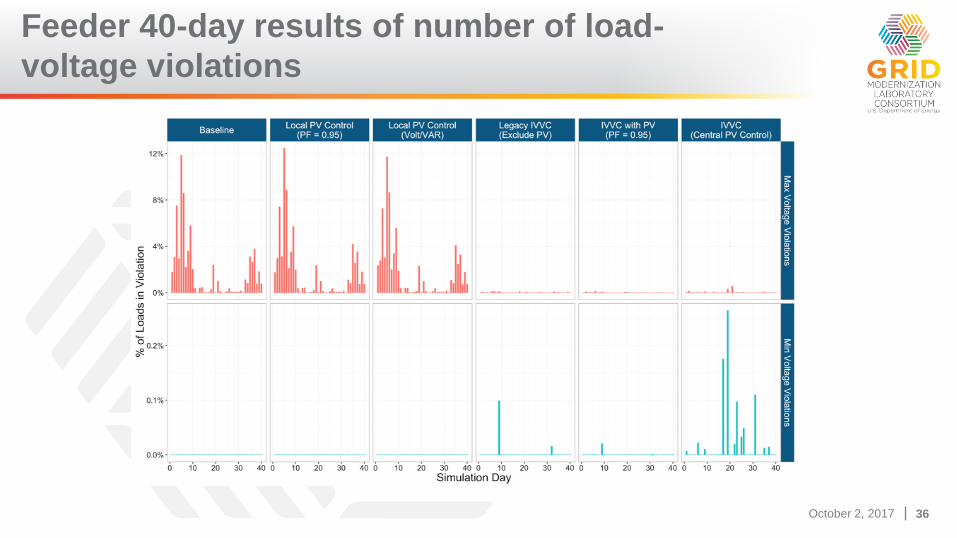
Feeder 40-day results of number of load-
voltage violations
October 2, 2017 37October 2, 2017 37
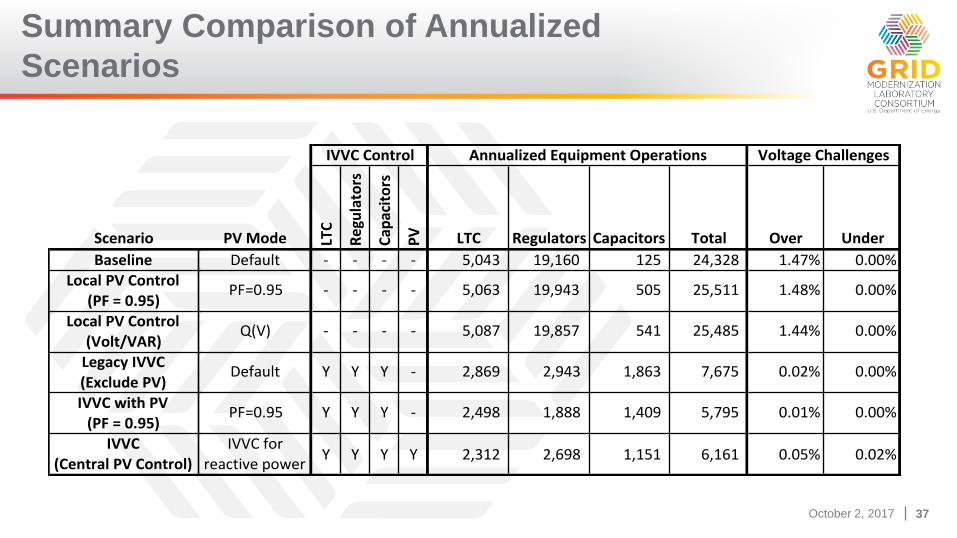
Summary Comparison of Annualized
Scenarios
Scenario
BaselineLocalPVControl
(PF=0.95)
LocalPVControl(Volt/VAR)LegacyIVVC(ExcludePV)
IVVCwithPV(PF=0.95)
IVVC(CentralPVControl)
PVMode LTC
Regulators
Cap
acitors
PV LTC Regulators Capacitors Total Over Under
Default - - - - 5,043 19,160 125 24,328 1.47% 0.00%
PF=0.95 - - - - 5,063 19,943 505 25,511 1.48% 0.00%
Q(V) - - - - 5,087 19,857 541 25,485 1.44% 0.00%
Default Y Y Y - 2,869 2,943 1,863 7,675 0.02% 0.00%
PF=0.95 Y Y Y - 2,498 1,888 1,409 5,795 0.01% 0.00%
IVVCforreactivepower
Y Y Y Y 2,312 2,698 1,151 6,161 0.05% 0.02%
IVVCControl AnnualizedEquipmentOperations VoltageChallenges
October 2, 2017 38October 2, 2017 38
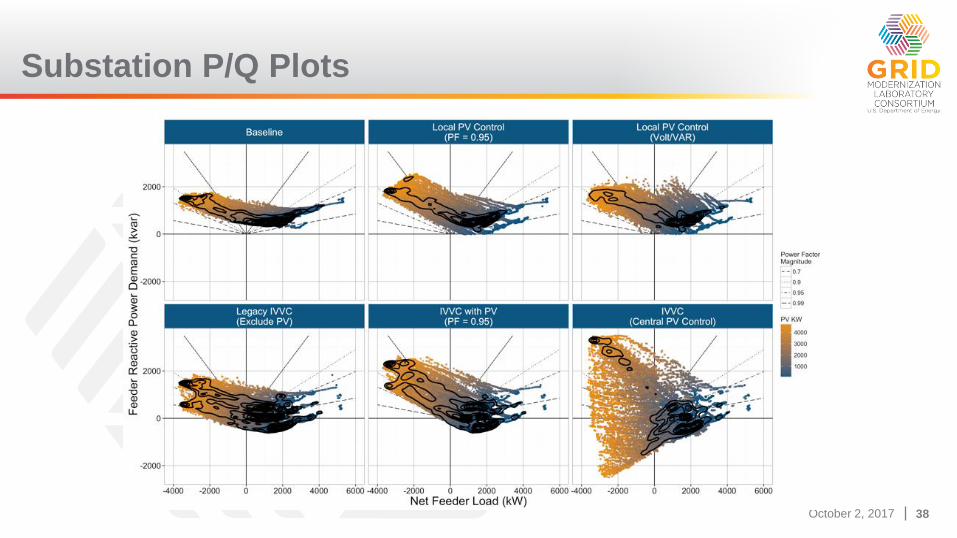
Substation P/Q Plots
October 2, 2017 39October 2, 2017 39
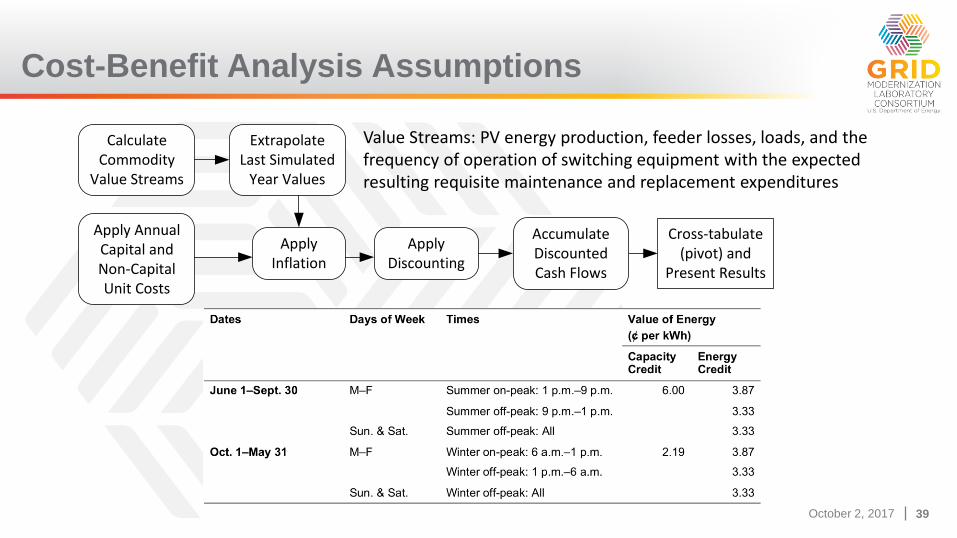
Cost-Benefit Analysis Assumptions
Calculate Commodity
Value Streams
Extrapolate Last Simulated
Year Values
Apply Annual Capital and Non-Capital Unit Costs
Apply Inflation
Apply Discounting
Cross-tabulate (pivot) and
Present Results
Accumulate Discounted Cash Flows
Value Streams: PV energy production, feeder losses, loads, and the frequency of operation of switching equipment with the expected resulting requisite maintenance and replacement expenditures
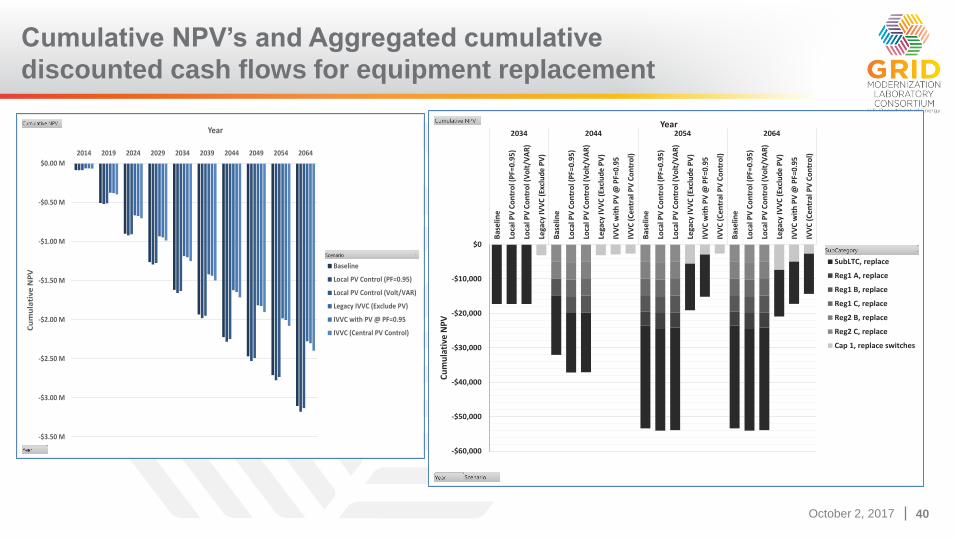
October 2, 2017 40October 2, 2017 40
-$3.50 M
-$3.00 M
-$2.50 M
-$2.00 M
-$1.50 M
-$1.00 M
-$0.50 M
$0.00 M
2014 2019 2024 2029 2034 2039 2044 2049 2054 2064
Cu
mu
lati
ve
NP
V
Year
Baseline
Local PV Control (PF=0.95)
Local PV Control (Volt/VAR)
Legacy IVVC (Exclude PV)
IVVC with PV @ PF=0.95
IVVC (Central PV Control)
Cumulative NPV’s and Aggregated cumulative
discounted cash flows for equipment replacement
-$60,000
-$50,000
-$40,000
-$30,000
-$20,000
-$10,000
$0
Bas
elin
e
Loca
l PV
Co
ntr
ol (
PF=
0.95
)
Loca
l PV
Co
ntr
ol (
Vo
lt/V
AR
)
Lega
cy IV
VC
(Ex
clu
de
PV
)
Bas
elin
e
Loca
l PV
Co
ntr
ol (
PF=
0.95
)
Loca
l PV
Co
ntr
ol (
Vo
lt/V
AR
)
Lega
cy IV
VC
(Ex
clu
de
PV
)
IVV
C w
ith
PV
@ P
F=0.
95
IVV
C (
Cen
tral
PV
Co
ntr
ol)
Bas
elin
e
Loca
l PV
Co
ntr
ol (
PF=
0.95
)
Loca
l PV
Co
ntr
ol (
Vo
lt/V
AR
)
Lega
cy IV
VC
(Ex
clu
de
PV
)
IVV
C w
ith
PV
@ P
F=0.
95
IVV
C (
Cen
tral
PV
Co
ntr
ol)
Bas
elin
e
Loca
l PV
Co
ntr
ol (
PF=
0.95
)
Loca
l PV
Co
ntr
ol (
Vo
lt/V
AR
)
Lega
cy IV
VC
(Ex
clu
de
PV
)
IVV
C w
ith
PV
@ P
F=0.
95
IVV
C (
Cen
tral
PV
Co
ntr
ol)
2034 2044 2054 2064
Cu
mu
lati
ve N
PV
Year
SubLTC, replace
Reg1 A, replace
Reg1 B, replace
Reg1 C, replace
Reg2 B, replace
Reg2 C, replace
Cap 1, replace switches
October 2, 2017 41October 2, 2017 41
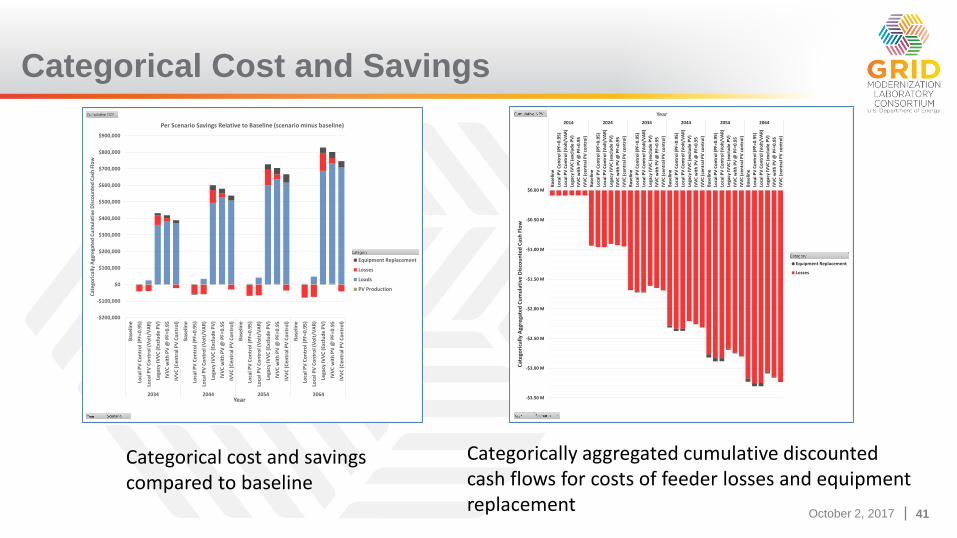
Categorical Cost and Savings
-$200,000
-$100,000
$0
$100,000
$200,000
$300,000
$400,000
$500,000
$600,000
$700,000
$800,000
$900,000B
ase
line
Loca
l PV
Co
ntr
ol (
PF=
0.9
5)
Loca
l PV
Co
ntr
ol (
Vo
lt/V
AR
)
Lega
cy IV
VC
(Ex
clu
de
PV
)
IVV
C w
ith
PV
@ P
F=0.
95
IVV
C (
Cen
tral
PV
Co
ntr
ol)
Bas
elin
e
Loca
l PV
Co
ntr
ol (
PF=
0.9
5)
Loca
l PV
Co
ntr
ol (
Vo
lt/V
AR
)
Lega
cy IV
VC
(Ex
clu
de
PV
)
IVV
C w
ith
PV
@ P
F=0.
95
IVV
C (
Ce
ntr
al P
V C
on
tro
l)
Bas
elin
e
Loca
l PV
Co
ntr
ol (
PF=
0.9
5)
Loca
l PV
Co
ntr
ol (
Vo
lt/V
AR
)
Lega
cy IV
VC
(Ex
clu
de
PV
)
IVV
C w
ith
PV
@ P
F=0.
95
IVV
C (
Ce
ntr
al P
V C
on
tro
l)
Bas
elin
e
Loca
l PV
Co
ntr
ol (
PF=
0.9
5)
Loca
l PV
Co
ntr
ol (
Vo
lt/V
AR
)
Lega
cy IV
VC
(Ex
clu
de
PV
)
IVV
C w
ith
PV
@ P
F=0.
95
IVV
C (
Ce
ntr
al P
V C
on
tro
l)
2034 2044 2054 2064
Cat
ego
rica
lly A
ggre
gate
d C
um
ula
tive
Dis
cou
nte
d C
ash
Flo
w
Year
Per Scenario Savings Relative to Baseline (scenario minus baseline)
Equipment Replacement
Losses
Loads
PV Production
-$3.50 M
-$3.00 M
-$2.50 M
-$2.00 M
-$1.50 M
-$1.00 M
-$0.50 M
$0.00 M
Bas
elin
e
Loca
l PV
Co
ntr
ol (
PF=
0.9
5)
Loca
l PV
Co
ntr
ol (
Vo
lt/V
AR
)
Lega
cy IV
VC
(e
xclu
de
PV
)
IVV
C w
ith
PV
@ P
F=0
.95
IVV
C (
cen
tral
PV
co
ntr
ol)
Bas
elin
e
Loca
l PV
Co
ntr
ol (
PF=
0.9
5)
Loca
l PV
Co
ntr
ol (
Vo
lt/V
AR
)
Lega
cy IV
VC
(e
xclu
de
PV
)
IVV
C w
ith
PV
@ P
F=0
.95
IVV
C (
cen
tral
PV
co
ntr
ol)
Bas
elin
e
Loca
l PV
Co
ntr
ol (
PF=
0.9
5)
Loca
l PV
Co
ntr
ol (
Vo
lt/V
AR
)
Lega
cy IV
VC
(e
xclu
de
PV
)
IVV
C w
ith
PV
@ P
F=0
.95
IVV
C (
cen
tral
PV
co
ntr
ol)
Bas
elin
e
Loca
l PV
Co
ntr
ol (
PF=
0.9
5)
Loca
l PV
Co
ntr
ol (
Vo
lt/V
AR
)
Lega
cy IV
VC
(e
xclu
de
PV
)
IVV
C w
ith
PV
@ P
F=0
.95
IVV
C (
cen
tral
PV
co
ntr
ol)
Bas
elin
e
Loca
l PV
Co
ntr
ol (
PF=
0.9
5)
Loca
l PV
Co
ntr
ol (
Vo
lt/V
AR
)
Lega
cy IV
VC
(e
xclu
de
PV
)
IVV
C w
ith
PV
@ P
F=0
.95
IVV
C (
cen
tral
PV
co
ntr
ol)
Bas
elin
e
Loca
l PV
Co
ntr
ol (
PF=
0.9
5)
Loca
l PV
Co
ntr
ol (
Vo
lt/V
AR
)
Lega
cy IV
VC
(e
xclu
de
PV
)
IVV
C w
ith
PV
@ P
F=0
.95
IVV
C (
cen
tral
PV
co
ntr
ol)
2014 2024 2034 2044 2054 2064
Cat
ego
rica
lly A
ggre
gate
d C
um
ula
tive
Dis
cou
nte
d C
ash
Flo
w
Year
Equipment Replacement
Losses
Categorically aggregated cumulative discounted cash flows for costs of feeder losses and equipment replacement
Categorical cost and savings compared to baseline
October 2, 2017 42October 2, 2017 42
Case Study 1: Conclusion
► This work Illustrates the potential for coordinated control of voltage management equipment,
such as the central DMS-controlled IVVC by:
◼ Providing substantial improvement in distribution operations with large-scale PV systems
◼ reducing regulator operations
◼ Decreasing the number of voltage challenges
► The preliminary cost-benefit analysis showed operational cost savings for the IVVC
scenarios that were:
◼ partially driven by reduced wear and tear on utility regulating equipment,
◼ but dominated by the use of CVR/Demand reduction objective
► Work needed in the area of integrating advanced inverters as controllable resources into
IVVC optimization strategies
◼ Event triggered operation of DMS IVVC
◼ Power factor set point in place of reactive power set point
October 2, 2017 43
Thank you
Questions?
Backup slides
October 2, 2017 44October 2, 2017 44
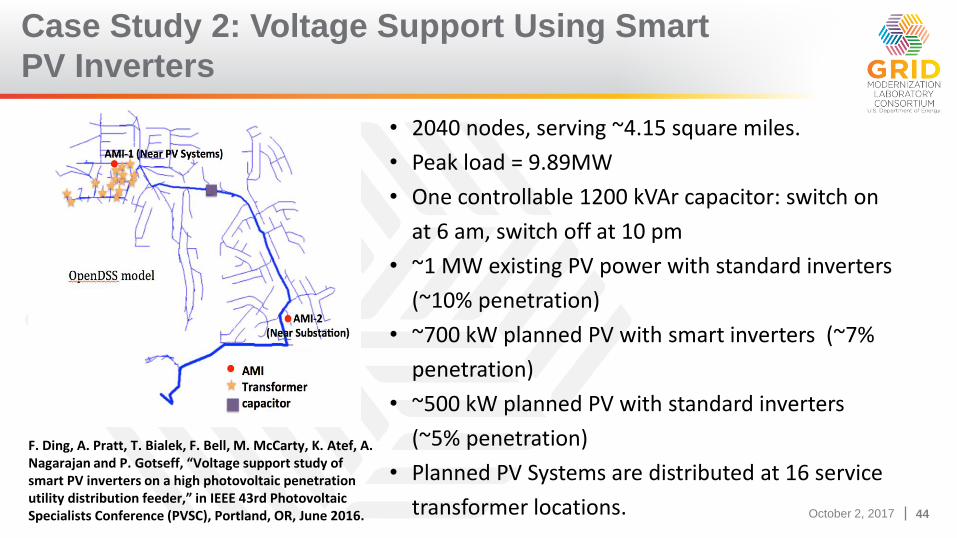
Case Study 2: Voltage Support Using Smart
PV Inverters
• 2040 nodes, serving ~4.15 square miles.
• Peak load = 9.89MW
• One controllable 1200 kVAr capacitor: switch on
at 6 am, switch off at 10 pm
• ~1 MW existing PV power with standard inverters
(~10% penetration)
• ~700 kW planned PV with smart inverters (~7%
penetration)
• ~500 kW planned PV with standard inverters
(~5% penetration)
• Planned PV Systems are distributed at 16 service
transformer locations.
F. Ding, A. Pratt, T. Bialek, F. Bell, M. McCarty, K. Atef, A. Nagarajan and P. Gotseff, “Voltage support study of smart PV inverters on a high photovoltaic penetration utility distribution feeder,” in IEEE 43rd Photovoltaic Specialists Conference (PVSC), Portland, OR, June 2016.
October 2, 2017 45October 2, 2017 45
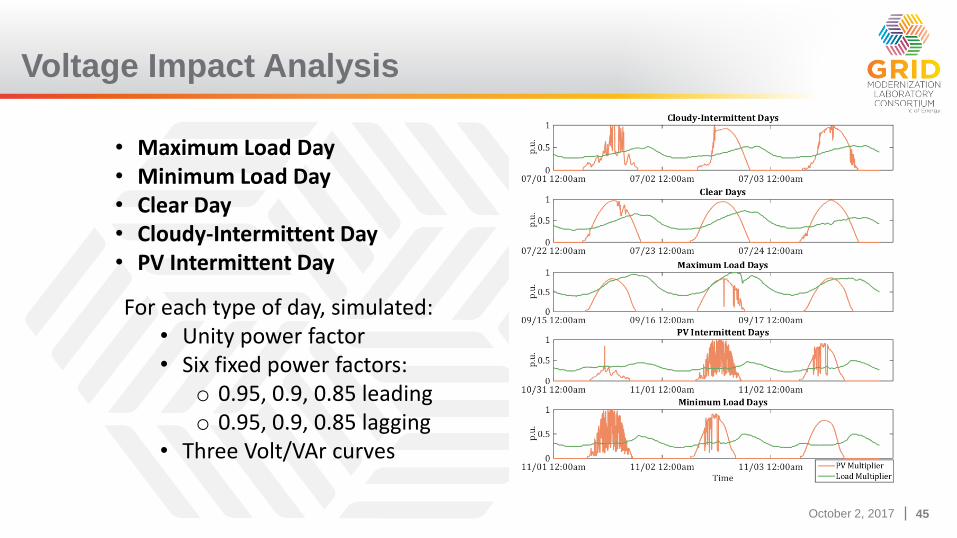
Voltage Impact Analysis
• Maximum Load Day• Minimum Load Day• Clear Day• Cloudy-Intermittent Day• PV Intermittent Day
For each type of day, simulated:• Unity power factor• Six fixed power factors:
o 0.95, 0.9, 0.85 leadingo 0.95, 0.9, 0.85 lagging
• Three Volt/VAr curves
October 2, 2017 46October 2, 2017 46
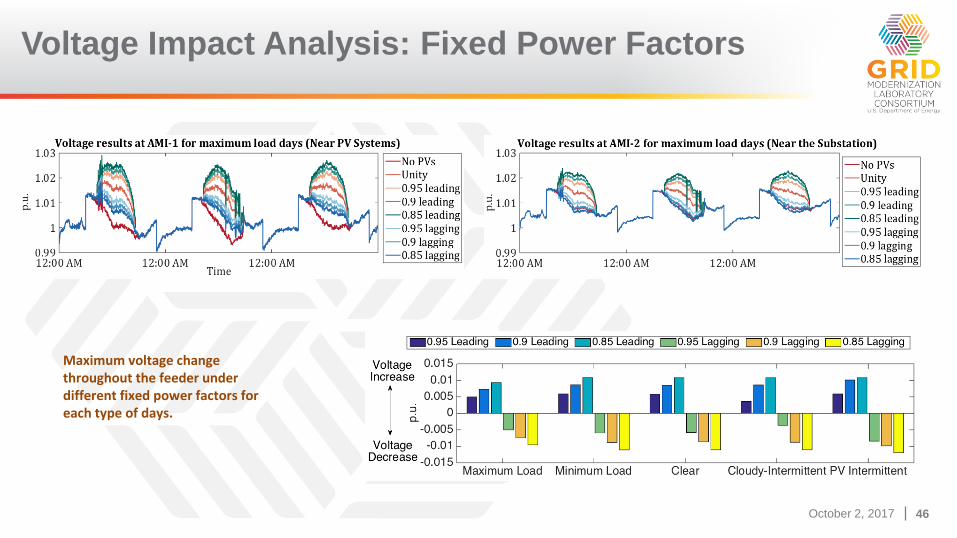
Voltage Impact Analysis: Fixed Power Factors
Maximum voltage change throughout the feeder under different fixed power factors for each type of days.
October 2, 2017 47October 2, 2017 47
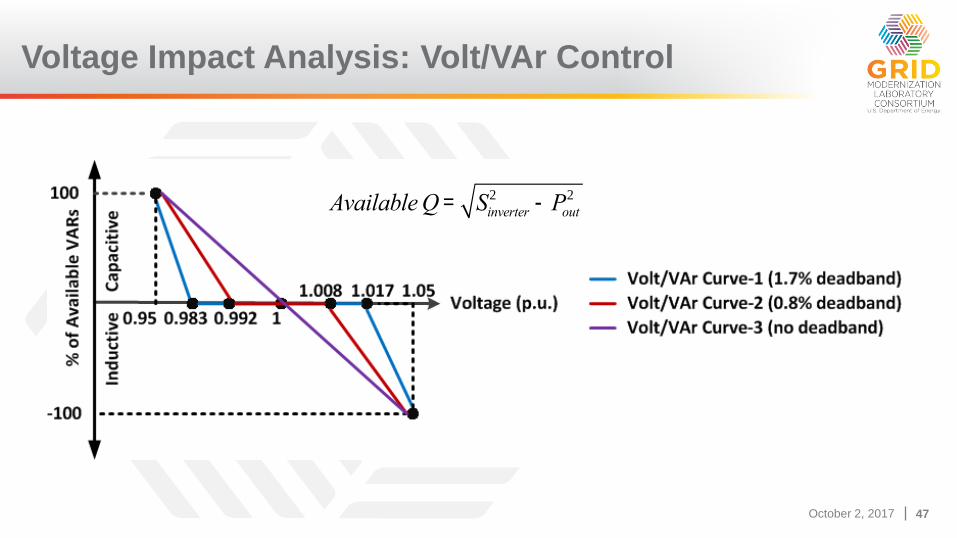
Voltage Impact Analysis: Volt/VAr Control
AvailableQ = Sinverter2 -Pout
2
October 2, 2017 48October 2, 2017 48
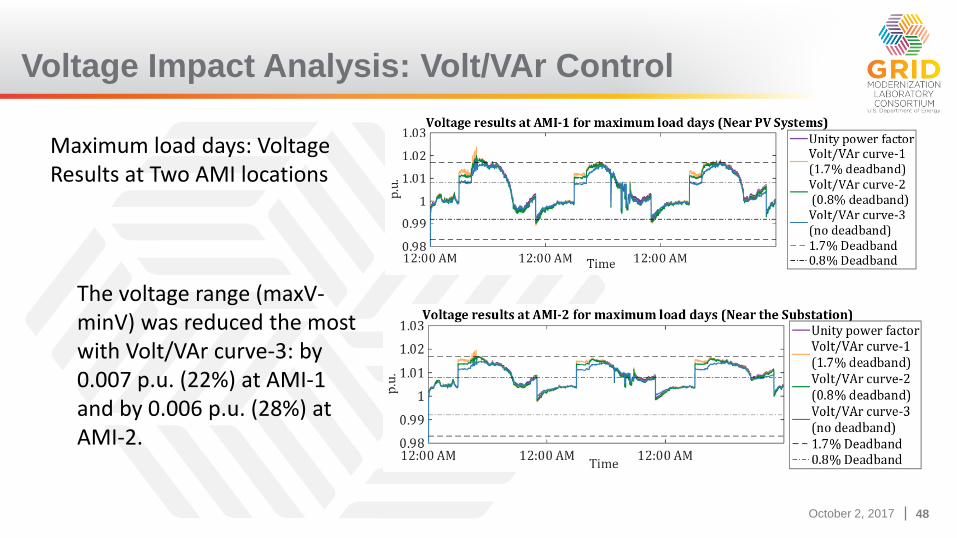
Voltage Impact Analysis: Volt/VAr Control
Maximum load days: Voltage Results at Two AMI locations
The voltage range (maxV-minV) was reduced the most with Volt/VAr curve-3: by 0.007 p.u. (22%) at AMI-1 and by 0.006 p.u. (28%) at AMI-2.
October 2, 2017 49October 2, 2017 49
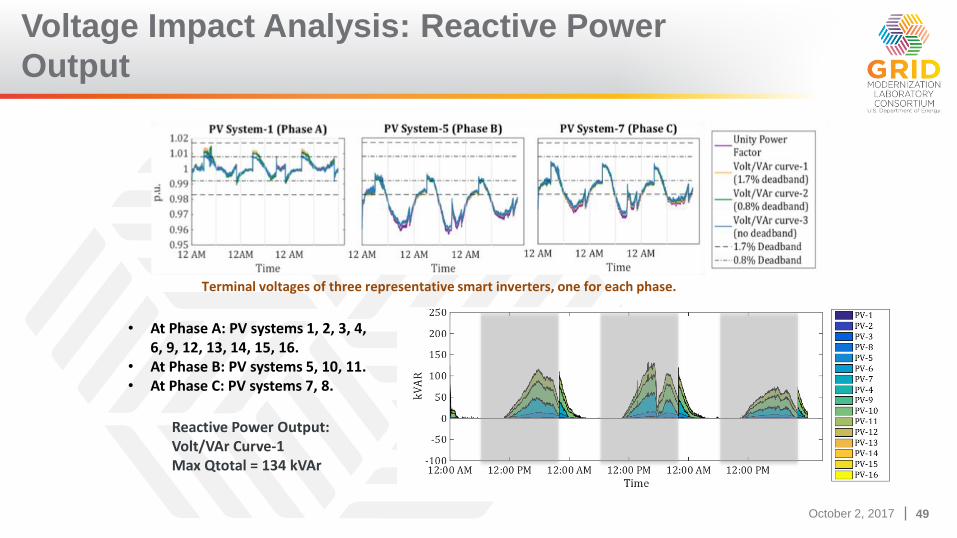
Voltage Impact Analysis: Reactive Power
Output
• At Phase A: PV systems 1, 2, 3, 4, 6, 9, 12, 13, 14, 15, 16.
• At Phase B: PV systems 5, 10, 11.• At Phase C: PV systems 7, 8.
Reactive Power Output: Volt/VAr Curve-1Max Qtotal = 134 kVAr
Terminal voltages of three representative smart inverters, one for each phase.
October 2, 2017 50October 2, 2017 50
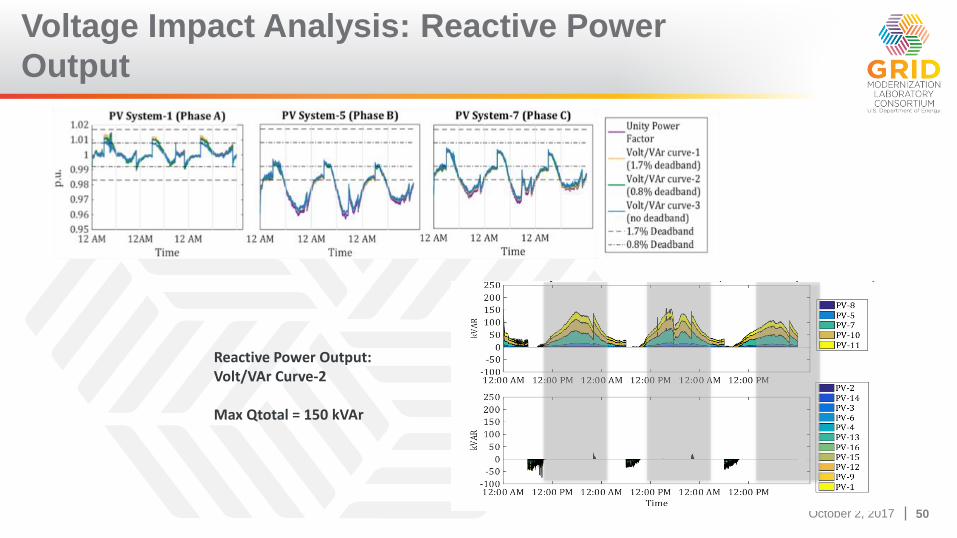
Voltage Impact Analysis: Reactive Power
Output
Reactive Power Output: Volt/VAr Curve-2
Max Qtotal = 150 kVAr
October 2, 2017 51October 2, 2017 51
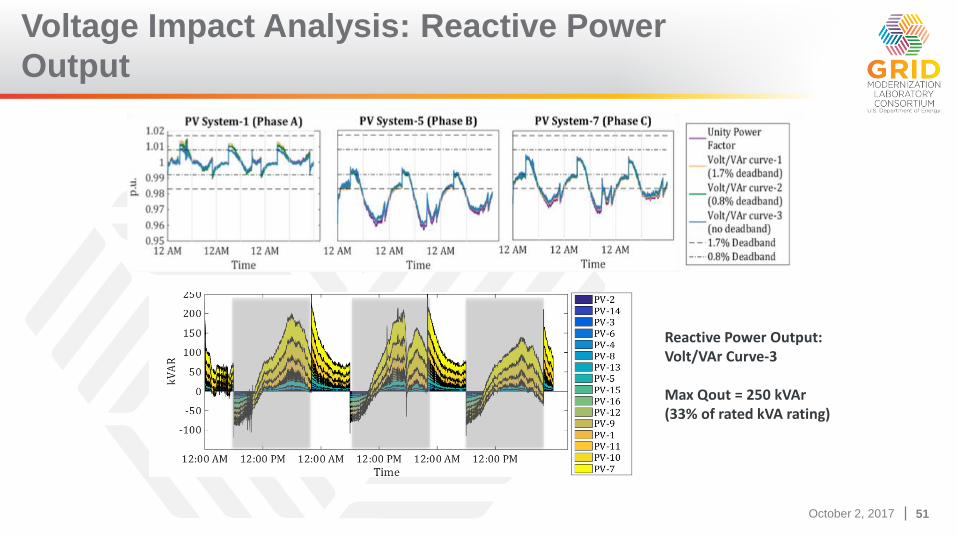
Voltage Impact Analysis: Reactive Power
Output
Reactive Power Output: Volt/VAr Curve-3
Max Qout = 250 kVAr(33% of rated kVA rating)
October 2, 2017 52October 2, 2017 52
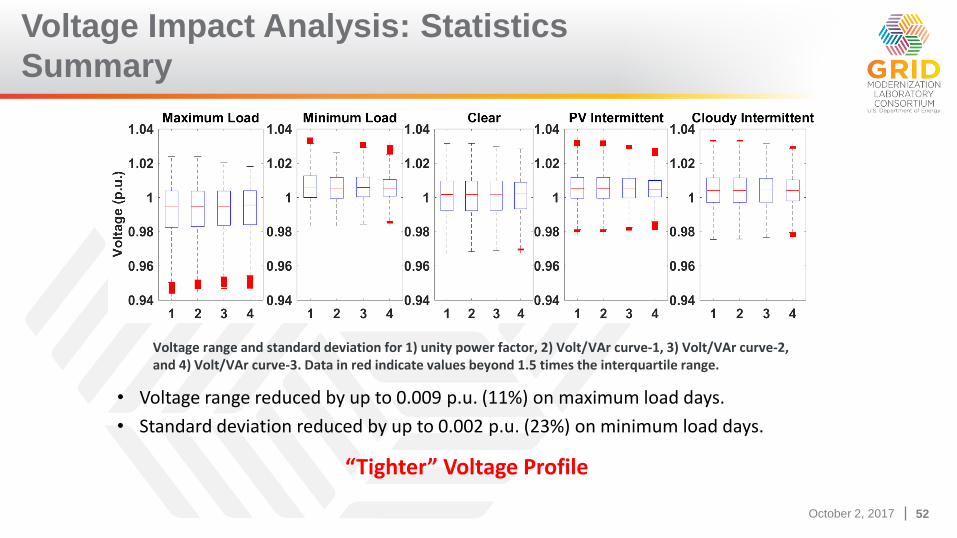
Voltage Impact Analysis: Statistics
Summary
• Voltage range reduced by up to 0.009 p.u. (11%) on maximum load days.
• Standard deviation reduced by up to 0.002 p.u. (23%) on minimum load days.
Voltage range and standard deviation for 1) unity power factor, 2) Volt/VAr curve-1, 3) Volt/VAr curve-2, and 4) Volt/VAr curve-3. Data in red indicate values beyond 1.5 times the interquartile range.
“Tighter” Voltage Profile
October 2, 2017 53October 2, 2017 53
Case Study 2: Conclusion
• Results from a specific utility feeder:
• Fixed 0.85 power factor change in primary voltage just over 1%
• 700 kW of PV with smart inverters had comparable voltage impact
to 1,200 kVAr switched capacitor
• Volt/VAr reduced range and standard deviation of voltages
• No deadband had most significant voltage profile improvement
• Reduced voltage range up to 11%; standard deviation up to 23 %
October 2, 2017 54October 2, 2017 54
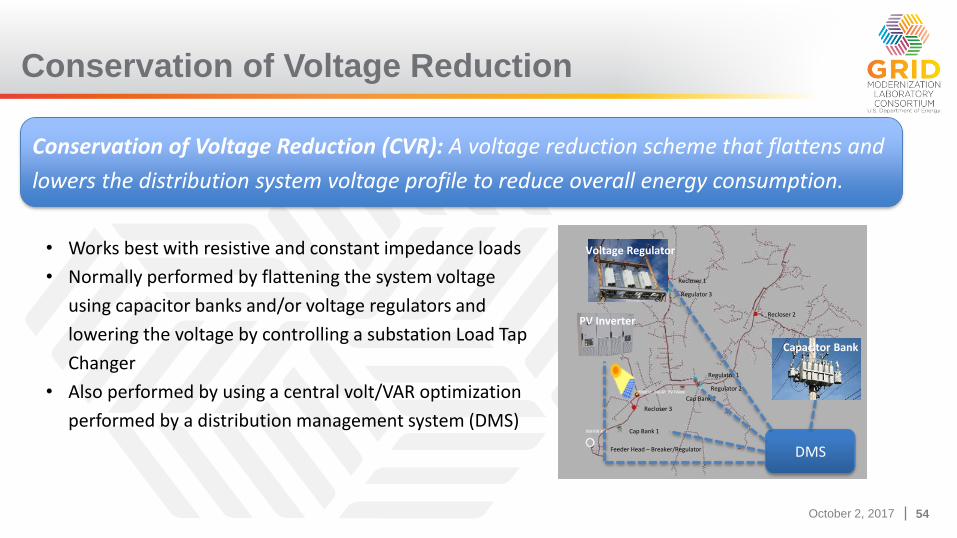
Conservation of Voltage Reduction
Conservation of Voltage Reduction (CVR): A voltage reduction scheme that flattens and
lowers the distribution system voltage profile to reduce overall energy consumption.
• Works best with resistive and constant impedance loads
• Normally performed by flattening the system voltage
using capacitor banks and/or voltage regulators and
lowering the voltage by controlling a substation Load Tap
Changer
• Also performed by using a central volt/VAR optimization
performed by a distribution management system (DMS)
Recloser 1
Recloser 2
Recloser 3
Cap Bank 1
Cap Bank 2
Regulator 1
Regulator 2
Regulator 3
Feeder Head – Breaker/Regulator DMS
PV Inverter
Capacitor Bank
Voltage Regulator
October 2, 2017 55October 2, 2017 55
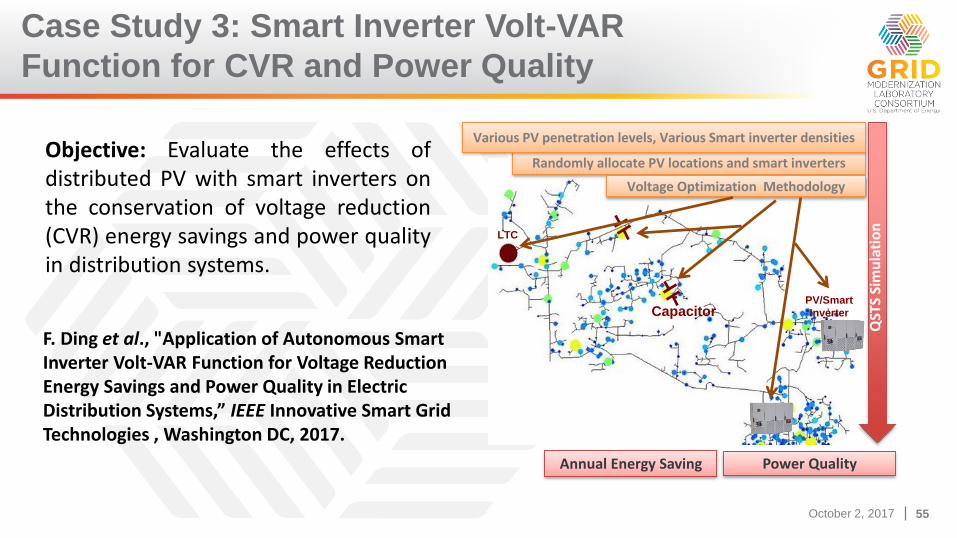
Case Study 3: Smart Inverter Volt-VAR
Function for CVR and Power Quality
LTC
CapacitorPV/Smart
Inverter
Randomly allocate PV locations and smart inverters
Various PV penetration levels, Various Smart inverter densities
Voltage Optimization Methodology
Annual Energy Saving Power Quality
QST
S Si
mu
lati
on
Objective: Evaluate the effects ofdistributed PV with smart inverters onthe conservation of voltage reduction(CVR) energy savings and power qualityin distribution systems.
F. Ding et al., "Application of Autonomous Smart Inverter Volt-VAR Function for Voltage Reduction Energy Savings and Power Quality in Electric Distribution Systems,” IEEE Innovative Smart Grid Technologies , Washington DC, 2017.
October 2, 2017 56October 2, 2017 56
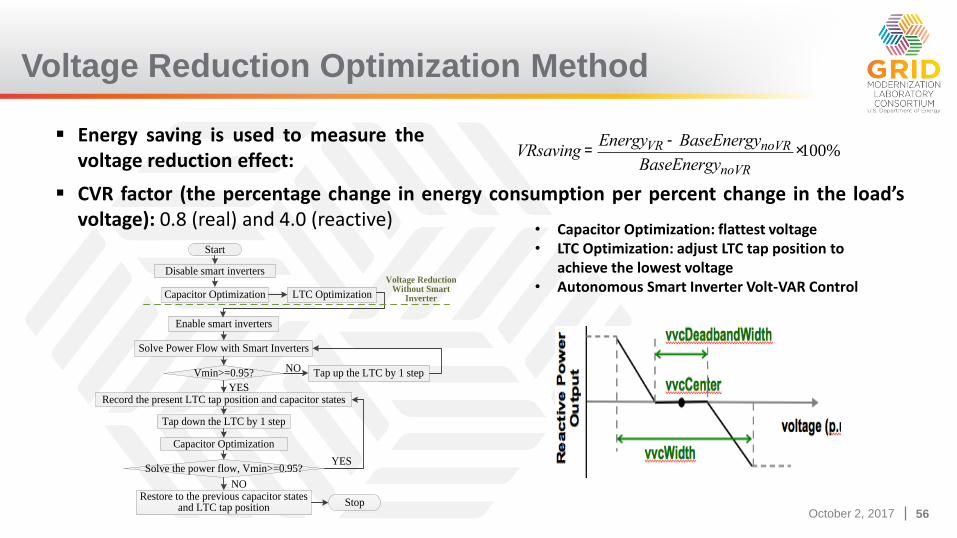
Voltage Reduction Optimization Method
Energy saving is used to measure thevoltage reduction effect:
VRsaving =EnergyVR -BaseEnergynoVR
BaseEnergynoVR×100%
CVR factor (the percentage change in energy consumption per percent change in the load’svoltage): 0.8 (real) and 4.0 (reactive)
Start
Disable smart inverters
Capacitor Optimization LTC Optimization
Enable smart inverters
Solve Power Flow with Smart Inverters
Vmin>=0.95? Tap up the LTC by 1 step
Tap down the LTC by 1 step
Capacitor Optimization
Solve the power flow, Vmin>=0.95?
Restore to the previous capacitor states and LTC tap position
Record the present LTC tap position and capacitor statesYES
NO
Stop
YES
NO
Voltage Reduction Without Smart
Inverter
• Capacitor Optimization: flattest voltage • LTC Optimization: adjust LTC tap position to
achieve the lowest voltage • Autonomous Smart Inverter Volt-VAR Control
October 2, 2017 57October 2, 2017 57
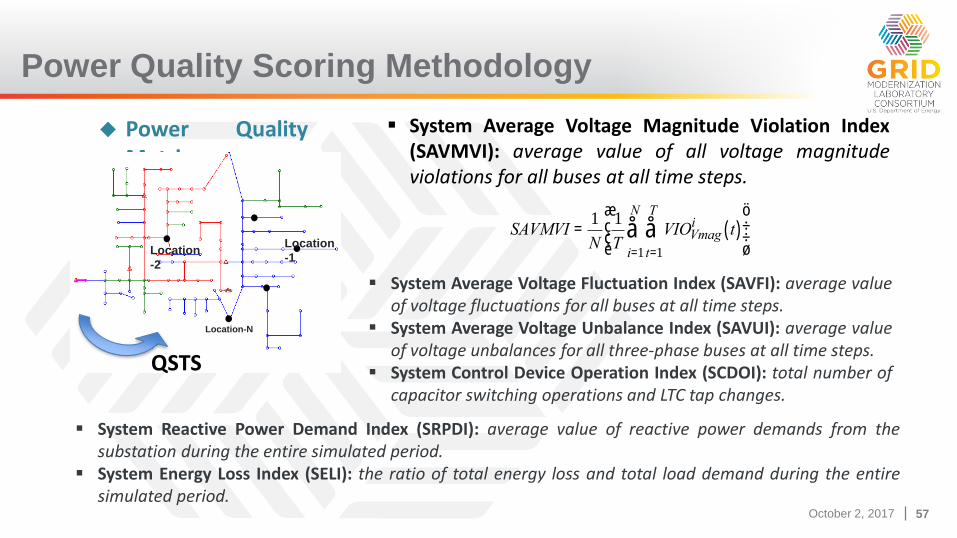
Power Quality Scoring Methodology
Power QualityMetrics
System Average Voltage Magnitude Violation Index(SAVMVI): average value of all voltage magnitudeviolations for all buses at all time steps.
System Average Voltage Fluctuation Index (SAVFI): average valueof voltage fluctuations for all buses at all time steps.
System Average Voltage Unbalance Index (SAVUI): average valueof voltage unbalances for all three-phase buses at all time steps.
System Control Device Operation Index (SCDOI): total number ofcapacitor switching operations and LTC tap changes.
SAVMVI =1
N
1
TVIOVmag
i t( )t=1
T
åi=1
N
åæ
è
çç
ö
ø
÷÷
Location
-2
Location-N
Location
-1
QSTS
System Reactive Power Demand Index (SRPDI): average value of reactive power demands from thesubstation during the entire simulated period.
System Energy Loss Index (SELI): the ratio of total energy loss and total load demand during the entiresimulated period.
October 2, 2017 58October 2, 2017 58
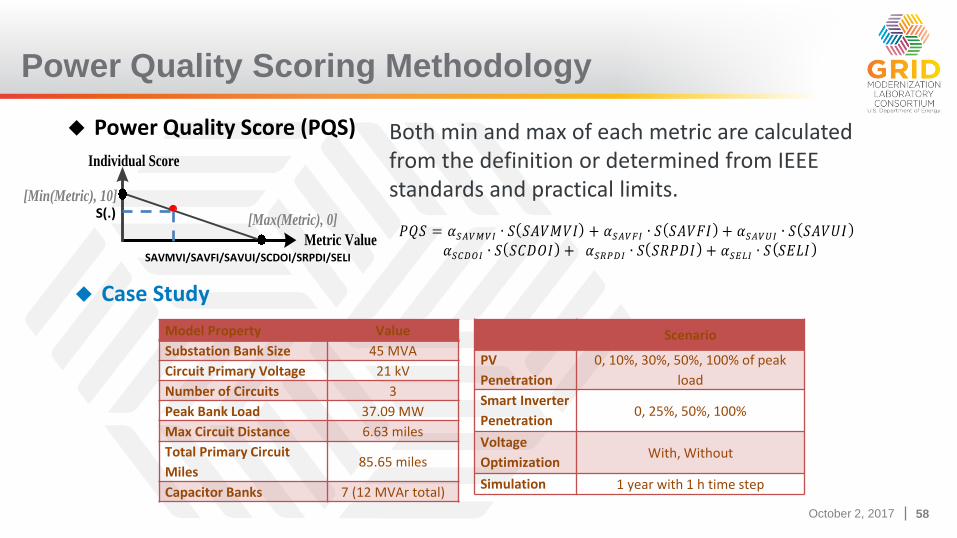
Power Quality Scoring Methodology
Power Quality Score (PQS) Both min and max of each metric are calculated from the definition or determined from IEEE standards and practical limits.
Model Property Value
Substation Bank Size 45 MVA
Circuit Primary Voltage 21 kV
Number of Circuits 3
Peak Bank Load 37.09 MW
Max Circuit Distance 6.63 miles
Total Primary Circuit
Miles85.65 miles
Capacitor Banks 7 (12 MVAr total)
SAVMVI/SAVFI/SAVUI/SCDOI/SRPDI/SELI
Scenario
PV
Penetration
0, 10%, 30%, 50%, 100% of peak
load
Smart Inverter
Penetration0, 25%, 50%, 100%
Voltage
OptimizationWith, Without
Simulation 1 year with 1 h time step
Case Study
[Min(Metric), 10]
[Max(Metric), 0]
Metric Value
Individual Score
S(.)
October 2, 2017 59October 2, 2017 59
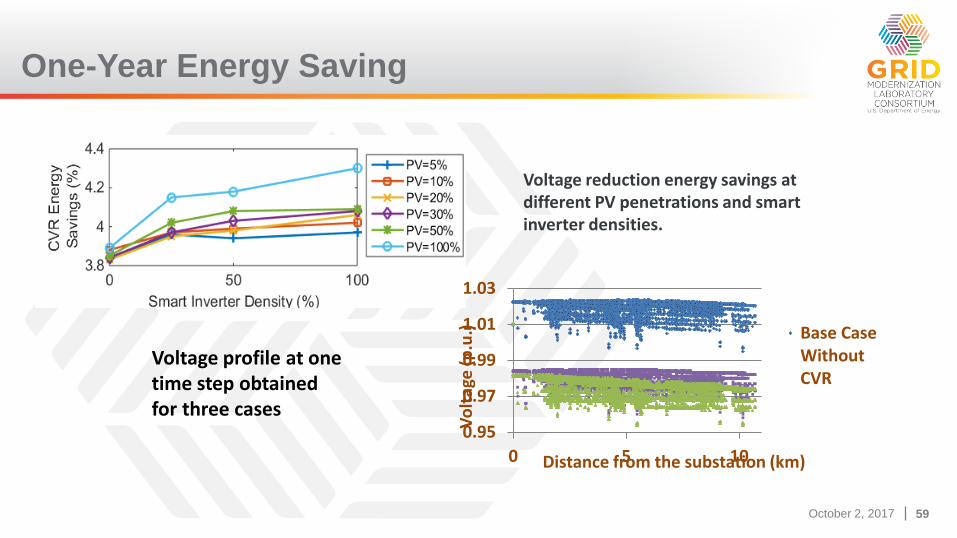
One-Year Energy Saving
0.95
0.97
0.99
1.01
1.03
0 5 10V
olt
age
(p
.u.)
Distance from the substation (km)
Base CaseWithoutCVR
Voltage profile at one time step obtained for three cases
Voltage reduction energy savings at different PV penetrations and smart inverter densities.
October 2, 2017 60October 2, 2017 60
Case Study 3: Conclusion
• Voltage reduction energy savings increased with autonomous smart inverter Volt-VAR
control. Smart inverters with a lower VVC band center allowed the tap position of the
substation LTC to be lower, compared to cases without smart inverters. This resulted
in a lower distribution system voltage profile and increased voltage reduction energy
savings.
• Since voltage reduction energy savings were prioritized over the PQS, the
implementation of the proposed voltage reduction scheme lowered certain power
quality scoring metrics, including SCDOI and SRPDI, leading to an overall lower PQS.
• Overall without CVR VO, smart inverters had a positive impact on the PQS, and helped
to reduce energy losses and voltage fluctuations.