Embed Size (px)
Citation preview
© 2010 by Taylor and Francis Group, LLC
401
21Tumor Blood Flow–
Modifying Effects of Electroporation and
Electrochemotherapy—Experimental Evidence
and Implications for the Therapy
21.1 Introduction ......................................................................................40221.2 Blood Flow in Solid Tumors ............................................................40321.3 Measurement of Tumor Blood Flow and Related
Parameters ...................................................................................403Contrast-Enhanced Magnetic Resonance Imaging • Rubidium (86Rb) Extraction Technique • Patent Blue-Violet Staining Technique • Laser Doppler Flowmetry • Power Doppler Ultrasonographic Imaging • Electron Paramagnetic Resonance Oximetry • Polarographic Oximetry • Luminescence-Based Fiber-Optic Oximetry • Histological Assessment of Hypoxia by Means of Hypoxia Marker Pimonidazole
21.4 Effects of Electroporation and Electrochemotherapy on Tumor Blood Flow ..................................................................... 406Electroporation and Electrochemotherapy Protocols • Electroporation and Blood Flow • Electrochemotherapy and Blood Flow • Oxygenation in Tumors after EP and ECT
21.5 Synthesis—Models of Physiological Effects of EP and ECT on Tumor Blood Flow .....................................................413The Proposed Series of Events in Blood Flow Changes after EP • The Proposed Series of Events in Blood Flow Changes after ECT • The Role of EP and ECT in Antitumor Effectiveness of the Treatment • Clinical Significance of Vascular-Disrupting Action of Electrochemotherapy
21.6 Conclusions........................................................................................419Acknowledgments ........................................................................................419Abbreviations ................................................................................................419References ......................................................................................................419
Tomaz Jarm
Maja Cemazar
Gregor Sersa
© 2010 by Taylor and Francis Group, LLC
402 Advanced Electroporation Techniques in Biology and Medicine
21.1 Introduction
Reversible electroporation or electropermeabilization (EP) is a highly effective method for nondestruc-tive and transient modification of cell membrane permeability by means of a series of electric pulses characterized by high voltage (e.g., 1 kV) and short duration (e.g., 100 μs) (Orlowski et al. 1988). EP has gained considerable attention over the last decade, largely due to applications in which extracellular molecules that do not cross cell membrane easily, such as hydrophilic molecules, can be introduced into the cells in vastly increased quantities by means of EP. The combined use of EP with chemotherapeutic drugs has been named electrochemotherapy (ECT) (Mir et al. 1991). Over the last decade, numerous studies have been reported, that involve the treatment of experimental and clinical tumors by means of ECT (Sersa 2006, Sersa et al. 2006, Quaglino et al. 2008). The combined efforts of many research groups have recently culminated in the Cliniporator (IGEA, Carpi, Italy), the first CE-certified clinical instru-ment for EP, and in the Standard Operating Procedures for the use of the method in clinical oncology (Mir et al. 2006). ECT with chemotherapeutics bleomycin and cisplatin is now being used successfully in a steadily increasing number of hospitals and veterinary clinics for the treatment of solid tumors of various etiologies including melanoma skin metastases, head and neck tumors, basal cell carcinomas, and adenocarcinomas in humans (Heller et al. 1999, Marty et al. 2006, Sersa 2006, Cemazar et al. 2008). Recently ECT has been proposed as a treatment modality for skin melanoma metastases (Testori et al. 2009). In another procedure closely related to ECT and named electrogenetherapy (EGT), electric pulses different from those used in ECT are used not only to electropermeabilize the cell membranes but also to produce electrophoretic forces, which are both needed to transfer the extracellular genetic material into the cells (Satkauskas et al. 2002, 2005, Kanduser et al. 2009). Due to a more complex situation, the development of procedures for effective EGT is lagging behind that for ECT, but the potential of EGT for local gene therapy in tissues including muscle, skin, liver, and tumor without the use of viral vectors has already been demonstrated in vivo and in a clinical study (Neumann et al. 1982, Heller and Heller 2006, Cemazar et al. 2006, Prud’homme et al. 2006, Daud et al. 2008).
The main mechanism of antitumor effectiveness of ECT is the direct cytotoxic effect of the drug introduced into the cells by EP and entrapped there after resealing of the cell membrane (Mir et al. 2006). However, since the early studies the investigators have also been noticing transient but severe local blood flow–reducing effects of EP and ECT (Sersa et al. 1998, 1999b, Ramirez et al. 1998). Even though this indirect effect on tumors was recognized, its contribution was initially regarded as a side effect with minor significance for antitumor effectiveness of ECT, especially in the light of nonsignifi-cant antitumor effect exerted by EP alone in the absence of chemotherapeutic drug. With mounting new evidence, however, this general view has been changing constantly. It is now evident that not only can the blood flow–modifying effect of ECT contribute significantly to its antitumor effectiveness, but that there are actually several distinct physiological pathways by which it does so.
There are several reasons why blood flow–modifying effects of EP alone and of ECT are important and must be studied. Understanding these effects contributes to better understanding of how EP and ECT work and can thus lead to further optimization of treatment protocols. Both direct and indirect effects of EP and ECT are of local nature (confined to the tumor itself and to minimal normal sur-rounding tissue), which by fine-tuning of the parameters can allow for truly individualized treatment. The blood flow–modifying effects of EP and ECT could be exploited in vascular-targeted treatment, a special class of antitumor treatments targeted at tumor blood supply (either on the level of existing tumor blood vessels or formation of new ones) rather than tumor cells directly (Chaplin et al. 1998, Tozer et al. 2005, Sersa et al. 2008). Exposure of tumor cells to the drug can be prolonged by imped-ing the drug washout from the tumor interstitium due to effective cutoff of tumor blood flow (the so-called vascular lock effect) and may thus improve the effectiveness of conventional chemotherapy by drug entrapment in the tumors. Because of the vascular lock, the i.v. administration of the drug must be performed before the application of EP. In addition, the increased tumor hypoxia and anoxia as a consequence of impeded blood flow can be used to increase effectiveness of hypoxia-dependent agents
© 2010 by Taylor and Francis Group, LLC
Tumor Blood Flow–Modifying Effects of Electroporation and Electrochemotherapy 403
such as bioreductive drugs (Cemazar et al. 2001b). And finally, EP and ECT can be used effectively for alleviation and cosmetic effects in palliative treatment of hemorrhaging tumors and ulcers to stop the bleeding (Gehl and Geertsen 2000, Snoj et al. 2009).
In the following sections, we first outline the general characteristics of tumor vasculature and blood flow. This is followed by a brief description of some methods used for assessment of tumor blood flow and oxygenation and then by the demonstrated evidence of blood flow–modifying effects of EP and ECT with emphasis on experimental tumors. Finally, and based on this evidence, we suggest a model of physiological events taking place in a tumor within seconds, minutes, hours, and days following the application of EP and ECT.
21.2 Blood Flow in Solid Tumors
Solid tumors, in general, are physiologically different from normal tissues in many aspects. Even though there are also large histological differences between various tumor types, there are many common char-acteristics of tumor vasculature and blood flow (Jain 1987, Vaupel and Hockel 2000, Tozer et al. 2005, Folkman 2007).
In contrast to normal tissues, solid tumors in general are usually poorly perfused and oxygenated. This is largely due to inadequately developed tumor neovasculature, which is characterized by irregular and chaotic networks and branching patterns, irregular shape and length of microvessels, shunts and dead ends, which all contribute to increased resistance to blood flow and to presence of stagnant blood pools. All this leads to low blood flow and together with large distances between capillaries to develop-ment of hypoxic and acidic tissue environment. There may be large local variations in both the density of capillaries and oxygenation levels within the same tumor. But generally, the peripheral rim of center of most solid tumors is better vascularized and oxygenated than the center (Vaupel and Hockel 2000, Tozer et al. 2005).
Tumor blood vessel walls are structurally and functionally abnormal. Relative lack or paucity of smooth muscle cells and sympathetic enervation is common and contributes to inferior local regulation of microcirculatory blood flow. Abnormal basal membrane and endothelial lining with loose intercellu-lar connections or even openings between endothelial cells result in high vascular permeability to large molecules, including plasma proteins. This leads to increased extravasation of liquids; tumor capillaries are said to be “leaky,” which together with inadequate lymphatic drainage system contributes to elevated interstitial fluid pressure (IFP) in tumors (Pusenjak and Miklavcic 1997, Tozer et al. 2005).
These characteristics of tumor blood flow can represent obstacles for some antitumor treatments. For example, insufficient blood flow and elevated IFP in tumors impede effective delivery of che-motherapeutics into the tumor. Hypoxic environment makes tumors more resistant to radiotherapy. But on the other hand, the abnormal and inadequate tumor vasculature is also an attractive target for vascular-disrupting therapies and other new treatments specifically designed to take advantage of tumor vasculature’s weaknesses (Tozer et al. 2005, Siemann and Horsman 2009).
21.3 Measurement of Tumor Blood Flow and Related Parameters
In the following section, we present measurement methods which are frequently used in experimental studies for assessment of various parameters of blood perfusion and oxygenation in solid tumors.
21.3.1 Contrast-Enhanced Magnetic Resonance Imaging
The use of contrast-enhancing agents in conjunction with MRI can provide insight into physiology and pathophysiology of tissues in addition to anatomical information offered by nonenhanced MRI. For measurement of blood flow–related parameters, the macromolecular agents are best suited because they produce relatively stable enhancement of blood pool in tissues for a prolonged time and remain
© 2010 by Taylor and Francis Group, LLC
404 Advanced Electroporation Techniques in Biology and Medicine
largely confined to vascular space, thus enabling differentiation between the vascular and extravascu-lar compartments. This is in contrast to low-molecular-weight agents such as paramagnetic Gd-DTPA (gadolinium diethylenetriaminepentaacetic acid), which equilibrates rapidly between the intra- and extravascular spaces after an intravenous injection, and is also rapidly cleared from the plasma by the renal function, so it is not suitable for blood pool analysis (Schmiedl et al. 1987). Macromolecular agents include substances such as albumin-(Gd-DTPA)30, gadomer-17, and polylysine-DTPA, which can be used for the measurement of fractional tumor blood volume and microvascular permeability surface area product and have been used successfully in studies of effects of EP on tumor blood flow (Sersa et al. 1998, Ivanusa et al. 2001, Sersa et al. 2002). The measurements are based on a pixel-by-pixel comparison of a pre-contrast MRI image with a sequence of enhanced images taken at different intervals after intra-venous injection of the contrast agent (see Demsar et al. 1997 for details).
21.3.2 Rubidium (86Rb) Extraction Technique
Relative tissue perfusion as a proportion of cardiac output can be measured using extraction of the radioactive rubidium isotope 86Rb (Sapirstein 1958, Sersa et al. 1999b). Briefly, the mouse is injected via tail vein with saline solution of 86RbCl of known radioactivity. One minute later (the time needed to saturate tissues with rubidium) the mouse is sacrificed, the tail removed, and tissue samples of interest are extracted and weighed. Radioactivity of tissue samples is measured by a gamma counter and used to calculate the relative perfusion expressed as a percent of injected dose normalized per sample weight while applying corrections for the activity retained in the tail (injection site) and the background radio-activity. Such measurements can be used for comparison of perfusion levels between different tissues or organs. The method is simple but time consuming and requires work with radioactive material. Its major drawback is that only one measurement point in time per animal can be obtained, so this method requires a large number of experimental animals if a time course of perfusion changes is required.
21.3.3 Patent Blue-Violet Staining Technique
This in vivo staining technique uses patent blue-violet biological dye (otherwise commonly used in lymphography) as a contrast agent for visualization of perfused versus non-perfused tissue areas. Even though the results are of qualitative nature, it has been established experimentally that this method provides essentially the same results in solid tumors as the rubidium extraction technique with a ben-efit of being simpler, less time-consuming and involving no hazardous materials (Sersa et al. 1999a). The mouse is injected via tail vein with saline solution of patent blue-violet (PBV) dye. After 1 min (the time needed by the dye to distribute around the tissues) the mouse is sacrificed and tumor removed and cut along its largest diameter. Both cross sections are photographed and images can be analyzed using image processing software. The percentage of stained (perfused) and non-stained (non-perfused) cross-section area is estimated and used as a relative indicator of perfusion level (Sersa et al. 2008). In addition, the heterogeneous macroscopic distribution of perfused areas in the tumor can be visualized. However, only one measurement per time point per animal can be obtained; so this method requires a large number of experimental animals if a time course of perfusion changes is required.
21.3.4 Laser Doppler Flowmetry
Laser Doppler flowmetry (LDF) is a well-documented optical method, which allows for in vivo monitor-ing of relative blood flow on the level of microcirculation (Shepherd and Öberg 1990). It is based on a physical phenomenon of Doppler shift in wavelength of light. Lasers and fiber-optic probes are used to introduce a beam of coherent monochromatic light in the near-infrared part of the spectrum into the tissue. Most photons are absorbed or otherwise lost in the tissue, but some of them scatter on stationary and moving structures in the tissue and can be collected by the receiving fiber-optic probe and mea-sured. Due to scattering of photons on moving structures (red blood cells in capillaries), the wavelength
© 2010 by Taylor and Francis Group, LLC
Tumor Blood Flow–Modifying Effects of Electroporation and Electrochemotherapy 405
of these photons is changed (Doppler shift) and it is the spread of the wavelengths of reemerging photons that is used to calculate the relative microcirculatory blood flow. LDF is a very sensitive method with excellent time resolution and can be used to measure rapid changes in local blood flow. Even though LDF is in principle a noninvasive method, thin invasive probes should be used for measurement in tissues below the skin (such as subcutaneous tumors) due to relatively small sampling volume of the method. Anesthesia is usually required for animals to minimize all movements, preferably by an inhala-tion anesthetic, in which case animals must be kept at physiological temperature at all times to ensure stable physiological conditions (Jarm et al. 2002).
21.3.5 Power Doppler Ultrasonographic Imaging
Power Doppler ultrasonographic (US) imaging can be used to asses noninvasively the gross tumor blood flow changes and to visualize the distribution of areas with different perfusion rates within the same tumor. It requires use of a contrast agent such as SonoVue, a sulfur hexafluoride-filled micro-bubble contrast agent (SonoVue, Bracco, Milan, Italy) to produce sufficient contrast enhancement of per-fused areas. In anesthetized mice, an i.v. injection of a solution containing tiny bubbles of this contrast agent gas produces strong enhancement of perfused tumor areas in US images within 5–10 s. Contrast enhancement is monitored just before and at regular intervals of 15 s for 5 min after the injection of the contrast agent. The procedure can be repeated at desired intervals after the treatment of tumors with blood flow–modifying treatments in order to follow the long-term effects (Sersa et al. 2008). The contrast agent SonoVue in particular is licensed for abdominal and vascular imaging in many countries and its use for tumor measurements has been tested and can be performed in clinical environment (Delorme and Krix 2006).
21.3.6 Electron Paramagnetic Resonance Oximetry
Electron paramagnetic resonance (EPR) oximetry is a method related to nuclear magnetic resonance method. It is based on paramagnetic properties of oxygen molecules. Its spin exchange interaction with a paramagnetic probe sensitive to oxygen allows essentially noninvasive monitoring of oxygen partial pres-sure (pO2) at the same tissue location over long period of time (O’Hara et al. 2001, Sentjurc et al. 2004). A solid particle of paramagnetic probe such as a very small (e.g., 0.5 mm3) amount of charcoal made from Bubinga tree is implanted into tissue under observation (Sentjurc et al. 2004). In case of tumor oxygen-ation studies, the probes are usually implanted in tumor periphery and center (to distinguish between the two regions) and in normal control tissue such as subcutis or muscle (Sersa et al. 2001, 2002, Sentjurc et al. 2004). When tissue is exposed to appropriate external magnetic excitation, the resulting EPR spectra of the paramagnetic material can be measured by a surface coil resonator. In the presence of oxygen, the spectral linewidth is broadened and the level of broadening depends on pO2 (Swartz and Clarkson 1998). EPR linewidth of the implanted probe can be measured repeatedly at different time points of interest. Immobilization of experimental animals by anesthesia is required during measurements.
21.3.7 Polarographic Oximetry
Polarographic oximetry is a well-known and documented method for measurement of oxygen partial pressure (pO2) in tissue. The principle and use of this method are extensively documented (see, for example, Vaupel et al., 1991). Briefly, a thin active electrode is inserted into the tissue of interest and the reference Ag/AgCl electrode is placed subcutaneously somewhere else. Due to a negative voltage the reduction and oxidation take place at the active and reference electrode, respectively, resulting in a very small electric current, which can be measured. A semipermeable membrane covers the active electrode to ensure that only oxygen contributes to the reduction process. When equilibrium in diffusion of O2 molecules toward the cathode is reached, the resulting electric current is proportional to pO2 in the
© 2010 by Taylor and Francis Group, LLC
406 Advanced Electroporation Techniques in Biology and Medicine
tissue. In spite of some well-known drawbacks of this method (invasiveness and consumption of oxygen which affects the measurement at low pO2 values typically encountered in tumors), its implementation in the Eppendorf Histograph instrument has been long considered a “golden standard” method for pO2 measurements in tumors, largely due to a unique procedure that allows for sampling of tumor pO2 in multitude of measurement points within the same tumor. It is however not well-suited for continuous monitoring of pO2 changes or for repeated measurements due to its invasiveness. The method has also been used in clinical studies due to the recognized prognostic value of tumor oxygenation as an inde-pendent prognostic indicator in cancer, which influences tumor progression and treatment outcome (Menon and Fraker 2005).
21.3.8 Luminescence-Based Fiber-Optic Oximetry
This method implemented in the OxyLite instruments (Oxford Optronix, Oxford, United Kingdom) is considered an alternative to polarographic oximetry. The details about the method can be found in Collingridge et al. (1997). Briefly, pulses of light emitted by a blue LED diode are delivered via optical fiber to ruthenium chloride luminophore incorporated in a tip of a thin probe inserted into tissue of interest. The incident light induces fluorescence of ruthenium molecules at a longer wavelength. The lifetime of the fluorescence is inversely proportional to oxygen pO2 in the surrounding tissue and pO2 can be calculated using the Stern–Volmer relation. Tissue temperature at the probe tip must also be monitored and its fluctuations must be compensated for. In contrast to polarographic oximetry, the sensor of the luminescence-based oximetry does not consume oxygen and can therefore also be used to monitor pO2 changes over longer periods. The same limitations due to invasiveness however apply and the method is currently still not approved for use in humans.
21.3.9 Histological Assessment of Hypoxia by Means of Hypoxia Marker Pimonidazole
Pimonidazole is a hypoxia marker known to bind preferentially to hypoxic tumor cells. It is reduc-tively activated in an oxygen-dependent manner and is covalently bound to thiol-containing proteins in hypoxic cells, forming intracellular protein adducts. Detection of protein adducts of reductively acti-vated pimonidazole using monoclonal antibodies can be used to detect hypoxic regions or even indi-vidual hypoxic cells in histological preparations. The experimental animal (such as a mouse) is injected intraperitoneally with pimonidazole approximately 16 h prior to tumor excision. Tumors are then for-malin-fixed, paraffin-embedded, cut, and immunohistochemical staining is performed to detect pimo-nidazole (Raleigh et al. 2001, Cör et al. 2009).
21.4 Effects of Electroporation and Electrochemotherapy on Tumor Blood Flow
All effects of EP alone or ECT described in this section are strictly of local nature. All studies report that macroscopic changes in blood flow and related parameters as well as histological evidence of these effects were confined only to the tissue directly subjected to the treatment. No significant systemic effects on blood flow have ever been found.
21.4.1 Electroporation and Electrochemotherapy Protocols
A typical single application of EP commonly used in ECT consists of a sequence of eight square mono-polar electric pulses delivered to tissue either noninvasively via parallel-plate electrodes or invasively using various arrangements of several needle electrodes (Mir et al. 2006). Duration of pulses and
© 2010 by Taylor and Francis Group, LLC
Tumor Blood Flow–Modifying Effects of Electroporation and Electrochemotherapy 407
repetition frequency are most frequently set to 100 μs and 1 Hz, respectively. The amplitude of pulses is dependent on the interelectrode distance and is frequently reported as the voltage divided by the interelectrode distance. For invasive EP with needle electrodes inserted into tumors, lower voltages are used than for noninvasive EP with plate electrodes, due to absence of the skin barrier between the target tissue and the electrodes (Miklavcic et al. 2006). In a typical application of ECT, the electric pulses are delivered at the time when the maximum extracellular concentration of the chemotherapeu-tic drug is achieved (Sersa et al. 1995). Therefore the EP procedure is applied 3 min in mice or 8 min in humans after intravenous or immediately after intratumoral injection of bleomycin or cisplatin (Sersa et al. 1995, Domenge et al. 1996, Heller et al. 1997, Cemazar et al. 1998). The drugs are used at very low doses, which have no systemic side effects and only insignificant antitumor effect when used with-out EP. Even though the exact protocols for EP, drug dosage and administration, and ECT in various studies are optimized for particular applications (animal species, electrode type, tumor site and size, chemotherapeutic used, aim of the study) and can thus vary from the one outlined here, the protocol details will not be mentioned in this chapter unless necessary for the discussion, but can be found in the cited references.
21.4.2 Electroporation and Blood Flow
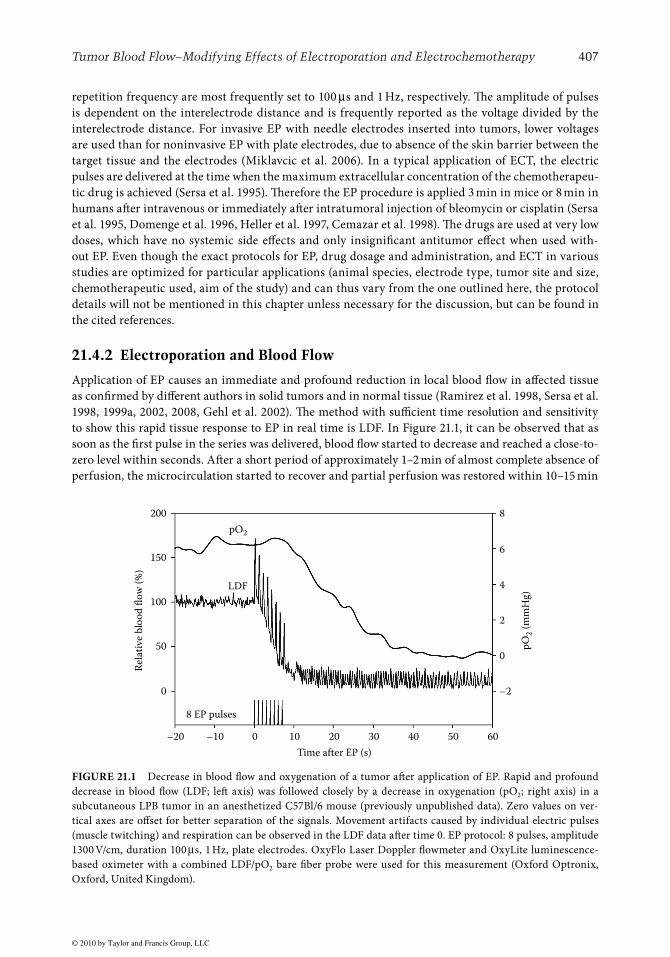
Application of EP causes an immediate and profound reduction in local blood flow in affected tissue as confirmed by different authors in solid tumors and in normal tissue (Ramirez et al. 1998, Sersa et al. 1998, 1999a, 2002, 2008, Gehl et al. 2002). The method with sufficient time resolution and sensitivity to show this rapid tissue response to EP in real time is LDF. In Figure 21.1, it can be observed that as soon as the first pulse in the series was delivered, blood flow started to decrease and reached a close-to-zero level within seconds. After a short period of approximately 1–2 min of almost complete absence of perfusion, the microcirculation started to recover and partial perfusion was restored within 10–15 min
200
150
100
50
0 –2
0
2
4
6
8
–20 –10 0 10
Time after EP (s)
8 EP pulses
LDF
Rel
ativ
e b
loo
d fl
ow
(%
)
pO
2 (
mm
Hg
)pO2
20 30 40 50 60
FIGURE 21.1 Decrease in blood flow and oxygenation of a tumor after application of EP. Rapid and profound decrease in blood flow (LDF; left axis) was followed closely by a decrease in oxygenation (pO2; right axis) in a subcutaneous LPB tumor in an anesthetized C57Bl/6 mouse (previously unpublished data). Zero values on ver-tical axes are offset for better separation of the signals. Movement artifacts caused by individual electric pulses (muscle twitching) and respiration can be observed in the LDF data after time 0. EP protocol: 8 pulses, amplitude 1300 V/cm, duration 100 μs, 1 Hz, plate electrodes. OxyFlo Laser Doppler flowmeter and OxyLite luminescence-based oximeter with a combined LDF/pO2 bare fiber probe were used for this measurement (Oxford Optronix, Oxford, United Kingdom).
© 2010 by Taylor and Francis Group, LLC
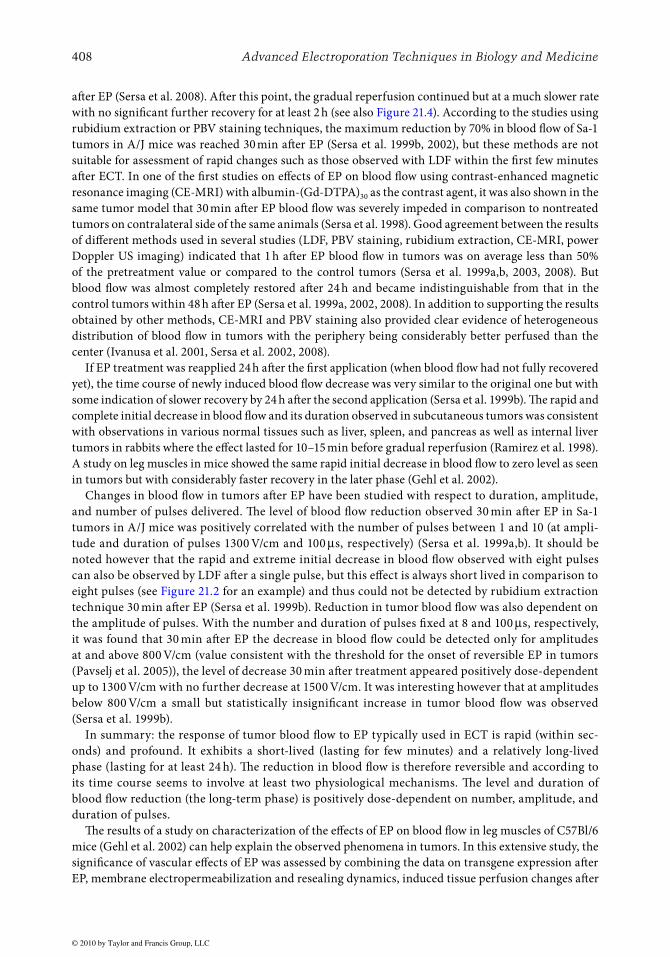
408 Advanced Electroporation Techniques in Biology and Medicine
after EP (Sersa et al. 2008). After this point, the gradual reperfusion continued but at a much slower rate with no significant further recovery for at least 2 h (see also Figure 21.4). According to the studies using rubidium extraction or PBV staining techniques, the maximum reduction by 70% in blood flow of Sa-1 tumors in A/J mice was reached 30 min after EP (Sersa et al. 1999b, 2002), but these methods are not suitable for assessment of rapid changes such as those observed with LDF within the first few minutes after ECT. In one of the first studies on effects of EP on blood flow using contrast-enhanced magnetic resonance imaging (CE-MRI) with albumin-(Gd-DTPA)30 as the contrast agent, it was also shown in the same tumor model that 30 min after EP blood flow was severely impeded in comparison to nontreated tumors on contralateral side of the same animals (Sersa et al. 1998). Good agreement between the results of different methods used in several studies (LDF, PBV staining, rubidium extraction, CE-MRI, power Doppler US imaging) indicated that 1 h after EP blood flow in tumors was on average less than 50% of the pretreatment value or compared to the control tumors (Sersa et al. 1999a,b, 2003, 2008). But blood flow was almost completely restored after 24 h and became indistinguishable from that in the control tumors within 48 h after EP (Sersa et al. 1999a, 2002, 2008). In addition to supporting the results obtained by other methods, CE-MRI and PBV staining also provided clear evidence of heterogeneous distribution of blood flow in tumors with the periphery being considerably better perfused than the center (Ivanusa et al. 2001, Sersa et al. 2002, 2008).
If EP treatment was reapplied 24 h after the first application (when blood flow had not fully recovered yet), the time course of newly induced blood flow decrease was very similar to the original one but with some indication of slower recovery by 24 h after the second application (Sersa et al. 1999b). The rapid and complete initial decrease in blood flow and its duration observed in subcutaneous tumors was consistent with observations in various normal tissues such as liver, spleen, and pancreas as well as internal liver tumors in rabbits where the effect lasted for 10–15 min before gradual reperfusion (Ramirez et al. 1998). A study on leg muscles in mice showed the same rapid initial decrease in blood flow to zero level as seen in tumors but with considerably faster recovery in the later phase (Gehl et al. 2002).
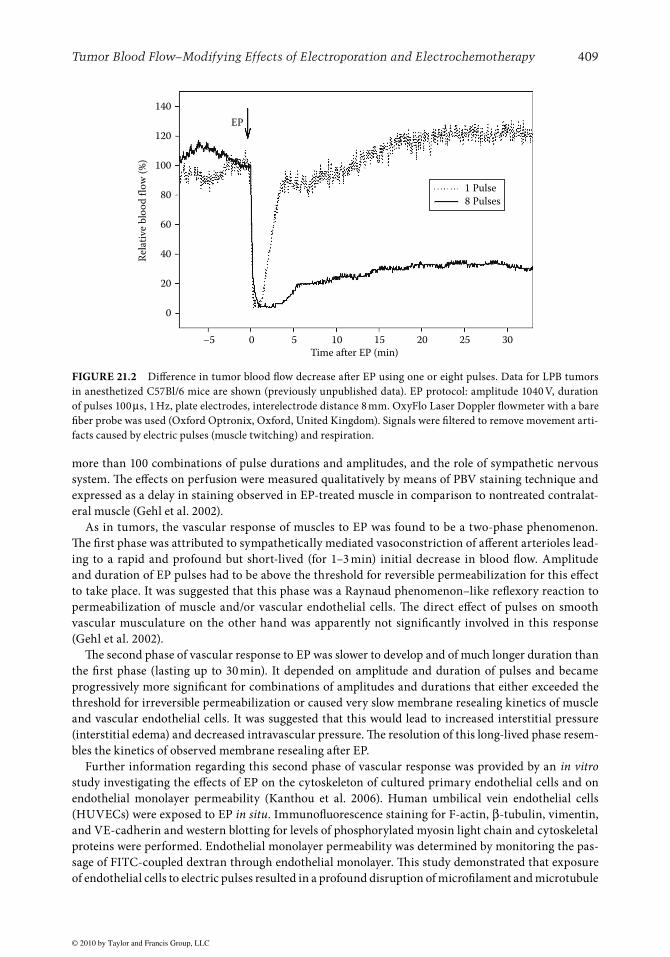
Changes in blood flow in tumors after EP have been studied with respect to duration, amplitude, and number of pulses delivered. The level of blood flow reduction observed 30 min after EP in Sa-1 tumors in A/J mice was positively correlated with the number of pulses between 1 and 10 (at ampli-tude and duration of pulses 1300 V/cm and 100 μs, respectively) (Sersa et al. 1999a,b). It should be noted however that the rapid and extreme initial decrease in blood flow observed with eight pulses can also be observed by LDF after a single pulse, but this effect is always short lived in comparison to eight pulses (see Figure 21.2 for an example) and thus could not be detected by rubidium extraction technique 30 min after EP (Sersa et al. 1999b). Reduction in tumor blood flow was also dependent on the amplitude of pulses. With the number and duration of pulses fixed at 8 and 100 μs, respectively, it was found that 30 min after EP the decrease in blood flow could be detected only for amplitudes at and above 800 V/cm (value consistent with the threshold for the onset of reversible EP in tumors (Pavselj et al. 2005)), the level of decrease 30 min after treatment appeared positively dose-dependent up to 1300 V/cm with no further decrease at 1500 V/cm. It was interesting however that at amplitudes below 800 V/cm a small but statistically insignificant increase in tumor blood flow was observed (Sersa et al. 1999b).
In summary: the response of tumor blood flow to EP typically used in ECT is rapid (within sec-onds) and profound. It exhibits a short-lived (lasting for few minutes) and a relatively long-lived phase (lasting for at least 24 h). The reduction in blood flow is therefore reversible and according to its time course seems to involve at least two physiological mechanisms. The level and duration of blood flow reduction (the long-term phase) is positively dose-dependent on number, amplitude, and duration of pulses.
The results of a study on characterization of the effects of EP on blood flow in leg muscles of C57Bl/6 mice (Gehl et al. 2002) can help explain the observed phenomena in tumors. In this extensive study, the significance of vascular effects of EP was assessed by combining the data on transgene expression after EP, membrane electropermeabilization and resealing dynamics, induced tissue perfusion changes after
© 2010 by Taylor and Francis Group, LLC
Tumor Blood Flow–Modifying Effects of Electroporation and Electrochemotherapy 409
more than 100 combinations of pulse durations and amplitudes, and the role of sympathetic nervous system. The effects on perfusion were measured qualitatively by means of PBV staining technique and expressed as a delay in staining observed in EP-treated muscle in comparison to nontreated contralat-eral muscle (Gehl et al. 2002).
As in tumors, the vascular response of muscles to EP was found to be a two-phase phenomenon. The first phase was attributed to sympathetically mediated vasoconstriction of afferent arterioles lead-ing to a rapid and profound but short-lived (for 1–3 min) initial decrease in blood flow. Amplitude and duration of EP pulses had to be above the threshold for reversible permeabilization for this effect to take place. It was suggested that this phase was a Raynaud phenomenon–like reflexory reaction to permeabilization of muscle and/or vascular endothelial cells. The direct effect of pulses on smooth vascular musculature on the other hand was apparently not significantly involved in this response (Gehl et al. 2002).
The second phase of vascular response to EP was slower to develop and of much longer duration than the first phase (lasting up to 30 min). It depended on amplitude and duration of pulses and became progressively more significant for combinations of amplitudes and durations that either exceeded the threshold for irreversible permeabilization or caused very slow membrane resealing kinetics of muscle and vascular endothelial cells. It was suggested that this would lead to increased interstitial pressure (interstitial edema) and decreased intravascular pressure. The resolution of this long-lived phase resem-bles the kinetics of observed membrane resealing after EP.
Further information regarding this second phase of vascular response was provided by an in vitro study investigating the effects of EP on the cytoskeleton of cultured primary endothelial cells and on endothelial monolayer permeability (Kanthou et al. 2006). Human umbilical vein endothelial cells (HUVECs) were exposed to EP in situ. Immunofluorescence staining for F-actin, β-tubulin, vimentin, and VE-cadherin and western blotting for levels of phosphorylated myosin light chain and cytoskeletal proteins were performed. Endothelial monolayer permeability was determined by monitoring the pas-sage of FITC-coupled dextran through endothelial monolayer. This study demonstrated that exposure of endothelial cells to electric pulses resulted in a profound disruption of microfilament and microtubule
140
120
100
80
60
40
20
0
–5 0 5 10
Time after EP (min)
EP
1 Pulse
8 Pulses
Rel
ativ
e b
loo
d f
low
(%
)
15 20 25 30
FIGURE 21.2 Difference in tumor blood flow decrease after EP using one or eight pulses. Data for LPB tumors in anesthetized C57Bl/6 mice are shown (previously unpublished data). EP protocol: amplitude 1040 V, duration of pulses 100 μs, 1 Hz, plate electrodes, interelectrode distance 8 mm. OxyFlo Laser Doppler flowmeter with a bare fiber probe was used (Oxford Optronix, Oxford, United Kingdom). Signals were filtered to remove movement arti-facts caused by electric pulses (muscle twitching) and respiration.
© 2010 by Taylor and Francis Group, LLC
410 Advanced Electroporation Techniques in Biology and Medicine
cytoskeletal networks, loss of contractility, and loss of VE-cadherin from cell-to-cell junctions within 5 min after EP. These effects were voltage-dependent and reversible, since cytoskeletal structures recov-ered within 60 min of EP, without any significant loss of cell viability. The cytoskeletal effects of EP were paralleled by a rapid rise in endothelial monolayer permeability, demonstrating that besides changes in cell membrane permeability, as suggested in (Gehl et al. 2002), changes in vascular endothelial mono-layer permeability may contribute to the observed second phase effects of vascular response to EP of normal vessels (Kanthou et al. 2006).
In summary: permeabilization of muscle and endothelial cells induced two distinct vascular effects in muscle tissue: (1) a rapid and short-lived Raynaud-like reflexory vasoconstriction of afferent arte-rioles mediated by sympathetic nervous system, the resolution of which depended on the release of vasoconstricting spasm and (2) slower and longer lived increased endothelial monolayer permeability, that resulted in leakage of fluids and molecules from blood vessels as well as from permeabilized cells into extracellular space, leading to increased IFP and decreased intravascular pressure. The resolution of this phase depended on membrane resealing kinetics and recovery of endothelial cytoskeletal structures (Gehl et al. 2002, Kanthou et al. 2006).
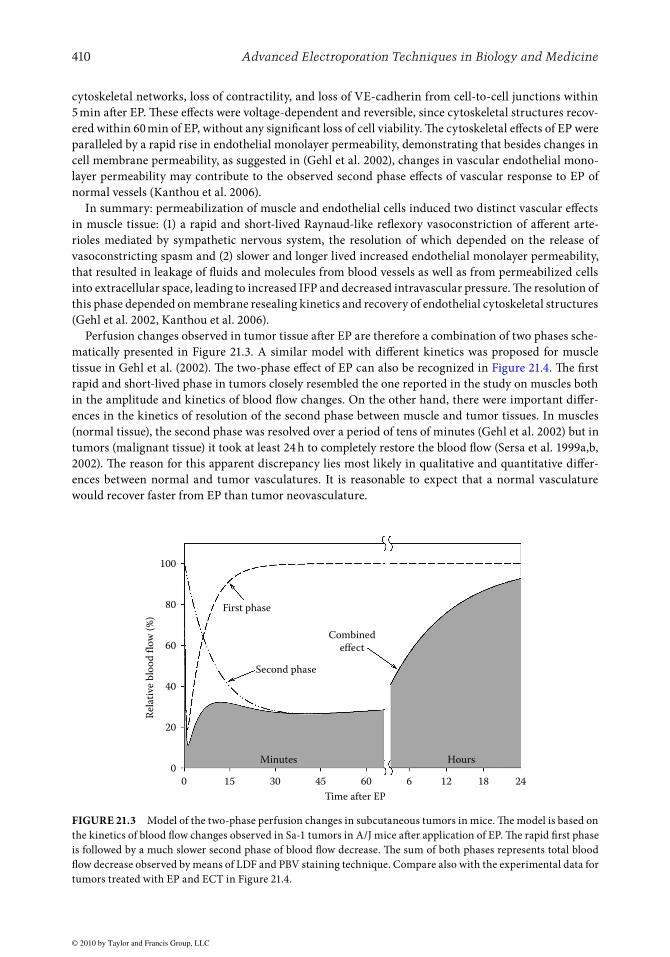
Perfusion changes observed in tumor tissue after EP are therefore a combination of two phases sche-matically presented in Figure 21.3. A similar model with different kinetics was proposed for muscle tissue in Gehl et al. (2002). The two-phase effect of EP can also be recognized in Figure 21.4. The first rapid and short-lived phase in tumors closely resembled the one reported in the study on muscles both in the amplitude and kinetics of blood flow changes. On the other hand, there were important differ-ences in the kinetics of resolution of the second phase between muscle and tumor tissues. In muscles (normal tissue), the second phase was resolved over a period of tens of minutes (Gehl et al. 2002) but in tumors (malignant tissue) it took at least 24 h to completely restore the blood flow (Sersa et al. 1999a,b, 2002). The reason for this apparent discrepancy lies most likely in qualitative and quantitative differ-ences between normal and tumor vasculatures. It is reasonable to expect that a normal vasculature would recover faster from EP than tumor neovasculature.
100
80
60
40
20
0
0 15 30 45 60
Time after EP
Minutes
Combined
effect
Second phase
Rel
ativ
e b
loo
d f
low
(%
)
First phase
Hours
6 12 18 24
FIGURE 21.3 Model of the two-phase perfusion changes in subcutaneous tumors in mice. The model is based on the kinetics of blood flow changes observed in Sa-1 tumors in A/J mice after application of EP. The rapid first phase is followed by a much slower second phase of blood flow decrease. The sum of both phases represents total blood flow decrease observed by means of LDF and PBV staining technique. Compare also with the experimental data for tumors treated with EP and ECT in Figure 21.4.
© 2010 by Taylor and Francis Group, LLC
Tumor Blood Flow–Modifying Effects of Electroporation and Electrochemotherapy 411
21.4.3 Electrochemotherapy and Blood Flow
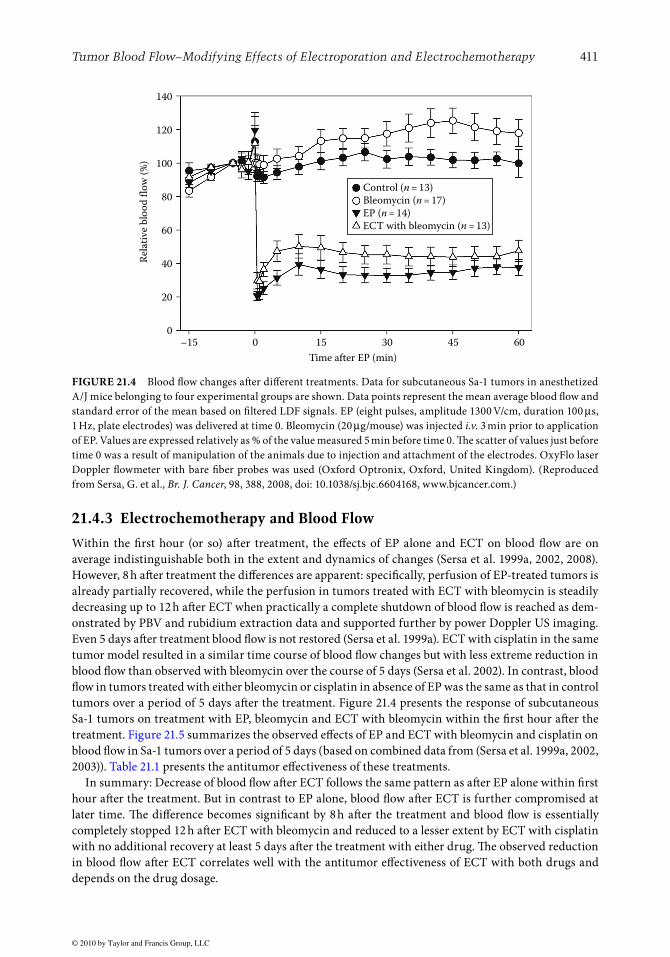
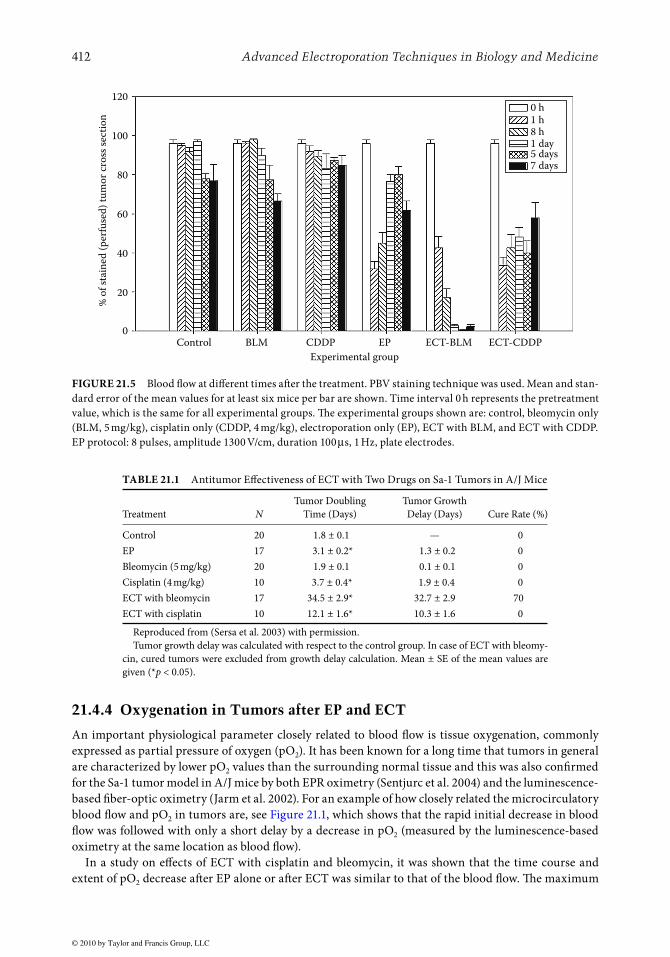
Within the first hour (or so) after treatment, the effects of EP alone and ECT on blood flow are on average indistinguishable both in the extent and dynamics of changes (Sersa et al. 1999a, 2002, 2008). However, 8 h after treatment the differences are apparent: specifically, perfusion of EP-treated tumors is already partially recovered, while the perfusion in tumors treated with ECT with bleomycin is steadily decreasing up to 12 h after ECT when practically a complete shutdown of blood flow is reached as dem-onstrated by PBV and rubidium extraction data and supported further by power Doppler US imaging. Even 5 days after treatment blood flow is not restored (Sersa et al. 1999a). ECT with cisplatin in the same tumor model resulted in a similar time course of blood flow changes but with less extreme reduction in blood flow than observed with bleomycin over the course of 5 days (Sersa et al. 2002). In contrast, blood flow in tumors treated with either bleomycin or cisplatin in absence of EP was the same as that in control tumors over a period of 5 days after the treatment. Figure 21.4 presents the response of subcutaneous Sa-1 tumors on treatment with EP, bleomycin and ECT with bleomycin within the first hour after the treatment. Figure 21.5 summarizes the observed effects of EP and ECT with bleomycin and cisplatin on blood flow in Sa-1 tumors over a period of 5 days (based on combined data from (Sersa et al. 1999a, 2002, 2003)). Table 21.1 presents the antitumor effectiveness of these treatments.
In summary: Decrease of blood flow after ECT follows the same pattern as after EP alone within first hour after the treatment. But in contrast to EP alone, blood flow after ECT is further compromised at later time. The difference becomes significant by 8 h after the treatment and blood flow is essentially completely stopped 12 h after ECT with bleomycin and reduced to a lesser extent by ECT with cisplatin with no additional recovery at least 5 days after the treatment with either drug. The observed reduction in blood flow after ECT correlates well with the antitumor effectiveness of ECT with both drugs and depends on the drug dosage.
140
120
100
80
60
40
20
0–15 0 15
Time after EP (min)
Control (n = 13)
Bleomycin (n = 17)
EP (n = 14)
ECT with bleomycin (n = 13)
Rel
ativ
e b
loo
d f
low
(%
)
30 45 60
FIGURE 21.4 Blood flow changes after different treatments. Data for subcutaneous Sa-1 tumors in anesthetized A/J mice belonging to four experimental groups are shown. Data points represent the mean average blood flow and standard error of the mean based on filtered LDF signals. EP (eight pulses, amplitude 1300 V/cm, duration 100 μs, 1 Hz, plate electrodes) was delivered at time 0. Bleomycin (20 μg/mouse) was injected i.v. 3 min prior to application of EP. Values are expressed relatively as % of the value measured 5 min before time 0. The scatter of values just before time 0 was a result of manipulation of the animals due to injection and attachment of the electrodes. OxyFlo laser Doppler flowmeter with bare fiber probes was used (Oxford Optronix, Oxford, United Kingdom). (Reproduced from Sersa, G. et al., Br. J. Cancer, 98, 388, 2008, doi: 10.1038/sj.bjc.6604168, www.bjcancer.com.)
© 2010 by Taylor and Francis Group, LLC
412 Advanced Electroporation Techniques in Biology and Medicine
21.4.4 Oxygenation in Tumors after EP and ECT
An important physiological parameter closely related to blood flow is tissue oxygenation, commonly expressed as partial pressure of oxygen (pO2). It has been known for a long time that tumors in general are characterized by lower pO2 values than the surrounding normal tissue and this was also confirmed for the Sa-1 tumor model in A/J mice by both EPR oximetry (Sentjurc et al. 2004) and the luminescence-based fiber-optic oximetry (Jarm et al. 2002). For an example of how closely related the microcirculatory blood flow and pO2 in tumors are, see Figure 21.1, which shows that the rapid initial decrease in blood flow was followed with only a short delay by a decrease in pO2 (measured by the luminescence-based oximetry at the same location as blood flow).
In a study on effects of ECT with cisplatin and bleomycin, it was shown that the time course and extent of pO2 decrease after EP alone or after ECT was similar to that of the blood flow. The maximum
120
100
80
60
40
20
0Control BLM CDDP
Experimental group
% o
f st
ain
ed (
per
fuse
d)
tum
or
cro
ss s
ecti
on
0 h1 h8 h1 day5 days7 days
EP ECT-BLM ECT-CDDP
FIGURE 21.5 Blood flow at different times after the treatment. PBV staining technique was used. Mean and stan-dard error of the mean values for at least six mice per bar are shown. Time interval 0 h represents the pretreatment value, which is the same for all experimental groups. The experimental groups shown are: control, bleomycin only (BLM, 5 mg/kg), cisplatin only (CDDP, 4 mg/kg), electroporation only (EP), ECT with BLM, and ECT with CDDP. EP protocol: 8 pulses, amplitude 1300 V/cm, duration 100 μs, 1 Hz, plate electrodes.
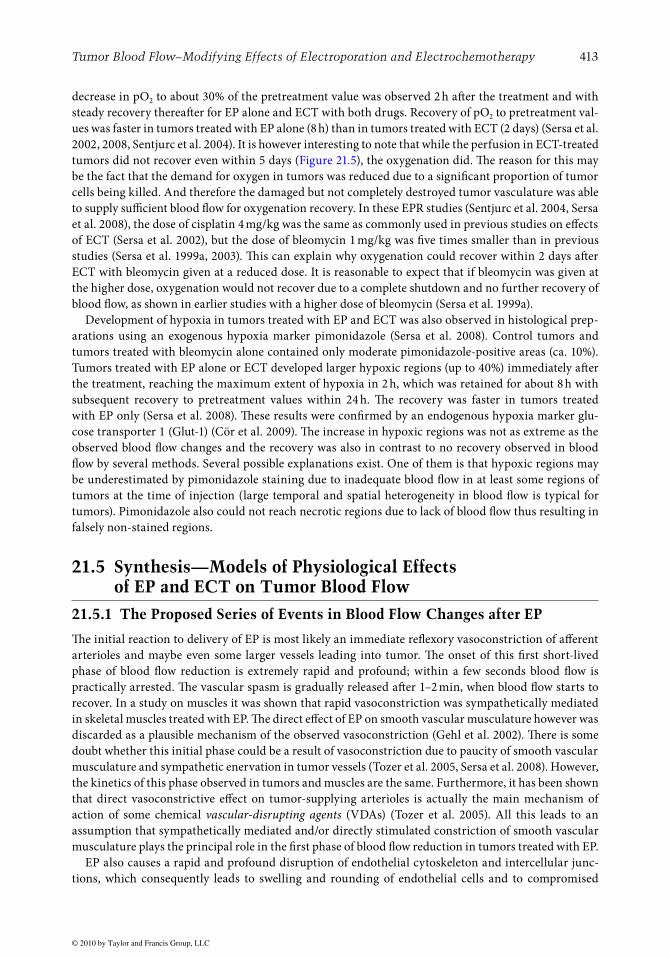
TABLE 21.1 Antitumor Effectiveness of ECT with Two Drugs on Sa-1 Tumors in A/J Mice
Treatment NTumor Doubling
Time (Days)Tumor Growth Delay (Days) Cure Rate (%)
Control 20 1.8 ± 0.1 — 0EP 17 3.1 ± 0.2* 1.3 ± 0.2 0Bleomycin (5 mg/kg) 20 1.9 ± 0.1 0.1 ± 0.1 0Cisplatin (4 mg/kg) 10 3.7 ± 0.4* 1.9 ± 0.4 0ECT with bleomycin 17 34.5 ± 2.9* 32.7 ± 2.9 70ECT with cisplatin 10 12.1 ± 1.6* 10.3 ± 1.6 0
Reproduced from (Sersa et al. 2003) with permission.Tumor growth delay was calculated with respect to the control group. In case of ECT with bleomy-
cin, cured tumors were excluded from growth delay calculation. Mean ± SE of the mean values are given (*p < 0.05).
© 2010 by Taylor and Francis Group, LLC
Tumor Blood Flow–Modifying Effects of Electroporation and Electrochemotherapy 413
decrease in pO2 to about 30% of the pretreatment value was observed 2 h after the treatment and with steady recovery thereafter for EP alone and ECT with both drugs. Recovery of pO2 to pretreatment val-ues was faster in tumors treated with EP alone (8 h) than in tumors treated with ECT (2 days) (Sersa et al. 2002, 2008, Sentjurc et al. 2004). It is however interesting to note that while the perfusion in ECT-treated tumors did not recover even within 5 days (Figure 21.5), the oxygenation did. The reason for this may be the fact that the demand for oxygen in tumors was reduced due to a significant proportion of tumor cells being killed. And therefore the damaged but not completely destroyed tumor vasculature was able to supply sufficient blood flow for oxygenation recovery. In these EPR studies (Sentjurc et al. 2004, Sersa et al. 2008), the dose of cisplatin 4 mg/kg was the same as commonly used in previous studies on effects of ECT (Sersa et al. 2002), but the dose of bleomycin 1 mg/kg was five times smaller than in previous studies (Sersa et al. 1999a, 2003). This can explain why oxygenation could recover within 2 days after ECT with bleomycin given at a reduced dose. It is reasonable to expect that if bleomycin was given at the higher dose, oxygenation would not recover due to a complete shutdown and no further recovery of blood flow, as shown in earlier studies with a higher dose of bleomycin (Sersa et al. 1999a).
Development of hypoxia in tumors treated with EP and ECT was also observed in histological prep-arations using an exogenous hypoxia marker pimonidazole (Sersa et al. 2008). Control tumors and tumors treated with bleomycin alone contained only moderate pimonidazole-positive areas (ca. 10%). Tumors treated with EP alone or ECT developed larger hypoxic regions (up to 40%) immediately after the treatment, reaching the maximum extent of hypoxia in 2 h, which was retained for about 8 h with subsequent recovery to pretreatment values within 24 h. The recovery was faster in tumors treated with EP only (Sersa et al. 2008). These results were confirmed by an endogenous hypoxia marker glu-cose transporter 1 (Glut-1) (Cör et al. 2009). The increase in hypoxic regions was not as extreme as the observed blood flow changes and the recovery was also in contrast to no recovery observed in blood flow by several methods. Several possible explanations exist. One of them is that hypoxic regions may be underestimated by pimonidazole staining due to inadequate blood flow in at least some regions of tumors at the time of injection (large temporal and spatial heterogeneity in blood flow is typical for tumors). Pimonidazole also could not reach necrotic regions due to lack of blood flow thus resulting in falsely non-stained regions.
21.5 Synthesis—Models of Physiological Effects of EP and ECT on Tumor Blood Flow
21.5.1 The Proposed Series of Events in Blood Flow Changes after EP
The initial reaction to delivery of EP is most likely an immediate reflexory vasoconstriction of afferent arterioles and maybe even some larger vessels leading into tumor. The onset of this first short-lived phase of blood flow reduction is extremely rapid and profound; within a few seconds blood flow is practically arrested. The vascular spasm is gradually released after 1–2 min, when blood flow starts to recover. In a study on muscles it was shown that rapid vasoconstriction was sympathetically mediated in skeletal muscles treated with EP. The direct effect of EP on smooth vascular musculature however was discarded as a plausible mechanism of the observed vasoconstriction (Gehl et al. 2002). There is some doubt whether this initial phase could be a result of vasoconstriction due to paucity of smooth vascular musculature and sympathetic enervation in tumor vessels (Tozer et al. 2005, Sersa et al. 2008). However, the kinetics of this phase observed in tumors and muscles are the same. Furthermore, it has been shown that direct vasoconstrictive effect on tumor-supplying arterioles is actually the main mechanism of action of some chemical vascular-disrupting agents (VDAs) (Tozer et al. 2005). All this leads to an assumption that sympathetically mediated and/or directly stimulated constriction of smooth vascular musculature plays the principal role in the first phase of blood flow reduction in tumors treated with EP.
EP also causes a rapid and profound disruption of endothelial cytoskeleton and intercellular junc-tions, which consequently leads to swelling and rounding of endothelial cells and to compromised
© 2010 by Taylor and Francis Group, LLC
414 Advanced Electroporation Techniques in Biology and Medicine
barrier function of the endothelial lining (Kanthou et al. 2006). Change in shape of endothelial cells increases vascular resistance for blood flow. The increased permeability of vascular walls to macromol-ecules is followed by protein leakage and leads to a decrease in oncotic pressure between the intra- and extravascular compartments and consequently to extravasation of liquids. The results are a develop-ment of interstitial edema, a buildup of IFP, a decreased intravascular pressure, and ultimately a com-promised blood flow, not unlike what is seen after application of chemical VDAs (Tozer et al. 2005). The effect on endothelial cells in vitro was reported to be rapid, it developed within 5 min (Kanthou et al. 2006)), but not as rapid as the initial blood flow reduction observed in tumors or muscles after EP. So it is proposed that this second longer lived phase lags behind the first phase and becomes the predomi-nant blood flow–reducing mechanism in tumors treated with EP 5–10 min after EP. It can be seen in LDF records of blood flow in tumors that blood flow stops increasing approximately 10–15 min after EP (Figure 21.4), which indicates a fully developed second phase of blood flow reduction. The resolution of this second phase is gradual and slow so that blood flow remains decreased up to about 24 h after the treatment of tumors (Sersa et al. 1999a,b, 2002). It was speculated that the resolution of the second phase follows the dynamics of endothelial cell membrane resealing after EP (Gehl et al. 2002). We sug-gest that the kinetics of reestablishment of endothelial cytoskeleton and the barrier function of endo-thelial cells may be an even more important determinant of resolution of the second phase in tumors. Blood flow reduction in tumors after EP is therefore reversible. But even this relatively short period of blood flow reduction (24 h) may contribute to the observed but practically insignificant growth delay in tumors treated by EP alone.
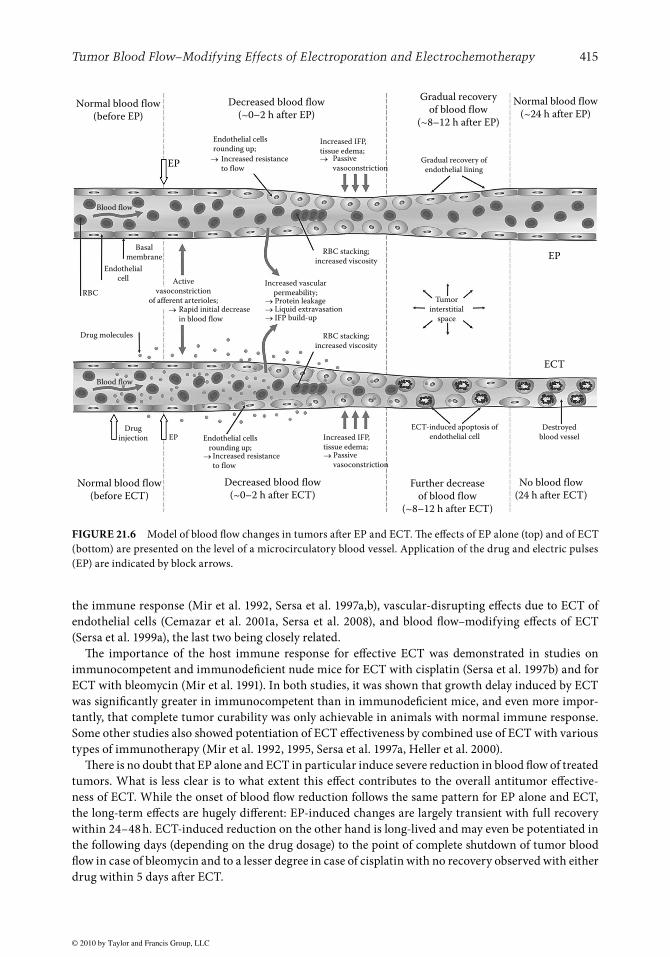
The proposed sequence of events after EP on the level of tumor microvasculature is summarized in the upper part of Figure 21.6.
21.5.2 The Proposed Series of Events in Blood Flow Changes after ECT
Up to few hours after ECT, the blood flow changes in tumors treated by ECT are identical to those observed in tumors treated by EP alone; so it is safe to assume that the main mechanisms of the observed effect are the same. However, 8 h after treatment, the differences between the effects of EP and ECT become obvious. Blood flow in EP-treated tumors continues to recover while blood flow in ECT-treated tumors continues to deteriorate or at least shows no further improvement up to 5 days after the treat-ment. The main reason for this is that the endothelial cells are affected by ECT in a similar way if not even more profoundly than the tumor cells. Affected endothelial cells cannot recover their struc-ture and function and are ultimately pushed toward cell death. As a consequence, tumor vasculature is damaged beyond repair, blood flow cannot be restored, and the remaining tumor cells supplied by the affected vessels enter the so-called secondary cascade of induced cell death brought about by the lack of oxygen and nutrients and accumulation of waste products. The proposed sequence of events after ECT on the level of tumor microvasculature is summarized in the lower part of Figure 21.6.
21.5.3 The Role of EP and ECT in Antitumor Effectiveness of the Treatment
The increased cytotoxicity of chemotherapeutic drugs bleomycin and cisplatin induced by successful EP of tumor cells is undoubtedly the main mechanism involved in antitumor effectiveness of in vivo ECT. This is supported by (a) in vitro studies showing that exposure of tumor cells to EP increased cytotox-icity of bleomycin several 100-fold and that of cisplatin 10-fold (Orlowski et al. 1988, Sersa et al. 1995, Jaroszeski et al. 2000); (b) clearly increased accumulation of both drugs in tumors treated with electric pulses (Belehradek et al. 1994, Cemazar et al. 1999); and (c) the fact that both drugs being hydrophilic in nature become highly cytotoxic once they gain access to cytosol by means of EP (Sersa et al. 1995, Mir and Orlowski 1999). However, a discrepancy between increased cytotoxicity of cisplatin by EP in vitro (10-fold) and that observed in the same tumor cells in vivo (20-fold) led researchers to a conclusion that additional mechanisms must be involved (Cemazar et al. 1999). The following ones had been proposed:
© 2010 by Taylor and Francis Group, LLC
Tumor Blood Flow–Modifying Effects of Electroporation and Electrochemotherapy 415
the immune response (Mir et al. 1992, Sersa et al. 1997a,b), vascular-disrupting effects due to ECT of endothelial cells (Cemazar et al. 2001a, Sersa et al. 2008), and blood flow–modifying effects of ECT (Sersa et al. 1999a), the last two being closely related.
The importance of the host immune response for effective ECT was demonstrated in studies on immunocompetent and immunodeficient nude mice for ECT with cisplatin (Sersa et al. 1997b) and for ECT with bleomycin (Mir et al. 1991). In both studies, it was shown that growth delay induced by ECT was significantly greater in immunocompetent than in immunodeficient mice, and even more impor-tantly, that complete tumor curability was only achievable in animals with normal immune response. Some other studies also showed potentiation of ECT effectiveness by combined use of ECT with various types of immunotherapy (Mir et al. 1992, 1995, Sersa et al. 1997a, Heller et al. 2000).
There is no doubt that EP alone and ECT in particular induce severe reduction in blood flow of treated tumors. What is less clear is to what extent this effect contributes to the overall antitumor effective-ness of ECT. While the onset of blood flow reduction follows the same pattern for EP alone and ECT, the long-term effects are hugely different: EP-induced changes are largely transient with full recovery within 24–48 h. ECT-induced reduction on the other hand is long-lived and may even be potentiated in the following days (depending on the drug dosage) to the point of complete shutdown of tumor blood flow in case of bleomycin and to a lesser degree in case of cisplatin with no recovery observed with either drug within 5 days after ECT.
Increased resistance
to flow
Normal blood flow
(before EP)
Normal blood flow
(~24 h after EP)Decreased blood flow
(~0–2 h after EP)
Gradual recovery
of blood flow
(~8–12 h after EP)
Gradual recovery of
endothelial lining
Passive
vasoconstrictionEP
EP
ECT
Destroyed
blood vessel
No blood flow
(24 h after ECT)
Blood flow
Blood flow
Endothelial cells
rounding up;
Rapid initial decrease
in blood flow
Active
vasoconstriction
of afferent arterioles; Protein leakageLiquid extravasationIFP build-up
Increased vascular
permeability;
Increased resistance
to flow
Endothelial cells
rounding up;Passive
vasoconstriction
Increased IFP,
tissue edema;
RBC stacking;
increased viscosity
ECT-induced apoptosis of
endothelial cell
Further decrease
of blood flow
(~8–12 h after ECT)
Decreased blood flow
(~0–2 h after ECT)
Basal
membrane
Drug
injection EP
Normal blood flow
(before ECT)
Endothelial
cell
Drug molecules
RBC
RBC stacking;
increased viscosity
Tumor
interstitial
space
Increased IFP,
tissue edema;
FIGURE 21.6 Model of blood flow changes in tumors after EP and ECT. The effects of EP alone (top) and of ECT (bottom) are presented on the level of a microcirculatory blood vessel. Application of the drug and electric pulses (EP) are indicated by block arrows.
© 2010 by Taylor and Francis Group, LLC
416 Advanced Electroporation Techniques in Biology and Medicine
EP is not a selective process and all cells in tumor treated with EP can be expected to be affected simi-larly (Sersa et al. 2003). Endothelial cells lining the tumor vasculature are thus also a likely target for EP and ECT. First, theoretical considerations, which took into account electrical properties of different tis-sue constituents and realistic microcirculatory blood vessel dimensions, have revealed that the electric field strength at the boundary between the blood and blood vessel wall (the location of endothelial cells) may be up to 40% higher than in the surrounding tissue further away from the vessel (Sersa et al. 2008). The reason for this is higher conductivity of blood in comparison to surrounding tissue. This indicates that the endothelial cells may be even more susceptible to the effects of EP than the tumor cells. Second, the endothelial cells are initially exposed to the highest concentration of the chemotherapeutic drug reached in blood vessels after an i.v. injection.
It is well known that the cell cytoskeleton that is composed of three major types of structures (micro-tubules, actin microfilaments, and intermediate filaments) is essential for maintaining cell shape and function. In case of vascular endothelial cells, the contractility and the integrity of intercellular junc-tions are responsible for regulation of vascular permeability (Kanthou et al. 2006). A study on human umbilical vein endothelial cells (HUVECs) provided conclusive evidence that the cytoskeleton and intercellular junctions are affected by EP. Exposure of confluent monolayers of HUVECs to electric pulses resulted in profound disruption of microfilament and microtubule cytoskeletal networks, loss of contractility, disruption of cell-to-cell junctions, and a rapid increase in endothelial monolayer perme-ability immediately after EP. The effects were voltage-dependent and almost fully reversible within 1–2 h after EP without a loss of endothelial cell viability. For voltages high enough to induce significant drop in cell viability, the restoration of perturbed cytoskeleton was severely impeded (Kanthou et al. 2006). All these results are in perfect agreement with the resolution of blood flow changes observed in tumors and suggest that changes in endothelial barrier function leading to increased permeability may be the main mechanism of the second long-term phase of blood flow decrease observed after EP in vivo. Due to inherent differences between normal and tumor vasculature, it can be expected that the disruption of cytoskeletal networks and intercellular junctions disrupted by EP would need more time to heal in tumor vasculature, which can explain why it takes longer to restore blood flow after EP in tumors (Sersa et al. 1999a,b, 2002) than in muscles (Gehl et al. 2002).
Damaged and killed endothelial cells lead to obstructed blood flow and to ischemic death of all cells supplied by the affected vessels. This effect brings ECT into the realm of the so-called vascular-targeted therapies. It was confirmed in in vitro studies using human dermal microvascular endothelial cells HMEC-1 that these cells are highly sensitive to ECT. While the cells were only moderately sensi-tive to cisplatin and bleomycin in absence of EP, the EP increased the cytotoxicity of cisplatin 10-fold and that of bleomycin even 5000-fold (compare these figures to previously mentioned 10-fold and sev-eral 100-fold increase in vitro cytotoxicity of cisplatin and bleomycin for tumor cells) (Cemazar et al. 2001a). Endothelial cells exhibited even greater sensitivity to ECT with bleomycin than some tumor cell lines (including Sa-1) but at the same time slightly better resistance to EP itself (Cemazar et al. 2001a). According to all this, ECT of endothelial cells should play a more important role in treatment of tumors with bleomycin than with cisplatin. The differences between the responses of endothelial cells treated with ECT with the two drugs in vitro are completely consistent with the overall blood flow reduction characteristics observed in tumors treated with the same treatments.
The profound and long-lasting reduction in blood flow after ECT with cisplatin was closely followed by similar extensive decrease in oxygenation, which can be expected to induce further cell death due to hypoxia. Indeed, it was found that the progression of necrosis in tumors to 90% of total tumor area correlated with oxygenation changes and also with the observed effects on overall tumor growth (Sersa et al. 2002). All these effects were more pronounced with bleomycin than with cisplatin, which was con-sistent with in vitro data on sensitivity of endothelial cells to these two drugs (Sersa et al. 1999a, 2003, Cemazar et al. 2001a).
Histological examination of tumors treated with ECT with bleomycin or cisplatin revealed develop-ment of massive necrosis (up to 100% of tumor mass in some cases with bleomycin) which reached

© 2010 by Taylor and Francis Group, LLC
Tumor Blood Flow–Modifying Effects of Electroporation and Electrochemotherapy 417
maximum values 1–3 days after the treatment and never recovered thereafter (Sersa et al. 1999a, 2002, 2008). Necrotic areas were characterized by swollen tumor cells with picnotic nuclei and eosinophilic cytoplasm and sometimes by complete nuclear disappearance. Significant ECT-induced apoptosis of cells was observed even in non-necrotic areas of tumors treated with ECT with cisplatin (Sersa et al. 2002). In contrast to ECT-treated tumors, tumors treated with EP alone developed only transiently and significantly increased tissue necrosis within first 24 h after EP. The level of necrosis usually decreased to levels comparable to control tumors within a day or two. This was well correlated with the transient blood flow changes and with only moderate growth delay induced in tumors treated with EP alone. On the other hand, tumors treated with bleomycin alone were indistinguishable from control tumors in both growth delay, extent of necrosis, and blood flow changes (Sersa et al. 2002, 2008). Tumors treated with cisplatin alone developed slightly more necrosis and a small growth delay in comparison to control tumors (Sersa et al. 1999a).
The histological examination also revealed changes induced in blood vessels by EP or ECT with bleomycin (Sersa et al. 2008). One hour after EP alone or ECT the endothelial cells appeared swollen and rounded with narrowed lumen of blood vessels which is consistent with both the observed blood flow changes and demonstrated effects of EP on endothelial cytoskeleton and endothelial monolayer (Kanthou et al. 2006). Eight hours after ECT apoptotic morphological changes in endothelial cells were observed with some extravasation of erythrocytes, a clear indication of damaged blood vessels. These effects were absent in tumors treated with EP or bleomycin only or in control tumors.
The effects of EP and ECT on blood flow can contribute to antitumor effectiveness of ECT in two ways. The first one is the entrapment of the drug accumulated within tumor due to reduced blood flow—the so-called vascular lock effect—induced transiently by EP alone and permanently by ECT, which leads to extended exposure of tumor cells to the drug. The second one is the severely damaged tumor vasculature due to ECT of endothelial cells, which consequently leads to additional cascade of tumor cell death as a result of lack of oxygen and nutrients and accumulation of waste products in the tumor. Such a phenom-enon, termed vascular-targeted therapy, has already been exploited in several studies using different approaches to affect tumor vasculature (Tozer et al. 2005). But this effect is also of extreme importance for complete elimination of the tumor in case of ECT because it helps to kill the cells that were not destroyed directly by the drug. In vitro studies confirmed that sensitivity of vascular endothelial cells to bleomycin (and to a lesser degree to cisplatin) was highly increased by ECT (Cemazar et al. 2001a).
In summary, we can therefore identify at least three pathways for how tumor cells in a tumor treated by ECT are killed.
1. Cells killed directly due to the increased uptake of the drug by electropermeabilized cells. This is the primary mechanism of ECT and these cells would die even in the absence of any antivascular effects of EP and ECT. Most cells in a successfully treated tumor treated with cisplatin or bleo-mycin probably belong to this class. But some unknown proportion of tumor cells would almost certainly escape this fate and remain viable either because some tumor regions were not exposed to high enough electric field or because extracellular drug concentration was not sufficient in some areas or due to other intrinsic characteristics of some tumor cells. In time, these remaining cells could thus give raise to tumor relapse.
2. Cells killed thanks to prolonged exposure of tumor cells to extracellular chemotherapeutic. Severely reduced blood flow after EP alone even without any long-term antivascular effects would effectively prevent or at least impede the washout of the drug from tumor tissue thus prolonging the exposure of tumor cells to high extracellular concentration of chemotherapeutic and increasing the chance of killing them. This class of cells is probably not significant in case of poorly permeant chemotherapeutics such as bleomycin and cisplatin, which require successful electropermeabili-zation in order to be effective at very low doses commonly used in ECT. Prolonged exposure of cells after membrane resealing to such low extracellular concentrations of poorly permeant drug molecules would not increase their cytotoxicity significantly. But this pathway of cell kill opens up
© 2010 by Taylor and Francis Group, LLC
418 Advanced Electroporation Techniques in Biology and Medicine
new possibilities for tumor treatment. It is reasonable to expect that this “vascular lock” or “drug entrapment” effect could increase effectiveness in case of some other drugs which cross the cell membrane more readily even after the membranes are resealed but whose effectiveness is limited due to rapid clearance from the extracellular space once the peak concentration is reached.
3. Cells killed due to lack of oxygen and nutrients and buildup of catabolic products. The long-term abrogation of blood flow in tumors due to destruction of tumor vasculature by ECT would wipe out this class of “resistant” cells. The importance of this mechanism of cell kill is clear in the case of presently used ECT but it also opens new possibilities for future vascular-targeted therapies.
Small but typically insignificant delay in growth of tumors treated by EP alone can be attributed to two distinct mechanisms. The first one is irreversible EP of a small proportion of tumor cells which leads to death or at least a temporary arrest in growth of the affected cells. In addition to this, the relatively long-lived decrease of blood flow in tumors due to reversible and irreversible EP of endothelial cells (duration of which is in agreement with the observed tumor growth delay after EP) leads to temporarily reduced supply of nutrients and removal of wastes from the tumor which impedes the growth of viable tumor cells and possibly also induces some minor additional cell death. In addition, the effectiveness of drugs that are activated in hypoxic environment (e.g., bioreductive drugs) is also increased due to this “vascular lock” caused by EP (Cemazar et al. 2001b).
21.5.4 Clinical Significance of Vascular-Disrupting Action of Electrochemotherapy
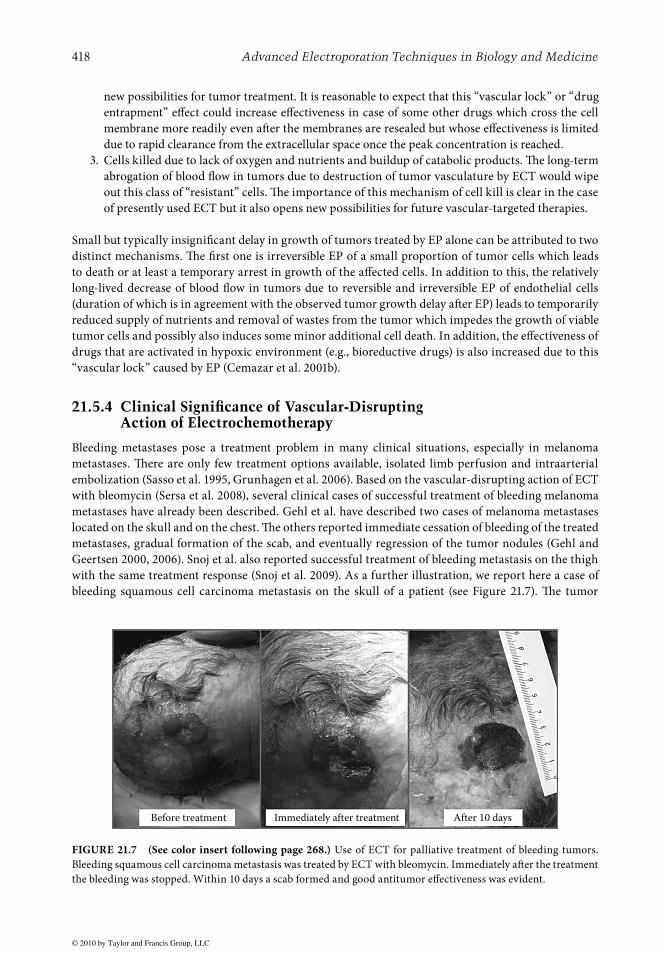
Bleeding metastases pose a treatment problem in many clinical situations, especially in melanoma metastases. There are only few treatment options available, isolated limb perfusion and intraarterial embolization (Sasso et al. 1995, Grunhagen et al. 2006). Based on the vascular-disrupting action of ECT with bleomycin (Sersa et al. 2008), several clinical cases of successful treatment of bleeding melanoma metastases have already been described. Gehl et al. have described two cases of melanoma metastases located on the skull and on the chest. The others reported immediate cessation of bleeding of the treated metastases, gradual formation of the scab, and eventually regression of the tumor nodules (Gehl and Geertsen 2000, 2006). Snoj et al. also reported successful treatment of bleeding metastasis on the thigh with the same treatment response (Snoj et al. 2009). As a further illustration, we report here a case of bleeding squamous cell carcinoma metastasis on the skull of a patient (see Figure 21.7). The tumor
Before treatment Immediately after treatment After 10 days
FIGURE 21.7 (See color insert following page 268.) Use of ECT for palliative treatment of bleeding tumors. Bleeding squamous cell carcinoma metastasis was treated by ECT with bleomycin. Immediately after the treatment the bleeding was stopped. Within 10 days a scab formed and good antitumor effectiveness was evident.
© 2010 by Taylor and Francis Group, LLC
Tumor Blood Flow–Modifying Effects of Electroporation and Electrochemotherapy 419
stopped bleeding immediately (within seconds) after the application of electric pulses in ECT with bleo-mycin given intravenously. Within 10 days a scab gradually formed and good antitumor effect was recorded. All these cases support the proposed models of tumor blood flow–modifying action of EP and vascular-disrupting effect of ECT.
21.6 Conclusions
Tumor vasculature is now recognized as a valid target for anticancer treatments. In this chapter, we sum-marized the known effects of EP and ECT on blood flow in tumors and proposed the underlying mecha-nisms of action. In the case of EP, the duration and extent of blood flow reduction can be manipulated by using different voltages, number of pulses and pulse durations, and by repeating the application. This offers potential new application areas for combined treatment modalities with EP, such as hyperthermia and hypoxia-activated drugs. In addition, clinical applicability of EP for management of bleeding metastases has already been proven. In ECT, the effect of EP on tumor vasculature is combined with chemotherapy, which additionally damages tumor endothelial cells and can cause complete cessation of tumor blood flow. Due to this effect, ECT can also be included in the group of vascular-targeted therapies. As such it offers new opportunities for treatment modalities in combination with drugs targeted at tumor vasculature.
Acknowledgments
The authors would like to thank Dr. Simona Kranjc for her help in the preparation of the manuscript. The authors acknowledge the financial support of several research projects by the Slovenian Research Agency and by the European Commission.
Abbreviations
CE-MRI contrast-enhanced magnetic resonance imagingECT electrochemotherapy. Combined use of a chemotherapeutic and electric pulses to enhance
cytotoxicity of the drugEGT electrogenetherapy. Combined use of genetic material and electric pulses to enhance the
transfection of the cellsEP electroporation or electropermeabilization. Use of electric pulses to increase the permeabil-
ity of cell membrane for the purpose of ECT or EGTEPR electron paramagnetic resonanceIFP interstitial fluid pressureLDF laser Doppler flowmetryMRI magnetic resonance imagingPBV patent blue-violet (biological dye)pO2 partial pressure of oxygenUS ultrasound
References
Belehradek J, Orlowski S, Ramirez LH, Pron G, Poddevin B, Mir LM. 1994. Electropermeabilization of cells in tissues assessed by the qualitative and quantitative electroloading of bleomycin. Biochimica et Biophysica Acta-Biomembranes 1190(1):155–163.
Cemazar M, Milacic R, Miklavcic D, Dolzan V, Sersa G. 1998. Intratumoral cisplatin administration in electrochemotherapy: Antitumor effectiveness, sequence dependence and platinum content. Anti-Cancer Drugs 9(6):525–530.
© 2010 by Taylor and Francis Group, LLC
420 Advanced Electroporation Techniques in Biology and Medicine
Cemazar M, Miklavcic D, Scancar J, Dolzan V, Golouh R, Sersa G. 1999. Increased platinum accumula-tion in SA-1 tumour cells after in vivo electrochemotherapy with cisplatin. British Journal of Cancer 79(9–10):1386–1391.
Cemazar M, Parkins CS, Holder AL, Chaplin DJ, Tozer GM, Sersa G. 2001a. Electroporation of human microvascular endothelial cells: Evidence for an anti-vascular mechanism of electrochemotherapy. British Journal of Cancer 84(4):565–570.
Cemazar M, Parkins CS, Holder AL, Kranjc S, Chaplin DJ, Sersa G. 2001b. Cytotoxicity of bioreductive drug tirapazamine is increased by application of electric pulses in SA-1 tumours in mice. Anticancer Research 21(2A):1151–1156.
Cemazar M, Golzio M, Sersa G, Rols MP, Teissie J. 2006. Electrically-assisted nucleic acids delivery to tis-sues in vivo: Where do we stand? Current Pharmaceutical Design 12(29):3817–3825.
Cemazar M, Tamzali Y, Sersa G, Tozon N, Mir LM, Miklavcic D, Lowe R, Teissie J. 2008. Electrochemotherapy in veterinary oncology. Journal of Veterinary Internal Medicine 22(4):826–831.
Chaplin DJ, Hill SA, Bell KM, Tozer GM. 1998. Modification of tumor blood flow: Current status and future directions. Seminars in Radiation Oncology 8(3):151–163.
Collingridge DR, Young WK, Vojnovic B, Wardman P, Lynch EM, Hill SA, Chaplin DJ. 1997. Measurement of tumor oxygenation: A comparison between polarographic needle electrodes and a time-resolved luminescence-based optical sensor. Radiation Research 147(3):329–334.
Cör A, Cemazar M, Plazar N, Sersa G. 2009. Comparison between hypoxic markers pimonidazole and glu-cose transporter 1 (Glut-1) in murine fibrosarcoma tumours after electrochemotherapy. Radiology and Oncology 43(3):195–202.
Daud AI, DeConti RC, Andrews S, Urbas P, Riker AI, Sondak VK, Munster PN et al. 2008. Phase I trial of interleukin-12 plasmid electroporation in patients with metastatic melanoma. Journal of Clinical Oncology 26(36):5896–5903.
Delorme S, Krix M. 2006. Contrast-enhanced ultrasound for examining tumor biology. Cancer Imaging 6(1):148–152.
Demsar F, Roberts TPL, Schwickert HC, Shames DM, vanDijke CF, Mann JS, Saeed M, Brasch RC. 1997. A MRI spatial mapping technique for microvascular permeability and tissue blood vol-ume based on macromolecular contrast agent distribution. Magnetic Resonance in Medicine 37(2):236–242.
Domenge C, Orlowski S, Luboinski B, DeBaere T, Schwaab G, Belehradek J, Mir LM. 1996. Antitumor electrochemotherapy—New advances in the clinical protocol. Cancer 77(5):956–963.
Folkman J. 2007. Opinion—Angiogenesis: An organizing principle for drug discovery? Nature Reviews Drug Discovery 6(4):273–286.
Gehl J, Geertsen PF. 2000. Efficient palliation of haemorrhaging malignant melanoma skin metastases by electrochemotherapy. Melanoma Research 10(6):585–589.
Gehl J, Geertsen PF. 2006. Palliation of haemorrhaging and ulcerated cutaneous tumours using electro-chemotherapy. EJC Supplements 4(11):35–37.
Gehl J, Skovsgaard T, Mir LM. 2002. Vascular reactions to in vivo electroporation: Characterization and consequences for drug and gene delivery. Biochimica et Biophysica Acta-General Subjects 1569(1–3):51–58.
Grunhagen DJ, de Wilt JHW, Graveland WJ, van Geel AN, Eggermont AMM. 2006. The palliative value of tumor necrosis factor alpha-based isolated limb perfusion in patients with metastatic sarcoma and melanoma. Cancer 106(1):156–162.
Heller LC, Heller R. 2006. In vivo electroporation for gene therapy. Human Gene Therapy 17(9):890–897.
Heller R, Jaroszeski M, Perrott R, Messina J, Gilbert R. 1997. Effective treatment of B16 melanoma by direct delivery of bleomycin using electrochemotherapy. Melanoma Research 7(1):10–18.
Heller R, Gilbert R, Jaroszeski MJ. 1999. Clinical applications of electrochemotherapy. Advanced Drug Delivery Reviews 35(1):119–129.
© 2010 by Taylor and Francis Group, LLC
Tumor Blood Flow–Modifying Effects of Electroporation and Electrochemotherapy 421
Heller L, Pottinger C, Jaroszeski M-L, Gilbert R, Heller R. 2000. In vivo electroporation of plasmids encod-ing GM-CFS or interleukin-2 into existing B16 melanomas combined with electrochemotherapy induces long-term antitumour immunity. Melanoma Research 10(6):577–583.
Ivanusa T, Beravs K, Cemazar M, Jevtic V, Demsar F, Sersa G. 2001. MRI macromolecular contrast agents as indicators of changed tumor blood flow. Radiology and Oncology 35(2):139–147.
Jain RK. 1987. Transport of molecules across tumor vasculature. Cancer and Metastasis Reviews 6(4):559–593.
Jarm T, Sersa G, Miklavcic D. 2002. Oxygenation and blood flow in tumors treated with hydralazine: Evaluation with a novel luminescence-based optic sensor. Technology and Health Care 10:363–380.
Jaroszeski MJ, Dang V, Pottinger C, Hickey J, Gilbert R, Heller R. 2000. Toxicity of anticancer agents medi-ated by electroporation in vitro. Anti-Cancer Drugs 11(3):201–208.
Kanduser M, Miklavcic D, Pavlin M. 2009. Mechanisms involved in gene electrotransfer using high- and low-voltage pulses—An in vitro study. Bioelectrochemistry 74(2):265–271.
Kanthou C, Kranjc S, Sersa G, Tozer G, Zupanic A, Cemazar M. 2006. The endothelial cytoskeleton as a target of electroporation-based therapies. Molecular Cancer Therapeutics 5(12):3145–3152.
Marty M, Sersa G, Garbay JR, Gehl J, Collins CG, Snoj M, Billard V et al. 2006. Electrochemotherapy—An easy, highly effective and safe treatment of cutaneous and subcutaneous metastases: Results of ESOPE (European Standard Operating Procedures of Electrochemotherapy) study. EJC Supplements 4(11):3–13.
Menon C, Fraker DL. 2005. Tumor oxygenation status as a prognostic marker. Cancer Letters 221(2):225–235.
Miklavcic D, Corovic S, Pucihar G, Pavselj N. 2006. Importance of tumour coverage by sufficiently high local electric field for effective electrochemotherapy. EJC Supplements 4(11):45–51.
Mir LM, Orlowski S. 1999. Mechanisms of electrochemotherapy. Advanced Drug Delivery Reviews 35(1):107–118.
Mir LM, Orlowski S, Belehradek J, Paoletti C. 1991. Electrochemotherapy potentiation of antitumor effect of bleomycin by local electric pulses. European Journal of Cancer 27(1):68–72.
Mir LM, Orlowski S, Poddevin B, Belehradek J. 1992. Electrochemotherapy tumor treatment is improved by interleukin-2 stimulation of the host’s defenses. European Cytokine Network 3(3):331–334.
Mir LM, Roth C, Orlowski S, Quintincolonna F, Fradelizi D, Belehradek J, Kourilsky P. 1995. Systemic antitumor effects of electrochemotherapy combined with histoincompatible cells secreting interleu-kin-2. Journal of Immunotherapy 17(1):30–38.
Mir LM, Gehl J, Sersa G, Collins CG, Garbay JR, Billard V, Geertsen PF, Rudolf Z, O’Sullivan GC, Marty M. 2006. Standard operating procedures of the electrochemotherapy: Instructions for the use of bleomycin or cisplatin administered either systemically or locally and electric pulses deliv-ered by the Cliniporator (TM) by means of invasive or non-invasive electrodes. EJC Supplements 4(11):14–25.
Neumann E, Schaeferridder M, Wang Y, Hofschneider PH. 1982. Gene-transfer into mouse lyoma cells by electroporation in high electric-fields. EMBO Journal 1(7):841–845.
O’Hara JA, Blumenthal RD, Grinberg OY, Demidenko E, Grinberg S, Wilmot CM, Taylor AM, Goldenberg DM, Swartz HM. 2001. Response to radioimmunotherapy correlates with tumor pO(2) measured by EPR oximetry in human tumor xenografts. Radiation Research 155(3):466–473.
Orlowski S, Belehradek J, Paoletti C, Mir LM. 1988. Transient electropermeabilization of cells in culture - increase of the cyto-toxicity of anticancer drugs. Biochemical Pharmacology 37(24):4727–4733.
Pavselj N, Bregar Z, Cukjati D, Batiuskaite D, Mir LM, Miklavcic D. 2005. The course of tissue per-meabilization studied on a mathematical model of a subcutaneous tumor in small animals. IEEE Transactions on Biomedical Engineering 52(8):1373–1381.
Prud’homme GJ, Glinka Y, Khan AS, Draghia-Akli R. 2006. Electroporation-enhanced nonviral gene transfer for the prevention or treatment of immunological, endocrine and neoplastic diseases. Current Gene Therapy 6(2):243–273.
© 2010 by Taylor and Francis Group, LLC
422 Advanced Electroporation Techniques in Biology and Medicine
Pusenjak J, Miklavcic D. 1997. Interstitial fluid pressure as an obstacle in treatment of solid tumors. Radiology and Oncology 31:291–297.
Quaglino P, Mortera C, Osella-Abate S, Barberis M, Illengo M, Rissone M, Savoia P, Bernengo MG. 2008. Electrochemotherapy with intravenous bleomycin in the local treatment of skin melanoma metas-tases. Annals of Surgical Oncology 15(8):2215–2222.
Raleigh JA, Chou SC, Bono EL, Thrall DE, Varia MA. 2001. Semiquantitative immunohistochemical analysis for hypoxia in human tumors. International Journal of Radiation Oncology Biology Physics 49:569–574.
Ramirez LH, Orlowski S, An D, Bindoula G, Dzodic R, Ardouin P, Bognel C, Belehradek J, Munck JN, Mir LM. 1998. Electrochemotherapy on liver tumours in rabbits. British Journal of Cancer 77(12):2104–2111.
Sapirstein LA. 1958. Regional blood flow by fractional distribution of indicators. American Journal of Physiology 193:161–168.
Sasso CM, Hubner C, Wall S. 1995. Intraarterial embolization of bleeding melanoma. Journal of Vascular Nursing 13(1):27–28.
Satkauskas S, Bureau MF, Puc M, Mahfoudi A, Scherman D, Miklavcic D, Mir LM. 2002. Mechanisms of in vivo DNA electrotransfer: Respective contributions of cell electropermeabilization and DNA electrophoresis. Molecular Therapy 5(2):133–140.
Satkauskas S, Andre F, Bureau MF, Scherman D, Miklavcic D, Mir LM. 2005. Electrophoretic compo-nent of electric pulses determines the efficacy of in vivo DNA electrotransfer. Human Gene Therapy 16(10):1194–1201.
Schmiedl U, Ogan M, Paajanen H, Marotti M, Crooks LE, Brito AC, Brasch RC. 1987. Albumin labeled with GD-DTPA as an intravascular, blood pool enhancing agent for MR imaging—Biodistribution and imaging studies. Radiology 162(1):205–210.
Sentjurc M, Cemazar M, Sersa G. 2004. EPR oximetry of tumors in vivo in cancer therapy. Spectrochimica Acta Part A 60:1379–1385.
Sersa G. 2006. The state-of-the-art of electrochemotherapy before the ESOPE study; advantages and clini-cal uses. EJC Supplements 4(11):52–59.
Sersa G, Cemazar M, Miklavcic D. 1995. Antitumor effectiveness of electrochemotherapy with cis-diamminedichloroplatinum(II) in mice. Cancer Research 55(15):3450–3455.
Sersa G, Cemazar M, Menart V, GabercPorekar V, Miklavcic D. 1997a. Anti-tumor effectiveness of elec-trochemotherapy with bleomycin is increased by TNF-alpha on SA-1 tumors in mice. Cancer Letters 116(1):85–92.
Sersa G, Miklavcic D, Cemazar M, Belehradek J, Jarm T, Mir LM. 1997b. Electrochemotherapy with CDDP on LPB sarcoma: Comparison of the anti-tumor effectiveness in immunocompetent and immunodeficient mice. Bioelectrochemistry and Bioenergetics 43:279–283.
Sersa G, Beravs K, Cemazar M, Miklavcic D, Demsar F. 1998. Contrast enhanced MRI assessment of tumor blood volume after application of electric pulses. Electro- and Magnetobiology 17:299–306.
Sersa G, Cemazar M, Miklavcic D, Chaplin DJ. 1999a. Tumor blood flow modifying effect of electroche-motherapy with bleomycin. Anticancer Research 19(5B):4017–4022.
Sersa G, Cemazar M, Parkins CS, Chaplin DJ. 1999b. Tumour blood flow changes induced by application of electric pulses. European Journal of Cancer 35(4):672–677.
Sersa G, Krzic M, Sentjurc M, Ivanusa T, Beravs K, Cemazar M, Auersperg M, Swartz HM. 2001. Reduced tumor oxygenation by treatment with vinblastine. Cancer Research 61(10):4266–4271.
Sersa G, Krzic M, Sentjurc M, Ivanusa T, Beravs K, Kotnik V, Coer A, Swartz HM, Cemazar M. 2002. Reduced blood flow and oxygenation in SA-1 tumours after electrochemotherapy with cisplatin. British Journal of Cancer 87(9):1047–1054.
Sersa G, Cemazar M, Miklavcic D. 2003. Tumor blood flow modifying effects of electrochemotherapy: A potential vascular targeted mechanism. Radiology and Oncology 37(1):43–48.
© 2010 by Taylor and Francis Group, LLC
Tumor Blood Flow–Modifying Effects of Electroporation and Electrochemotherapy 423
Sersa G, Cemazar M, Miklavcic D, Rudolf Z. 2006. Electrochemotherapy of tumours. Radiology and Oncology 40(3):163–174.
Sersa G, Jarm T, Kotnik T, Coer A, Podkrajsek M, Sentjurc M, Miklavcic D et al. 2008. Vascular disrupt-ing action of electroporation and electrochemotherapy with bleomycin in murine sarcoma. British Journal of Cancer 98(2):388–398 (doi: 10.1038/sj.bjc.6604168, www.bjcancer.com).
Shepherd AP, Öberg PÅ. 1990. Laser-Doppler Blood Flowmetry. Norwell, MA: Kluwer Academic Publishers.Siemann DW, Horsman MR. 2009. Vascular targeted therapies in oncology. Cell and Tissue Research
335(1):241–248.Snoj M, Cemazar M, Srnovrsnik T, Kosir SP, Sersa G. 2009. Limb sparing treatment of bleeding melanoma
recurrence by electrochemotherapy. Tumori 95(3):398–402.Swartz HM, Clarkson RB. 1998. The measurement of oxygen in vivo using EPR techniques. Physics in
Medicine and Biology 43(7):1957–1975.Testori A, Rutkowski P, Marsden J, Bastholt L, Chiarion-Sileni V, Hauschild A, Eggermont AMM. 2009.
Surgery and radiotherapy in the treatment of cutaneous melanoma. Annals of Oncology 20:22–29.Tozer GM, Kanthou C, Baguley BC. 2005. Disrupting tumour blood vessels. Nature Reviews Cancer
5(6):423–435.Vaupel P, Hockel M. 2000. Blood supply, oxygenation status and metabolic micromilieu of breast can-
cers: Characterization and therapeutic relevance (Review). International Journal of Oncology 17(5):869–879.
Vaupel P, Schlenger K, Knoop C, Hockel M. 1991. Oxygenation of human tumors—Evaluation of tissue oxygen distribution in breast cancers by computerized O2 tension measurements. Cancer Research 51(12):3316–3322.