Embed Size (px)
Citation preview
45th International Conference on Environmental Systems ICES-2015-82 12-16 July 2015, Bellevue, Washington
Advanced Oxygen Recovery via Series-Bosch Technology
Morgan B. Abney1, J. Matthew Mansell2, Bobby Atkins3, Chris Evans4, and Mononita Nur5
NASA George C. Marshall Space Flight Center, Huntsville, AL, 35802
and
Rockford D. Beassie6
The University of Texas at Arlington – Department of Mechanical & Aerospace Engineering, Arlington, TX, 76010
Advanced oxygen recovery life support for Martian transit and surface missions
constitutes a variety of possible architectures. Over the last several years, NASA has pursued
development of a two-step Bosch-based system called Series-Bosch (S-Bosch) to enable
maximum recovery of oxygen from metabolic carbon dioxide. The first step of the process
involves the Reverse Water-Gas Shift (RWGS) reaction. Two RWGS reactors, one developed
at NASA and the other developed at Precision Combustion, Inc. have been assembled for the
S-Bosch. The RWGS reactors were each tested to evaluate and compare general operational
performance and fouling resistance. A down-select was completed to identify the reactor to be
used in an integrated S-Bosch system. The second step in the S-Bosch process is carbon
deposition. A carbon formation reactor (CFR) based on Martian regolith simulant as a
catalyst was designed and tested for performance. Because the regolith will only be available
once the crew arrives on the Martian surface, a second catalyst was evaluated for transit
phases. Finally, integrated testing of an S-Bosch system was completed, leading to a technology
readiness level (TRL) advancement of the S-Bosch system to TRL 4. The results of the RWGS
down-select, CFR testing, and TRL evaluation are reported and discussed.
Nomenclature
BOP = Balance of Plant
CFR = Carbon Formation Reactor
CHXR = condensing heat exchanger
CO2 = Carbon Dioxide
CORTS = CO2 Reduction Test Stand
ECLSS = Environmental Control & Life Support Systems
H2 = diatomic hydrogen
MSFC = Marshall Space Flight Center
MRS = Martian Regolith Simulant
MTR = Membrane Technology Research, Inc.
OGA = Oxygen Generation Assembly
RFMBR = Radial Flow Moving Bed Reactor
RWGSr = Reverse Water-Gas Shift reactor
S-Bosch = Series-Bosch
1 Lead Aerospace Engineer, ECLSS Development Branch, Mail Stop: ES62, MSFC, AL 35812. 2 Lead Test Engineer, ECLSS Development Branch, Bldg 4755, Room 115, MSFC, AL 35812. 3 Mechanical Designer, Mechanical and Thermal Analysis Branch, Bldg 4877, MSFC, AL 35812. 4 Simulation and Analysis, Marshall Space Flight Center, Al 35812. 5 NASA Cooperative Student, ECLSS Development Branch, Bldg 4755, MSFC, AL 35812. 6 NASA Intern, ECLSS Development Branch, Marshall Space Flight Center, University of Texas at Arlington.
https://ntrs.nasa.gov/search.jsp?R=20150016512 2018-06-14T14:30:03+00:00Z
International Conference on Environmental Systems
2
I. Introduction
XYGEN recovery from metabolically-produced carbon dioxide (CO2) is of critical importance for long-duration
manned space missions beyond low Earth orbit. On the International Space Station (ISS), oxygen is provided to
the crew through electrolysis of water in the Oxygen Generation Assembly (OGA). Prior to 2011, this water was
entirely resupplied from Earth. A CO2 Reduction Assembly based on the Sabatier reaction (1) was developed by
Hamilton Sundstrand and delivered to ISS in 2010. The unit recovers oxygen by reducing metabolic CO2 with diatomic
hydrogen (H2) to produce methane and product water. The water is cleaned by the Water Purification Assembly and
recycled to the OGA for continued oxygen production. The methane product is vented overboard.
Sabatier Reaction CO2 + 4H2 ↔ 2H2O + CH4 ΔH°rxn = -165 kJ/mol (1)
Ground testing of a Sabatier Development Unit with a design similar to the Hamilton Sundstrand hardware on
board ISS, suggests that the expected system-level oxygen recovery of a life support architecture similar to that on
ISS, but fully utilizing the Sabatier reactor, is just under 50% of the oxygen required to sustain the crew.3 Thus, when
the Sabatier unit is fully operational, this system results in a reduction in water resupply mass from Earth of over
530kg/year (>1180 lbs/year) for a crew size of four. While this savings is considerable, for missions beyond ISS such
as Lunar or Martian surface missions, oxygen recovery of >90% has been identified as an enabling capability.1 To
achieve this goal, several post-processing technologies have been explored to generate H2 from the Sabatier methane
product stream and recycle it back to the Sabatier to enhance CO2 conversion. These efforts have been reported
previously.2-6
As an alternative to a Sabatier-based oxygen recovery architecture, the Bosch process has been proposed for future
missions. This process provides 100% theoretical recovery of oxygen from metabolic CO2 with the limited H2
generated by the OGA. The Bosch process (5) has been discussed in detail previously7-11 and involves a two-step
mechanism to convert CO2 and hydrogen to water and solid carbon. In the first step, CO2 reacts with hydrogen in the
Reverse Water-Gas Shift reaction (2) to form carbon monoxide (CO) and water. In the second step, the carbon
monoxide is further reduced to solid, elemental carbon by either hydrogen (3), or by self-disproportionation in the
Boudouard reaction (4).
RWGS CO2 + H2 H2O + CO ΔH°rxn = 41 kJ/mol (2)
CO Hydrogenation CO + H2 H2O + C(s) ΔH°rxn = -131 kJ/mol (3)
Boudouard 2CO CO2 + C(s) ΔH°rxn = -172 kJ/mol (4)
Bosch Process CO2 + 2H2 2H2O + C(s) ΔH°rxn = -90 kJ/mol (5)
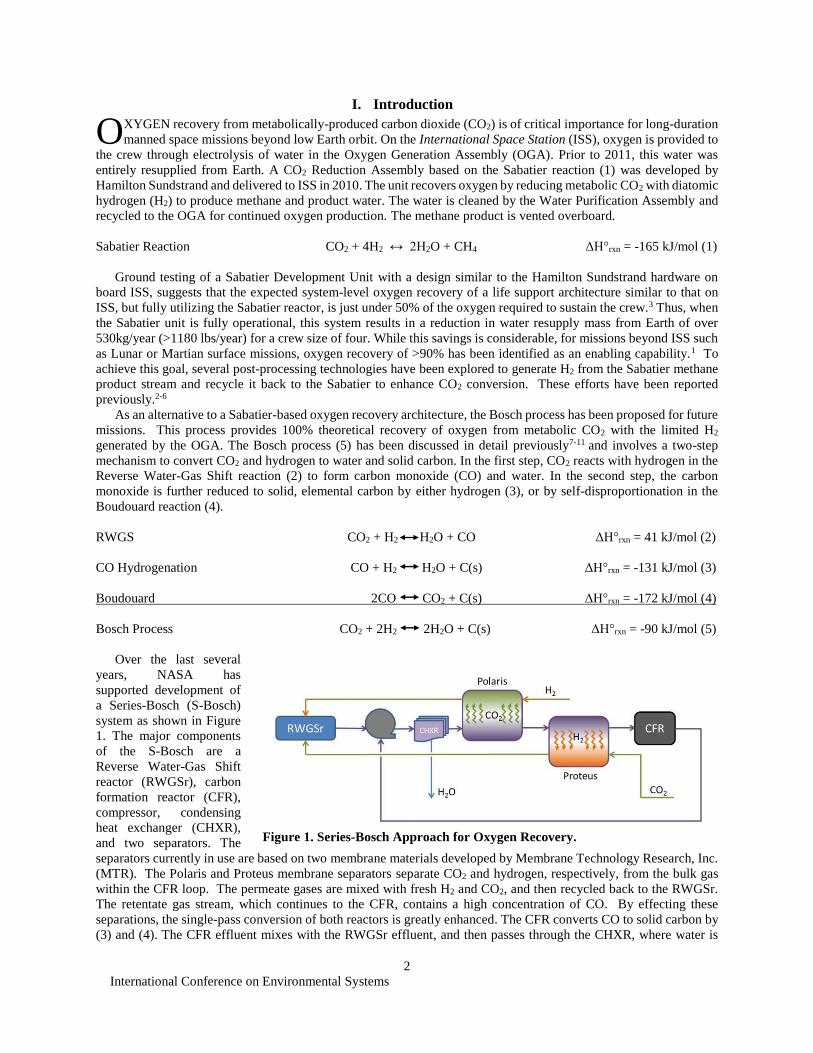
Over the last several
years, NASA has
supported development of
a Series-Bosch (S-Bosch)
system as shown in Figure
1. The major components
of the S-Bosch are a
Reverse Water-Gas Shift
reactor (RWGSr), carbon
formation reactor (CFR),
compressor, condensing
heat exchanger (CHXR),
and two separators. The
separators currently in use are based on two membrane materials developed by Membrane Technology Research, Inc.
(MTR). The Polaris and Proteus membrane separators separate CO2 and hydrogen, respectively, from the bulk gas
within the CFR loop. The permeate gases are mixed with fresh H2 and CO2, and then recycled back to the RWGSr.
The retentate gas stream, which continues to the CFR, contains a high concentration of CO. By effecting these
separations, the single-pass conversion of both reactors is greatly enhanced. The CFR converts CO to solid carbon by
(3) and (4). The CFR effluent mixes with the RWGSr effluent, and then passes through the CHXR, where water is
O
Figure 1. Series-Bosch Approach for Oxygen Recovery.
International Conference on Environmental Systems
3
condensed out of the stream, before returning to the membrane separators. Because the permeation rates through the
membranes increase with the partial pressure differentials across the membrane (retentate pressure minus permeate
pressure), and the selectivities of the membranes are expected to be relatively high, the system is operated with the
permeate side at a lower total pressure than the retentate side of the system.
In 2014, progress of S-Bosch development was reported.6 At that time, the system contained only the RWGSr, the
Polaris membrane separator, and the Proteus membrane separator, along with the balance of plant (BOP) components
required to control and monitor the partially completed system. Testing to gather data on thermal behavior of the
RWGSr had been conducted and was reported, but no other testing had been completed. Since that time, continued
development at the NASA Marshall Space Flight Center (MSFC) has involved performance mapping of the RWGSr,
performance mapping of both membrane separators, design and assembly of a “batch” CFR, and initial testing of this
CFR with both a proposed Martian surface mission catalyst and a Martian transit mission catalyst. This paper includes
discussion of the results of recent testing, updates on the status of the project, an operational evaluation of the S-Bosch
approach, and a discussion of the advantages of the S-Bosch architecture.
II. Materials and Methods
Four tests were conducted to evaluate the performance of the RWGSr, Proteus Membrane, Polaris Membrane, and
CFR sub-systems of the S-Bosch in stand-alone configurations. The materials and methods for each test are provided
below.
A. CO2 Reduction Test Stand (CORTS)
The performance evaluations of these four sub-systems were conducted on the CO2 Reduction Test Stand
(CORTS) at the MSFC Environmental Control and Life Support Systems (ECLSS) development facility. The CORTS
provides the capability to test integrated systems or evaluate the performance of each sub-system individually by
controlling system parameters (e.g. flow rates, temperatures, pressures, etc) and providing data acquisition from all
system controls and sensors. The CORTS includes an Agilent 3000 micro-gas chromatograph for dry gas analysis and
a General Eastern Optica Series DewPoint Analyzer to determine the water vapor content of gas streams. The CORTS
test stand is controlled using internally developed Labview software. Data is collected and stored using an internal
MSFC software called PACRATS.
Ultra-high purity gas was used for all testing on the CORTS. Hydrogen, nitrogen, carbon dioxide, argon, and
helium were supplied by Sexton Gas and Airgas. Carbon monoxide was purchased from Matheson Tri-Gas.
B. RWGSr Performance Testing Methods
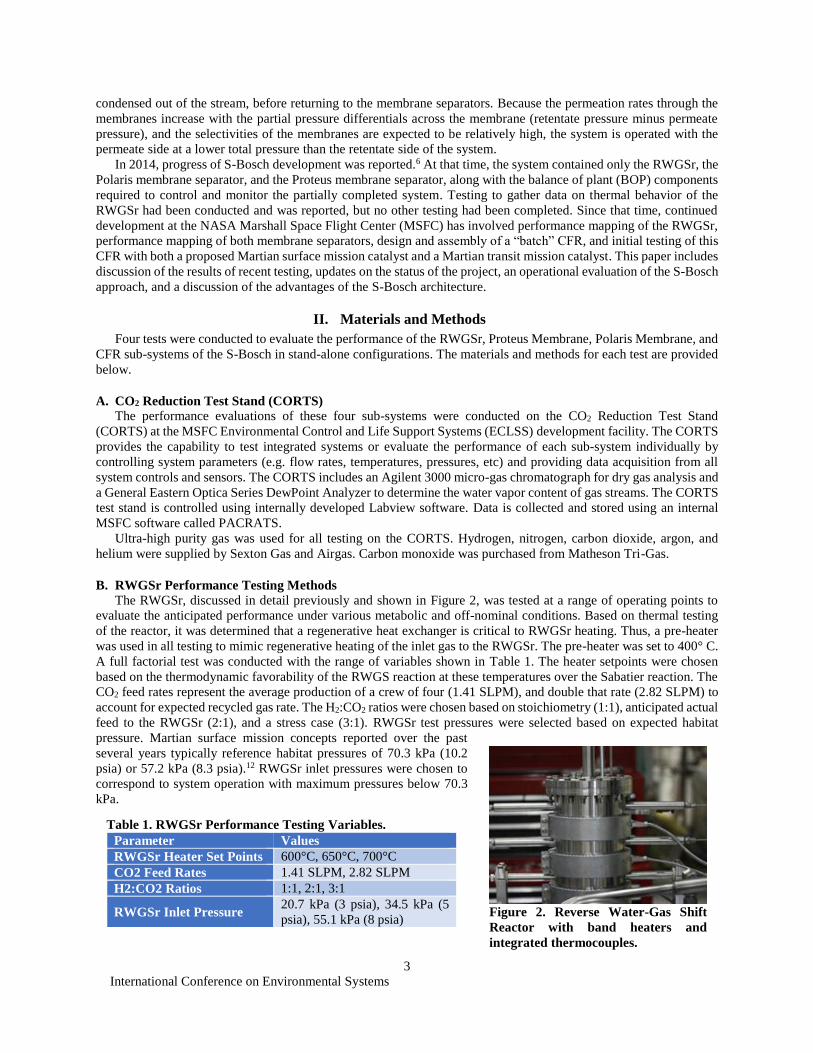
The RWGSr, discussed in detail previously and shown in Figure 2, was tested at a range of operating points to
evaluate the anticipated performance under various metabolic and off-nominal conditions. Based on thermal testing
of the reactor, it was determined that a regenerative heat exchanger is critical to RWGSr heating. Thus, a pre-heater
was used in all testing to mimic regenerative heating of the inlet gas to the RWGSr. The pre-heater was set to 400° C.
A full factorial test was conducted with the range of variables shown in Table 1. The heater setpoints were chosen
based on the thermodynamic favorability of the RWGS reaction at these temperatures over the Sabatier reaction. The
CO2 feed rates represent the average production of a crew of four (1.41 SLPM), and double that rate (2.82 SLPM) to
account for expected recycled gas rate. The H2:CO2 ratios were chosen based on stoichiometry (1:1), anticipated actual
feed to the RWGSr (2:1), and a stress case (3:1). RWGSr test pressures were selected based on expected habitat
pressure. Martian surface mission concepts reported over the past
several years typically reference habitat pressures of 70.3 kPa (10.2
psia) or 57.2 kPa (8.3 psia).12 RWGSr inlet pressures were chosen to
correspond to system operation with maximum pressures below 70.3
kPa.
Figure 2. Reverse Water-Gas Shift
Reactor with band heaters and
integrated thermocouples.
Table 1. RWGSr Performance Testing Variables.
Parameter Values
RWGSr Heater Set Points 600°C, 650°C, 700°C
CO2 Feed Rates 1.41 SLPM, 2.82 SLPM
H2:CO2 Ratios 1:1, 2:1, 3:1
RWGSr Inlet Pressure 20.7 kPa (3 psia), 34.5 kPa (5
psia), 55.1 kPa (8 psia)
International Conference on Environmental Systems
4
C. Membrane Performance Testing Methods
The two separation membranes were individually evaluated for performance. The membranes are constructed with
two sides: the process (retentate) side and the sweep (permeate) side. The composition, pressure, and flow rate of gas
on either side of the membrane is controlled. Gas flow through the sweep side of the membrane facilitates removal of
permeate compounds, thereby maximizing the concentration gradients across the membrane and enhancing
permeation. For any given compound, the permeation rate through a membrane increases with increased pressure ratio
(process pressure/sweep pressure). Selectivity of the membranes is highest at the optimum membrane temperature.
Because we plan to operate the S-Bosch below the surrounding air pressure of the habitat, the maximum pressure
of either side of each membrane must not exceed the cabin pressure. Thus, the process (high pressure) side of the
membranes was varied. A constant nominal differential pressure of 34.5 kPa (5psid) was targeted for testing of both
membranes. Carbon dioxide was used as the sweep gas for the Proteus (to separate H2), and H2 was used as the sweep
gas for the
Polaris (to
separate CO2).
The optimum
operating
temperature for
the Polaris
membrane, per
MTR
specifications, is
less than 20°C.
We did not
attempt to cool
the membrane, but designed the test to maintain the Polaris membrane near room temperature. The Proteus membrane
was specified to operate most efficiently at 125-135°C. For the Proteus, the initial test matrix included ambient
temperature (to mimic operation in case of a heater power failure) and 130°C operation. However, a problem with the
heater controller resulted in test data collection at 111°C. The test was repeated at 130°C after repairing the heater
controller. Thus, the Proteus was operated at 130°C, 111°C, and ambient temperature (~20°C). Finally, all gas fed to
the process sides of the membranes was generated by passing mixtures of CO2, H2, and N2 first through the RWGSr
and then to the membranes. The composition of the gas fed to the process side of the membrane was varied by varying
the feed to the RWGSr. All
membrane testing variables are
provided in Table 2. Data
reduction was completed using
Microsoft Office Excel and
Minitab 16.
D. CFR Reactor and
Performance Testing
Methods
The considerations for a
CFR based on Martian regolith
simulant (MRS) catalyst were
discussed previously.7 With
these considerations, a design
for a 1st generation CFR
(hereafter referred to simply as
“the CFR”) was completed and
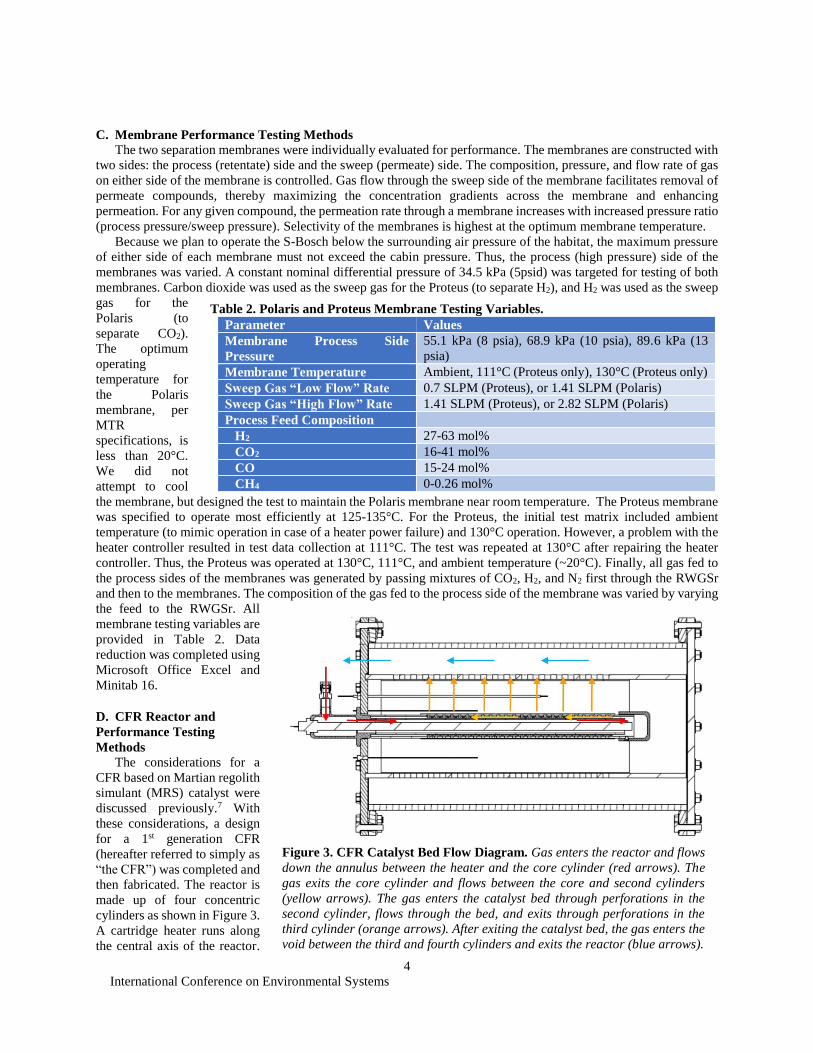
then fabricated. The reactor is
made up of four concentric
cylinders as shown in Figure 3.
A cartridge heater runs along
the central axis of the reactor.
Figure 3. CFR Catalyst Bed Flow Diagram. Gas enters the reactor and flows
down the annulus between the heater and the core cylinder (red arrows). The
gas exits the core cylinder and flows between the core and second cylinders
(yellow arrows). The gas enters the catalyst bed through perforations in the
second cylinder, flows through the bed, and exits through perforations in the
third cylinder (orange arrows). After exiting the catalyst bed, the gas enters the
void between the third and fourth cylinders and exits the reactor (blue arrows).
Table 2. Polaris and Proteus Membrane Testing Variables.
Parameter Values
Membrane Process Side
Pressure
55.1 kPa (8 psia), 68.9 kPa (10 psia), 89.6 kPa (13
psia)
Membrane Temperature Ambient, 111°C (Proteus only), 130°C (Proteus only)
Sweep Gas “Low Flow” Rate 0.7 SLPM (Proteus), or 1.41 SLPM (Polaris)
Sweep Gas “High Flow” Rate 1.41 SLPM (Proteus), or 2.82 SLPM (Polaris)
Process Feed Composition
H2 27-63 mol%
CO2 16-41 mol%
CO 15-24 mol%
CH4 0-0.26 mol%
International Conference on Environmental Systems
5
Feed gas enters at a header at the top of the reactor. The gas flows along the length of the heater through a narrow
annulus between the heater and the first concentric cylinder. The majority of the heat transfer to the gas takes place in
this section of the reactor. The hot gas exits the annulus into a void between the first and second cylinders. The second
cylinder is perforated along most of its length and is covered in copper mesh to contain the MRS catalyst. Gas passes
radially outward through the perforations in the second cylinder and into the catalyst bed, which is formed by the
space between the second and third concentric cylinders. The third cylinder, also perforated and covered in copper
mesh, is located on the outside of the catalyst bed. Gas continues to flow radially through the bed, and ultimately exits
through the perforations in the third cylinder. The fourth cylinder is the outer housing of the reactor. Gas flows through
the catalyst bed, out of the third cylinder into the void between the third and fourth cylinders. The reactor outlet is
located at the top of the reactor, positioned radially between the outer surface of the third cylinder and the inner surface
of the reactor wall (the fourth cylinder). This design provides a high temperature at the inlet to the catalyst bed (i.e.,
the outer surface of the second cylinder). This high temperature is kinetically favorable for conversion of CO. A
negative radial temperature gradient through the reactor provides the thermodynamically favorable conditions (i.e.
lower temperatures at the catalyst bed outlet) to maximize net conversion to solid carbon.
Three reactor designs were completed: a batch reactor design (the first generation design described above), a semi-
batch reactor design, and a continuous reactor design. The batch reactor provides a comparatively low-cost option to
test the radial-flow concept and the MRS catalyst performance. This design does not allow addition or removal of
catalyst during operation. The semi-batch reactor design enables the removal (but not addition) of solid material from
the catalyst bed without shutting down the
reactor heaters or cooling the bed. Finally,
the continuous reactor design enables both
the removal of solid material from the bed
and the addition of fresh catalyst to the bed
during operation.
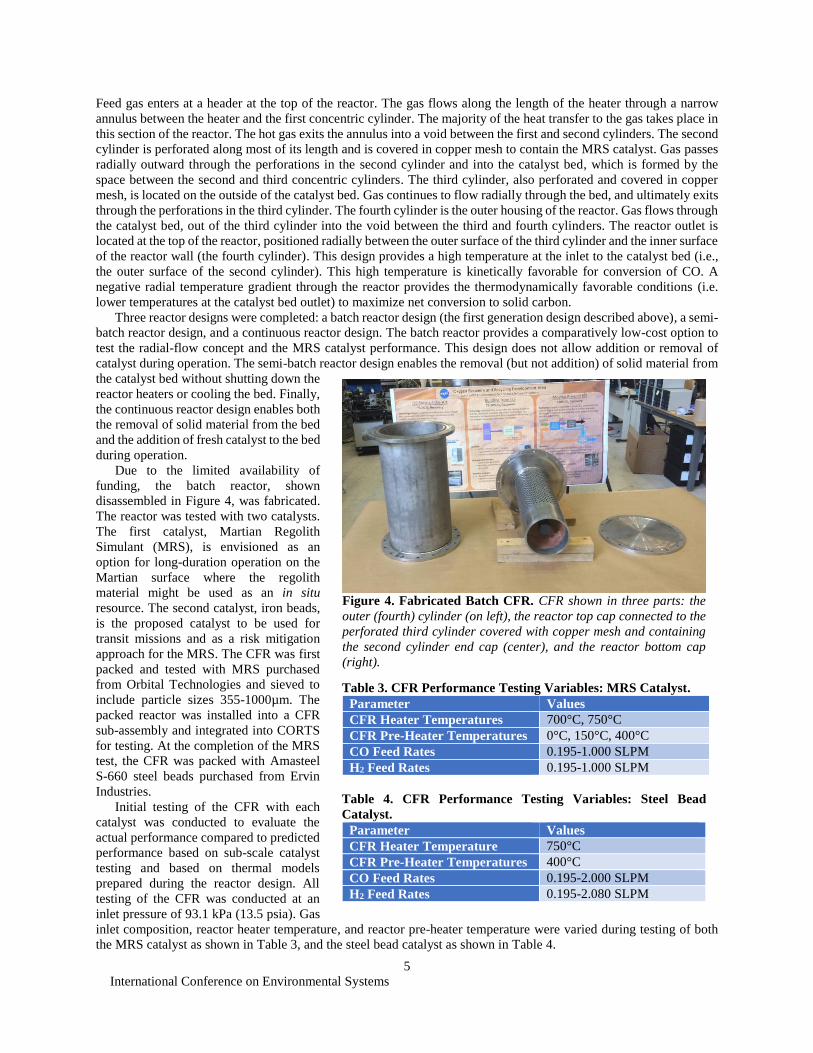
Due to the limited availability of
funding, the batch reactor, shown
disassembled in Figure 4, was fabricated.
The reactor was tested with two catalysts.
The first catalyst, Martian Regolith
Simulant (MRS), is envisioned as an
option for long-duration operation on the
Martian surface where the regolith
material might be used as an in situ
resource. The second catalyst, iron beads,
is the proposed catalyst to be used for
transit missions and as a risk mitigation
approach for the MRS. The CFR was first
packed and tested with MRS purchased
from Orbital Technologies and sieved to
include particle sizes 355-1000µm. The
packed reactor was installed into a CFR
sub-assembly and integrated into CORTS
for testing. At the completion of the MRS
test, the CFR was packed with Amasteel
S-660 steel beads purchased from Ervin
Industries.
Initial testing of the CFR with each
catalyst was conducted to evaluate the
actual performance compared to predicted
performance based on sub-scale catalyst
testing and based on thermal models
prepared during the reactor design. All
testing of the CFR was conducted at an
inlet pressure of 93.1 kPa (13.5 psia). Gas
inlet composition, reactor heater temperature, and reactor pre-heater temperature were varied during testing of both
the MRS catalyst as shown in Table 3, and the steel bead catalyst as shown in Table 4.
Figure 4. Fabricated Batch CFR. CFR shown in three parts: the
outer (fourth) cylinder (on left), the reactor top cap connected to the
perforated third cylinder covered with copper mesh and containing
the second cylinder end cap (center), and the reactor bottom cap
(right).
Table 3. CFR Performance Testing Variables: MRS Catalyst.
Parameter Values
CFR Heater Temperatures 700°C, 750°C
CFR Pre-Heater Temperatures 0°C, 150°C, 400°C
CO Feed Rates 0.195-1.000 SLPM
H2 Feed Rates 0.195-1.000 SLPM
Table 4. CFR Performance Testing Variables: Steel Bead
Catalyst.
Parameter Values
CFR Heater Temperature 750°C
CFR Pre-Heater Temperatures 400°C
CO Feed Rates 0.195-2.000 SLPM
H2 Feed Rates 0.195-2.080 SLPM
International Conference on Environmental Systems
6
III. Results and Discussion
Four tests were undertaken to evaluate S-Bosch sub-assemblies including RWGSr Performance Testing, Proteus
Separation Membrane Performance Testing, Polaris Separation Membrane Performance Testing, and CFR
Performance Testing using MRS and iron beads as catalyst. The results of these tests and a discussion of their relevance
are provided below. Additionally, a discussion of the S-Bosch system architecture is provided.
A. RWGSr Performance Testing Results and Discussion
A full factorial test was conducted to map the performance of the RWGSr by varying reactor temperature, pressure,
CO2 feed rate, and H2:CO2 feed
ratio. Test requirements
specified CO2 feed rates of
either 1.41 SLPM or 2.82 SLPM
and a constant N2 feed rate of
0.25 SLPM for mass balance
calculations. After the tests were
completed, it was determined
that an error in the software had
resulted in incorrect gas
metering of the CO2 and N2
gases. Additionally, it was
determined that the software controls assumed the mass flow controllers had been calibrated with a standard
temperature of 0°C when the controllers had actually been calibrated at 25°C. The data from the test was adjusted
accordingly and the actual gas flow rates to the RWGS reactor are shown in Table 5.
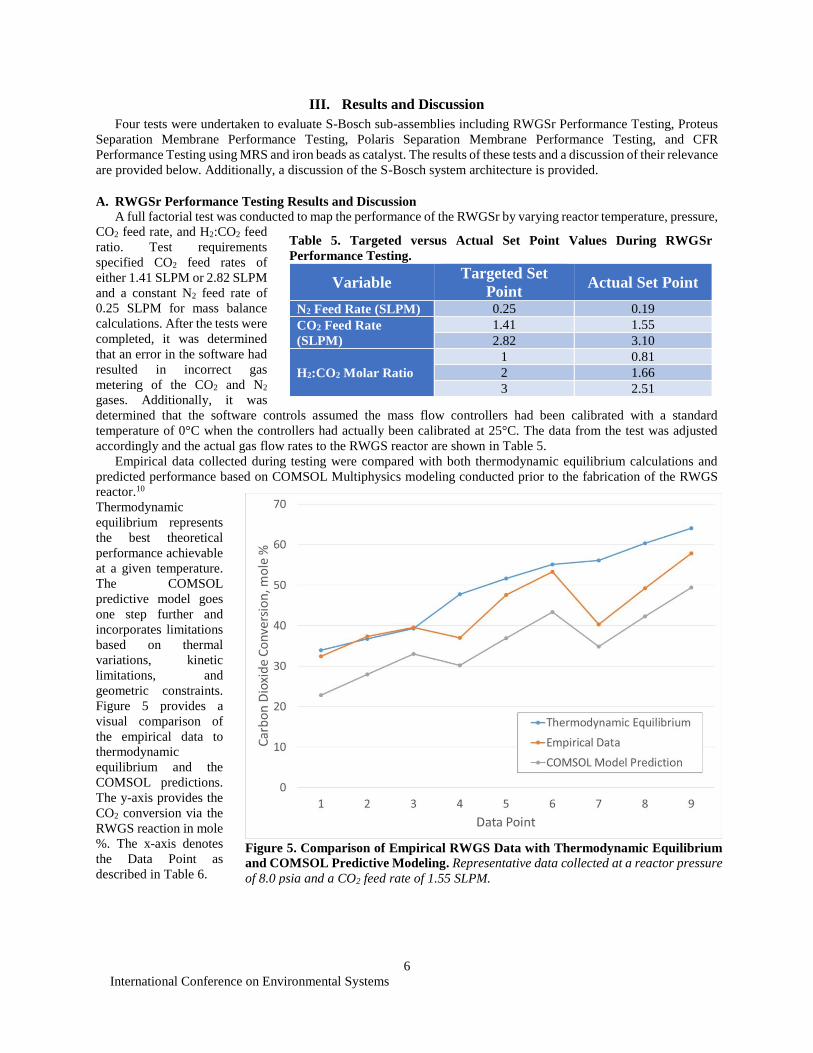
Empirical data collected during testing were compared with both thermodynamic equilibrium calculations and
predicted performance based on COMSOL Multiphysics modeling conducted prior to the fabrication of the RWGS
reactor.10
Thermodynamic
equilibrium represents
the best theoretical
performance achievable
at a given temperature.
The COMSOL
predictive model goes
one step further and
incorporates limitations
based on thermal
variations, kinetic
limitations, and
geometric constraints.
Figure 5 provides a
visual comparison of
the empirical data to
thermodynamic
equilibrium and the
COMSOL predictions.
The y-axis provides the
CO2 conversion via the
RWGS reaction in mole
%. The x-axis denotes
the Data Point as
described in Table 6.
Figure 5. Comparison of Empirical RWGS Data with Thermodynamic Equilibrium
and COMSOL Predictive Modeling. Representative data collected at a reactor pressure
of 8.0 psia and a CO2 feed rate of 1.55 SLPM.
Table 5. Targeted versus Actual Set Point Values During RWGSr
Performance Testing.
Variable Targeted Set
Point Actual Set Point
N2 Feed Rate (SLPM) 0.25 0.19
CO2 Feed Rate
(SLPM)
1.41 1.55
2.82 3.10
H2:CO2 Molar Ratio
1 0.81
2 1.66
3 2.51
International Conference on Environmental Systems
7
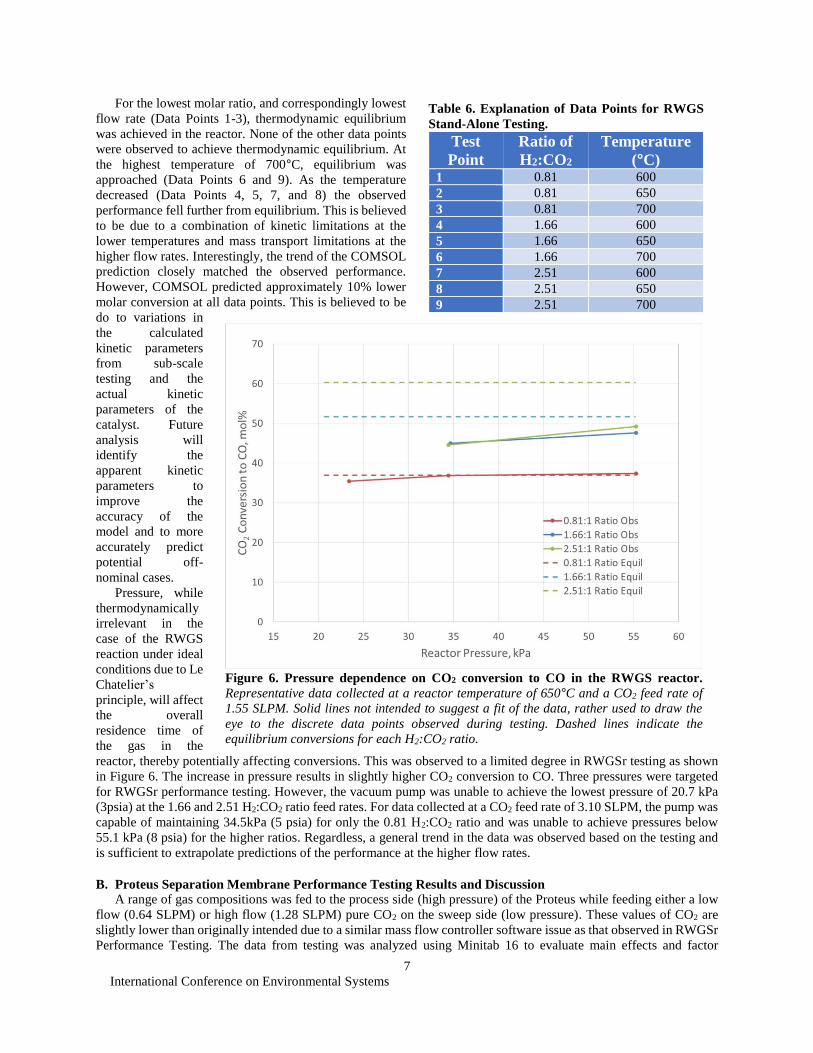
For the lowest molar ratio, and correspondingly lowest
flow rate (Data Points 1-3), thermodynamic equilibrium
was achieved in the reactor. None of the other data points
were observed to achieve thermodynamic equilibrium. At
the highest temperature of 700°C, equilibrium was
approached (Data Points 6 and 9). As the temperature
decreased (Data Points 4, 5, 7, and 8) the observed
performance fell further from equilibrium. This is believed
to be due to a combination of kinetic limitations at the
lower temperatures and mass transport limitations at the
higher flow rates. Interestingly, the trend of the COMSOL
prediction closely matched the observed performance.
However, COMSOL predicted approximately 10% lower
molar conversion at all data points. This is believed to be
do to variations in
the calculated
kinetic parameters
from sub-scale
testing and the
actual kinetic
parameters of the
catalyst. Future
analysis will
identify the
apparent kinetic
parameters to
improve the
accuracy of the
model and to more
accurately predict
potential off-
nominal cases.
Pressure, while
thermodynamically
irrelevant in the
case of the RWGS
reaction under ideal
conditions due to Le
Chatelier’s
principle, will affect
the overall
residence time of
the gas in the
reactor, thereby potentially affecting conversions. This was observed to a limited degree in RWGSr testing as shown
in Figure 6. The increase in pressure results in slightly higher CO2 conversion to CO. Three pressures were targeted
for RWGSr performance testing. However, the vacuum pump was unable to achieve the lowest pressure of 20.7 kPa
(3psia) at the 1.66 and 2.51 H2:CO2 ratio feed rates. For data collected at a CO2 feed rate of 3.10 SLPM, the pump was
capable of maintaining 34.5kPa (5 psia) for only the 0.81 H2:CO2 ratio and was unable to achieve pressures below
55.1 kPa (8 psia) for the higher ratios. Regardless, a general trend in the data was observed based on the testing and
is sufficient to extrapolate predictions of the performance at the higher flow rates.
B. Proteus Separation Membrane Performance Testing Results and Discussion
A range of gas compositions was fed to the process side (high pressure) of the Proteus while feeding either a low
flow (0.64 SLPM) or high flow (1.28 SLPM) pure CO2 on the sweep side (low pressure). These values of CO2 are
slightly lower than originally intended due to a similar mass flow controller software issue as that observed in RWGSr
Performance Testing. The data from testing was analyzed using Minitab 16 to evaluate main effects and factor
Figure 6. Pressure dependence on CO2 conversion to CO in the RWGS reactor.
Representative data collected at a reactor temperature of 650°C and a CO2 feed rate of
1.55 SLPM. Solid lines not intended to suggest a fit of the data, rather used to draw the
eye to the discrete data points observed during testing. Dashed lines indicate the
equilibrium conversions for each H2:CO2 ratio.
Table 6. Explanation of Data Points for RWGS
Stand-Alone Testing.
Test
Point
Ratio of
H2:CO2
Temperature
(°C) 1 0.81 600
2 0.81 650
3 0.81 700
4 1.66 600
5 1.66 650
6 1.66 700
7 2.51 600
8 2.51 650
9 2.51 700
International Conference on Environmental Systems
8
interactions. Factors considered included the pressure ratio (process pressure/sweep pressure) across the membrane,
the process stream inlet absolute pressure, the membrane temperature, the sweep flow rate, the H2 feed rate in the
process stream, and the total feed rate of the process stream. Responses included total hydrogen permeation, relative
hydrogen permeation, and total percent mass permeation. The total % hydrogen permeation was calculated by
analyzing the total hydrogen in the sweep stream at the outlet of the membrane and comparing to the total hydrogen
fed to the process side. Relative hydrogen permeation was calculated by Eq 6.
min)/(
100*min)/((%) 2
2grmeatedTotalGasPe
gPermeatedTotalHPermeationrelativeH (6)
Total percent mass permeation is defined by the fraction of the total mass in the process side feed stream that exits the
separator in the sweep stream. This value was calculated by Eq 7.
min)/(
100*min))/(min)/((%
getMassprocessInl
gletMassprocessOutgetMassprocessInltionMassPermeaTotal
(7)
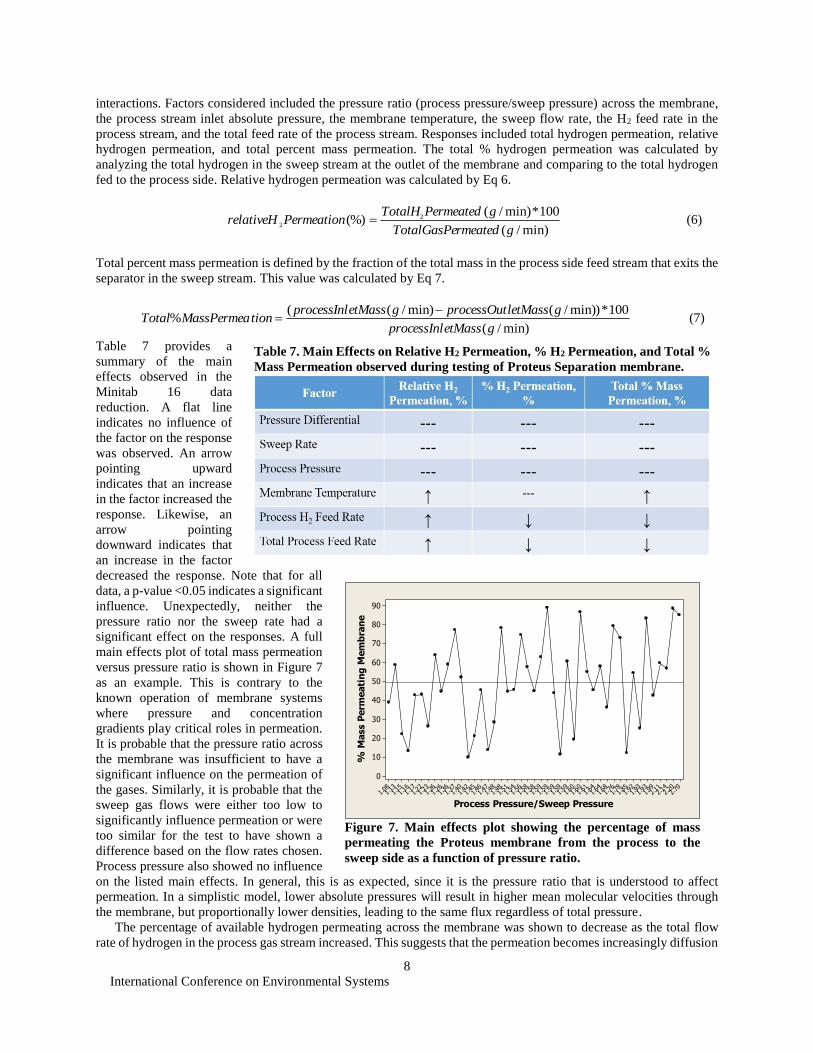
Table 7 provides a
summary of the main
effects observed in the
Minitab 16 data
reduction. A flat line
indicates no influence of
the factor on the response
was observed. An arrow
pointing upward
indicates that an increase
in the factor increased the
response. Likewise, an
arrow pointing
downward indicates that
an increase in the factor
decreased the response. Note that for all
data, a p-value <0.05 indicates a significant
influence. Unexpectedly, neither the
pressure ratio nor the sweep rate had a
significant effect on the responses. A full
main effects plot of total mass permeation
versus pressure ratio is shown in Figure 7
as an example. This is contrary to the
known operation of membrane systems
where pressure and concentration
gradients play critical roles in permeation.
It is probable that the pressure ratio across
the membrane was insufficient to have a
significant influence on the permeation of
the gases. Similarly, it is probable that the
sweep gas flows were either too low to
significantly influence permeation or were
too similar for the test to have shown a
difference based on the flow rates chosen.
Process pressure also showed no influence
on the listed main effects. In general, this is as expected, since it is the pressure ratio that is understood to affect
permeation. In a simplistic model, lower absolute pressures will result in higher mean molecular velocities through
the membrane, but proportionally lower densities, leading to the same flux regardless of total pressure.
The percentage of available hydrogen permeating across the membrane was shown to decrease as the total flow
rate of hydrogen in the process gas stream increased. This suggests that the permeation becomes increasingly diffusion
Table 7. Main Effects on Relative H2 Permeation, % H2 Permeation, and Total %
Mass Permeation observed during testing of Proteus Separation membrane.
2.70
2.20
2.14
2.11
1.99
1.93
1.93
1.92
1.85
1.78
1.76
1.68
1.64
1.64
1.61
1.60
1.60
1.59
1.59
1.59
1.59
1.59
1.58
1.58
1.56
1.54
1.51
1.48
1.48
1.47
1.46
1.45
1.42
1.40
1.37
1.36
1.26
1.26
1.23
1.22
1.17
1.16
1.15
1.13
1.08
90
80
70
60
50
40
30
20
10
0
Process Pressure/Sweep Pressure
% M
ass P
erm
eati
ng
Mem
bra
ne
Figure 7. Main effects plot showing the percentage of mass
permeating the Proteus membrane from the process to the
sweep side as a function of pressure ratio.
International Conference on Environmental Systems
9
limited as the total mass flow increases and that additional hydrogen could be separated at the higher flow rates if the
membrane had a higher surface area.
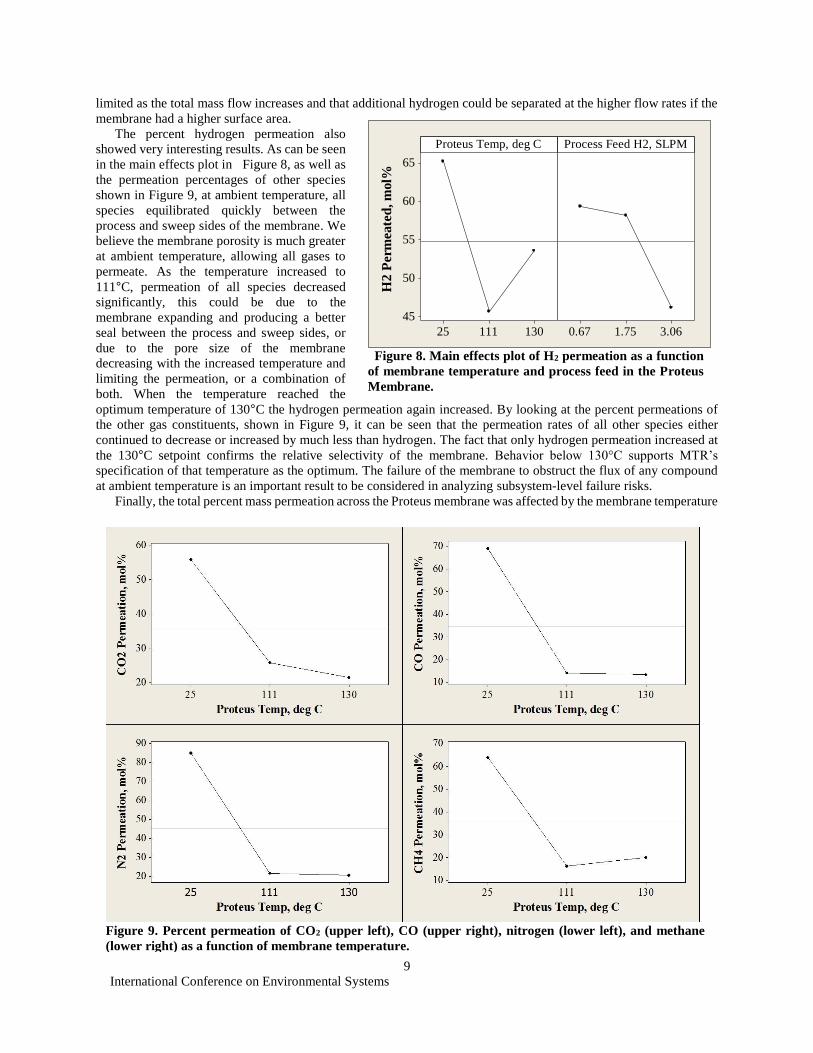
The percent hydrogen permeation also
showed very interesting results. As can be seen
in the main effects plot in Figure 8, as well as
the permeation percentages of other species
shown in Figure 9, at ambient temperature, all
species equilibrated quickly between the
process and sweep sides of the membrane. We
believe the membrane porosity is much greater
at ambient temperature, allowing all gases to
permeate. As the temperature increased to
111°C, permeation of all species decreased
significantly, this could be due to the
membrane expanding and producing a better
seal between the process and sweep sides, or
due to the pore size of the membrane
decreasing with the increased temperature and
limiting the permeation, or a combination of
both. When the temperature reached the
optimum temperature of 130°C the hydrogen permeation again increased. By looking at the percent permeations of
the other gas constituents, shown in Figure 9, it can be seen that the permeation rates of all other species either
continued to decrease or increased by much less than hydrogen. The fact that only hydrogen permeation increased at
the 130°C setpoint confirms the relative selectivity of the membrane. Behavior below 130°C supports MTR’s
specification of that temperature as the optimum. The failure of the membrane to obstruct the flux of any compound
at ambient temperature is an important result to be considered in analyzing subsystem-level failure risks.
Finally, the total percent mass permeation across the Proteus membrane was affected by the membrane temperature
Figure 9. Percent permeation of CO2 (upper left), CO (upper right), nitrogen (lower left), and methane
(lower right) as a function of membrane temperature.
13011125
65
60
55
50
45
3.061.750.67
Proteus Temp, deg C
H2
Per
mea
ted
, m
ol%
Process Feed H2, SLPM
Figure 8. Main effects plot of H2 permeation as a function
of membrane temperature and process feed in the Proteus
Membrane.
International Conference on Environmental Systems
10
and the total hydrogen/process feed rate. When the membrane temperature increased, total mass permeation increased.
Because non-hydrogen components were observed to decrease with increasing temperature, it follows that this
increase is due entirely to increased H2 permeation. As total hydrogen/process feed rate increased, the total mass
permeating the membrane decreased. Again, this can be explained by the reduction in CO, methane, CO2, and nitrogen
permeation.
C. Polaris Separation Membrane Performance Testing Results and Discussion
Similar to the Proteus membrane, the Polaris membrane is designed to selectively permeate gas at a high pressure
differential (>345 kPa, >50 psid). However, while the Proteus is selective for hydrogen, the Polaris is selective for
CO2 and at ambient or colder temperatures. Like the Proteus, the Polaris cannot be operated at high pressure
differentials in a life support system so a lower pressure differential (~34.5kPa, ~5psid) was targeted. This was
combined with a sweep stream containing pure hydrogen to pull CO2 across the membrane. A range of gas
compositions was fed to the process side of the Polaris (identical to those fed to the Proteus) while feeding either a
low flow (1.30 SLPM) or high flow (2.60 SLPM) pure hydrogen on the sweep side. These values of hydrogen are
slightly lower than originally intended due to a similar mass flow controller software issue as that observed in RWGSr
Performance Testing and the Proteus Separation membrane performance testing. The data from testing was analyzed
with Minitab 16 to evaluate Main Effects. Factors considered included the pressure ratio across the membrane, the
process pressure, the membrane temperature, the H2 sweep flow rate, the CO2 feed rate in the process stream, and the
total feed rate of the process stream. Responses included total CO2 permeation, Relative CO2 Permeation, and total
percent mass permeation. The total % CO2 permeation was calculated by analyzing the total CO2 in the sweep stream
at the outlet of the membrane and comparing to the total CO2 fed to the process side. Relative CO2 Permeation was
calculated by Eq 8.
min)/(
100*min)/((%) 2
2grmeatedTotalGasPe
gPermeatedTotalCOPermeationrelativeCO (8)
Total percent mass permeation is defined by the total mass initially in the process side of the membrane that permeates
the membrane to the sweep side of the membrane. This value was calculated by Eq 7 above.
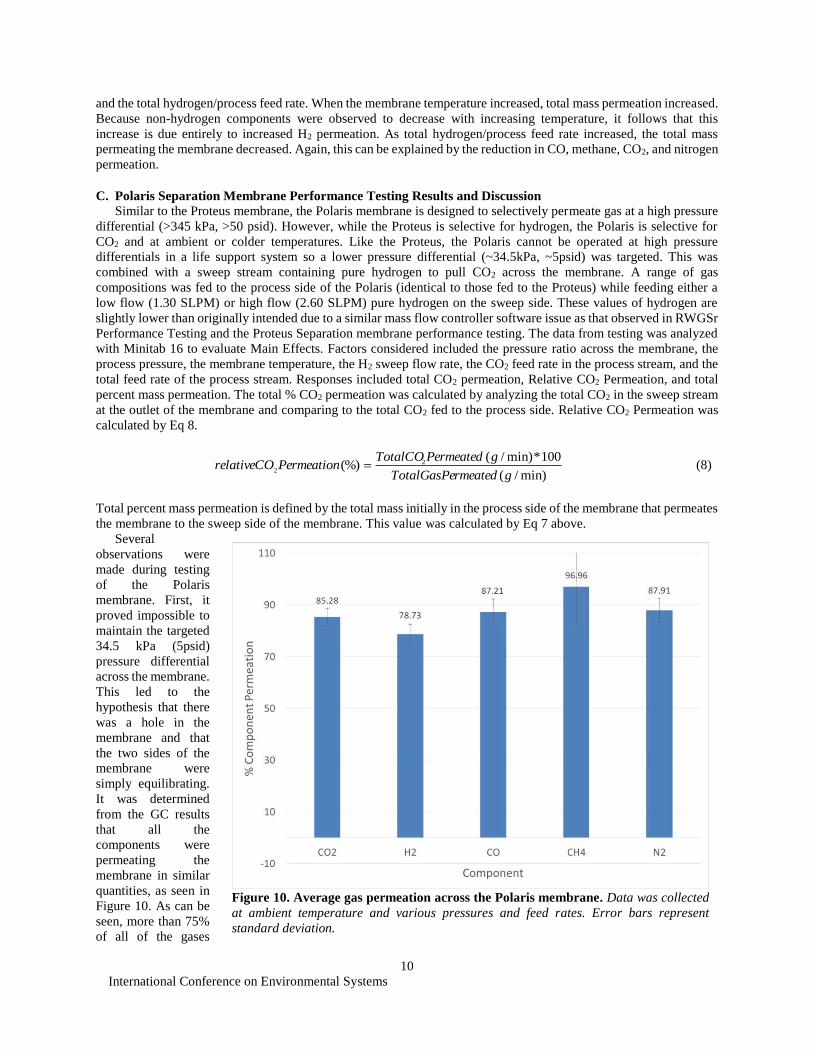
Several
observations were
made during testing
of the Polaris
membrane. First, it
proved impossible to
maintain the targeted
34.5 kPa (5psid)
pressure differential
across the membrane.
This led to the
hypothesis that there
was a hole in the
membrane and that
the two sides of the
membrane were
simply equilibrating.
It was determined
from the GC results
that all the
components were
permeating the
membrane in similar
quantities, as seen in
Figure 10. As can be
seen, more than 75%
of all of the gases
Figure 10. Average gas permeation across the Polaris membrane. Data was collected
at ambient temperature and various pressures and feed rates. Error bars represent
standard deviation.
International Conference on Environmental Systems
11
permeated the membrane in a single pass. Additionally, the error bars, representing standard deviation, show how
little variation there was regardless of pressure differential, flow rates, inlet gas composition, etc.
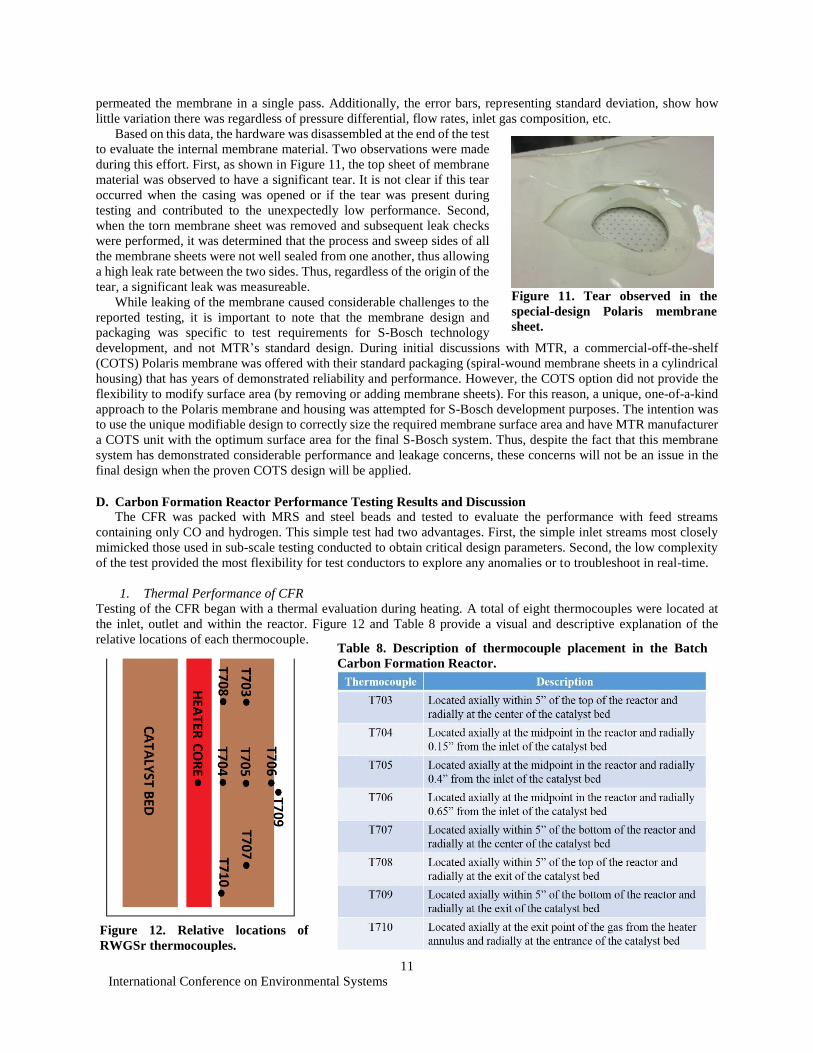
Based on this data, the hardware was disassembled at the end of the test
to evaluate the internal membrane material. Two observations were made
during this effort. First, as shown in Figure 11, the top sheet of membrane
material was observed to have a significant tear. It is not clear if this tear
occurred when the casing was opened or if the tear was present during
testing and contributed to the unexpectedly low performance. Second,
when the torn membrane sheet was removed and subsequent leak checks
were performed, it was determined that the process and sweep sides of all
the membrane sheets were not well sealed from one another, thus allowing
a high leak rate between the two sides. Thus, regardless of the origin of the
tear, a significant leak was measureable.
While leaking of the membrane caused considerable challenges to the
reported testing, it is important to note that the membrane design and
packaging was specific to test requirements for S-Bosch technology
development, and not MTR’s standard design. During initial discussions with MTR, a commercial-off-the-shelf
(COTS) Polaris membrane was offered with their standard packaging (spiral-wound membrane sheets in a cylindrical
housing) that has years of demonstrated reliability and performance. However, the COTS option did not provide the
flexibility to modify surface area (by removing or adding membrane sheets). For this reason, a unique, one-of-a-kind
approach to the Polaris membrane and housing was attempted for S-Bosch development purposes. The intention was
to use the unique modifiable design to correctly size the required membrane surface area and have MTR manufacturer
a COTS unit with the optimum surface area for the final S-Bosch system. Thus, despite the fact that this membrane
system has demonstrated considerable performance and leakage concerns, these concerns will not be an issue in the
final design when the proven COTS design will be applied.
D. Carbon Formation Reactor Performance Testing Results and Discussion
The CFR was packed with MRS and steel beads and tested to evaluate the performance with feed streams
containing only CO and hydrogen. This simple test had two advantages. First, the simple inlet streams most closely
mimicked those used in sub-scale testing conducted to obtain critical design parameters. Second, the low complexity
of the test provided the most flexibility for test conductors to explore any anomalies or to troubleshoot in real-time.
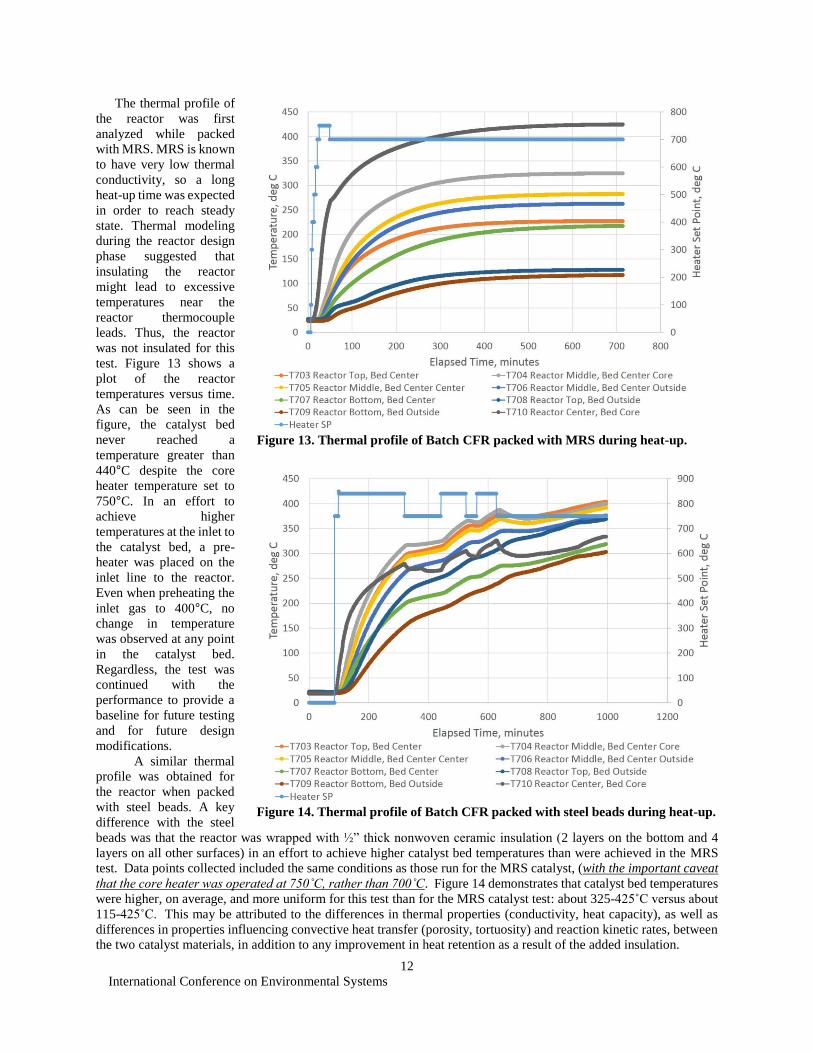
1. Thermal Performance of CFR
Testing of the CFR began with a thermal evaluation during heating. A total of eight thermocouples were located at
the inlet, outlet and within the reactor. Figure 12 and Table 8 provide a visual and descriptive explanation of the
relative locations of each thermocouple. Table 8. Description of thermocouple placement in the Batch
Carbon Formation Reactor.
Figure 11. Tear observed in the
special-design Polaris membrane
sheet.
Figure 12. Relative locations of
RWGSr thermocouples.
International Conference on Environmental Systems
12
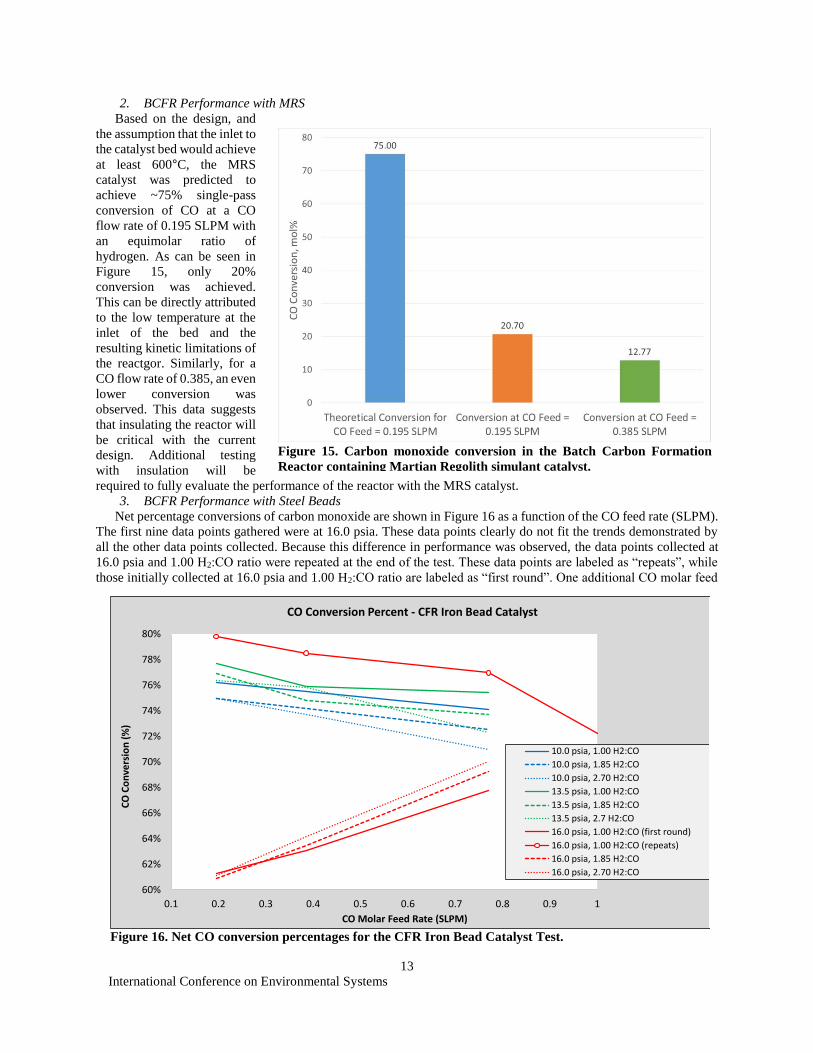
The thermal profile of
the reactor was first
analyzed while packed
with MRS. MRS is known
to have very low thermal
conductivity, so a long
heat-up time was expected
in order to reach steady
state. Thermal modeling
during the reactor design
phase suggested that
insulating the reactor
might lead to excessive
temperatures near the
reactor thermocouple
leads. Thus, the reactor
was not insulated for this
test. Figure 13 shows a
plot of the reactor
temperatures versus time.
As can be seen in the
figure, the catalyst bed
never reached a
temperature greater than
440°C despite the core
heater temperature set to
750°C. In an effort to
achieve higher
temperatures at the inlet to
the catalyst bed, a pre-
heater was placed on the
inlet line to the reactor.
Even when preheating the
inlet gas to 400°C, no
change in temperature
was observed at any point
in the catalyst bed.
Regardless, the test was
continued with the
performance to provide a
baseline for future testing
and for future design
modifications.
A similar thermal
profile was obtained for
the reactor when packed
with steel beads. A key
difference with the steel
beads was that the reactor was wrapped with ½” thick nonwoven ceramic insulation (2 layers on the bottom and 4
layers on all other surfaces) in an effort to achieve higher catalyst bed temperatures than were achieved in the MRS
test. Data points collected included the same conditions as those run for the MRS catalyst, (with the important caveat
that the core heater was operated at 750˚C, rather than 700˚C. Figure 14 demonstrates that catalyst bed temperatures
were higher, on average, and more uniform for this test than for the MRS catalyst test: about 325-425˚C versus about
115-425˚C. This may be attributed to the differences in thermal properties (conductivity, heat capacity), as well as
differences in properties influencing convective heat transfer (porosity, tortuosity) and reaction kinetic rates, between
the two catalyst materials, in addition to any improvement in heat retention as a result of the added insulation.
Figure 13. Thermal profile of Batch CFR packed with MRS during heat-up.
Figure 14. Thermal profile of Batch CFR packed with steel beads during heat-up.
International Conference on Environmental Systems
13
2. BCFR Performance with MRS
Based on the design, and
the assumption that the inlet to
the catalyst bed would achieve
at least 600°C, the MRS
catalyst was predicted to
achieve ~75% single-pass
conversion of CO at a CO
flow rate of 0.195 SLPM with
an equimolar ratio of
hydrogen. As can be seen in
Figure 15, only 20%
conversion was achieved.
This can be directly attributed
to the low temperature at the
inlet of the bed and the
resulting kinetic limitations of
the reactgor. Similarly, for a
CO flow rate of 0.385, an even
lower conversion was
observed. This data suggests
that insulating the reactor will
be critical with the current
design. Additional testing
with insulation will be
required to fully evaluate the performance of the reactor with the MRS catalyst.
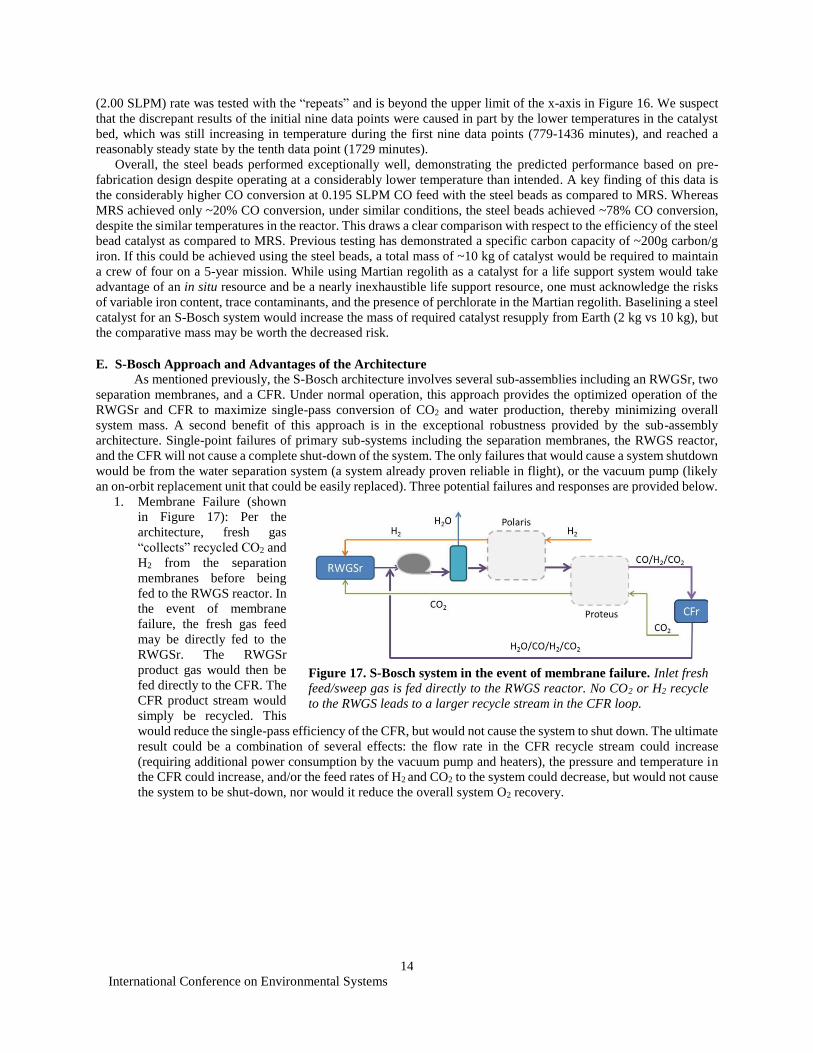
3. BCFR Performance with Steel Beads
Net percentage conversions of carbon monoxide are shown in Figure 16 as a function of the CO feed rate (SLPM).
The first nine data points gathered were at 16.0 psia. These data points clearly do not fit the trends demonstrated by
all the other data points collected. Because this difference in performance was observed, the data points collected at
16.0 psia and 1.00 H2:CO ratio were repeated at the end of the test. These data points are labeled as “repeats”, while
those initially collected at 16.0 psia and 1.00 H2:CO ratio are labeled as “first round”. One additional CO molar feed
Figure 15. Carbon monoxide conversion in the Batch Carbon Formation
Reactor containing Martian Regolith simulant catalyst.
Figure 16. Net CO conversion percentages for the CFR Iron Bead Catalyst Test.
60%
62%
64%
66%
68%
70%
72%
74%
76%
78%
80%
0.1 0.2 0.3 0.4 0.5 0.6 0.7 0.8 0.9 1
CO
Co
nve
rsio
n (
%)
CO Molar Feed Rate (SLPM)
CO Conversion Percent - CFR Iron Bead Catalyst
10.0 psia, 1.00 H2:CO
10.0 psia, 1.85 H2:CO
10.0 psia, 2.70 H2:CO
13.5 psia, 1.00 H2:CO
13.5 psia, 1.85 H2:CO
13.5 psia, 2.7 H2:CO
16.0 psia, 1.00 H2:CO (first round)
16.0 psia, 1.00 H2:CO (repeats)
16.0 psia, 1.85 H2:CO
16.0 psia, 2.70 H2:CO
International Conference on Environmental Systems
14
(2.00 SLPM) rate was tested with the “repeats” and is beyond the upper limit of the x-axis in Figure 16. We suspect
that the discrepant results of the initial nine data points were caused in part by the lower temperatures in the catalyst
bed, which was still increasing in temperature during the first nine data points (779-1436 minutes), and reached a
reasonably steady state by the tenth data point (1729 minutes).
Overall, the steel beads performed exceptionally well, demonstrating the predicted performance based on pre-
fabrication design despite operating at a considerably lower temperature than intended. A key finding of this data is
the considerably higher CO conversion at 0.195 SLPM CO feed with the steel beads as compared to MRS. Whereas
MRS achieved only ~20% CO conversion, under similar conditions, the steel beads achieved ~78% CO conversion,
despite the similar temperatures in the reactor. This draws a clear comparison with respect to the efficiency of the steel
bead catalyst as compared to MRS. Previous testing has demonstrated a specific carbon capacity of ~200g carbon/g
iron. If this could be achieved using the steel beads, a total mass of ~10 kg of catalyst would be required to maintain
a crew of four on a 5-year mission. While using Martian regolith as a catalyst for a life support system would take
advantage of an in situ resource and be a nearly inexhaustible life support resource, one must acknowledge the risks
of variable iron content, trace contaminants, and the presence of perchlorate in the Martian regolith. Baselining a steel
catalyst for an S-Bosch system would increase the mass of required catalyst resupply from Earth (2 kg vs 10 kg), but
the comparative mass may be worth the decreased risk.
E. S-Bosch Approach and Advantages of the Architecture
As mentioned previously, the S-Bosch architecture involves several sub-assemblies including an RWGSr, two
separation membranes, and a CFR. Under normal operation, this approach provides the optimized operation of the
RWGSr and CFR to maximize single-pass conversion of CO2 and water production, thereby minimizing overall
system mass. A second benefit of this approach is in the exceptional robustness provided by the sub-assembly
architecture. Single-point failures of primary sub-systems including the separation membranes, the RWGS reactor,
and the CFR will not cause a complete shut-down of the system. The only failures that would cause a system shutdown
would be from the water separation system (a system already proven reliable in flight), or the vacuum pump (likely
an on-orbit replacement unit that could be easily replaced). Three potential failures and responses are provided below.
1. Membrane Failure (shown
in Figure 17): Per the
architecture, fresh gas
“collects” recycled CO2 and
H2 from the separation
membranes before being
fed to the RWGS reactor. In
the event of membrane
failure, the fresh gas feed
may be directly fed to the
RWGSr. The RWGSr
product gas would then be
fed directly to the CFR. The
CFR product stream would
simply be recycled. This
would reduce the single-pass efficiency of the CFR, but would not cause the system to shut down. The ultimate
result could be a combination of several effects: the flow rate in the CFR recycle stream could increase
(requiring additional power consumption by the vacuum pump and heaters), the pressure and temperature in
the CFR could increase, and/or the feed rates of H2 and CO2 to the system could decrease, but would not cause
the system to be shut-down, nor would it reduce the overall system O2 recovery.
Figure 17. S-Bosch system in the event of membrane failure. Inlet fresh
feed/sweep gas is fed directly to the RWGS reactor. No CO2 or H2 recycle
to the RWGS leads to a larger recycle stream in the CFR loop.
International Conference on Environmental Systems
15
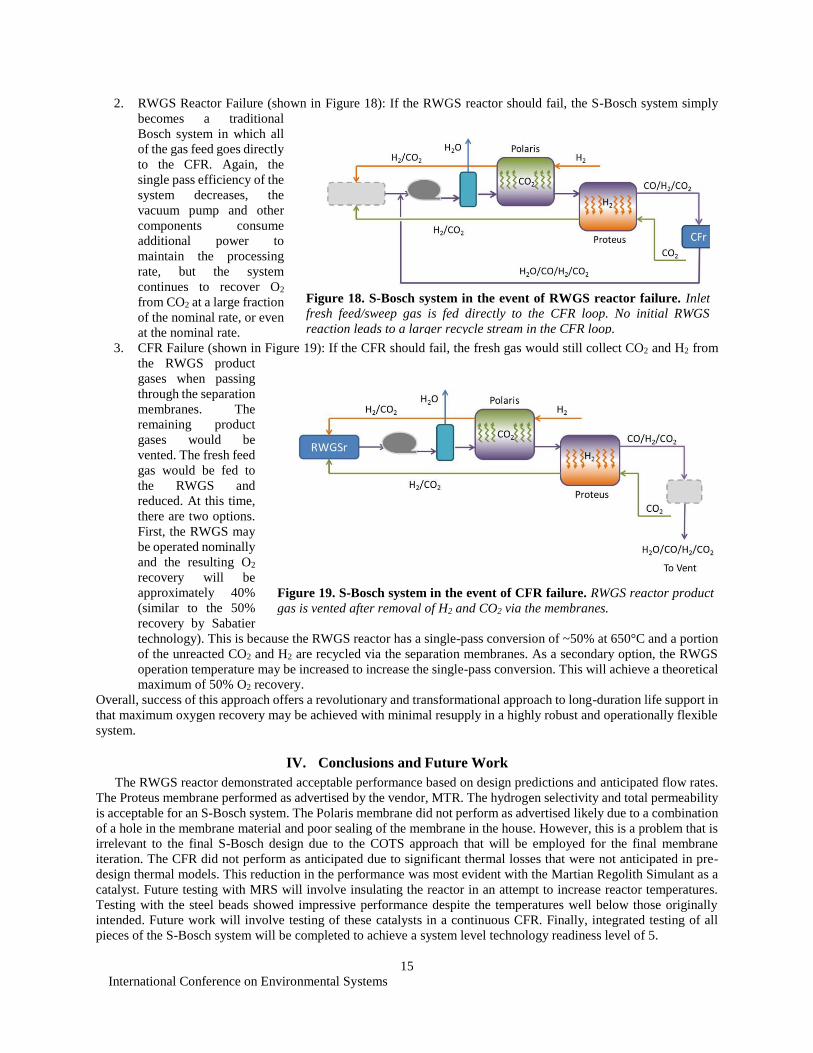
2. RWGS Reactor Failure (shown in Figure 18): If the RWGS reactor should fail, the S-Bosch system simply
becomes a traditional
Bosch system in which all
of the gas feed goes directly
to the CFR. Again, the
single pass efficiency of the
system decreases, the
vacuum pump and other
components consume
additional power to
maintain the processing
rate, but the system
continues to recover O2
from CO2 at a large fraction
of the nominal rate, or even
at the nominal rate.
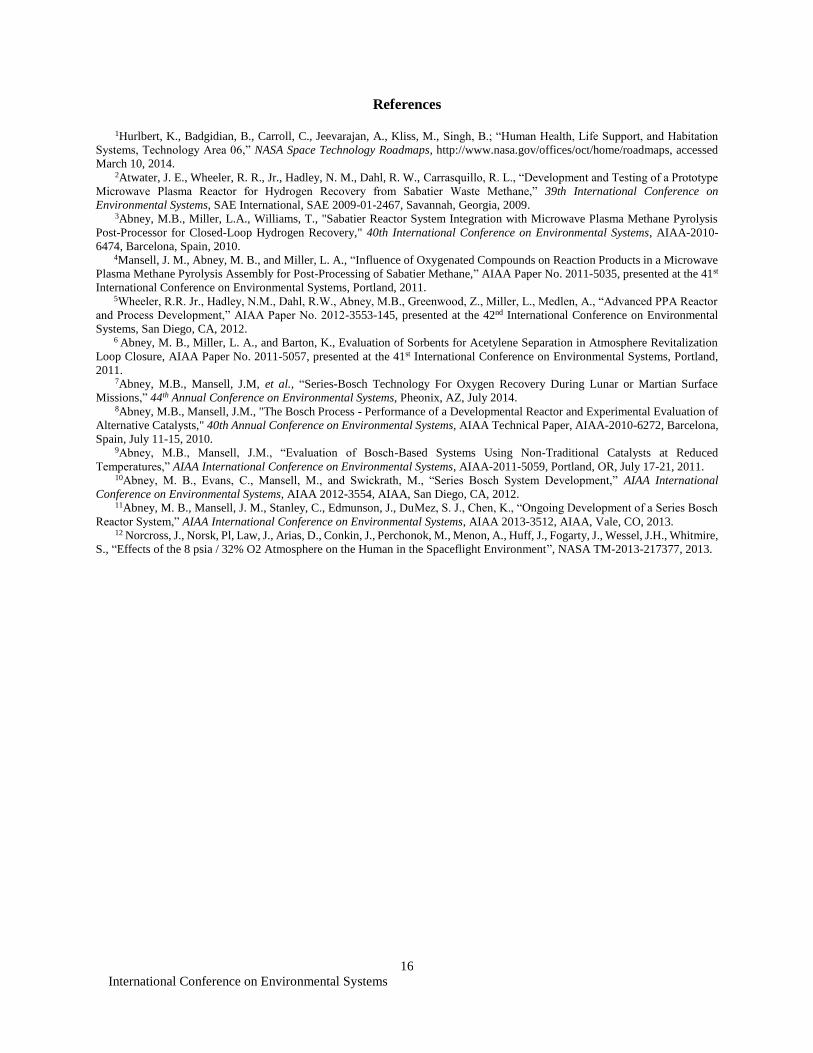
3. CFR Failure (shown in Figure 19): If the CFR should fail, the fresh gas would still collect CO2 and H2 from
the RWGS product
gases when passing
through the separation
membranes. The
remaining product
gases would be
vented. The fresh feed
gas would be fed to
the RWGS and
reduced. At this time,
there are two options.
First, the RWGS may
be operated nominally
and the resulting O2
recovery will be
approximately 40%
(similar to the 50%
recovery by Sabatier
technology). This is because the RWGS reactor has a single-pass conversion of ~50% at 650°C and a portion
of the unreacted CO2 and H2 are recycled via the separation membranes. As a secondary option, the RWGS
operation temperature may be increased to increase the single-pass conversion. This will achieve a theoretical
maximum of 50% O2 recovery.
Overall, success of this approach offers a revolutionary and transformational approach to long-duration life support in
that maximum oxygen recovery may be achieved with minimal resupply in a highly robust and operationally flexible
system.
IV. Conclusions and Future Work
The RWGS reactor demonstrated acceptable performance based on design predictions and anticipated flow rates.
The Proteus membrane performed as advertised by the vendor, MTR. The hydrogen selectivity and total permeability
is acceptable for an S-Bosch system. The Polaris membrane did not perform as advertised likely due to a combination
of a hole in the membrane material and poor sealing of the membrane in the house. However, this is a problem that is
irrelevant to the final S-Bosch design due to the COTS approach that will be employed for the final membrane
iteration. The CFR did not perform as anticipated due to significant thermal losses that were not anticipated in pre-
design thermal models. This reduction in the performance was most evident with the Martian Regolith Simulant as a
catalyst. Future testing with MRS will involve insulating the reactor in an attempt to increase reactor temperatures.
Testing with the steel beads showed impressive performance despite the temperatures well below those originally
intended. Future work will involve testing of these catalysts in a continuous CFR. Finally, integrated testing of all
pieces of the S-Bosch system will be completed to achieve a system level technology readiness level of 5.
Figure 18. S-Bosch system in the event of RWGS reactor failure. Inlet
fresh feed/sweep gas is fed directly to the CFR loop. No initial RWGS
reaction leads to a larger recycle stream in the CFR loop.
Figure 19. S-Bosch system in the event of CFR failure. RWGS reactor product
gas is vented after removal of H2 and CO2 via the membranes.
International Conference on Environmental Systems
16
References
1Hurlbert, K., Badgidian, B., Carroll, C., Jeevarajan, A., Kliss, M., Singh, B.; “Human Health, Life Support, and Habitation
Systems, Technology Area 06,” NASA Space Technology Roadmaps, http://www.nasa.gov/offices/oct/home/roadmaps, accessed
March 10, 2014. 2Atwater, J. E., Wheeler, R. R., Jr., Hadley, N. M., Dahl, R. W., Carrasquillo, R. L., “Development and Testing of a Prototype
Microwave Plasma Reactor for Hydrogen Recovery from Sabatier Waste Methane,” 39th International Conference on
Environmental Systems, SAE International, SAE 2009-01-2467, Savannah, Georgia, 2009. 3Abney, M.B., Miller, L.A., Williams, T., "Sabatier Reactor System Integration with Microwave Plasma Methane Pyrolysis
Post-Processor for Closed-Loop Hydrogen Recovery," 40th International Conference on Environmental Systems, AIAA-2010-
6474, Barcelona, Spain, 2010. 4Mansell, J. M., Abney, M. B., and Miller, L. A., “Influence of Oxygenated Compounds on Reaction Products in a Microwave
Plasma Methane Pyrolysis Assembly for Post-Processing of Sabatier Methane,” AIAA Paper No. 2011-5035, presented at the 41st
International Conference on Environmental Systems, Portland, 2011. 5Wheeler, R.R. Jr., Hadley, N.M., Dahl, R.W., Abney, M.B., Greenwood, Z., Miller, L., Medlen, A., “Advanced PPA Reactor
and Process Development,” AIAA Paper No. 2012-3553-145, presented at the 42nd International Conference on Environmental
Systems, San Diego, CA, 2012. 6 Abney, M. B., Miller, L. A., and Barton, K., Evaluation of Sorbents for Acetylene Separation in Atmosphere Revitalization
Loop Closure, AIAA Paper No. 2011-5057, presented at the 41st International Conference on Environmental Systems, Portland,
2011. 7Abney, M.B., Mansell, J.M, et al., “Series-Bosch Technology For Oxygen Recovery During Lunar or Martian Surface
Missions,” 44th Annual Conference on Environmental Systems, Pheonix, AZ, July 2014. 8Abney, M.B., Mansell, J.M., "The Bosch Process - Performance of a Developmental Reactor and Experimental Evaluation of
Alternative Catalysts," 40th Annual Conference on Environmental Systems, AIAA Technical Paper, AIAA-2010-6272, Barcelona,
Spain, July 11-15, 2010. 9Abney, M.B., Mansell, J.M., “Evaluation of Bosch-Based Systems Using Non-Traditional Catalysts at Reduced
Temperatures,” AIAA International Conference on Environmental Systems, AIAA-2011-5059, Portland, OR, July 17-21, 2011. 10Abney, M. B., Evans, C., Mansell, M., and Swickrath, M., “Series Bosch System Development,” AIAA International
Conference on Environmental Systems, AIAA 2012-3554, AIAA, San Diego, CA, 2012. 11Abney, M. B., Mansell, J. M., Stanley, C., Edmunson, J., DuMez, S. J., Chen, K., “Ongoing Development of a Series Bosch
Reactor System,” AIAA International Conference on Environmental Systems, AIAA 2013-3512, AIAA, Vale, CO, 2013. 12 Norcross, J., Norsk, Pl, Law, J., Arias, D., Conkin, J., Perchonok, M., Menon, A., Huff, J., Fogarty, J., Wessel, J.H., Whitmire,
S., “Effects of the 8 psia / 32% O2 Atmosphere on the Human in the Spaceflight Environment”, NASA TM-2013-217377, 2013.