Embed Size (px)
Citation preview

Advanced Piloting Course (Coastal
Navigation)
Chapter 3
Fixes
Educational Officer – Dave [email protected] - 651-429-3840
Assistant Educational Officer – David Moberg
[email protected] – 715-386-8582 Instructor – Art Mollica
[email protected] - 651-777-0277
United States Power Squadrons®

Any questions on homework from Chapter 1?1. The chart projection used for U.S. coastal areas is: (b) Mercator.
2. An advantage of the Mercator projection is: (c) lines of latitude and longitude are at right angles to each other.
3. When comparing a land mass at a latitude of 70ºN on a Mercator chart with a comparable size land mass near the equator, the: (b) land mass at 70 ºN will appear larger.
4. Polyconic projections are useful especially when traveling over great distances. (b) False
5. As long as a Polyconic chart is limited in extent, the curvature of the grid lines is negligible and the chart is very accurate. (a) True
6. On a Polyconic projection, the parallels of latitude are straight lines. (b) False
7. In planning a cruise, the steering error that can be expected under normal weather conditions is: (b) between 3 º to 5 º.
8. The smaller your boat’s compass, the easier it is to read. (b) False
9. One of the most important advantages of pre-plotting a cruise is that it tells you: (c) areas of hazard to be avoided.
10. When underway in waters near land, it’s best to plot GPS fixes and time every: (c) hour or so.

Any questions on homework from Chapter 1?11. Raster formatted digital charts: (b) have the look and feel of
traditional paper charts.
12. Vector formatted digital charts: (d) are easily stored on chips or cartridges.
13. Digital charts are less accurate than traditional paper charts. (b) False
14. Using the zoom function on a raster digital chart increases the precision of detail. (b) False
15. Chart scale is a factor in determining the accuracy of a digital chart, therefore: (b) a large scale chart covers a small area with great detail.
16. The use of a Chartplotter requires: (d) input from a digital chart to activate the display.

Any questions on homework from Chapter 2?1. Computer-assisted navigation systems are: (b) useful for planning a
cruise in the comfort on one’s home or office.
2. The most accurate radar fix is obtained by: (d) using simultaneous ranges to two or more known points.
3. An electronic bearing line (EBL) lays a line of bearing over a target to: (b) determine the bearing to the target.
4. The variable range marker (VRM) on the radar display screen is used to determine: (c) distance to a target.
5. Range rings on a radar display screen allow the operator to estimate the: (a) distance to a displayed object.
6. According to the rules of relative motion: (b) all fixed objects appear to be moving in the direction opposite from your boat’s motion.
7. According to the rules of relative motion, on a boat’s radar screen when your boat increases speed going forward, all relative motion tends to move toward the bottom of the display screen. (a) True
8. Fixed objects can be differentiated from moving objects on the radar screen by noting which objects appear to be moving: (d) downward on the radar screen in relation to your boat’s course and speed.
Any questions on homework from Chapter 2?9. A “lollypop” displayed on a radar screen is a dashed line to a circle: (b)
indicating a GPS waypoint.
10. A depth sounder, when combined with another navigation tool, can be used to estimate a boat’s position. (a) True
11. The primary purpose of a depth sounder is to: (c) determined water depth below the hull of a boat.
12. Depth sounders can be used to crosscheck the proper functioning of the GPS. (a) True

Slide 6
Visual Bearing Limitations Multiple Bearings
• Simultaneous Bearings Often Difficult
• Landmarks not Separated Sufficiently
• Landmarks too Far Away
• Only one Landmark available
Two Bearings on same Landmark• Sight Landmark from Different Directions
• Second Bearing Somewhat Later
• Called ‘Running Fix’ Advance First Bearing to Current
Position Use Distance Run to Determine How Far

Slide 7
Running Fix
C 285MS 7.5
0935
325M
0935
1012
060M
1012
0935-1012
325M
1012 RFix
C 285MS 7.5
N “3”

Slide 8
Running Fix
C 090MS 7.5
1445
170M
1445
1415
060M
1415
1415
-144
5
060M
1445 RFixC 090MS 7.5
N “9”
C “14”

Slide 9
Running Fix (open ocean) Taught in JN
Charts not available• Create on using
CLS
NavAids not available
Sights on Sun• Morning• Noon• Evening
Advance• Morning to noon• Noon to evening• Evening to morning

Slide 10
Exercise 3 - 1Take out Bowditch Bay Chart. Using two bearings on the same landmark and advance an LOP to plot a Running Fix.At 0900, depart R”2” Fl R 4s Oyster River on a true course of 355. Speed is 6.0 Kn.At 0926, you take a hand bearing compass bearing of 310 on Chapman Point Light.At 0955, you take a second compass bearing of 260 on Chapman Point Light.With these two bearings, plot a running fix.What are the coordinates of the 0955 running fix?Seaman’s Eye: What can you use to confirm the accuracy of the 0955 fix?At 0955, you take up a magnetic heading of 099. You increase your speed to 12 Kn.
T = 355V = 015WM = 010D = 000C = 010
0900 Visual
C
01
0M
S
6.0
D = (ST) / 60D = 6.0x26/60D = 2.6nm
0926
C = 310D = 000M = 310V = 015WT = 295
0926 310M
D = (ST) / 60D = 6.0x29/60D = 2.9nm
0955
C = 260D = 000M = 260V = 015WT = 245
0955
260M
0926-0955 310M0955 RFix
41º 42.7’N72º 01.6’W
You are nearlydue north of
G C”1”,confirming your
position
M = 099V = 015WT = 084
C 099M
S 12.0

Homework Exercise 3-1Running Fix
At 1300, depart from a GPS fix of L 41º 45.0’ N, Lo 71º 55.0’ W on true course of 230º and speed of 6.0kn.
At 1330, take a hand-bearing compass bearing of 318º on “Fl R 6s Horn.”
At 1355, take a hand-bearing compass bearing of 280º on “Chapman Pt “Fl 6s”
Plot 1355 running fix.
What are the coordinates?
L 41º 41.6’ N Lo 72º 01.7’ W
Take up a heading to RW “OR” Mo(A).
1300 GPS
C 245M
S 6.0
1330 318M
1355
280M
1330-1355 318M
1355 RFix
C 175M
S 6.0
1330
1355
0900 Visual
C 0
10
M
S 6
.0
0926
0926 310M
0955
0955
260M
0926-0955 310M
0955 RFix
C 099M
S 12.0

Slide 12
Radar Fix
Compare with Chart• Identifiable features
Distinct Shorelines Isolated Buoys
Plot• Convert Relative Bearings• Distance & Bearing to return echoes
Accuracy• Short Distances (<1/4nm): EBL 55ft; VRM 30ft• Medium Distances (<2nm): EBL 300ft; VRM 75ft• Long Distances (>3nm): EBL 650ft; VRM 200ft

Slide 13
Radar Plotting Board
CPA / TCPA
1004 2.4nm 084º R
1010 1.4nm 064º R
1016 1.0nm 028º R
1/2rr
10041010
1016Modern, high-end radar uses mini-automatic radar plotting aid (MARPA) – allowing you to identify vessel, speed, bearing, closest point of approach and time to closest point of approach.
Slide 14
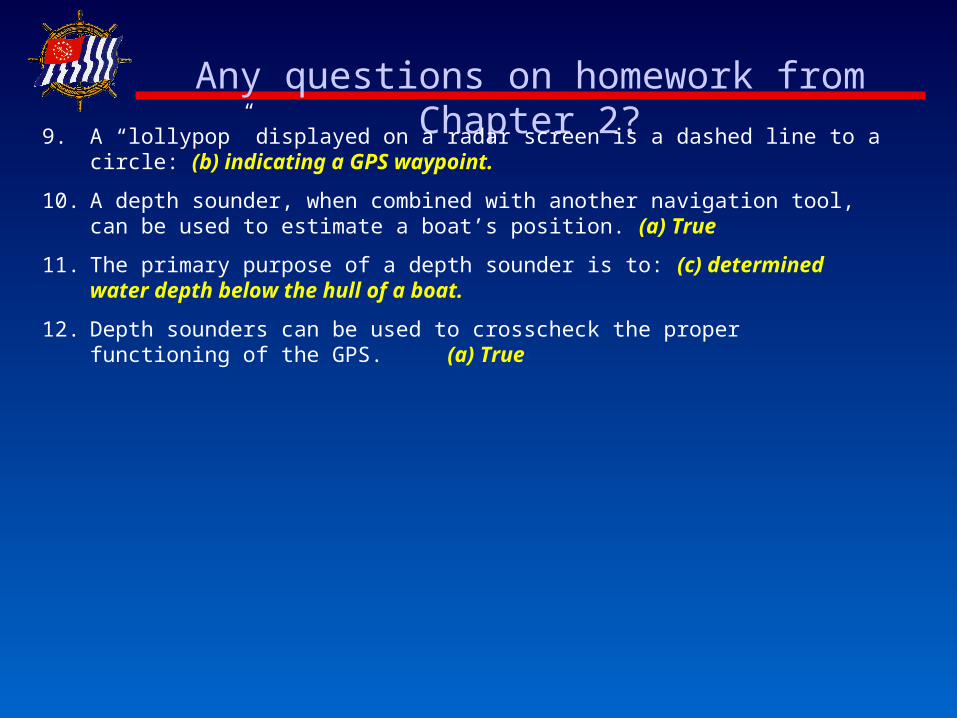
Radar Images
Buoys are Point Targets• Challenge: Uniquely Identify Buoy
Shoreline Less Defined• Shapes Change with Each Sweep• Only See Forward Slope• Low-lying Areas may not Provide Echoes• Look for Point Features of Shoreline
Look for Prominent Regions• Get Distance from each Feature• Approximate Position Likely

Slide 15
Position by Radar
C 275M
S 7.5
Tim
e

Slide 16
Position by Radar
+
3nmR/R
1 / 2 H – UP
AUTO
M275ºM
EBL 1
VRM 1
245.0º R
01.80 NM
EBL 2
VRM 2
020.0º R
00.00 NM
CURSORBRG 000º
RNG 01.8NM
VRM1
EBL1
EBL2

Slide 17
Position by Radar
+

Slide 18
Position by Radar
C 275M
S 7.5
295M160M
D 1.8
Time Radar
TimeTime
Time
EBL1 245ºR EBL2 020ºR Range 1.8nm
MC 275º RB 245º
520º -360º
MB 160º V 15ºW TB 145º

Slide 19
Exercise 3 – 2 Take out Bowditch Bay Chart.
Using a radar range and a radar bearing on two objects, plot a radar fix.You depart RG “CP” Fl (2+1) R 6s at 0900 on a magnetic heading of 112. Speed is 6.0 Kn.
0900 Visual
C 112MS 6.0
M 122º V 15ºW T 107º

Slide 20
+
3nmR/R
1 / 2 H – UP
AUTO
M112ºM
EBL 1
VRM 1
245.0º R
01.50 NM
EBL 2
VRM 2
000.0º R
00.00 NM
CURSORBRG 000º
RNG 00.0NM
Exercise 3 – 2
At 0950, this is your radar screen image, plot a radar fix.

Slide 21
Exercise 3 – 2 Take out Bowditch Bay Chart.
Using a radar range and a radar bearing on two objects, plot a radar fix.
0900 Visual
C 112MS 6.0 0950 Radar
D 1.5
0950
347M
0950

Homework Exercise 3-2Radar Position
Determine where you are based on the radar screen below.
What are the coordinates of your position?
L 41º 38.7’ N Lo 72º 05.1’ W
Which of the returns are from buoys? Which buoys? RG “CP”
R “16” G “15”
R “4”
G “13”
G “11”
R “
14”
10 9 8 7 6 5 4 3 2 1
10 MINUTE BREAK
PLEASE TAKE YOUR SEATS

Advanced Piloting Course (Coastal
Navigation)
Chapter 4
Avoidance Techniques
Educational Officer – Dave [email protected] - 651-429-3840
Assistant Educational Officer – David Moberg
[email protected] – 715-386-8582 Instructor – Art Mollica
[email protected] - 651-777-0277
United States Power Squadrons®

Slide 25
Danger Bearings
VSSPR36VSSPR34
NMT 245M
NLT 070M

Slide 26
Exercise 4-1Danger Bearing
Plot waypoint “TWRN” at Tower R Lt north of Channel Island and “ORRW” at RW “OR” Mo “A”.
At 1000 depart ORRW for TWRN at 7.0kn.
Plot a danger bearing that will keep you west of Channel Island, coming no closer than the 12ft sounding curve.
Take a GPS fix when you reach a point 2.1nm from TWRN and the waypoint bears 037ºM.
From this fix, take up a magnetic heading of 105º and increase speed to 9.0kn.
T = 022 V = 15W M = 037
T = 090 V= 15W M = 105
T = 015 V = 15W M = 030
C
037M
S 7
.0C
105M S 7.0
1058 GPS
1058 – 1000 = 0058 60D = ST D = 7x58/60 D = 6.8
ORRW
TWRN
NLT
030M
1058
D 2
.1
1000

Slide 27
Danger Sector
DANCHI
NM
T 23
5MNLT 250M
Danger
Sector
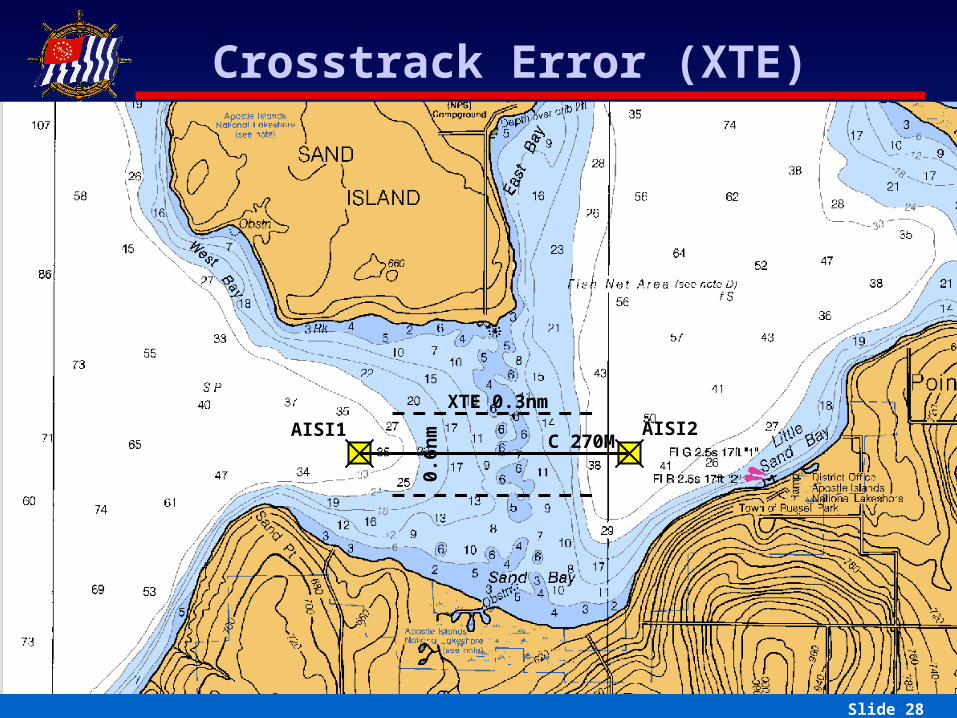
Slide 28
Crosstrack Error (XTE)
AISI2AISI1
XTE 0.3nm
C 270M0.
6nm

Slide 29
Exercise 4-2 Crosstrack Error
Plot waypoint “BB17” at 41º 38.8’ N 71º 55.0’ W and “BB18” at 41º 38.8’ N 72º 06.7’ W. Using these waypoints as your intended course line plot and label a crosstrack error which will provide a safe passage.
BB17
BB18
T = 270 M = 15W M = 285
C 285M
XTE 1.0

Slide 30
Danger Circle
WFBPS

Slide 31
Exercise 4-3Danger Circle
Using a charted visible object, plot and label a danger circle around the rocks at Rocky Neck Point.
Create a GPS waypoint and plot and label a danger circle around the rocks south of Channel Island.
DCIRD NLT 0.3
DRNPR
D NLT 1.5

Slide 32
Exercise 4-4Radar Avoidance
Plot and label a radar danger circle to avoid the rocky area to the south of Channel Island to ensure you stay at least 0.5 nm away from the rocks as you navigate on a true course of 270º.
D NLT 1.3
0.5

Slide 33
Alarm Zones
Slide 34
Questions ? … Comments

Slide 35
Read Chapters 5 – Student Guide
Do Part I and II of the Weekend Cruise
Next Class – 3 May
Homework