Embed Size (px)
Citation preview
Advanced Simulation Technologies for Nuclear Power Plants 94
Advanced Simulation Technologies for Nuclear Power Plants
Kazuya IshiiTakuji NagayoshiShiro Takahashi, Dr. Eng.Yoichi Wada, Dr. Eng.Naoshi Tanikawa
INTRODUCTIONNUCLEAR plant systems are subject to ongoing enhancements to improve their safety and economics. Computer simulations have played an important
role from the earliest stages of nuclear power plant development. Predicting the physical phenomena that will occur in a new system is an essential part of turning innovative ideas into commercial reality and
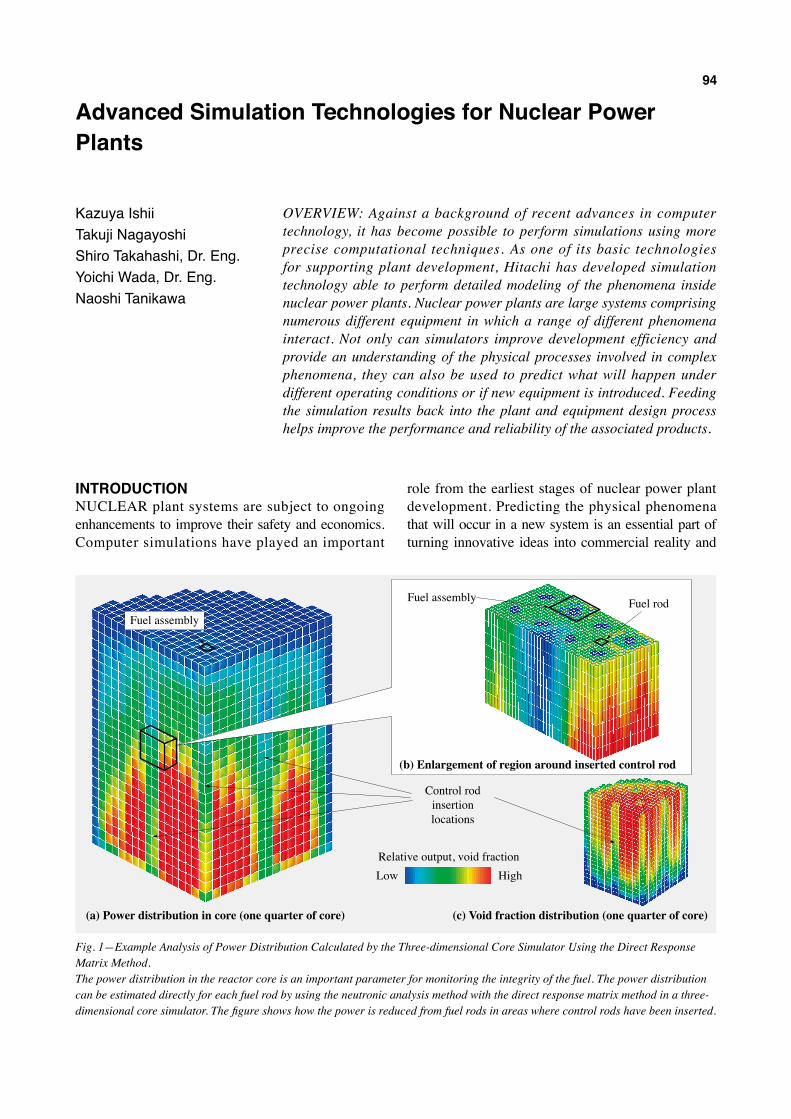
Control rodinsertionlocations
Fuel assembly
Fuel assembly Fuel rod
Relative output, void fractionLow High
(a) Power distribution in core (one quarter of core) (c) Void fraction distribution (one quarter of core)
(b) Enlargement of region around inserted control rod
Fig. 1—Example Analysis of Power Distribution Calculated by the Three-dimensional Core Simulator Using the Direct Response Matrix Method.The power distribution in the reactor core is an important parameter for monitoring the integrity of the fuel. The power distribution can be estimated directly for each fuel rod by using the neutronic analysis method with the direct response matrix method in a three-dimensional core simulator. The figure shows how the power is reduced from fuel rods in areas where control rods have been inserted.
OVERVIEW: Against a background of recent advances in computer technology, it has become possible to perform simulations using more precise computational techniques. As one of its basic technologies for supporting plant development, Hitachi has developed simulation technology able to perform detailed modeling of the phenomena inside nuclear power plants. Nuclear power plants are large systems comprising numerous different equipment in which a range of different phenomena interact. Not only can simulators improve development efficiency and provide an understanding of the physical processes involved in complex phenomena, they can also be used to predict what will happen under different operating conditions or if new equipment is introduced. Feeding the simulation results back into the plant and equipment design process helps improve the performance and reliability of the associated products.
Hitachi Review Vol. 58 (2009), No.2 95
requires high-precision simulation techniques. As one of the fundamental technologies for plant development, Hitachi is working on the development of detailed simulation technologies powered by more precise computational techniques that take advantage of the rapidly advancing field of computing (see Fig. 1).
This article describes the features and latest trends in simulation technologies used for nuclear power plant design and maintenance, including core neutronic and thermal-hydraulic analysis for BWRs (boiling water reactors), gas-liquid two-phase flow analysis, acoustic vibration analysis of steam dryers, and simulation techniques for the corrosive environment in the reactor.
CORE NEUTRONIC AND THERMAL-HYDRAULIC ANALYSISCore Neutronic and Thermal-hydraulic Analysis for BWRs
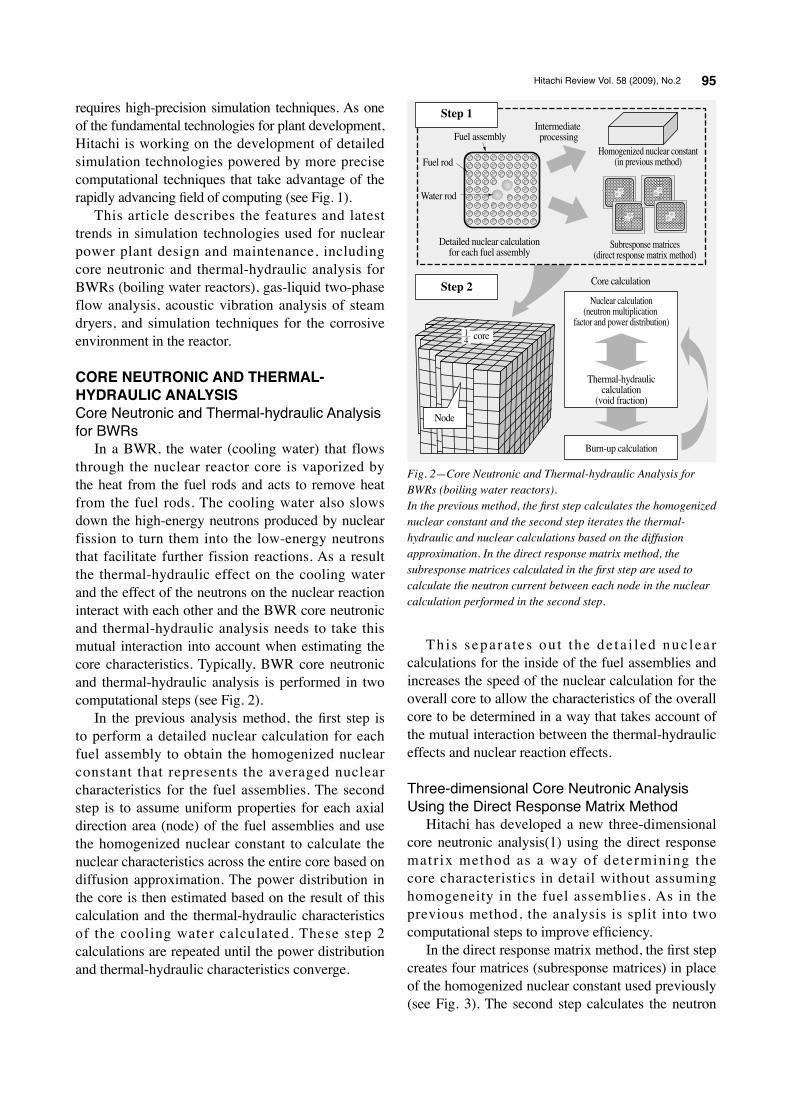
In a BWR, the water (cooling water) that flows through the nuclear reactor core is vaporized by the heat from the fuel rods and acts to remove heat from the fuel rods. The cooling water also slows down the high-energy neutrons produced by nuclear fission to turn them into the low-energy neutrons that facilitate further fission reactions. As a result the thermal-hydraulic effect on the cooling water and the effect of the neutrons on the nuclear reaction interact with each other and the BWR core neutronic and thermal-hydraulic analysis needs to take this mutual interaction into account when estimating the core characteristics. Typically, BWR core neutronic and thermal-hydraulic analysis is performed in two computational steps (see Fig. 2).
In the previous analysis method, the first step is to perform a detailed nuclear calculation for each fuel assembly to obtain the homogenized nuclear constant that represents the averaged nuclear characteristics for the fuel assemblies. The second step is to assume uniform properties for each axial direction area (node) of the fuel assemblies and use the homogenized nuclear constant to calculate the nuclear characteristics across the entire core based on diffusion approximation. The power distribution in the core is then estimated based on the result of this calculation and the thermal-hydraulic characteristics of the cooling water calculated. These step 2 calculations are repeated until the power distribution and thermal-hydraulic characteristics converge.
Th i s s epa ra t e s ou t t he de ta i l ed nuc lea r calculations for the inside of the fuel assemblies and increases the speed of the nuclear calculation for the overall core to allow the characteristics of the overall core to be determined in a way that takes account of the mutual interaction between the thermal-hydraulic effects and nuclear reaction effects.
Three-dimensional Core Neutronic Analysis Using the Direct Response Matrix Method
Hitachi has developed a new three-dimensional core neutronic analysis(1) using the direct response matrix method as a way of determining the core characteristics in detail without assuming homogeneity in the fuel assemblies. As in the previous method, the analysis is split into two computational steps to improve efficiency.
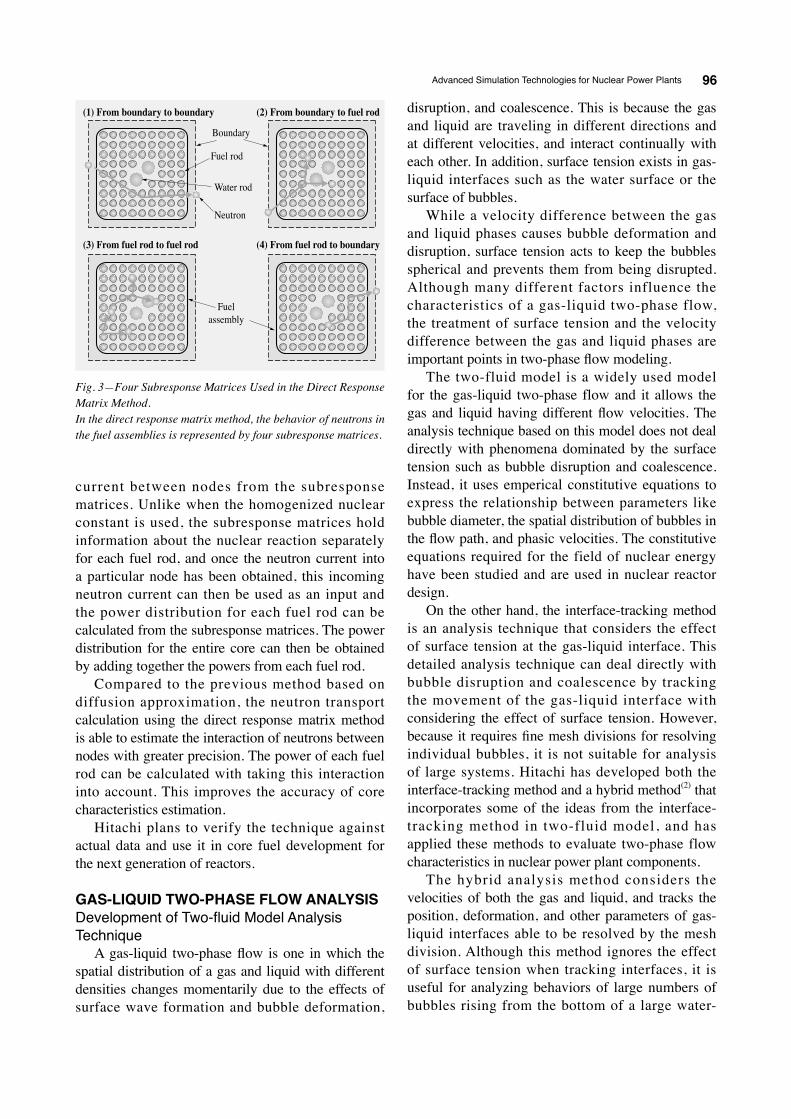
In the direct response matrix method, the first step creates four matrices (subresponse matrices) in place of the homogenized nuclear constant used previously (see Fig. 3). The second step calculates the neutron
Node
Core calculation
Detailed nuclear calculationfor each fuel assembly
Fuel rod
Fuel assemblyIntermediate processing
Homogenized nuclear constant(in previous method)
Water rod
Burn-up calculation
Step 2
Step 1
Subresponse matrices(direct response matrix method)
Nuclear calculation(neutron multiplication
factor and power distribution)
Thermal-hydrauliccalculation
(void fraction)
core41
Fig. 2—Core Neutronic and Thermal-hydraulic Analysis for BWRs (boiling water reactors).In the previous method, the first step calculates the homogenized nuclear constant and the second step iterates the thermal-hydraulic and nuclear calculations based on the diffusion approximation. In the direct response matrix method, the subresponse matrices calculated in the first step are used to calculate the neutron current between each node in the nuclear calculation performed in the second step.
Advanced Simulation Technologies for Nuclear Power Plants 96
disruption, and coalescence. This is because the gas and liquid are traveling in different directions and at different velocities, and interact continually with each other. In addition, surface tension exists in gas-liquid interfaces such as the water surface or the surface of bubbles.
While a velocity difference between the gas and liquid phases causes bubble deformation and disruption, surface tension acts to keep the bubbles spherical and prevents them from being disrupted. Although many different factors influence the characteristics of a gas-liquid two-phase flow, the treatment of surface tension and the velocity difference between the gas and liquid phases are important points in two-phase flow modeling.
The two-fluid model is a widely used model for the gas-liquid two-phase flow and it allows the gas and liquid having different flow velocities. The analysis technique based on this model does not deal directly with phenomena dominated by the surface tension such as bubble disruption and coalescence. Instead, it uses emperical constitutive equations to express the relationship between parameters like bubble diameter, the spatial distribution of bubbles in the flow path, and phasic velocities. The constitutive equations required for the field of nuclear energy have been studied and are used in nuclear reactor design.
On the other hand, the interface-tracking method is an analysis technique that considers the effect of surface tension at the gas-liquid interface. This detailed analysis technique can deal directly with bubble disruption and coalescence by tracking the movement of the gas-liquid interface with considering the effect of surface tension. However, because it requires fine mesh divisions for resolving individual bubbles, it is not suitable for analysis of large systems. Hitachi has developed both the interface-tracking method and a hybrid method(2) that incorporates some of the ideas from the interface-tracking method in two-fluid model, and has applied these methods to evaluate two-phase flow characteristics in nuclear power plant components.
The hybrid analysis method considers the velocities of both the gas and liquid, and tracks the position, deformation, and other parameters of gas-liquid interfaces able to be resolved by the mesh division. Although this method ignores the effect of surface tension when tracking interfaces, it is useful for analyzing behaviors of large numbers of bubbles rising from the bottom of a large water-
current between nodes from the subresponse matrices. Unlike when the homogenized nuclear constant is used, the subresponse matrices hold information about the nuclear reaction separately for each fuel rod, and once the neutron current into a particular node has been obtained, this incoming neutron current can then be used as an input and the power distribution for each fuel rod can be calculated from the subresponse matrices. The power distribution for the entire core can then be obtained by adding together the powers from each fuel rod.
Compared to the previous method based on diffusion approximation, the neutron transport calculation using the direct response matrix method is able to estimate the interaction of neutrons between nodes with greater precision. The power of each fuel rod can be calculated with taking this interaction into account. This improves the accuracy of core characteristics estimation.
Hitachi plans to verify the technique against actual data and use it in core fuel development for the next generation of reactors.
GAS-LIQUID TWO-PHASE FLOW ANALYSISDevelopment of Two-fluid Model Analysis Technique
A gas-liquid two-phase flow is one in which the spatial distribution of a gas and liquid with different densities changes momentarily due to the effects of surface wave formation and bubble deformation,
Boundary
Fuel rod
Fuelassembly
Water rod
Neutron
(1) From boundary to boundary (2) From boundary to fuel rod
(3) From fuel rod to fuel rod (4) From fuel rod to boundary
Fig. 3—Four Subresponse Matrices Used in the Direct Response Matrix Method.In the direct response matrix method, the behavior of neutrons in the fuel assemblies is represented by four subresponse matrices.
Hitachi Review Vol. 58 (2009), No.2 97
filled pool. The flow in the pool is characterized by the interaction among the rising bubbles and wave formation on the water surface in the pool. However, the two-fluid model can not deal with the waves on the surface. The interface-tracking method, on the other hand, requires a fine mesh division to resolve the bubbles. The hybrid method uses the two-fluid model for groups of bubbles and the interface-tracking method for surface waves. As a result, it can analyze two-phase flow with higher accuracy than the two-fluid model while using fewer mesh divisions than the interface-tracking method. Fig. 4 shows a two-phase flow pattern calculated by the hybrid method in a horizontal pipe with an orifice. This shows how slug bubbles are being broken into large numbers of small bubbles in the region of the orifice. Although the size of the small bubbles is strongly dependent on the surface tension, this effect is considered indirectly by the constitutive equations.
Both the hybrid method and the interface-tracking method have been extended to consider phase changes such as evaporation and condensation, the compressibility of the gas phase, and Hitachi continues to work on extending the scope of application of these methods.
Example Applications in the Nuclear Power Industry
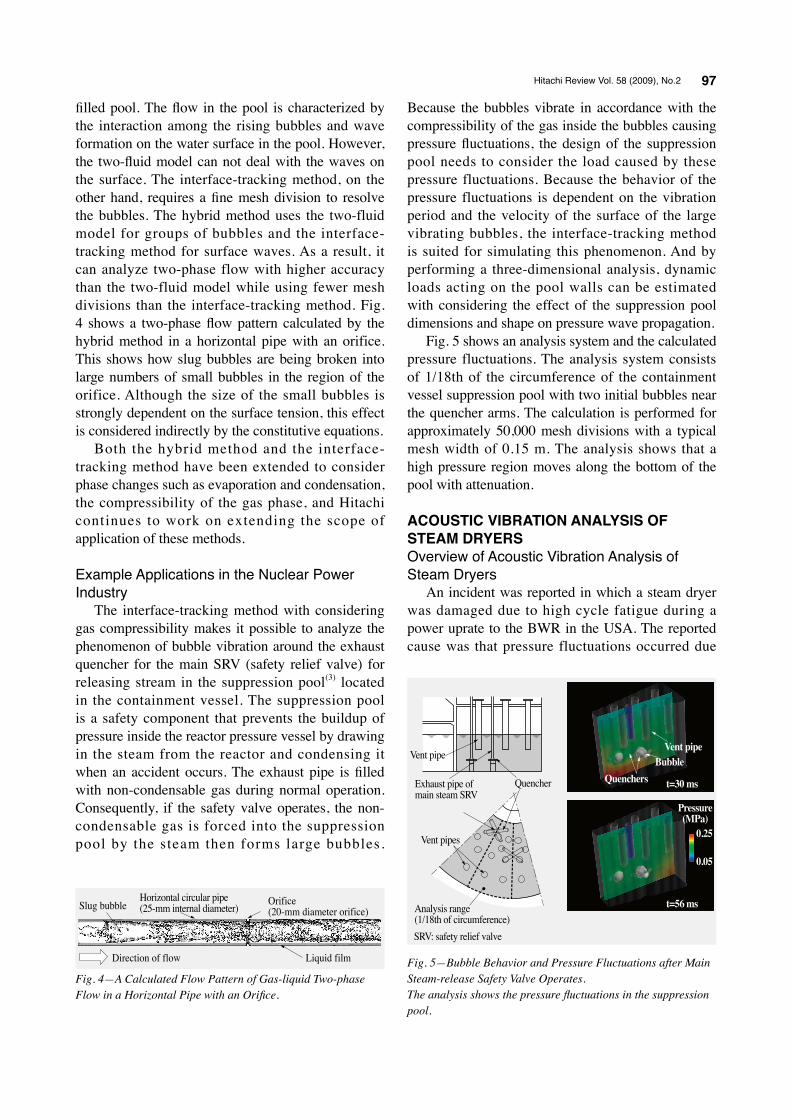
The interface-tracking method with considering gas compressibility makes it possible to analyze the phenomenon of bubble vibration around the exhaust quencher for the main SRV (safety relief valve) for releasing stream in the suppression pool(3) located in the containment vessel. The suppression pool is a safety component that prevents the buildup of pressure inside the reactor pressure vessel by drawing in the steam from the reactor and condensing it when an accident occurs. The exhaust pipe is filled with non-condensable gas during normal operation. Consequently, if the safety valve operates, the non-condensable gas is forced into the suppression pool by the steam then forms large bubbles.
Because the bubbles vibrate in accordance with the compressibility of the gas inside the bubbles causing pressure fluctuations, the design of the suppression pool needs to consider the load caused by these pressure fluctuations. Because the behavior of the pressure fluctuations is dependent on the vibration period and the velocity of the surface of the large vibrating bubbles, the interface-tracking method is suited for simulating this phenomenon. And by performing a three-dimensional analysis, dynamic loads acting on the pool walls can be estimated with considering the effect of the suppression pool dimensions and shape on pressure wave propagation.
Fig. 5 shows an analysis system and the calculated pressure fluctuations. The analysis system consists of 1/18th of the circumference of the containment vessel suppression pool with two initial bubbles near the quencher arms. The calculation is performed for approximately 50,000 mesh divisions with a typical mesh width of 0.15 m. The analysis shows that a high pressure region moves along the bottom of the pool with attenuation.
ACOUSTIC VIBRATION ANALYSIS OF STEAM DRYERSOverview of Acoustic Vibration Analysis of Steam Dryers
An incident was reported in which a steam dryer was damaged due to high cycle fatigue during a power uprate to the BWR in the USA. The reported cause was that pressure fluctuations occurred due
Direction of flow Liquid film
Slug bubbleHorizontal circular pipe(25-mm internal diameter)
Orifice(20-mm diameter orifice)
Fig. 4—A Calculated Flow Pattern of Gas-liquid Two-phase Flow in a Horizontal Pipe with an Orifice.
t=56 ms
t=30 ms
Pressure(MPa)
QuenchersBubble
Vent pipeVent pipe
Vent pipes
QuencherExhaust pipe of main steam SRV
0.05
0.25
Analysis range(1/18th of circumference)SRV: safety relief valve
Fig. 5—Bubble Behavior and Pressure Fluctuations after Main Steam-release Safety Valve Operates.The analysis shows the pressure fluctuations in the suppression pool.
Advanced Simulation Technologies for Nuclear Power Plants 98
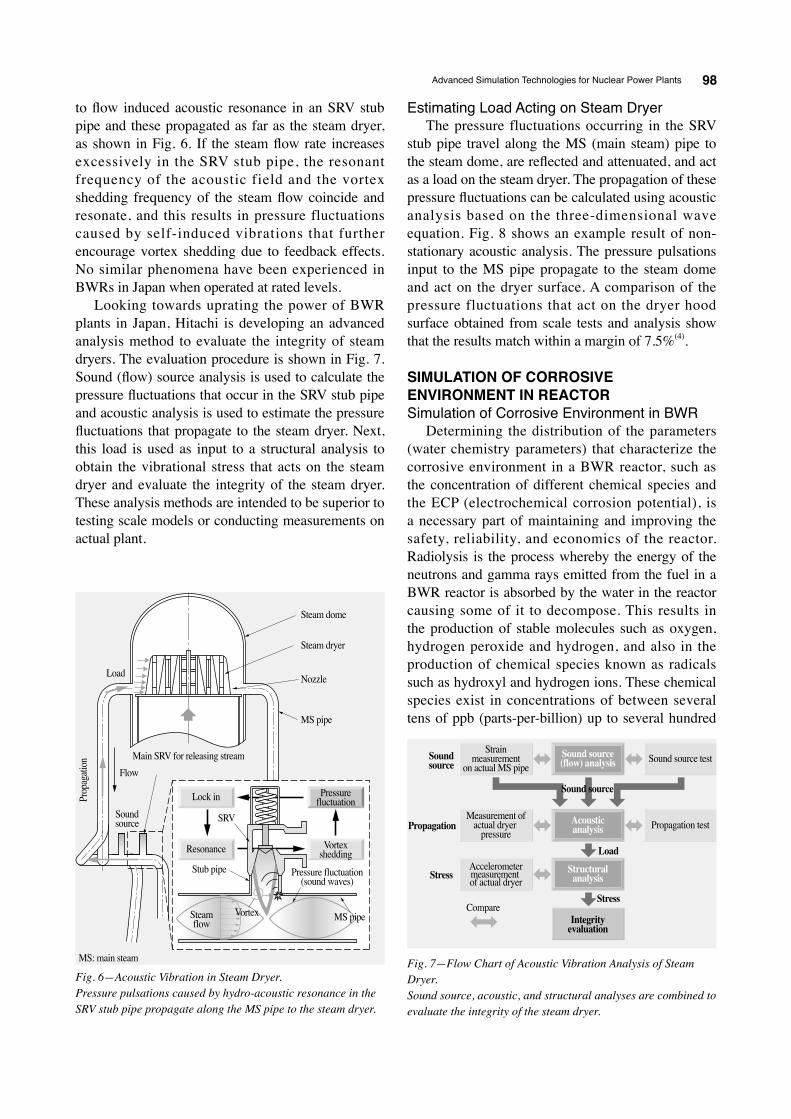
to flow induced acoustic resonance in an SRV stub pipe and these propagated as far as the steam dryer, as shown in Fig. 6. If the steam flow rate increases excessively in the SRV stub pipe, the resonant frequency of the acoustic field and the vortex shedding frequency of the steam flow coincide and resonate, and this results in pressure fluctuations caused by self-induced vibrations that further encourage vortex shedding due to feedback effects. No similar phenomena have been experienced in BWRs in Japan when operated at rated levels.
Looking towards uprating the power of BWR plants in Japan, Hitachi is developing an advanced analysis method to evaluate the integrity of steam dryers. The evaluation procedure is shown in Fig. 7. Sound (flow) source analysis is used to calculate the pressure fluctuations that occur in the SRV stub pipe and acoustic analysis is used to estimate the pressure fluctuations that propagate to the steam dryer. Next, this load is used as input to a structural analysis to obtain the vibrational stress that acts on the steam dryer and evaluate the integrity of the steam dryer. These analysis methods are intended to be superior to testing scale models or conducting measurements on actual plant.
Estimating Load Acting on Steam DryerThe pressure fluctuations occurring in the SRV
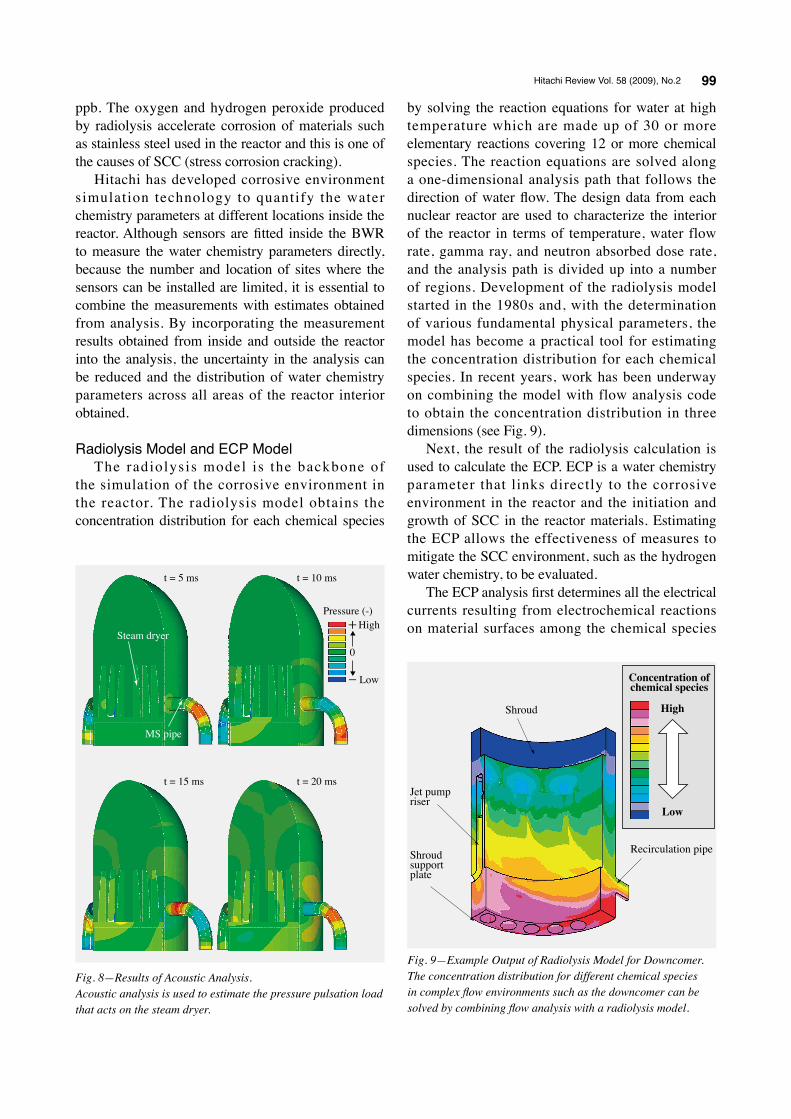
stub pipe travel along the MS (main steam) pipe to the steam dome, are reflected and attenuated, and act as a load on the steam dryer. The propagation of these pressure fluctuations can be calculated using acoustic analysis based on the three-dimensional wave equation. Fig. 8 shows an example result of non-stationary acoustic analysis. The pressure pulsations input to the MS pipe propagate to the steam dome and act on the dryer surface. A comparison of the pressure fluctuations that act on the dryer hood surface obtained from scale tests and analysis show that the results match within a margin of 7.5%(4).
SIMULATION OF CORROSIVE ENVIRONMENT IN REACTORSimulation of Corrosive Environment in BWR
Determining the distribution of the parameters (water chemistry parameters) that characterize the corrosive environment in a BWR reactor, such as the concentration of different chemical species and the ECP (electrochemical corrosion potential), is a necessary part of maintaining and improving the safety, reliability, and economics of the reactor. Radiolysis is the process whereby the energy of the neutrons and gamma rays emitted from the fuel in a BWR reactor is absorbed by the water in the reactor causing some of it to decompose. This results in the production of stable molecules such as oxygen, hydrogen peroxide and hydrogen, and also in the production of chemical species known as radicals such as hydroxyl and hydrogen ions. These chemical species exist in concentrations of between several tens of ppb (parts-per-billion) up to several hundred
MS: main steam
Lock in
Resonance
Pressurefluctuation
SRV
Stub pipe
Steamflow
Main SRV for releasing stream
MS pipe
Steam dryer
Steam dome
Nozzle
Soundsource
Flow
Load
Vortex
Pressure fluctuation(sound waves)
MS pipe
Vortexshedding
Prop
agati
on
Structuralanalysis
Integrityevaluation
Acousticanalysis
Sound source(flow) analysis
Sound source
Soundsource
Propagation
Stress
Load
Strainmeasurement
on actual MS pipeSound source test
Measurement ofactual dryer
pressurePropagation test
Accelerometermeasurement of actual dryer
StressCompare
Fig. 6—Acoustic Vibration in Steam Dryer.Pressure pulsations caused by hydro-acoustic resonance in the SRV stub pipe propagate along the MS pipe to the steam dryer.
Fig. 7—Flow Chart of Acoustic Vibration Analysis of Steam Dryer.Sound source, acoustic, and structural analyses are combined to evaluate the integrity of the steam dryer.
Hitachi Review Vol. 58 (2009), No.2 99
ppb. The oxygen and hydrogen peroxide produced by radiolysis accelerate corrosion of materials such as stainless steel used in the reactor and this is one of the causes of SCC (stress corrosion cracking).
Hitachi has developed corrosive environment simulation technology to quantify the water chemistry parameters at different locations inside the reactor. Although sensors are fitted inside the BWR to measure the water chemistry parameters directly, because the number and location of sites where the sensors can be installed are limited, it is essential to combine the measurements with estimates obtained from analysis. By incorporating the measurement results obtained from inside and outside the reactor into the analysis, the uncertainty in the analysis can be reduced and the distribution of water chemistry parameters across all areas of the reactor interior obtained.
Radiolysis Model and ECP ModelThe radiolysis model is the backbone of
the simulation of the corrosive environment in the reactor. The radiolysis model obtains the concentration distribution for each chemical species
by solving the reaction equations for water at high temperature which are made up of 30 or more elementary reactions covering 12 or more chemical species. The reaction equations are solved along a one-dimensional analysis path that follows the direction of water flow. The design data from each nuclear reactor are used to characterize the interior of the reactor in terms of temperature, water flow rate, gamma ray, and neutron absorbed dose rate, and the analysis path is divided up into a number of regions. Development of the radiolysis model started in the 1980s and, with the determination of various fundamental physical parameters, the model has become a practical tool for estimating the concentration distribution for each chemical species. In recent years, work has been underway on combining the model with flow analysis code to obtain the concentration distribution in three dimensions (see Fig. 9).
Next, the result of the radiolysis calculation is used to calculate the ECP. ECP is a water chemistry parameter that links directly to the corrosive environment in the reactor and the initiation and growth of SCC in the reactor materials. Estimating the ECP allows the effectiveness of measures to mitigate the SCC environment, such as the hydrogen water chemistry, to be evaluated.
The ECP analysis first determines all the electrical currents resulting from electrochemical reactions on material surfaces among the chemical species
Jet pumpriser
Shroudsupportplate
Shroud
Recirculation pipe
Low
High
Concentration ofchemical species
Fig. 9—Example Output of Radiolysis Model for Downcomer.The concentration distribution for different chemical species in complex flow environments such as the downcomer can be solved by combining flow analysis with a radiolysis model.
Pressure (-)
Steam dryer
t = 5 ms
MS pipe
t = 10 ms
t = 15 ms t = 20 ms
0
High
Low
Fig. 8—Results of Acoustic Analysis.Acoustic analysis is used to estimate the pressure pulsation load that acts on the steam dryer.
Advanced Simulation Technologies for Nuclear Power Plants 100
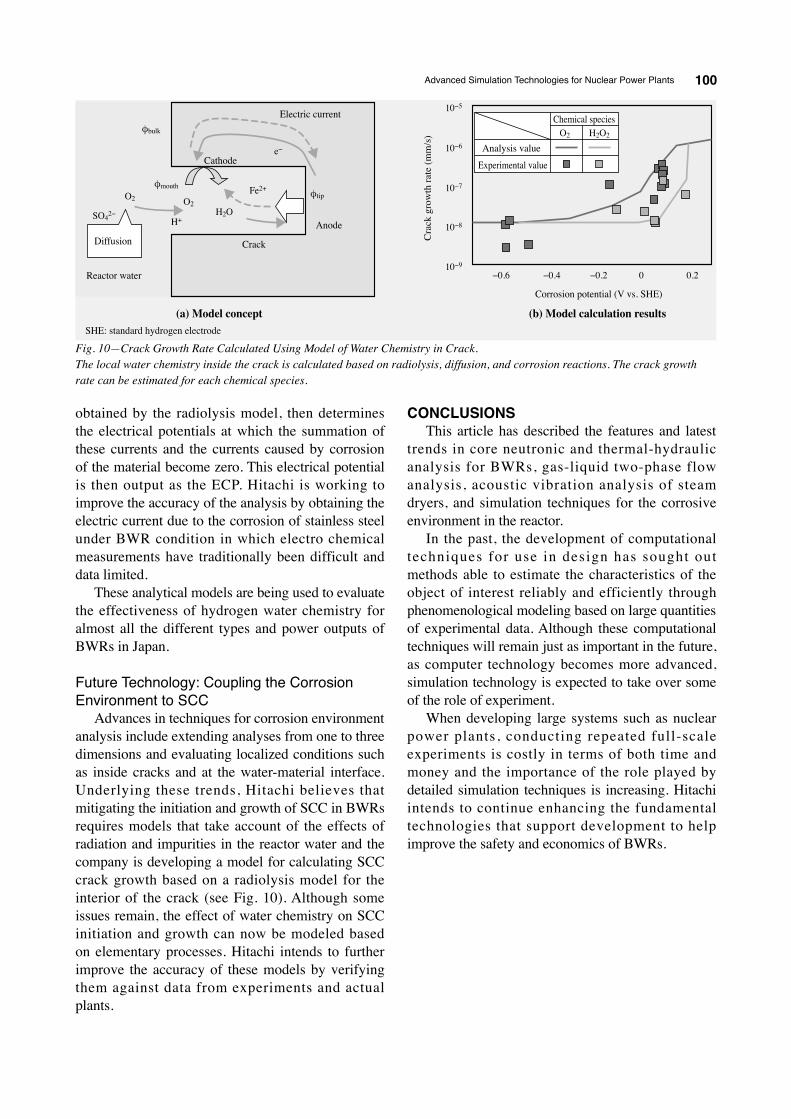
obtained by the radiolysis model, then determines the electrical potentials at which the summation of these currents and the currents caused by corrosion of the material become zero. This electrical potential is then output as the ECP. Hitachi is working to improve the accuracy of the analysis by obtaining the electric current due to the corrosion of stainless steel under BWR condition in which electro chemical measurements have traditionally been difficult and data limited.
These analytical models are being used to evaluate the effectiveness of hydrogen water chemistry for almost all the different types and power outputs of BWRs in Japan.
Future Technology: Coupling the Corrosion Environment to SCC
Advances in techniques for corrosion environment analysis include extending analyses from one to three dimensions and evaluating localized conditions such as inside cracks and at the water-material interface. Underlying these trends, Hitachi believes that mitigating the initiation and growth of SCC in BWRs requires models that take account of the effects of radiation and impurities in the reactor water and the company is developing a model for calculating SCC crack growth based on a radiolysis model for the interior of the crack (see Fig. 10). Although some issues remain, the effect of water chemistry on SCC initiation and growth can now be modeled based on elementary processes. Hitachi intends to further improve the accuracy of these models by verifying them against data from experiments and actual plants.
CONCLUSIONSThis article has described the features and latest
trends in core neutronic and thermal-hydraulic analysis for BWRs, gas-liquid two-phase flow analysis, acoustic vibration analysis of steam dryers, and simulation techniques for the corrosive environment in the reactor.
In the past, the development of computational techniques for use in design has sought out methods able to estimate the characteristics of the object of interest reliably and efficiently through phenomenological modeling based on large quantities of experimental data. Although these computational techniques will remain just as important in the future, as computer technology becomes more advanced, simulation technology is expected to take over some of the role of experiment.
When developing large systems such as nuclear power plants, conducting repeated full-scale experiments is costly in terms of both time and money and the importance of the role played by detailed simulation techniques is increasing. Hitachi intends to continue enhancing the fundamental technologies that support development to help improve the safety and economics of BWRs.
Crack
Corrosion potential (V vs. SHE)
Analysis value
Experimental value
Chemical species
Cra
ck g
row
th ra
te (m
m/s
)
−0.6 −0.4 −0.2 0 0.2
Diffusion
Reactor water
Anode
Cathode
Electric current
Fe2+
10−9
10−8
10−7
10−6
10−5
H+
e−
SO42−
φmouthφtip
φbulk
O2 O2H2O
H2O2O2
(a) Model concept (b) Model calculation resultsSHE: standard hydrogen electrode
Fig. 10—Crack Growth Rate Calculated Using Model of Water Chemistry in Crack.The local water chemistry inside the crack is calculated based on radiolysis, diffusion, and corrosion reactions. The crack growth rate can be estimated for each chemical species.

Hitachi Review Vol. 58 (2009), No.2 101
ABOUT THE AUTHORS
Shiro Takahashi, Dr. Eng.Joined Hitachi, Ltd. in 1992, and now works at the Advanced Reactor System Group, Nuclear Energy System Project, Energy and Environmental Laboratory. He is currently engaged in the development of reactor internals in BWRs. Dr. Takahashi is a member of JSME and the AESJ.
Naoshi TanikawaJoined Hitachi, Ltd. in 1981, and now works at the Nuclear Business Planning & Managemet Division, Hitachi-GE Nuclear Energy, Ltd. He is currently engaged in work relating to technology for nuclear reactors. Mr. Tanikawa is a member of the AESJ.
Kazuya IshiiJoined Hitachi, Ltd. in 1986, and now works at the Advanced Reactor Systems Group, Nuclear Energy Systems Project, Energy and Environmental Systems Laboratory. He is currently engaged in the development of core analysis methods. Mr. Ishii is a member of The Physical Society of Japan and the Atomic Energy Society of Japan (AESJ).
Takuji NagayoshiJoined Hitachi, Ltd. in 1991, and now works at the Two-Phase Flow Group, Nuclear Energy Systems Project, Energy and Environmental Systems Laboratory. He is currently engaged in the development of two-phase flow equipment for nuclear power plants. Mr. Nagayoshi is a member of the AESJ, The Japan Society of Mechanical Engineers (JSME), and the Turbomachinery Society of Japan.
Yoichi Wada, Dr. Eng.Joined Hitachi, Ltd. in 1991, and now works at the Chemical System Group, Nuclear Inspection & Maintenance Project, Energy and Environmental Systems Laboratory. He is currently engaged in the control of BWR water chemistry in order to mitigate stress corrosion cracking and reduce radiation exposure. Dr. Wada is a member of the AESJ and The Chemical Society of Japan.
REFERENCES(1) T. Hino et al., “Development of Core Analysis Method
Using Three-dimensional Direct Response Matrix,” Proc. of PHYSOR’08, Paper# 657 (2008).
(2) A. Minato et al., “Numerical Simulation Method of Complex 3D Gas-Liquid Two-Phase Flow,” Proc. of the 5th International Conference on Multiphase Flow (2004).
(3) K. Katono et al., “Three-Dimensional Compressible Two-Fluid Model and Its Application,” Proc. of the 13th International Conference on Nuclear Engineering (2005).
(4) S. Takahashi et al., “Experimental Study of Acoustic and Flow-Induced Vibration of Main Steam Lines and Dryer in BWRs,” ASME PVP2008-61318 (2008).
(5) Y. Wada et al., “Model Calculation of Crack Growth Rate Coupled to Crevice Chemistry for BWR Plant Life Management,” 13th International Conference on Degradation of Materials in Nuclear Power System, Paper# 96, CNS (2007).