Embed Size (px)
Citation preview
O n a chart, price movesalong a path relative totime. In other words, ithas velocity, which is
defined as the change of position perunit of time. If a stock moves sideways,the velocity is low and there are no realtrading opportunities. However, ifvelocity begins to rise, an opportunitymay occur.
There are a number of ways to meas-ure velocity. The simplest measurementis the difference between the currentprice and the price x bars ago. However,t h e re is always a large amount of“noise” (i.e., irrelevant fluctuations) in
36 www.activetradermag.com • July 2003 • ACTIVE TRADER
THE VELOCITY SYSTEMThe rate of price
movement in a stock can
be thought of as
“ v e l o c i t y.” Increasing
positive velocity sets up
long trades, while
growing negative velocity
sets up short trades.
To filter out noise and
decrease whipsaws, you
can use a least-squares
trendline to measure
velocity and determine
entry points.
BY DENNIS MEYERS, PH.D.
QQQ five-minute bars Oct. 9 – Nov. 8, 2002
Performance summary: All trades
Total net profit $4,400.00 Open position P/L $0.00Gross profit $8,150.00 Gross loss ($3,750.00)
Total # of trades 42 Percent profitable 59.52%Number winning trades 25 Number losing trades 17
Largest winning trade $1,140.00 Largest losing trade ($530.00)Average winning trade $326.00 Average losing trade ($220.59)Ratio avg. win/avg. loss 1.48 Avg. trade (win & loss) $104.76
Max. consec. winners 6 Max. consec. losers 3Avg. # bars in winners 46 Avg. # bars in losers 27
Max. intraday drawdown ($1,450.00)Profit factor 2.17 Max. # contracts held 1
Performance summary: Long trades
Total net profit $4,320.00 Open position P/L $0.00Gross profit $6,560.00 Gross loss ($2,240.00)
Total # of trades 28 Percent profitable 60.71%Number winning trades 17 Number losing trades 11
Largest winning trade $1,140.00 Largest losing trade ($510.00)Average winning trade $385.88 Average losing trade ($203.64)Ratio avg. win/avg. loss 1.89 Avg. trade (win & loss) $154.29
Max. consec. winners 5 Max. consec. losers 2Avg. # bars in winners 56 Avg. # bars in losers 37
Max. intraday drawdown ($780.00)Profit factor 2.93 Max. # contracts held 1
Performance summary: Short trades
Total net profit $80.00 Open position P/L $0.00Gross profit $1,590.00 Gross loss ($1,510.00)
Total # of trades 14 Percent profitable 57.14%Number winning trades 8 Number losing trades 6
Largest winning trade $380.00 Largest losing trade ($530.00)Average winning trade $198.75 Average losing trade ($251.67)Ratio avg. win/avg. loss .79 Avg. trade (win & loss) $5.71
Max. consec. winners 3 Max. consec. losers 3Avg. # bars in winners 24 Avg. # bars in losers 9
Max. intraday drawdown ($1,170.00)Profit factor 1.05 Max. # contracts held 1
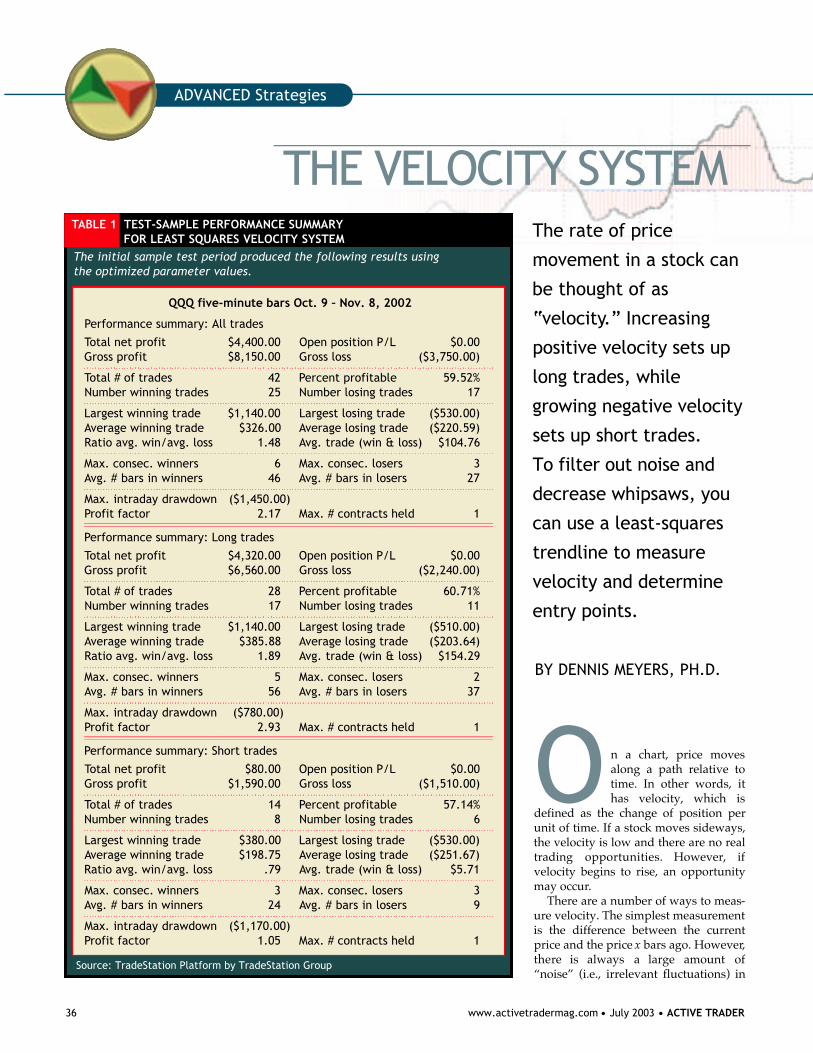
The initial sample test period produced the following results using the optimized parameter values.
TABLE 1 TEST-SAMPLE PERFORMANCE SUMMARYFOR LEAST SQUARES VELOCITY SYSTEM
Source: TradeStation Platform by TradeStation Group
ADVANCED Strategies
ACTIVE TRADER • July 2003 • www.activetradermag.com 37
price movement, which creates falsebuy and sell signals for many tradingsystems.
To better capture meaningful pricemovement, we will use another tech-nique to measure velocity: monitoringthe slope of a best-fit (or “least-squares”) trendline. The change in theslope will indicate the price velocity.The least-squares velocity acts as aprice noise inhibitor or filter that identi-fies the underlying trend and its veloci-ty. As a result, it’s logical to create a sys-tem that requires the velocity be greaterthan some threshold before buying orselling. (For more information on calcu-lating a least-squares line, see “Theleast-squares line,” p. 38.)
The resulting Least-Squares Velocity(LSV)system is a cousin of the Next BarForecast (NBF) system described in theMay 2003 issue of Active Trader (p. 46).Like the NBF, the LSV system will betested on five-minute bars of theNasdaq 100 index-tracking stock(QQQ). The results of the LSV test willbe compared to those of the NBF andthe Maximum Likelihood Range sys-tem (MLR), presented in “Range rov-ing,” Active Trader, March 2003, p. 58.
Building a velocity systemThe slope (m) of a straight line can alsobe called velocity. Recall that velocity isdefined as the position change per timeunit. Using the formula for a straightline provided in “The least-square sline,” velocity would be defined as:
Velocity = [b+m*(x+1)] – [b+m*x] = m
The least-squares velocity will be cal-culated at each bar. When velocity ispositive and high, it indicates upwardmomentum and a long-trade opportu-nity; reverse the scenario for negative
continued on p. 39
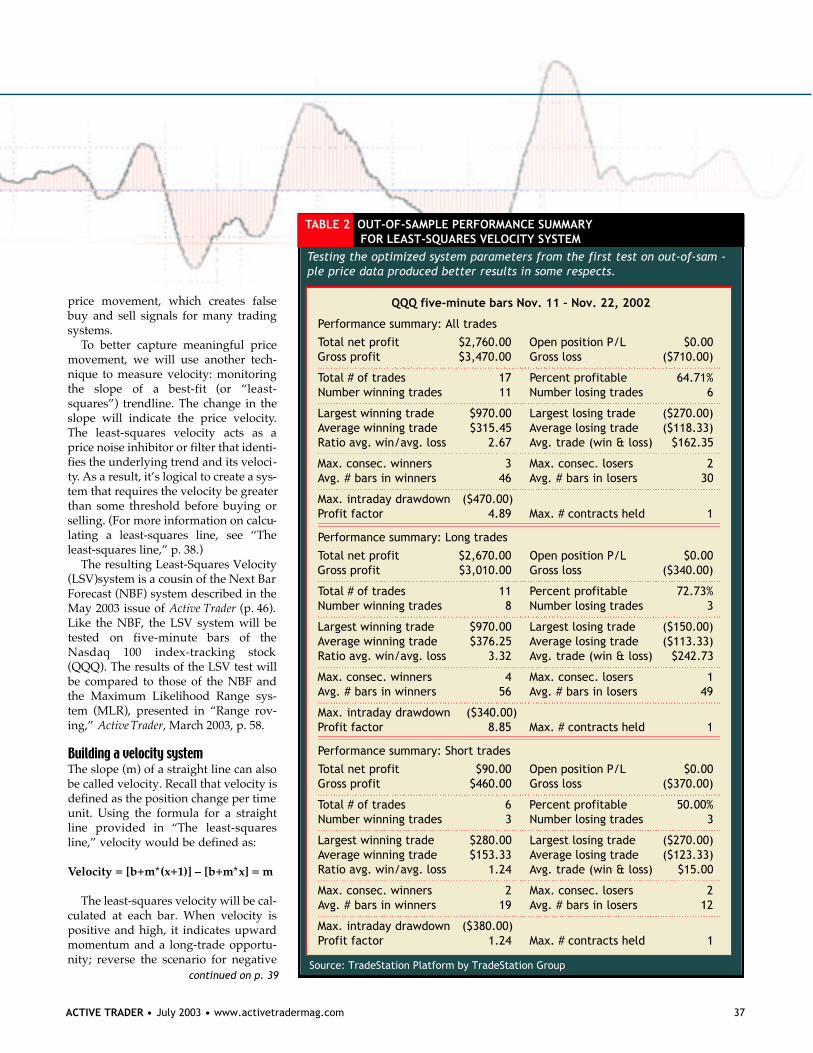
QQQ five-minute bars Nov. 11 – Nov. 22, 2002
Performance summary: All trades
Total net profit $2,760.00 Open position P/L $0.00Gross profit $3,470.00 Gross loss ($710.00)
Total # of trades 17 Percent profitable 64.71%Number winning trades 11 Number losing trades 6
Largest winning trade $970.00 Largest losing trade ($270.00)Average winning trade $315.45 Average losing trade ($118.33)Ratio avg. win/avg. loss 2.67 Avg. trade (win & loss) $162.35
Max. consec. winners 3 Max. consec. losers 2Avg. # bars in winners 46 Avg. # bars in losers 30
Max. intraday drawdown ($470.00)Profit factor 4.89 Max. # contracts held 1
Performance summary: Long trades
Total net profit $2,670.00 Open position P/L $0.00Gross profit $3,010.00 Gross loss ($340.00)
Total # of trades 11 Percent profitable 72.73%Number winning trades 8 Number losing trades 3
Largest winning trade $970.00 Largest losing trade ($150.00)Average winning trade $376.25 Average losing trade ($113.33)Ratio avg. win/avg. loss 3.32 Avg. trade (win & loss) $242.73
Max. consec. winners 4 Max. consec. losers 1Avg. # bars in winners 56 Avg. # bars in losers 49
Max. intraday drawdown ($340.00)Profit factor 8.85 Max. # contracts held 1
Performance summary: Short trades
Total net profit $90.00 Open position P/L $0.00Gross profit $460.00 Gross loss ($370.00)
Total # of trades 6 Percent profitable 50.00%Number winning trades 3 Number losing trades 3
Largest winning trade $280.00 Largest losing trade ($270.00)Average winning trade $153.33 Average losing trade ($123.33)Ratio avg. win/avg. loss 1.24 Avg. trade (win & loss) $15.00
Max. consec. winners 2 Max. consec. losers 2Avg. # bars in winners 19 Avg. # bars in losers 12
Max. intraday drawdown ($380.00)Profit factor 1.24 Max. # contracts held 1
Testing the optimized system parameters from the first test on out-of-sam -ple price data produced better results in some respects.
TABLE 2 OUT-OF-SAMPLE PERFORMANCE SUMMARYFOR LEAST-SQUARES VELOCITY SYSTEM
Source: TradeStation Platform by TradeStation Group

38 www.activetradermag.com • July 2003 • ACTIVE TRADER
L inear regression is a way to calculate a straightline that best fits a series of data points — thatis, a line that most accurately reflects the slope,
or trend, of that data. In terms of price analysis, a linearregression line is used to determine the trend of closingprices over a given time period. Because it is mathemat-ically derived, a regression line, or “best-fit” line, is notbased on subjective, visual analysis, as are standardtrendlines.
Figure 1 (right) shows a group of five closing prices on aprice chart. A straight line that goes through the “middle”of those five prices — a line for which the differencebetween it and each of the zigzagging prices is as small aspossible — is a regression line.
C a l c u l a t i o nA regression line is calculated using the “least-squares”method, which refers to finding the minimum squared(x*x, or x2) differences between price points and astraight line. For example, if two closing prices are 2 and3 points away (the distance being calculated vertically)from a straight line, the squared differences between thepoints and the line are 4 and 9, respectively.
Why are the squared differences used, instead of justthe differences? Figure 1 shows that some differencesare negative (for points below the line) and others arepositive (for points above the line). This makes it neces-sary to square all the differences, creating all positivevalues and making it possible to calculate a formula forthe straight line.
The best-fit line is the line for which the sum of thesquared differences between each price and the straightline are minimized.
The formula for a straight line (y) is:y = b + m*xwhere
x = the “time” of the price (the x-axis value)b = the initial value of the line when “x” is equal to
zero (the “intercept” value — i.e., the point at which theline intercepts the vertical axis);
m = the slope of the line, which is the rate at which theline rises or falls. In other words, b is how much y changesfor a one-unit change in x (e.g., .75 points per day).
As prices change, the slope of the line also changes.When a market is rising sharply the slope (b) has a highvalue and the line will be steep. As the market slowsdown, the slope value decreases and the line will slopeupward more gently.
When calculating a straight line to N prices, the “best-fit” coefficients b and m can be solved for by:
N Nb = [(4N+2)/(N2-N)] ∑p(x) + [6/(N2-N)] ∑x*p(x)
x=1 x=1
N Nm = [12/(N3–N)] ∑x*p(x) – [6/(N2-N)]∑p(x)
x=1 x=1
where p(x) is the price at point x. N is the number of prices used to calculate the coeffi-
cients — e.g., N = 5 for a five-day regression calculation.In this case, the first day p(1) in the price series is 1 andthe last price p(N) in the series is 5.
is the sum of the prices for p(1) through p(N).For example, if N = 5 and the prices for days 1
and 2 are 10, 11, 12, 13 and 14, respectively, the sum is60.
is the sum of the products of time (x) andprice (p). For example, the products of theprices used in the previous calculation are 10
(1*10), 22 (2*11), 36 (3*12), 52 (4*13) and 70 (5*14), andthe sum of those products is 190.
Figure 2 (right) shows the calculations and chart of threefive-day regression lines calculated at different points overa 10-day period: Line A covers days 1 through 5; line B rep-resents days 4 through 8; and line C is days 6 through 10.The linear regression estimates for the slopes (b) andintercept values (a) are listed in the third and fourthcolumns. The values for each of the five points that makeup regression lines A, B and C are in the final three columns
The slope for line A (days 1-5), which accompanies anupward trend, is 0.60. Price continued to rally higher indays 6 through 8, but at a slower rate, which resulted ina slope of .43 for line B. For line C, when price movedsideways to lower, the slope was -0.07.
Least-squares line
Nx*p(x)
x=1
Np(x)
x=1

velocity and short trades. One of thegoals, therefore, is determining whatconstitutes strong upward and down-ward velocity.
Using this basic velocity principle,when velocity exceeds a certain thresh-old (to be determined later thro u g hoptimization), we will go long. Whenvelocity is less than a certain threshold,we will go short. These are the rules:
1. Buy rule: If velocity is greater thanthe threshold amount vup, buy QQQ atthe market.
2. Sell rule: If velocity is less than thethreshold amount -vdn, sell QQQ at themarket.
3. Intraday bars exit rule: Close theposition five minutes before the close(no trades are carried overnight).
4. Intraday bars first trade of dayentry rule: I g n o re all trade signalsbefore 10 a.m. ET (30 minutes after theopen). Opening gaps that create triggertrades are often closed quickly, creatinglosing whipsaw trades. This rule isdesigned to avoid the problem.
Testing the systemWe will use historical testing to deter-mine the “best” systems parameters,which are defined as the values thatproduce the highest average per-tradenet profit and the highest total winningbars to total losing bars ratio, with thesmallest drawdown, largest losing tradevalue and no more than four losses in arow (because of the psychological diffi-culty of trading a system that producesmore consecutive losers than this).
In addition, these parameters shouldproduce stable results, which means theprofit, winning percentage and draw-down figures should not change bymuch as the parameters are adjusted asmall amount either way.
A “walk-forward” optimization testwas used consisting of an initial test ona “sample” data set (used to determine
ACTIVE TRADER • July 2003 • www.activetradermag.com 39
continued on p. 40
1 2 3 4 5
20
18
16
14
12
10
8
A regression or “best-fit” line is calculated to minimize the difference between price points and the line. In doing so, the lineapproximates the slope (trend) of the prices.
FIGURE 1 FITTING A STRAIGHT LINE TO PRICES
Price
Straight line
Differences
Y=22.28+0.43*X
Price
A
B C
Y=24.02-0.07*X
Y=19.90+0.60*X
1 2 3 4 5 6 7 8 9 10
25.0024.5024.0023.5023.0022.5022.0021.5021.0020.5020.00
The following calculations resulted in the three different five-dayregression lines on the chart below.
FIGURE 2 REGRESSION LINES
D a y P r i c e Slope (m) Intercept (b) Line A Line B Line C
1 2 1 . 2 5 2 0 . 5 0
2 2 0 . 5 0 2 1 . 1 0
3 2 1 . 0 0 2 1 . 7 0
4 2 2 . 5 0 2 2 . 3 0 2 2 . 7 1
5 2 3 . 2 5 0 . 6 0 1 9 . 9 0 2 2 . 9 0 2 3 . 1 4
6 2 4 . 2 0 2 3 . 5 7 2 3 . 9 5
7 2 3 . 2 5 2 4 . 0 0 2 3 . 8 9
8 2 4 . 6 6 0 . 4 3 2 2 . 2 8 2 4 . 4 4 2 3 . 8 2
9 2 3 . 0 0 2 3 . 7 6
1 0 2 4 . 0 0 - 0 . 0 7 2 4 . 0 2 2 3 . 6 9

the optimal system values — i.e., the“best” parameters — for that period)and a second test on an “out-of-sample”data set using the optimal parameters,which will allow us to verify their value.The sample data period consisted of onemonth of five-minute QQQ bars (Oct. 9to Nov. 8, 2002), and the out-of-sampledata was two weeks of five-minute QQQbars (Nov. 11 to Nov. 22, 2002).
The sample portion of such a test islikely to produce favorable results, butthis does not mean the system will per-form well in real trading. Only success-ful performance on out-of-sample datacan provide any indication a system willwork in the future.
There are three system parameters todetermine in the optimization:
1. Len, the lookback period to calculatevelocity;
2. vup, the threshold amount velocityhas to be greater than to issue a buy sig-nal; and
3. vdn, the threshold amount velocityhas to be less than to issue a sell signal.
The optimal system parametersderived from the initial sample-test dataare shown below:
Start End Len vup vdndate date
10/9/02 11/8/02 16 0.001 0.023
Table 1 (p. 36) shows the performancesummary of the sample test segment.
These parameters were then tested onthe out-of-sample data to simulate theexperience of trading in real-time onnew price data. Table 2 (p. 37) shows theperformance summary of the out-of-sample test. Slippage and commissionsare not included in any of the test results.
Live vs. MemorexAs it turned out, a comparison of Tables1 and 2 shows the out-of-sample resultswere better than the in-sample results.The average win/loss ratio, drawdownand profit factor were all better in the
Trades from the out-of-sample test are shown along with the bar-by-bar prof -it or loss (below the price series). Overall, the system was effective at catch -ing intraday trends during this period.
FIGURE 1 QQQ FIVE-MINUTE BARS LEAST-SQUARES VELOCITY SYSTEM
Nasdaq 100 index-tracking stock (QQQ), five-minute
VelocityBuy Buy
Buy Buy
SellBuySell
Sell
ExitExit
Exit
2 6 . 2 0
2 6 . 0 0
2 5 . 8 0
2 5 . 6 0
2 5 . 4 0
2 5 . 2 0
2 5 . 0 0
2 4 . 8 0
2 4 . 6 0
2 4 . 4 0
2 4 . 2 0
0 . 0 6 0
0 . 0 4 0
0 . 0 2 0
0 . 0 0 0
- 0 . 0 2 0
- 0 . 0 4 011/11 11:30 13:05 11/12 11:05 12:40 1 1 / 1 3 10:40 12:15 11/14 10:15 11:50
Nasdaq 100 index-tracking stock (QQQ),five-minute
VelocityBuyBuy
Exit
Buy
Buy
Sell
Short
Exit
Exit
Exit2 7 . 0 0
2 6 . 8 0
2 6 . 6 0
2 6 . 4 0
2 6 . 2 0
2 6 . 0 0
2 5 . 8 0
2 5 . 6 0
2 5 . 4 0
0 . 0 6 0
0 . 0 4 0
0 . 0 2 0
0 . 0 0 0
- 0 . 0 2 0- 0 . 0 4 0
10:35 12:10 13.:45 11/20 10:10 11:45 13:20 1 1 / 2 1 11:20 12:55 11/22 10:55 12:30
Nasdaq 100 index-tracking stock (QQQ), five-minute
Buy
Buy
Buy
Buy
Sell Sell
Sell
Exit
Exit
Exit
2 6 . 8 0
2 6 . 6 0
2 6 . 4 0
2 6 . 2 0
2 6 . 0 0
2 5 . 8 0
2 5 . 6 0
2 5 . 4 0
2 5 . 2 0
0 . 0 6 0
0 . 0 4 0
0 . 0 2 0
0 . 0 0 0
- 0 . 0 2 0
- 0 . 0 4 0
11/14 11:50 13:25 11/15 11:25 13:00 1 1 / 1 8 11:00 12:35 11/19 10:35 12:10
Velocity
Source: TradeStation Platform by TradeStation Group
ACTIVE TRADER • July 2003 • www.activetradermag.com 41
out-of-sample data. However, there was a more trending
price action in the out-of-sample period,and much of the superior performancecan likely be attributed to that.Specifically, Table 2 shows the systemdid much better on long trades thanshort trades, the result of a long uptrendin the out-of-sample period.
The average trade (on 1,000 shares ofQQQ) resulted in a $105 profit in the testsection and $162 in the out-of-samplesection. The profit factor in the out-of-sample section was twice as high as thecomparable figure in the test section.Also, during every up day from Nov. 11to Nov. 22, the system remained in onelong trade all day, showing the systemwas able to avoid getting knocked outof the market and having to re-enter,resulting in whipsaw losses. Also, thesystem produced no big winners or biglosers, which means the system did notrely on a few exceptional trades that arenot representative of the system’s basiccharacteristics.
F i g u res 1a-1c (opposite page) arefive-minute price charts of QQQ fromNov. 11 to Nov. 22 (the out-of-sampleperiod). The Least-Squares Ve l o c i t yindicator is plotted along with price.(The buy and sell signals can be viewedas part of the trade-by-trade summaryof the out-of-sample trades in the WebExtra for this article at www.activetra-dermag.com from June 10 to June 30.)These charts show the system producedsteady returns, which is all anyone canask of a trading system.
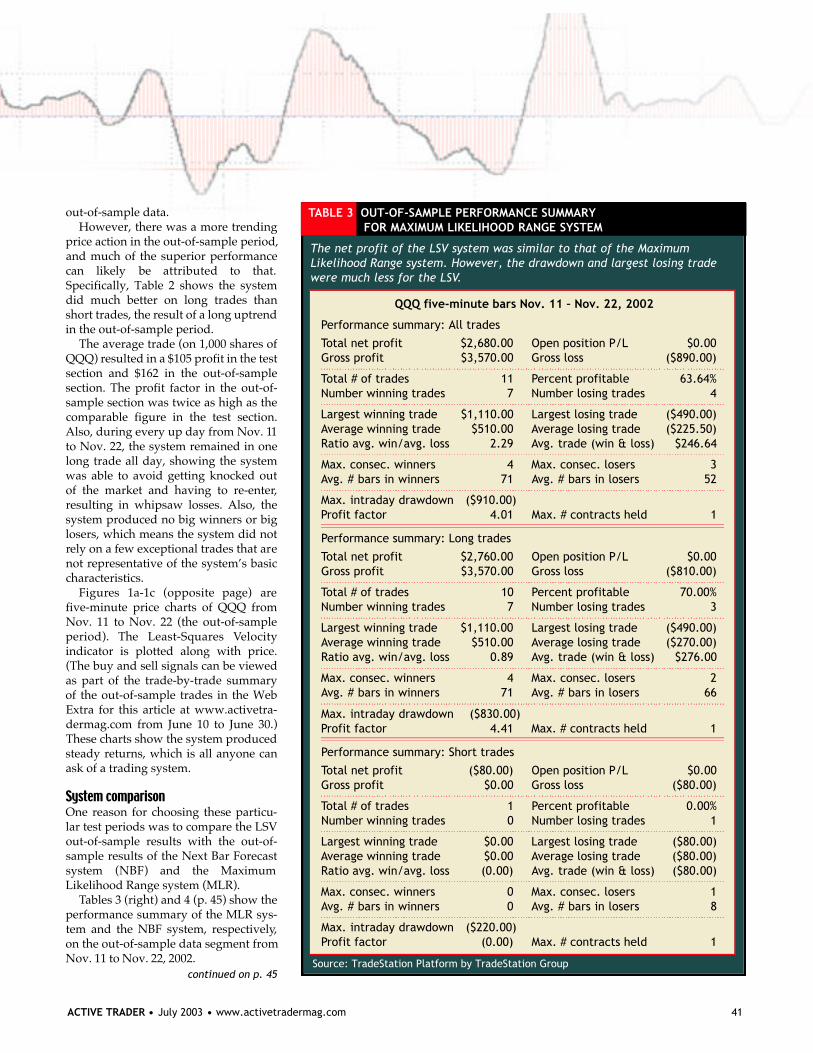
System comparisonOne reason for choosing these particu-lar test periods was to compare the LSVout-of-sample results with the out-of-sample results of the Next Bar Forecastsystem (NBF) and the MaximumLikelihood Range system (MLR).
Tables 3 (right) and 4 (p. 45) show theperformance summary of the MLR sys-tem and the NBF system, respectively,on the out-of-sample data segment fromNov. 11 to Nov. 22, 2002.
QQQ five-minute bars Nov. 11 – Nov. 22, 2002
Performance summary: All trades
Total net profit $2,680.00 Open position P/L $0.00Gross profit $3,570.00 Gross loss ($890.00)
Total # of trades 11 Percent profitable 63.64%Number winning trades 7 Number losing trades 4
Largest winning trade $1,110.00 Largest losing trade ($490.00)Average winning trade $510.00 Average losing trade ($225.50)Ratio avg. win/avg. loss 2.29 Avg. trade (win & loss) $246.64
Max. consec. winners 4 Max. consec. losers 3Avg. # bars in winners 71 Avg. # bars in losers 52
Max. intraday drawdown ($910.00)Profit factor 4.01 Max. # contracts held 1
Performance summary: Long trades
Total net profit $2,760.00 Open position P/L $0.00Gross profit $3,570.00 Gross loss ($810.00)
Total # of trades 10 Percent profitable 70.00%Number winning trades 7 Number losing trades 3
Largest winning trade $1,110.00 Largest losing trade ($490.00)Average winning trade $510.00 Average losing trade ($270.00)Ratio avg. win/avg. loss 0.89 Avg. trade (win & loss) $276.00
Max. consec. winners 4 Max. consec. losers 2Avg. # bars in winners 71 Avg. # bars in losers 66
Max. intraday drawdown ($830.00)Profit factor 4.41 Max. # contracts held 1
Performance summary: Short trades
Total net profit ($80.00) Open position P/L $0.00Gross profit $0.00 Gross loss ($80.00)
Total # of trades 1 Percent profitable 0.00%Number winning trades 0 Number losing trades 1
Largest winning trade $0.00 Largest losing trade ($80.00)Average winning trade $0.00 Average losing trade ($80.00)Ratio avg. win/avg. loss (0.00) Avg. trade (win & loss) ($80.00)
Max. consec. winners 0 Max. consec. losers 1Avg. # bars in winners 0 Avg. # bars in losers 8
Max. intraday drawdown ($220.00)Profit factor (0.00) Max. # contracts held 1
The net profit of the LSV system was similar to that of the MaximumLikelihood Range system. However, the drawdown and largest losing tradewere much less for the LSV.
TABLE 3 OUT-OF-SAMPLE PERFORMANCE SUMMARYFOR MAXIMUM LIKELIHOOD RANGE SYSTEM
Source: TradeStation Platform by TradeStation Groupcontinued on p. 45

The LSV system produced an out-of-sample net profit of $2,760, while theMLR produced a net profit of $2,680.However, the LSV’s slightly higher netprofits were produced with about 50percent more trades. The LSV systemhad a per-trade net profit of $162 com-pared to the MLR system’s $243.
If $50 for slippage and commissionwere subtracted from each system foreach trade, the total net profits of eachsystem would still be approximately thesame. However, in looking at the out-of-sample drawdowns and largest losingtrades, the LSV system has a clearadvantage. In both cases, the MLR fig-ures are almost twice those of the LSV.
In comparison with the NBF system,the LSV system produced a net profit of$470 less than the NBF ($2,760 vs.$3,230). The NBF’s higher profits wereproduced with more trades. The LSVsystem had an average profit-per-tradeof $162; the average profit-per-trade forthe MLR system was $134. Again, sub-tracting $50 for slippage and commis-sion per trade would make these figuresmuch closer.
Looking at the out-of-sample draw-downs and largest losing trades of eachsystem, the NBF has a clear advantage.Its results in those categories are half ofwhat the LSV system produced. In addi-tion, the NBF system was able to gener-ate short trade profits while LSV systemwas only minimally effective in thisregard and the MLR lost money on theshort side.
Overall, the NBF system performedmuch better on the out-of-sample datathan the Maximum Likelihood Range sys-tem or the Least-Square Velocity system.
At least 20 more tests on diff e rent setsof sample and out-of-sample data wouldbe necessary to confirm the viability ofthe results shown here. Both test periodsw e re dominated by uptrending condi-tions; down markets have diff e rent intra-day characteristics that could significant-ly affect system performance. Ý
For information on the author see p. 10.
ACTIVE TRADER • July 2003 • www.activetradermag.com 45
QQQ five-minute bars Nov. 11 – Nov. 22, 2002
Performance summary: All trades
Total net profit $3,230.00 Open position P/L $0.00Gross profit $4,160.00 Gross loss ($930.00)
Total # of trades 24 Percent profitable 58.33%Number winning trades 14 Number losing trades 10
Largest winning trade $970.00 Largest losing trade ($190.00)Average winning trade $297.14 Average losing trade ($93.00)Ratio avg. win/avg. loss 3.20 Avg. trade (win & loss) $134.58
Max. consec. winners 7 Max. consec. losers 3Avg. # bars in winners 39 Avg. # bars in losers 17
Max. intraday drawdown ($420.00)Profit factor 4.47 Max. # contracts held 1
Performance summary: Long trades
Total net profit $2,860.00 Open position P/L $0.00Gross profit $3,400.00 Gross loss ($540.00)
Total # of trades 15 Percent profitable 60.00%Number winning trades 9 Number losing trades 6
Largest winning trade $970.00 Largest losing trade ($190.00)Average winning trade $377.78 Average losing trade ($90.00)Ratio avg. win/avg. loss 4.20 Avg. trade (win & loss) $190.64
Max. consec. winners 5 Max. consec. losers 3Avg. # bars in winners 51 Avg. # bars in losers 24
Max. intraday drawdown ($380.00)Profit factor 6.30 Max. # contracts held 1
Performance summary: Short trades
Total net profit ($370.00) Open position P/L $0.00Gross profit $760.00 Gross loss ($390.00)
Total # of trades 9 Percent profitable 55.56%Number winning trades 5 Number losing trades 4
Largest winning trade $240.00 Largest losing trade ($140.00)Average winning trade $152.00 Average losing trade ($97.50)Ratio avg. win/avg. loss 1.56 Avg. trade (win & loss) ($41.11)
Max. consec. winners 2 Max. consec. losers 1Avg. # bars in winners 18 Avg. # bars in losers 6
Max. intraday drawdown ($230.00)Profit factor 1.95 Max. # contracts held 1
Overall, the Next Bar Forecast system did a better job of trading the QQQsthan the LSV system.
TABLE 4 OUT-OF-SAMPLE PERFORMANCE SUMMARYFOR NEXT BAR FORECAST SYSTEM
Source: TradeStation Platform by TradeStation Group
Advanced Strategiescontinued from p. 41