Embed Size (px)
Citation preview

NTNU - Norwegian University of Science and TechnologyDep. Hydraulic and Environmental Engineering
Prof. Hallvard Ødegaard
NTNU/XUAT Postgraduate course 21.05.02-31.05.02: Wastewater as a resource
ADVANCEMENTS IN PHYSICAL/CHEMICAL TREATMENT
Hallvard Ødegaard

NTNU - Norwegian University of Science and TechnologyDep. Hydraulic and Environmental Engineering
Prof. Hallvard Ødegaard
CHALLENGES IN THE USE OFCOAGULATION OF WASTEWATER
• MINIMISATION OF SLUDGE PRODUCTION
• MINIMISATION OF SPACE REQUIREMENT• Flocculation• Floc separation
• REMOVAL OF SOLUBLE (ORGANIC) MATTER
• PRODUCTION OF CARBON SOURCE IF NITROGENREMOVAL IS TO BE ACHIEVED
NTNU - Norwegian University of Science and TechnologyDep. Hydraulic and Environmental Engineering
Prof. Hallvard Ødegaard
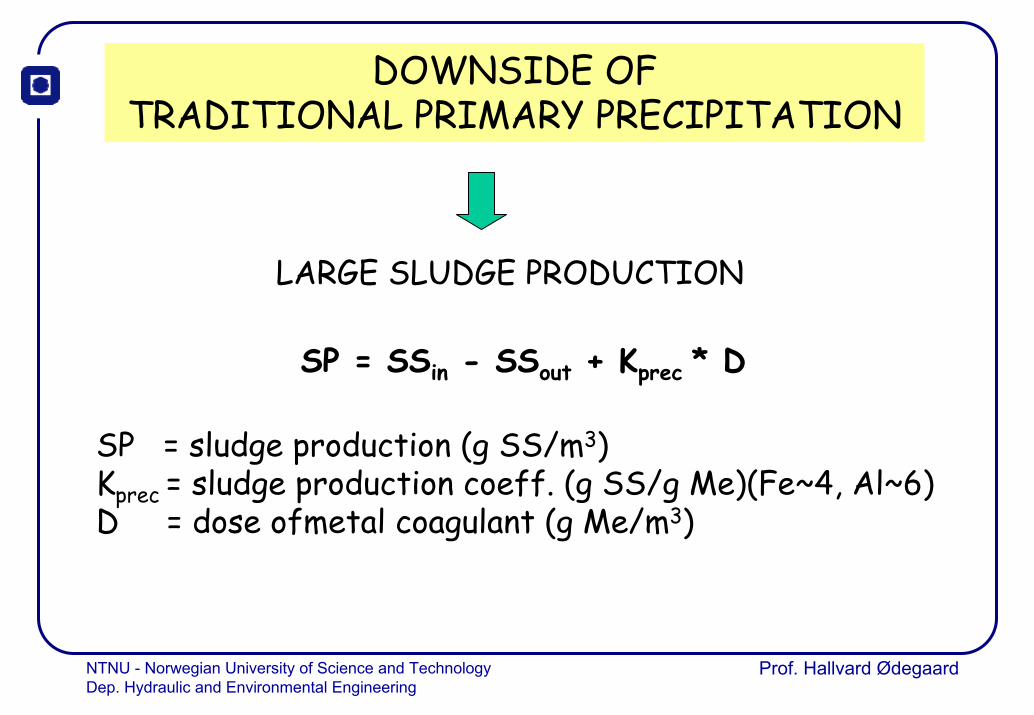
DOWNSIDE OF TRADITIONAL PRIMARY PRECIPITATION
LARGE SLUDGE PRODUCTION
SP = SSin - SSout + Kprec * D
SP = sludge production (g SS/m3)Kprec = sludge production coeff. (g SS/g Me)(Fe~4, Al~6)D = dose ofmetal coagulant (g Me/m3)

NTNU - Norwegian University of Science and TechnologyDep. Hydraulic and Environmental Engineering
Prof. Hallvard Ødegaard
EVALUATION OF SLUDGE PRODUCTION
SP = SSin - SSout + Kprec.* D
SP SSprod Kprec.= = 1 + * D
SSin-SSout SSrem SSrem
When D 0
SSprod.1
SSrem

NTNU - Norwegian University of Science and TechnologyDep. Hydraulic and Environmental Engineering
Prof. Hallvard Ødegaard
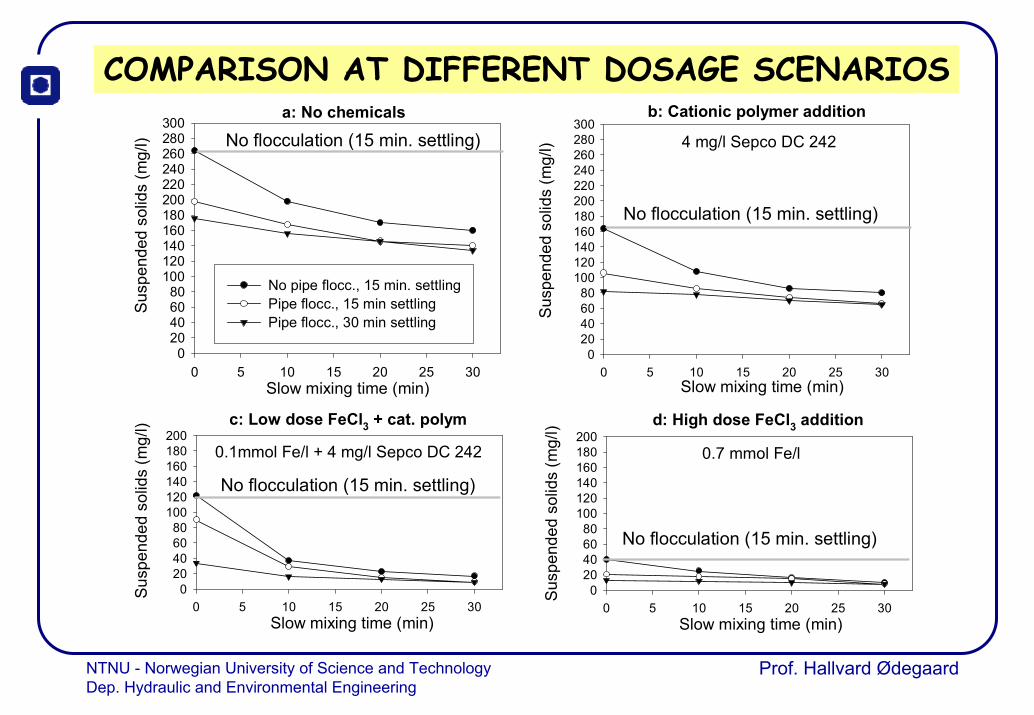
COMPARISON AT DIFFERENT DOSAGE SCENARIOSa. FeCl3 (high dose) only b. FeCl3 (high dose) only
c. Cationic polymer only d. FeCl3 (low dose) + cationic polymer
0,0
0,5
1,0
1,5
2,0
2,5
0 1 2 3
5,5 mg Fe + mg DC 242/244/l
SSpr
od/S
Srem
0
20
40
60
80
100
SS-r
emov
al (%
)
SSp/ SSr
R
0,0
0,5
1,0
1,5
2,0
2,5
0 20 40 60
mg Fe/l
SSpr
od/S
Srem
0
20
40
60
80
100
SS-r
emov
al (%
)
SSp/ SSr
R
0,0
0,5
1,0
1,5
2,0
2,5
0 2 4 6
mg DC 242/244/l
SSpr
od/S
Srem
0
20
40
60
80
100
SS-r
emov
al (%
)
SSp/ SSr
R
0
50
100
150
200
250
300
0 20 40 60
mg Fe/l
SP-S
Srem
(mg
SS/l)

NTNU - Norwegian University of Science and TechnologyDep. Hydraulic and Environmental Engineering
Prof. Hallvard Ødegaard
FLOCCULATION - KEY FACTOR
a) Orthokinetic flocculation* Turbulent velocity gradient (G) G = (W/µ)1/2
* Residence time (T) T = V/Q* Residence time distribution (m) m~number of
reactors in series* Floc volume fraction Φ = f(Me,dose)
b) Chemical flocculation (polymeric flocculants) by anionic polymer addition
* Polymer charge (anionic, cationic, non-ionic) * Polymer type (polyacrylamide, polyDadmac, polyamin)* Polymer dose * Polymer characteristic (MW, Charge density)

NTNU - Norwegian University of Science and TechnologyDep. Hydraulic and Environmental Engineering
Prof. Hallvard Ødegaard
ORTHOKINETIC FLOCCULATIONRelationship between flocculation performance and flocculation variables

NTNU - Norwegian University of Science and TechnologyDep. Hydraulic and Environmental Engineering
Prof. Hallvard Ødegaard
CHEMICAL FLOCCULATION
INFLUENCE OF ANIONIC POLYMER ADDITION ON CHEMICAL FLOC SETTLING RATE
1. Anionic polymer addition leads to larger flocs dueto the bridging mechanism
2. Low dosage needed (0,1 - 1,0 mg/l)
3. Polymer flocculant addition leads to higher acceptableturbulent velocity gradient and consequently to lower acceptable residence time

NTNU - Norwegian University of Science and TechnologyDep. Hydraulic and Environmental Engineering
Prof. Hallvard Ødegaard
Organic flocculants and coagulants
Charge density cationic
PEI/Fennofix 30
MW
5-5anionic
10 000 000
1 000 000
100 000
10 000
1000
P-epiamine/
FennoFix 50/57P-DADMAC /
Fennofix 40
PAM/Fennopol
PEO/FRA
Mannich/FennoFloc
Flocculants
Org. Coagulants
Fennopol K 990
FennoFix 2X0

NTNU - Norwegian University of Science and TechnologyDep. Hydraulic and Environmental Engineering
Prof. Hallvard Ødegaard
FLOC SETTLING RATE (vs) VERSUS CHEMICAL DOSAGES(Ce - turbidity of settled effluent)

NTNU - Norwegian University of Science and TechnologyDep. Hydraulic and Environmental Engineering
Prof. Hallvard Ødegaard
THE IMPORTANCE OF ORTHOKINETIC FLOCCULATION EVEN IN PRIMARY TREATMENT
a: No chemicals
Slow mixing time (min)0 5 10 15 20 25 30
Sus
pend
ed s
olid
s (m
g/l)
020406080
100120140160180200220240260280300
No pipe flocc., 15 min. settlingPipe flocc., 15 min settlingPipe flocc., 30 min settling
No flocculation (15 min. settling)
NTNU - Norwegian University of Science and TechnologyDep. Hydraulic and Environmental Engineering
Prof. Hallvard Ødegaard
COMPARISON AT DIFFERENT DOSAGE SCENARIOSb: Cationic polymer addition
Slow mixing time (min)0 5 10 15 20 25 30
Sus
pend
ed s
olid
s (m
g/l)
020406080
100120140160180200220240260280300
a: No chemicals
Slow mixing time (min)0 5 10 15 20 25 30
Sus
pend
ed s
olid
s (m
g/l)
020406080
100120140160180200220240260280300
No pipe flocc., 15 min. settlingPipe flocc., 15 min settlingPipe flocc., 30 min settling
No flocculation (15 min. settling)
No flocculation (15 min. settling)
c: Low dose FeCl3 + cat. polym
Slow mixing time (min)0 5 10 15 20 25 30
Sus
pend
ed s
olid
s (m
g/l)
020406080
100120140160180200
No flocculation (15 min. settling)
d: High dose FeCl3 addition
Slow mixing time (min)0 5 10 15 20 25 30
Sus
pend
ed s
olid
s (m
g/l)
020406080
100120140160180200
No flocculation (15 min. settling)
4 mg/l Sepco DC 242
0.1mmol Fe/l + 4 mg/l Sepco DC 242 0.7 mmol Fe/l
NTNU - Norwegian University of Science and TechnologyDep. Hydraulic and Environmental Engineering
Prof. Hallvard Ødegaard
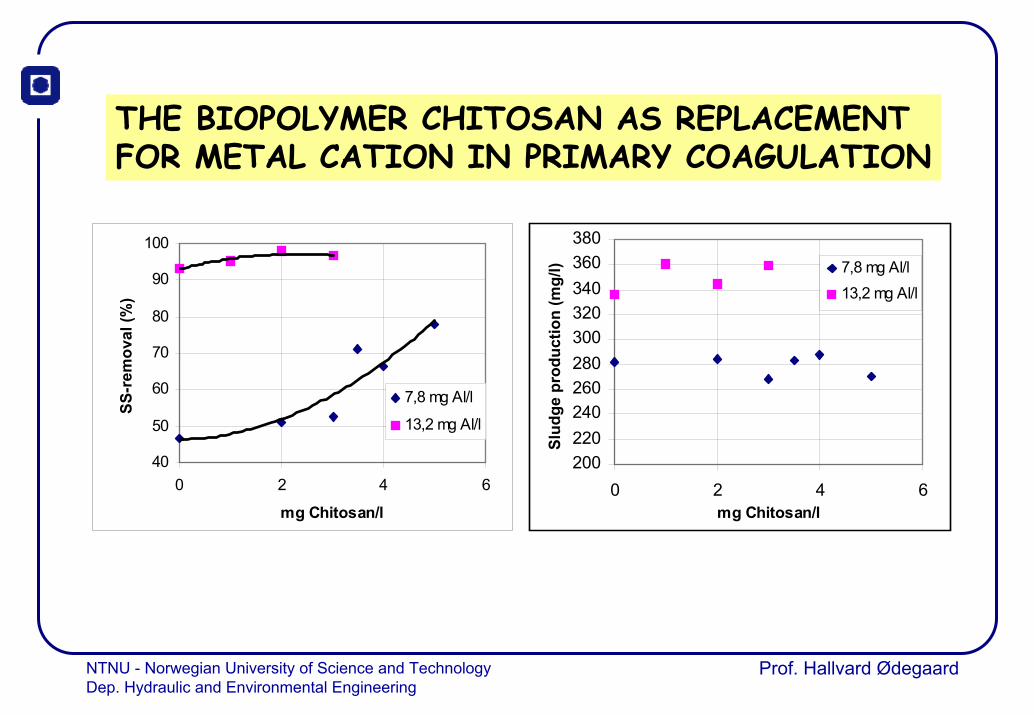
THE BIOPOLYMER CHITOSAN AS REPLACEMENTFOR METAL CATION IN PRIMARY COAGULATION
40
50
60
70
80
90
100
0 2 4 6
mg Chitosan/l
SS-r
emov
al (%
)
7,8 mg Al/l
13,2 mg Al/l
200220240260280300320340360380
0 2 4 6mg Chitosan/l
Slud
ge p
rodu
ctio
n (m
g/l) 7,8 mg Al/l
13,2 mg Al/l

NTNU - Norwegian University of Science and TechnologyDep. Hydraulic and Environmental Engineering
Prof. Hallvard Ødegaard
DEEP SETTLING TANK WITH INTERNAL FLOCCULATION
NTNU - Norwegian University of Science and TechnologyDep. Hydraulic and Environmental Engineering
Prof. Hallvard Ødegaard
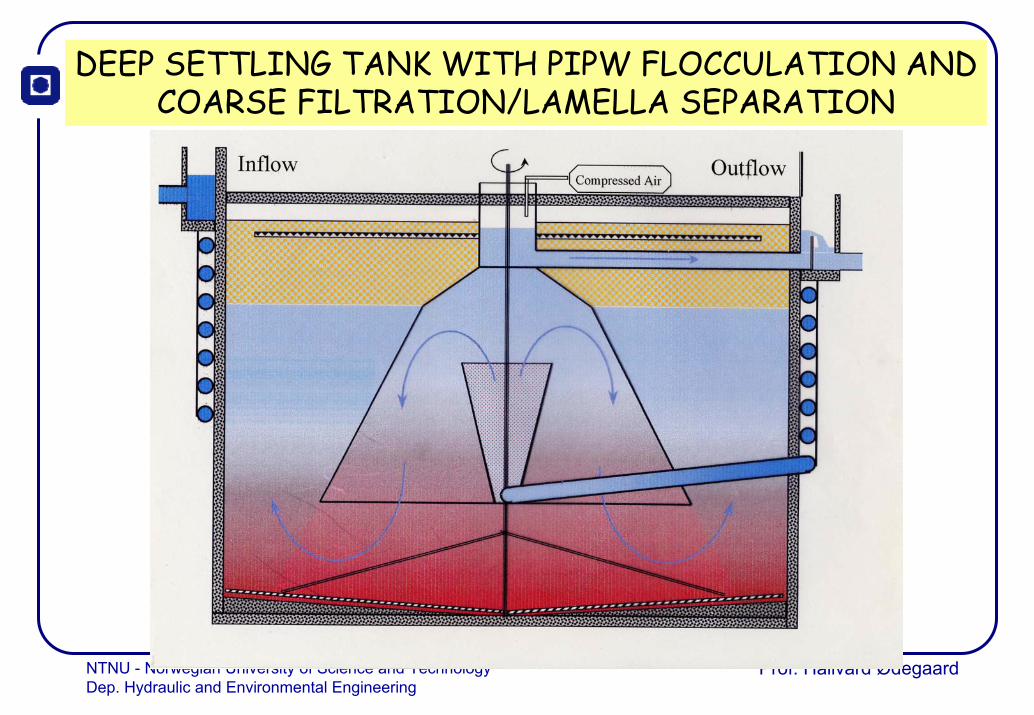
DEEP SETTLING TANK WITH PIPW FLOCCULATION ANDCOARSE FILTRATION/LAMELLA SEPARATION

NTNU - Norwegian University of Science and TechnologyDep. Hydraulic and Environmental Engineering
Prof. Hallvard Ødegaard

NTNU - Norwegian University of Science and TechnologyDep. Hydraulic and Environmental Engineering
Prof. Hallvard Ødegaard

NTNU - Norwegian University of Science and TechnologyDep. Hydraulic and Environmental Engineering
Prof. Hallvard Ødegaard
ACTIFLOMICROSAND SEPARATION

NTNU - Norwegian University of Science and TechnologyDep. Hydraulic and Environmental Engineering
Prof. Hallvard Ødegaard
LAMELLA SETTLING

NTNU - Norwegian University of Science and TechnologyDep. Hydraulic and Environmental Engineering
Prof. Hallvard Ødegaard
FLOTATION
NTNU - Norwegian University of Science and TechnologyDep. Hydraulic and Environmental Engineering
Prof. Hallvard Ødegaard
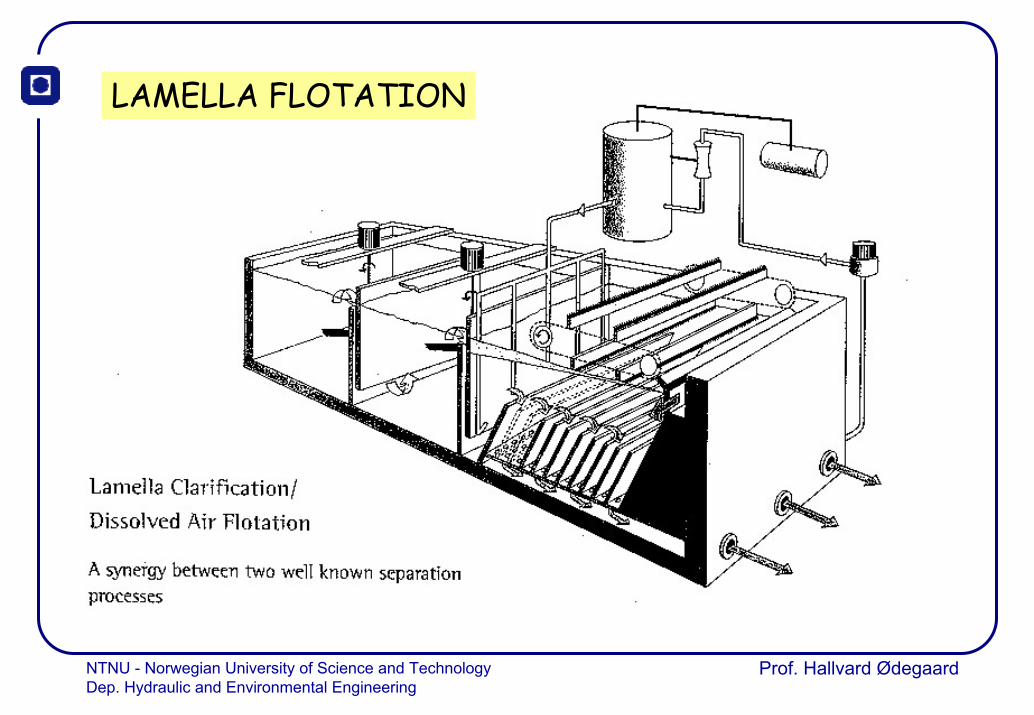
LAMELLA FLOTATION

NTNU - Norwegian University of Science and TechnologyDep. Hydraulic and Environmental Engineering
Prof. Hallvard Ødegaard
THE DYNASAND FILTER
NTNU - Norwegian University of Science and TechnologyDep. Hydraulic and Environmental Engineering
Prof. Hallvard Ødegaard
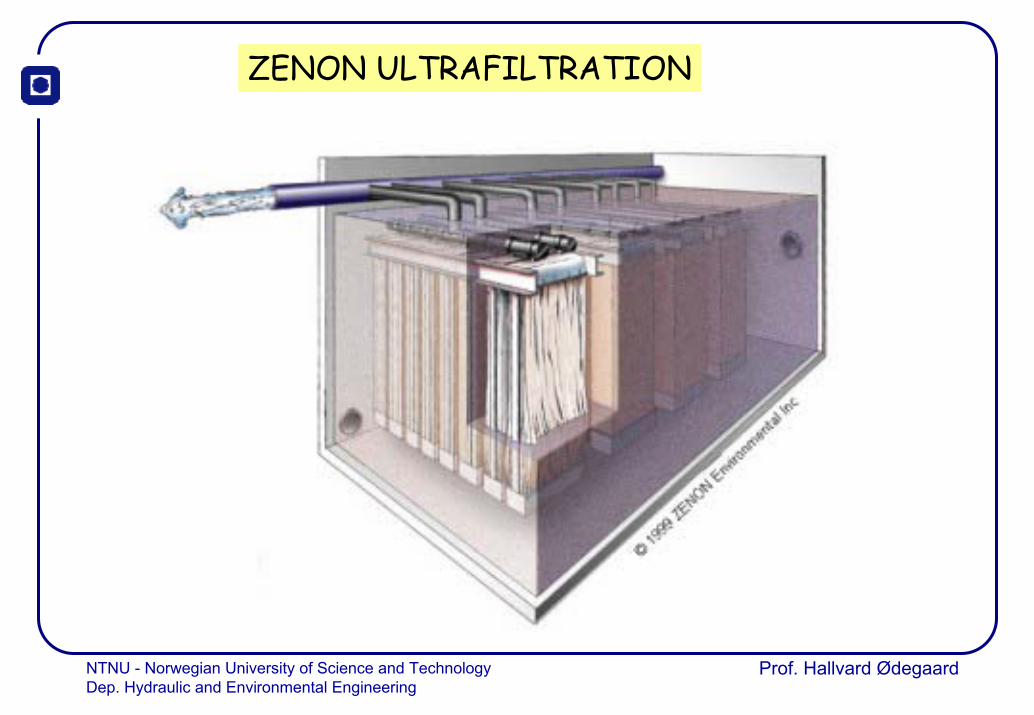
ZENON ULTRAFILTRATION

NTNU - Norwegian University of Science and TechnologyDep. Hydraulic and Environmental Engineering
Prof. Hallvard Ødegaard
DEVELOPMENT OF FLOTATION

NTNU - Norwegian University of Science and TechnologyDep. Hydraulic and Environmental Engineering
Prof. Hallvard Ødegaard
ADVANTAGES AND DISADVANTAGES OF FLOTATION IN COMPARISON WITH
SEDIMENTATION
ADVANTAGES
• Less space required, vf = 5-15 m/h against 1-2 m/h
• Better separation efficiency
• Higher sludge concentration
DISADVANTAGES
• Higher costs ?
• Less known technology
• More skilled operatorsneeded ?

NTNU - Norwegian University of Science and TechnologyDep. Hydraulic and Environmental Engineering
Prof. Hallvard Ødegaard
FLOCCULATION/FLOTATION EXPERIMENTSØdegaard(1995) Wat.Sci.Tech. Vol. 31, No 3.-4. Pp 73-82

NTNU - Norwegian University of Science and TechnologyDep. Hydraulic and Environmental Engineering
Prof. Hallvard Ødegaard
FLOCCULATION /FLOTATION EFFICIENCY VSG-VALUE AT VARIOUS RESIDENCE TIMES (T)
NTNU - Norwegian University of Science and TechnologyDep. Hydraulic and Environmental Engineering
Prof. Hallvard Ødegaard
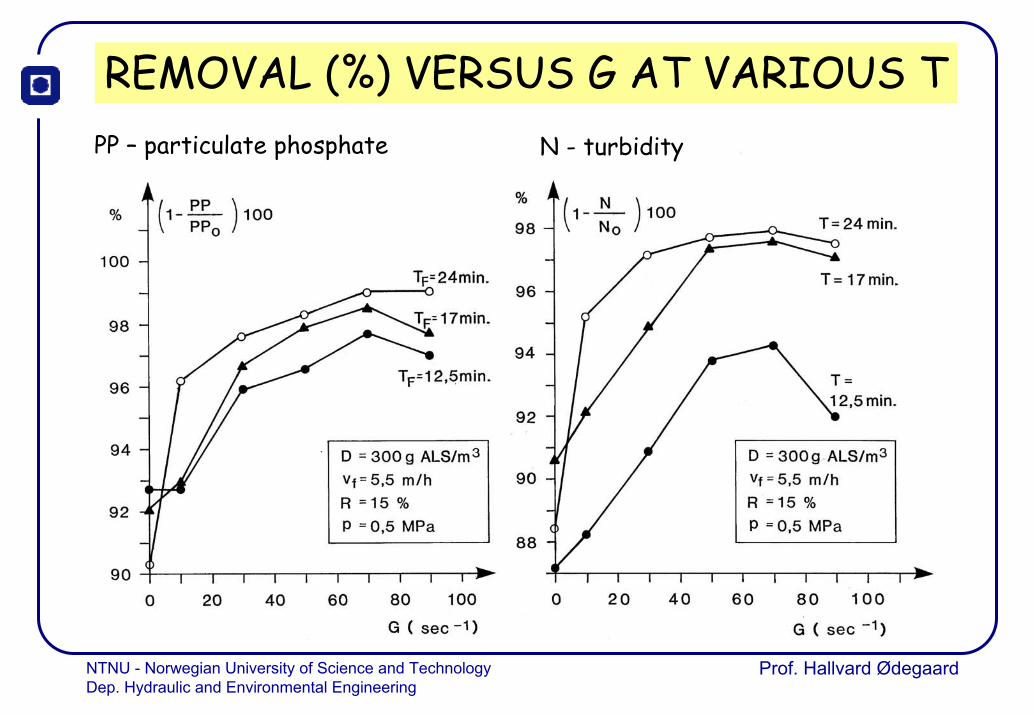
REMOVAL (%) VERSUS G AT VARIOUS TPP – particulate phosphate N - turbidity
NTNU - Norwegian University of Science and TechnologyDep. Hydraulic and Environmental Engineering
Prof. Hallvard Ødegaard
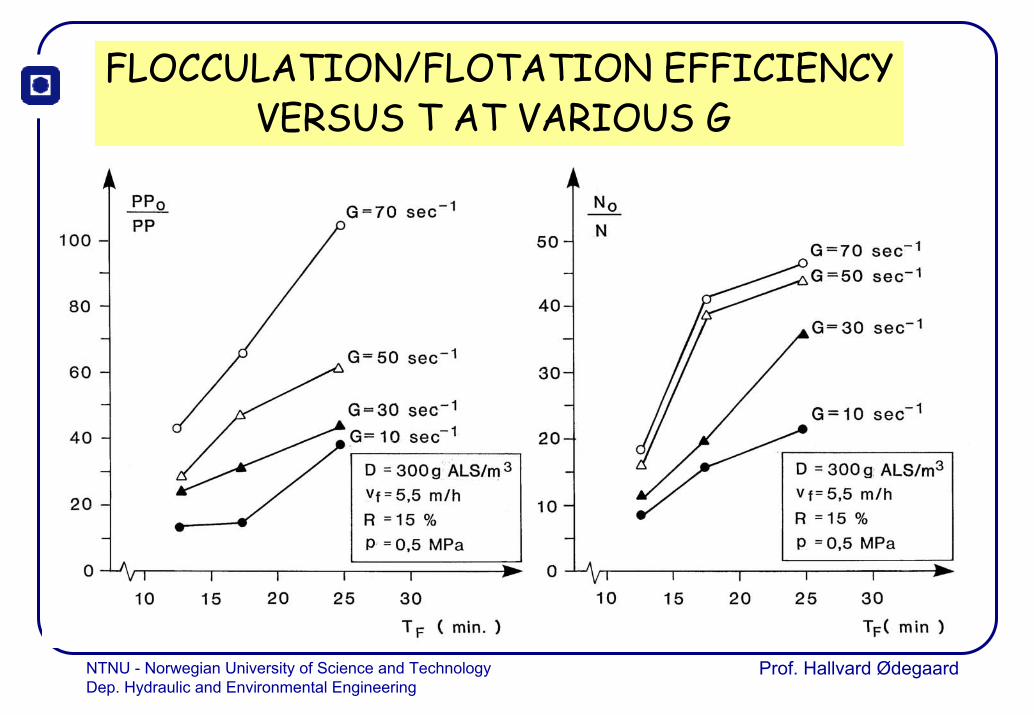
FLOCCULATION/FLOTATION EFFICIENCYVERSUS T AT VARIOUS G

NTNU - Norwegian University of Science and TechnologyDep. Hydraulic and Environmental Engineering
Prof. Hallvard Ødegaard
FLOCCULATION AHEAD OF FLOTATIONØdegaard, Wat.Sci.Tech. Vol 31, No3-4, 1995
1. The theor.mean residence time at design flow should be 25 - 30 min.
2. The flocculator should be designed to give a residence timedistribution as plug flow like as possible. If stirred tanks are used, the flocculator should be divided into at least two chambers
3. The G-value should be the same in each of the flocculator chambers and in the order of 60 - 80 sec-1.
4. The flotation unit should be designed for a hydraulic surface load of 5 - 6 m3/m2⋅h at design flow allowing for variations up to 10 m3/m2⋅h at maximum design flow. If the variation in the flow is small, a load of 8 m3/m2⋅h could be recommended at design flow.
5. The amount of pressurized water should be 10-20 % of design flow when the pressure is 0.5 MPa.
NTNU - Norwegian University of Science and TechnologyDep. Hydraulic and Environmental Engineering
Prof. Hallvard Ødegaard
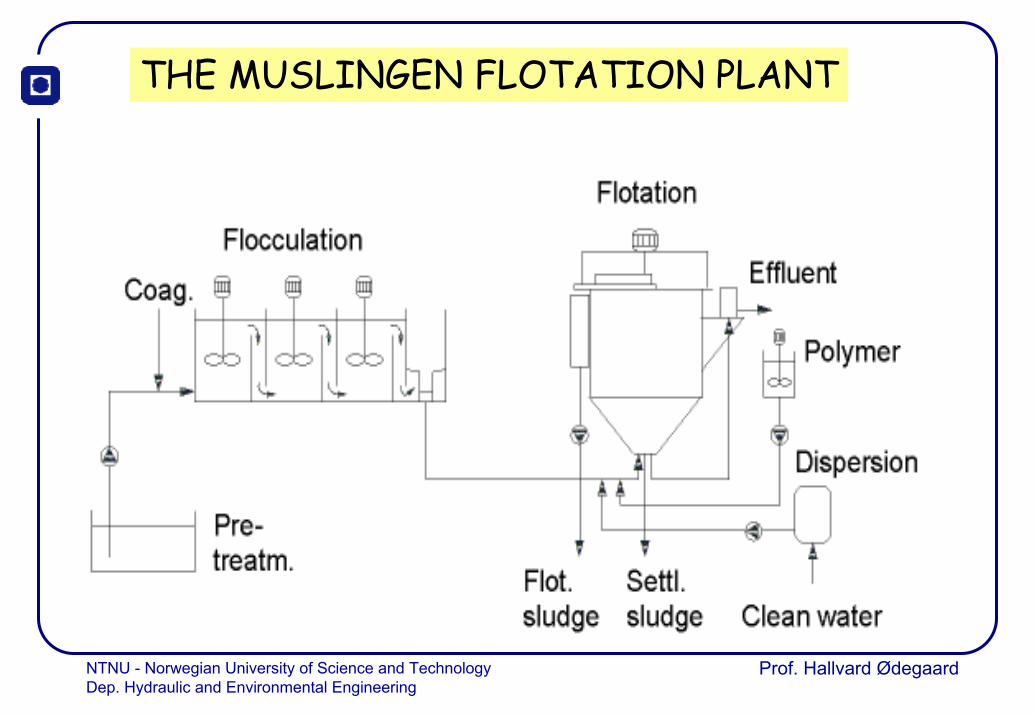
THE MUSLINGEN FLOTATION PLANT
NTNU - Norwegian University of Science and TechnologyDep. Hydraulic and Environmental Engineering
Prof. Hallvard Ødegaard

NTNU - Norwegian University of Science and TechnologyDep. Hydraulic and Environmental Engineering
Prof. Hallvard Ødegaard
Plant Overflow
rate (m/h) Tot P
In (mg/l) Tot P
Out (mg/l) Tot P
% A 1.9 (4,0) 5,9 (9,3) 0.12 (0,42) 98.0 B 4.2 (8.7) 4,6 (7,3) 0.21 (0.59) 95.4 C 1.9 (6.9) 4.4 (7.6) 0.10 (0.34) 97.7 D 4.6 (7.3) 4.6 (7.3) 0.38 (1.63) 91.7 E 4.4 (6.6) 1.9 (2,7) 0.06 (0.07) 96.8
Plant Overflow rate (m/h)
COD (TOC) In (mg/l)
COD (TOC) Out (mg/l)
COD (TOC) %
A 1.9 (4,0) 337 (710) 62 (120) 81.6 B 4.2 (8.7) 109 (190) 8.9 (15.3) 91.8 C 1.9 (6.9) 343 (643) 97 (151) 71.7 D 4.6 (7.3) 93 (180) 28 (58) 69.9 E 4.4 (6.6) 119 (167) 30 (30) 74.8
TREATMENT RESULTS MUSLINGEN
NTNU - Norwegian University of Science and TechnologyDep. Hydraulic and Environmental Engineering
Prof. Hallvard Ødegaard
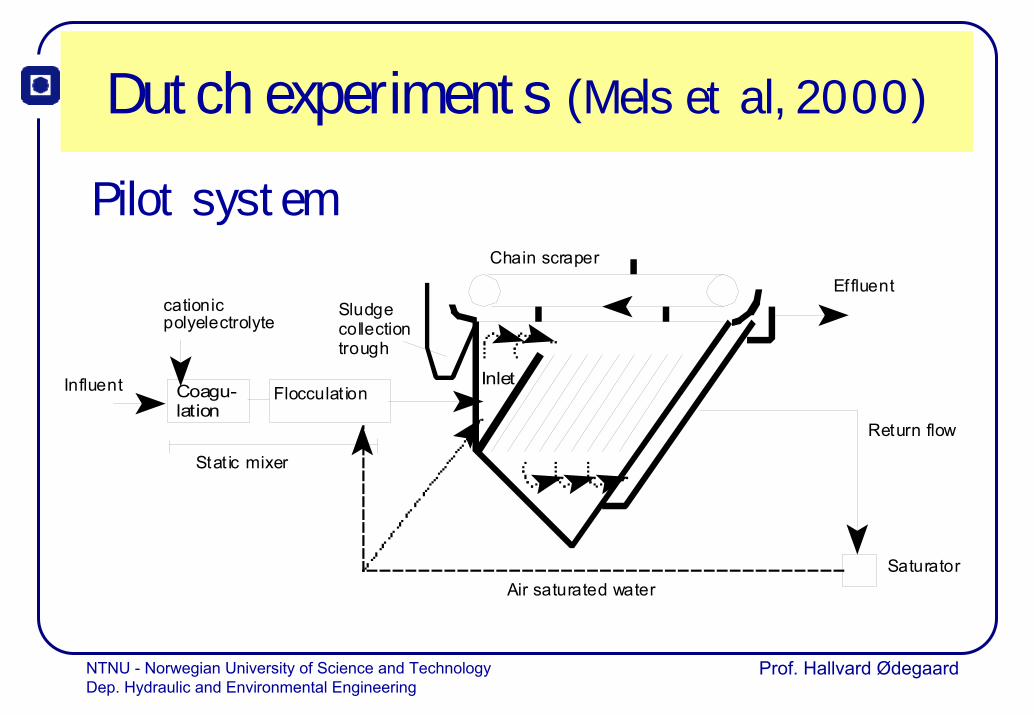
Dutch experiments (Mels et al, 2000)
Chain scraper
Sludgecollectiontrough
Air saturated water
Return flow
Saturator
cationicpolyelectrolyte
InletInfluent
Effluent
Stat ic mixer
Flocculat ionCoagu-lation
Pilot system
NTNU - Norwegian University of Science and TechnologyDep. Hydraulic and Environmental Engineering
Prof. Hallvard Ødegaard
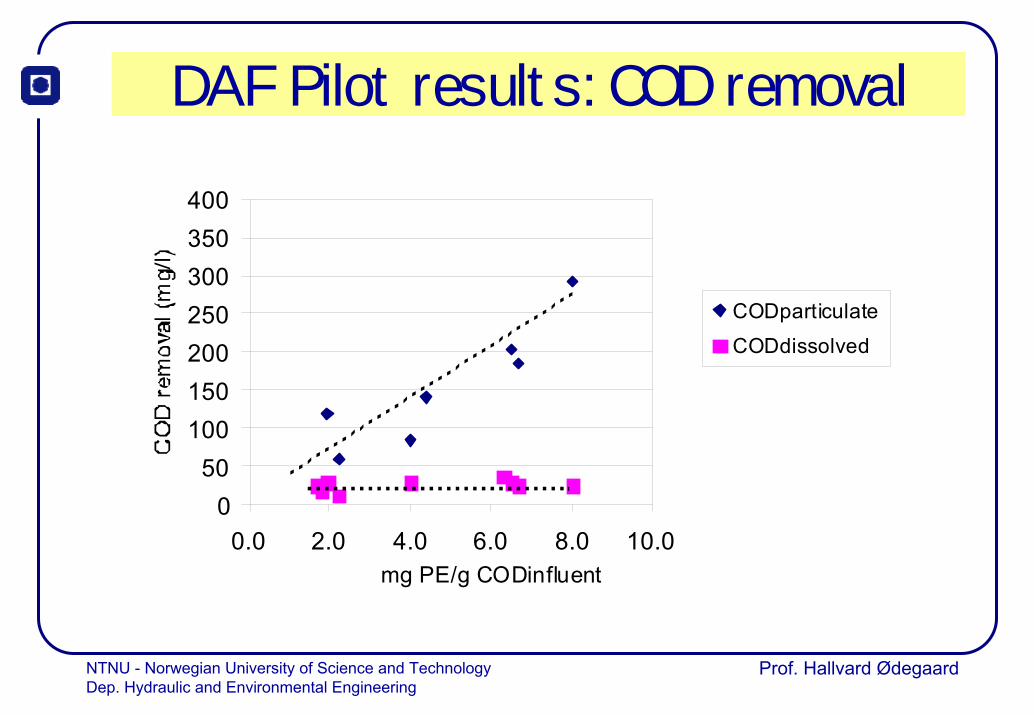
DAF Pilot results: COD removal
050
100150200250300350400
0.0 2.0 4.0 6.0 8.0 10.0mg PE/g CODinfluent
CODparticulate
CODdissolved

NTNU - Norwegian University of Science and TechnologyDep. Hydraulic and Environmental Engineering
Prof. Hallvard Ødegaard
y = 2.6 x - 11.5R2 = 0.88
0
50
100
150
200
250
300350
400
0 50 100 150 200
EffluentTurbidity (NTU)Influent
0
20
40
60
80
100
0.0 5.0 10.0 15.0 20.0
mg pe/100 NTU
8 Mg/mol 4 Mg/mol
0
20
40
60
80
100
Setpoint
Discussion: Determining flocculation/flotation efficiency with turbidity measurements
Evaluation of two PE’s by plotting particulate COD as a
function of PE-NTUinfluent-ratio
Linear relation turbidityand particulate COD

NTNU - Norwegian University of Science and TechnologyDep. Hydraulic and Environmental Engineering
Prof. Hallvard Ødegaard
PROPOSED SECONDARY TREATMENT PROCESS
• Particulate organic matter is coagulated and separated as in a conventionalchemical plant
• Easily biodegradable matter is removed in a highly loaded biofilm reactor at such a high load that only easily biodegradable organic matter is degraded (no hydrolysis)
• Good biomass separation of incoming particles as well as produced biomass
Flocseparation
Coagulant

NTNU - Norwegian University of Science and TechnologyDep. Hydraulic and Environmental Engineering
Prof. Hallvard Ødegaard
THE PRINCIPLE OF THE MOVING BED REACTOR
Anaerobic/anoxic reactorAerobic reactor

NTNU - Norwegian University of Science and TechnologyDep. Hydraulic and Environmental Engineering
Prof. Hallvard Ødegaard
THE KALDNES MOVING BED BIOFILM PROCESS
Carrier under waterAerated tank for nitrification

NTNU - Norwegian University of Science and TechnologyDep. Hydraulic and Environmental Engineering
Prof. Hallvard Ødegaard
CHARACTERISTICS OF THE BIOFILM CARRIERS
Biofilm carrier :Material : Polyethylene (density 0,95 g/cm3)Size : K1 - Diam./Length = 10mm/7mm
K2 - Diam./Length = 15mm/15mm
K1
K2Surface area K1 K2
Per carrier (mm2) Total Effective for biofilm growth
670490
23001530
Specific area (m2/m3) Total at 70 % carrier filling Effective for biofilm growth
490350
330220
NTNU - Norwegian University of Science and TechnologyDep. Hydraulic and Environmental Engineering
Prof. Hallvard Ødegaard
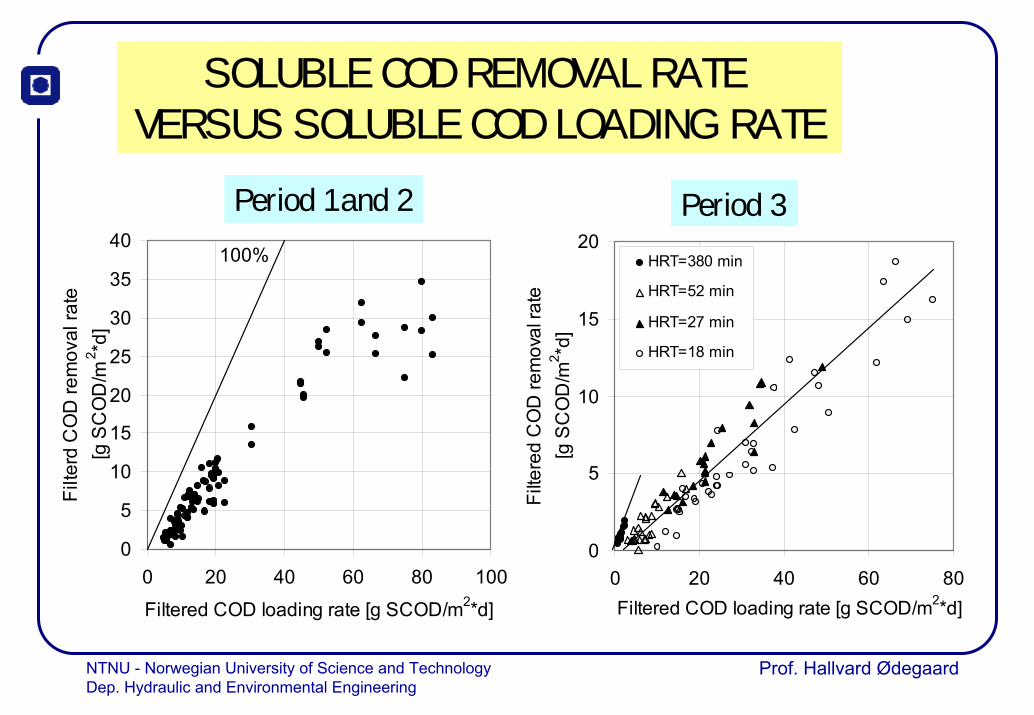
SOLUBLE COD REMOVAL RATE VERSUS SOLUBLE COD LOADING RATE
0
5
10
15
20
25
30
35
40
0 20 40 60 80 100
Filtered COD loading rate [g SCOD/m2*d]
Filte
rd C
OD
rem
oval
rate
[g S
CO
D/m
2 *d]
100%
Period 1 and 2 Period 3
0
5
10
15
20
0 20 40 60 80Filtered COD loading rate [g SCOD/m2*d]
Filte
red
CO
D re
mov
al ra
te[g
SC
OD
/m2 *d
]
HRT=380 min
HRT=52 min
HRT=27 min
HRT=18 min
NTNU - Norwegian University of Science and TechnologyDep. Hydraulic and Environmental Engineering
Prof. Hallvard Ødegaard
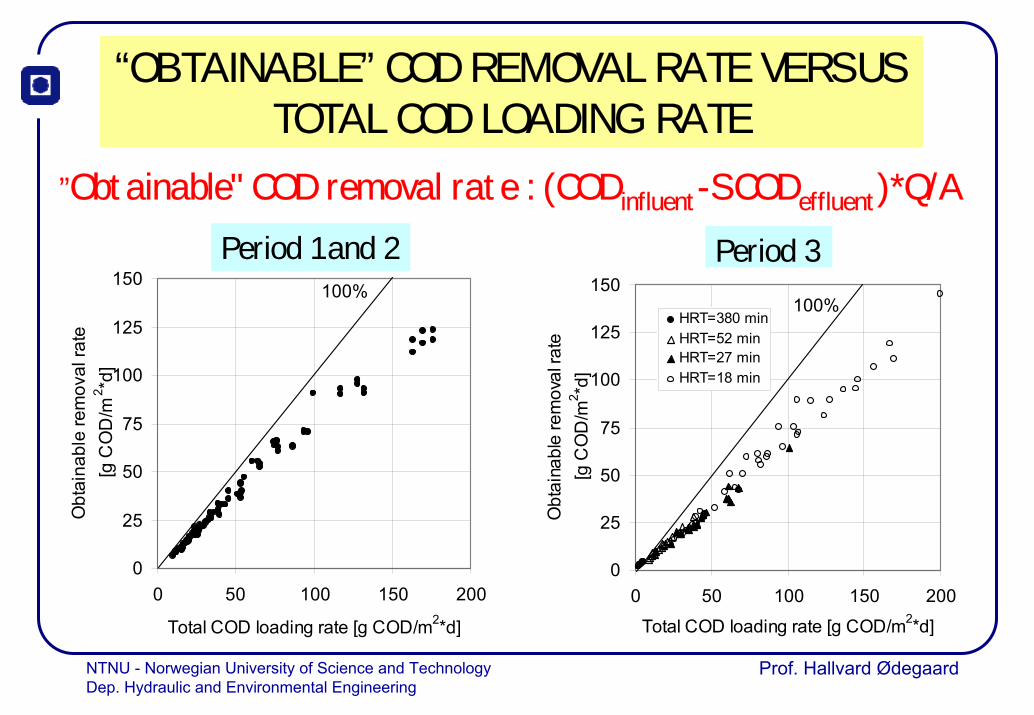
“OBTAINABLE” COD REMOVAL RATE VERSUSTOTAL COD LOADING RATE
”Obtainable" COD removal rate : (CODinfluent-SCODeffluent)*Q/A
0
25
50
75
100
125
150
0 50 100 150 200
Total COD loading rate [g COD/m2*d]
Obt
aina
ble
rem
oval
rate
[g C
OD
/m2 *d
]
100%
Period 1 and 2 Period 3
0
25
50
75
100
125
150
0 50 100 150 200
Total COD loading rate [g COD/m2*d]
Obt
aina
ble
rem
oval
rate
[g C
OD
/m2 *d
]
HRT=380 minHRT=52 minHRT=27 minHRT=18 min
100%
NTNU - Norwegian University of Science and TechnologyDep. Hydraulic and Environmental Engineering
Prof. Hallvard Ødegaard
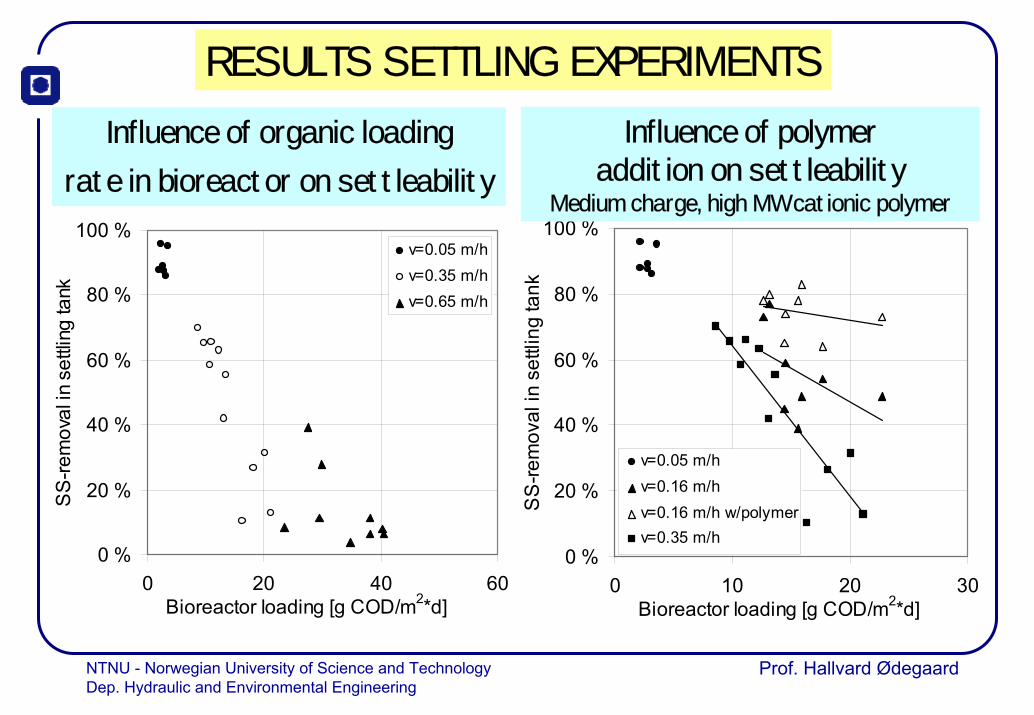
RESULTS SETTLING EXPERIMENTS
0 %
20 %
40 %
60 %
80 %
100 %
0 10 20 30Bioreactor loading [g COD/m2*d]
SS
-rem
oval
in s
ettli
ng ta
nk
v=0.05 m/hv=0.16 m/hv=0.16 m/h w/polymerv=0.35 m/h
Influence of polymer addition on settleability
Medium charge, high MW cationic polymer
0 %
20 %
40 %
60 %
80 %
100 %
0 20 40 60Bioreactor loading [g COD/m2*d]
SS
-rem
oval
in s
ettli
ng ta
nk
v=0.05 m/hv=0.35 m/hv=0.65 m/h
Influence of organic loading rate in bioreactor on settleability

NTNU - Norwegian University of Science and TechnologyDep. Hydraulic and Environmental Engineering
Prof. Hallvard Ødegaard
RETROFITTING EXISTING PRIMARY PRECIPITATION PLANTSBY THE HIGH RATE MOVING BED PROCESS
T = 20-40 min
Fe
Fe (evt +cat. pol.)
Alt. dosong point (or anionic polymer)
T=10-20 T=10-20
Air
NTNU - Norwegian University of Science and TechnologyDep. Hydraulic and Environmental Engineering
Prof. Hallvard Ødegaard
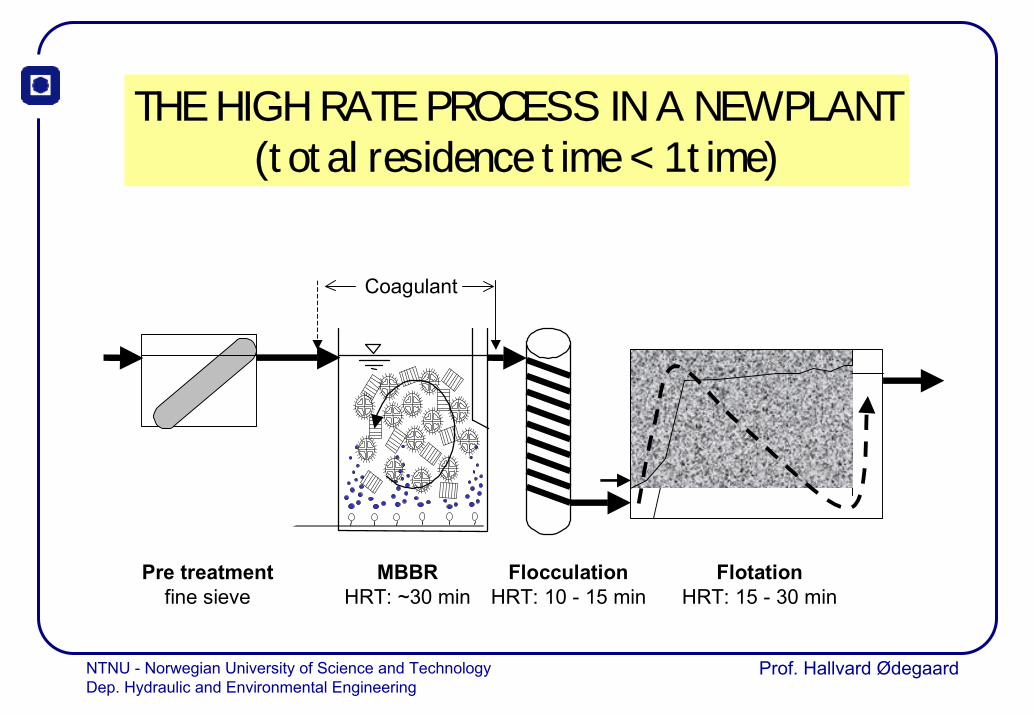
THE HIGH RATE PROCESS IN A NEW PLANT(total residence time < 1 time)
Coagulant
Pre treatmentfine sieve
MBBRHRT: ~30 min
FlocculationHRT: 10 - 15 min
FlotationHRT: 15 - 30 min
NTNU - Norwegian University of Science and TechnologyDep. Hydraulic and Environmental Engineering
Prof. Hallvard Ødegaard
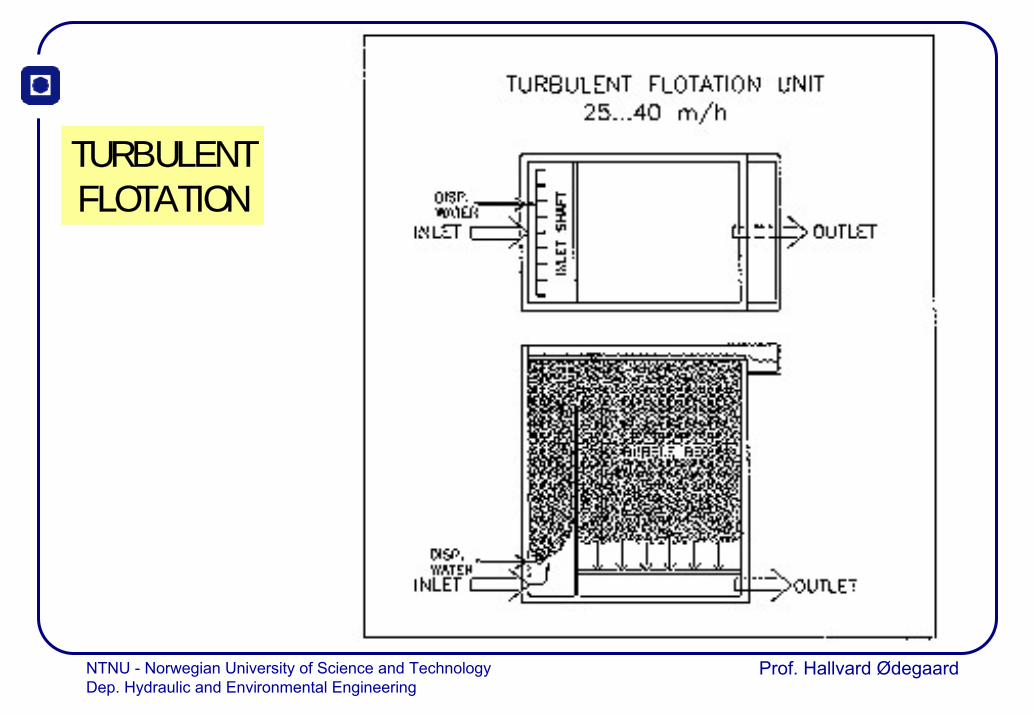
TURBULENTFLOTATION

NTNU - Norwegian University of Science and TechnologyDep. Hydraulic and Environmental Engineering
Prof. Hallvard Ødegaard
QUESTIONS TO BE ANSWERED
ON COAGULATION/FLOCCULATION• Where to dose the coagulant?• What coagulant?• How much coagulant?
ON THE BIOREACTOR• What happens to the soluble COD?• What happens to the particulate COD?• How to design the MBBR
ON THE FLOTATION REACTOR• Performance of turbulent flotation• Design of turbulent flotation

NTNU - Norwegian University of Science and TechnologyDep. Hydraulic and Environmental Engineering
Prof. Hallvard Ødegaard
COD DEGRADATION/TRANSFORMATIONTotal COD in wastewater - 100%
1 µm
SCOD PCOD
“True solution” “Particulate fraction” (colloids & SS)
Degradable in MBBR
Coagulation Flocculation
ChemicalsMBBRWe want:
ChemicalsMBBR
We don’t want:
0.1 µm
Total COD in wastewater - 100%
1 µm
SCOD PCOD
“True solution” “Particulate fraction” (colloids & SS)
Degradable in MBBR
Coagulation Flocculation
ChemicalsMBBRWe want:
ChemicalsMBBR
We don’t want:
0.1 µm

NTNU - Norwegian University of Science and TechnologyDep. Hydraulic and Environmental Engineering
Prof. Hallvard Ødegaard
POLYMERS INVESTIGATED
02468
10121416
0 1 2 3 4 5 6 7
Charge density, (meq/g)
MW
, (10
^6 g
/mol
)
Design region, D4&D5 Design region, D8 C587 C591
C595 Ffix 40 Ffix 210 Ffix 220
Ffix 230 Ffix 240 K194 K211
K504 K506 K508 K594
K1333 K1351 K1370 K1384
K1390 K1488 K1912 K3297
K3450 K4650 K5060

NTNU - Norwegian University of Science and TechnologyDep. Hydraulic and Environmental Engineering
Prof. Hallvard Ødegaard
-30.0-20.0-10.0
0.010.020.030.040.050.060.070.080.0
<0.1
micron
0.1-1
micron
1-11 m
icron
11-41
micr
on41
-160 m
icron
totCOD
COD-fraction
COD i
n - C
OD o
ut, (
mg
COD/
l)
MBBR 1MBBR 3
Net change in COD fractions through the MBBRPositive value: net removal, negative value: net production

NTNU - Norwegian University of Science and TechnologyDep. Hydraulic and Environmental Engineering
Prof. Hallvard Ødegaard
EFFECT OF POLYMER AND IRON DOSAGE ON SS REMOVAL
PolyacrylamidePolyamine
0
20
40
60
80
100
0 1 2 3 4
Polymer dosage (mg/l)
SS re
mov
al (%
)
a
0
20
40
60
80
100
0 1 2 3 4
Polymer dosage (mg/l)SS
rem
oval
(%)
b

NTNU - Norwegian University of Science and TechnologyDep. Hydraulic and Environmental Engineering
Prof. Hallvard Ødegaard
DETERMINATION OF OPTIMAL Fe/Polymer-DOSE
PAM01_pls1_MIS_…, PC: 2, Y-var: SSe, (X-var = value): CD = 2.1939, MW = 4.6231, SCODi = 67.6315, pHi = 7.7063
Response Surface
3.0
2.5
2.0
1.5
1.0
0.5 00.05
0.100.15
0.20P
ol
M e
33.774 38.611 43.448 48.285 53.122 57.959

NTNU - Norwegian University of Science and TechnologyDep. Hydraulic and Environmental Engineering
Prof. Hallvard Ødegaard
0
20
40
60
80
100
0 1 2 3 4
Polymer dosage (mg/l)
CO
D re
mov
al (%
)a
0
20
40
60
80
100
0 1 2 3 4
Polymer dosage (mg/l)
CO
D re
mov
al (%
)
b
Polyamine Polyacrylamide
0
20
40
60
80
100
0 1 2 3 4
Polymer dosage (mg/l)
SCO
D re
mov
al (%
)
a
0
20
40
60
80
100
0 1 2 3 4
Polymer dosage (mg/l)
SCO
D re
mov
al (%
)b
EFFECT OF POLYMER
AND IRON
DOSAGE ON COD
REMOVAL

NTNU - Norwegian University of Science and TechnologyDep. Hydraulic and Environmental Engineering
Prof. Hallvard Ødegaard
EFFECT OF POLYMER PROPERTIES
0
20
40
60
80
100
0 5 10 15
Molecular weight (106 g/mol)
SS re
mov
al (%
)
b
0
20
40
60
80
100
0 5 10 15
Molecular weight (106 g/mol)
SS re
mov
al (%
)
a
0
20
40
60
80
100
0 2 4 6 8Charge density of the polymer (meq/g)
SS re
mov
al (%
)b
0
20
40
60
80
100
0 2 4 6 8Charge density of the polymer (meq/g)
SS re
mov
al (%
)
a
Results Model predictions
Molecular weigth
Charge density

NTNU - Norwegian University of Science and TechnologyDep. Hydraulic and Environmental Engineering
Prof. Hallvard Ødegaard
PARTICULATE COD FRACTIONS IN RAW WATER AND FLOTATED WATER WITH DIFFERENT
POLYDADMAC DOSAGES AND 0.2 MMOL FE/L IRON.
0.0
20.0
40.0
60.0
80.0
100.0
120.0
>11 µm 1-11 µm 0.1-1 µm <0.1 µm
CO
D (m
g/l)
Raw waterP = 0.58 mg/lP = 1 mg/lP = 2 mg/lP = 3 mg/lP = 3.4 mg/l

NTNU - Norwegian University of Science and TechnologyDep. Hydraulic and Environmental Engineering
Prof. Hallvard Ødegaard
FLOTATION FOR FINAL SEPARATION

NTNU - Norwegian University of Science and TechnologyDep. Hydraulic and Environmental Engineering
Prof. Hallvard Ødegaard
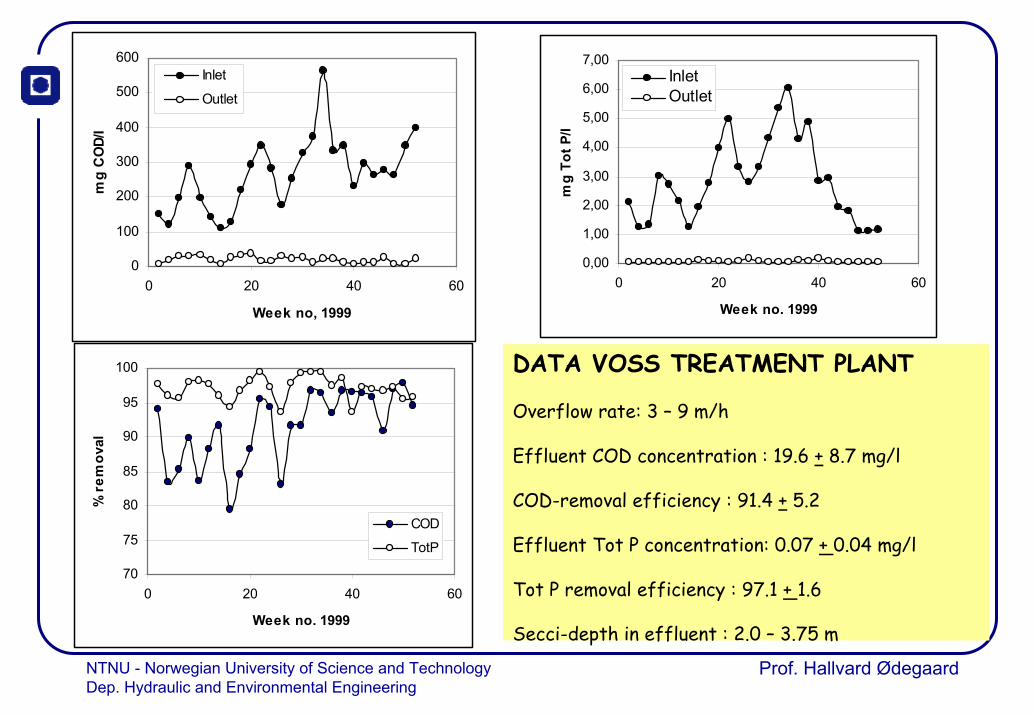
VOSS WASTEWATER TREATMENT PLANT
NTNU - Norwegian University of Science and TechnologyDep. Hydraulic and Environmental Engineering
Prof. Hallvard Ødegaard
0
100
200
300
400
500
600
0 20 40 60
Week no, 1999
mg
CO
D/l
Inlet
Outlet
70
75
80
85
90
95
100
0 20 40 60
Week no. 1999
% r
emov
al
COD
TotP
0,00
1,00
2,00
3,00
4,00
5,00
6,00
7,00
0 20 40 60
Week no. 1999
mg
Tot P
/l
InletOutlet
DATA VOSS TREATMENT PLANT
Overflow rate: 3 – 9 m/h
Effluent COD concentration : 19.6 + 8.7 mg/l
COD-removal efficiency : 91.4 + 5.2
Effluent Tot P concentration: 0.07 + 0.04 mg/l
Tot P removal efficiency : 97.1 + 1.6
Secci-depth in effluent : 2.0 – 3.75 m

NTNU - Norwegian University of Science and TechnologyDep. Hydraulic and Environmental Engineering
Prof. Hallvard Ødegaard
GARDERMOEN WWTP
NTNU - Norwegian University of Science and TechnologyDep. Hydraulic and Environmental Engineering
Prof. Hallvard Ødegaard
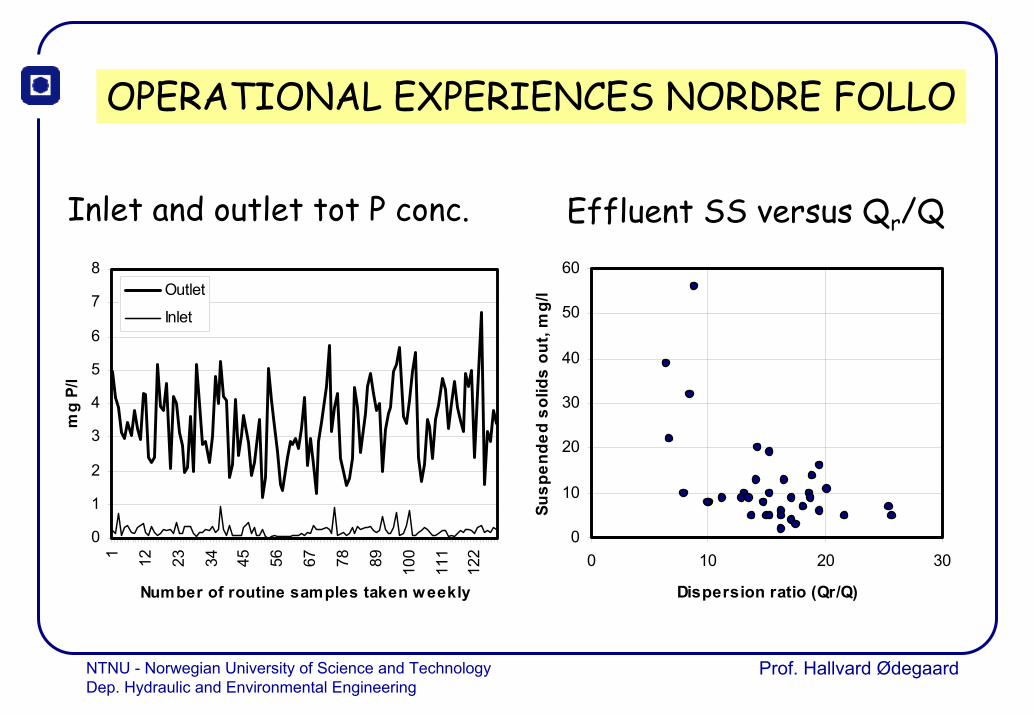
OPERATIONAL EXPERIENCES NORDRE FOLLO
Inlet and outlet tot P conc.
0
1
2
3
4
5
6
7
8
1 12 23 34 45 56 67 78 89 100
111
122
Number of routine samples taken weekly
mg
P/l
Outlet
Inlet
0
10
20
30
40
50
60
0 10 20 30
Dispersion ratio (Qr/Q)
Susp
ende
d so
lids
out,
mg/
l
Effluent SS versus Qr/Q

NTNU - Norwegian University of Science and TechnologyDep. Hydraulic and Environmental Engineering
Prof. Hallvard Ødegaard
SUMMARY• A very good particle removal and hence organic matter
removal can be obtained by the use of pre-coagulation
• If advanced phosphate removal is not the objective,sludge production can be minimised by replacing part of the metal cation for coagulant by a organic polymer cation
• The addition of an anionic organic polymer as flocculantcan improve the settleability of flocs dramatically with corresponding reduction in plant space requirement
• The combination of a high-rate moving bed process andcoagulation/flotation can result in an extremely compact and efficient secondary treatment process