Embed Size (px)
Citation preview
Advances in Nonfiling Measures
Presentation to the IRS-TPC Research Conference
June 21, 2012
Mark Payne – RAS:OR: Taxpayer Analysis & Modeling
Alan Plumley – RAS: Office of Research
Brian Erard – B. Erard & Associates
Note: The views expressed herein are those of the authors and are not necessarily the official positions of the U.S. Treasury Department or the Internal Revenue Service.
June 21, 2012 2
Office ofResearch
Nonfiling Measures
Two main measures related to Nonfiling: Nonfiling Gap ($)
Voluntary Filing Rate (% of returns)
Nonfiling Gap definition: Tax not paid on time by those who don’t file on time or don’t file at all.
Measure of the No-Return portion of Non-Filing Gap was presented at 2011 IRS research conference. Use IRS administrative data (especially information returns) Use information from the Current Population Survey (CPS) on
living arrangements and family structures Construct synthetic tax returns for persons not found on a tax return
and estimate their tax liability and balance due

June 21, 2012 3
Office ofResearch
Non-Filing Gap Estimation
No-Return Population (TY2005 tax liability minus withholding): $12.9B
Late Returns Reported $8.7B balance due Add income from information documents Recompute tax and balance due ($13.0B)
Total Nonfiling Gap (No-Return + Late group) For TY2005: $12.9B + $13.0B = $25.9B Projection to TY2006 (reflecting decline in
number of nonfilers): $25 B
June 21, 2012 4
Office ofResearch
Voluntary Filing Rate
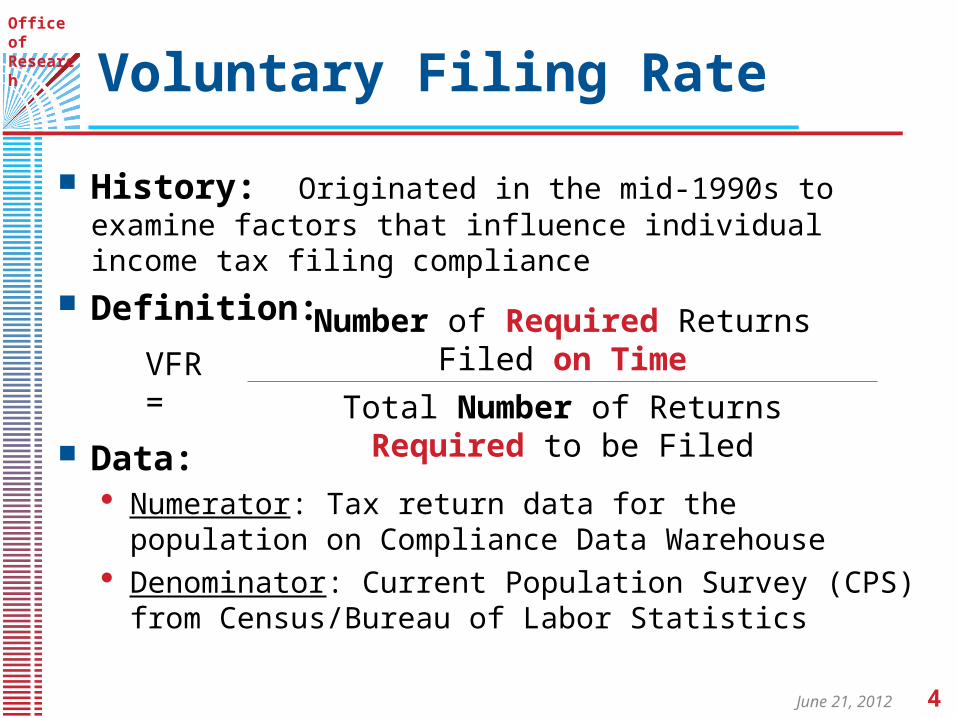
History: Originated in the mid-1990s to examine factors that influence individual income tax filing compliance
Definition:
Data: Numerator: Tax return data for the population on Compliance
Data Warehouse Denominator: Current Population Survey (CPS) from
Census/Bureau of Labor Statistics
VFR =Number of Required Returns Filed on Time
Total Number of Returns Required to be Filed
June 21, 2012 5
Office ofResearch Key Methodological
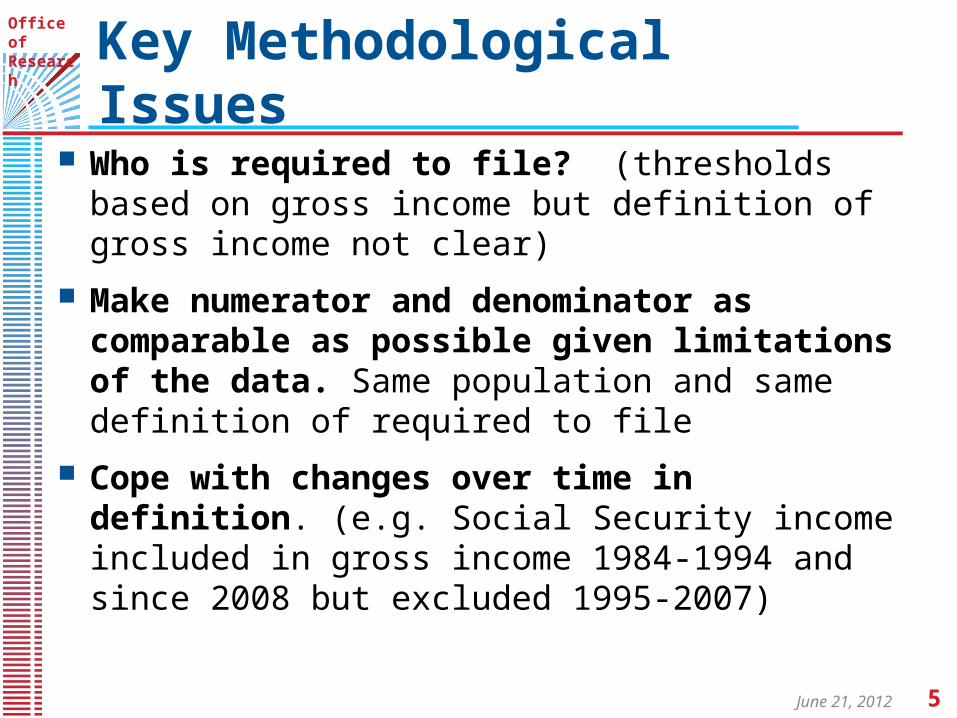
Issues Who is required to file? (thresholds based on gross
income but definition of gross income not clear)
Make numerator and denominator as comparable as possible given limitations of the data. Same population and same definition of required to file
Cope with changes over time in definition. (e.g. Social Security income included in gross income 1984-1994 and since 2008 but excluded 1995-2007)

June 21, 2012 6
Office ofResearch Adjustments to the
Numerator
Restrict to U.S. residents > age 14 (to correspond with Census)
Include only timely filers who file within 1 year of close of tax year (omits some combat extensions)
Apply definition of required to file from instructions using best approximation
Use gross income concept for each income type when possible (e.g. for Schedule C use line 7 “Gross Income” before subtracting out expenses and do not reduce taxpayer total income by any loss on line 7)
June 21, 2012 7
Office ofResearch
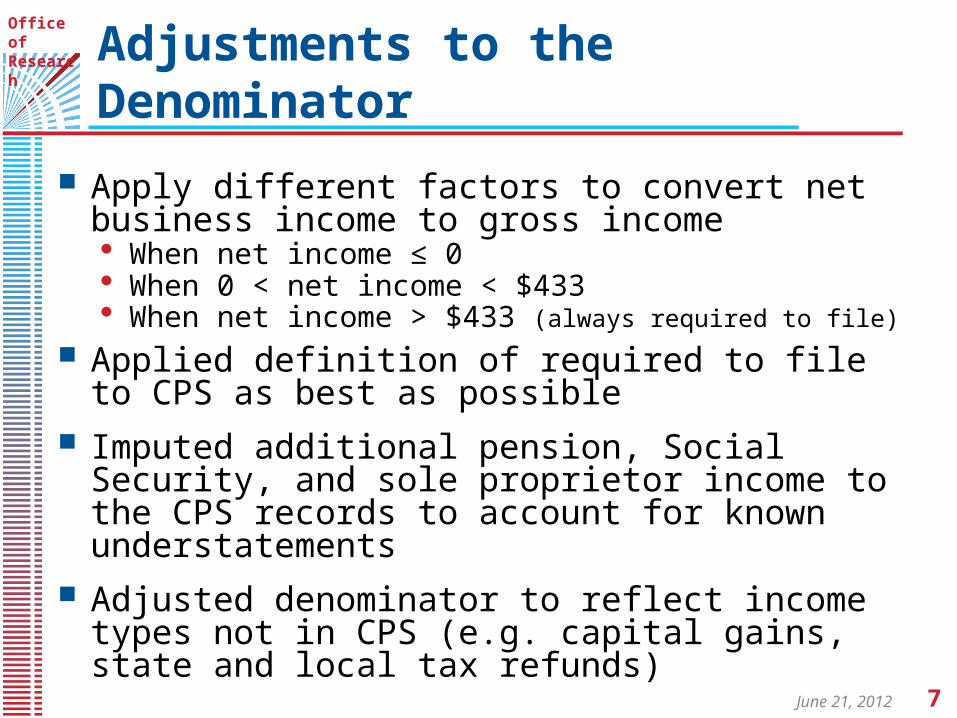
Apply different factors to convert net business income to gross income When net income ≤ 0 When 0 < net income < $433 When net income > $433 (always required to file)
Applied definition of required to file to CPS as best as possible
Imputed additional pension, Social Security, and sole proprietor income to the CPS records to account for known understatements
Adjusted denominator to reflect income types not in CPS (e.g. capital gains, state and local tax refunds)
Adjustments to the Denominator
June 21, 2012 8
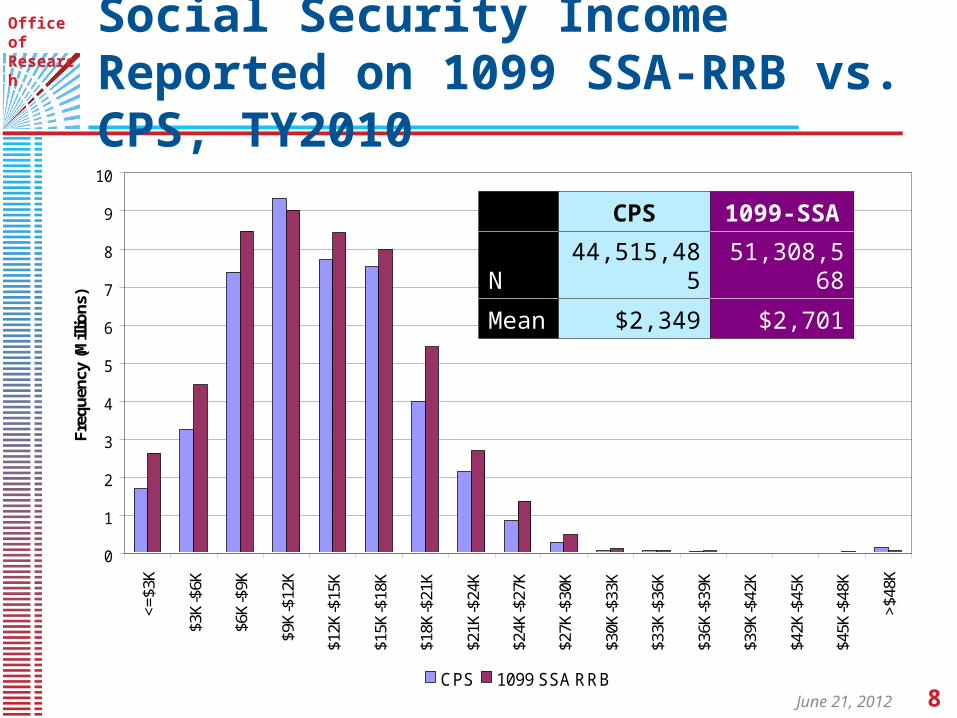
Office ofResearch Social Security Income Reported on
1099 SSA-RRB vs. CPS, TY2010
0
1
2
3
4
5
6
7
8
9
10
<=$3
K
$3K
-$6K
$6K
-$9K
$9K
-$12
K
$12K
-$15
K
$15K
-$18
K
$18K
-$21
K
$21K
-$24
K
$24K
-$27
K
$27K
-$30
K
$30K
-$33
K
$33K
-$36
K
$36K
-$39
K
$39K
-$42
K
$42K
-$45
K
$45K
-$48
K
>$48
K
Freq
uenc
y (M
illio
ns)
CPS 1099 SSA RRB
CPS 1099-SSA
N 44,515,485 51,308,568
Mean $2,349 $2,701

June 21, 2012 9
Office ofResearch Pension Income Reported on
1099-R vs. CPS, TY2010
0
2
4
6
8
10
12
14
16
18<
=$5
K
$5K
-$10
K
$10K
-$15
K
$15K
-$20
K
$20K
-$25
K
$25K
-$30
K
$30K
-$35
K
$35K
-$40
K
$40K
-$45
K
>$4
5K
Fre
qu
ency
(M
illi
on
s)
CPS 1099-R
CPS 1099-R
N 21,115,560 47,265,856
Mean $1,592 $4,850
June 21, 2012 10
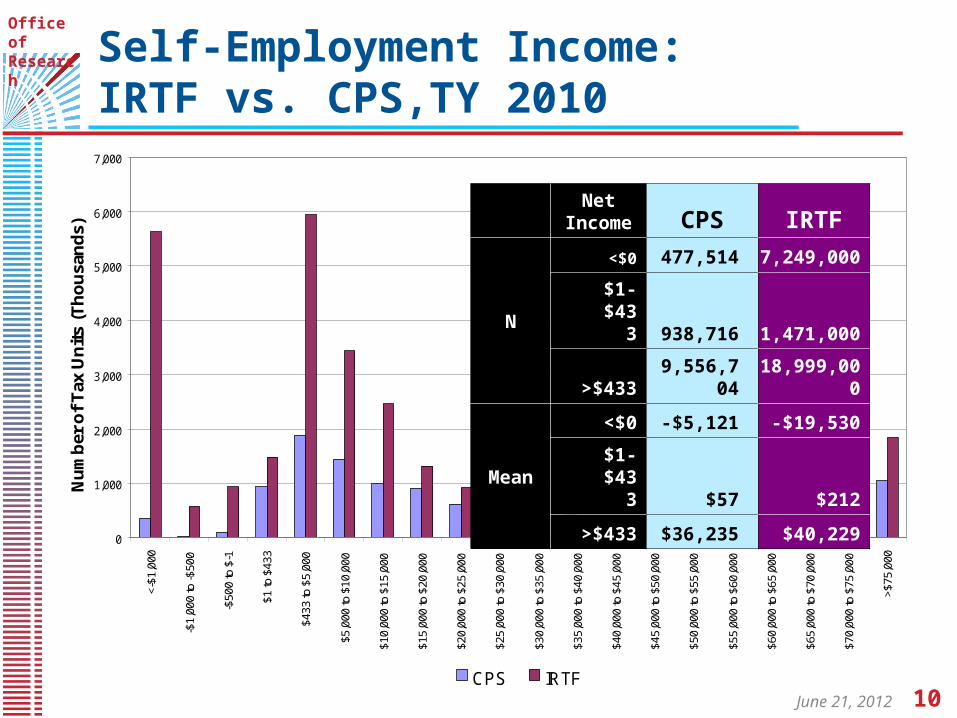
Office ofResearch Self-Employment Income:
IRTF vs. CPS,TY 2010
0
1,000
2,000
3,000
4,000
5,000
6,000
7,000<-
$1,0
00
-$1,
000
to -$
500
-$50
0 to
$-1
$1 to
$43
3
$433
to $
5,00
0
$5,0
00 to
$10
,000
$10,
000
to $
15,0
00
$15,
000
to $
20,0
00
$20,
000
to $
25,0
00
$25,
000
to $
30,0
00
$30,
000
to $
35,0
00
$35,
000
to $
40,0
00
$40,
000
to $
45,0
00
$45,
000
to $
50,0
00
$50,
000
to $
55,0
00
$55,
000
to $
60,0
00
$60,
000
to $
65,0
00
$65,
000
to $
70,0
00
$70,
000
to $
75,0
00
>$75
,000
Nu
mb
er o
f T
ax U
nit
s (T
ho
usa
nd
s)
CPS IRTF
Net Income CPS IRTF
N
<$0 477,514 7,249,000
$1-$433 938,716 1,471,000
>$4339,556,70
4 18,999,000
Mean
<$0 -$5,121 -$19,530
$1-$433 $57 $212
>$433 $36,235 $40,229
June 21, 2012 11
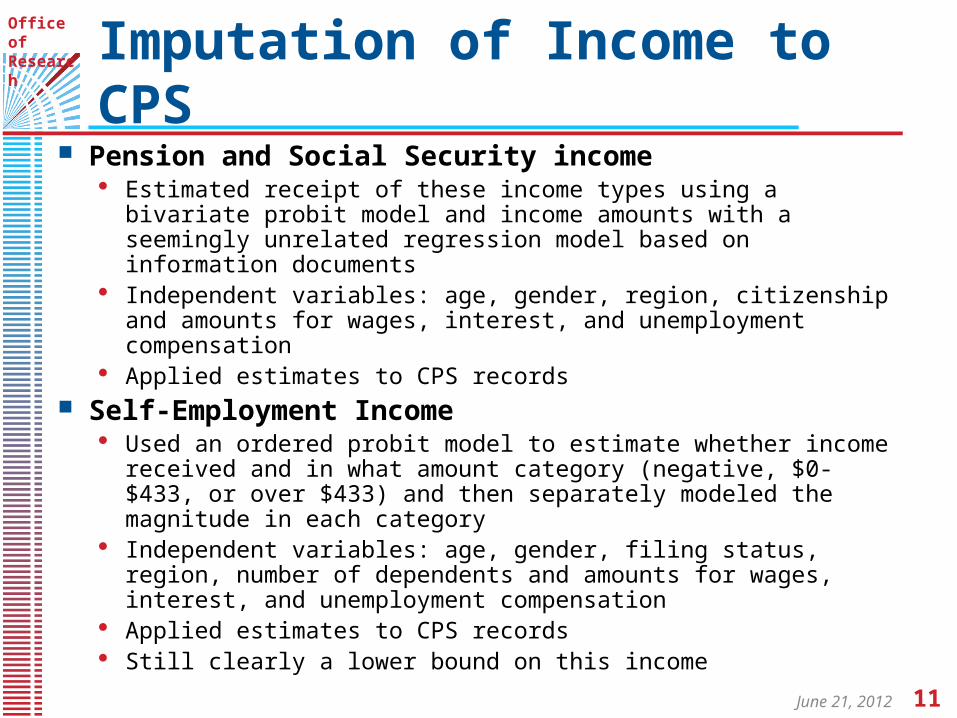
Office ofResearch Imputation of Income to
CPS Pension and Social Security income
Estimated receipt of these income types using a bivariate probit model and income amounts with a seemingly unrelated regression model based on information documents
Independent variables: age, gender, region, citizenship and amounts for wages, interest, and unemployment compensation
Applied estimates to CPS records Self-Employment Income
Used an ordered probit model to estimate whether income received and in what amount category (negative, $0-$433, or over $433) and then separately modeled the magnitude in each category
Independent variables: age, gender, filing status, region, number of dependents and amounts for wages, interest, and unemployment compensation
Applied estimates to CPS records Still clearly a lower bound on this income

June 21, 2012 12
Office ofResearch
Impact of Imputations
2007 2008 2009
Without imputing any income to CPS 114.8 114.1 112.1
Increment from imputing only Social Security and pension income
4.4 4.2 5.1
Increment from imputing only self-employment income
3.6 4.7 5.2
Number double-counted in the two increments -0.5 0.0 -0.5
Total after all imputations 122.3 123.0 122.0
Estimated Number of Required Returns, CPS (millions)
June 21, 2012 13
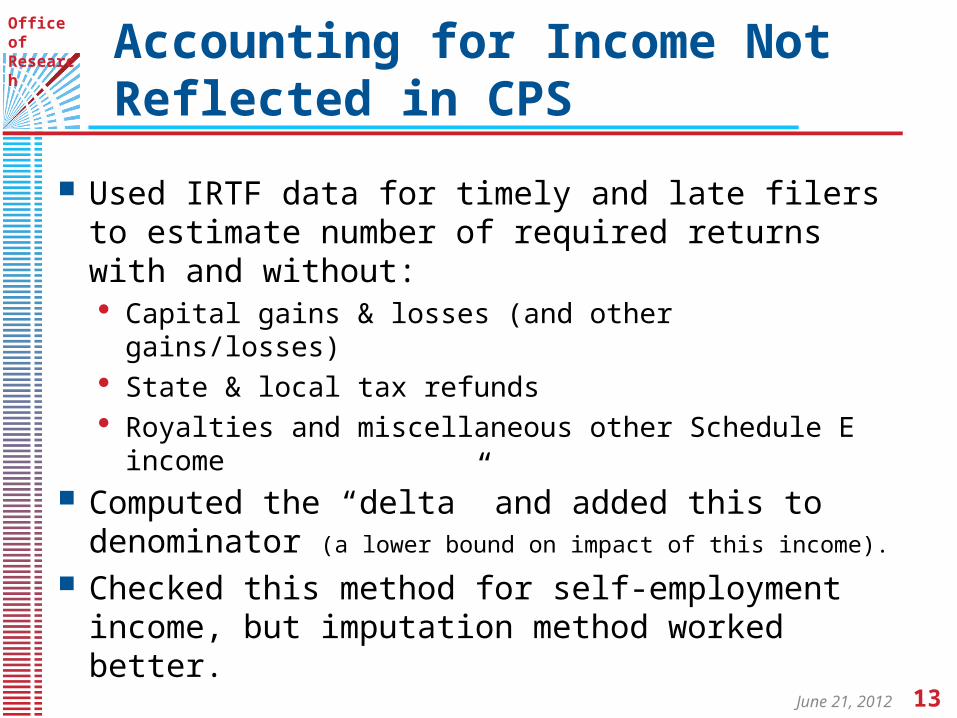
Office ofResearch Accounting for Income Not
Reflected in CPS
Used IRTF data for timely and late filers to estimate number of required returns with and without: Capital gains & losses (and other gains/losses) State & local tax refunds Royalties and miscellaneous other Schedule E income
Computed the “delta” and added this to denominator (a lower bound on impact of this income).
Checked this method for self-employment income, but imputation method worked better.

June 21, 2012 14
Office ofResearch
Estimated VFR Trend
Individual Income Tax Voluntary Filing RateNumber of Required Returns Filed on Time / Total Number Required to be Filed
80
82
84
86
88
90
92
94
96
98
100
1999 2000 2001 2002 2003 2004 2005 2006 2007 2008 2009
Tax Year
Pe
rce
nt
June 21, 2012 15
Office ofResearch
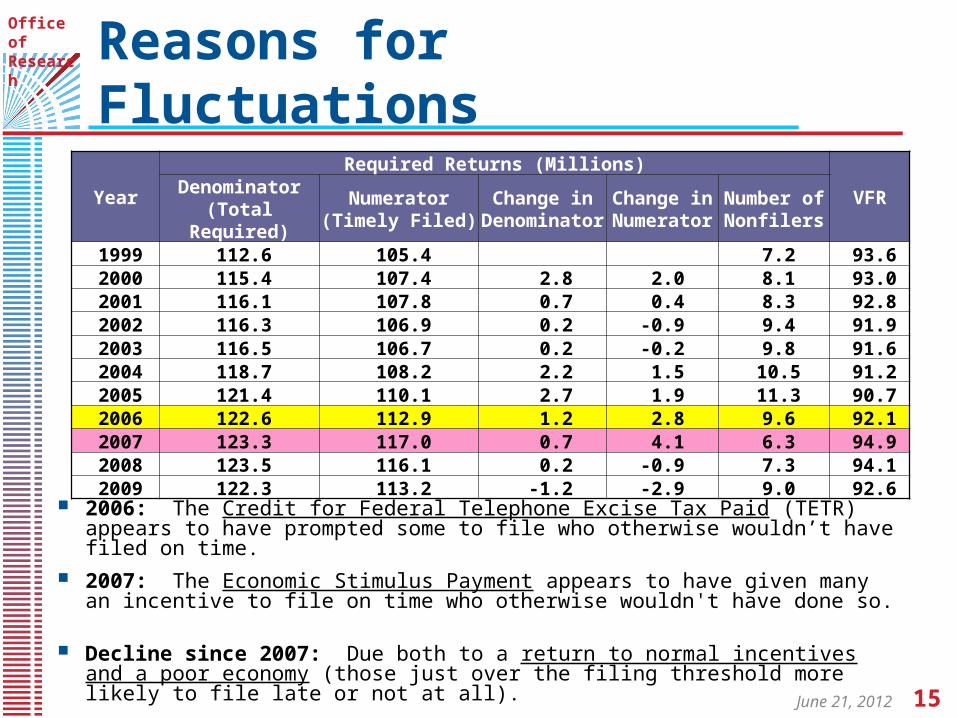
Reasons for Fluctuations
2006: The Credit for Federal Telephone Excise Tax Paid (TETR) appears to have prompted some to file who otherwise wouldn’t have filed on time.
2007: The Economic Stimulus Payment appears to have given many an incentive to file on time who otherwise wouldn't have done so.
Decline since 2007: Due both to a return to normal incentives and a poor economy (those just over the filing threshold more likely to file late or not at all).
YearRequired Returns (Millions)
VFRDenominator (Total Required)
Numerator (Timely Filed)
Change in Denominator
Change in Numerator
Number of Nonfilers
1999 112.6 105.4 7.2 93.62000 115.4 107.4 2.8 2.0 8.1 93.02001 116.1 107.8 0.7 0.4 8.3 92.82002 116.3 106.9 0.2 -0.9 9.4 91.92003 116.5 106.7 0.2 -0.2 9.8 91.62004 118.7 108.2 2.2 1.5 10.5 91.22005 121.4 110.1 2.7 1.9 11.3 90.72006 122.6 112.9 1.2 2.8 9.6 92.12007 123.3 117.0 0.7 4.1 6.3 94.92008 123.5 116.1 0.2 -0.9 7.3 94.12009 122.3 113.2 -1.2 -2.9 9.0 92.6
June 21, 2012 16
Office ofResearch
Benefits of VFR Analysis
Improved understanding of the extent to which Census understates certain income types
Developed a reasonable approach to imputing these incomes to the CPS each year
Better understanding of the drivers of VFR fluctuations over time
Improved 1040 instructions about the filing requirement