Embed Size (px)
Citation preview
Zbigniew SchabowskiWhittle Laboratory,
University of Cambridge,
Cambridge CB3 0DY, UK
Howard HodsonWhittle Laboratory,
University of Cambridge,
Cambridge CB3 0DY, UK
Davide GiaccheWhittle Laboratory,
University of Cambridge,
Cambridge CB3 0DY, UK
Bronwyn PowerWhittle Laboratory,
University of Cambridge,
Cambridge CB3 0DY, UK
Mark R. StokesRolls-Royce Plc.,
P.O. Box 31,
Derby DE24 8BJ, UK
Aeromechanical Optimizationof a Winglet-Squealer Tipfor an Axial TurbineThe possibility of reducing the over tip leakage loss of unshrouded axial turbine rotorshas been investigated in an experiment using a linear cascade of turbine blades and byusing CFD. A numerical optimization of a winglet-squealer geometry was performed.The optimization involved the structural analysis alongside the CFD. Significant effectsof the tip design on the tip gap flow pattern, loss generation and mechanical deformationunder centrifugal loads were found. The results of the optimization process were verifiedby low speed cascade testing. The measurements showed that the optimized winglet-squealer design had a lower loss than the flat tip at all of the tested tip gaps. At the sametime, it offered a 37% reduction in the rate of change of the aerodynamic loss with thetip gap size. The optimized tip geometry was used to experimentally assess the effects ofthe opening of the tip cavity in the leading edge part of the blade and the inclination ofthe pressure side squealer from the radial direction. The opening of the cavity had anegligible effect on the aerodynamic performance of the cascade. The squealer leanresulted in a small reduction of the aerodynamic loss at all the tested tip gaps. It wasshown that a careful consideration of the mechanical aspects of the winglet is requiredduring the design process. Mechanically unconstrained designs could result in unac-ceptable deformation of the winglet due to centrifugal loads. An example winglet geome-try is presented that produced a similar aerodynamic loss to that of the optimized tip buthad a much worse mechanical performance. The mechanisms leading to the reduction ofthe tip leakage loss were identified. Using this knowledge, a simple method for designingthe tip geometry of a shroudless turbine rotor is proposed. Numerical calculations indi-cated that the optimized low-speed winglet-squealer geometry maintained its aerody-namic superiority over the flat tip blade with the exit Mach number increased from 0.1to 0.8. [DOI: 10.1115/1.4025687]
Introduction
The clearance gap between the unshrouded blade tips and thecasing of axial flow turbines is usually of the order of 1–2% of theblade span. This results in fluid leaking over the blade, which hasa significant effect on turbine performance. Hourmouziadis andAlbrecht [1] showed that for a shroudless stage an increase in thetip gap size equal to 1% of the blade span caused around a 2%drop in the stage efficiency. They also showed that the tip clear-ance varies considerably during the operation of an engine due tothermal and mechanical loads.
The fluid leaks over the blade tip because of the pressure differ-ence between the pressure and suction surface of the blade. Theover tip leakage flow has both a different velocity and angle whencompared to the blade passage flow. These differences, accordingto Denton [2], have two fundamental effects. Firstly, the leakingflow reduces the mass flow through the blade passage, whichreduces the work done by the fluid on the blade. Secondly, theflow issuing from the tip gap mixes with the main passage flow,which may be responsible for as much as 30% of the total aerody-namic loss in the stage of a modern high-pressure turbine.
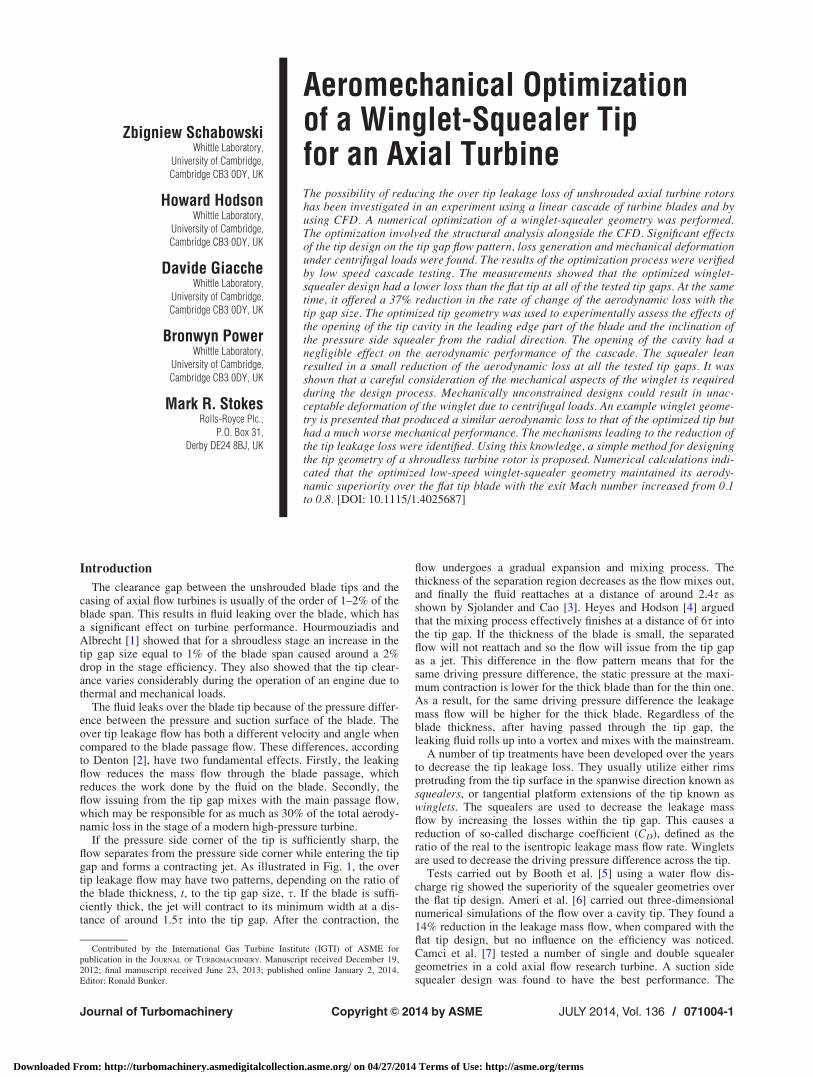
If the pressure side corner of the tip is sufficiently sharp, theflow separates from the pressure side corner while entering the tipgap and forms a contracting jet. As illustrated in Fig. 1, the overtip leakage flow may have two patterns, depending on the ratio ofthe blade thickness, t, to the tip gap size, s. If the blade is suffi-ciently thick, the jet will contract to its minimum width at a dis-tance of around 1.5s into the tip gap. After the contraction, the
flow undergoes a gradual expansion and mixing process. Thethickness of the separation region decreases as the flow mixes out,and finally the fluid reattaches at a distance of around 2.4s asshown by Sjolander and Cao [3]. Heyes and Hodson [4] arguedthat the mixing process effectively finishes at a distance of 6s intothe tip gap. If the thickness of the blade is small, the separatedflow will not reattach and so the flow will issue from the tip gapas a jet. This difference in the flow pattern means that for thesame driving pressure difference, the static pressure at the maxi-mum contraction is lower for the thick blade than for the thin one.As a result, for the same driving pressure difference the leakagemass flow will be higher for the thick blade. Regardless of theblade thickness, after having passed through the tip gap, theleaking fluid rolls up into a vortex and mixes with the mainstream.
A number of tip treatments have been developed over the yearsto decrease the tip leakage loss. They usually utilize either rimsprotruding from the tip surface in the spanwise direction known assquealers, or tangential platform extensions of the tip known aswinglets. The squealers are used to decrease the leakage massflow by increasing the losses within the tip gap. This causes areduction of so-called discharge coefficient (CD), defined as theratio of the real to the isentropic leakage mass flow rate. Wingletsare used to decrease the driving pressure difference across the tip.
Tests carried out by Booth et al. [5] using a water flow dis-charge rig showed the superiority of the squealer geometries overthe flat tip design. Ameri et al. [6] carried out three-dimensionalnumerical simulations of the flow over a cavity tip. They found a14% reduction in the leakage mass flow, when compared with theflat tip design, but no influence on the efficiency was noticed.Camci et al. [7] tested a number of single and double squealergeometries in a cold axial flow research turbine. A suction sidesquealer design was found to have the best performance. The
Contributed by the International Gas Turbine Institute (IGTI) of ASME forpublication in the JOURNAL OF TURBOMACHINERY. Manuscript received December 19,2012; final manuscript received June 23, 2013; published online January 2, 2014.Editor: Ronald Bunker.
Journal of Turbomachinery JULY 2014, Vol. 136 / 071004-1Copyright VC 2014 by ASME
Downloaded From: http://turbomachinery.asmedigitalcollection.asme.org/ on 04/27/2014 Terms of Use: http://asme.org/terms
experimental and numerical results presented by Zhou and Hod-son [8] indicated that in the uncooled case the cavity tip per-formed better than the flat tip and suction side squealer tip acrossa range of tip gaps.
The double-sided winglet design investigated by Patel [9]resulted in an efficiency improvement of 1.2% at a tip gap heightequal to 3% of span. The winglet had no influence on the effi-ciency slope, defined as the ratio of the change in the stage effi-ciency to the change in the clearance-to-span ratio. Booth et al.[5], in addition to the squealer designs mentioned earlier, tested anumber of winglet geometries. A simple double-sided wingletdesign had the best performance. In the cascade tests of Yaras andSjolander [10], both pressure and suction side winglets, as well asthe double-sided winglet gave about a 10% reduction in the tipleakage loss. However, Schabowski and Hodson [11] showed thata suction side winglet gave a better reduction in the tip leakagedriving pressure than the pressure side winglet.
Harvey and Ramsden [12] presented a partial shroud design,which combined a double-sided winglet with a double-squealer.The squealers, however, were not of equal thickness along thechord but were of airfoil shape. The authors argued that, in effect,this halved the pitch to chord ratio in the tip region. The CFDresults showed 31% decrease in the leakage loss exchange ratewhen compared with the flat tip design. The results of model rigtests presented by Harvey et al. [13] showed that this wingletdesign had a performance similar to a shrouded design with twofins.
In HP turbines, the thermal effect of the leakage flow is alsovery important. However, it will not be discussed here since thispaper is focused on the aerodynamics. A comprehensive overviewof the early work done on the thermal aspects of tip leakage flowsmay be found in Bunker [14].
The present paper describes a study of the aerodynamic aspectsof tip leakage flow in shroudless turbines. A numerical optimiza-tion process of a winglet-squealer geometry is described. The wayin which the geometry was parameterized and the way in which
the optimization process was carried out was designed to reachseveral goals. The first goal was to gain more insight into theeffect of the winglet shape and squealer size on the flow physicsand tip performance. The second was to investigate the trade-offsbetween the winglet performance, its size, and its structural integ-rity. The third goal was to verify whether a multidisciplinary opti-mization of a relatively complicated geometry, such as winglet,may be carried out with practical resources. The final goal was toverify experimentally the results of the numerical optimizationprocess. This would show whether the CFD validation, which hadbeen carried out using the geometries described in Schabowskiand Hodson [11] was sufficient to allow the design of a wingletwith a significantly improved performance.
Experimental Method
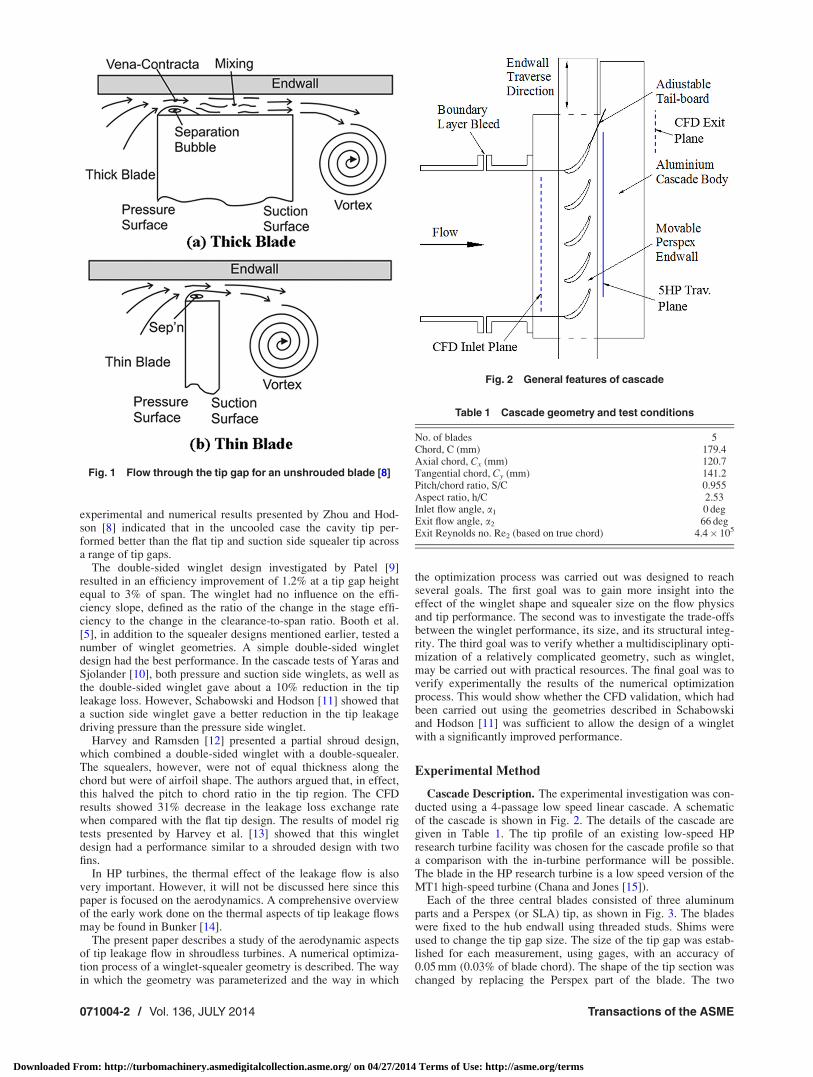
Cascade Description. The experimental investigation was con-ducted using a 4-passage low speed linear cascade. A schematicof the cascade is shown in Fig. 2. The details of the cascade aregiven in Table 1. The tip profile of an existing low-speed HPresearch turbine facility was chosen for the cascade profile so thata comparison with the in-turbine performance will be possible.The blade in the HP research turbine is a low speed version of theMT1 high-speed turbine (Chana and Jones [15]).
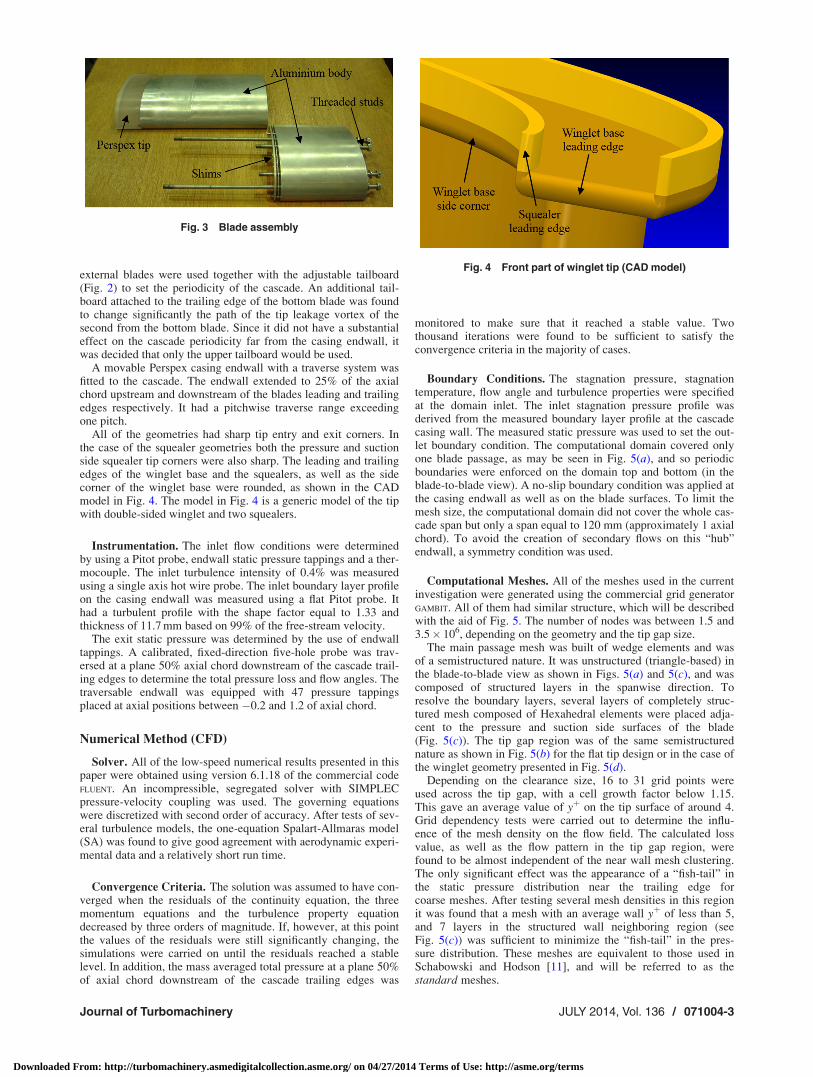
Each of the three central blades consisted of three aluminumparts and a Perspex (or SLA) tip, as shown in Fig. 3. The bladeswere fixed to the hub endwall using threaded studs. Shims wereused to change the tip gap size. The size of the tip gap was estab-lished for each measurement, using gages, with an accuracy of0.05 mm (0.03% of blade chord). The shape of the tip section waschanged by replacing the Perspex part of the blade. The two
Fig. 1 Flow through the tip gap for an unshrouded blade [8]
Fig. 2 General features of cascade
Table 1 Cascade geometry and test conditions
No. of blades 5Chord, C (mm) 179.4Axial chord, Cx (mm) 120.7Tangential chord, Cy (mm) 141.2Pitch/chord ratio, S/C 0.955Aspect ratio, h/C 2.53Inlet flow angle, a1 0 degExit flow angle, a2 66 degExit Reynolds no. Re2 (based on true chord) 4.4� 105
071004-2 / Vol. 136, JULY 2014 Transactions of the ASME
Downloaded From: http://turbomachinery.asmedigitalcollection.asme.org/ on 04/27/2014 Terms of Use: http://asme.org/terms
external blades were used together with the adjustable tailboard(Fig. 2) to set the periodicity of the cascade. An additional tail-board attached to the trailing edge of the bottom blade was foundto change significantly the path of the tip leakage vortex of thesecond from the bottom blade. Since it did not have a substantialeffect on the cascade periodicity far from the casing endwall, itwas decided that only the upper tailboard would be used.
A movable Perspex casing endwall with a traverse system wasfitted to the cascade. The endwall extended to 25% of the axialchord upstream and downstream of the blades leading and trailingedges respectively. It had a pitchwise traverse range exceedingone pitch.
All of the geometries had sharp tip entry and exit corners. Inthe case of the squealer geometries both the pressure and suctionside squealer tip corners were also sharp. The leading and trailingedges of the winglet base and the squealers, as well as the sidecorner of the winglet base were rounded, as shown in the CADmodel in Fig. 4. The model in Fig. 4 is a generic model of the tipwith double-sided winglet and two squealers.
Instrumentation. The inlet flow conditions were determinedby using a Pitot probe, endwall static pressure tappings and a ther-mocouple. The inlet turbulence intensity of 0.4% was measuredusing a single axis hot wire probe. The inlet boundary layer profileon the casing endwall was measured using a flat Pitot probe. Ithad a turbulent profile with the shape factor equal to 1.33 andthickness of 11.7 mm based on 99% of the free-stream velocity.
The exit static pressure was determined by the use of endwalltappings. A calibrated, fixed-direction five-hole probe was trav-ersed at a plane 50% axial chord downstream of the cascade trail-ing edges to determine the total pressure loss and flow angles. Thetraversable endwall was equipped with 47 pressure tappingsplaced at axial positions between �0.2 and 1.2 of axial chord.
Numerical Method (CFD)
Solver. All of the low-speed numerical results presented in thispaper were obtained using version 6.1.18 of the commercial codeFLUENT. An incompressible, segregated solver with SIMPLECpressure-velocity coupling was used. The governing equationswere discretized with second order of accuracy. After tests of sev-eral turbulence models, the one-equation Spalart-Allmaras model(SA) was found to give good agreement with aerodynamic experi-mental data and a relatively short run time.
Convergence Criteria. The solution was assumed to have con-verged when the residuals of the continuity equation, the threemomentum equations and the turbulence property equationdecreased by three orders of magnitude. If, however, at this pointthe values of the residuals were still significantly changing, thesimulations were carried on until the residuals reached a stablelevel. In addition, the mass averaged total pressure at a plane 50%of axial chord downstream of the cascade trailing edges was
monitored to make sure that it reached a stable value. Twothousand iterations were found to be sufficient to satisfy theconvergence criteria in the majority of cases.
Boundary Conditions. The stagnation pressure, stagnationtemperature, flow angle and turbulence properties were specifiedat the domain inlet. The inlet stagnation pressure profile wasderived from the measured boundary layer profile at the cascadecasing wall. The measured static pressure was used to set the out-let boundary condition. The computational domain covered onlyone blade passage, as may be seen in Fig. 5(a), and so periodicboundaries were enforced on the domain top and bottom (in theblade-to-blade view). A no-slip boundary condition was applied atthe casing endwall as well as on the blade surfaces. To limit themesh size, the computational domain did not cover the whole cas-cade span but only a span equal to 120 mm (approximately 1 axialchord). To avoid the creation of secondary flows on this “hub”endwall, a symmetry condition was used.
Computational Meshes. All of the meshes used in the currentinvestigation were generated using the commercial grid generatorGAMBIT. All of them had similar structure, which will be describedwith the aid of Fig. 5. The number of nodes was between 1.5 and3.5� 106, depending on the geometry and the tip gap size.
The main passage mesh was built of wedge elements and wasof a semistructured nature. It was unstructured (triangle-based) inthe blade-to-blade view as shown in Figs. 5(a) and 5(c), and wascomposed of structured layers in the spanwise direction. Toresolve the boundary layers, several layers of completely struc-tured mesh composed of Hexahedral elements were placed adja-cent to the pressure and suction side surfaces of the blade(Fig. 5(c)). The tip gap region was of the same semistructurednature as shown in Fig. 5(b) for the flat tip design or in the case ofthe winglet geometry presented in Fig. 5(d).
Depending on the clearance size, 16 to 31 grid points wereused across the tip gap, with a cell growth factor below 1.15.This gave an average value of yþ on the tip surface of around 4.Grid dependency tests were carried out to determine the influ-ence of the mesh density on the flow field. The calculated lossvalue, as well as the flow pattern in the tip gap region, werefound to be almost independent of the near wall mesh clustering.The only significant effect was the appearance of a “fish-tail” inthe static pressure distribution near the trailing edge forcoarse meshes. After testing several mesh densities in this regionit was found that a mesh with an average wall yþ of less than 5,and 7 layers in the structured wall neighboring region (seeFig. 5(c)) was sufficient to minimize the “fish-tail” in the pres-sure distribution. These meshes are equivalent to those used inSchabowski and Hodson [11], and will be referred to as thestandard meshes.
Fig. 4 Front part of winglet tip (CAD model)
Fig. 3 Blade assembly
Journal of Turbomachinery JULY 2014, Vol. 136 / 071004-3
Downloaded From: http://turbomachinery.asmedigitalcollection.asme.org/ on 04/27/2014 Terms of Use: http://asme.org/terms
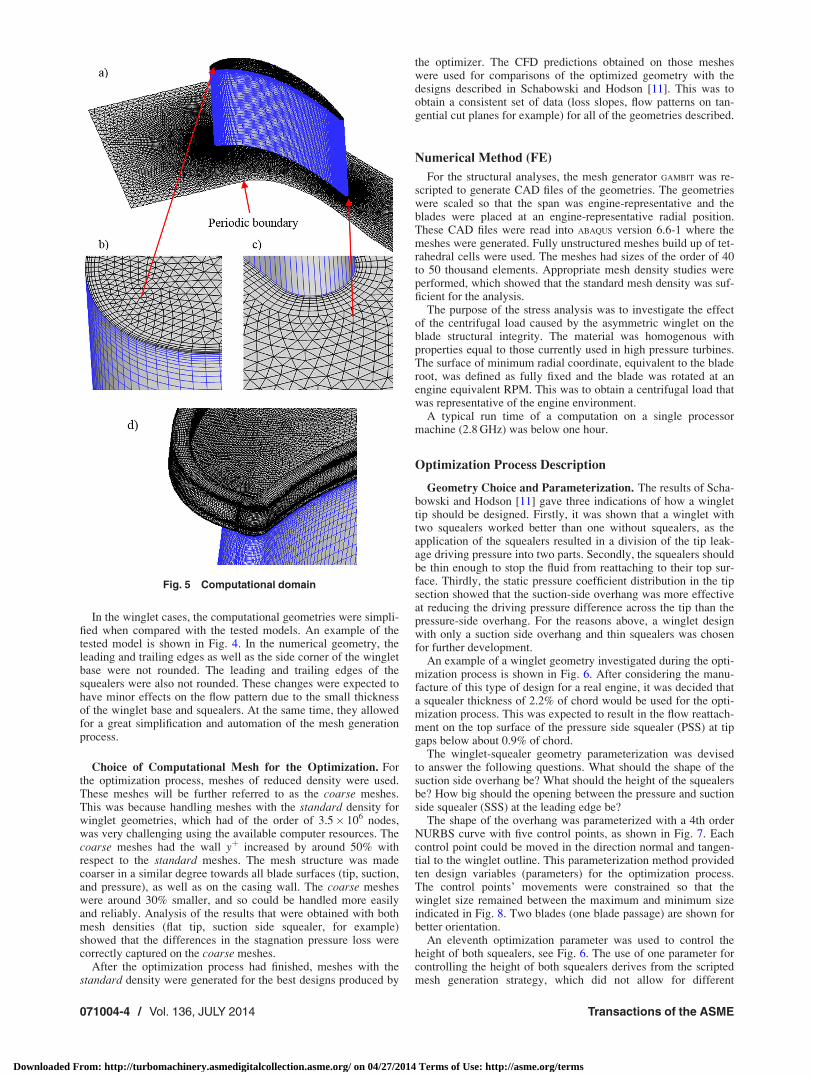
In the winglet cases, the computational geometries were simpli-fied when compared with the tested models. An example of thetested model is shown in Fig. 4. In the numerical geometry, theleading and trailing edges as well as the side corner of the wingletbase were not rounded. The leading and trailing edges of thesquealers were also not rounded. These changes were expected tohave minor effects on the flow pattern due to the small thicknessof the winglet base and squealers. At the same time, they allowedfor a great simplification and automation of the mesh generationprocess.
Choice of Computational Mesh for the Optimization. Forthe optimization process, meshes of reduced density were used.These meshes will be further referred to as the coarse meshes.This was because handling meshes with the standard density forwinglet geometries, which had of the order of 3.5� 106 nodes,was very challenging using the available computer resources. Thecoarse meshes had the wall yþ increased by around 50% withrespect to the standard meshes. The mesh structure was madecoarser in a similar degree towards all blade surfaces (tip, suction,and pressure), as well as on the casing wall. The coarse mesheswere around 30% smaller, and so could be handled more easilyand reliably. Analysis of the results that were obtained with bothmesh densities (flat tip, suction side squealer, for example)showed that the differences in the stagnation pressure loss werecorrectly captured on the coarse meshes.
After the optimization process had finished, meshes with thestandard density were generated for the best designs produced by
the optimizer. The CFD predictions obtained on those mesheswere used for comparisons of the optimized geometry with thedesigns described in Schabowski and Hodson [11]. This was toobtain a consistent set of data (loss slopes, flow patterns on tan-gential cut planes for example) for all of the geometries described.
Numerical Method (FE)
For the structural analyses, the mesh generator GAMBIT was re-scripted to generate CAD files of the geometries. The geometrieswere scaled so that the span was engine-representative and theblades were placed at an engine-representative radial position.These CAD files were read into ABAQUS version 6.6-1 where themeshes were generated. Fully unstructured meshes build up of tet-rahedral cells were used. The meshes had sizes of the order of 40to 50 thousand elements. Appropriate mesh density studies wereperformed, which showed that the standard mesh density was suf-ficient for the analysis.
The purpose of the stress analysis was to investigate the effectof the centrifugal load caused by the asymmetric winglet on theblade structural integrity. The material was homogenous withproperties equal to those currently used in high pressure turbines.The surface of minimum radial coordinate, equivalent to the bladeroot, was defined as fully fixed and the blade was rotated at anengine equivalent RPM. This was to obtain a centrifugal load thatwas representative of the engine environment.
A typical run time of a computation on a single processormachine (2.8 GHz) was below one hour.
Optimization Process Description
Geometry Choice and Parameterization. The results of Scha-bowski and Hodson [11] gave three indications of how a winglettip should be designed. Firstly, it was shown that a winglet withtwo squealers worked better than one without squealers, as theapplication of the squealers resulted in a division of the tip leak-age driving pressure into two parts. Secondly, the squealers shouldbe thin enough to stop the fluid from reattaching to their top sur-face. Thirdly, the static pressure coefficient distribution in the tipsection showed that the suction-side overhang was more effectiveat reducing the driving pressure difference across the tip than thepressure-side overhang. For the reasons above, a winglet designwith only a suction side overhang and thin squealers was chosenfor further development.
An example of a winglet geometry investigated during the opti-mization process is shown in Fig. 6. After considering the manu-facture of this type of design for a real engine, it was decided thata squealer thickness of 2.2% of chord would be used for the opti-mization process. This was expected to result in the flow reattach-ment on the top surface of the pressure side squealer (PSS) at tipgaps below about 0.9% of chord.
The winglet-squealer geometry parameterization was devisedto answer the following questions. What should the shape of thesuction side overhang be? What should the height of the squealersbe? How big should the opening between the pressure and suctionside squealer (SSS) at the leading edge be?
The shape of the overhang was parameterized with a 4th orderNURBS curve with five control points, as shown in Fig. 7. Eachcontrol point could be moved in the direction normal and tangen-tial to the winglet outline. This parameterization method providedten design variables (parameters) for the optimization process.The control points’ movements were constrained so that thewinglet size remained between the maximum and minimum sizeindicated in Fig. 8. Two blades (one blade passage) are shown forbetter orientation.
An eleventh optimization parameter was used to control theheight of both squealers, see Fig. 6. The use of one parameter forcontrolling the height of both squealers derives from the scriptedmesh generation strategy, which did not allow for different
Fig. 5 Computational domain
071004-4 / Vol. 136, JULY 2014 Transactions of the ASME
Downloaded From: http://turbomachinery.asmedigitalcollection.asme.org/ on 04/27/2014 Terms of Use: http://asme.org/terms
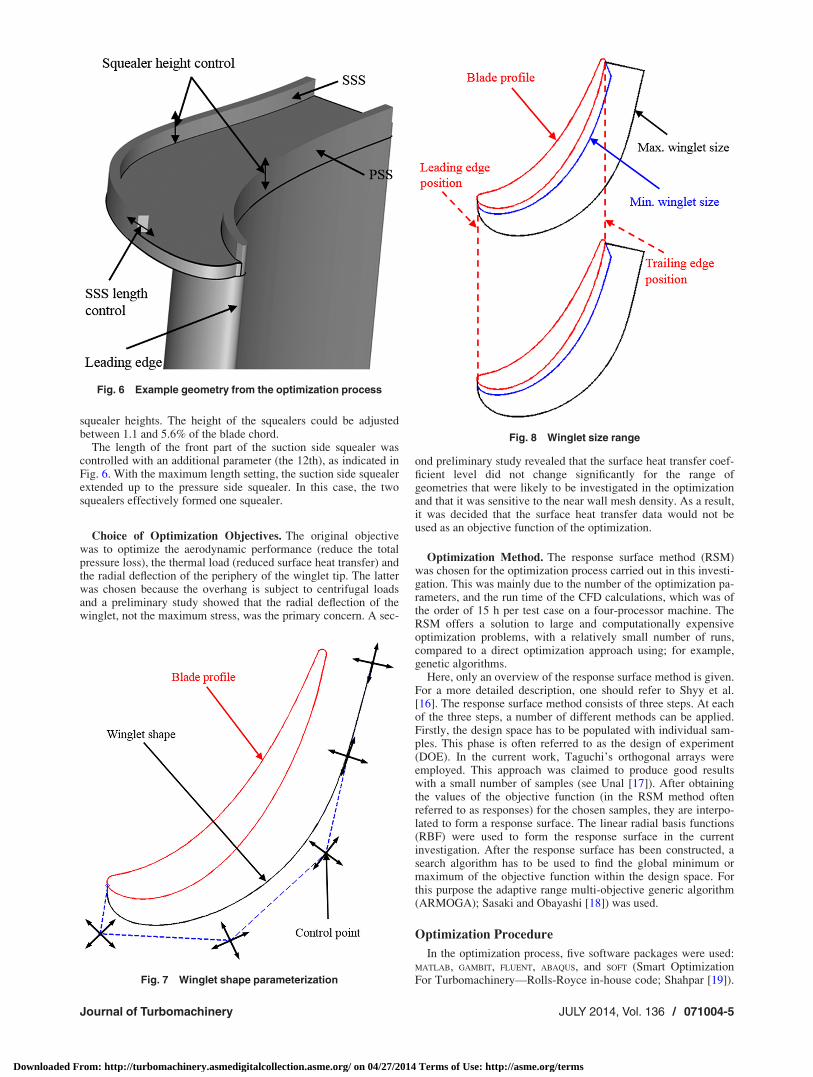
squealer heights. The height of the squealers could be adjustedbetween 1.1 and 5.6% of the blade chord.
The length of the front part of the suction side squealer wascontrolled with an additional parameter (the 12th), as indicated inFig. 6. With the maximum length setting, the suction side squealerextended up to the pressure side squealer. In this case, the twosquealers effectively formed one squealer.
Choice of Optimization Objectives. The original objectivewas to optimize the aerodynamic performance (reduce the totalpressure loss), the thermal load (reduced surface heat transfer) andthe radial deflection of the periphery of the winglet tip. The latterwas chosen because the overhang is subject to centrifugal loadsand a preliminary study showed that the radial deflection of thewinglet, not the maximum stress, was the primary concern. A sec-
ond preliminary study revealed that the surface heat transfer coef-ficient level did not change significantly for the range ofgeometries that were likely to be investigated in the optimizationand that it was sensitive to the near wall mesh density. As a result,it was decided that the surface heat transfer data would not beused as an objective function of the optimization.
Optimization Method. The response surface method (RSM)was chosen for the optimization process carried out in this investi-gation. This was mainly due to the number of the optimization pa-rameters, and the run time of the CFD calculations, which was ofthe order of 15 h per test case on a four-processor machine. TheRSM offers a solution to large and computationally expensiveoptimization problems, with a relatively small number of runs,compared to a direct optimization approach using; for example,genetic algorithms.
Here, only an overview of the response surface method is given.For a more detailed description, one should refer to Shyy et al.[16]. The response surface method consists of three steps. At eachof the three steps, a number of different methods can be applied.Firstly, the design space has to be populated with individual sam-ples. This phase is often referred to as the design of experiment(DOE). In the current work, Taguchi’s orthogonal arrays wereemployed. This approach was claimed to produce good resultswith a small number of samples (see Unal [17]). After obtainingthe values of the objective function (in the RSM method oftenreferred to as responses) for the chosen samples, they are interpo-lated to form a response surface. The linear radial basis functions(RBF) were used to form the response surface in the currentinvestigation. After the response surface has been constructed, asearch algorithm has to be used to find the global minimum ormaximum of the objective function within the design space. Forthis purpose the adaptive range multi-objective generic algorithm(ARMOGA); Sasaki and Obayashi [18]) was used.
Optimization Procedure
In the optimization process, five software packages were used:MATLAB, GAMBIT, FLUENT, ABAQUS, and SOFT (Smart OptimizationFor Turbomachinery—Rolls-Royce in-house code; Shahpar [19]).
Fig. 6 Example geometry from the optimization process
Fig. 7 Winglet shape parameterization
Fig. 8 Winglet size range
Journal of Turbomachinery JULY 2014, Vol. 136 / 071004-5
Downloaded From: http://turbomachinery.asmedigitalcollection.asme.org/ on 04/27/2014 Terms of Use: http://asme.org/terms
The Taguchi design of experiment method was used in SOFT togenerate the initial set of test cases. For the 12 optimization pa-rameters, each having five levels, the Taguchi orthogonal arrayresulted in 125 initial test cases. A MATLAB script was used to readthe file generated by SOFT, and produce the shape of the suctionside winglet overhang for each test case, based on the set of opti-mization parameters. The same MATLAB script was used to gener-ate a journal file for GAMBIT. This journal file was used in GAMBIT
to generate a mesh, set the boundary condition types and exportthe mesh file. Another, MATLAB-generated journal file was used inFLUENT to read the mesh file, set the solver parameters, the bound-ary conditions and other required parameters. After the test casehas been run on the cluster, another MATLAB-generated FLUENT
script was used for the postprocessing of the solution.ABAQUS was used to carry out the structural analysis of the test
cases in parallel with the CFD simulations in FLUENT. To do that,GAMBIT was rescripted to generate CAD files of the geometriesinstead of the meshes for the CFD. ABAQUS was scripted to readthe CAD files, set the boundary conditions and automaticallymesh the geometries. After the stress analysis had been run, themaximum radial deflection value was extracted, and used togetherwith the stagnation pressure loss value as an input for SOFT.
In the final step, the results were read into SOFT, in which theresponse surface was generated and the ARMOGA algorithm wasused to find the minimum of the objective functions. As the twoobjective functions were dealt with separately, the result of theoptimization process was in the form of a Pareto front.
At this point, to verify the accuracy of the optimizer predic-tions, several cases from the Pareto front were chosen and the cal-culations were run for those geometries. The values of theobjective functions for these geometries were used to updatethe optimizer database, build a new response surface and run thesearch algorithm to find the new Pareto front. The process wasrepeated until the updates of the database stopped influencing theposition of the Pareto front.
Results of the Optimization Process
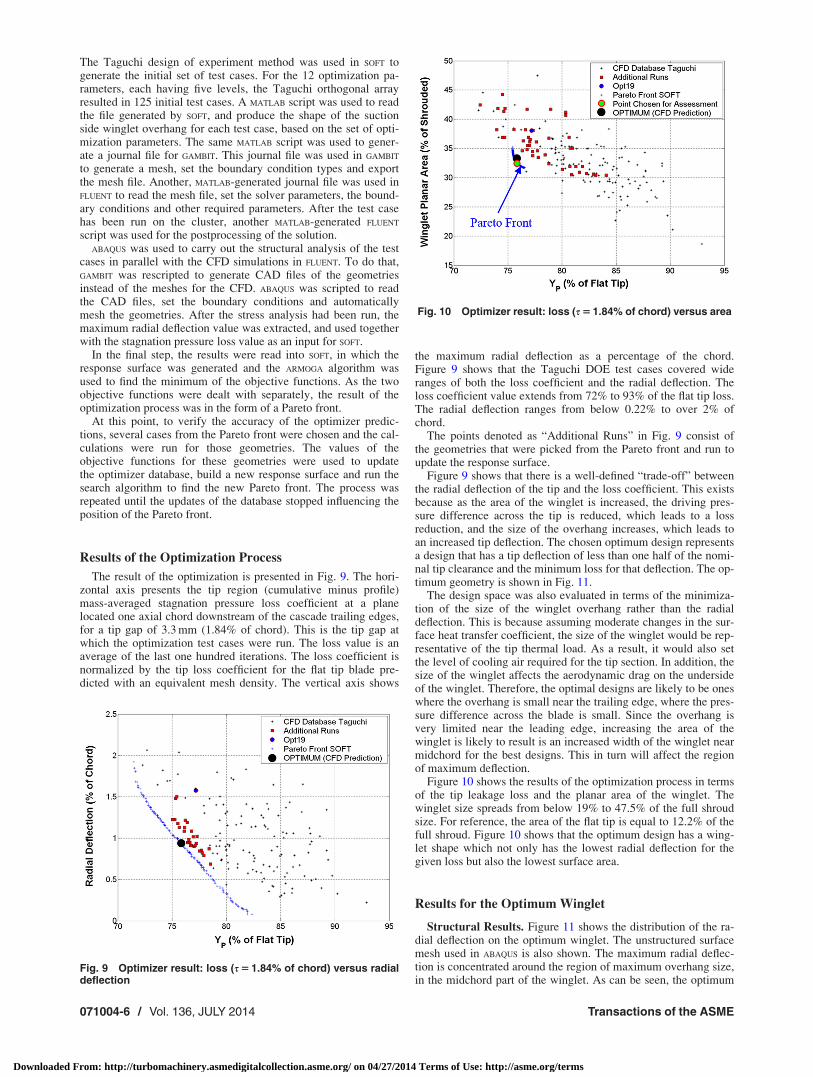
The result of the optimization is presented in Fig. 9. The hori-zontal axis presents the tip region (cumulative minus profile)mass-averaged stagnation pressure loss coefficient at a planelocated one axial chord downstream of the cascade trailing edges,for a tip gap of 3.3 mm (1.84% of chord). This is the tip gap atwhich the optimization test cases were run. The loss value is anaverage of the last one hundred iterations. The loss coefficient isnormalized by the tip loss coefficient for the flat tip blade pre-dicted with an equivalent mesh density. The vertical axis shows
the maximum radial deflection as a percentage of the chord.Figure 9 shows that the Taguchi DOE test cases covered wideranges of both the loss coefficient and the radial deflection. Theloss coefficient value extends from 72% to 93% of the flat tip loss.The radial deflection ranges from below 0.22% to over 2% ofchord.
The points denoted as “Additional Runs” in Fig. 9 consist ofthe geometries that were picked from the Pareto front and run toupdate the response surface.
Figure 9 shows that there is a well-defined “trade-off” betweenthe radial deflection of the tip and the loss coefficient. This existsbecause as the area of the winglet is increased, the driving pres-sure difference across the tip is reduced, which leads to a lossreduction, and the size of the overhang increases, which leads toan increased tip deflection. The chosen optimum design representsa design that has a tip deflection of less than one half of the nomi-nal tip clearance and the minimum loss for that deflection. The op-timum geometry is shown in Fig. 11.
The design space was also evaluated in terms of the minimiza-tion of the size of the winglet overhang rather than the radialdeflection. This is because assuming moderate changes in the sur-face heat transfer coefficient, the size of the winglet would be rep-resentative of the tip thermal load. As a result, it would also setthe level of cooling air required for the tip section. In addition, thesize of the winglet affects the aerodynamic drag on the undersideof the winglet. Therefore, the optimal designs are likely to be oneswhere the overhang is small near the trailing edge, where the pres-sure difference across the blade is small. Since the overhang isvery limited near the leading edge, increasing the area of thewinglet is likely to result is an increased width of the winglet nearmidchord for the best designs. This in turn will affect the regionof maximum deflection.
Figure 10 shows the results of the optimization process in termsof the tip leakage loss and the planar area of the winglet. Thewinglet size spreads from below 19% to 47.5% of the full shroudsize. For reference, the area of the flat tip is equal to 12.2% of thefull shroud. Figure 10 shows that the optimum design has a wing-let shape which not only has the lowest radial deflection for thegiven loss but also the lowest surface area.
Results for the Optimum Winglet
Structural Results. Figure 11 shows the distribution of the ra-dial deflection on the optimum winglet. The unstructured surfacemesh used in ABAQUS is also shown. The maximum radial deflec-tion is concentrated around the region of maximum overhang size,in the midchord part of the winglet. As can be seen, the optimum
Fig. 9 Optimizer result: loss (s 5 1.84% of chord) versus radialdeflection
Fig. 10 Optimizer result: loss (s 5 1.84% of chord) versus area
071004-6 / Vol. 136, JULY 2014 Transactions of the ASME
Downloaded From: http://turbomachinery.asmedigitalcollection.asme.org/ on 04/27/2014 Terms of Use: http://asme.org/terms
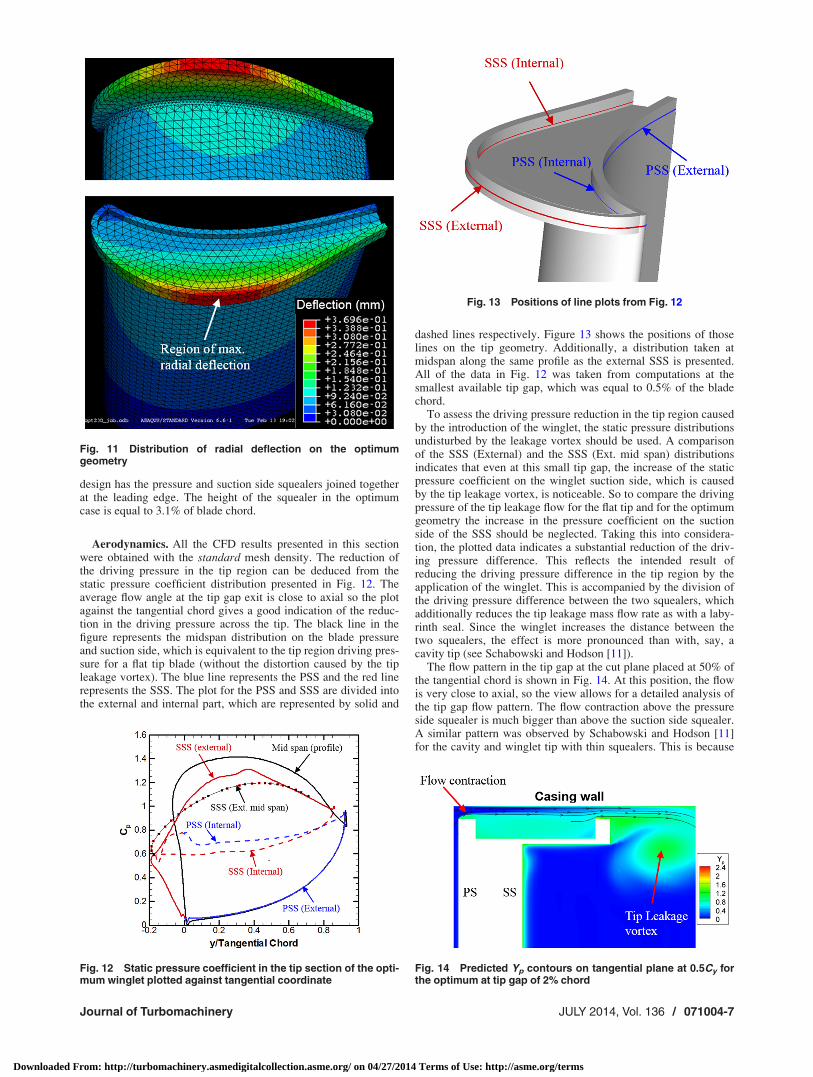
design has the pressure and suction side squealers joined togetherat the leading edge. The height of the squealer in the optimumcase is equal to 3.1% of blade chord.
Aerodynamics. All the CFD results presented in this sectionwere obtained with the standard mesh density. The reduction ofthe driving pressure in the tip region can be deduced from thestatic pressure coefficient distribution presented in Fig. 12. Theaverage flow angle at the tip gap exit is close to axial so the plotagainst the tangential chord gives a good indication of the reduc-tion in the driving pressure across the tip. The black line in thefigure represents the midspan distribution on the blade pressureand suction side, which is equivalent to the tip region driving pres-sure for a flat tip blade (without the distortion caused by the tipleakage vortex). The blue line represents the PSS and the red linerepresents the SSS. The plot for the PSS and SSS are divided intothe external and internal part, which are represented by solid and
dashed lines respectively. Figure 13 shows the positions of thoselines on the tip geometry. Additionally, a distribution taken atmidspan along the same profile as the external SSS is presented.All of the data in Fig. 12 was taken from computations at thesmallest available tip gap, which was equal to 0.5% of the bladechord.
To assess the driving pressure reduction in the tip region causedby the introduction of the winglet, the static pressure distributionsundisturbed by the leakage vortex should be used. A comparisonof the SSS (External) and the SSS (Ext. mid span) distributionsindicates that even at this small tip gap, the increase of the staticpressure coefficient on the winglet suction side, which is causedby the tip leakage vortex, is noticeable. So to compare the drivingpressure of the tip leakage flow for the flat tip and for the optimumgeometry the increase in the pressure coefficient on the suctionside of the SSS should be neglected. Taking this into considera-tion, the plotted data indicates a substantial reduction of the driv-ing pressure difference. This reflects the intended result ofreducing the driving pressure difference in the tip region by theapplication of the winglet. This is accompanied by the division ofthe driving pressure difference between the two squealers, whichadditionally reduces the tip leakage mass flow rate as with a laby-rinth seal. Since the winglet increases the distance between thetwo squealers, the effect is more pronounced than with, say, acavity tip (see Schabowski and Hodson [11]).
The flow pattern in the tip gap at the cut plane placed at 50% ofthe tangential chord is shown in Fig. 14. At this position, the flowis very close to axial, so the view allows for a detailed analysis ofthe tip gap flow pattern. The flow contraction above the pressureside squealer is much bigger than above the suction side squealer.A similar pattern was observed by Schabowski and Hodson [11]for the cavity and winglet tip with thin squealers. This is because
Fig. 12 Static pressure coefficient in the tip section of the opti-mum winglet plotted against tangential coordinate
Fig. 11 Distribution of radial deflection on the optimumgeometry
Fig. 13 Positions of line plots from Fig. 12
Fig. 14 Predicted Yp contours on tangential plane at 0.5Cy forthe optimum at tip gap of 2% chord
Journal of Turbomachinery JULY 2014, Vol. 136 / 071004-7
Downloaded From: http://turbomachinery.asmedigitalcollection.asme.org/ on 04/27/2014 Terms of Use: http://asme.org/terms
the flow above the suction side squealer is strongly affected by thehigh momentum leakage jet parallel to the casing wall. At the pre-sented tip gap of 2% chord the flow does not reattach to the topsurface of the pressure side squealer of the optimum tip.
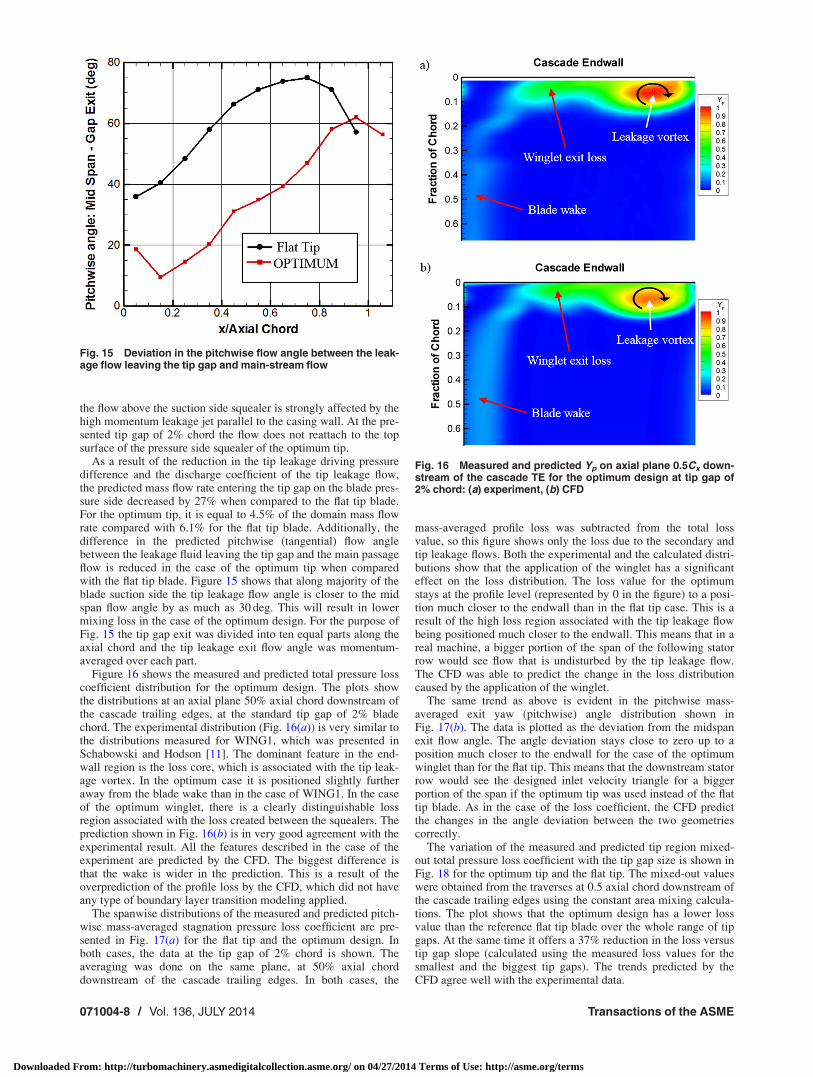
As a result of the reduction in the tip leakage driving pressuredifference and the discharge coefficient of the tip leakage flow,the predicted mass flow rate entering the tip gap on the blade pres-sure side decreased by 27% when compared to the flat tip blade.For the optimum tip, it is equal to 4.5% of the domain mass flowrate compared with 6.1% for the flat tip blade. Additionally, thedifference in the predicted pitchwise (tangential) flow anglebetween the leakage fluid leaving the tip gap and the main passageflow is reduced in the case of the optimum tip when comparedwith the flat tip blade. Figure 15 shows that along majority of theblade suction side the tip leakage flow angle is closer to the midspan flow angle by as much as 30 deg. This will result in lowermixing loss in the case of the optimum design. For the purpose ofFig. 15 the tip gap exit was divided into ten equal parts along theaxial chord and the tip leakage exit flow angle was momentum-averaged over each part.
Figure 16 shows the measured and predicted total pressure losscoefficient distribution for the optimum design. The plots showthe distributions at an axial plane 50% axial chord downstream ofthe cascade trailing edges, at the standard tip gap of 2% bladechord. The experimental distribution (Fig. 16(a)) is very similar tothe distributions measured for WING1, which was presented inSchabowski and Hodson [11]. The dominant feature in the end-wall region is the loss core, which is associated with the tip leak-age vortex. In the optimum case it is positioned slightly furtheraway from the blade wake than in the case of WING1. In the caseof the optimum winglet, there is a clearly distinguishable lossregion associated with the loss created between the squealers. Theprediction shown in Fig. 16(b) is in very good agreement with theexperimental result. All the features described in the case of theexperiment are predicted by the CFD. The biggest difference isthat the wake is wider in the prediction. This is a result of theoverprediction of the profile loss by the CFD, which did not haveany type of boundary layer transition modeling applied.
The spanwise distributions of the measured and predicted pitch-wise mass-averaged stagnation pressure loss coefficient are pre-sented in Fig. 17(a) for the flat tip and the optimum design. Inboth cases, the data at the tip gap of 2% chord is shown. Theaveraging was done on the same plane, at 50% axial chorddownstream of the cascade trailing edges. In both cases, the
mass-averaged profile loss was subtracted from the total lossvalue, so this figure shows only the loss due to the secondary andtip leakage flows. Both the experimental and the calculated distri-butions show that the application of the winglet has a significanteffect on the loss distribution. The loss value for the optimumstays at the profile level (represented by 0 in the figure) to a posi-tion much closer to the endwall than in the flat tip case. This is aresult of the high loss region associated with the tip leakage flowbeing positioned much closer to the endwall. This means that in areal machine, a bigger portion of the span of the following statorrow would see flow that is undisturbed by the tip leakage flow.The CFD was able to predict the change in the loss distributioncaused by the application of the winglet.
The same trend as above is evident in the pitchwise mass-averaged exit yaw (pitchwise) angle distribution shown inFig. 17(b). The data is plotted as the deviation from the midspanexit flow angle. The angle deviation stays close to zero up to aposition much closer to the endwall for the case of the optimumwinglet than for the flat tip. This means that the downstream statorrow would see the designed inlet velocity triangle for a biggerportion of the span if the optimum tip was used instead of the flattip blade. As in the case of the loss coefficient, the CFD predictthe changes in the angle deviation between the two geometriescorrectly.
The variation of the measured and predicted tip region mixed-out total pressure loss coefficient with the tip gap size is shown inFig. 18 for the optimum tip and the flat tip. The mixed-out valueswere obtained from the traverses at 0.5 axial chord downstream ofthe cascade trailing edges using the constant area mixing calcula-tions. The plot shows that the optimum design has a lower lossvalue than the reference flat tip blade over the whole range of tipgaps. At the same time it offers a 37% reduction in the loss versustip gap slope (calculated using the measured loss values for thesmallest and the biggest tip gaps). The trends predicted by theCFD agree well with the experimental data.
Fig. 15 Deviation in the pitchwise flow angle between the leak-age flow leaving the tip gap and main-stream flow
Fig. 16 Measured and predicted Yp on axial plane 0.5Cx down-stream of the cascade TE for the optimum design at tip gap of2% chord: (a) experiment, (b) CFD
071004-8 / Vol. 136, JULY 2014 Transactions of the ASME
Downloaded From: http://turbomachinery.asmedigitalcollection.asme.org/ on 04/27/2014 Terms of Use: http://asme.org/terms

In Fig. 18, the loss data for a second winglet design, calledOpt19, is also presented. Opt19 is included to show what can hap-pen if the optimization or design process of a winglet design is notcorrectly constrained.
Figure 19 shows the blade-to-blade view of the Opt19 and theoptimum geometries. The midspan static pressure coefficient con-tours are also plotted. The biggest difference between the twowinglets is in the aft part. This is the part of the winglet that wasconstrained due to structural considerations. As a result, the opti-mum design has a winglet with a planar area that is 13% lowerthan that of the Opt19 design and a radial deflection that is 40%less than that of Opt19. Even though the Opt19 has a larger wing-let, Fig. 18 shows that the increase in the winglet size did notimprove the aerodynamic performance. The measured loss coeffi-cient at tip gaps above 1.2% of chord is nearly identical for bothwinglets. At tip gaps below 1.2% of chord, the optimum designhas a marginally lower loss coefficient than opt19.
The static pressure coefficient contours in Fig. 19 reveal thereason why Opt19 is not better than the optimum tip in terms ofaerodynamic performance. It shows that the increase of the wing-let size in the rear section did not result in a significant change ofthe driving pressure difference. This is because, in the aft part ofthe blade the static pressure gradient in the direction normal to theblade suction side is much reduced when compared with the frontor the middle part of the blade.
An analysis of the optimization results showed that the optimi-zation variables had different effects on the loss and radial deflec-tion. The biggest reduction in loss resulted from increasing theoverhang size in the midchord of the blade. Unfortunately, thisalso resulted in the most significant increase in the radialdeflection. Increasing the size of the overhang in the front part ofthe blade had a smaller influence on the loss reduction as well ason the radial deflection. The size of the winglet in the aft part ofthe blade had a negligible effect on loss, as there is very smallpressure gradient normal to the blade surface in the trailing edgepart of the blade. However, it considerably affected the maximumradial deflection of the winglet. The length of the front part of the
Fig. 18 Measured and predicted tip region mixed-out totalpressure loss coefficient - optimum tip
Fig. 17 Pitchwise mass-averaged profiles at 0.5Cx downstreamof the cascade TE for the optimum and flat tip at tip gap of 2%chord: (a) loss coefficient, (b) deviation from midspan exit flowangle
Fig. 19 Winglet shape comparison: optimum versus Opt19
Journal of Turbomachinery JULY 2014, Vol. 136 / 071004-9
Downloaded From: http://turbomachinery.asmedigitalcollection.asme.org/ on 04/27/2014 Terms of Use: http://asme.org/terms
suction side squealer also had a negligible effect on the loss. Theoptimal value of the squealer height was about 1.5 to 2 times thetip gap height. Outside of this range, the height adversely affectedthe aerodynamic performance, however this was to a lesser degreethan when reducing the overhang size in the midchord section.
Results for Derivatives of the Optimum Tip
After testing the optimum tip, two derivative geometries weretested. Both of them had the same winglet shape and the samesquealer height.
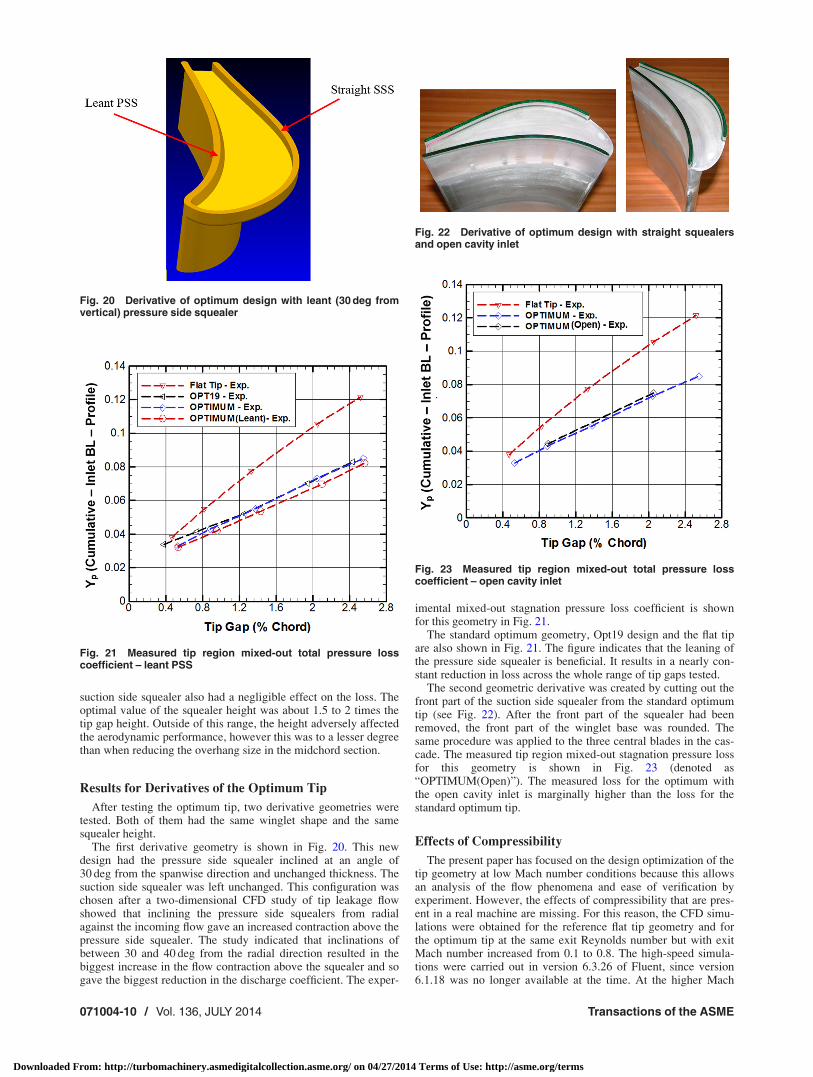
The first derivative geometry is shown in Fig. 20. This newdesign had the pressure side squealer inclined at an angle of30 deg from the spanwise direction and unchanged thickness. Thesuction side squealer was left unchanged. This configuration waschosen after a two-dimensional CFD study of tip leakage flowshowed that inclining the pressure side squealers from radialagainst the incoming flow gave an increased contraction above thepressure side squealer. The study indicated that inclinations ofbetween 30 and 40 deg from the radial direction resulted in thebiggest increase in the flow contraction above the squealer and sogave the biggest reduction in the discharge coefficient. The exper-
imental mixed-out stagnation pressure loss coefficient is shownfor this geometry in Fig. 21.
The standard optimum geometry, Opt19 design and the flat tipare also shown in Fig. 21. The figure indicates that the leaning ofthe pressure side squealer is beneficial. It results in a nearly con-stant reduction in loss across the whole range of tip gaps tested.
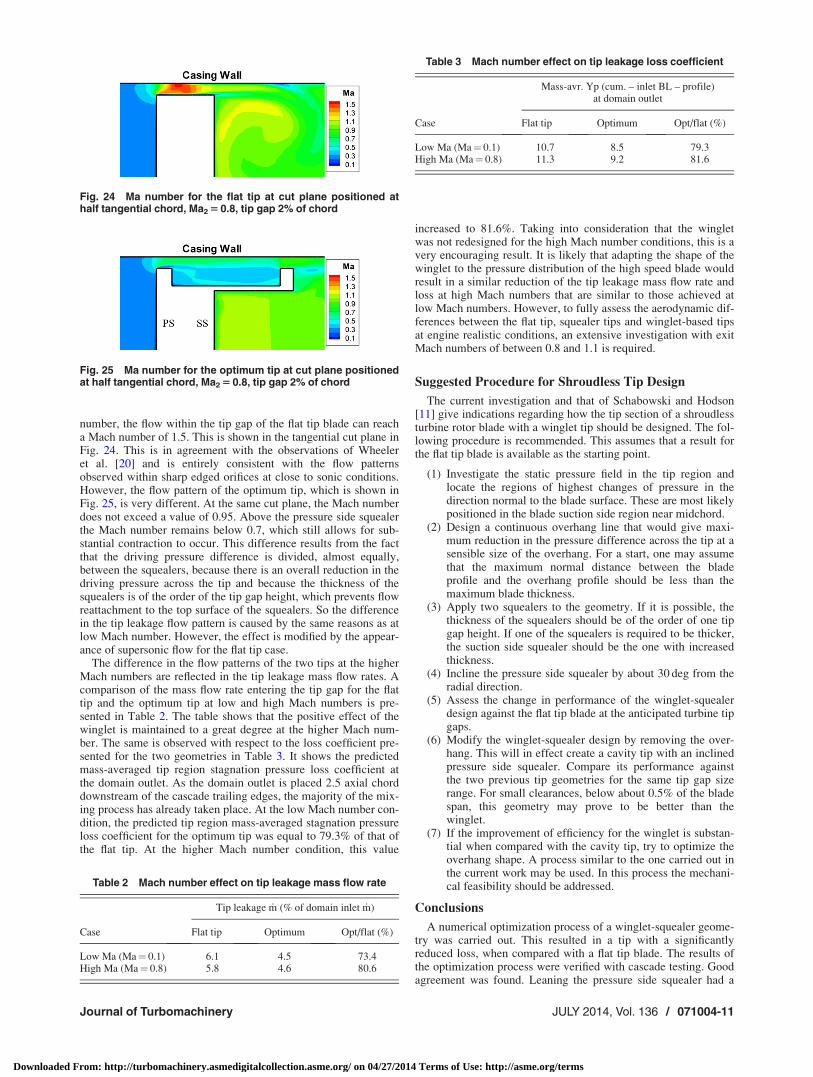
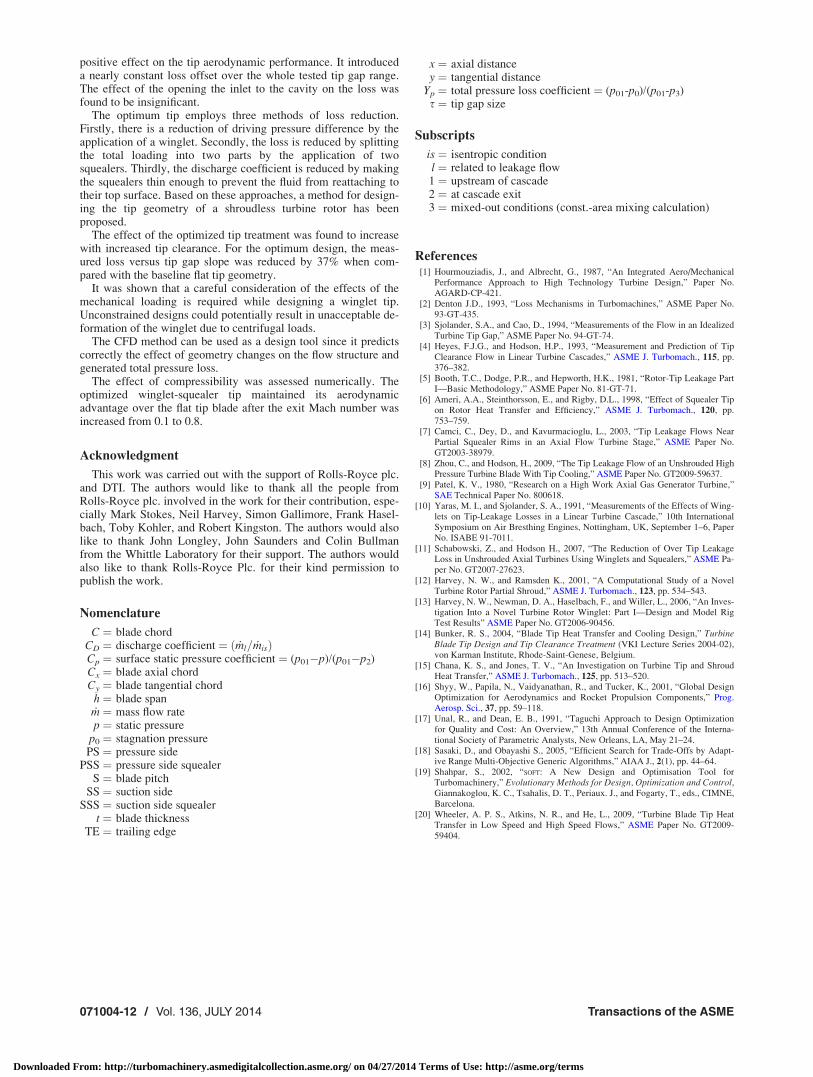
The second geometric derivative was created by cutting out thefront part of the suction side squealer from the standard optimumtip (see Fig. 22). After the front part of the squealer had beenremoved, the front part of the winglet base was rounded. Thesame procedure was applied to the three central blades in the cas-cade. The measured tip region mixed-out stagnation pressure lossfor this geometry is shown in Fig. 23 (denoted as“OPTIMUM(Open)”). The measured loss for the optimum withthe open cavity inlet is marginally higher than the loss for thestandard optimum tip.
Effects of Compressibility
The present paper has focused on the design optimization of thetip geometry at low Mach number conditions because this allowsan analysis of the flow phenomena and ease of verification byexperiment. However, the effects of compressibility that are pres-ent in a real machine are missing. For this reason, the CFD simu-lations were obtained for the reference flat tip geometry and forthe optimum tip at the same exit Reynolds number but with exitMach number increased from 0.1 to 0.8. The high-speed simula-tions were carried out in version 6.3.26 of Fluent, since version6.1.18 was no longer available at the time. At the higher Mach
Fig. 21 Measured tip region mixed-out total pressure losscoefficient – leant PSS
Fig. 22 Derivative of optimum design with straight squealersand open cavity inlet
Fig. 23 Measured tip region mixed-out total pressure losscoefficient – open cavity inlet
Fig. 20 Derivative of optimum design with leant (30 deg fromvertical) pressure side squealer
071004-10 / Vol. 136, JULY 2014 Transactions of the ASME
Downloaded From: http://turbomachinery.asmedigitalcollection.asme.org/ on 04/27/2014 Terms of Use: http://asme.org/terms
number, the flow within the tip gap of the flat tip blade can reacha Mach number of 1.5. This is shown in the tangential cut plane inFig. 24. This is in agreement with the observations of Wheeleret al. [20] and is entirely consistent with the flow patternsobserved within sharp edged orifices at close to sonic conditions.However, the flow pattern of the optimum tip, which is shown inFig. 25, is very different. At the same cut plane, the Mach numberdoes not exceed a value of 0.95. Above the pressure side squealerthe Mach number remains below 0.7, which still allows for sub-stantial contraction to occur. This difference results from the factthat the driving pressure difference is divided, almost equally,between the squealers, because there is an overall reduction in thedriving pressure across the tip and because the thickness of thesquealers is of the order of the tip gap height, which prevents flowreattachment to the top surface of the squealers. So the differencein the tip leakage flow pattern is caused by the same reasons as atlow Mach number. However, the effect is modified by the appear-ance of supersonic flow for the flat tip case.
The difference in the flow patterns of the two tips at the higherMach numbers are reflected in the tip leakage mass flow rates. Acomparison of the mass flow rate entering the tip gap for the flattip and the optimum tip at low and high Mach numbers is pre-sented in Table 2. The table shows that the positive effect of thewinglet is maintained to a great degree at the higher Mach num-ber. The same is observed with respect to the loss coefficient pre-sented for the two geometries in Table 3. It shows the predictedmass-averaged tip region stagnation pressure loss coefficient atthe domain outlet. As the domain outlet is placed 2.5 axial chorddownstream of the cascade trailing edges, the majority of the mix-ing process has already taken place. At the low Mach number con-dition, the predicted tip region mass-averaged stagnation pressureloss coefficient for the optimum tip was equal to 79.3% of that ofthe flat tip. At the higher Mach number condition, this value
increased to 81.6%. Taking into consideration that the wingletwas not redesigned for the high Mach number conditions, this is avery encouraging result. It is likely that adapting the shape of thewinglet to the pressure distribution of the high speed blade wouldresult in a similar reduction of the tip leakage mass flow rate andloss at high Mach numbers that are similar to those achieved atlow Mach numbers. However, to fully assess the aerodynamic dif-ferences between the flat tip, squealer tips and winglet-based tipsat engine realistic conditions, an extensive investigation with exitMach numbers of between 0.8 and 1.1 is required.
Suggested Procedure for Shroudless Tip Design
The current investigation and that of Schabowski and Hodson[11] give indications regarding how the tip section of a shroudlessturbine rotor blade with a winglet tip should be designed. The fol-lowing procedure is recommended. This assumes that a result forthe flat tip blade is available as the starting point.
(1) Investigate the static pressure field in the tip region andlocate the regions of highest changes of pressure in thedirection normal to the blade surface. These are most likelypositioned in the blade suction side region near midchord.
(2) Design a continuous overhang line that would give maxi-mum reduction in the pressure difference across the tip at asensible size of the overhang. For a start, one may assumethat the maximum normal distance between the bladeprofile and the overhang profile should be less than themaximum blade thickness.
(3) Apply two squealers to the geometry. If it is possible, thethickness of the squealers should be of the order of one tipgap height. If one of the squealers is required to be thicker,the suction side squealer should be the one with increasedthickness.
(4) Incline the pressure side squealer by about 30 deg from theradial direction.
(5) Assess the change in performance of the winglet-squealerdesign against the flat tip blade at the anticipated turbine tipgaps.
(6) Modify the winglet-squealer design by removing the over-hang. This will in effect create a cavity tip with an inclinedpressure side squealer. Compare its performance againstthe two previous tip geometries for the same tip gap sizerange. For small clearances, below about 0.5% of the bladespan, this geometry may prove to be better than thewinglet.
(7) If the improvement of efficiency for the winglet is substan-tial when compared with the cavity tip, try to optimize theoverhang shape. A process similar to the one carried out inthe current work may be used. In this process the mechani-cal feasibility should be addressed.
Conclusions
A numerical optimization process of a winglet-squealer geome-try was carried out. This resulted in a tip with a significantlyreduced loss, when compared with a flat tip blade. The results ofthe optimization process were verified with cascade testing. Goodagreement was found. Leaning the pressure side squealer had a
Fig. 25 Ma number for the optimum tip at cut plane positionedat half tangential chord, Ma2 5 0.8, tip gap 2% of chord
Table 3 Mach number effect on tip leakage loss coefficient
Mass-avr. Yp (cum. – inlet BL – profile)at domain outlet
Case Flat tip Optimum Opt/flat (%)
Low Ma (Ma¼ 0.1) 10.7 8.5 79.3High Ma (Ma¼ 0.8) 11.3 9.2 81.6
Table 2 Mach number effect on tip leakage mass flow rate
Tip leakage _m (% of domain inlet _m)
Case Flat tip Optimum Opt/flat (%)
Low Ma (Ma¼ 0.1) 6.1 4.5 73.4High Ma (Ma¼ 0.8) 5.8 4.6 80.6
Fig. 24 Ma number for the flat tip at cut plane positioned athalf tangential chord, Ma2 5 0.8, tip gap 2% of chord
Journal of Turbomachinery JULY 2014, Vol. 136 / 071004-11
Downloaded From: http://turbomachinery.asmedigitalcollection.asme.org/ on 04/27/2014 Terms of Use: http://asme.org/terms
positive effect on the tip aerodynamic performance. It introduceda nearly constant loss offset over the whole tested tip gap range.The effect of the opening the inlet to the cavity on the loss wasfound to be insignificant.
The optimum tip employs three methods of loss reduction.Firstly, there is a reduction of driving pressure difference by theapplication of a winglet. Secondly, the loss is reduced by splittingthe total loading into two parts by the application of twosquealers. Thirdly, the discharge coefficient is reduced by makingthe squealers thin enough to prevent the fluid from reattaching totheir top surface. Based on these approaches, a method for design-ing the tip geometry of a shroudless turbine rotor has beenproposed.
The effect of the optimized tip treatment was found to increasewith increased tip clearance. For the optimum design, the meas-ured loss versus tip gap slope was reduced by 37% when com-pared with the baseline flat tip geometry.
It was shown that a careful consideration of the effects of themechanical loading is required while designing a winglet tip.Unconstrained designs could potentially result in unacceptable de-formation of the winglet due to centrifugal loads.
The CFD method can be used as a design tool since it predictscorrectly the effect of geometry changes on the flow structure andgenerated total pressure loss.
The effect of compressibility was assessed numerically. Theoptimized winglet-squealer tip maintained its aerodynamicadvantage over the flat tip blade after the exit Mach number wasincreased from 0.1 to 0.8.
Acknowledgment
This work was carried out with the support of Rolls-Royce plc.and DTI. The authors would like to thank all the people fromRolls-Royce plc. involved in the work for their contribution, espe-cially Mark Stokes, Neil Harvey, Simon Gallimore, Frank Hasel-bach, Toby Kohler, and Robert Kingston. The authors would alsolike to thank John Longley, John Saunders and Colin Bullmanfrom the Whittle Laboratory for their support. The authors wouldalso like to thank Rolls-Royce Plc. for their kind permission topublish the work.
Nomenclature
C ¼ blade chordCD ¼ discharge coefficient ¼ ð _ml= _misÞCp ¼ surface static pressure coefficient ¼ (p01�p)/(p01�p2)Cx ¼ blade axial chordCy ¼ blade tangential chord
h ¼ blade span_m ¼ mass flow ratep ¼ static pressure
p0 ¼ stagnation pressurePS ¼ pressure side
PSS ¼ pressure side squealerS ¼ blade pitch
SS ¼ suction sideSSS ¼ suction side squealer
t ¼ blade thicknessTE ¼ trailing edge
x ¼ axial distancey ¼ tangential distance
Yp ¼ total pressure loss coefficient ¼ (p01-p0)/(p01-p3)s ¼ tip gap size
Subscripts
is ¼ isentropic conditionl ¼ related to leakage flow1 ¼ upstream of cascade2 ¼ at cascade exit3 ¼ mixed-out conditions (const.-area mixing calculation)
References[1] Hourmouziadis, J., and Albrecht, G., 1987, “An Integrated Aero/Mechanical
Performance Approach to High Technology Turbine Design,” Paper No.AGARD-CP-421.
[2] Denton J.D., 1993, “Loss Mechanisms in Turbomachines,” ASME Paper No.93-GT-435.
[3] Sjolander, S.A., and Cao, D., 1994, “Measurements of the Flow in an IdealizedTurbine Tip Gap,” ASME Paper No. 94-GT-74.
[4] Heyes, F.J.G., and Hodson, H.P., 1993, “Measurement and Prediction of TipClearance Flow in Linear Turbine Cascades,” ASME J. Turbomach., 115, pp.376–382.
[5] Booth, T.C., Dodge, P.R., and Hepworth, H.K., 1981, “Rotor-Tip Leakage PartI—Basic Methodology,” ASME Paper No. 81-GT-71.
[6] Ameri, A.A., Steinthorsson, E., and Rigby, D.L., 1998, “Effect of Squealer Tipon Rotor Heat Transfer and Efficiency,” ASME J. Turbomach., 120, pp.753–759.
[7] Camci, C., Dey, D., and Kavurmacioglu, L., 2003, “Tip Leakage Flows NearPartial Squealer Rims in an Axial Flow Turbine Stage,” ASME Paper No.GT2003-38979.
[8] Zhou, C., and Hodson, H., 2009, “The Tip Leakage Flow of an Unshrouded HighPressure Turbine Blade With Tip Cooling,” ASME Paper No. GT2009-59637.
[9] Patel, K. V., 1980, “Research on a High Work Axial Gas Generator Turbine,”SAE Technical Paper No. 800618.
[10] Yaras, M. I., and Sjolander, S. A., 1991, “Measurements of the Effects of Wing-lets on Tip-Leakage Losses in a Linear Turbine Cascade,” 10th InternationalSymposium on Air Bresthing Engines, Nottingham, UK, September 1–6, PaperNo. ISABE 91-7011.
[11] Schabowski, Z., and Hodson H., 2007, “The Reduction of Over Tip LeakageLoss in Unshrouded Axial Turbines Using Winglets and Squealers,” ASME Pa-per No. GT2007-27623.
[12] Harvey, N. W., and Ramsden K., 2001, “A Computational Study of a NovelTurbine Rotor Partial Shroud,” ASME J. Turbomach., 123, pp. 534–543.
[13] Harvey, N. W., Newman, D. A., Haselbach, F., and Willer, L., 2006, “An Inves-tigation Into a Novel Turbine Rotor Winglet: Part I—Design and Model RigTest Results” ASME Paper No. GT2006-90456.
[14] Bunker, R. S., 2004, “Blade Tip Heat Transfer and Cooling Design,” TurbineBlade Tip Design and Tip Clearance Treatment (VKI Lecture Series 2004-02),von Karman Institute, Rhode-Saint-Genese, Belgium.
[15] Chana, K. S., and Jones, T. V., “An Investigation on Turbine Tip and ShroudHeat Transfer,” ASME J. Turbomach., 125, pp. 513–520.
[16] Shyy, W., Papila, N., Vaidyanathan, R., and Tucker, K., 2001, “Global DesignOptimization for Aerodynamics and Rocket Propulsion Components,” Prog.Aerosp. Sci., 37, pp. 59–118.
[17] Unal, R., and Dean, E. B., 1991, “Taguchi Approach to Design Optimizationfor Quality and Cost: An Overview,” 13th Annual Conference of the Interna-tional Society of Parametric Analysts, New Orleans, LA, May 21–24.
[18] Sasaki, D., and Obayashi S., 2005, “Efficient Search for Trade-Offs by Adapt-ive Range Multi-Objective Generic Algorithms,” AIAA J., 2(1), pp. 44–64.
[19] Shahpar, S., 2002, “SOFT: A New Design and Optimisation Tool forTurbomachinery,” Evolutionary Methods for Design, Optimization and Control,Giannakoglou, K. C., Tsahalis, D. T., Periaux. J., and Fogarty, T., eds., CIMNE,Barcelona.
[20] Wheeler, A. P. S., Atkins, N. R., and He, L., 2009, “Turbine Blade Tip HeatTransfer in Low Speed and High Speed Flows,” ASME Paper No. GT2009-59404.
071004-12 / Vol. 136, JULY 2014 Transactions of the ASME
Downloaded From: http://turbomachinery.asmedigitalcollection.asme.org/ on 04/27/2014 Terms of Use: http://asme.org/terms