Embed Size (px)
Citation preview
PLEASE SCROLL DOWN FOR ARTICLE
This article was downloaded by: [Moteki, Nobuhiro]On: 25 May 2011Access details: Access Details: [subscription number 937922581]Publisher Taylor & FrancisInforma Ltd Registered in England and Wales Registered Number: 1072954 Registered office: Mortimer House, 37-41 Mortimer Street, London W1T 3JH, UK
Aerosol Science and TechnologyPublication details, including instructions for authors and subscription information:http://www.informaworld.com/smpp/title~content=t713656376
Multiangle Polarimetry of Thermal Emission and Light Scattering byIndividual Particles in AirflowNobuhiro Motekia; Nobuyuki Takegawaa; Kazuhiro Koizumib; Takayuki Nakamurab; Yutaka Kondoa
a Research Center of Advanced Science and Technology, University of Tokyo, Meguro-ku, Tokyo,Japan b Fuji Electric Co., Ltd., Hino, Tokyo, Japan
Accepted uncorrected manuscript posted online: 25 April 2011
First published on: 23 May 2011
To cite this Article Moteki, Nobuhiro , Takegawa, Nobuyuki , Koizumi, Kazuhiro , Nakamura, Takayuki and Kondo,Yutaka(2011) 'Multiangle Polarimetry of Thermal Emission and Light Scattering by Individual Particles in Airflow',Aerosol Science and Technology, 45: 10, 1184 — 1198, First published on: 23 May 2011 (iFirst)To link to this Article: DOI: 10.1080/02786826.2011.583299URL: http://dx.doi.org/10.1080/02786826.2011.583299
Full terms and conditions of use: http://www.informaworld.com/terms-and-conditions-of-access.pdf
This article may be used for research, teaching and private study purposes. Any substantial orsystematic reproduction, re-distribution, re-selling, loan or sub-licensing, systematic supply ordistribution in any form to anyone is expressly forbidden.
The publisher does not give any warranty express or implied or make any representation that the contentswill be complete or accurate or up to date. The accuracy of any instructions, formulae and drug dosesshould be independently verified with primary sources. The publisher shall not be liable for any loss,actions, claims, proceedings, demand or costs or damages whatsoever or howsoever caused arising directlyor indirectly in connection with or arising out of the use of this material.
Aerosol Science and Technology, 45:1184–1198, 2011Copyright C© American Association for Aerosol ResearchISSN: 0278-6826 print / 1521-7388 onlineDOI: 10.1080/02786826.2011.583299
Multiangle Polarimetry of Thermal Emission and LightScattering by Individual Particles in Airflow
Nobuhiro Moteki,1 Nobuyuki Takegawa,1 Kazuhiro Koizumi,2
Takayuki Nakamura,2 and Yutaka Kondo1
1Research Center of Advanced Science and Technology, University of Tokyo, Meguro-ku, Tokyo, Japan2Fuji Electric Co., Ltd., Hino, Tokyo, Japan
The generalized Kirchhoff’s law predicts that the polarizationstate of thermal emission from an individual small particle de-pends on the particle shape. We show for the first time experimen-tal evidence confirming this prediction for particles smaller thanthe wavelength by using a newly developed laser-induced incan-descence instrument and a theoretical model that can predict thesignals of thermal emission and light scattering for an ellipsoid un-der the dipole approximation (Rayleigh ellipsoid). We use single-sphere (singlet) and two-sphere clusters (doublet) of polystyrenelatex spheres as primary test particles. These are currently avail-able, well-characterized spherical and nonspherical particles, re-spectively. The polarization states of thermal emission and scat-tered light of graphite particles smaller than the wavelength showa good agreement with model calculations for plate-like Rayleigh-spheroids, consistent with their plate-like shapes observed by atransmission electron microscope. We propose that the measure-ment of the polarization state of thermal emission may be applica-ble to real-time analysis of the shape of light-absorbing particles inair.
Supplementary materials are available for this article. Go tothe publisher’s online edition of Aerosol Science and Technologyto view the free supplementary files.
1. INTRODUCTIONAerosol particles in atmosphere are highly variable in mor-
phology depending on the chemical composition, formation pro-cesses, and relative humidity. Solid-state aerosols, e.g., mineral
Received 12 January 2011; accepted 17 April 2011.We acknowledge technical support by GENESIA Corp. and KISO
Designing Ltd. This work was supported by the JST SENTAN Program;the Ministry of Education, Culture, Sports, Science, and Technology(MEXT); and the global environment research fund of the JapaneseMinistry of the Environment (B-083).
Address correspondence to Nobuhiro Moteki, Research Center ofAdvanced Science and Technology, University of Tokyo, Room-414Bldg.-3, 4-6-1, Komaba, Meguro-ku, Tokyo 153-8904, Japan. E-mail:[email protected]
dust, soot, and dried inorganic salts, are generally nonspherical,whereas liquid-state aerosols, e.g., cloud droplets, are spherical.Interpretation of radiometric remote sensing data and calcula-tions of climate effects of atmospheric aerosols require an ac-curate aerosol optical model relating the aerosol microphysics(i.e., size distribution, chemical composition, and mixing state)and the optical properties (i.e., extinction coefficient per unitconcentration, scattering phase function, and single scatteringalbedo). Most current aerosol optical models assume a spheri-cal shape for individual particles because of a lack of sufficientknowledge of the spatial and temporal variations of particleshapes in the atmosphere. Dubovik et al. (2002) demonstratedquantitative improvements in the ground-based remote sensingof atmospheric aerosols by taking into account nonsphericalparticle shapes. Adachi et al. (2010) showed the importance oftaking into account the actual complex shapes of soot particlesfor quantitative calculations of their optical properties in atmo-sphere. Therefore, observations of particle shapes in varioustimes and locations in atmosphere are important for physicallybased improvements in aerosol optical models.
Real-time measurement of the particle shape in air has longbeen one of the frontier subjects in aerosol technology. Thelight-scattering technique has long been the only method to in-vestigate the shape of individual suspended particles in real-timeand nonsampling way (Sachweh et al. 1999; Sassen 2000; Ap-towicz et al. 2006; Bogan et al. 2010). Particle shape analysessolely based on this technique can be associated with large un-certainty for atmospheric aerosols without a priori knowledge ofchemical composition, because the analyses of light-scatteringdata often require assumptions regarding the refractive index.Therefore, a new technique for particle shape analysis sensitiveto the chemical composition of individual particles is desiredfor atmospheric measurements.
The inelastic scattering phenomena induced by laser, i.e., Ra-man scattering, plasma emission, fluorescent emission, and ther-mal emission, are possible candidates for the principles of newtechnique. Theoretically, the measured signals of Raman scatter-ing, plasma emission, and fluorescent emission from an arbitrary
1184
Downloaded By: [Moteki, Nobuhiro] At: 14:14 25 May 2011
POLARIMETRY OF THERMAL EMISSION FROM AEROSOLS 1185
particle depend on many chemical and physical parameters:chemical structure of molecules, interactions between adjacentmolecules, internal locations of excited molecules, internal dis-tribution of refractive index, and particle shape. In addition, theyalso depend on the parameters of laser for excitation: intensity,wavelength, and incident direction (Boutou et al. 2002; Griaznovet al. 2002; Weigel et al. 2006). In contrast, the measured signalsof thermal emission depend solely on two physical parameters:thermodynamic temperature and emission cross section ( = ab-sorption cross section) of the particle (Rytov 1953; Bekefi 1966;Moteki et al. 2009), independent of any parameters of laser toheat the particle. Therefore, both theoretical and experimentalmethods for thermal emission are less complicated than thoseof other phenomena mentioned earlier.
According to the generalized Kirchhoff’s law (Rytov 1953),the emission cross section of thermal radiation of an arbitrarybody at a given wavelength, polarization, and direction is rig-orously equivalent to the absorption cross section for incidentradiation of the same wavelength and polarization state, butpropagating in the opposite direction. The absorption cross sec-tion of an arbitrary particle for each polarization and directionis uniquely determined by its microphysical properties (i.e., re-fractive index, volume, shape, and orientation). Therefore, thevalidity of the generalized Kirchhoff’s law assures predictablerelationships between the microphysical properties of the par-ticle and the directional intensity distribution of thermal emis-sion in each polarization state. Moteki et al. (2009) showedexperimental results on the directional dependence of thermalemission from various nonspherical carbon particles that can beinterpreted on the basis of the generalized Kirchhoff’s law.
The purpose of this study is to provide experimentalevidence regarding the generalized Kirchhoff’s law includingpolarization, especially for particles smaller than the wave-length. A demonstration of the experimental evidence ensuresthat the polarization-resolved measurement of thermal emissionwill be a new technique for analyzing the shape of individuallight-absorbing particles. This new technique based on thermalemission can be used simultaneously with the light-scatteringtechnique. Section 2 presents the instrumental design and basicprinciples. Section 3 presents a theoretical model for simulatingsignals measured by the instrument using microphysicalproperties and the orientation of individual particles as inputparameters. Section 4 describes experimental methods. Finally,Section 5 is devoted to the presentation of the experimentalresults and their interpretation.
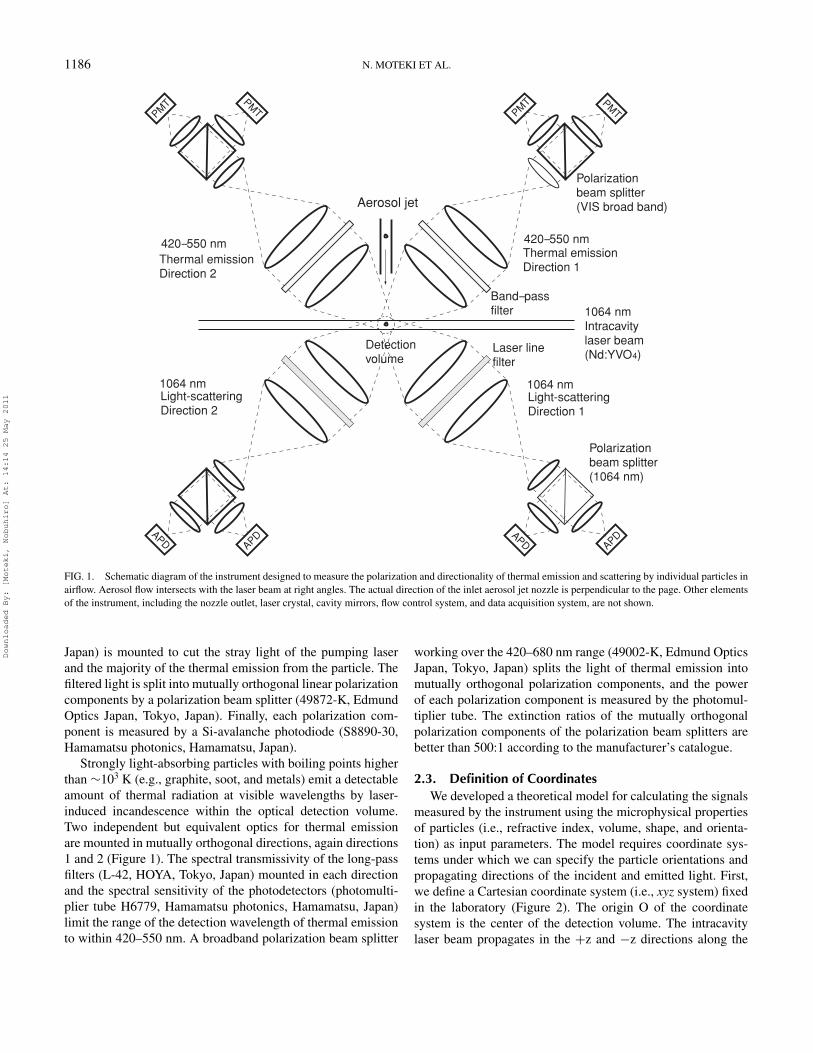
2. INSTRUMENTAL DESIGNFigure 1 shows a schematic diagram of the instrument devel-
oped to measure the directionalities and polarizations of thermalemission and light scattering by individual aerosol particles. Theprinciple of single-particle detection is based on the experimen-tal system of Stephens et al. (2003), which enables simultaneousdetection of the intensities of thermal emission and light scat-
tering by individual particles. This system has been commer-cialized as the single-particle soot photometer (SP2: DropletMeasurement Technologies, Inc., Boulder, CO, USA), an in-strument for single-particle measurement of soot aerosols inatmosphere. The principles of the SP2 have been described indetail in previous publications (Schwarz et al. 2006; Gao et al.2007; Moteki and Kondo 2007, 2010; and references therein).The new concepts of the instrument used in this study are asfollows: (1) polarization-resolved measurements of both ther-mal emission and light scattering, and (2) the intracavity laseris linearly polarized by using a Nd:YVO4 crystal instead of aNd:YAG crystal as in previous studies.
2.1. Laser CavityThe intracavity Nd:YVO4 laser is pumped by an 808-nm
wavelength laser diode (Model JOLD-7.8-BAFC-11, JENOP-TIK, Jena, Germany) and resonating at 1064-nm wavelength.The laser beam transmitted through one of the cavity mirrors(reflectivity > 99.99%) is monitored to analyze the beam pro-file, polarization state, and stability of the laser power. Afteran optimal alignment of the laser cavity, the transverse modeof the laser beam during operation was TEM00 for which thecross-sectional power profile can be approximated by a Gaussianfunction with ∼1 mm diameter (i.e., 1/e2 power) as confirmedby a charge-coupled device (CCD) beam profiler. The polar-ization state of the intracavity laser was measured by using apolarization analyzer PAX 5720-IR2 (Thorlabs GmbH, Dachau,Germany). The polarization state of the intracavity laser oper-ating in TEM00 mode was a linear polarization of purity greaterthan 99% with an electric field perpendicular to the plane con-taining the optical axis of the light collection optics (i.e., parallelto the direction of aerosol flow). The birefringence character ofNd:YVO4 (Koechner 2006) likely caused the stable resonationof the laser light at a linear polarization with a specific direction.
2.2. Detection of Light from Individual ParticlesSample air containing aerosol particles (i.e., aerosol flow) is
introduced to the particle detection chamber through a nozzleinlet (Figure 1). The nozzle inlet narrows the diameter of thesample flow down to ∼0.2 mm by a concentric sheath flow. Theoptical detection volume is a zone overlapping with the 0.2 mmdiameter aerosol flow and with the ∼1 mm diameter laser beam.The optical systems were designed to transmit the light emittedfrom an area within ±1.2 mm vertical and ±1.2 mm horizontaldistances from the center of the detection volume into the activearea of the individual photodetectors without spatial variation ofthe light transmission efficiency. Four 28 mm diameter objectivelenses are mounted at distances of 25 mm from the center of thedetection volume and the numerical aperture of each objectivelens is approximately 0.5.
Two independent but equivalent optics for light scattering aremounted in mutually orthogonal directions, namely, directions1 and 2 (Figure 1). For each direction, a laser line filter transmit-ting 1064 ± 20 nm (DIF-BP-3, Optical Coating Japan, Tokyo,
Downloaded By: [Moteki, Nobuhiro] At: 14:14 25 May 2011
1186 N. MOTEKI ET AL.
APD
PMT
APDAPD APD
PMTPM
T
PMT
Polarizationbeam splitter(VIS broad band)
1064 nmIntracavitylaser beam(Nd:YVO4)
Thermal emissionDirection 1
420--550 nm
Thermal emissionDirection 2
420--550 nm
Aerosol jet
Polarizationbeam splitter(1064 nm)
Band--passfilter
Laser line filter
Light-scatteringDirection 1
1064 nmLight-scatteringDirection 2
1064 nm
Detectionvolume
FIG. 1. Schematic diagram of the instrument designed to measure the polarization and directionality of thermal emission and scattering by individual particles inairflow. Aerosol flow intersects with the laser beam at right angles. The actual direction of the inlet aerosol jet nozzle is perpendicular to the page. Other elementsof the instrument, including the nozzle outlet, laser crystal, cavity mirrors, flow control system, and data acquisition system, are not shown.
Japan) is mounted to cut the stray light of the pumping laserand the majority of the thermal emission from the particle. Thefiltered light is split into mutually orthogonal linear polarizationcomponents by a polarization beam splitter (49872-K, EdmundOptics Japan, Tokyo, Japan). Finally, each polarization com-ponent is measured by a Si-avalanche photodiode (S8890-30,Hamamatsu photonics, Hamamatsu, Japan).
Strongly light-absorbing particles with boiling points higherthan ∼103 K (e.g., graphite, soot, and metals) emit a detectableamount of thermal radiation at visible wavelengths by laser-induced incandescence within the optical detection volume.Two independent but equivalent optics for thermal emissionare mounted in mutually orthogonal directions, again directions1 and 2 (Figure 1). The spectral transmissivity of the long-passfilters (L-42, HOYA, Tokyo, Japan) mounted in each directionand the spectral sensitivity of the photodetectors (photomulti-plier tube H6779, Hamamatsu photonics, Hamamatsu, Japan)limit the range of the detection wavelength of thermal emissionto within 420–550 nm. A broadband polarization beam splitter
working over the 420–680 nm range (49002-K, Edmund OpticsJapan, Tokyo, Japan) splits the light of thermal emission intomutually orthogonal polarization components, and the powerof each polarization component is measured by the photomul-tiplier tube. The extinction ratios of the mutually orthogonalpolarization components of the polarization beam splitters arebetter than 500:1 according to the manufacturer’s catalogue.
2.3. Definition of CoordinatesWe developed a theoretical model for calculating the signals
measured by the instrument using the microphysical propertiesof particles (i.e., refractive index, volume, shape, and orienta-tion) as input parameters. The model requires coordinate sys-tems under which we can specify the particle orientations andpropagating directions of the incident and emitted light. First,we define a Cartesian coordinate system (i.e., xyz system) fixedin the laboratory (Figure 2). The origin O of the coordinatesystem is the center of the detection volume. The intracavitylaser beam propagates in the +z and −z directions along the
Downloaded By: [Moteki, Nobuhiro] At: 14:14 25 May 2011
POLARIMETRY OF THERMAL EMISSION FROM AEROSOLS 1187
θ
φ
x
z
y
O
eθ
eφ
er
P QScattering plane
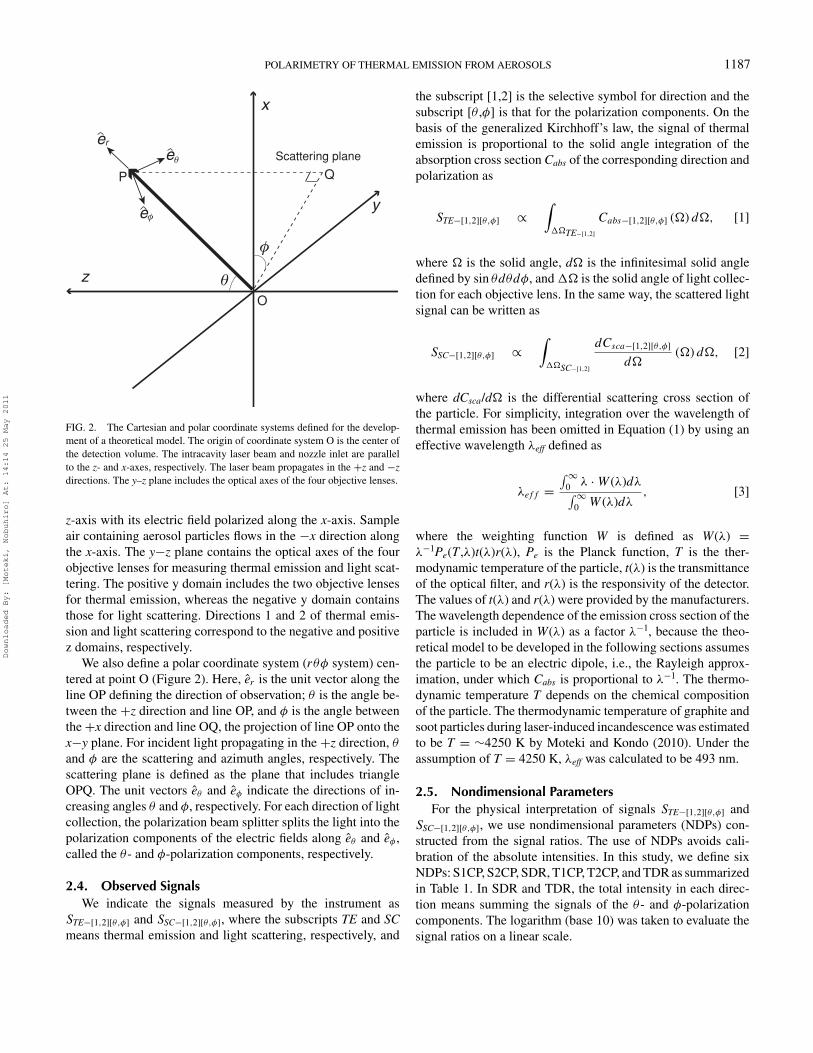
FIG. 2. The Cartesian and polar coordinate systems defined for the develop-ment of a theoretical model. The origin of coordinate system O is the center ofthe detection volume. The intracavity laser beam and nozzle inlet are parallelto the z- and x-axes, respectively. The laser beam propagates in the +z and −zdirections. The y–z plane includes the optical axes of the four objective lenses.
z-axis with its electric field polarized along the x-axis. Sampleair containing aerosol particles flows in the −x direction alongthe x-axis. The y−z plane contains the optical axes of the fourobjective lenses for measuring thermal emission and light scat-tering. The positive y domain includes the two objective lensesfor thermal emission, whereas the negative y domain containsthose for light scattering. Directions 1 and 2 of thermal emis-sion and light scattering correspond to the negative and positivez domains, respectively.
We also define a polar coordinate system (rθφ system) cen-tered at point O (Figure 2). Here, er is the unit vector along theline OP defining the direction of observation; θ is the angle be-tween the +z direction and line OP, and φ is the angle betweenthe +x direction and line OQ, the projection of line OP onto thex−y plane. For incident light propagating in the +z direction, θ
and φ are the scattering and azimuth angles, respectively. Thescattering plane is defined as the plane that includes triangleOPQ. The unit vectors eθ and eφ indicate the directions of in-creasing angles θ and φ, respectively. For each direction of lightcollection, the polarization beam splitter splits the light into thepolarization components of the electric fields along eθ and eφ ,called the θ - and φ-polarization components, respectively.
2.4. Observed SignalsWe indicate the signals measured by the instrument as
STE−[1,2][θ,φ] and SSC−[1,2][θ,φ], where the subscripts TE and SCmeans thermal emission and light scattering, respectively, and
the subscript [1,2] is the selective symbol for direction and thesubscript [θ ,φ] is that for the polarization components. On thebasis of the generalized Kirchhoff’s law, the signal of thermalemission is proportional to the solid angle integration of theabsorption cross section Cabs of the corresponding direction andpolarization as
STE−[1,2][θ,φ] ∝∫
��TE−[1,2]
Cabs−[1,2][θ,φ] (�) d�, [1]
where � is the solid angle, d� is the infinitesimal solid angledefined by sin θdθdφ, and �� is the solid angle of light collec-tion for each objective lens. In the same way, the scattered lightsignal can be written as
SSC−[1,2][θ,φ] ∝∫
��SC−[1,2]
dCsca−[1,2][θ,φ]
d�(�) d�, [2]
where dCsca/d� is the differential scattering cross section ofthe particle. For simplicity, integration over the wavelength ofthermal emission has been omitted in Equation (1) by using aneffective wavelength λeff defined as
λeff =∫∞
0 λ · W (λ)dλ∫∞0 W (λ)dλ
, [3]
where the weighting function W is defined as W(λ) =λ−1Pe(T ,λ)t(λ)r(λ), Pe is the Planck function, T is the ther-modynamic temperature of the particle, t(λ) is the transmittanceof the optical filter, and r(λ) is the responsivity of the detector.The values of t(λ) and r(λ) were provided by the manufacturers.The wavelength dependence of the emission cross section of theparticle is included in W(λ) as a factor λ−1, because the theo-retical model to be developed in the following sections assumesthe particle to be an electric dipole, i.e., the Rayleigh approx-imation, under which Cabs is proportional to λ−1. The thermo-dynamic temperature T depends on the chemical compositionof the particle. The thermodynamic temperature of graphite andsoot particles during laser-induced incandescence was estimatedto be T = ∼4250 K by Moteki and Kondo (2010). Under theassumption of T = 4250 K, λeff was calculated to be 493 nm.
2.5. Nondimensional ParametersFor the physical interpretation of signals STE−[1,2][θ,φ] and
SSC−[1,2][θ,φ], we use nondimensional parameters (NDPs) con-structed from the signal ratios. The use of NDPs avoids cali-bration of the absolute intensities. In this study, we define sixNDPs: S1CP, S2CP, SDR, T1CP, T2CP, and TDR as summarizedin Table 1. In SDR and TDR, the total intensity in each direc-tion means summing the signals of the θ - and φ-polarizationcomponents. The logarithm (base 10) was taken to evaluate thesignal ratios on a linear scale.
Downloaded By: [Moteki, Nobuhiro] At: 14:14 25 May 2011
1188 N. MOTEKI ET AL.
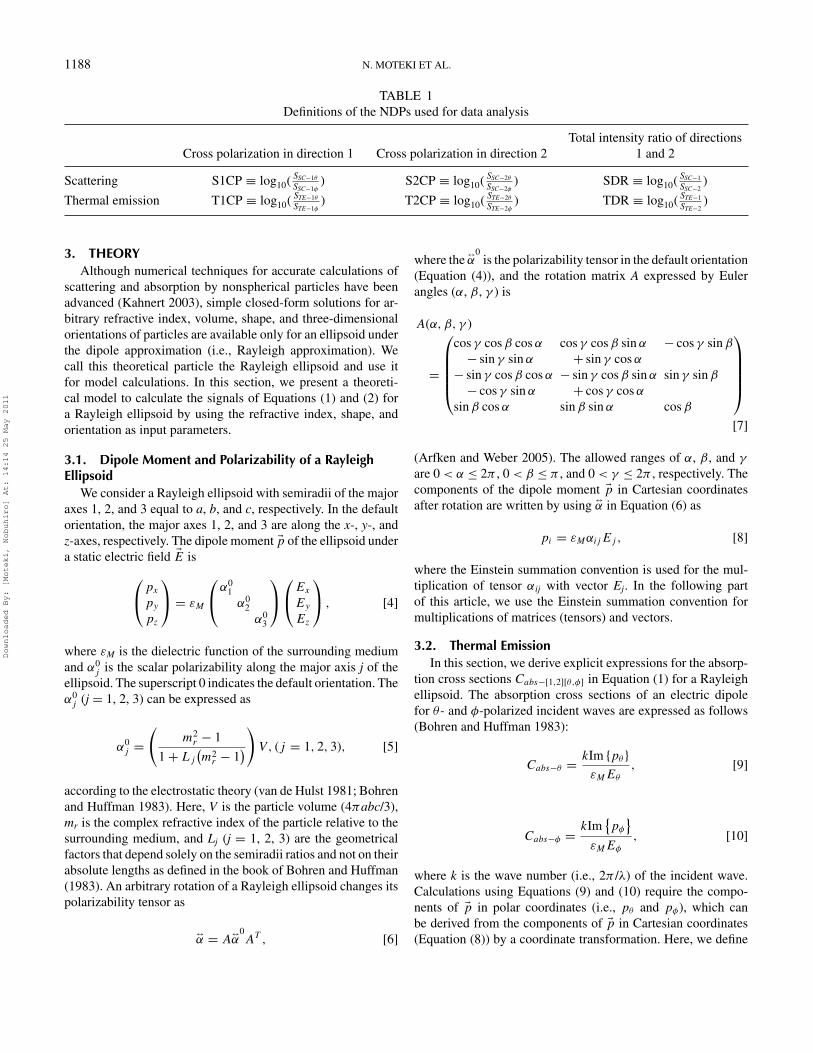
TABLE 1Definitions of the NDPs used for data analysis
Cross polarization in direction 1 Cross polarization in direction 2Total intensity ratio of directions
1 and 2
Scattering S1CP ≡ log10( SSC−1θ
SSC−1φ) S2CP ≡ log10( SSC−2θ
SSC−2φ) SDR ≡ log10( SSC−1
SSC−2)
Thermal emission T1CP ≡ log10( STE−1θ
STE−1φ) T2CP ≡ log10( STE−2θ
STE−2φ) TDR ≡ log10( STE−1
STE−2)
3. THEORYAlthough numerical techniques for accurate calculations of
scattering and absorption by nonspherical particles have beenadvanced (Kahnert 2003), simple closed-form solutions for ar-bitrary refractive index, volume, shape, and three-dimensionalorientations of particles are available only for an ellipsoid underthe dipole approximation (i.e., Rayleigh approximation). Wecall this theoretical particle the Rayleigh ellipsoid and use itfor model calculations. In this section, we present a theoreti-cal model to calculate the signals of Equations (1) and (2) fora Rayleigh ellipsoid by using the refractive index, shape, andorientation as input parameters.
3.1. Dipole Moment and Polarizability of a RayleighEllipsoid
We consider a Rayleigh ellipsoid with semiradii of the majoraxes 1, 2, and 3 equal to a, b, and c, respectively. In the defaultorientation, the major axes 1, 2, and 3 are along the x-, y-, andz-axes, respectively. The dipole moment �p of the ellipsoid undera static electric field �E is⎛
⎝px
py
pz
⎞⎠ = εM
⎛⎝α0
1α0
2α0
3
⎞⎠⎛⎝Ex
Ey
Ez
⎞⎠ , [4]
where εM is the dielectric function of the surrounding mediumand α0
j is the scalar polarizability along the major axis j of theellipsoid. The superscript 0 indicates the default orientation. Theα0
j (j = 1, 2, 3) can be expressed as
α0j =
(m2
r − 1
1 + Lj
(m2
r − 1))
V, (j = 1, 2, 3), [5]
according to the electrostatic theory (van de Hulst 1981; Bohrenand Huffman 1983). Here, V is the particle volume (4πabc/3),mr is the complex refractive index of the particle relative to thesurrounding medium, and Lj (j = 1, 2, 3) are the geometricalfactors that depend solely on the semiradii ratios and not on theirabsolute lengths as defined in the book of Bohren and Huffman(1983). An arbitrary rotation of a Rayleigh ellipsoid changes itspolarizability tensor as
↔α = A
↔α
0AT , [6]
where the ↔α
0is the polarizability tensor in the default orientation
(Equation (4)), and the rotation matrix A expressed by Eulerangles (α, β, γ ) is
A(α, β, γ )
=
⎛⎜⎜⎜⎜⎝
cos γ cos β cos α cos γ cos β sin α − cos γ sin β
− sin γ sin α + sin γ cos α
− sin γ cos β cos α − sin γ cos β sin α sin γ sin β
− cos γ sin α + cos γ cos α
sin β cos α sin β sin α cos β
⎞⎟⎟⎟⎟⎠[7]
(Arfken and Weber 2005). The allowed ranges of α, β, and γ
are 0 < α ≤ 2π , 0 < β ≤ π , and 0 < γ ≤ 2π , respectively. Thecomponents of the dipole moment �p in Cartesian coordinatesafter rotation are written by using ↔
α in Equation (6) as
pi = εMαijEj , [8]
where the Einstein summation convention is used for the mul-tiplication of tensor αij with vector Ej. In the following partof this article, we use the Einstein summation convention formultiplications of matrices (tensors) and vectors.
3.2. Thermal EmissionIn this section, we derive explicit expressions for the absorp-
tion cross sections Cabs−[1,2][θ,φ] in Equation (1) for a Rayleighellipsoid. The absorption cross sections of an electric dipolefor θ - and φ-polarized incident waves are expressed as follows(Bohren and Huffman 1983):
Cabs−θ = kIm {pθ }εMEθ
, [9]
Cabs−φ = kIm{pφ
}εMEφ
, [10]
where k is the wave number (i.e., 2π /λ) of the incident wave.Calculations using Equations (9) and (10) require the compo-nents of �p in polar coordinates (i.e., pθ and pφ), which canbe derived from the components of �p in Cartesian coordinates(Equation (8)) by a coordinate transformation. Here, we define
Downloaded By: [Moteki, Nobuhiro] At: 14:14 25 May 2011
POLARIMETRY OF THERMAL EMISSION FROM AEROSOLS 1189
a matrix R that transforms unit vectors in Cartesian coordinatesinto polar coordinates as
⎛⎜⎝
er
eθ
eφ
⎞⎟⎠ = R
⎛⎜⎝
ex
ey
ez
⎞⎟⎠ , [11]
where
R =⎛⎝ sin θ cos φ sin θ sin φ cos θ
cos θ cos φ cos θ sin φ − sin θ
− sin φ cos φ 0
⎞⎠ [12]
(Arfken and Weber 2005). Using the matrix R, pθ and pφ areexpressed as
pθ = p(rθφ)2 = R2jp
(xyz)j = εMR2jαjlE
(xyz)l
= εMR2jαjlRmlE(rθφ)m , [13]
pφ = p(rθφ)3 = R3jp
(xyz)j = εMR3jαjlE
(xyz)l
= εMR3jαjlRmlE(rθφ)m , [14]
where the superscripts (rθφ) and (xyz) denote the polar andCartesian coordinates, respectively. After the substitution ofEquation (13) into Equation (9) under the condition of Er =Eφ = 0, we have
Cabs−θ = k
εMEθ
Im{εMR2jαjlRmlE
(rθφ)m δm2
}= k
Eθ
Im{R2jαjlR2lEθ
}, [15]
where δij is the Kronecker delta. In the same way, by substitutingEquation (14) into Equation (10) under the condition of Er =Eθ = 0, we have
Cabs−φ = k
εMEφ
Im{εMR3jαjlRmlE
(rθφ)m δm3
}= k
Eφ
Im{R3jαjlR3lEφ
}. [16]
The components of the electric field in Equations (15) and(16) are real numbers under the framework of the electrostaticapproximation. Therefore, Equations (15) and (16) reduce to
Cabs−θ = kIm{R2jαjlR2l
}, [17]
Cabs−φ = kIm{R3jαjlR3l
}. [18]
Calculations of Equations (17) and (18) require the values ofθ and φ in the matrix R specifying the direction. For example,calculations of Cabs−1[θ,φ] use the numerical values of θ and φ
corresponding to the direction 1 of thermal emission. The signals
of thermal emission STE−[1,2][θ,φ] (Equation (1)) are calculatedby the integration of Cabs−[1,2][θ,φ] over the ranges of θ and φ
within the solid angle of light collection.
3.3. Light ScatteringCalculations of scattering signals (Equation (2)) require ex-
plicit expressions of the differential scattering cross section forthe θ - and φ-polarization components of the scattered wavefor x-polarized incident waves. We have to take into account thecontributions of incident waves propagating in the +z and −z di-rections for the calculations of the scattering signals because theintracavity laser is a standing wave. For this calculation, we de-rive formulations of (1) the differential scattering cross sectionsof the θ - and φ-polarization components for an x-polarized inci-dent wave propagating in the +z direction, and (2) the elementsof the amplitude-scattering matrix, and (3) the transformationrules between the formulations for incident waves propagatingin the +z and −z directions.
3.3.1. Differential Scattering Cross SectionIn this section, we derive the differential scattering cross sec-
tions of the θ - and φ-polarization components for an x-polarizedincident wave propagating in the +z direction. First, we decom-pose the incident and scattered waves into mutually orthogonalelectric field components parallel (‖) and perpendicular (⊥) tothe scattering plane as
�Ei = Ei||e
i|| + Ei
⊥ei⊥, [19]
�Es = Es||e
s|| + Es
⊥es⊥, [20]
where the superscripts i and s indicate the incident and scatteredwaves, respectively. The unit vectors parallel and perpendicularto the scattering plane in Equations (19) and (20) are defined byusing unit vectors in Cartesian and polar coordinates as
ei|| = cos φex + sin φey, ei
⊥ = sin φex − cos φey, [21]
es|| = eθ , es
⊥ = −eφ. [22]
For an arbitrary particle, the relationship between the com-ponents of the incident wave (Ei
||, Ei⊥) and the scattered wave
(Es||, Es
⊥) is expressed by an amplitude-scattering matrix as
(Es
||Es
⊥
)= eik(r−z)
−ikr
(S2 S3
S4 S1
)(Ei
||Ei
⊥
), [23]
where r is the distance from the particle to the observationpoint and i is the unit imaginary number (Bohren and Huffman1983). Values of Sj (j = 1, 2, 3, 4) are determined solely bythe microphysical properties (volume, refractive index, shape,and orientation) of the particle. From Equations (21) and (22),the electric field components in Equation (23) can be written in
Downloaded By: [Moteki, Nobuhiro] At: 14:14 25 May 2011
1190 N. MOTEKI ET AL.
Cartesian and polar coordinates as
Ei|| = cos φEi
x + sin φEiy, Ei
⊥ = sin φEix − cos φEi
y,
[24]
Es|| = Es
θ , Es⊥ = −Es
φ. [25]
Substituting Equations (24) and (25) into Equation (23), wehave a relation between the scattered field components in po-lar coordinates and the incident field components in Cartesiancoordinates as
(Es
θ
−Esφ
)= eik(r−z)
−ikr
(S2 S3
S4 S1
)(cos φEi
x + sin φEiy
sin φEix − cos φEi
y
).
[26]
To calculate the differential scattering cross sections of theθ - and φ-polarization components, we need the squares of theamplitudes of the θ - and φ-polarization components of the scat-tered wave. From Equation (26), we have
∣∣Esθ
∣∣2 = EsθE
s∗θ ,
= 1
k2r2
[S2S
∗2
{cos2 φEi
xEi∗x + sin2 φEi
yEi∗y + cos φ sin φ
× (Ei
xEi∗y − Ei∗
x Eiy
)}+ S3S∗3
{sin2 φEi
xEi∗x
+ cos2 φEiyE
i∗y + cos φ sin φ
(Ei
xEi∗y + Ei∗
x Eiy
)}+S3S
∗2
{cos φ sin φ
(Ei
xEi∗x − Ei
yEi∗y
)+ sin2 φEixE
i∗y
− cos2 φEi∗x Ei
y
}+ S2S∗3
{cos φ sin φ
(Ei
xEi∗x − Ei
yEi∗y
)− cos2 φEi
xEi∗y + sin2 φEi∗
x Eiy
}[27]
∣∣Esφ
∣∣2 = EsφEs∗
φ ,
= 1
k2r2
[S4S
∗4
{cos2 φEi
xEi∗x + sin2 φEi
yEi∗y + cos φ sin φ
× (Ei
xEi∗y − Ei∗
x Eiy
)}+ S1S∗1
{sin2 φEi
xEi∗x
+ cos2 φEiyE
i∗y − cos φ sin φ
(Ei
xEi∗y + Ei∗
x Eiy
)}+ S1S
∗4
{cos φ sin φ
(Ei
xEi∗x − Ei
yEi∗y
)+ sin2 φEixE
i∗y
− cos2 φEi∗x Ei
y
}+ S4S∗1
{cos φ sin φ
(Ei
xEi∗x − Ei
yEi∗y
)− cos2 φEi
xEi∗y + sin2 φEi∗
x Eiy
}], [28]
where the asterisk symbol denotes the complex conjugate. Thesquare of the amplitude of the incident wave is
|Ei |2 = EixE
i∗x + Ei
yEi∗y . [29]
The differential scattering cross sections for the θ - and φ-polarization components of the scattered wave are defined as
dCsca−θ
d�= r2 |Es
θ |2|Ei |2 , [30]
dCsca−φ
d�= r2
|Esφ|2
|Ei |2 . [31]
For the application of Equations (30) and (31) to our instru-ment, we can assume that the electric field of the incident waveis x polarized and Ei
y = 0 in Equation (29). Substituting Equa-tions (27) and (29) into Equation (30) under the assumption ofEi
y = 0, we have
dCsca−θ
d�= 1
k2
{S2S
∗2 cos2 φ + S3S
∗3 sin2 φ + (
S3S∗2 + S2S
∗3
)× cos φ sin φ
}. [32]
Similarly, substituting Equations (28) and (29) into Equation(31) under the assumption of Ei
y = 0, we have
dCsca−φ
d�= 1
k2
{S4S
∗4 cos2 φ + S1S
∗1 sin2 φ + (
S1S∗4 + S4S
∗1
)× cos φ sin φ
}. [33]
Equations (32) and (33) are the general formulae of the dif-ferential scattering cross sections for the θ - and φ-polarizationcomponents of the scattered wave for an x-polarized incidentwave.
3.3.2. Amplitude-Scattering MatrixIn this subsection, we derive the elements of the amplitude-
scattering matrix Sj (j = 1, 2, 3, 4) for a Rayleigh ellipsoid. Thegeneral expression for the amplitude of a scattered wave in thefar-field zone (kr >> 1) is
�Es = Esθ eθ + Es
φeφ
= eikr
−ikrik3
4πεMer × (er × �p)
[34]
(Bohren and Huffman 1983). We expand the vector productsin Equation (34) by using the Levi-Civita symbol εijk (Arfkenand Weber 2005) with the Einstein summation convention. Theleftmost part of the vector product is
(er × �p)(rθφ)i = εijk (er )j p
(rθφ)k . [35]
Downloaded By: [Moteki, Nobuhiro] At: 14:14 25 May 2011
POLARIMETRY OF THERMAL EMISSION FROM AEROSOLS 1191
Using Equation (35), the vector products in Equation (34)become
(er × (er × �p))(rθφ)i = εijk (er )j
(εklm (er )l p
(rθφ)m
)= εijkεklm (er )j (er )l p
(rθφ)m
= (δilδjm − δimδjl
)(er )j (er )l p
(rθφ)m
= (δi1δ1m − δim) p(rθφ)m , [36]
where we have used the rule
εijkεklm = δilδjm − δimδjl [37]
(Arfken and Weber 2005). Substituting Equation (36) into Equa-tion (34), we have the θ - and φ-polarization components of thescattered wave as
Esθ = eikr
−ikr
ik3
4πεM
(er × (
er × �p(rθφ)))(rθφ)
2
= eikr
ikr
ik3
4πεM
p(rθφ)2 , [38]
Esφ = eikr
−ikr
ik3
4πεM
(er × (
er × �p(rθφ)))(rθφ)
3
= eikr
ikr
ik3
4πεM
p(rθφ)3 . [39]
We expand the components of the dipole moment in Equa-tions (38) and (39) by using the amplitude of the incident waveand the polarizability tensor in Cartesian coordinates as
p(rθφ)i = Rijp
(xyz)j
= Rij
(εMαjkE
ik
)(xyz)
= εMRij
(αjkE
ik
)(xyz),
[40]
where the matrix R was defined as Equation (12). We can thenexpand the expression of p
(rθφ)2 in Equation (40) as
p(rθφ)2 = εMR2j
(αjkE
ik
)(xyz)
= εMR2j
(αj1E
ix + αj2E
iy
)= εMR2j
(αj1(cos φEi
|| + sin φEi⊥)+ αj2
× (sin φEi
|| − cos φEi⊥))
= εMR2j (αj1 cos φ + αj2 sin φ)Ei|| + εMR2j
× (αj1 sin φ − αj2 cos φ)Ei⊥, [41]
where we have used Equation (24). In the same way, we have
p(rθφ)3 = εMR3j (αj1 cos φ + αj2 sin φ)Ei
|| + εMR3j (αj1 sin φ
−αj2 cos φ)Ei⊥. [42]
Substituting Equations (41) and (42) into (38) and (39), wehave
Esθ = eikr
ikr
ik3
4π
{R2j (αj1 cos φ + αj2 sin φ)Ei
|| + R2j (αj1 sin φ
−αj2 cos φ)Ei⊥}, [43]
Esφ = eikr
ikr
ik3
4π
{R3j (αj1 cos φ + αj2 sin φ)Ei
|| + R3j
× (αj1 sin φ − αj2 cos φ)Ei⊥}. [44]
By comparing Equations (43) and (44) with the matrix equa-tion (Equation (23)), we can find the elements of the amplitude-scattering matrix as
S2 = −ik3
4πR2j (αj1 cos φ + αj2 sin φ), [45]
S3 = −ik3
4πR2j (αj1 sin φ − αj2 cos φ), [46]
S4 = −ik3
4πR3j (αj1 cos φ + αj2 sin φ), [47]
S1 = −ik3
4πR3j (αj1 sin φ − αj2 cos φ). [48]
By using these Sj (j = 1, 2, 3, 4), we can calculate Equations(32) and (33), the differential scattering cross sections of theθ - and φ-polarization components of scattered waves for anx-polarized incident wave propagating in the +z direction.
3.3.3. Transformation Rules Between Counter-PropagatingIncident Waves
Because the intracavity laser is a standing wave, we haveto take into account the contributions of incident waves prop-agating in the +z and −z directions to the scattering signals.The procedure given in the previous sections calculates the con-tribution of the incident wave propagating in the +z direction.The contribution of the incident wave propagating in the −zdirection is calculated by the same procedures except for usingthe modified coordinate systems x ′y ′z′ and r ′θ ′φ′ instead of theoriginal coordinate systems xyz and rθφ. The transformationrelation between the x ′y ′z′ and xyz coordinate systems is
⎛⎝ ex ′
ey ′
ez′
⎞⎠ = M
⎛⎝ ex
ey
ez
⎞⎠ , [49]
where
M =⎛⎝ 1
−1−1
⎞⎠ . [50]
Downloaded By: [Moteki, Nobuhiro] At: 14:14 25 May 2011
1192 N. MOTEKI ET AL.
The transformation relation between the r ′θ ′φ′ and rθφ co-ordinate systems is
r ′ = r, θ ′ = π − θ, φ′ = 2π − φ. [51]
By using the transformation matrix M defined in Equation(50) and the polarizability tensor of the Rayleigh ellipsoid inthe x ′y ′z′-coordinate system, ↔
α′is calculated from ↔
α (Equation(6)) as
↔α
′ = M↔αMT . [52]
The calculation of the light-scattering signal SSC−[1,2][θ,φ]
(Equation (2)) requires a summation of the contributions of theincident waves propagating in the +z and −z directions to thescattered waves, and an integration of the differential scatteringcross sections over the ranges of θ and φ within the solid angleof light collection.
3.4. Model CalculationsWe calculated the NDPs (Table 1) for Rayleigh ellipsoids by
using the refractive indexes, shapes, and orientations as inputparameters based on the formulations in Sections 2–3. Becauseof the limitation of numbers of pages and figures, details ofthe model calculations are shown in online supplemental in-formation (SI). Importantly, the NDPs calculated for Rayleighellipsoids are sensitive to the shape and orientation of parti-cles. The SI shows the detailed relationships between particleorientations and NDPs for needle-like and plate-like Rayleighspheroids. In Section 5, we refer to the calculation results in SIfor interpretations of the experimental results.
4. EXPERIMENTAL METHODS
4.1. Operation of the InstrumentOur experiments were conducted at a pressure of 1000 ±
10 hPa and temperature of 300 ± 2 K. The pressure insidethe instrument chamber was approximately 30 hPa less thanthe ambient pressure because of the pressure drop through thenarrow tube of the nozzle inlet. At the nozzle inlet, sampleair with 1.7 cm3 s−1 volume flow rate is sheathed by cleandried air with 18 cm3 s−1 volume flow rate. The velocity of thesheathed sample flow is approximately 50 m s−1, and individualparticles take ∼40 µs to pass through the optical detectionvolume. Optical signals from eight photodetectors (four thermalemission and four scattering) are simultaneously digitized to12-bit resolution at a rate of 5 MHz (i.e., every 0.2 µs).
4.2. Test Particles4.2.1. Polystyrene Latex Particles
We need particles with standard spherical and nonsphericalshapes to test the functioning of the instrument and validatethe theoretical model. For this purpose, we used single-sphere
(singlets) and two-sphere clusters (doublets) of polystyrene la-tex (PSL). We generated aerosols from a concentrated aqueoussolution of the PSL sample with a single-sphere diameter of294 ± 9 nm (STADEX, JSR Corp., Tokyo, Japan) by using anultrasonic nebulizer (U-5000AT, CETAC, NE, USA). The num-ber distribution of the PSL aerosols as a function of particlemass was measured by an aerosol particle mass analyzer (APMmodel-302, KANOMAX, Osaka, Japan; Ehara et al. 1996) anda condensation particle counter (CPC model-3022A, TSI, Inc.,MN, USA). This measurement demonstrated the presence ofa significant number of 29.2 fg two-sphere clusters (doublets)associated with 14.6 fg single-sphere clusters (singlets). Singletand doublet PSL particles in the sample flow were discriminatedby the APM before measurement.
4.2.2. Graphite and Soot ParticlesWe used graphite and soot particles because their vaporiza-
tion temperatures are high enough to emit detectable intensitiesof thermal emission in the visible band upon laser-inducedincandescence (Moteki and Kondo 2010). Table 2 summarizesbrief descriptions of these samples. Aquadag and colloidalgraphite are plate-like fragments of crystalline graphite (Motekiand Kondo 2007, 2010; Moteki et al. 2009). Palas soot is afractal-like aggregate generated by spark discharges betweentwo graphite electrodes (GFG-1000 aerosols generator, Palas,GmbH, Germany). Helsper et al. (1993) describes the principlesof the GFG-1000 aerosol generator. Palas soot is an aggregateof many 5–10 nm primary spherules with nanocrystallinestructure similar to that of diesel soot (Wentzel et al. 2003).Aqua-Black (Aqua-Black 162, Tokai Carbon, Tokyo, Japan) isa commercial soot sample dispersed in water. Aqua-Black is anaggregate of primary spherules of ∼20 nm diameter (Motekiet al. 2009). Aquadag, colloidal graphite, and Aqua-Blacksamples were aerosolized from their water suspensions byusing a pneumatic nebulizer. The nebulized aerosols were driedthrough a diffusion dryer with silica gel. For each sample, weselected particle masses to be 14.6 fg by using the APM beforemeasurement.
As an indicator of the compactness of the particle shape, weuse the effective density ρeff (McMurry et al. 2002) defined bythe measured mass M and mobility diameter dmob as
M = π
6ρeffd
3mob, [53]
where dmob is measured by a differential mobility analyzer(Model-3081, TSI, Inc., MN, USA). The value of ρeff agreeswith the true density for spherical particles without internalvoids, and larger ρeff values close to the true density indicatethe compactness of the particle shape. The measured ρeff valuesof the samples for M = 14.6 fg are shown in Table 2. Theseρeff values are much less than the reported values of the truedensity of graphite and soot, which range from 1.63 to 2.26 gcm−3 as given by a compilation by Moteki and Kondo (2010),
Downloaded By: [Moteki, Nobuhiro] At: 14:14 25 May 2011
POLARIMETRY OF THERMAL EMISSION FROM AEROSOLS 1193
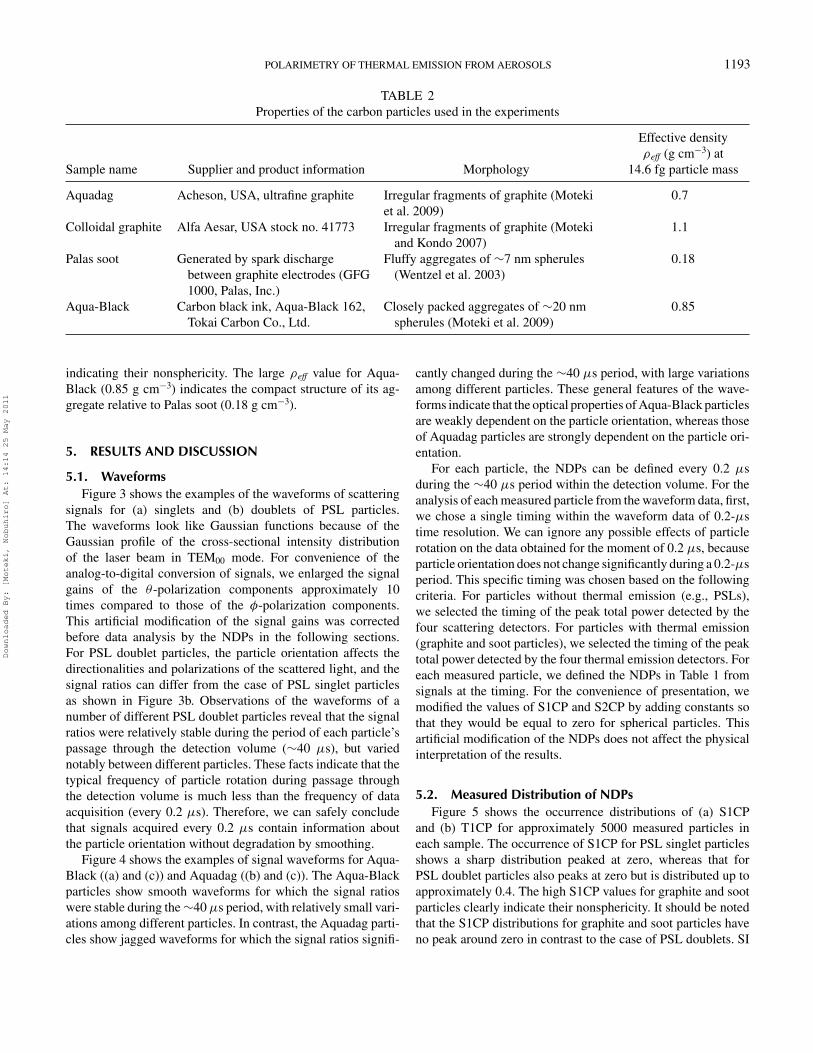
TABLE 2Properties of the carbon particles used in the experiments
Sample name Supplier and product information Morphology
Effective densityρeff (g cm−3) at
14.6 fg particle mass
Aquadag Acheson, USA, ultrafine graphite Irregular fragments of graphite (Motekiet al. 2009)
0.7
Colloidal graphite Alfa Aesar, USA stock no. 41773 Irregular fragments of graphite (Motekiand Kondo 2007)
1.1
Palas soot Generated by spark dischargebetween graphite electrodes (GFG1000, Palas, Inc.)
Fluffy aggregates of ∼7 nm spherules(Wentzel et al. 2003)
0.18
Aqua-Black Carbon black ink, Aqua-Black 162,Tokai Carbon Co., Ltd.
Closely packed aggregates of ∼20 nmspherules (Moteki et al. 2009)
0.85
indicating their nonsphericity. The large ρeff value for Aqua-Black (0.85 g cm−3) indicates the compact structure of its ag-gregate relative to Palas soot (0.18 g cm−3).
5. RESULTS AND DISCUSSION
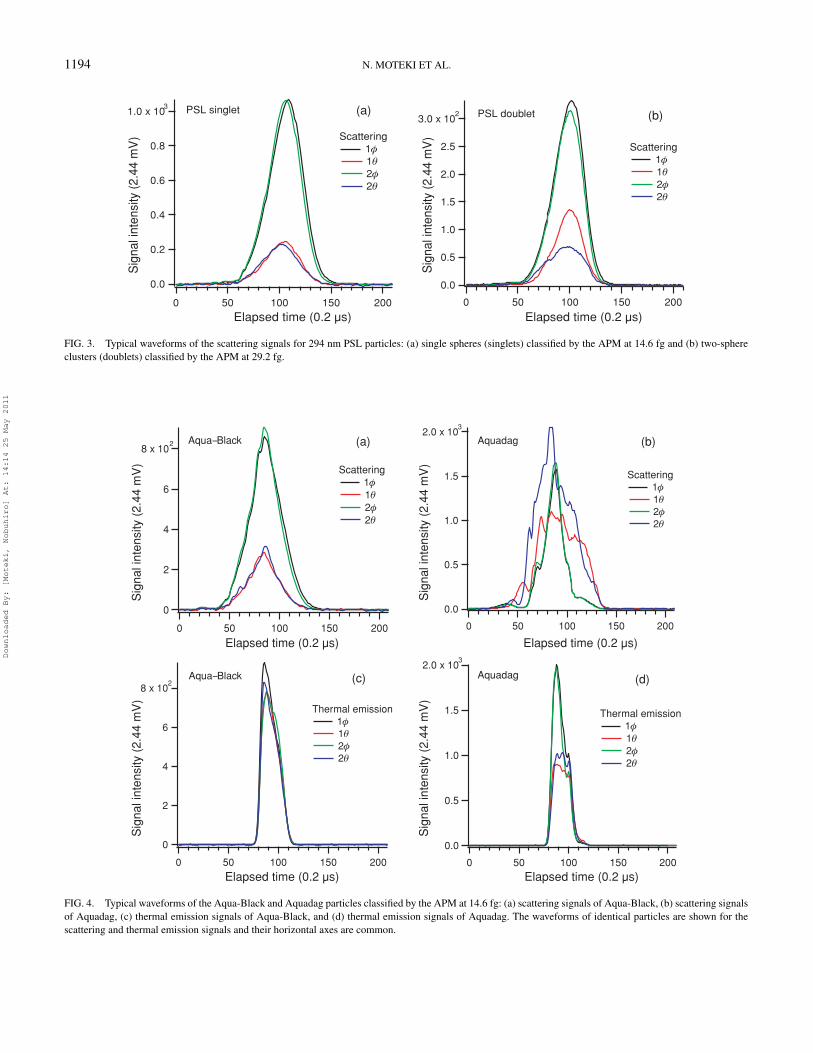
5.1. WaveformsFigure 3 shows the examples of the waveforms of scattering
signals for (a) singlets and (b) doublets of PSL particles.The waveforms look like Gaussian functions because of theGaussian profile of the cross-sectional intensity distributionof the laser beam in TEM00 mode. For convenience of theanalog-to-digital conversion of signals, we enlarged the signalgains of the θ -polarization components approximately 10times compared to those of the φ-polarization components.This artificial modification of the signal gains was correctedbefore data analysis by the NDPs in the following sections.For PSL doublet particles, the particle orientation affects thedirectionalities and polarizations of the scattered light, and thesignal ratios can differ from the case of PSL singlet particlesas shown in Figure 3b. Observations of the waveforms of anumber of different PSL doublet particles reveal that the signalratios were relatively stable during the period of each particle’spassage through the detection volume (∼40 µs), but variednotably between different particles. These facts indicate that thetypical frequency of particle rotation during passage throughthe detection volume is much less than the frequency of dataacquisition (every 0.2 µs). Therefore, we can safely concludethat signals acquired every 0.2 µs contain information aboutthe particle orientation without degradation by smoothing.
Figure 4 shows the examples of signal waveforms for Aqua-Black ((a) and (c)) and Aquadag ((b) and (c)). The Aqua-Blackparticles show smooth waveforms for which the signal ratioswere stable during the ∼40 µs period, with relatively small vari-ations among different particles. In contrast, the Aquadag parti-cles show jagged waveforms for which the signal ratios signifi-
cantly changed during the ∼40 µs period, with large variationsamong different particles. These general features of the wave-forms indicate that the optical properties of Aqua-Black particlesare weakly dependent on the particle orientation, whereas thoseof Aquadag particles are strongly dependent on the particle ori-entation.
For each particle, the NDPs can be defined every 0.2 µsduring the ∼40 µs period within the detection volume. For theanalysis of each measured particle from the waveform data, first,we chose a single timing within the waveform data of 0.2-µstime resolution. We can ignore any possible effects of particlerotation on the data obtained for the moment of 0.2 µs, becauseparticle orientation does not change significantly during a 0.2-µsperiod. This specific timing was chosen based on the followingcriteria. For particles without thermal emission (e.g., PSLs),we selected the timing of the peak total power detected by thefour scattering detectors. For particles with thermal emission(graphite and soot particles), we selected the timing of the peaktotal power detected by the four thermal emission detectors. Foreach measured particle, we defined the NDPs in Table 1 fromsignals at the timing. For the convenience of presentation, wemodified the values of S1CP and S2CP by adding constants sothat they would be equal to zero for spherical particles. Thisartificial modification of the NDPs does not affect the physicalinterpretation of the results.
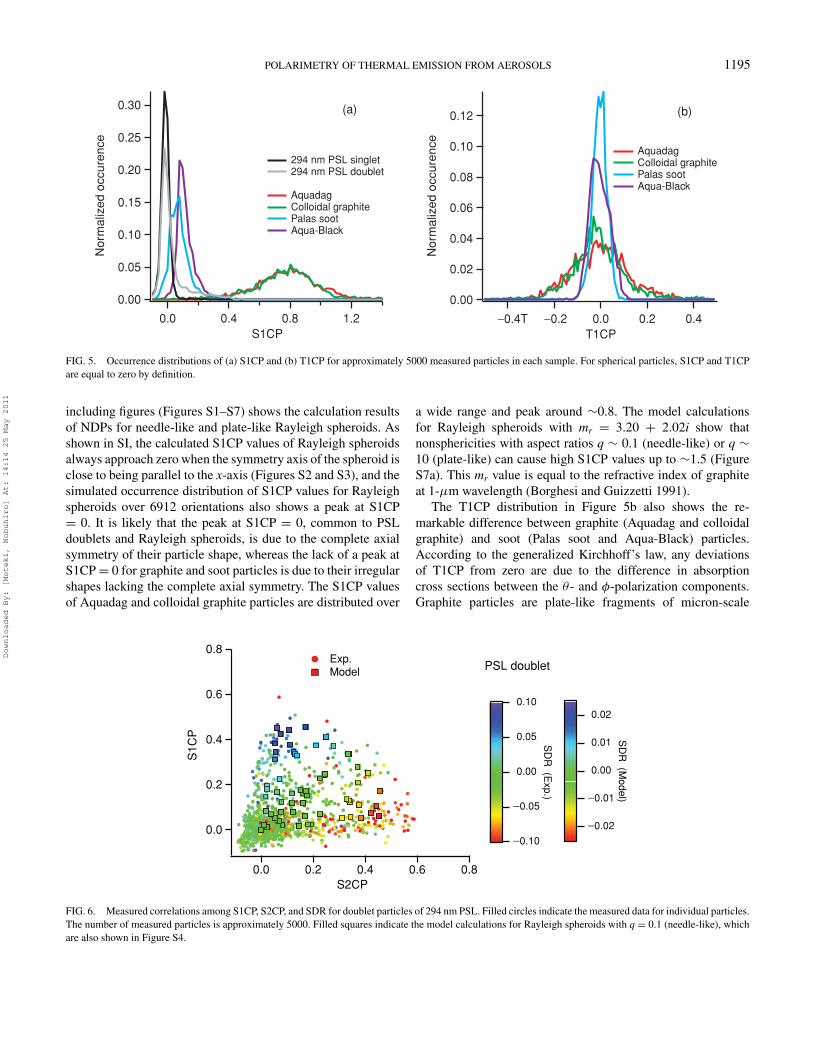
5.2. Measured Distribution of NDPsFigure 5 shows the occurrence distributions of (a) S1CP
and (b) T1CP for approximately 5000 measured particles ineach sample. The occurrence of S1CP for PSL singlet particlesshows a sharp distribution peaked at zero, whereas that forPSL doublet particles also peaks at zero but is distributed up toapproximately 0.4. The high S1CP values for graphite and sootparticles clearly indicate their nonsphericity. It should be notedthat the S1CP distributions for graphite and soot particles haveno peak around zero in contrast to the case of PSL doublets. SI
Downloaded By: [Moteki, Nobuhiro] At: 14:14 25 May 2011
1194 N. MOTEKI ET AL.
1.0 x 10³
0.8
0.6
0.4
0.2
0.0
Sig
nal i
nten
sity
(2.
44 m
V)
200150100500
Elapsed time (0.2 µs)
Scattering 1φ1θ2φ2θ
PSL singlet (a)3.0 x 10
2
2.5
2.0
1.5
1.0
0.5
0.0
Sig
nal i
nten
sity
(2.
44 m
V)
200150100500
Elapsed time (0.2 µs)
Scattering 1φ1θ2φ2θ
PSL doublet (b)
FIG. 3. Typical waveforms of the scattering signals for 294 nm PSL particles: (a) single spheres (singlets) classified by the APM at 14.6 fg and (b) two-sphereclusters (doublets) classified by the APM at 29.2 fg.
8 x 10²
6
4
2
0
Sig
nal i
nten
sity
(2.
44 m
V)
200150100500
Elapsed time (0.2 µs)
Scattering 1φ 1θ 2φ 2θ
Aqua--Black (a)2.0 x 10
3
1.5
1.0
0.5
0.0
Sig
nal i
nten
sity
(2.
44 m
V)
200150100500
Elapsed time (0.2 µs)
Scattering 1φ 1θ 2φ 2θ
Aquadag (b)
8 x 10²
6
4
2
0
Sig
nal i
nten
sity
(2.
44 m
V)
200150100500
Elapsed time (0.2 µs)
Thermal emission 1φ 1θ 2φ 2θ
Aqua--Black (c)2.0 x 10
3
1.5
1.0
0.5
0.0
Sig
nal i
nten
sity
(2.
44 m
V)
200150100500
Elapsed time (0.2 µs)
Thermal emission 1φ 1θ 2φ 2θ
Aquadag (d)
FIG. 4. Typical waveforms of the Aqua-Black and Aquadag particles classified by the APM at 14.6 fg: (a) scattering signals of Aqua-Black, (b) scattering signalsof Aquadag, (c) thermal emission signals of Aqua-Black, and (d) thermal emission signals of Aquadag. The waveforms of identical particles are shown for thescattering and thermal emission signals and their horizontal axes are common.
Downloaded By: [Moteki, Nobuhiro] At: 14:14 25 May 2011
POLARIMETRY OF THERMAL EMISSION FROM AEROSOLS 1195
0.30
0.25
0.20
0.15
0.10
0.05
0.00
Nor
mal
ized
occ
uren
ce
1.20.80.40.0S1CP
294 nm PSL singlet 294 nm PSL doublet
Aquadag Colloidal graphite Palas soot Aqua-Black
(a) 0.12
0.10
0.08
0.06
0.04
0.02
0.00
Nor
mal
ized
occ
uren
ce
−0.4T −0.2 0.0 0.2 0.4T1CP
Aquadag Colloidal graphite Palas soot Aqua-Black
(b)
FIG. 5. Occurrence distributions of (a) S1CP and (b) T1CP for approximately 5000 measured particles in each sample. For spherical particles, S1CP and T1CPare equal to zero by definition.
including figures (Figures S1–S7) shows the calculation resultsof NDPs for needle-like and plate-like Rayleigh spheroids. Asshown in SI, the calculated S1CP values of Rayleigh spheroidsalways approach zero when the symmetry axis of the spheroid isclose to being parallel to the x-axis (Figures S2 and S3), and thesimulated occurrence distribution of S1CP values for Rayleighspheroids over 6912 orientations also shows a peak at S1CP= 0. It is likely that the peak at S1CP = 0, common to PSLdoublets and Rayleigh spheroids, is due to the complete axialsymmetry of their particle shape, whereas the lack of a peak atS1CP = 0 for graphite and soot particles is due to their irregularshapes lacking the complete axial symmetry. The S1CP valuesof Aquadag and colloidal graphite particles are distributed over
a wide range and peak around ∼0.8. The model calculationsfor Rayleigh spheroids with mr = 3.20 + 2.02i show thatnonsphericities with aspect ratios q ∼ 0.1 (needle-like) or q ∼10 (plate-like) can cause high S1CP values up to ∼1.5 (FigureS7a). This mr value is equal to the refractive index of graphiteat 1-µm wavelength (Borghesi and Guizzetti 1991).
The T1CP distribution in Figure 5b also shows the re-markable difference between graphite (Aquadag and colloidalgraphite) and soot (Palas soot and Aqua-Black) particles.According to the generalized Kirchhoff’s law, any deviationsof T1CP from zero are due to the difference in absorptioncross sections between the θ - and φ-polarization components.Graphite particles are plate-like fragments of micron-scale
0.8
0.6
0.4
0.2
0.0
S1C
P
0.80.60.40.20.0S2CP
Exp. Model
−0.02
−0.01
0.00
0.01
0.02
SD
R (M
odel)
PSL doublet
−0.10
−0.05
0.00
0.05
0.10
SD
R (E
xp.)
FIG. 6. Measured correlations among S1CP, S2CP, and SDR for doublet particles of 294 nm PSL. Filled circles indicate the measured data for individual particles.The number of measured particles is approximately 5000. Filled squares indicate the model calculations for Rayleigh spheroids with q = 0.1 (needle-like), whichare also shown in Figure S4.
Downloaded By: [Moteki, Nobuhiro] At: 14:14 25 May 2011
1196 N. MOTEKI ET AL.
2.0
1.5
1.0
0.5
0.0
S1C
P
2.01.51.00.50.0S2CP
−0.15
−0.10
−0.05
0.00
0.05
0.10
0.15
SD
R (E
xp.)
Aquadag
−0.15
−0.10
−0.05
0.00
0.05
0.10
0.15
SD
R (M
odel)
Exp. Model
(a)
−1.0
−0.5
0.0
0.5
1.0
T1C
P
2.01.51.00.50.0S1CP
−0.4
−0.2
0.0
0.2
0.4
T2C
P (E
xp.)
−0.8
−0.6
−0.4
−0.2
0.0
0.2
0.4
0.6
0.8
T2C
P (M
odel) Exp.
r2= 0.26
Model
Aquadag (b)
−1.0
−0.5
0.0
0.5
1.0
T2C
P
2.01.51.00.50.0S2CP
−0.4
−0.2
0.0
0.2
0.4
T1C
P (E
xp.)
−0.8
−0.6
−0.4
−0.2
0.0
0.2
0.4
0.6
0.8
T1C
P (M
odel) Exp.
r2 = 0.31
Model
Aquadag (c)
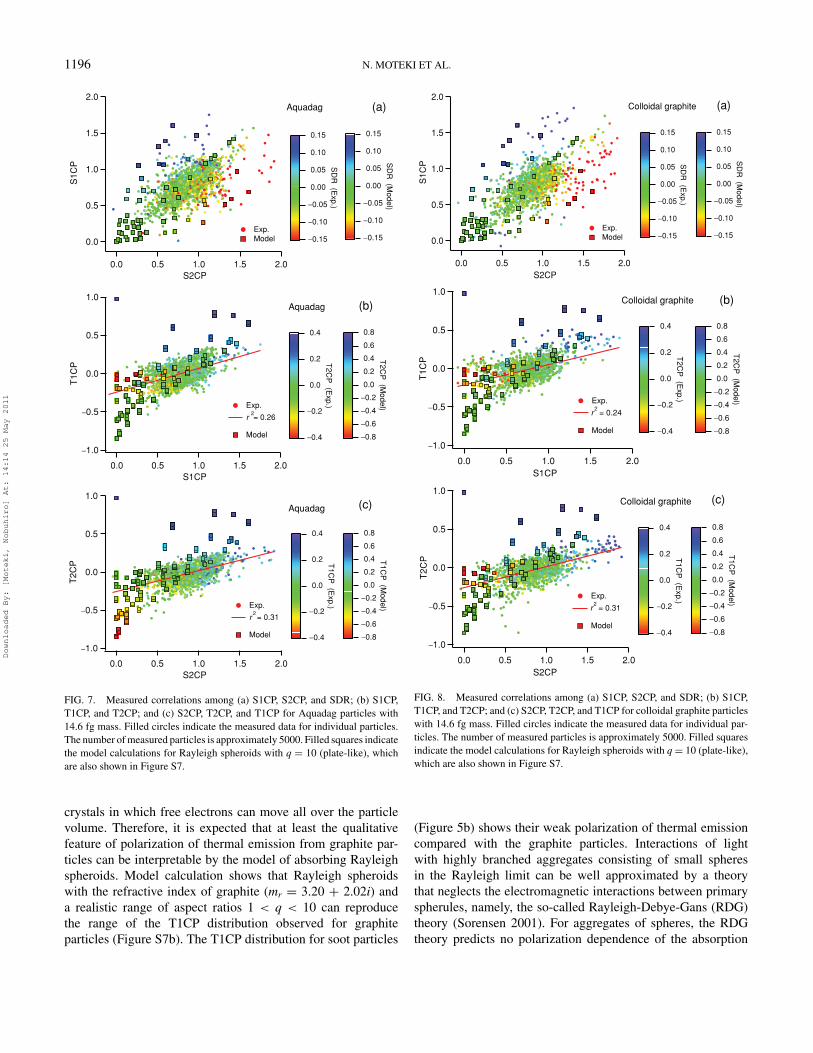
FIG. 7. Measured correlations among (a) S1CP, S2CP, and SDR; (b) S1CP,T1CP, and T2CP; and (c) S2CP, T2CP, and T1CP for Aquadag particles with14.6 fg mass. Filled circles indicate the measured data for individual particles.The number of measured particles is approximately 5000. Filled squares indicatethe model calculations for Rayleigh spheroids with q = 10 (plate-like), whichare also shown in Figure S7.
crystals in which free electrons can move all over the particlevolume. Therefore, it is expected that at least the qualitativefeature of polarization of thermal emission from graphite par-ticles can be interpretable by the model of absorbing Rayleighspheroids. Model calculation shows that Rayleigh spheroidswith the refractive index of graphite (mr = 3.20 + 2.02i) anda realistic range of aspect ratios 1 < q < 10 can reproducethe range of the T1CP distribution observed for graphiteparticles (Figure S7b). The T1CP distribution for soot particles
2.0
1.5
1.0
0.5
0.0
S1C
P
2.01.51.00.50.0S2CP
−0.15
−0.10
−0.05
0.00
0.05
0.10
0.15S
DR
(Exp.)
Colloidal graphite
−0.15
−0.10
−0.05
0.00
0.05
0.10
0.15
SD
R (M
odel)
Exp. Model
(a)
−1.0
−0.5
0.0
0.5
1.0
T1C
P
2.01.51.00.50.0S1CP
Exp.
r2
= 0.24
Model −0.4
−0.2
0.0
0.2
0.4
T2C
P (E
xp.)
−0.8
−0.6
−0.4
−0.2
0.0
0.2
0.4
0.6
0.8
T2C
P (M
odel)
Colloidal graphite (b)
−1.0
−0.5
0.0
0.5
1.0
T2C
P
2.01.51.00.50.0S2CP
Exp.
r2
= 0.31
Model−0.4
−0.2
0.0
0.2
0.4
T1C
P (E
xp.)
−0.8
−0.6
−0.4
−0.2
0.0
0.2
0.4
0.6
0.8
T1C
P (M
odel)
Colloidal graphite (c)
FIG. 8. Measured correlations among (a) S1CP, S2CP, and SDR; (b) S1CP,T1CP, and T2CP; and (c) S2CP, T2CP, and T1CP for colloidal graphite particleswith 14.6 fg mass. Filled circles indicate the measured data for individual par-ticles. The number of measured particles is approximately 5000. Filled squaresindicate the model calculations for Rayleigh spheroids with q = 10 (plate-like),which are also shown in Figure S7.
(Figure 5b) shows their weak polarization of thermal emissioncompared with the graphite particles. Interactions of lightwith highly branched aggregates consisting of small spheresin the Rayleigh limit can be well approximated by a theorythat neglects the electromagnetic interactions between primaryspherules, namely, the so-called Rayleigh-Debye-Gans (RDG)theory (Sorensen 2001). For aggregates of spheres, the RDGtheory predicts no polarization dependence of the absorption
Downloaded By: [Moteki, Nobuhiro] At: 14:14 25 May 2011
POLARIMETRY OF THERMAL EMISSION FROM AEROSOLS 1197
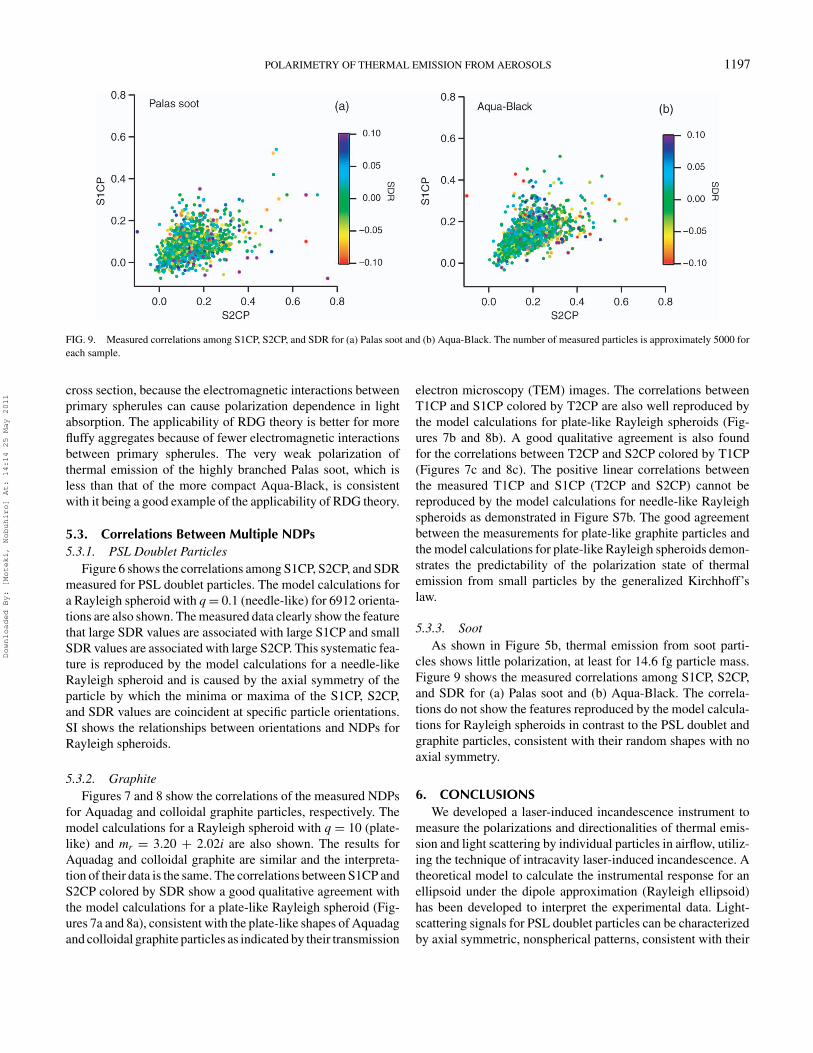
FIG. 9. Measured correlations among S1CP, S2CP, and SDR for (a) Palas soot and (b) Aqua-Black. The number of measured particles is approximately 5000 foreach sample.
cross section, because the electromagnetic interactions betweenprimary spherules can cause polarization dependence in lightabsorption. The applicability of RDG theory is better for morefluffy aggregates because of fewer electromagnetic interactionsbetween primary spherules. The very weak polarization ofthermal emission of the highly branched Palas soot, which isless than that of the more compact Aqua-Black, is consistentwith it being a good example of the applicability of RDG theory.
5.3. Correlations Between Multiple NDPs5.3.1. PSL Doublet Particles
Figure 6 shows the correlations among S1CP, S2CP, and SDRmeasured for PSL doublet particles. The model calculations fora Rayleigh spheroid with q = 0.1 (needle-like) for 6912 orienta-tions are also shown. The measured data clearly show the featurethat large SDR values are associated with large S1CP and smallSDR values are associated with large S2CP. This systematic fea-ture is reproduced by the model calculations for a needle-likeRayleigh spheroid and is caused by the axial symmetry of theparticle by which the minima or maxima of the S1CP, S2CP,and SDR values are coincident at specific particle orientations.SI shows the relationships between orientations and NDPs forRayleigh spheroids.
5.3.2. GraphiteFigures 7 and 8 show the correlations of the measured NDPs
for Aquadag and colloidal graphite particles, respectively. Themodel calculations for a Rayleigh spheroid with q = 10 (plate-like) and mr = 3.20 + 2.02i are also shown. The results forAquadag and colloidal graphite are similar and the interpreta-tion of their data is the same. The correlations between S1CP andS2CP colored by SDR show a good qualitative agreement withthe model calculations for a plate-like Rayleigh spheroid (Fig-ures 7a and 8a), consistent with the plate-like shapes of Aquadagand colloidal graphite particles as indicated by their transmission
electron microscopy (TEM) images. The correlations betweenT1CP and S1CP colored by T2CP are also well reproduced bythe model calculations for plate-like Rayleigh spheroids (Fig-ures 7b and 8b). A good qualitative agreement is also foundfor the correlations between T2CP and S2CP colored by T1CP(Figures 7c and 8c). The positive linear correlations betweenthe measured T1CP and S1CP (T2CP and S2CP) cannot bereproduced by the model calculations for needle-like Rayleighspheroids as demonstrated in Figure S7b. The good agreementbetween the measurements for plate-like graphite particles andthe model calculations for plate-like Rayleigh spheroids demon-strates the predictability of the polarization state of thermalemission from small particles by the generalized Kirchhoff’slaw.
5.3.3. SootAs shown in Figure 5b, thermal emission from soot parti-
cles shows little polarization, at least for 14.6 fg particle mass.Figure 9 shows the measured correlations among S1CP, S2CP,and SDR for (a) Palas soot and (b) Aqua-Black. The correla-tions do not show the features reproduced by the model calcula-tions for Rayleigh spheroids in contrast to the PSL doublet andgraphite particles, consistent with their random shapes with noaxial symmetry.
6. CONCLUSIONSWe developed a laser-induced incandescence instrument to
measure the polarizations and directionalities of thermal emis-sion and light scattering by individual particles in airflow, utiliz-ing the technique of intracavity laser-induced incandescence. Atheoretical model to calculate the instrumental response for anellipsoid under the dipole approximation (Rayleigh ellipsoid)has been developed to interpret the experimental data. Light-scattering signals for PSL doublet particles can be characterizedby axial symmetric, nonspherical patterns, consistent with their
Downloaded By: [Moteki, Nobuhiro] At: 14:14 25 May 2011
1198 N. MOTEKI ET AL.
actual shape. The polarizations and directionalities of thermalemission from plate-like graphite particles smaller than thewavelength were successfully explained by the model calcu-lations for light-absorbing Rayleigh spheroids with plate-likeshapes under the assumption of the generalized Kirchhoff’s law.This result provides the first evidence that the polarization ofthermal emission from small particles can be predicted by thegeneralized Kirchhoff’s law. This study also proposes that themeasurements of the polarization of thermal emission from in-dividual particles can be used as a novel method for real-timemeasurements of the shape of light-absorbing particles in air.
REFERENCESAdachi, K., Chung, S. H., and Buseck, P. R. (2010). Shapes of Soot Aerosol
Particles and Implications for Their Effects on Climate. J. Geophys. Res.,115, D15206, doi:10.1029/2009JD012868.
Aptowicz, K. B., Pinnick, R. G., Hill, S. C., Pan, Y. L., and Chang, R. K. (2006).Optical Scattering Patterns from Single Urban Aerosol Particles at Adel-phi, Maryland, USA: A Classification Relating to Particle Morphologies. J.Geophys. Res., 111, D12212, doi:10.1029/2005JD006774.
Arfken, G., and Weber, H. (2005). Mathematical Methods for Physicists (6thed.). Elsevier Academic Press, NY, USA.
Bekefi, G. (1966). Radiation Processes in Plasmas. John Wiley & Sons, NewYork.
Bogan, M., Boutet, S., Chapman, H., Marchesini, S., Barty, A., Benner, H.,Rohner, U., Frank, M., Hau-Riege, S., Sasa Bajt, S., Woods, B., Seibert, M.,Iwan, B., Timneanu, N., Hajdu, J., and Schulz, J. (2010). Aerosol Imagingwith a Soft X-Ray Free Electron Laser. Aerosol Sci. Technol., 44(3):i–vi.
Bohren, C. F., and Huffman, D. R. (1983). Absorption and Scattering of Lightby Small Particles. John-Wiley & Sons, New York.
Borghesi, A., and Guizzetti, G. (1991). Graphite (C), in Handbook of OpticalConstants of Solids II, E. D. Palik, ed., Academic Press, New York, 449–460.
Boutou, V., Favre, C., Hill, S. C., Pan, Y. L., Chang, R. K., and Wolf, J. P. (2002).Backward Enhanced Emission from Multiphoton Processes in Aerosols.Appl. Phys. B, 75:145–152.
Dubovik, O., Holben, B. N., Lapyonok, T., Sinyuk, A., Mishchenko, M. I.,Yang, P., and Slutsker, I. (2002). Non-Spherical Aerosol Retrieval MethodEmploying Light Scattering by Spheroids. Geophys. Res. Lett., 29, 54. 1–4doi:10.1029/2001GL014506.
Ehara, K., Hagwood, C., and Coakley, K. J. (1996). Novel Method to Clas-sify Aerosol Particles According to Their Mass-to-Charge Ratio—AerosolParticle Mass Analyzer. J. Aerosol Sci., 27;217–234.
Gao, R. S., Schwarz, J. P., Kelly, K. K., Fahey, D. W., Watts, L. A., Thompson,T. L., Spackman, J. R., Slowik, J. G., Cross, E. S., Han, J.-H., Davidovits,P., Onasch, T. B., and Worsnop, D. R. (2007). A Novel Method for Es-timating Light-Scattering Properties of Soot Aerosols Using a ModifiedSingle-Particle Soot Photometer. Aerosol Sci. Technol., 41:125–135.
Griaznov, V., Veselovskii, I., Kolgotin, A., and Whiteman, D. N. (2002).Angle- and Size-Dependent Characteristics of Incoherent Raman and Flu-orescent Scattering by Microspheres. 1. General Expressions. Appl. Optic,41:5773–5782.
Helsper, C., Molter, W., Loffler, F., Wadenpohl, C., and Kaufmann, S. (1993).Investigations of a New Aerosol Generator for the Production of CarbonAggregate Particles. Atmos. Environ., 27A:1271–1275.
Kahnert, F. M. (2003). Numerical Methods in Electromagnetic Scattering The-ory. J. Quant. Spectrosc. Radiat. Transf., 79–80:775–824.
Koechner, W. (2006). Solid-State Laser Engineering, Sixth Revised and UpdatedEdition. Springer Science + Business Media, New York.
McMurry, P. H., Wang, X., Park, K., and Ehara, K. (2002). The RelationshipBetween Mass-To-Mobility of Atmospheric Particles: A New Technique forMeasuring Particle Density. Aerosol Sci. Technol., 36:227–238.
Moteki, N., and Kondo, Y. (2007). Effects of Mixing State on Black Car-bon Measurements by Laser-Induced Incandescence. Aerosol Sci. Technol.,41:398–417.
Moteki, N., Kondo, Y., Takegawa, N., and Nakamura, S. (2009). DirectionalDependence of Thermal Emission from Nonspherical Carbon Particles. J.Aerosol Sci., 40:790–801.
Moteki, N., Kondo, Y., and Nakamura, S. (2010). Method to Measure Refrac-tive Indices of Small Nonspherical Particles: Application to Black CarbonParticles. J. Aerosol Sci., 41:513–521.
Moteki, N., and Kondo, Y. (2010). Dependence of Laser-Induced Incandes-cence on Physical Properties of Black Carbon Aerosols: Measurements andTheoretical Interpretation. Aerosol Sci. Technol., 44:663–675.
Rytov, S. (1953). The Theory of Electrical Fluctuations and Thermal Radi-ation (English Translation by US Air Force Cambridge Research Cen-ter, Bedford, MA, Rep. AFCRC-TR-59-162). USSR Academy of Science,Moscow.
Sachweh, B., Barthel, H., Polke, R., Umhauer, H., and Buttner, H. (1999).Particle Shape and Structure Analysis from the Spatial Intensity Patternof Scattered Light Using Different Measuring Devices. J. Aerosol Sci.,30:1257–1270.
Sassen, K. (2000). Lidar Backscatter Depolarization Technique for Cloudand Aerosol Research, in Light Scattering by Nonspherical Particles,M. I. Mischenko, J. W. Hovenier, & L. D. Travis, eds., Academic Press,New York, 393–416.
Schwarz, J. P., Gao, R. S., Fahey, D. W., Thomson, D. S., Watts, L. A., Wilson, J.C., Reeves, J. M., Darbeshti, M., Baumgardner, D. G., Kok, G. L., Chung, S.H., Schulz, M., Hendricks, J., Lauer, A., Karcher, B., Slowik, J. G., Rosenlof,K. H., Thompson, T. L., Langford, A. O., Lowenstein, M., and Aikin, K.C. (2006). Single-Particle Measurement of Mid Latitude Black Carbon andLight-Scattering Aerosols from the Boundary Layer to the Lower Strato-sphere. J. Geophys. Res., 111, D16207, doi:10.1029/2006JD007076.
Sorensen, C. M. (2001). Light Scattering by Fractal Aggregates: A Review.Aerosol Sci. Technol., 35:648–687.
Stephens, M., Turner, N., and Sandberg, J. (2003). Particle Identification byLaser-Induced Incandescence in a Solid-State Laser Cavity. Appl. Optic,42:3726–3736.
van de Hulst, H. C. (1981). Light Scattering by Small Particles. Dover Publica-tions, NY.
Weigel, T., Shulte, J., and Schweiger, G. (2006). Inelastic Scattering by Particlesof Arbitrary Shape. J. Opt. Soc. Am. A, 23:2797–2802.
Wentzel, M., Gorzawski, H., Naumann, K.-H., Saathoff, H., andWeinbruch, S. (2003). Transmission Electron Microscopical andAerosol Dynamical Characterization of Soot Aerosols. J. Aerosol Sci.,34:1347–1370.
Downloaded By: [Moteki, Nobuhiro] At: 14:14 25 May 2011


![srep30175] Uncorrected proof](https://img.pdfslide.net/doc/110x75/625b0c1933f4415b212ded18/srep30175-uncorrected-proof.jpg)