Embed Size (px)
Citation preview
Aerothermal and Propulsion Ground Testing That Can Be Conducted to Increase Chances for Successful Hypervelocity Flight Experiments
Michael S. Holden, PhD CUBRC
4455 Genesee Street Buffalo, NY 14225 USA
1.0 OUTLINE
• Introduction – Experiment/Testing in Flight and on Ground
• Requirements for Ground Test Simulation in Hypersonic/Hypervelocity Flows
• Mach Number/Reynolds Number Simulation and Aerothermal Tests for Shuttle
• Numerical Codes/Physical Models Evaluation Studies
• Velocity/Density Simulation and Evaluation of Vehicle Performance
• Velocity/Altitude Simulation and Scramjet Engine Testing
• Conclusions
2.0 INTRODUCTION – EXPERIMENT/TESTING IN FLIGHT AND ON THE GROUND
Vehicle and Systems Evaluation
• Vehicle Performance– Vehicle Stability– Control System Effectiveness– TPS Performance
• Ablation/Recession• Transpiration Active Cooling
Systems• Component Testing
– Seekerhead coolant system– IR detector– DAC Thrusters– Shroud and stores separation
• Ram/Scramjet Testing– Vehicle stability and control (power
off and on)– Thrust performance– Starting and inlet performance – Performance of thermal protection
and thermal balance systems
Flight Test Experiments
– Measurements of Real Gas Effects• Catalytic heating effects, flowfield
radiation, electronic plasma, flap forces and heating, viscous/inviscid interaction, boundary layer transition
– Transitional Flows• Boundary layer tripping with
roughness and blowing• Transitional flow over compression
surfaces– Turbulent Interacting Flows
• Turbulence models for separated shock wave/turbulent boundary layer interaction
• Turbulence/flow chemistry plus combustion interaction
• Transpiration Cooling and ablation– Ram/Scramjet Technology– Ignition, mixing, shock interaction and
combustion– Starting and inlet performance
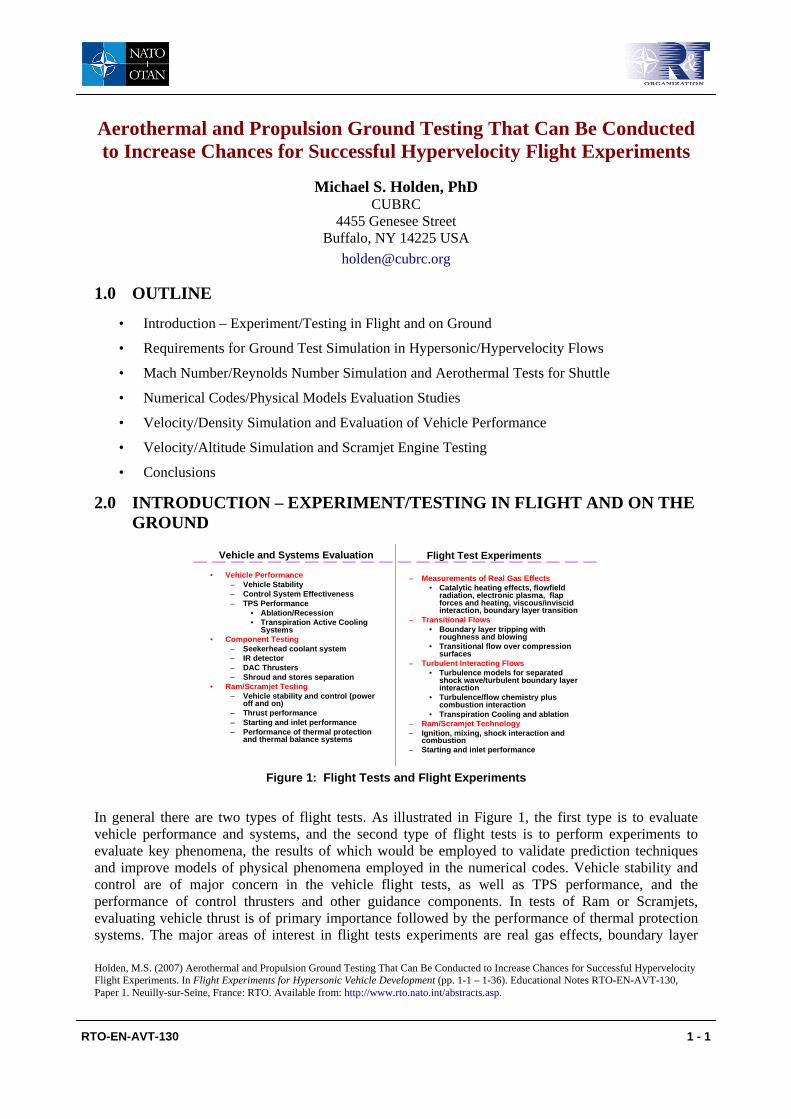
Figure 1: Flight Tests and Flight Experiments
In general there are two types of flight tests. As illustrated in Figure 1, the first type is to evaluate vehicle performance and systems, and the second type of flight tests is to perform experiments to evaluate key phenomena, the results of which would be employed to validate prediction techniques and improve models of physical phenomena employed in the numerical codes. Vehicle stability and control are of major concern in the vehicle flight tests, as well as TPS performance, and the performance of control thrusters and other guidance components. In tests of Ram or Scramjets, evaluating vehicle thrust is of primary importance followed by the performance of thermal protection systems. The major areas of interest in flight tests experiments are real gas effects, boundary layer
RTO-EN-AVT-130 1 - 1
Holden, M.S. (2007) Aerothermal and Propulsion Ground Testing That Can Be Conducted to Increase Chances for Successful Hypervelocity Flight Experiments. In Flight Experiments for Hypersonic Vehicle Development (pp. 1-1 – 1-36). Educational Notes RTO-EN-AVT-130, Paper 1. Neuilly-sur-Seine, France: RTO. Available from: http://www.rto.nato.int/abstracts.asp.
Report Documentation Page Form ApprovedOMB No. 0704-0188
Public reporting burden for the collection of information is estimated to average 1 hour per response, including the time for reviewing instructions, searching existing data sources, gathering andmaintaining the data needed, and completing and reviewing the collection of information. Send comments regarding this burden estimate or any other aspect of this collection of information,including suggestions for reducing this burden, to Washington Headquarters Services, Directorate for Information Operations and Reports, 1215 Jefferson Davis Highway, Suite 1204, ArlingtonVA 22202-4302. Respondents should be aware that notwithstanding any other provision of law, no person shall be subject to a penalty for failing to comply with a collection of information if itdoes not display a currently valid OMB control number.
1. REPORT DATE 01 JUN 2007
2. REPORT TYPE N/A
3. DATES COVERED -
4. TITLE AND SUBTITLE Aerothermal and Propulsion Ground Testing That Can Be Conducted toIncrease Chances for Successful Hypervelocity Flight Experiments
5a. CONTRACT NUMBER
5b. GRANT NUMBER
5c. PROGRAM ELEMENT NUMBER
6. AUTHOR(S) 5d. PROJECT NUMBER
5e. TASK NUMBER
5f. WORK UNIT NUMBER
7. PERFORMING ORGANIZATION NAME(S) AND ADDRESS(ES) CUBRC 4455 Genesee Street Buffalo, NY 14225 USA
8. PERFORMING ORGANIZATIONREPORT NUMBER
9. SPONSORING/MONITORING AGENCY NAME(S) AND ADDRESS(ES) 10. SPONSOR/MONITOR’S ACRONYM(S)
11. SPONSOR/MONITOR’S REPORT NUMBER(S)
12. DISTRIBUTION/AVAILABILITY STATEMENT Approved for public release, distribution unlimited
13. SUPPLEMENTARY NOTES See also ADM002054., The original document contains color images.
14. ABSTRACT
15. SUBJECT TERMS
16. SECURITY CLASSIFICATION OF: 17. LIMITATION OF ABSTRACT
UU
18. NUMBEROF PAGES
36
19a. NAME OFRESPONSIBLE PERSON
a. REPORT unclassified
b. ABSTRACT unclassified
c. THIS PAGE unclassified
Standard Form 298 (Rev. 8-98) Prescribed by ANSI Std Z39-18
transition, viscous interaction phenomena in laminar and turbulent flows, and ignition, mixing, shock interaction and combustion phenomena for airbreathing systems.
• Real gas effects on laminar interacting flows– Computational methods to describe flows between rarified and continuum flow regimes – Models of real gas chemistry for velocities above 10,000 ft/s– Models of flow/surface interaction in hypervelocity flows– Surface catalysis effects
• Shear layer and boundary layer transitional flows– Modeling tripping mechanisms associated with surface roughness, blowing, vibration and
freestream disturbances – Real gas effects– Shock interaction and pressure gradient effects
• Turbulent interacting flows – Developing turbulence models for separated regions of shock wave/turbulent boundary layer
interaction– Modeling turbulence/flow chemistry/combustion interactions– Transpiration cooling and ablation
• Mixing and Combustion– 3D mixing of fuel injector systems– Ignition and ignition delay aerothermodynamics– Mixing and combustion including shock interaction phenomena
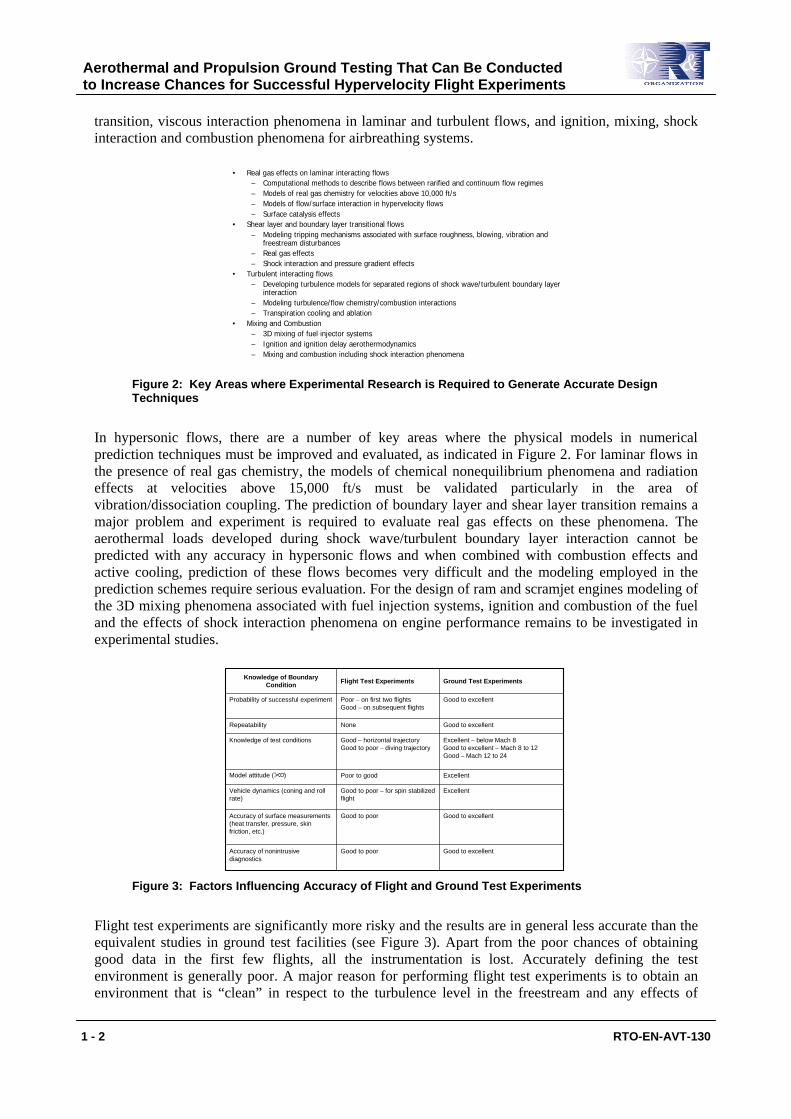
Figure 2: Key Areas where Experimental Research is Required to Generate Accurate Design Techniques
In hypersonic flows, there are a number of key areas where the physical models in numerical prediction techniques must be improved and evaluated, as indicated in Figure 2. For laminar flows in the presence of real gas chemistry, the models of chemical nonequilibrium phenomena and radiation effects at velocities above 15,000 ft/s must be validated particularly in the area of vibration/dissociation coupling. The prediction of boundary layer and shear layer transition remains a major problem and experiment is required to evaluate real gas effects on these phenomena. The aerothermal loads developed during shock wave/turbulent boundary layer interaction cannot be predicted with any accuracy in hypersonic flows and when combined with combustion effects and active cooling, prediction of these flows becomes very difficult and the modeling employed in the prediction schemes require serious evaluation. For the design of ram and scramjet engines modeling of the 3D mixing phenomena associated with fuel injection systems, ignition and combustion of the fuel and the effects of shock interaction phenomena on engine performance remains to be investigated in experimental studies.
Good to excellentGood to poorAccuracy of nonintrusive diagnostics
Good to excellentGood to poorAccuracy of surface measurements (heat transfer, pressure, skin friction, etc.)
ExcellentGood to poor – for spin stabilized flight
Vehicle dynamics (coning and roll rate)
ExcellentPoor to goodModel attitude ( )
Excellent – below Mach 8 Good to excellent – Mach 8 to 12Good – Mach 12 to 24
Good – horizontal trajectoryGood to poor – diving trajectory
Knowledge of test conditions
Good to excellentNoneRepeatability
Good to excellentPoor – on first two flightsGood – on subsequent flights
Probability of successful experiment
Ground Test ExperimentsFlight Test Experiments Knowledge of Boundary Condition
Figure 3: Factors Influencing Accuracy of Flight and Ground Test Experiments
Flight test experiments are significantly more risky and the results are in general less accurate than the equivalent studies in ground test facilities (see Figure 3). Apart from the poor chances of obtaining good data in the first few flights, all the instrumentation is lost. Accurately defining the test environment is generally poor. A major reason for performing flight test experiments is to obtain an environment that is “clean” in respect to the turbulence level in the freestream and any effects of
Aerothermal and Propulsion Ground Testing That Can Be Conducted to Increase Chances for Successful Hypervelocity Flight Experiments
1 - 2 RTO-EN-AVT-130
nonequilibrium flow chemistry. In general, the scale of the vehicle employed in the flight test experiments can be replicated in today’s large scale ground test facilities. The major drawback in flight test experiment is launch and vehicle cost and the total loss of all instrumentation.
3.0 REQUIREMENTS FOR GROUND TEST SIMULATION IN HYPERSONIC/HYPERVELOCITY FLOWS
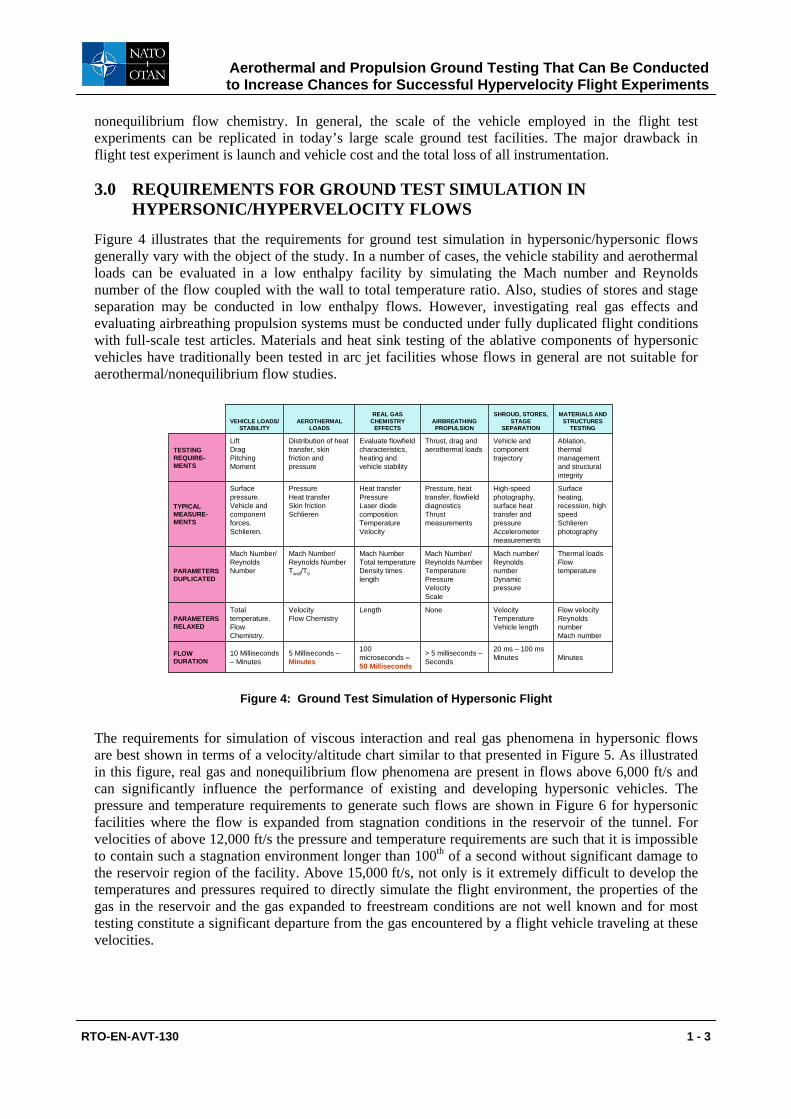
Figure 4 illustrates that the requirements for ground test simulation in hypersonic/hypersonic flows generally vary with the object of the study. In a number of cases, the vehicle stability and aerothermal loads can be evaluated in a low enthalpy facility by simulating the Mach number and Reynolds number of the flow coupled with the wall to total temperature ratio. Also, studies of stores and stage separation may be conducted in low enthalpy flows. However, investigating real gas effects and evaluating airbreathing propulsion systems must be conducted under fully duplicated flight conditions with full-scale test articles. Materials and heat sink testing of the ablative components of hypersonic vehicles have traditionally been tested in arc jet facilities whose flows in general are not suitable for aerothermal/nonequilibrium flow studies.
Minutes20 ms – 100 msMinutes> 5 milliseconds –
Seconds
100 microseconds –50 Milliseconds
5 Milliseconds –Minutes
10 Milliseconds – Minutes
FLOW DURATION
Flow velocityReynolds numberMach number
VelocityTemperatureVehicle length
NoneLengthVelocityFlow Chemistry
Total temperature.Flow Chemistry.
PARAMETERS RELAXED
Thermal loadsFlow temperature
Mach number/ Reynolds numberDynamic pressure
Mach Number/ Reynolds NumberTemperaturePressureVelocityScale
Mach NumberTotal temperatureDensity times length
Mach Number/ Reynolds NumberTwall/T0
Mach Number/ Reynolds NumberPARAMETERS
DUPLICATED
Surface heating, recession, high speed Schlieren photography
High-speed photography, surface heat transfer and pressureAccelerometer measurements
Pressure, heat transfer, flowfield diagnosticsThrust measurements
Heat transferPressureLaser diode compositionTemperatureVelocity
PressureHeat transferSkin frictionSchlieren
Surface pressure.Vehicle and component forces.Schlieren.
TYPICAL MEASURE-MENTS
Ablation, thermal management and structural integrity
Vehicle and component trajectory
Thrust, drag and aerothermal loads
Evaluate flowfield characteristics, heating and vehicle stability
Distribution of heat transfer, skin friction andpressure
LiftDragPitching Moment
TESTING REQUIRE-MENTS
MATERIALS AND STRUCTURES
TESTING
SHROUD, STORES, STAGE
SEPARATION AIRBREATHING PROPULSION
REAL GAS CHEMISTRY
EFFECTSAEROTHERMAL
LOADSVEHICLE LOADS/
STABILITY
Figure 4: Ground Test Simulation of Hypersonic Flight
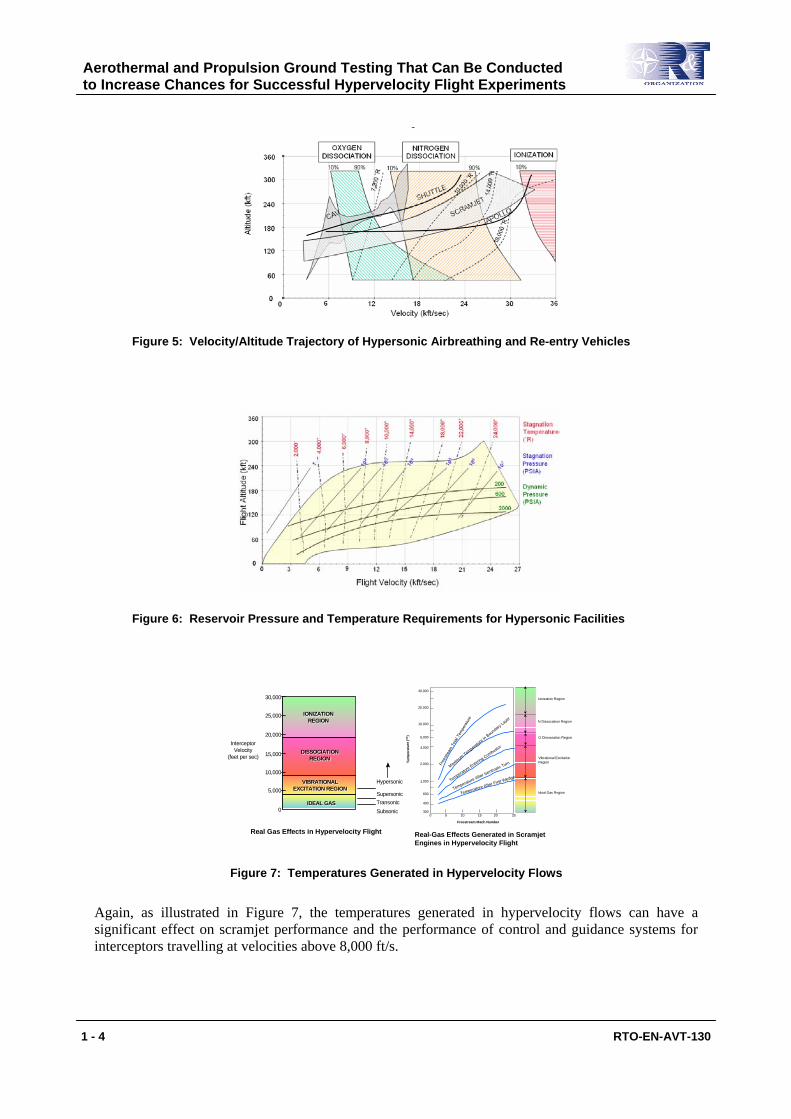
The requirements for simulation of viscous interaction and real gas phenomena in hypersonic flows are best shown in terms of a velocity/altitude chart similar to that presented in Figure 5. As illustrated in this figure, real gas and nonequilibrium flow phenomena are present in flows above 6,000 ft/s and can significantly influence the performance of existing and developing hypersonic vehicles. The pressure and temperature requirements to generate such flows are shown in Figure 6 for hypersonic facilities where the flow is expanded from stagnation conditions in the reservoir of the tunnel. For velocities of above 12,000 ft/s the pressure and temperature requirements are such that it is impossible to contain such a stagnation environment longer than 100th of a second without significant damage to the reservoir region of the facility. Above 15,000 ft/s, not only is it extremely difficult to develop the temperatures and pressures required to directly simulate the flight environment, the properties of the gas in the reservoir and the gas expanded to freestream conditions are not well known and for most testing constitute a significant departure from the gas encountered by a flight vehicle traveling at these velocities.
Aerothermal and Propulsion Ground Testing That Can Be Conducted to Increase Chances for Successful Hypervelocity Flight Experiments
RTO-EN-AVT-130 1 - 3
y
Figure 5: Velocity/Altitude Trajectory of Hypersonic Airbreathing and Re-entry Vehicles
Figure 6: Reservoir Pressure and Temperature Requirements for Hypersonic Facilities
VIBRATIONALEXCITATION REGION
VIBRATIONALEXCITATION REGION
IONIZATIONREGION
IONIZATIONREGION
IDEAL GASIDEAL GAS
DISSOCIATIONREGION
DISSOCIATIONREGION
30,000
15,000
25,000
20,000
10,000
5,000
0
InterceptorVelocity
(feet per sec)
Hypersonic
SupersonicTransonicSubsonic
40,000
20,000
10,000
6,000
4,000
2,000
1,000
600
400
3000 5 2010 2515
Freestream Mach Number
Ionization Region
N Dissociation Region
Vibrational ExcitationRegionTe
mpe
ratu
re (0
K) O Dissociation Region
Ideal Gas Region
Free
strea
mTo
tal T
empe
ratu
re
Maximum Temperature in
Boundary Layer
Temperature Entering Combustor
Temperature After Isentropic Turn
Temperature After First Wedge
Real Gas Effects in Hypervelocity Flight Real-Gas Effects Generated in Scramjet Engines in Hypervelocity Flight
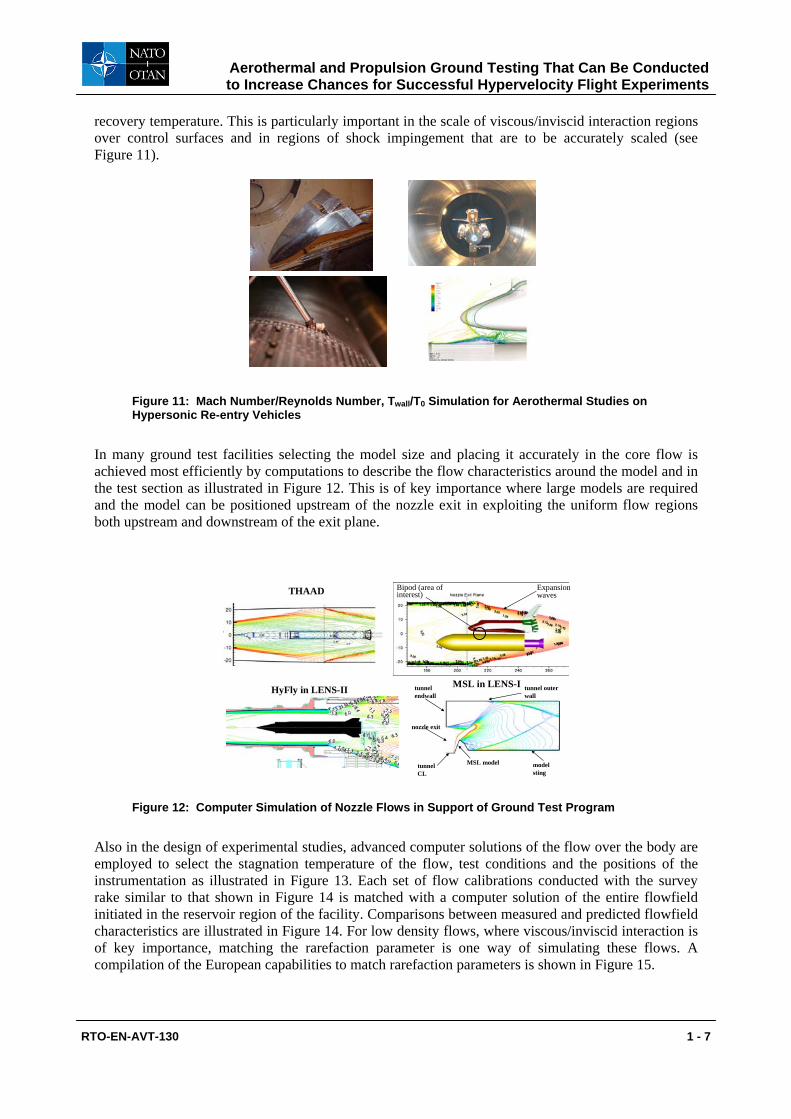
Figure 7: Temperatures Generated in Hypervelocity Flows
Again, as illustrated in Figure 7, the temperatures generated in hypervelocity flows can have a significant effect on scramjet performance and the performance of control and guidance systems for interceptors travelling at velocities above 8,000 ft/s.
Aerothermal and Propulsion Ground Testing That Can Be Conducted to Increase Chances for Successful Hypervelocity Flight Experiments
1 - 4 RTO-EN-AVT-130
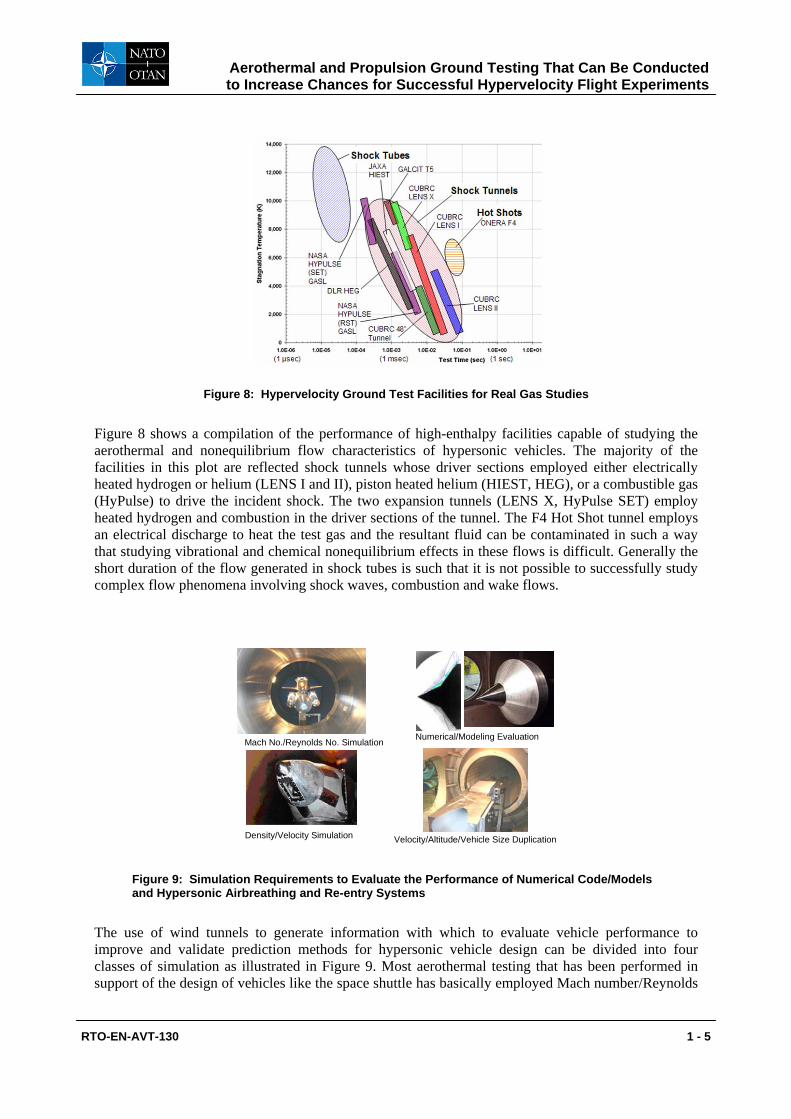
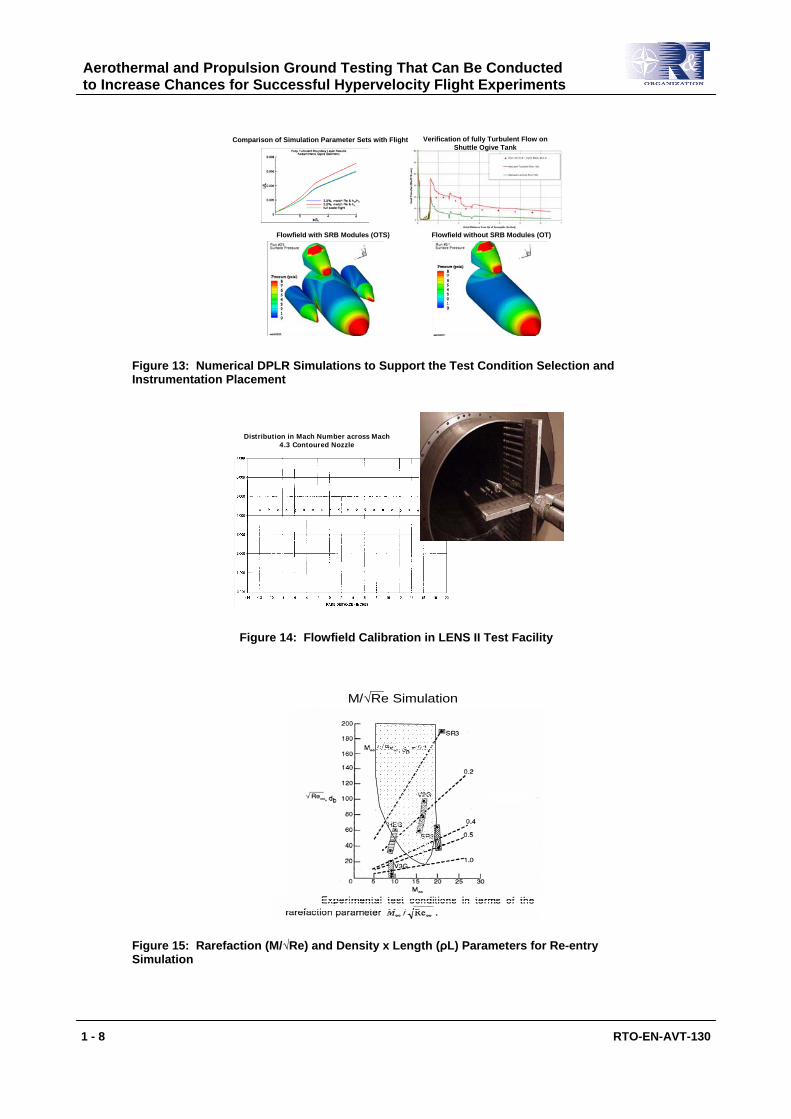
Figure 8: Hypervelocity Ground Test Facilities for Real Gas Studies
Figure 8 shows a compilation of the performance of high-enthalpy facilities capable of studying the aerothermal and nonequilibrium flow characteristics of hypersonic vehicles. The majority of the facilities in this plot are reflected shock tunnels whose driver sections employed either electrically heated hydrogen or helium (LENS I and II), piston heated helium (HIEST, HEG), or a combustible gas (HyPulse) to drive the incident shock. The two expansion tunnels (LENS X, HyPulse SET) employ heated hydrogen and combustion in the driver sections of the tunnel. The F4 Hot Shot tunnel employs an electrical discharge to heat the test gas and the resultant fluid can be contaminated in such a way that studying vibrational and chemical nonequilibrium effects in these flows is difficult. Generally the short duration of the flow generated in shock tubes is such that it is not possible to successfully study complex flow phenomena involving shock waves, combustion and wake flows.
Mach No./Reynolds No. Simulation Numerical/Modeling Evaluation
Density/Velocity Simulation Velocity/Altitude/Vehicle Size Duplication
Figure 9: Simulation Requirements to Evaluate the Performance of Numerical Code/Models and Hypersonic Airbreathing and Re-entry Systems
The use of wind tunnels to generate information with which to evaluate vehicle performance to improve and validate prediction methods for hypersonic vehicle design can be divided into four classes of simulation as illustrated in Figure 9. Most aerothermal testing that has been performed in support of the design of vehicles like the space shuttle has basically employed Mach number/Reynolds
Aerothermal and Propulsion Ground Testing That Can Be Conducted to Increase Chances for Successful Hypervelocity Flight Experiments
RTO-EN-AVT-130 1 - 5

number simulation, testing without duplicating the total temperature of the flow but in some cases matching the wall-to-freestream stagnation temperature ratio. In these tests, the important measurements are pressure and heat transfer distributions, and the major phenomenon which must be replicated is the position of transition on the vehicle thereby ensuring heating levels can be related to those encountered in flight in terms of the appropriate Stanton number and Reynolds number of the flow. Of course, experiments to evaluate the performance of various numerical prediction schemes and the modeling employed in them can be performed in many ways as long as the key mechanisms of interest are correctly handled in the selection of test conditions. There are some tests for which the requirement to match altitude can be loosened to obtain density/velocity simulation. However, again for aerothermal tests, the position of transition on the body must be replicated to accurately obtain the heating loads. Also, in studies of the performance of seekerheads similar to those shown in Figure 9, it is important to replicate the turbulent characteristics of the turbulent boundary/shear layer flow over the window. To accurately evaluate the performance of scramjet-engine powered hypersonic interceptors, it is of key importance to duplicate not only the velocity/altitude conditions but also the size of the vehicle in order to obtain accurate aerothermal loads and vehicle thrust performance.
4.0 MACH NUMBER/REYNOLDS NUMBER SIMULATION AND AEROTHERMAL TESTS FOR SHUTTLE
As discussed above, the majority of tests conducted to evaluate the performance of hypersonic vehicles or to investigate and evaluate prediction methods have employed Mach Number/Reynolds number simulations. Compilations of the Mach Number/Reynolds Number capabilities of large-scale American and European hypersonic ground test facilities are shown in Figure 10. Also shown on this figure is a line drawn at a Reynolds number of 7 million which typically represents the requirement to obtain turbulent flows on models whose dimensions are two foot or larger. Clearly, in the high Mach number regime, there are few tunnels that are capable of generating fully turbulent flows without tripping, and tripping laminar boundary layers at Mach 8 is also difficult because of the large hysteresis effects in these flows.
Figure 10: Mach Number/Reynolds Number Capabilities of American and European Hypersonic Ground Test Facilities
Many of the studies to evaluate the aerothermal performance of NASA and DoD vehicles have been performed to match not only the Mach number/Reynolds number of the flow but to also match the boundary layer to model length characteristics by matching the ratio of the wall temperature to the
Aerothermal and Propulsion Ground Testing That Can Be Conducted to Increase Chances for Successful Hypervelocity Flight Experiments
1 - 6 RTO-EN-AVT-130
recovery temperature. This is particularly important in the scale of viscous/inviscid interaction regions over control surfaces and in regions of shock impingement that are to be accurately scaled (see Figure 11).
Figure 11: Mach Number/Reynolds Number, Twall/T0 Simulation for Aerothermal Studies on Hypersonic Re-entry Vehicles
In many ground test facilities selecting the model size and placing it accurately in the core flow is achieved most efficiently by computations to describe the flow characteristics around the model and in the test section as illustrated in Figure 12. This is of key importance where large models are required and the model can be positioned upstream of the nozzle exit in exploiting the uniform flow regions both upstream and downstream of the exit plane.
Bipod (area of interest)
Expansionwaves
HyFly in LENS-II MSL in LENS-I tunnel outer wall
tunnel CL
model sting
MSL model
tunnel endwall
nozzle exit
THAAD
Figure 12: Computer Simulation of Nozzle Flows in Support of Ground Test Program
Also in the design of experimental studies, advanced computer solutions of the flow over the body are employed to select the stagnation temperature of the flow, test conditions and the positions of the instrumentation as illustrated in Figure 13. Each set of flow calibrations conducted with the survey rake similar to that shown in Figure 14 is matched with a computer solution of the entire flowfield initiated in the reservoir region of the facility. Comparisons between measured and predicted flowfield characteristics are illustrated in Figure 14. For low density flows, where viscous/inviscid interaction is of key importance, matching the rarefaction parameter is one way of simulating these flows. A compilation of the European capabilities to match rarefaction parameters is shown in Figure 15.
Aerothermal and Propulsion Ground Testing That Can Be Conducted to Increase Chances for Successful Hypervelocity Flight Experiments
RTO-EN-AVT-130 1 - 7
Flowfield with SRB Modules (OTS) Flowfield without SRB Modules (OT)
Verification of fully Turbulent Flow on Shuttle Ogive Tank
Comparison of Simulation Parameter Sets with Flight
Figure 13: Numerical DPLR Simulations to Support the Test Condition Selection and Instrumentation Placement
Distribution in Mach Number across Mach 4.3 Contoured Nozzle
Figure 14: Flowfield Calibration in LENS II Test Facility
Figure 15: Rarefaction (M/√Re) and Density x Length (ρL) Parameters for Re-entry Simulation
Aerothermal and Propulsion Ground Testing That Can Be Conducted to Increase Chances for Successful Hypervelocity Flight Experiments
1 - 8 RTO-EN-AVT-130
M/√Re Simulation
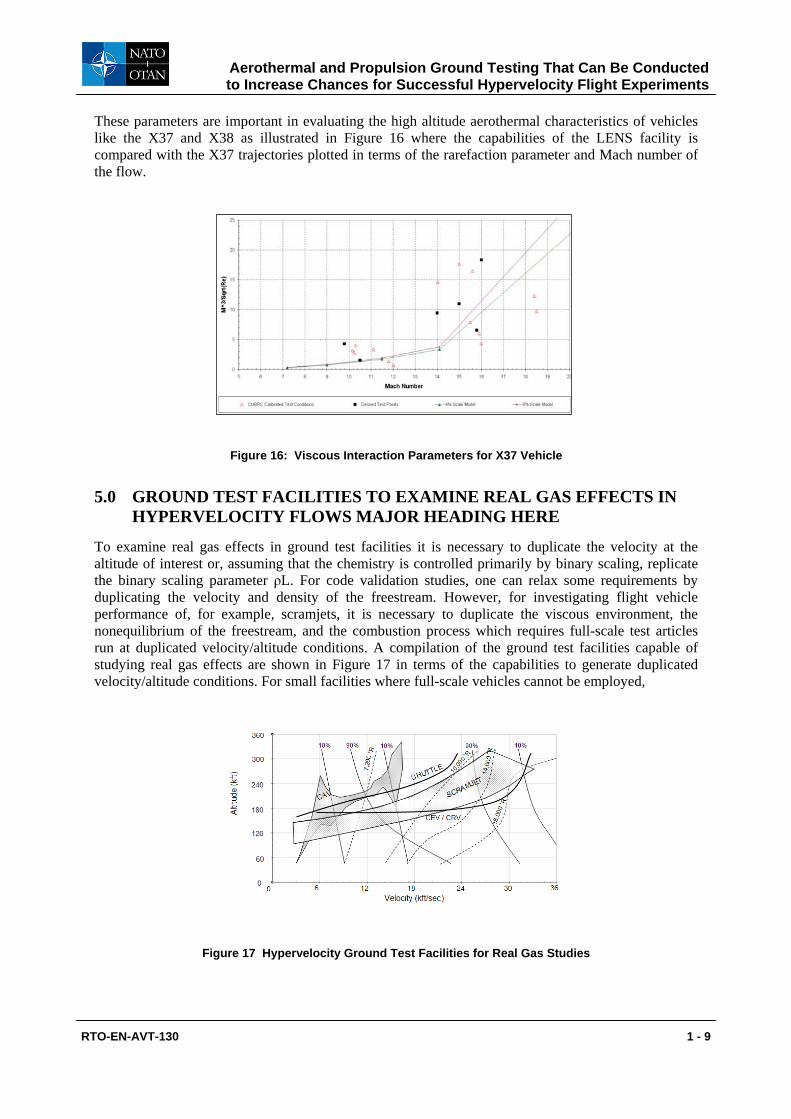
These parameters are important in evaluating the high altitude aerothermal characteristics of vehicles like the X37 and X38 as illustrated in Figure 16 where the capabilities of the LENS facility is compared with the X37 trajectories plotted in terms of the rarefaction parameter and Mach number of the flow.
Figure 16: Viscous Interaction Parameters for X37 Vehicle
5.0 GROUND TEST FACILITIES TO EXAMINE REAL GAS EFFECTS IN HYPERVELOCITY FLOWS MAJOR HEADING HERE
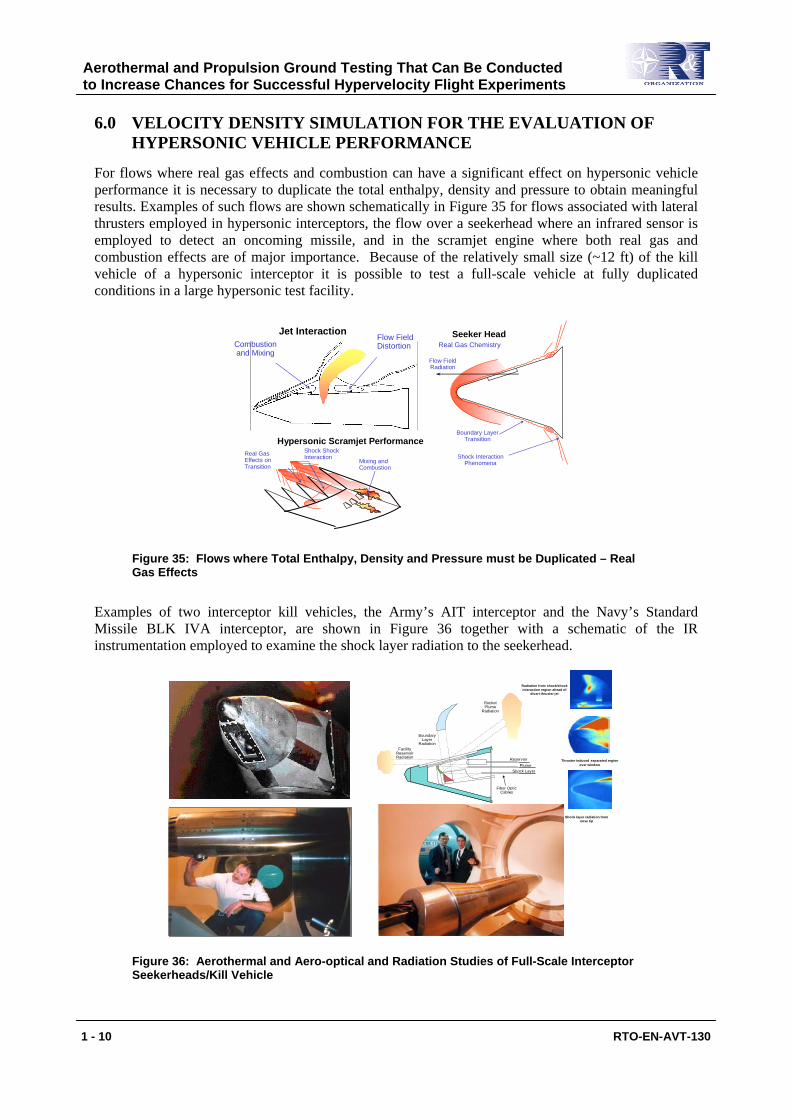
To examine real gas effects in ground test facilities it is necessary to duplicate the velocity at the altitude of interest or, assuming that the chemistry is controlled primarily by binary scaling, replicate the binary scaling parameter ρL. For code validation studies, one can relax some requirements by duplicating the velocity and density of the freestream. However, for investigating flight vehicle performance of, for example, scramjets, it is necessary to duplicate the viscous environment, the nonequilibrium of the freestream, and the combustion process which requires full-scale test articles run at duplicated velocity/altitude conditions. A compilation of the ground test facilities capable of studying real gas effects are shown in Figure 17 in terms of the capabilities to generate duplicated velocity/altitude conditions. For small facilities where full-scale vehicles cannot be employed,
Figure 17 Hypervelocity Ground Test Facilities for Real Gas Studies
Aerothermal and Propulsion Ground Testing That Can Be Conducted to Increase Chances for Successful Hypervelocity Flight Experiments
RTO-EN-AVT-130 1 - 9
6.0 VELOCITY DENSITY SIMULATION FOR THE EVALUATION OF HYPERSONIC VEHICLE PERFORMANCE
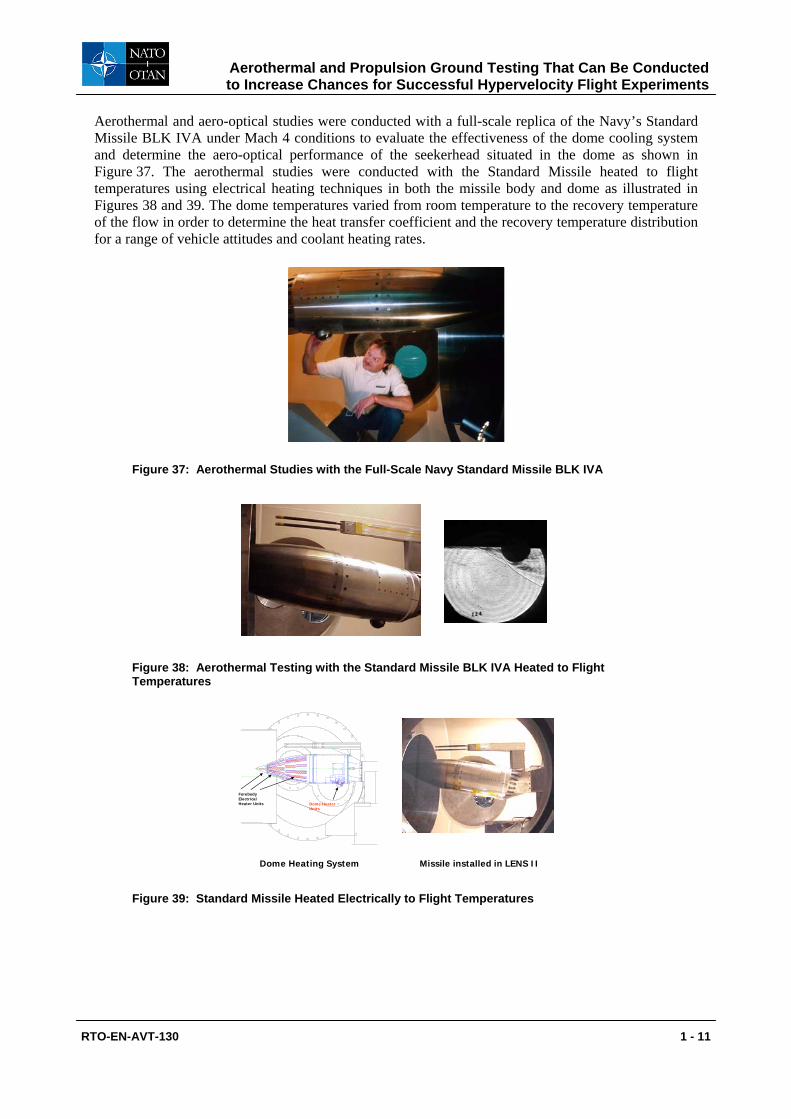
For flows where real gas effects and combustion can have a significant effect on hypersonic vehicle performance it is necessary to duplicate the total enthalpy, density and pressure to obtain meaningful results. Examples of such flows are shown schematically in Figure 35 for flows associated with lateral thrusters employed in hypersonic interceptors, the flow over a seekerhead where an infrared sensor is employed to detect an oncoming missile, and in the scramjet engine where both real gas and combustion effects are of major importance. Because of the relatively small size (~12 ft) of the kill vehicle of a hypersonic interceptor it is possible to test a full-scale vehicle at fully duplicated conditions in a large hypersonic test facility.
Flow Field Distortion
Jet InteractionCombustionand Mixing
Seeker HeadReal Gas Chemistry
Boundary Layer Transition
Shock Interaction Phenomena
Flow Field Radiation
Real Gas Effects on Transition
Hypersonic Scramjet Performance
Mixing and Combustion
Shock Shock Interaction
Figure 35: Flows where Total Enthalpy, Density and Pressure must be Duplicated – Real Gas Effects
Examples of two interceptor kill vehicles, the Army’s AIT interceptor and the Navy’s Standard Missile BLK IVA interceptor, are shown in Figure 36 together with a schematic of the IR instrumentation employed to examine the shock layer radiation to the seekerhead.
Fiber Optic Cables
ReservoirPlume
Shock Layer
Boundary Layer
RadiationFacility
Reservoir Radiation
Rocket Plume
Radiation
Thruster induced separated region over window
Shock layer radiation from nose tip
Radiation from shock/shock interaction region ahead of
divert thruster jet
Figure 36: Aerothermal and Aero-optical and Radiation Studies of Full-Scale Interceptor Seekerheads/Kill Vehicle
Aerothermal and Propulsion Ground Testing That Can Be Conducted to Increase Chances for Successful Hypervelocity Flight Experiments
1 - 10 RTO-EN-AVT-130
Aerothermal and aero-optical studies were conducted with a full-scale replica of the Navy’s Standard Missile BLK IVA under Mach 4 conditions to evaluate the effectiveness of the dome cooling system and determine the aero-optical performance of the seekerhead situated in the dome as shown in Figure 37. The aerothermal studies were conducted with the Standard Missile heated to flight temperatures using electrical heating techniques in both the missile body and dome as illustrated in Figures 38 and 39. The dome temperatures varied from room temperature to the recovery temperature of the flow in order to determine the heat transfer coefficient and the recovery temperature distribution for a range of vehicle attitudes and coolant heating rates.
Figure 37: Aerothermal Studies with the Full-Scale Navy Standard Missile BLK IVA
Figure 38: Aerothermal Testing with the Standard Missile BLK IVA Heated to Flight Temperatures
Missile installed in LENS II
Dome Heater Units
Forebody Electrical Heater Units
Dome Heating System
Figure 39: Standard Missile Heated Electrically to Flight Temperatures
Aerothermal and Propulsion Ground Testing That Can Be Conducted to Increase Chances for Successful Hypervelocity Flight Experiments
RTO-EN-AVT-130 1 - 11
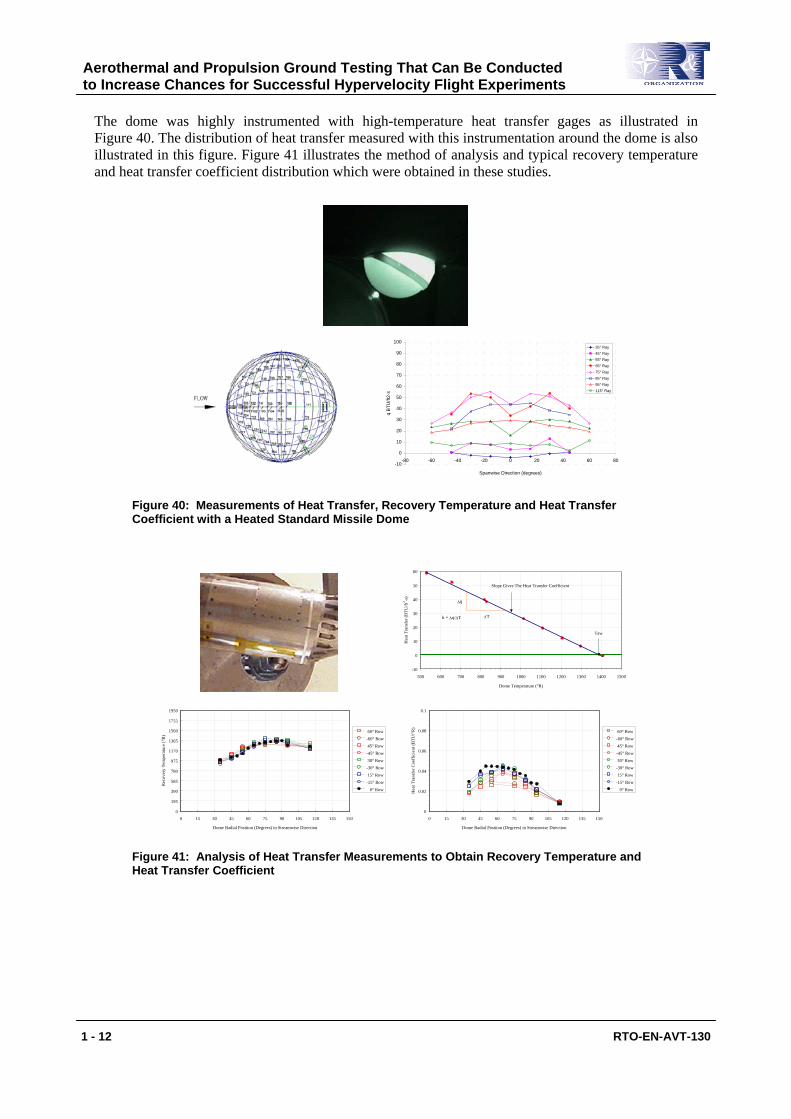
The dome was highly instrumented with high-temperature heat transfer gages as illustrated in Figure 40. The distribution of heat transfer measured with this instrumentation around the dome is also illustrated in this figure. Figure 41 illustrates the method of analysis and typical recovery temperature and heat transfer coefficient distribution which were obtained in these studies.
-10
0
10
20
30
40
50
60
70
80
90
100
-80 -60 -40 -20 0 20 40 60 80
Spanwise Direction (degrees)
q B
TU/ft
2-s
35° Ray45° Ray55° Ray65° Ray75° Ray85° Ray95° Ray115° Ray
Figure 40: Measurements of Heat Transfer, Recovery Temperature and Heat Transfer Coefficient with a Heated Standard Missile Dome
0
0.02
0.04
0.06
0.08
0.1
0 15 30 45 60 75 90 105 120 135 150
Dome Radial Position (Degrees) in Streamwise Direction
Hea
t Tra
nsfe
r Coe
ffic
ient
(BTU
/°R
)
60° Row -60° Row 45° Row -45° Row 30° Row -30° Row 15° Row -15° Row 0° Row
0
195
390
585
780
975
1170
1365
1560
1755
1950
0 15 30 45 60 75 90 105 120 135 150
Dome Radial Position (Degrees) in Streamwise Direction
Rec
over
y Te
mpe
ratu
re (°
R)
60° Row -60° Row 45° Row -45° Row 30° Row -30° Row 15° Row -15° Row 0° Row
-10
0
10
20
30
40
50
60
500 600 700 800 900 1000 1100 1200 1300 1400 1500
Dome Temperature (°R)
Hea
t Tra
nsfe
r (B
TU/ft
2 -s)
Slope Gives The Heat Transfer Coefficient
Taw
∆T
∆q
h = ∆q/∆T
Figure 41: Analysis of Heat Transfer Measurements to Obtain Recovery Temperature and Heat Transfer Coefficient
Aerothermal and Propulsion Ground Testing That Can Be Conducted to Increase Chances for Successful Hypervelocity Flight Experiments
1 - 12 RTO-EN-AVT-130
Most windows on seekerheads of interceptors to be flown at hypersonic velocities employ active cooling and this active cooling system can cause significant aero-optic distortions potentially limiting the performance of the seekerhead. Typically helium is employed as a coolant gas both to match the freestream velocity and because of its low reflective index to minimize the optical distortions. Figure 42 illustrates why it is important to match the total enthalpy/velocity and density to replicate the mixing flow over the windows and hence the aero-optic distortions. If tests are conducted in a low enthalpy facility, both the coolant effectiveness and the aero-optic distortion cannot be evaluated with any accuracy whatsoever.
Low velocity simulation results in
weak mixing –underestimates
cooling requirements and aero-optic
distortion
The correctly matching flight conditions generates velocity differences which give accurate cooling requirements and aero-optic distortion levels
0.6
0.7
0.8
0.9
1.0
0.0 0.5 1.0 1.5 2.0 2.5 3.0 3.5 4.0
RUN 6 0 RUN 10 0 RUN 21 10 RUN 22 10
α
8.05.0275.04.025. )(]2
11[)()())(Re(c
ec
c
c
e
e
c
e
cc Cp
CpMsx −− −
+γ
µµ
ρρ
µµ
λ
0.6
0.7
0.8
0.9
1.0
0.0 0.5 1.0 1.5 2.0 2.5 3.0 3.5 4.0
RUN 6 0 RUN 10 0 RUN 21 10 RUN 22 10
α
8.05.0275.04.025. )(]2
11[)()())(Re(c
ec
c
c
e
e
c
e
cc Cp
CpMsx −− −
+γ
µµ
ρρ
µµ
λ
He3000 ft/sec
LowAero-OpticsDistortion
WeakMixing4000 ft/sec
He3000 ft/sec
HighAero-OpticsDistortion
RapidMixing10,000 ft/sec
BL Thickness Decreases with Wall Temperature
Position of Transition
Separated Region Increases with Increased Wall
Temperature
Boresight Shift and Distortion of Electromagnetic
Signal
Po
Poe
BL Structure Changes with Wall Temperature
Hot Cold
Decreased Cooling Effectiveness with Increased Freestream Velocity
Figure 42: Total Enthalpy and Density must be Duplicated to Replicate Mixing and Aero-Optic Distortion Effects
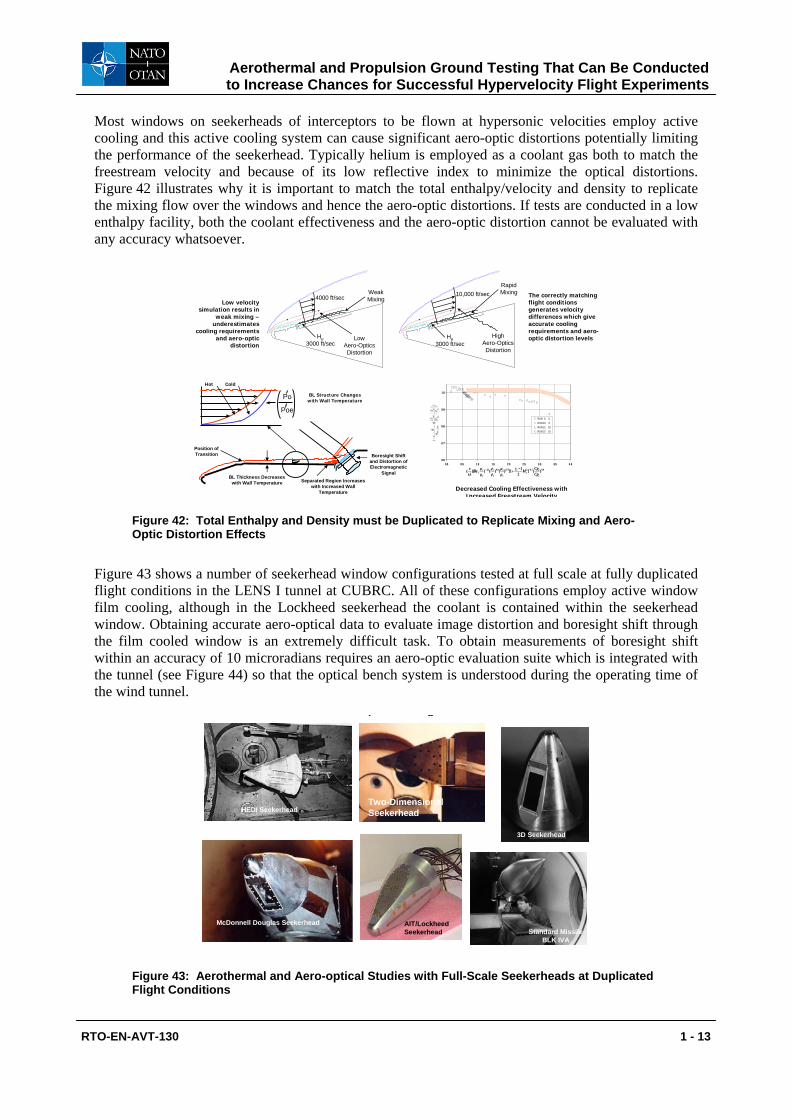
Figure 43 shows a number of seekerhead window configurations tested at full scale at fully duplicated flight conditions in the LENS I tunnel at CUBRC. All of these configurations employ active window film cooling, although in the Lockheed seekerhead the coolant is contained within the seekerhead window. Obtaining accurate aero-optical data to evaluate image distortion and boresight shift through the film cooled window is an extremely difficult task. To obtain measurements of boresight shift within an accuracy of 10 microradians requires an aero-optic evaluation suite which is integrated with the tunnel (see Figure 44) so that the optical bench system is understood during the operating time of the wind tunnel.
Two-Dimensional Seekerhead
3D Seekerhead
AIT/Lockheed Seekerhead
HEDI Seekerhead
McDonnell Douglas SeekerheadStandard Missile
BLK IVA
p g
Figure 43: Aerothermal and Aero-optical Studies with Full-Scale Seekerheads at Duplicated Flight Conditions
Aerothermal and Propulsion Ground Testing That Can Be Conducted to Increase Chances for Successful Hypervelocity Flight Experiments
RTO-EN-AVT-130 1 - 13
Wind Tunnel Internally And Vibrationally Isolated FromModel And Optical Bench Component.
Standard Missile Integrated Into Aero-OpticEvaluation System.
Optical Bench Isolated From Both Inertial AndAerodynamic Loads During Tunnel Operation.
Unique And Validated Suite For Aero-Optic AndRadiation Measurements.
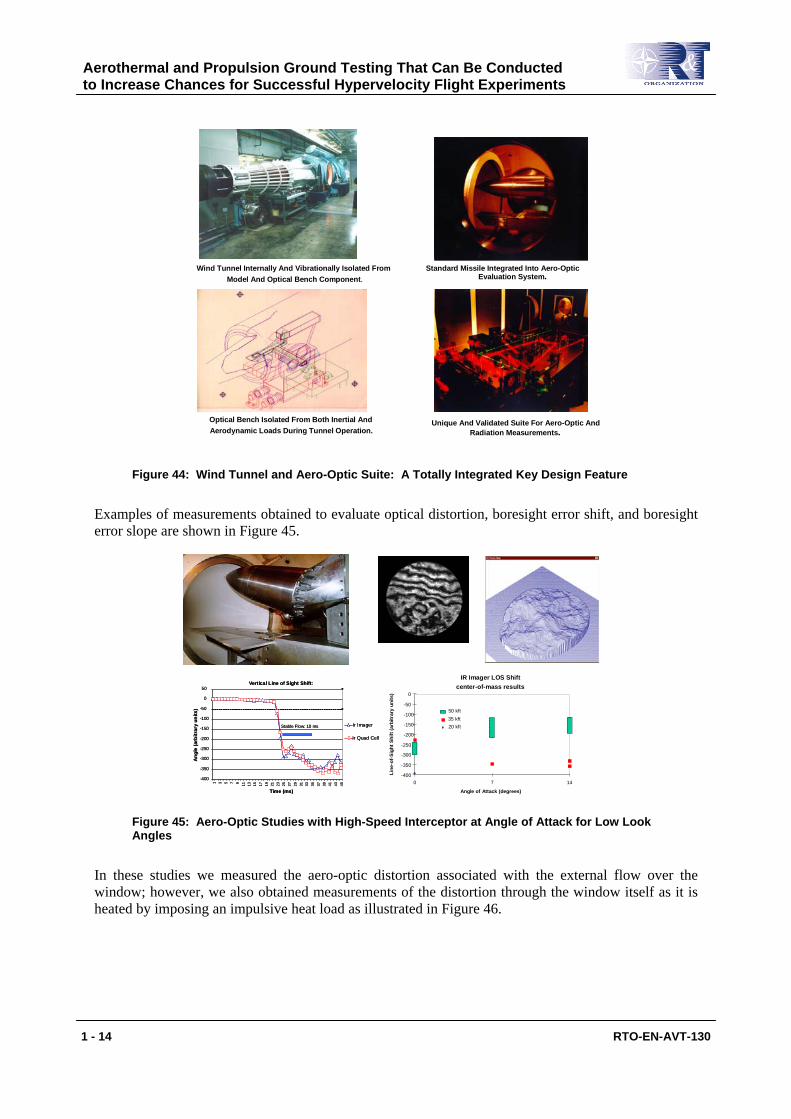
Figure 44: Wind Tunnel and Aero-Optic Suite: A Totally Integrated Key Design Feature
Examples of measurements obtained to evaluate optical distortion, boresight error shift, and boresight error slope are shown in Figure 45.
Vertical Line of Sight Shift:
-400
-350
-300
-250
-200
-150
-100
-50
0
50
1 3 5 7 9 11 13 15 17 19 21 23 25 27 29 31 33 35 37 39 41 43 45
Time (ms)
Ang
le (a
rbitr
ary
units
)
Ir Imager
Ir Quad Cell
Stable Flow: 10 ms
Vertical Line of Sight Shift:
-400
-350
-300
-250
-200
-150
-100
-50
0
50
1 3 5 7 9 11 13 15 17 19 21 23 25 27 29 31 33 35 37 39 41 43 45
Time (ms)
Ang
le (a
rbitr
ary
units
)
Ir Imager
Ir Quad Cell
Stable Flow: 10 ms
IR Imager LOS Shift center-of-mass results
-400
-350
-300
-250
-200
-150
-100
-50
0
0 7 14
Angle of Attack (degrees)
Line
-of-
Sigh
t Shi
ft(a
rbitr
ary
units
)
50 kft35 kft20 kft
IR Imager LOS Shift center-of-mass results
-400
-350
-300
-250
-200
-150
-100
-50
0
0 7 14
Angle of Attack (degrees)
Line
-of-
Sigh
t Shi
ft(a
rbitr
ary
units
)
50 kft35 kft20 kft
Figure 45: Aero-Optic Studies with High-Speed Interceptor at Angle of Attack for Low Look Angles
In these studies we measured the aero-optic distortion associated with the external flow over the window; however, we also obtained measurements of the distortion through the window itself as it is heated by imposing an impulsive heat load as illustrated in Figure 46.
Aerothermal and Propulsion Ground Testing That Can Be Conducted to Increase Chances for Successful Hypervelocity Flight Experiments
1 - 14 RTO-EN-AVT-130
Dome HtgDistributionConv. Heater
Dome heating unit installed for aero-optic distortion generated by dome refractive index changes
Replication of dome heating with convective heater
Image quality degradation resulting from refractive effects Variation of boresight shift with heating time
Visible line-of-sight shift measurementas a function of jet application time
-270
-180
-90
0
90
180
270
0 1 2 3 4 5Time (seconds)
LOS
Arb
itrar
y U
nits
Visible line-of-sight shift measurementas a function of jet application time
-270
-180
-90
0
90
180
270
0 1 2 3 4 5Time (seconds)
LOS
Arb
itrar
y U
nits
Figure 46: Measurements of Aero-Optic Distortion associated with Changes of the Refractive Index of the Heated Dome
These programs were conducted to evaluate seekerhead configurations designed to be operated in the atmosphere; however testing can also be conducted to evaluate seekerhead performance in low density flows associated with exo-interceptors similar to the LEAP configuration shown in Figure 47.
Figure 47: Low Density Studies of the LEAP Seekerhead
These studies were principally oriented toward measuring the heating loads on the seekerhead and validating the DSMC prediction techniques employed in their design. Typical full and subscale models of this configuration are shown in Figure 48.
Quarter-Scale Rake Model
Quarter-Scale Model
Full-Scale Model
Figure 48: Design, Construction and Instrumentation of Seekerhead Models
Aerothermal and Propulsion Ground Testing That Can Be Conducted to Increase Chances for Successful Hypervelocity Flight Experiments
RTO-EN-AVT-130 1 - 15
6.1 Studies of Jet Interaction Phenomena Associated with Divert Thruster Performance
Natural TransitionUnsteadiness onWindow Flows
Larger Separated Region Because of Burning
Upstream Convection of Burning Exhaust gases and Window Flows
Combustion Effectson Steady and
Unsteady PressureLoads Induced by
Jet Interaction
Fiber Optic Cables
ReservoirPlume
Shock Layer
Boundary Layer
RadiationFacility Reservoir Radiation
Rocket Plume
Radiation
Shock layer radiation from nose tip
Radiation from divert thruster shock
interaction
Jet Shock
Shock-Shock Interaction Free Shear Layer
Combined Nosetip& Separation Shock
Transitional Free Shear Layer
Figure 49: Aerothermal and Radiation Studies of Divert Thruster Performance with Duplicated Vehicle and Solid Propellant Rocket Motor
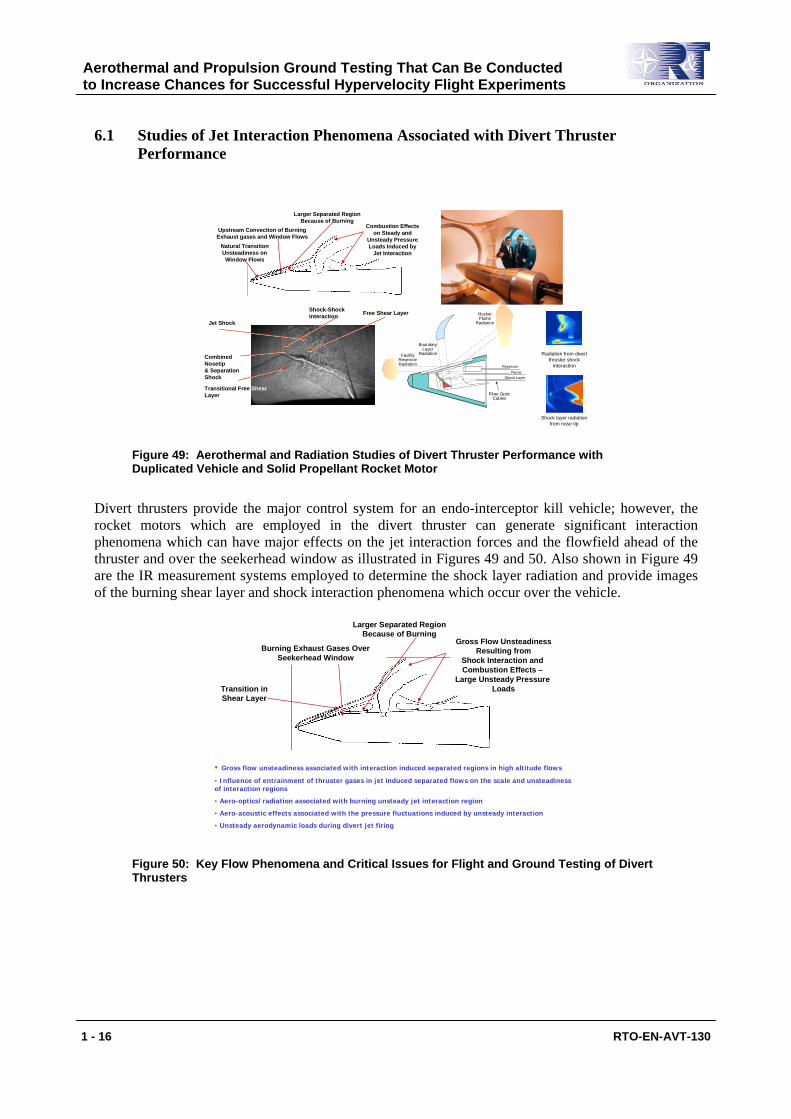
Divert thrusters provide the major control system for an endo-interceptor kill vehicle; however, the rocket motors which are employed in the divert thruster can generate significant interaction phenomena which can have major effects on the jet interaction forces and the flowfield ahead of the thruster and over the seekerhead window as illustrated in Figures 49 and 50. Also shown in Figure 49 are the IR measurement systems employed to determine the shock layer radiation and provide images of the burning shear layer and shock interaction phenomena which occur over the vehicle.
Transition in Shear Layer
Larger Separated Region Because of Burning
Burning Exhaust Gases Over Seekerhead Window
Gross Flow UnsteadinessResulting from
Shock Interaction and Combustion Effects –
Large Unsteady Pressure Loads
• Gross flow unsteadiness associated with interaction induced separated regions in high altitude flows
• Influence of entrainment of thruster gases in jet induced separated flows on the scale and unsteadiness of interaction regions
• Aero-optics/radiation associated with burning unsteady jet interaction region
• Aero-acoustic effects associated with the pressure fluctuations induced by unsteady interaction
• Unsteady aerodynamic loads during divert jet firing
Figure 50: Key Flow Phenomena and Critical Issues for Flight and Ground Testing of Divert Thrusters
Aerothermal and Propulsion Ground Testing That Can Be Conducted to Increase Chances for Successful Hypervelocity Flight Experiments
1 - 16 RTO-EN-AVT-130
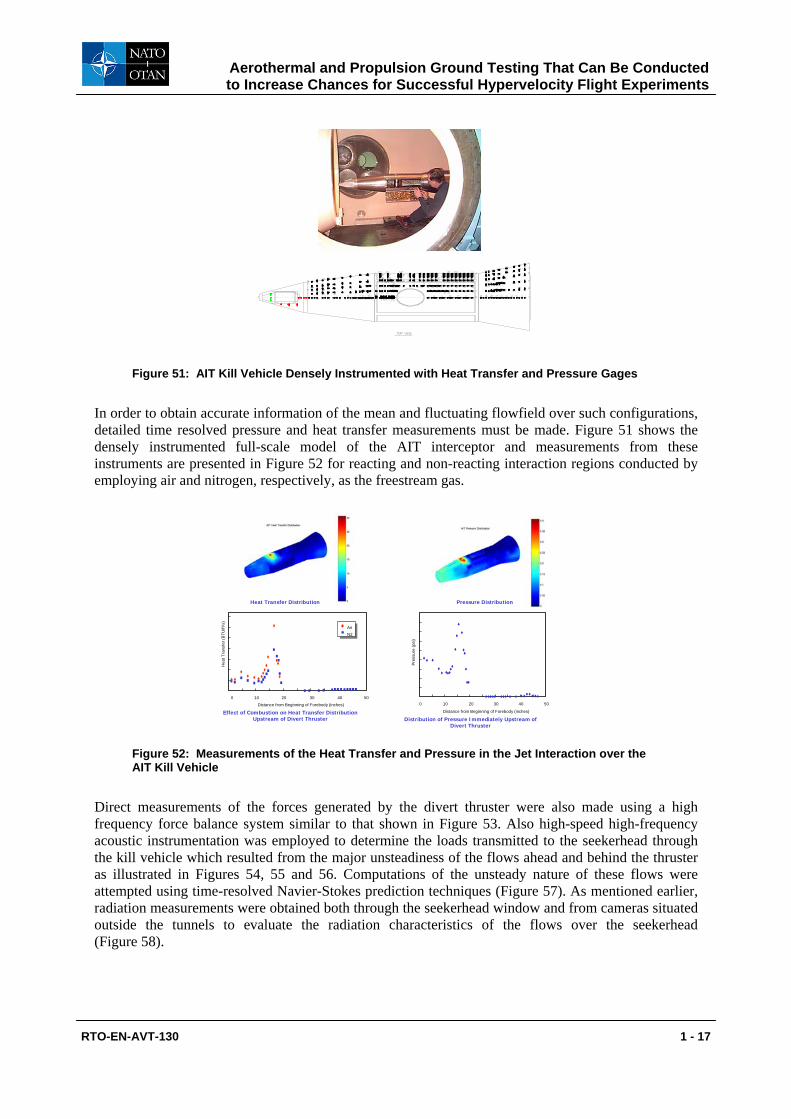
Figure 51: AIT Kill Vehicle Densely Instrumented with Heat Transfer and Pressure Gages
In order to obtain accurate information of the mean and fluctuating flowfield over such configurations, detailed time resolved pressure and heat transfer measurements must be made. Figure 51 shows the densely instrumented full-scale model of the AIT interceptor and measurements from these instruments are presented in Figure 52 for reacting and non-reacting interaction regions conducted by employing air and nitrogen, respectively, as the freestream gas.
0 10 20 30 40 50
Distance from Beginning of Forebody (inches)
Hea
t Tra
nsfe
r (BT
U/ft
2 s)
AirN2
0 10 20 30 40 50
Distance from Beginning of Forebody (inches)
Pres
sure
(psi
)
Pressure DistributionHeat Transfer Distribution
Effect of Combustion on Heat Transfer Distribution Upstream of Divert Thruster Distribution of Pressure Immediately Upstream of
Divert Thruster
Figure 52: Measurements of the Heat Transfer and Pressure in the Jet Interaction over the AIT Kill Vehicle
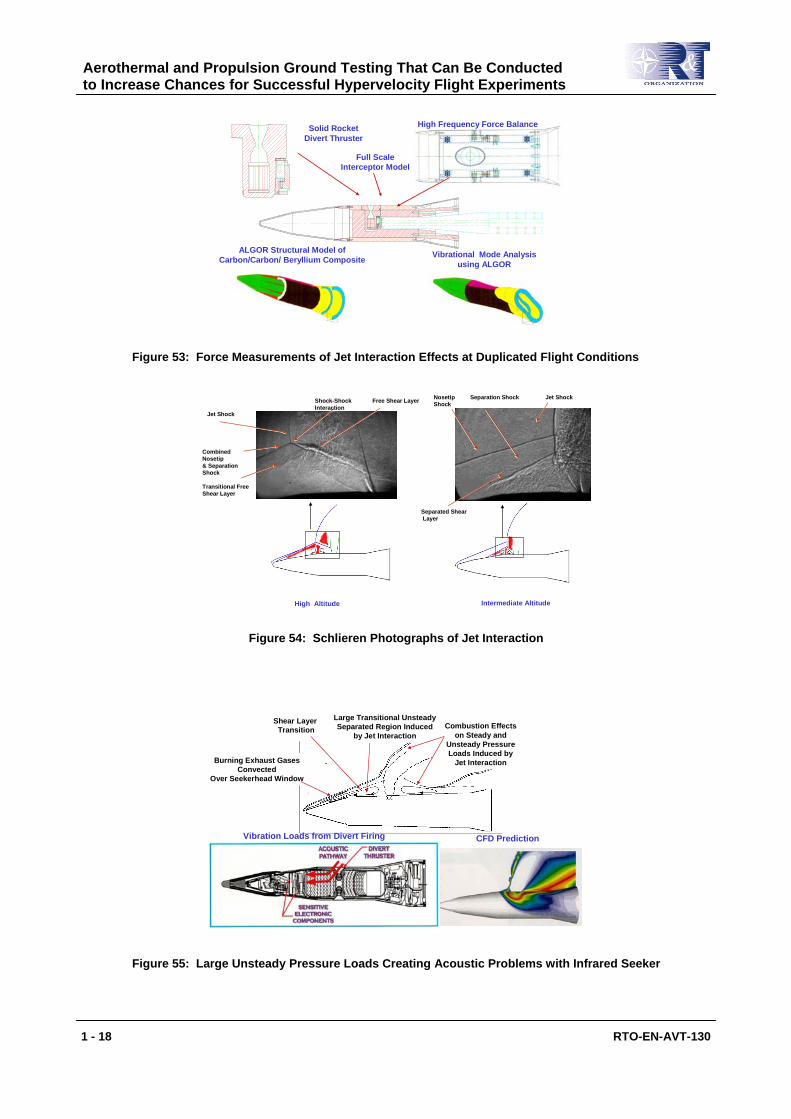
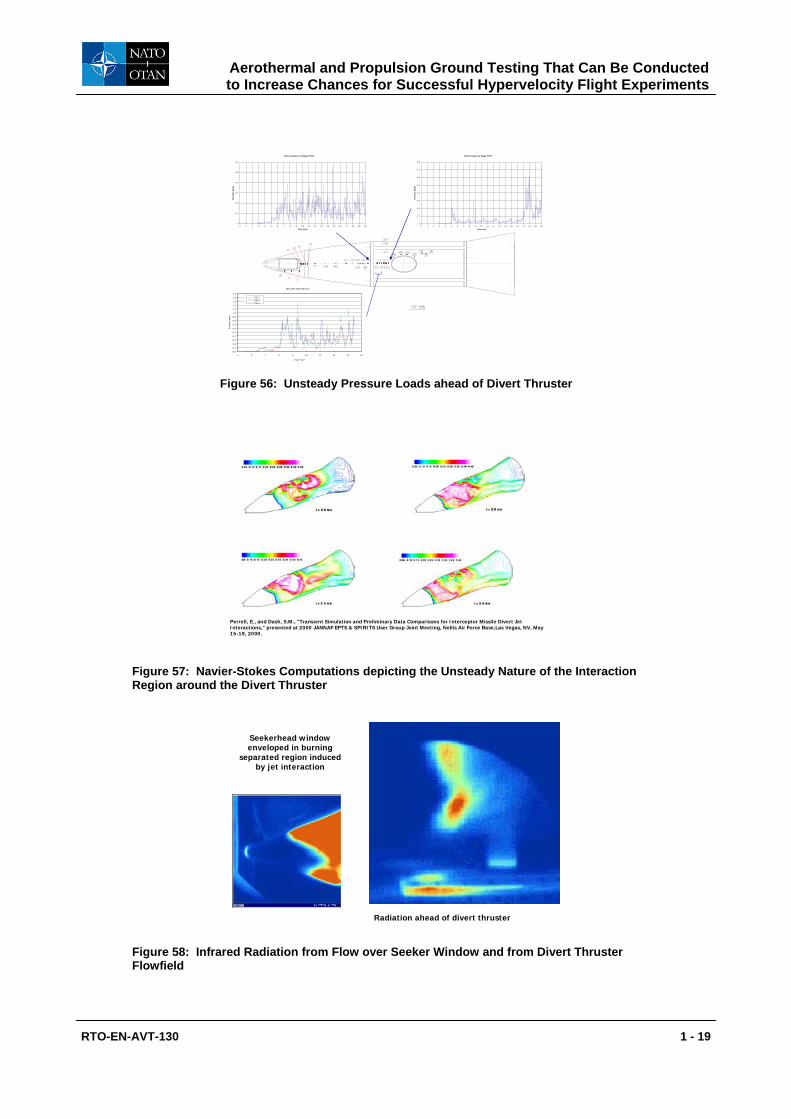
Direct measurements of the forces generated by the divert thruster were also made using a high frequency force balance system similar to that shown in Figure 53. Also high-speed high-frequency acoustic instrumentation was employed to determine the loads transmitted to the seekerhead through the kill vehicle which resulted from the major unsteadiness of the flows ahead and behind the thruster as illustrated in Figures 54, 55 and 56. Computations of the unsteady nature of these flows were attempted using time-resolved Navier-Stokes prediction techniques (Figure 57). As mentioned earlier, radiation measurements were obtained both through the seekerhead window and from cameras situated outside the tunnels to evaluate the radiation characteristics of the flows over the seekerhead (Figure 58).
Aerothermal and Propulsion Ground Testing That Can Be Conducted to Increase Chances for Successful Hypervelocity Flight Experiments
RTO-EN-AVT-130 1 - 17
Solid Rocket Divert Thruster
ALGOR Structural Model of Carbon/Carbon/ Beryllium Composite Vibrational Mode Analysis
using ALGOR
High Frequency Force Balance
Full Scale Interceptor Model
Figure 53: Force Measurements of Jet Interaction Effects at Duplicated Flight Conditions
Jet ShockNosetip Shock
Separation Shock
Separated ShearLayer
Intermediate Altitude
Jet Shock
Shock-Shock Interaction
Free Shear Layer
Combined Nosetip& Separation Shock
Transitional Free Shear Layer
High Altitude
Figure 54: Schlieren Photographs of Jet Interaction
Shear Layer Transition
Large Transitional Unsteady Separated Region Induced
by Jet Interaction
Burning Exhaust Gases Convected
Over Seekerhead Window
Combustion Effectson Steady and
Unsteady PressureLoads Induced by
Jet Interaction
CFD PredictionVibration Loads from Divert Firing
Figure 55: Large Unsteady Pressure Loads Creating Acoustic Problems with Infrared Seeker
Aerothermal and Propulsion Ground Testing That Can Be Conducted to Increase Chances for Successful Hypervelocity Flight Experiments
1 - 18 RTO-EN-AVT-130
Time History of Gage P217
0
0.1
0.2
0.3
0.4
0.5
0.6
0.7
0.8
0 1 2 3 4 5 6 7 8 9 10 11 12 13 14 15 16 17 18 19 20
Tme (ms)
Pres
sure
(psi
a)
Time History of Gage P227
0
0.1
0.2
0.3
0.4
0.5
0.6
0 1 2 3 4 5 6 7 8 9 10 11 12 13 14 15 16 17 18 19 20
Tme (ms)Pr
essu
re (p
sia)
Run 468 Time History
0.0
0.1
0.2
0.3
0.4
0.5
0.6
0.7
0.8
0.9
1.0
1.1
1.2
1.3
1.4
1.5
5 6 7 8 9 10 11 12 13 14
Time (ms)
Pres
sure
(psi
a)
P213 P212 P44
Figure 56: Unsteady Pressure Loads ahead of Divert Thruster
Perrell, E., and Dash, S.M., "Transient Simulation and Preliminary Data Comparisons for Interceptor Missile Divert Jet Interactions," presented at 2000 JANNAF EPTS & SPIRITS User Group Joint Meeting, Nellis Air Force Base,Las Vegas, NV, May 15-19, 2000.
Figure 57: Navier-Stokes Computations depicting the Unsteady Nature of the Interaction Region around the Divert Thruster
Seekerhead window enveloped in burning
separated region induced by jet interaction
Radiation ahead of divert thruster
Figure 58: Infrared Radiation from Flow over Seeker Window and from Divert Thruster Flowfield
Aerothermal and Propulsion Ground Testing That Can Be Conducted to Increase Chances for Successful Hypervelocity Flight Experiments
RTO-EN-AVT-130 1 - 19
7.0 VELOCITY/ALTITUDE SIMULATION AND SCRAMJET ENGINE TESTING
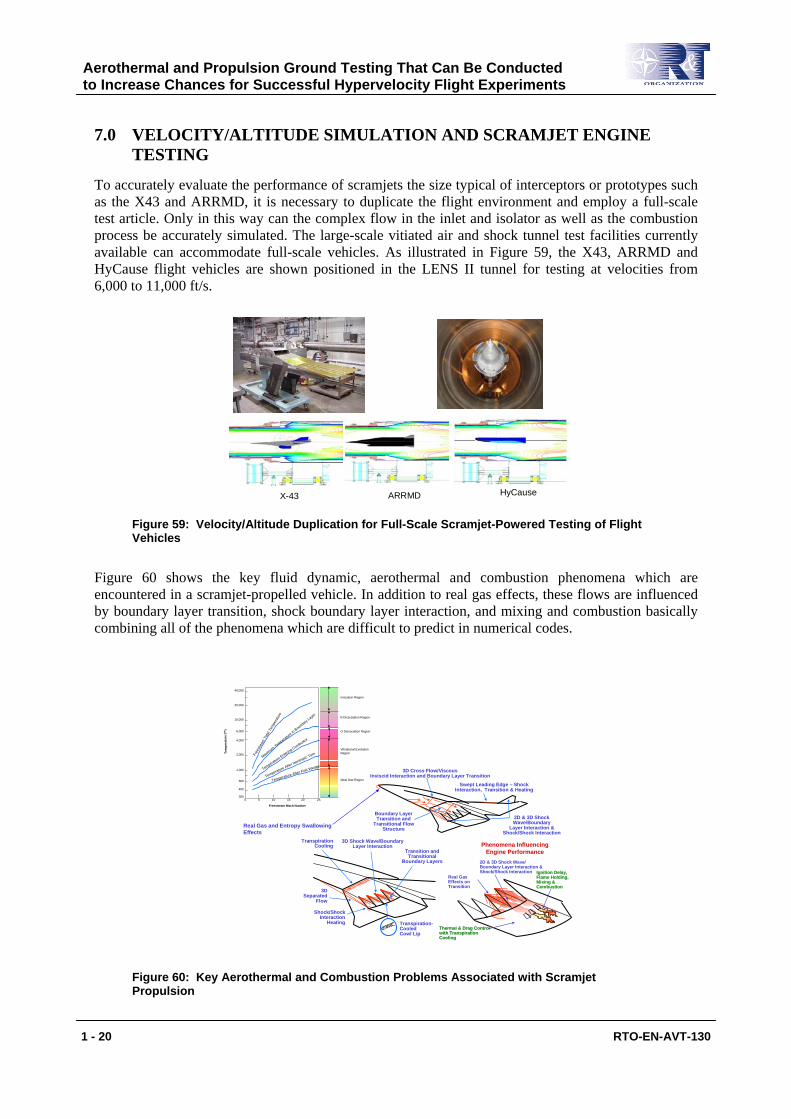
To accurately evaluate the performance of scramjets the size typical of interceptors or prototypes such as the X43 and ARRMD, it is necessary to duplicate the flight environment and employ a full-scale test article. Only in this way can the complex flow in the inlet and isolator as well as the combustion process be accurately simulated. The large-scale vitiated air and shock tunnel test facilities currently available can accommodate full-scale vehicles. As illustrated in Figure 59, the X43, ARRMD and HyCause flight vehicles are shown positioned in the LENS II tunnel for testing at velocities from 6,000 to 11,000 ft/s.
HyCauseX-43 ARRMD
Figure 59: Velocity/Altitude Duplication for Full-Scale Scramjet-Powered Testing of Flight Vehicles
Figure 60 shows the key fluid dynamic, aerothermal and combustion phenomena which are encountered in a scramjet-propelled vehicle. In addition to real gas effects, these flows are influenced by boundary layer transition, shock boundary layer interaction, and mixing and combustion basically combining all of the phenomena which are difficult to predict in numerical codes.
40,000
20,000
10,000
6,000
4,000
2,000
1,000
600
400
3000 5 2010 2515
Freestream Mach Number
Ionization Region
N Dissociation Region
Vibrational ExcitationRegionTe
mpe
ratu
re (0
K) O Dissociation Region
Ideal Gas Region
Free
strea
mTo
tal T
empe
ratu
re
Maximum Temperature in
Boundary
Layer
Temperature Entering Combustor
Temperature After Isentropic Turn
Temperature After First Wedge
Phenomena Influencing Engine Performance
TranspirationCooling
3D Shock Wave/BoundaryLayer Interaction
Transition and Transitional
Boundary Layers
3D Separated
Flow
Shock/ShockInteraction
Heating Transpiration-CooledCowl Lip
3D Cross Flow/ViscousInviscid Interaction and Boundary Layer Transition
Boundary Layer Transition and
Transitional Flow Structure
2D & 3D Shock Wave/Boundary
Layer Interaction & Shock/Shock Interaction
Swept Leading Edge – Shock Interaction, Transition & Heating
Real Gas Effects on Transition
Thermal & Drag Control Thermal & Drag Control with Transpiration with Transpiration CoolingCooling
2D & 3D Shock Wave/ Boundary Layer Interaction & Shock/Shock Interaction Ignition Delay, Ignition Delay,
Flame Holding, Flame Holding, Mixing & Mixing & CombustionCombustion
Real Gas and Entropy Swallowing Effects
Key Aerothermal and Combustion Problems Associated with Scramjet Propulsion
Figure 60: Key Aerothermal and Combustion Problems Associated with Scramjet Propulsion
Aerothermal and Propulsion Ground Testing That Can Be Conducted to Increase Chances for Successful Hypervelocity Flight Experiments
1 - 20 RTO-EN-AVT-130
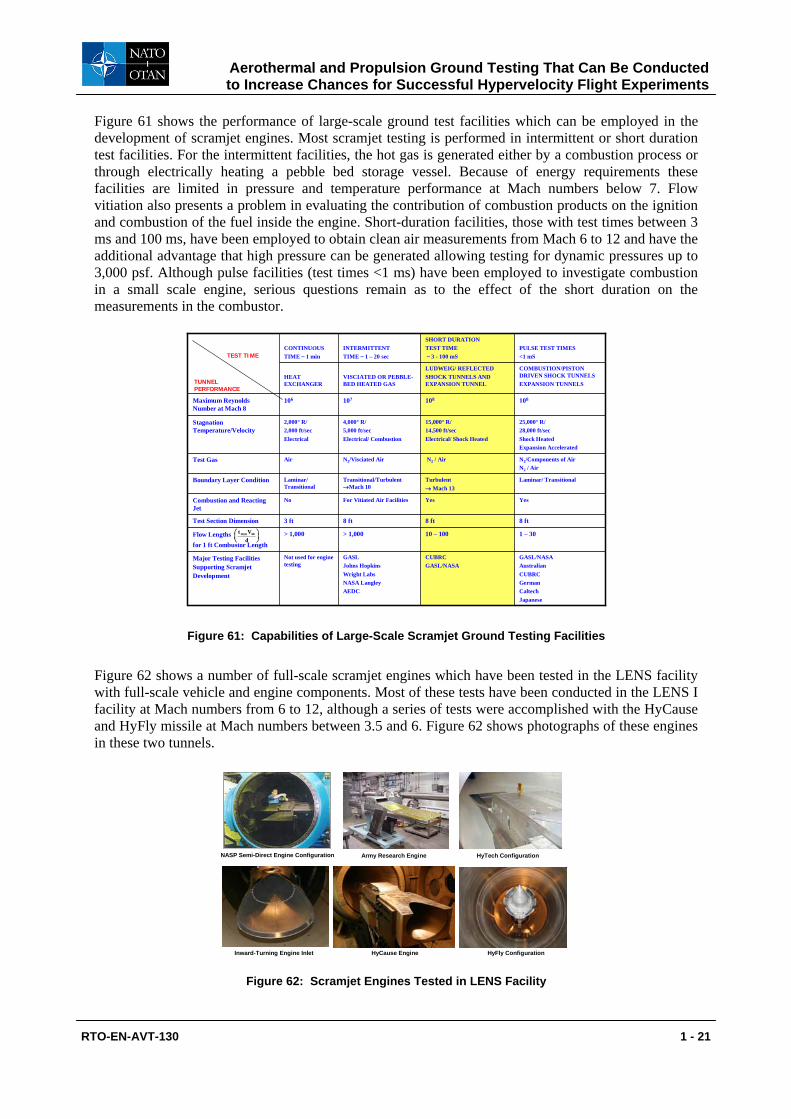
Figure 61 shows the performance of large-scale ground test facilities which can be employed in the development of scramjet engines. Most scramjet testing is performed in intermittent or short duration test facilities. For the intermittent facilities, the hot gas is generated either by a combustion process or through electrically heating a pebble bed storage vessel. Because of energy requirements these facilities are limited in pressure and temperature performance at Mach numbers below 7. Flow vitiation also presents a problem in evaluating the contribution of combustion products on the ignition and combustion of the fuel inside the engine. Short-duration facilities, those with test times between 3 ms and 100 ms, have been employed to obtain clean air measurements from Mach 6 to 12 and have the additional advantage that high pressure can be generated allowing testing for dynamic pressures up to 3,000 psf. Although pulse facilities (test times <1 ms) have been employed to investigate combustion in a small scale engine, serious questions remain as to the effect of the short duration on the measurements in the combustor.
GASL/NASAAustralianCUBRCGermanCaltechJapanese
CUBRCGASL/NASA
GASLJohns HopkinsWright LabsNASA LangleyAEDC
Not used for engine testing
Major Testing Facilities Supporting Scramjet Development
1 – 3010 – 100> 1,000> 1,000Flow Lengths for 1 ft Combustor Length
8 ft8 ft8 ft3 ftTest Section Dimension
YesYesFor Vitiated Air FacilitiesNoCombustion and Reacting Jet
Laminar/ TransitionalTurbulent→ Mach 13
Transitional/Turbulent →Mach 10
Laminar/ Transitional
Boundary Layer Condition
N2/Components of AirN2 / Air
N2 / AirN2/Visciated AirAirTest Gas
25,000° R/28,000 ft/secShock HeatedExpansion Accelerated
15,000° R/14,500 ft/secElectrical/ Shock Heated
4,000° R/ 5,000 ft/secElectrical/ Combustion
2,000° R/2,000 ft/secElectrical
Stagnation Temperature/Velocity
108108107106Maximum Reynolds Number at Mach 8
COMBUSTION/PISTON DRIVEN SHOCK TUNNELSEXPANSION TUNNELS
LUDWEIG/ REFLECTEDSHOCK TUNNELS AND EXPANSION TUNNEL
VISCIATED OR PEBBLE-BED HEATED GAS
HEAT EXCHANGER
PULSE TEST TIMES<1 mS
SHORT DURATIONTEST TIME~ 3 - 100 mS
INTERMITTENTTIME ~ 1 – 20 sec
CONTINUOUSTIME ~ 1 min
t Vd
run ∞
TEST TIME
TUNNELPERFORMANCE
Figure 61: Capabilities of Large-Scale Scramjet Ground Testing Facilities
Figure 62 shows a number of full-scale scramjet engines which have been tested in the LENS facility with full-scale vehicle and engine components. Most of these tests have been conducted in the LENS I facility at Mach numbers from 6 to 12, although a series of tests were accomplished with the HyCause and HyFly missile at Mach numbers between 3.5 and 6. Figure 62 shows photographs of these engines in these two tunnels.
NASP Semi-Direct Engine Configuration Army Research Engine HyTech Configuration
HyFly ConfigurationHyCause EngineInward-Turning Engine Inlet
Figure 62: Scramjet Engines Tested in LENS Facility
Aerothermal and Propulsion Ground Testing That Can Be Conducted to Increase Chances for Successful Hypervelocity Flight Experiments
RTO-EN-AVT-130 1 - 21
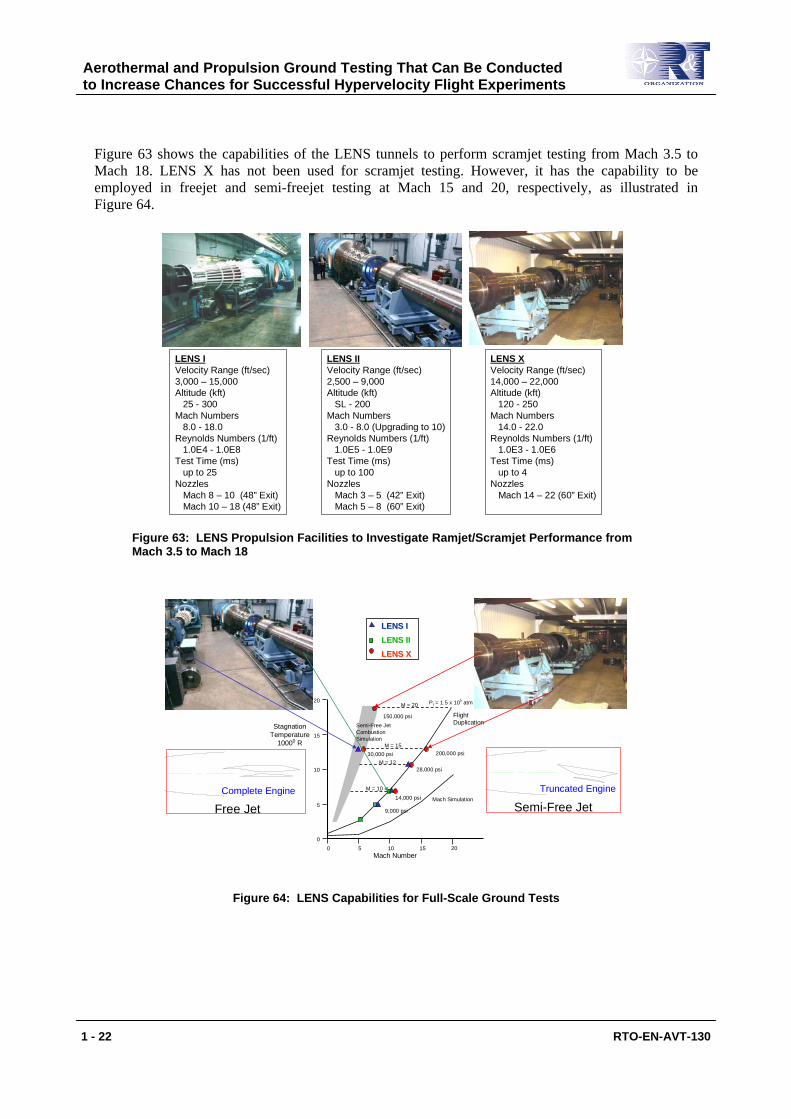
Figure 63 shows the capabilities of the LENS tunnels to perform scramjet testing from Mach 3.5 to Mach 18. LENS X has not been used for scramjet testing. However, it has the capability to be employed in freejet and semi-freejet testing at Mach 15 and 20, respectively, as illustrated in Figure 64.
LENS IIVelocity Range (ft/sec)2,500 – 9,000Altitude (kft)
SL - 200Mach Numbers
3.0 - 8.0 (Upgrading to 10)Reynolds Numbers (1/ft)
1.0E5 - 1.0E9 Test Time (ms)
up to 100Nozzles
Mach 3 – 5 (42” Exit)Mach 5 – 8 (60” Exit)
LENS XVelocity Range (ft/sec)14,000 – 22,000Altitude (kft)
120 - 250Mach Numbers
14.0 - 22.0Reynolds Numbers (1/ft)
1.0E3 - 1.0E6 Test Time (ms)
up to 4Nozzles
Mach 14 – 22 (60” Exit)
LENS IVelocity Range (ft/sec)3,000 – 15,000Altitude (kft)
25 - 300Mach Numbers
8.0 - 18.0Reynolds Numbers (1/ft)
1.0E4 - 1.0E8 Test Time (ms)
up to 25Nozzles
Mach 8 – 10 (48” Exit)Mach 10 – 18 (48” Exit)
Figure 63: LENS Propulsion Facilities to Investigate Ramjet/Scramjet Performance from Mach 3.5 to Mach 18
Mach Number0
05 10 15 20
5
10
15
20
Mach Simulation
200,000 psi
Pt = 1.5 x 10⁵ atm
M = 10
14,000 psi
30,000 psiM = 15
FlightDuplication
M = 20
150,000 psi
28,000 psi
Semi-Free JetCombustionSimulation
StagnationTemperature
10000 R
LENS ILENS ILENS IILENS IILENS XLENS X
M = 12
9,000 psiFree JetComplete Engine
Semi-Free JetTruncated Engine
Figure 64: LENS Capabilities for Full-Scale Ground Tests
Aerothermal and Propulsion Ground Testing That Can Be Conducted to Increase Chances for Successful Hypervelocity Flight Experiments
1 - 22 RTO-EN-AVT-130
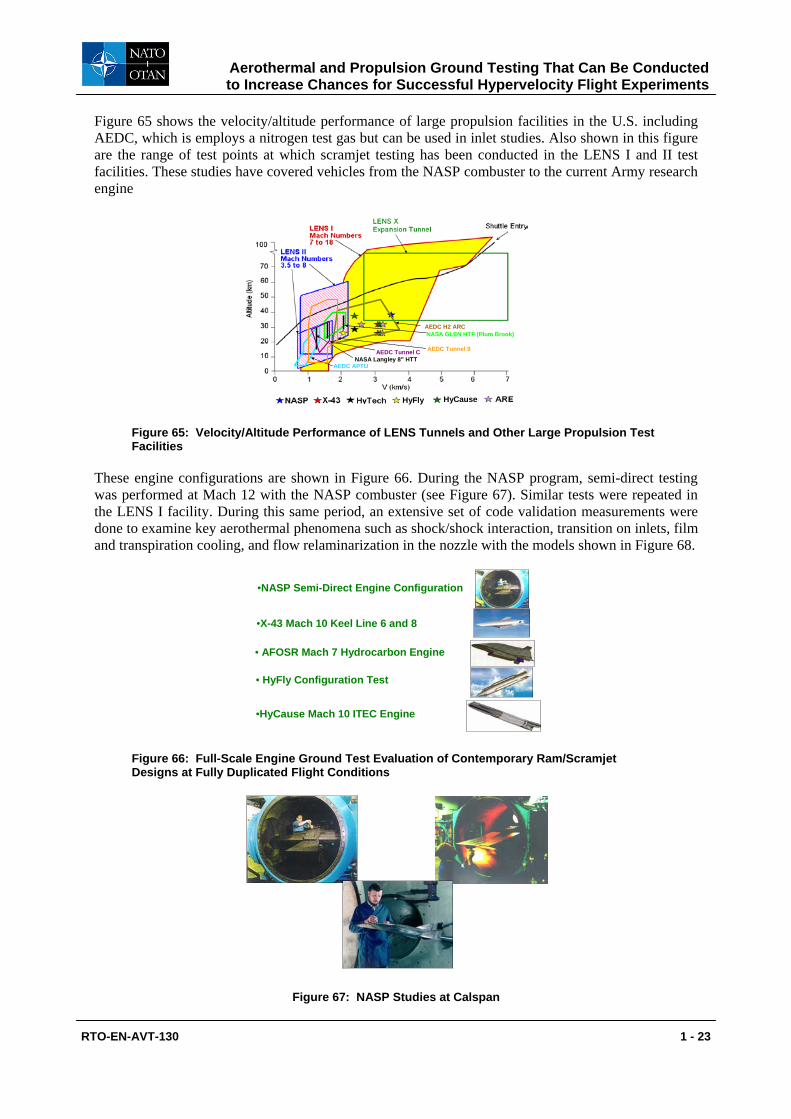
Figure 65 shows the velocity/altitude performance of large propulsion facilities in the U.S. including AEDC, which is employs a nitrogen test gas but can be used in inlet studies. Also shown in this figure are the range of test points at which scramjet testing has been conducted in the LENS I and II test facilities. These studies have covered vehicles from the NASP combuster to the current Army research engine
AEDC APTUNASA Langley 8” HTT
NASA GLEN HTF (Plum Brook)
AEDC Tunnel C AEDC Tunnel 9
AEDC H2 ARC
HyFly HyCause
Figure 65: Velocity/Altitude Performance of LENS Tunnels and Other Large Propulsion Test Facilities
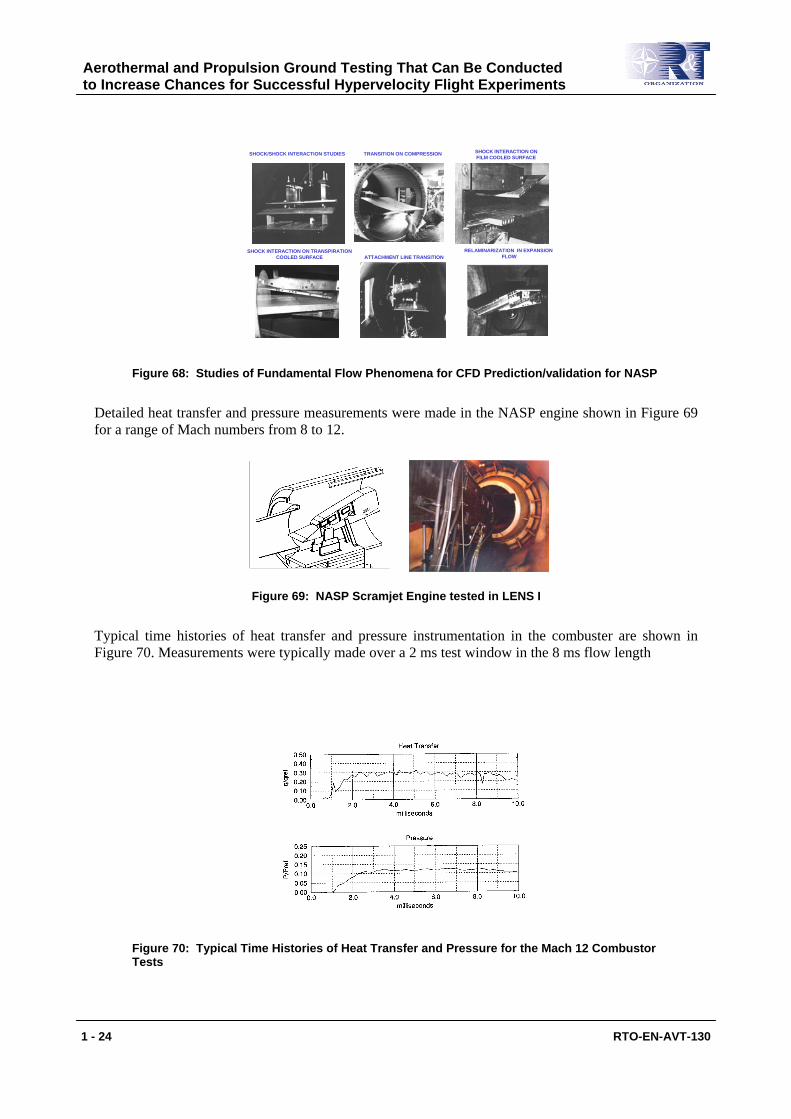
These engine configurations are shown in Figure 66. During the NASP program, semi-direct testing was performed at Mach 12 with the NASP combuster (see Figure 67). Similar tests were repeated in the LENS I facility. During this same period, an extensive set of code validation measurements were done to examine key aerothermal phenomena such as shock/shock interaction, transition on inlets, film and transpiration cooling, and flow relaminarization in the nozzle with the models shown in Figure 68.
•NASP Semi-Direct Engine Configuration
•X-43 Mach 10 Keel Line 6 and 8
• AFOSR Mach 7 Hydrocarbon Engine
• HyFly Configuration Test
•HyCause Mach 10 ITEC Engine
Figure 66: Full-Scale Engine Ground Test Evaluation of Contemporary Ram/Scramjet Designs at Fully Duplicated Flight Conditions
Figure 67: NASP Studies at Calspan
Aerothermal and Propulsion Ground Testing That Can Be Conducted to Increase Chances for Successful Hypervelocity Flight Experiments
RTO-EN-AVT-130 1 - 23
SHOCK INTERACTION ON TRANSPIRATIONCOOLED SURFACE
-
TRANSITION ON COMPRESSION
ATTACHMENT LINE TRANSITION
-
SHOCK/SHOCK INTERACTION STUDIES
RELAMINARIZATION IN EXPANSIONFLOW
SHOCK INTERACTION ONFILM COOLED SURFACE
Figure 68: Studies of Fundamental Flow Phenomena for CFD Prediction/validation for NASP
Detailed heat transfer and pressure measurements were made in the NASP engine shown in Figure 69 for a range of Mach numbers from 8 to 12.
Figure 69: NASP Scramjet Engine tested in LENS I
Typical time histories of heat transfer and pressure instrumentation in the combuster are shown in Figure 70. Measurements were typically made over a 2 ms test window in the 8 ms flow length
Figure 70: Typical Time Histories of Heat Transfer and Pressure for the Mach 12 Combustor Tests
Aerothermal and Propulsion Ground Testing That Can Be Conducted to Increase Chances for Successful Hypervelocity Flight Experiments
1 - 24 RTO-EN-AVT-130
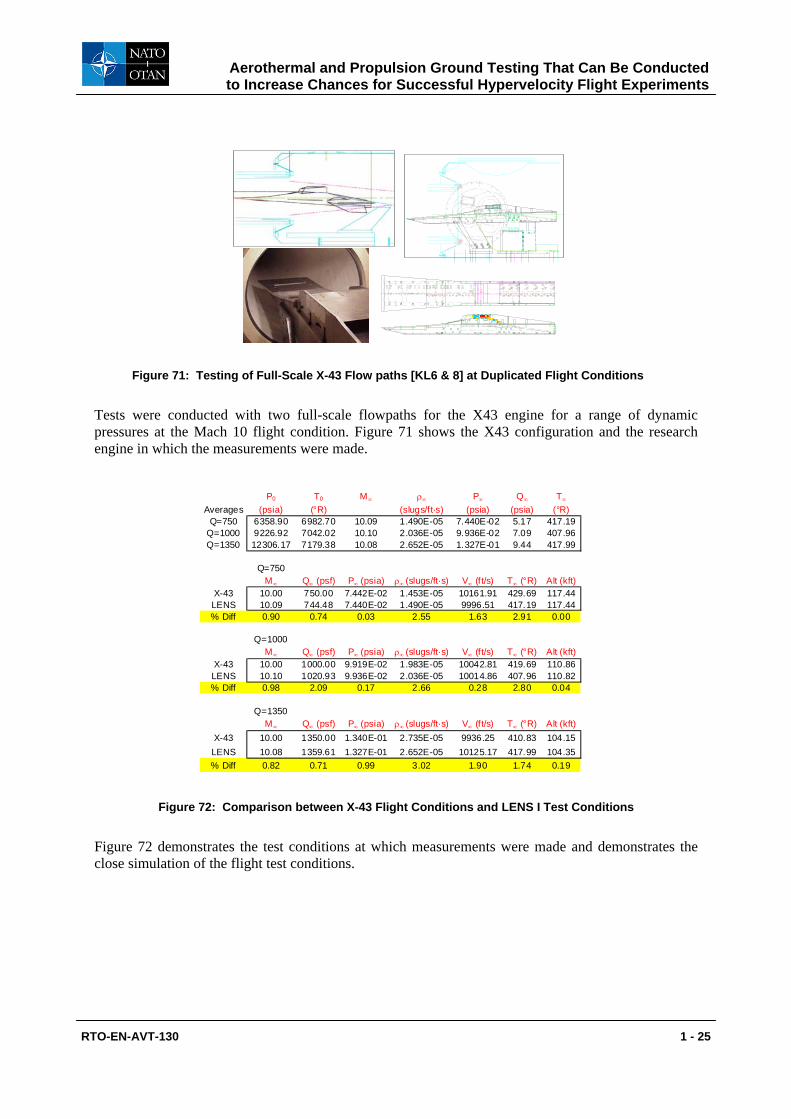
Figure 71: Testing of Full-Scale X-43 Flow paths [KL6 & 8] at Duplicated Flight Conditions
Tests were conducted with two full-scale flowpaths for the X43 engine for a range of dynamic pressures at the Mach 10 flight condition. Figure 71 shows the X43 configuration and the research engine in which the measurements were made.
P0 T0 M∞ ρ∞ P∞ Q∞ T∞
Averages (psia) (°R) (slugs/ft·s) (psia) (psia) (°R)Q=750 6358.90 6982.70 10.09 1.490E-05 7.440E-02 5.17 417.19
Q=1000 9226.92 7042.02 10.10 2.036E-05 9.936E-02 7.09 407.96Q=1350 12306.17 7179.38 10.08 2.652E-05 1.327E-01 9.44 417.99
Q=750M∞ Q∞ (psf) P∞ (psia) ρ∞ (slugs/ft·s) V∞ (ft/s) T∞ (°R) Alt (kft)
X-43 10.00 750.00 7.442E-02 1.453E-05 10161.91 429.69 117.44LENS 10.09 744.48 7.440E-02 1.490E-05 9996.51 417.19 117.44% Diff 0.90 0.74 0.03 2.55 1.63 2.91 0.00
Q=1000M∞ Q∞ (psf) P∞ (psia) ρ∞ (slugs/ft·s) V∞ (ft/s) T∞ (°R) Alt (kft)
X-43 10.00 1000.00 9.919E-02 1.983E-05 10042.81 419.69 110.86LENS 10.10 1020.93 9.936E-02 2.036E-05 10014.86 407.96 110.82% Diff 0.98 2.09 0.17 2.66 0.28 2.80 0.04
Q=1350M∞ Q∞ (psf) P∞ (psia) ρ∞ (slugs/ft·s) V∞ (ft/s) T∞ (°R) Alt (kft)
X-43 10.00 1350.00 1.340E-01 2.735E-05 9936.25 410.83 104.15LENS 10.08 1359.61 1.327E-01 2.652E-05 10125.17 417.99 104.35% Diff 0.82 0.71 0.99 3.02 1.90 1.74 0.19
Figure 72: Comparison between X-43 Flight Conditions and LENS I Test Conditions
Figure 72 demonstrates the test conditions at which measurements were made and demonstrates the close simulation of the flight test conditions.
Aerothermal and Propulsion Ground Testing That Can Be Conducted to Increase Chances for Successful Hypervelocity Flight Experiments
RTO-EN-AVT-130 1 - 25

q=1,350 psfNo Trips
q=1,350 psfTrips
Figure 73: Effect of trips on Flow Pattern and Heating Over Inlet
During this test series, detailed studies were made of the flow over the inlet ramp with a range of trip configurations employing both Schlieren (Figure 73) and holography (Figure 80) to visualize and quantify the flowfield.
Inlet RampWithout Trips
Infinite Fringe Holography
Inlet RampWith Trips
Pulsed Holography
Figure 74: Flow Visualization with Infinite Fringe and Pulsed Holography
Detailed heat transfer and pressure measurements were made over the inlet and closed cowl configuration for a range of test conditions and model temperatures to examine boundary layer trip effectiveness and closed door heating (see Figures 74 and 75).
•15 Runs Completed to Obtain Acreage Heating and Pressure Data on the X-43 Closed Cowl Configuration
•Heating and Pressure Data Obtained On Closed Cowl, Exposed Inlet Sidewalls, and Forebody
•Obtained Forebody Acreage Data to Access Tripping
Figure 75: X-43 Closed Cowl Heating Investigation in LENS I
Aerothermal and Propulsion Ground Testing That Can Be Conducted to Increase Chances for Successful Hypervelocity Flight Experiments
1 - 26 RTO-EN-AVT-130
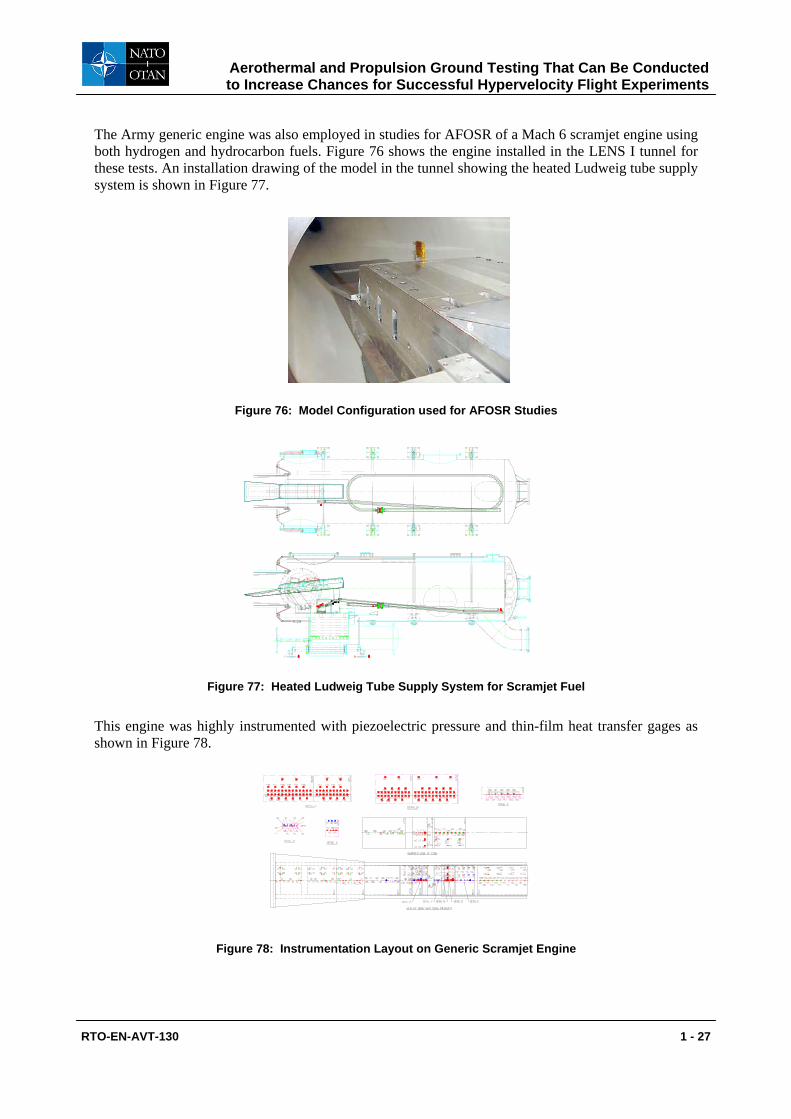
The Army generic engine was also employed in studies for AFOSR of a Mach 6 scramjet engine using both hydrogen and hydrocarbon fuels. Figure 76 shows the engine installed in the LENS I tunnel for these tests. An installation drawing of the model in the tunnel showing the heated Ludweig tube supply system is shown in Figure 77.
g
Figure 76: Model Configuration used for AFOSR Studies
Figure 77: Heated Ludweig Tube Supply System for Scramjet Fuel
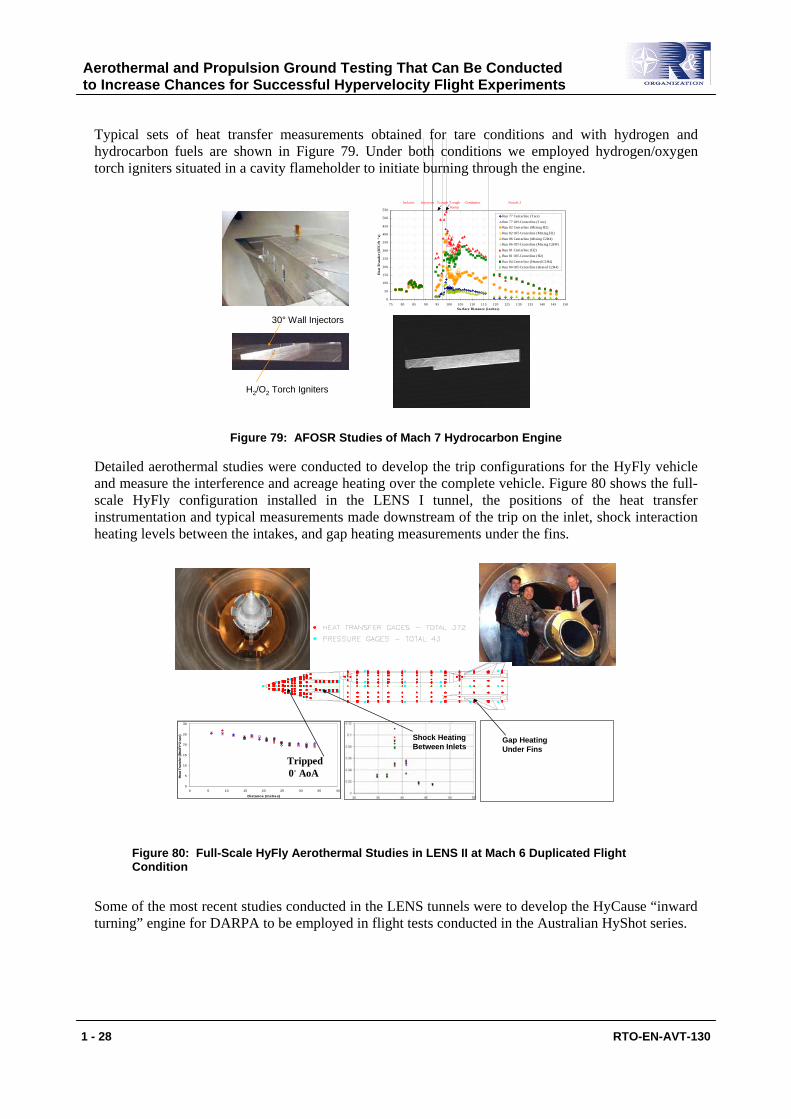
This engine was highly instrumented with piezoelectric pressure and thin-film heat transfer gages as shown in Figure 78.
Figure 78: Instrumentation Layout on Generic Scramjet Engine
Aerothermal and Propulsion Ground Testing That Can Be Conducted to Increase Chances for Successful Hypervelocity Flight Experiments
RTO-EN-AVT-130 1 - 27
Typical sets of heat transfer measurements obtained for tare conditions and with hydrogen and hydrocarbon fuels are shown in Figure 79. Under both conditions we employed hydrogen/oxygen torch igniters situated in a cavity flameholder to initiate burning through the engine.
y g
H2/O2 Torch Igniters
30° Wall Injectors
0
50
100
150
200
250
300
350
400
450
500
550
75 80 85 90 95 100 105 110 115 120 125 130 135 140 145 150Surface Distance (inches)
Hea
t Tra
nsfe
r (B
TU
/ft2 ·s
)
Run 77 Centerline (Tare)
Run 77 Off-Centerline (Tare)Run 82 Centerline (Mixing H2)Run 82 Off-Centerline (Mixing H2)Run 86 Centerline (Mixing C2H4)Run 86 Off-Centerline (Mixing C2H4)Run 81 Centerline (H2)Run 81 Off-Centerline (H2)
Run 84 Centerline (Heated C2H4)Run 84 Off-Centerline (Heated C2H4)
Trough Trough Ramp
Combustor Nozzle 2Isolator Injectors
Figure 79: AFOSR Studies of Mach 7 Hydrocarbon Engine
Detailed aerothermal studies were conducted to develop the trip configurations for the HyFly vehicle and measure the interference and acreage heating over the complete vehicle. Figure 80 shows the full-scale HyFly configuration installed in the LENS I tunnel, the positions of the heat transfer instrumentation and typical measurements made downstream of the trip on the inlet, shock interaction heating levels between the intakes, and gap heating measurements under the fins.
g
0
5
10
15
20
25
30
0 5 10 15 20 25 30 35 40
Distance (Inches)
Hea
t Tra
nsfe
r (B
tu/F
t̂2-
sec)
Tripped0◦ AoA
Shock Heating Between Inlets
Gap HeatingUnder Fins
Figure 80: Full-Scale HyFly Aerothermal Studies in LENS II at Mach 6 Duplicated Flight Condition
Some of the most recent studies conducted in the LENS tunnels were to develop the HyCause “inward turning” engine for DARPA to be employed in flight tests conducted in the Australian HyShot series.
Aerothermal and Propulsion Ground Testing That Can Be Conducted to Increase Chances for Successful Hypervelocity Flight Experiments
1 - 28 RTO-EN-AVT-130

The basic vehicle configuration and a full-scale ground test model which was tested in LENS I and II are shown in Figure 81.
INWARD TURNING SCRAMJET POWERED MACH 10 VEHICLE CONCEPT
FULL-SCALE GROUND TEST VEHICLE TESTED IN LENS I AND II AT DUPLICATED FLIGHT CONDITIONS
Figure 81: Full-Scale Studies of “Inward Turning” Engine
A significant effort was expended in the design and optimization of the inlet and the position and size of the trips to ensure that a turbulent flow entered the isolator. Pressure contours developed in the numerical simulations are shown in Figure 82. The trip configurations employed in the inlet are shown in Figure 83 together with the installation diagram for the HyCause engine in the LENS I facility.
PRESSURE (PSIA)
NUMERICAL SIMULATION OF PRESSURE DISTRIBUTION INSIDE “INWARD TURNING” INLET CONFIGURATION
FULL-SCALE INLET CONFIGURATION TO BE TESTED IN THE LENS FACILITY UNDER FULLY DUPLICATED FLIGHT CONDITIONS
Figure 82: Experimental and Numerical Evaluation of “Inward Turning” Inlet Configurations
Geometry of Inlet Trips
11 Feet
Figure 83: ITEC Installed in LENS I Tunnel
Aerothermal and Propulsion Ground Testing That Can Be Conducted to Increase Chances for Successful Hypervelocity Flight Experiments
RTO-EN-AVT-130 1 - 29
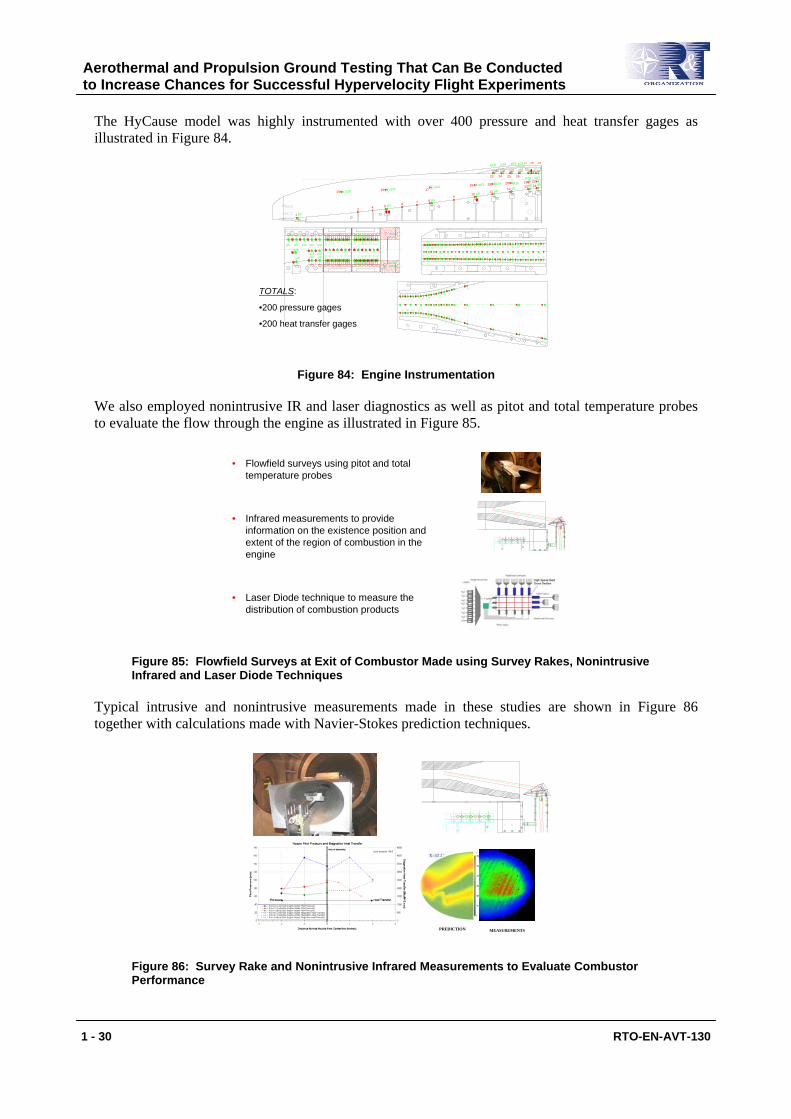
The HyCause model was highly instrumented with over 400 pressure and heat transfer gages as illustrated in Figure 84.
p10
p18 p21
p8 14 p9
2827 29
25 2624
12
20p7p15
p19 p20
p17p162221
13
1
63 4 p3
16
5
p11 17
7
p12
p48
p14
p6
p1
18
109
23
p13
p5
19
1115
p31 p32 p33 p34 p35
p26
p28
p25
p29p27p30
TOTALS:
•200 pressure gages
•200 heat transfer gages
Figure 84: Engine Instrumentation
We also employed nonintrusive IR and laser diagnostics as well as pitot and total temperature probes to evaluate the flow through the engine as illustrated in Figure 85.
• Flowfield surveys using pitot and total temperature probes
• Infrared measurements to provide information on the existence position and extent of the region of combustion in the engine
• Laser Diode technique to measure the distribution of combustion products
Figure 85: Flowfield Surveys at Exit of Combustor Made using Survey Rakes, Nonintrusive Infrared and Laser Diode Techniques
Typical intrusive and nonintrusive measurements made in these studies are shown in Figure 86 together with calculations made with Navier-Stokes prediction techniques.
PREDICTION MEASUREMENTS
Figure 86: Survey Rake and Nonintrusive Infrared Measurements to Evaluate Combustor Performance
Aerothermal and Propulsion Ground Testing That Can Be Conducted to Increase Chances for Successful Hypervelocity Flight Experiments
1 - 30 RTO-EN-AVT-130
Figure 87: Schematic Diagram of Laser Diode System for Water Vapor and Temperature Measurements in Scramjet Engines
A schematic of the laser diode system employed to measure water vapor and temperature at the back of the engine and the hardware associated with the tomography system are shown in Figures 87 and 88. We are continuing to develop these systems and the results of these measurements are of key importance in optimizing the fuel injection systems and engine geometry.
H2O Concentration Measurement
MEASUREMENT PREDICTION
Figure 88: Water Vapor Measurements at End of HyCause Combustor with Laser Diode Tomography System
Aerothermal and Propulsion Ground Testing That Can Be Conducted to Increase Chances for Successful Hypervelocity Flight Experiments
RTO-EN-AVT-130 1 - 31
7.1 Studies to Develop Starting Mechanisms for Highly Contracted Inlet Systems In order to start the HyCause engine, which was designed to have a significant internal contraction ratio, it is necessary to initiate the flow with a starting door open. The inlet modified to incorporate a starting door is shown in Figure 89. In these studies conducted in the LENS II facility with the full size scramjet engine, we also employed an isolator door (Figure 89) to ensure a stagnated flow through the engine during the initial part of the test series. Once flow was established over the engine, the isolator door was opened and then the bypass door was closed allowing the engine to successfully start as illustrated in Figures 89, 90 and 91.
ITEC Inlet @ M=7BYPASS DOOR ISOLATOR DOOR
Started with Bypass Door Open
Started with Bypass Door Shut
UnstartedInlet
Pressure in Front of Isolator Door
Pressure Behind Isolator Door
Figure 89: Test Time Requirements for Mode Switching and Scramjet Starting Studies (Ttest = 70 ms)
Bypass Door Open, Isolator Door Closed Bypass Door Open, Isolator Door Open
Powered Flight Configuration
Figure 90: Engine Start Test Sequence
q = 250 lbf / ft²Combustor SV Cycled (Closed to Open) Integrated Bypass Door Cycled (Open to Closed)
Isolator Door Closed,Bypass Door Open
Isolator Door Open,Bypass Door Open
Isolator Door Open,Bypass Door Closed
Isolator Door Open,Bypass Door Closing
Figure 91: Flowfield and Pressure Distribution during Engine Start Process: Result: Bypass Door Enables Inlet/Engine to Start at High Altitude
Aerothermal and Propulsion Ground Testing That Can Be Conducted to Increase Chances for Successful Hypervelocity Flight Experiments
1 - 32 RTO-EN-AVT-130
8.0 STUDIES OF SHROUD, STORES AND STAGE SEPARATION
Many hypersonic missiles employ a shroud to cover the seekerhead or inlets of the vehicle during launch which is dispensed higher in the atmosphere. Ensuring that the dispensed shroud does not subsequently hit and damage the vehicle or influence the trajectory is of major concern to the designer. Also the trajectory of stores as they are dispensed from a hypersonic vehicle is of major concern for the same reason. Tests to evaluate the dynamic response of the shroud as it separates from the vehicle body can be conducted in wind tunnels. However, in high Mach number flow, the energy levels of the flying components can be extremely large.
Figure 92: Tunnel Tests of Full-Scale Shroud Separation Model Prior to Flight Test Program
One way of minimizing the potential energy of the flying object is to stop the flow immediately as the shroud or munition is dispensed and this is done by a high speed valve. This is accomplished in the LENS II facility using a high speed valve which is timed to close when the shroud or other flying object has dispensed successfully. Figure 92 shows the tests which were conducted in the LENS II facility in which a full-scale two-part shroud was separated from the nosetip at duplicated flight conditions.
y
Time (ms)
Pres
sure
(psi
a)
Surface Pressure Level (no shroud)
P1P2 P3
SchlierenImage
ModelDrawing
Figure 93: Shroud Separation Tests Demonstrating Large Unsteady Transient Loads Generated by Shock Interaction
Measurements were obtained with onboard cameras (shown in Figure 92) and with side mounted cameras which obtained the photographs in Figure 93. In addition to concerns on the trajectory of the shroud, the aero loads on the window beneath the shroud generated as the shock from the shroud
Aerothermal and Propulsion Ground Testing That Can Be Conducted to Increase Chances for Successful Hypervelocity Flight Experiments
RTO-EN-AVT-130 1 - 33
swept across the window were of major concern. As shown in Figure 93, pressure enhancement factors of over 30 were generated during this process.
Figure 94: Comparison with Numerical Prediction
Figure 94 shows comparisons between the predictions a code employing unsteady Navier-Stokes equations and the tunnel results. Numerical predictions suffered from problems associated with accurately describing the shock/boundary layer interaction phenomena on the vehicle window and thus did not accurately reflect the experimental results.
Figure 95: Diagram of Penetrator Weapon Systems deployed with the Rapid Retractable Support System (RRSS) in LENS II
Another major area for which ground tests can be employed to evaluate and validate vehicle design before it is committed to flight is in the area of stores and stage separation. Again employing fast-acting valve systems to stop the tunnel flow abruptly once the separation is achieved, a release system must be developed which can deploy the flying article without introducing extraneous motion. Figure 95 shows the launch system employed in the LENS II facility in studies to examine the separation of a two-stage launch system.
Aerothermal and Propulsion Ground Testing That Can Be Conducted to Increase Chances for Successful Hypervelocity Flight Experiments
1 - 34 RTO-EN-AVT-130
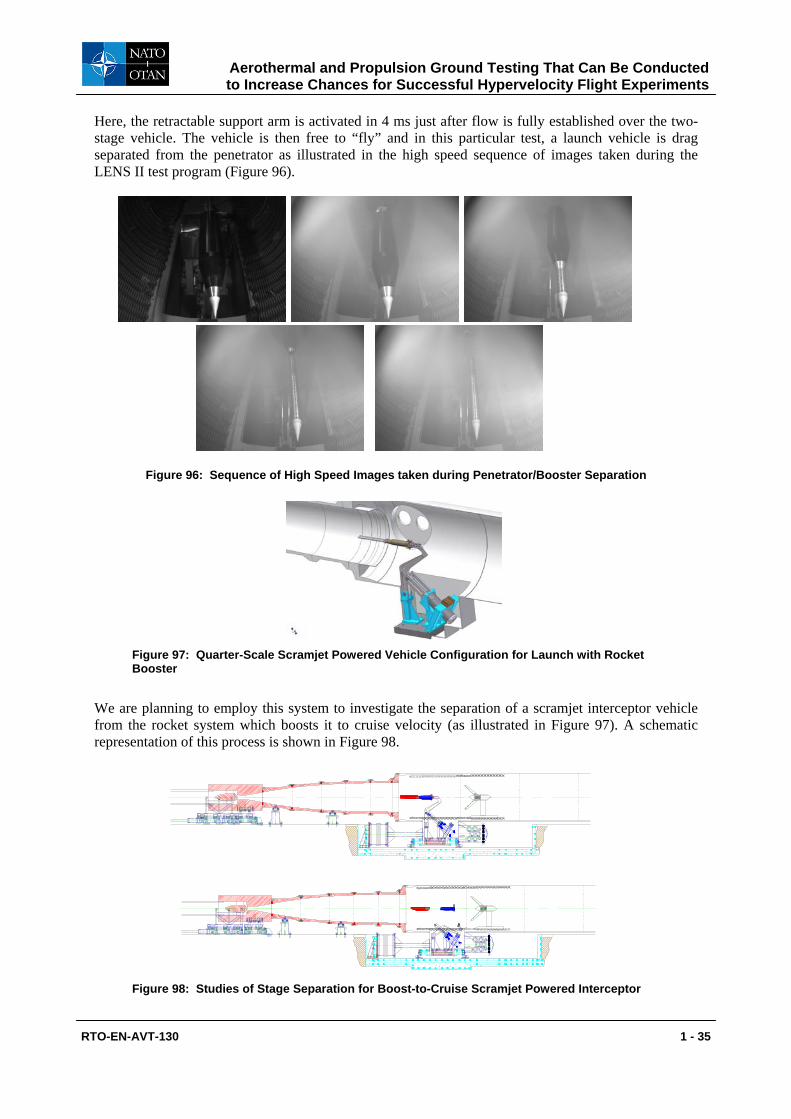
Here, the retractable support arm is activated in 4 ms just after flow is fully established over the two-stage vehicle. The vehicle is then free to “fly” and in this particular test, a launch vehicle is drag separated from the penetrator as illustrated in the high speed sequence of images taken during the LENS II test program (Figure 96).
Figure 96: Sequence of High Speed Images taken during Penetrator/Booster Separation
Figure 97: Quarter-Scale Scramjet Powered Vehicle Configuration for Launch with Rocket Booster
We are planning to employ this system to investigate the separation of a scramjet interceptor vehicle from the rocket system which boosts it to cruise velocity (as illustrated in Figure 97). A schematic representation of this process is shown in Figure 98.
Figure 98: Studies of Stage Separation for Boost-to-Cruise Scramjet Powered Interceptor
Aerothermal and Propulsion Ground Testing That Can Be Conducted to Increase Chances for Successful Hypervelocity Flight Experiments
RTO-EN-AVT-130 1 - 35
9.0 MAJOR CONCLUSIONS
• Ground tests at fully duplicated or well simulated flight conditions are essential to minimize
the risks associated with flight test programs from the perspective of overall vehicle performance and detailed measurements to investigate flow phenomena associated with real gas effects, boundary layer transition, turbulence and shock interaction phenomena and mixing and combustion
• Both flight test and ground test planning and evaluation should be totally integrated and supported by detailed numerical computations employing DSMC, Navier-Stokes and empirical prediction methods
• Hypersonic ground test facilities are available to perform full-scale testing at fully duplicated flight conditions of vehicles up to 3 to 6 meters in length.
• Flight test programs should be conducted in concert with and not at the expense of improving our ground test facilities and measurements techniques
Aerothermal and Propulsion Ground Testing That Can Be Conducted to Increase Chances for Successful Hypervelocity Flight Experiments
1 - 36 RTO-EN-AVT-130