Embed Size (px)
Citation preview
Plant Science Pamphlet 12 AESPS103
January 2003
Progress Report 2002
Central Crops and Soils Research Station Highmore, South Dakota
SOUTH DAKOTA STATE UNIVERSITY• Plant Science Department• Brookings, SD 57007
Contents
Welcome, Robin Bortnem
Greetings. Dale Gallenberg ........................ 2
Temperatures and Precipitation, 2002 ., ..
Advisory Board, 2002
Field Evaluation of Woody Plant Materials, Tober ...................... 5
Evaluation of a Naturalized Rangeland Population of Alfalfa, Boe, Bortnem
Winter Wheat Breeding and Genetics. fbranim, Kalsbeck, little I•••••••• 8
Oat Research, l. Hall 11
Spring Wheat Breeding, Glover, Devkota ....... 12
Resistance of Sunflower Germplasm to the Red Sunflower Seed Weevil, Miller, Grady . . . . . 14
Weed Control, Wmge, Deneke, Vos, Rook . • . . . . . . . . . . . . . . . . . . . . . . . . . . . . . . . . . . . 16
Fertilizer and Soil Test Effects on Wheat Yield, Gerwing, Gelderman, Bly, Volek
Influence of Planting Date on Insect Infestations, Viral Plant Disease, Plant Growth, and
23
Yield in Winter Wheat, Hesler, Riedell, Langham . . ............................ 25
Influence of Planting Date on Insect Infestations, Viral Plant Diseases. Plant Growth. and Yield of Spring Wheat. Hesler, Riedell, Langham . . . . . . . . . . . . . . . . . . . . . . . . . . . . . . 27
On the cover: Sunflower plots used In the study o1 resistance to the red sunflower seed weevil. Project cooperators were from USDA·ARS Sunflower Research Unit at Fargo, N.O .• and South Dakota State University. Photo by Kathy Grady, taken July 31,2002
Published in accordance with an act passed in 1881 by the 141h Legislative lda�y. Dakota Territory, establishing the Dakota Agricultural College and with the act of re-organization passed In 1887 by the 17th LegiSlative Assembly. which estabfished the Agricultural Experiment Station at South Dakota State University. South Dakota State Unlvarsi1y is an Affirmative Action/Equal Opportunity Employer and offers all benefits, services. education, and employment without regard for race, color. creed, religion, national origin, ancestry, citizenship, age, gender, sexual orientation, disability, or Vietnam Era veteran status.
This publication reports the results of research only. Mention ot a trademark, proprietary product, or vendor does not constitute a guarantee or warranty of the product by the South Oakcta Agricultural Experiment Station and does not imply lt.ci approval to lhe exclusion of other products or vendors that may also be suitable.
Plant Science Pamphlet 12 (AES PS103): 150 printed at oost of $1 41 each, January 2003
Plant Science Pamphlet 12 AESPS103
January 2003
Progress
Report 2002
Central Crops and Soils Research Station Highmore, South Dakota
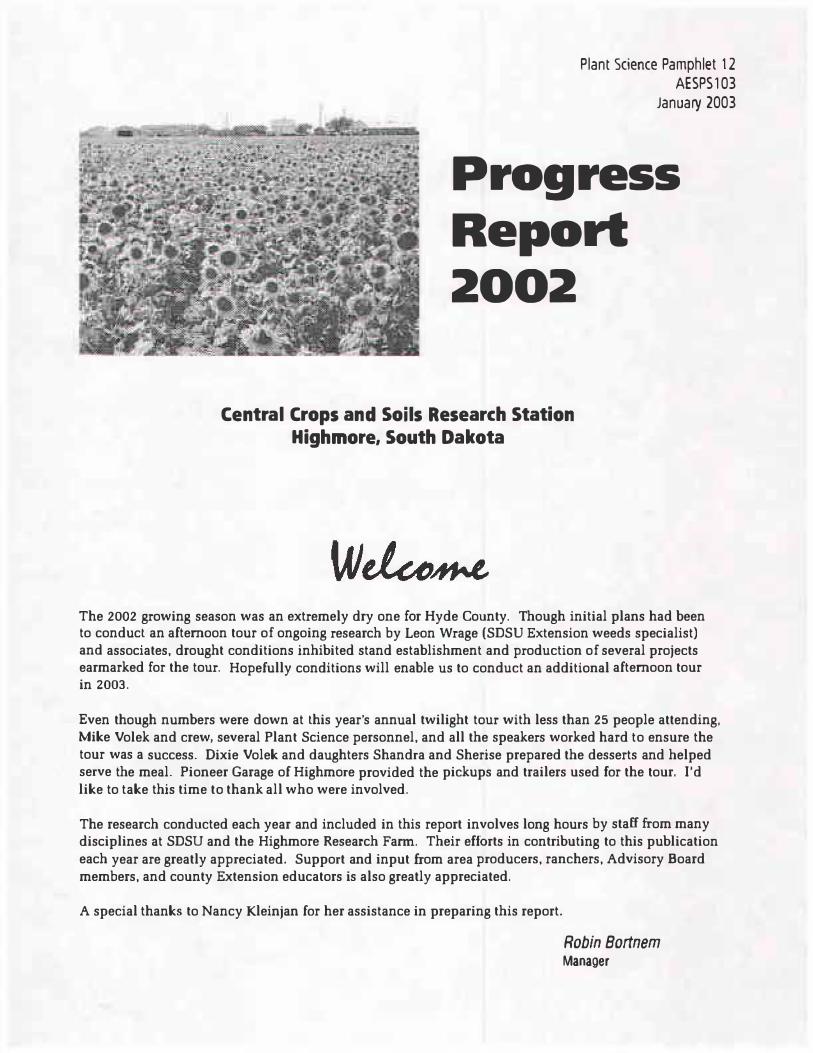
The 2002 growing season was an extremely dry one for Hyde County. Though initial plans had been to conduct an afternoon tour of ongoing research by Leon Wrage (SDSU Extension weeds specialist) and associates, drought conditions inhibited stand establishment and production of several projects earmarked for the tour. Hopefully conditions will enable us to conduct an additional afternoon tour in 2003.
Even though numbers were down at this year's annual twilight tour with less than 25 people attending, Mike Volek and crew, several Plant Science personnel, and all the speakers worked hard to ensure the tour was a success. Dixie Volek and daughters Shandra and Sherise prepared the desserts and helped serve the meal. Pioneer Garage of Highmore provided the pickups and trailers used for the tour. I'd like to take this time to thank all who were involved.
The research conducted each year and included in this report involves long hours by staff from many disciplines at SDSU and the Highmore Research Fann. Their efforts in contributing to this publication each year are greatly appreciated. Support and input from area producers, ranchers, Advisory Board members, and county Extension educators is also greatly appreciated.
A special thanks to Nancy Kleinjan for her assistance in preparing this report.
Robin Bortnem Manager
On behalf of the Plant Science Department at South Dakota State University, let me extend my greetings and best wishes to each of you. This annual progress report marks another year at the Highmore Research Farm The following pages represent some of the research and Extension activities during the 2002 season. Mother Nature was not very kind last year, and the studies reported here reflect this. Still, we hope the results are of value to you in making management decisions on your own operations.
As I try to do each year, I would Hke to thank Mike Volek for his continued hard work and dedication to the Highmore research farm. The day-to-day, on-site activities are conducted in an efficient and effective manner. The farm is always neat and organized, and the researchers and Extension specialists from Brookings appreciate this. I would also like to extend another thank you to Robin Bortnem for her continued efforts as station manager, to all the faculty and staff in the Plant Science Department at SDSU for their work at the farm, and to the NRCS personnel for their continued evaluation studies.
Finally, the biggest thanks goes to each one of you for taking the time to read this report and for giving us input into the research that needs to be done here in Highmore. Your continued comments and suggestions are more than welcome.
Date Gallenberg Head, Plant Science Department
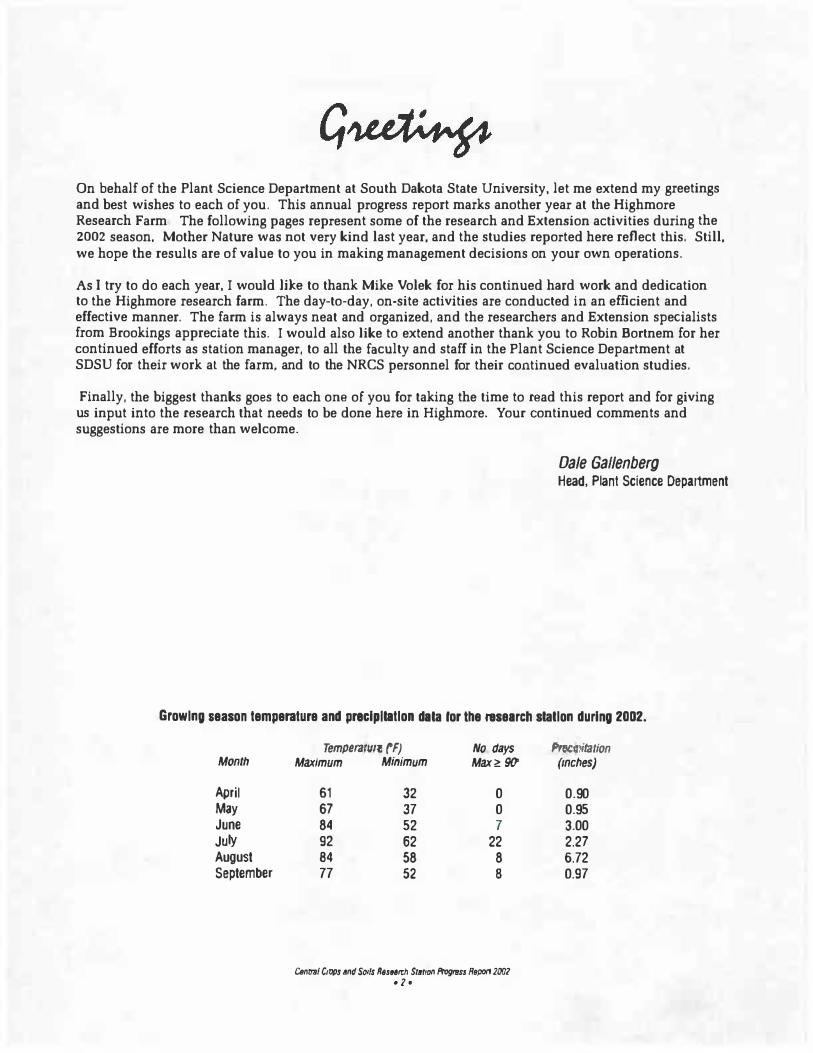
Growing season temperature and precipitation data ror the research station during 2002.
Month
April May
June July August September
Temperarura ('F) Maximum Minimum
61 67
84 92 84 77
32
37 52 62 58 52
No days Max� 90'
0 0 7
22 8 8
CentrBI Ctr)f)$ and Soils Res11rrh Stat1e,n Progrsss Repor1200? •2•
fir&.tnitation (inches)
0.90 0.95 3.00 2.27 6.72 0.97
Name
Gregg Yapp
Todd Weinmann
Slade Roseland
Lyle Stewart
Ken Wonnenberg
Larry Nagel
Randy Hague
Jerry Johnson
Marcia Deneke
Dennis Beckman
Karin Schilley
Lee Dougan
Donald Hinckley
Charles Todd
Kelly Stout
Mike Volek
Chris Onstad
Dale Gallenberg
Robin Bortnem
Kevin Kephart
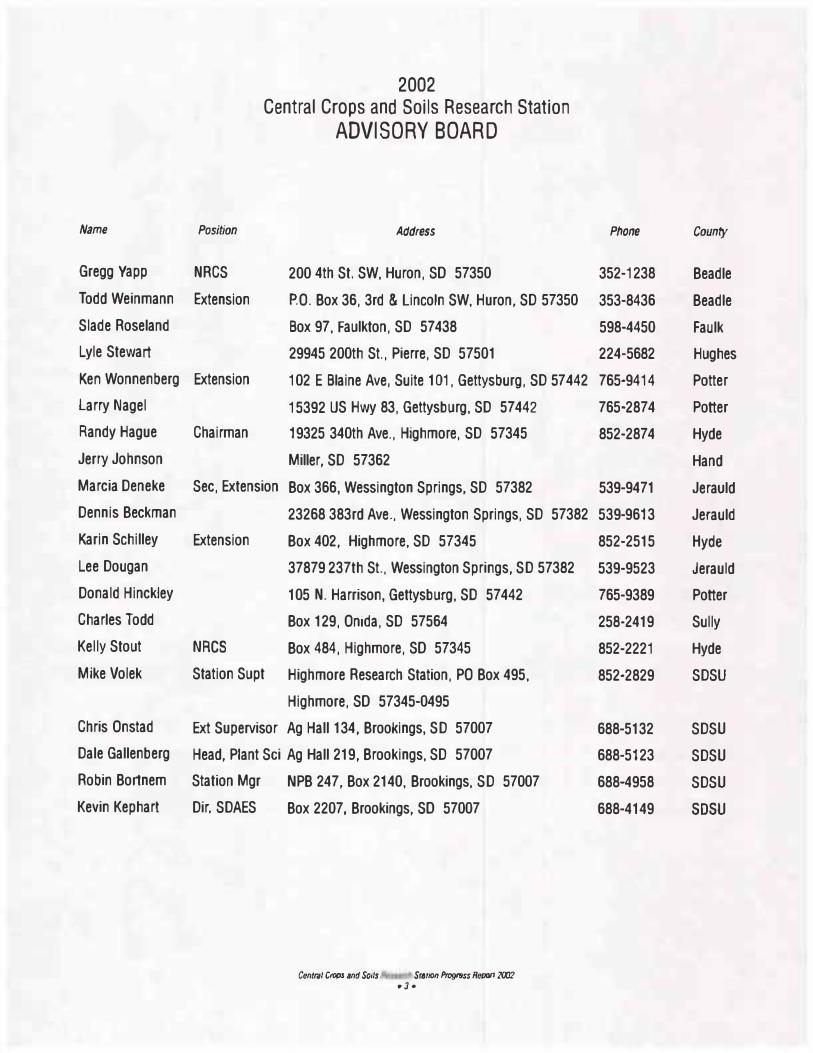
2002
Central Crops and Soils Research Station ADVISORY BOARD
Position Address
NRCS 200 4th St. SW, Huron, SO 57350
Extension P.O. Box 36, 3rd & Lincoln SW, Huron, SD 57350
Box 97, Faulkton, SD 57438
29945 200th St., Pierre, SD 57501
Extension 102 E Blaine Ave, Suite 101, Gettysburg, SD 57 442
15392 US Hwy 83, Gettysburg, SD 57442
Chairman 19325 340th Ave., Highmore, SD 57345
Miller, SD 57362
Sec, Extension Box 366, Wessington Springs, SD 57382
23268 383rd Ave .. Wessington Springs, SD 57382
Extension Box 402, Highmore, SD 57345
37879 237th St.. Wessington Springs, SD 57382
105 N. Harrison, Gettysburg, SD 57442
Box 129, Onida, SD 57564
NRCS Box 484, Highmore, SO 57345
Station Supt Highmore Research Station, PO Box 495,
Highmore, SO 57345-0495
Ext Supervisor Ag Hall 134, Brookings, SD 57007
Head, Plant Sci Ag Hall 219, Brookings, SD 57007
Station Mgr
Dir. SDAES
NPB 247, Box 2140, Brookings, SD 57007
Box 2207, Brookings, SO 57007
Central Clops and Soils Sra11on Progrr,ss Repon 2UIJZ ,,3.
Phone County
352-1238 Beadle
353-8436 Beadle
598-4450 Faulk
224-5682 Hughes
765·9414 Potter
765�2874 Potter
852-2874 Hyde
Hand
539-9471 Jerauld
539-9613 Jerauld
852-2515 Hyde
539-9523 Jerauld
765-9389 Potter
258-2419 Sully
852-2221 Hyde
852·2829 SDSU
688-5132 SDSU
688-5123 SDSU
688-4958 SDSU
688-4149 SDSU

I II
I I
r
I •
I
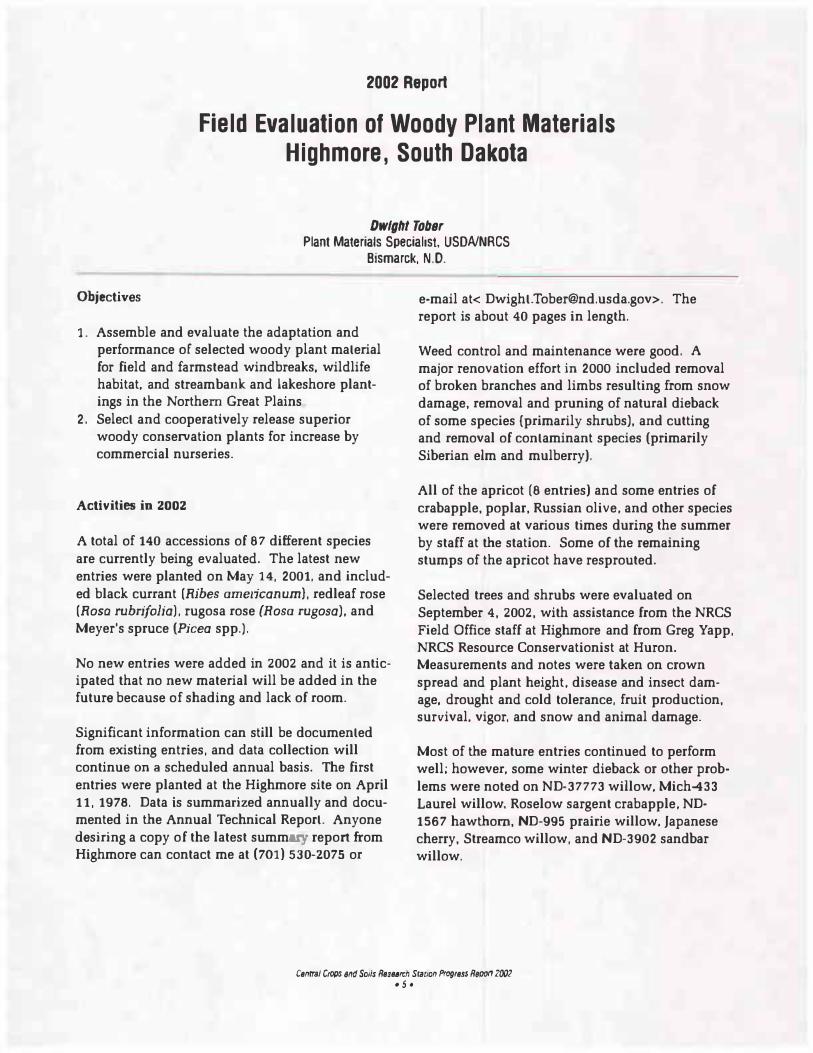
2002 Report
Field Evaluation of Woody Plant Materials Highmore, South Dakota
Dwight Tobsr Plant Materials Specialist, USDA/NRCS
Bismarck, N.0.
Objectives
1. Assemble and evaluate the adaptation and performance of selected woody plant material for field and farmstead windbreaks, wildlife habitat, and streambanlc and lakeshore plantings in the Northern Great Plains
2. Select and cooperatively release superior woody conservation plants for increase by commercial nurseries.
Activities in 2002
A total of 140 accessions of 87 different species are currently being evaluated. The latest new entries were planted on May 14, 2001. and included black currant (Ribes americanum}, redleaf rose (Rosa rubrifolia). rugosa rose (Rosa rugosa). and Meyer's spruce (Picea spp.).
No new entries were added in 2002 and it is anticipated that no new material will be added in the future because of shading and lack of room.
Significant information can still be documented from existing entries, and data collection will continue on a scheduled annual basis. The first entries were planted at the Highmore site on April 11, 1978. Data is summarized annually and documented in the Annual Technical Report. Anyone desiring a copy of the latest summ.lfY repon from Highmore can contact me at (701) 530-2075 or
e-mail at< [email protected]>. The report is about 40 pages in length.
Weed control and maintenance were good. A major renovation effort in 2000 included removal of broken branches and limbs resulting from snow damage, removal and pruning of natural dieback of some species {primarily shrubs), and cutting and removal of contaminant species (primarily Siberian elm and mulberry).
All of the apricot (8 entries) and some entries of crabapple, poplar, Russian olive. and other species were removed at various times during the summer by staff at the station. Some of the remaining stumps of the apricot have resprouted.
Selected trees and shrubs were evaluated on September 4, 2002, with assistance from the NRCS Field Office staff at Highmore and from Greg Yapp, NRCS Resource Conservationist at Huron. Measurements and notes were taken on crown spread and plant height. disease and insect damage, drought and cold tolerance, fruit production, survival. vigor. and snow and animal damage.
Most of the mature entries continued to perform well; however, some winter dieback or other problems were noted on ND-37773 willow, Mich-433 Laurel willow. Roselow sargent crabapple. ND· 1567 hawthorn, ND-995 prairie willow. Japanese cherry, Streamco willow, and ND-3902 sandbar willow.
Central Ct()/)$ 8/ld Soils Rese1,ch Station Pl'()l}ress Rt1()()ft 20()2 •5•
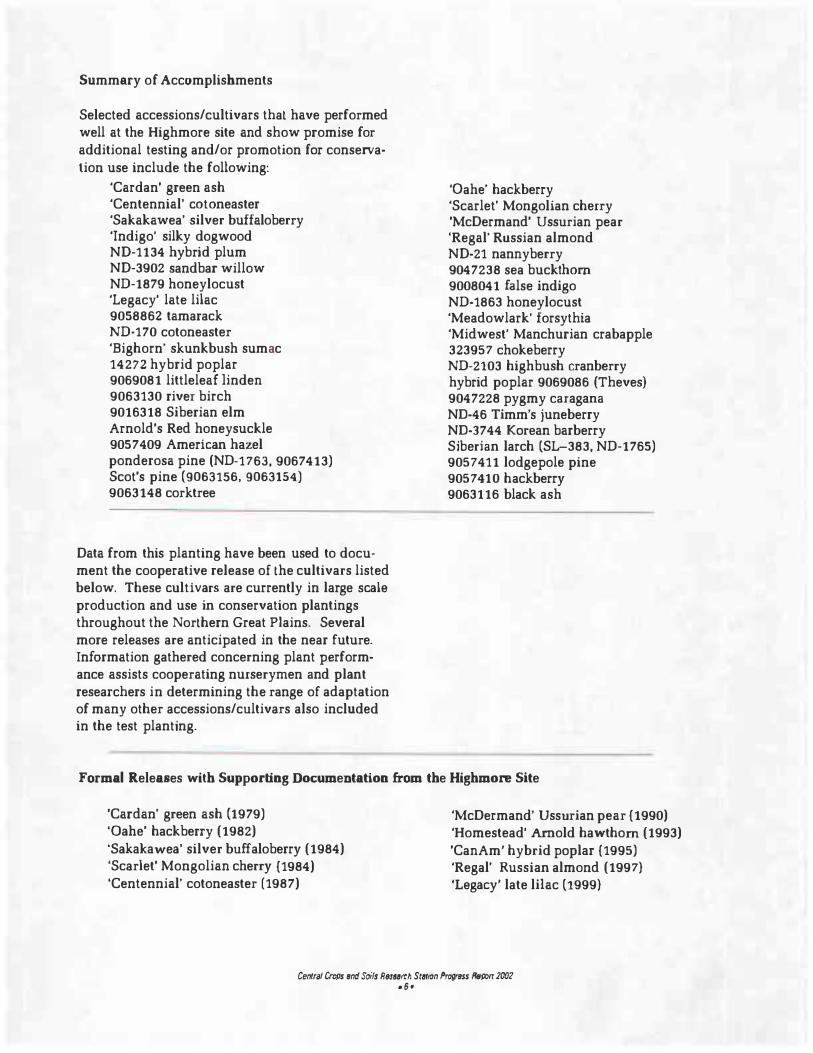
Summary of Accomplishments
Selected accessions/cultivars that have performed well at the Highmore site and show promise for additional testing and/or promotion for conservation use include the following:
'Cardan' green ash 'Centennial' cotoneaster 'Sakakawea' silver buffaloberry 'Indigo' silky dogwood ND-1134 hybrid plum ND-3902 sandbar willow ND-1879 honeylocust 'Legacy' late lilac 9058862 tamarack ND-170 cotoneaster 'Bighorn' skunkbush sumac 14272 hybrid poplar 9069081 littleleaf linden 9063130 river birch 9016318 Siberian elm Arnold's Red honeysuckle 905 7 409 American hazel ponderosa pine (ND-1763, 9067413) Scot's pine (9063156, 9063154) 9063148 corktree
Data from this planting have been used to document the cooperative release of the cultivars listed below. These cultivars are currently in large scale production and use in conservation plantings throughout the Northern Great Plains. Several more releases are anticipated in the near future. Information gathered concerning plant p.erformance assists cooperating nurserymen and plant researchers in determining the range of adaptation of many other accessions/cultivars also included in the test planting.
'Oahe' hackberry 'Scarlet' Mongolian cherry 'McDermand' Ussurian pear 'Regal' Russian almond ND-21 nannyberry 904 7238 sea buck thorn 9008041 false indigo ND-1863 honeylocust 'Meadowlark' forsythia 'Midwest' Manchurian crabapple 323957 chokeberry ND-2103 highbush cranberry hybrid poplar 9069086 (Theves) 9047228 pygmy caragana ND-46 Timm's juneberry ND-3744 Korean barberry Siberjan larch (SL-383, ND-1765) 905 7 411 lodgepole pine 905 7 41 O hackberry 9063116 black ash
Formal Releases with Supporting Documentation from the Highmore Site
'Cardan' green ash ( 1979) 'Oahe' hackberry (1982) 'Sakakawea' silver buffaloberry (1984) 'Scarlet' Mongolian cherry {1984) 'Centennial' cotoneaster (1987)
'McDermand' Ussurian pear {1990) 'Homestead' Arnold hawthorn (1993) 'CanAm' hybrid poplar {1995) 'Regal' Russian almond (1997} 'Legacy' late lilac (1999}
Central Crops end S<>ils R&eareh S1a11on Progress Rspcrr 200'2 "6•
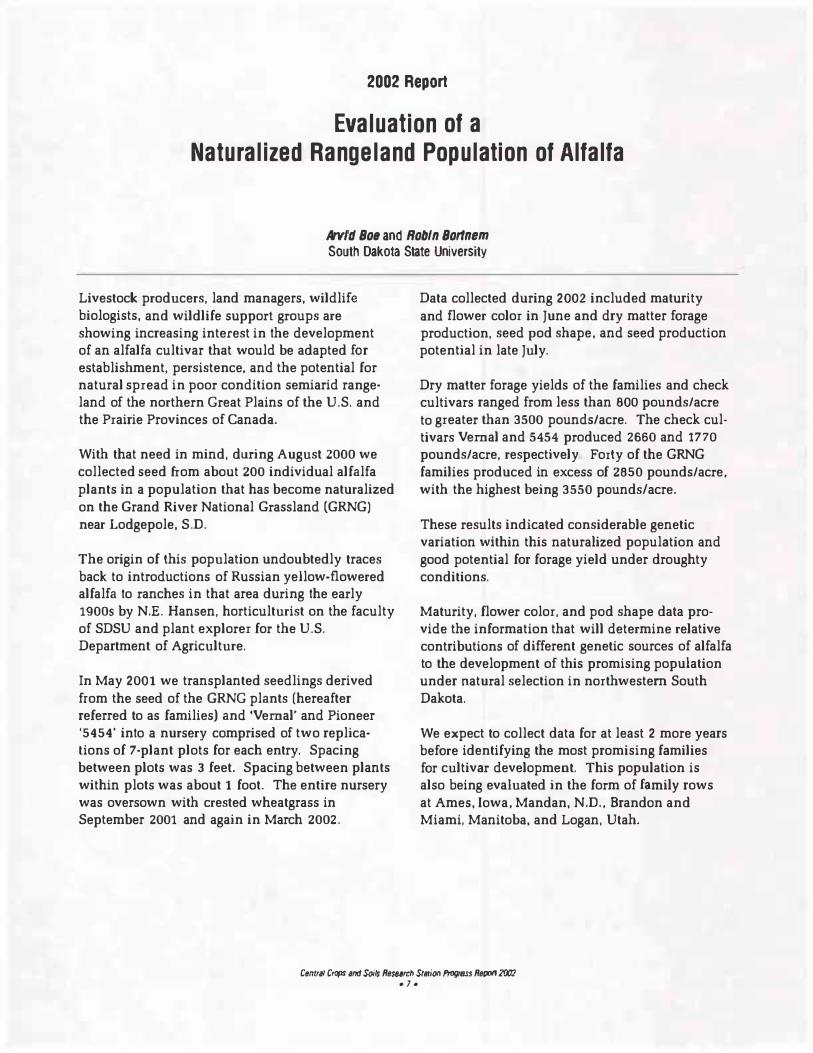
2002 Report
Evaluation of a Naturalized Rangeland Population of Alfalfa
Arvld Boe and Robin Bortnem
South Dakota State University
Livestock producers, land managers, wildlife biologists, and wildlife support groups are showing increasing interest in the development of an alfalfa cultivar that would be adapted for establishment, persistence, and the potential for natural spread in poor condition semiarid range· land of the northern Great Plains of the U.S. and the Prairie Provinces of Canada.
With that need in mind, during August 2000 we collected seed from about 200 individual alfalfa plants in a population that has become naturalized on the Grand River National Grassland (GRNG) near Lodgepole, S.D.
The origin of this population undoubtedly traces back to introductions of Russian yellow-flowered alfalfa to ranches in that area during the early 1900s by N.E. Hansen, horticulturist on the faculty of SDSU and plant explorer for the U.S. Department of Agriculture.
In May 2001 we transplanted seedlings derived from the seed of the GRNG plants (hereafter referred to as families) and 'Vernal' and Pioneer '5454' into a nursery comprised of two replica· lions of 7-plant plots for each entry. Spacing between plots was 3 feet. Spacing between plants within plots was about 1 foot. The entire nursery was oversown with crested wheatgrass in September 2001 and again in March 2002.
Data collected during 2002 included maturity and flower color in June and dry matter forage production, seed pod shape. and seed production potential in late July.
Dry matter forage yields of the families and check cultivars ranged from less than 800 pounds/acre to greater than 3500 pounds/acre. The check cultivars Vernal and 5454 produced 2660 and 1770 pounds/acre, respectively Forty of the GRNG families produced in excess of 2850 pounds/acre. with the highest being 3550 pounds/acre.
These results indicated considerable genetic variation within this naturalized population and good potential for forage yield under droughty conditions.
Maturity, flower color, and pod shape data provide the information that will determine relative contributions of different genetic sources of alfalfa to the development of this promising population under natural selection in northwestern South Dakota.
We expect to collect data for at least 2 more years before identifying the most promising families for cultivar development. This population is also being evaluated in the form of family rows at Ames, Iowa. Mandan, N.D .. Brandon and Miami. Manitoba, and Logan, Utah.
Cen1ra1 Crops a/Id $()ifs Resurth $t81iOll Pr091tm Ref)O(f 20C2 • 7 •
2002 Report
Winter Wheat Breeding and Genetics
Amir Ibrahim, Stsvs Kalsbsck, and Rich Little South Dakota State University
Summary of Activities
The winter wheat breeding and genetics program utilizes the Central Research Station at Highmore primarily for early-generation testing and evaluation of advanced-generation lines. Field trials also are conducted at several other sites throughout South Dakota.
Central Research Station trials conducted in 2002
included:
1. The CPT Variety Trial under the overall coordination of Bob Halt. The trial included 37 entries consisting of 24 released varieties (including new releases from other states), 13 advanced experimental lines from our program, and one experimental line from Nebraska. This trial was also grown at 13 other sites in South Dakota.
Prior to cultivar release, promising elite lines must be grown in the CPT Variety Trial for 3
years to accurately measure potential performance across a range of environmental conditions. Performance of 2002 CPT entries is given in Tables 1 and 2.
2. The South Dakota Advanced Yield Trial (AYT) with both hard red and hard white lines. The AYT nursery included 45 entries consisting of 38 advanced experimental lines and 7 checks. Twelve of the experimental lines have the white bran color. The AYT nurseries were also grown at six other sites in South Dakota
Each year. three to six superior experimental lines are selected from these nurseries and
Celllnll CrtJrJ$ And Soi1s
advanced to the CPT Variety Trial and the Northern Regional Testing Program.
3. Early-generation F 2-bulk populations, consisting of 185 different cross combinations. Undesirable F 2 populations are eliminated, based largely on visual observations, pedigree and parental characteristics, and bulk yield. Desirable F 2 populations are advanced lo the F 3 bulk nursery for further evaluation prior to head selection the following year.
Trial Conditions
The nurseries at Highmore were planted O. 75 inches deep into soybean cover with moist top soil on September 21, 2001. Plots were sprayed on April 26, 2002, with 5 quarts Ramrod per acre and in early May with 1.5 pints Bronate per acre Yield and agronomic data are presented in Tables 1 and 2 for the Crop Performance Trial.
Acknowledgements
Each year. 600 to 800 new cross combinations are made and 600 to 800 new experimental lines are developed by the winter wheat breeding program. In addition to the excellent support of our wheat pathology programs (small grains pathology and virology), the solid and consistent financial support from the South Dakota Wheat Commission and the South Dakota Crop Improvement Association are vitally important to ensuring continued availability of improved winter wheat varieties for producers in South Dakota.
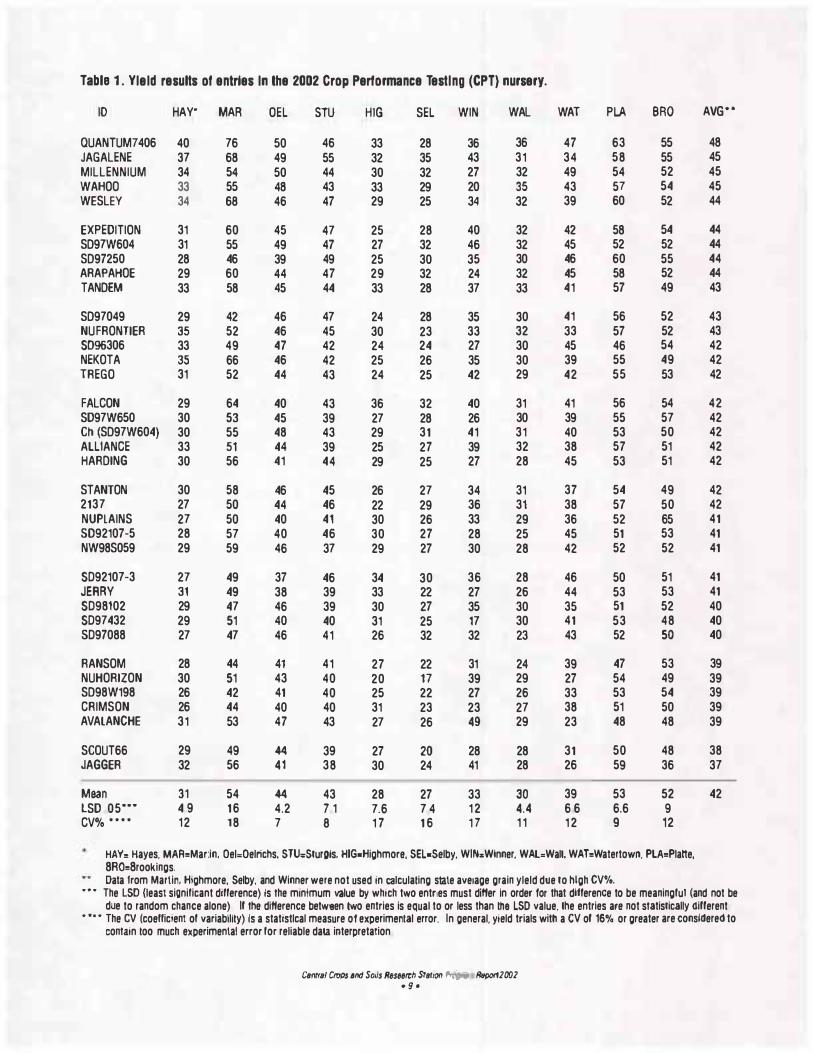
Tabla 1 . Yleld results of entries In the 2002 Crop Performance Testing (CPT) nursery.
IQ HAY" MAR OEL STU HIG SEL WIN WAL WAT PLA BRO AVG••
QUANTUM? 406 40 76 50 46 33 28 36 36 47 63 55 48 JAGALENE 37 68 49 55 32 35 43 31 34 58 55 45 MILLENNIUM 34 54 50 44 30 32 27 32 49 54 52 45 WAHOO 33 55 48 43 33 29 20 35 43 57 54 45 WESLEY 34 68 46 47 29 25 34 32 39 60 52 44
EXPEDITION 31 60 45 47 25 28 40 32 42 58 54 44 SD97W604 31 55 49 47 27 32 46 32 45 52 52 44 SD97250 28 46 39 49 25 30 35 30 46 60 55 44 ARAPAHOE 29 60 44 47 29 32 24 32 45 58 52 44 TANDEM 33 58 45 44 33 28 37 33 41 57 49 43
SD97049 29 42 46 47 24 28 35 30 41 56 52 43 NU FRONTIER 35 52 46 45 30 23 33 32 33 57 52 43 $096306 33 49 47 42 24 24 27 30 45 46 54 42 NEKOTA 35 66 46 42 25 26 35 30 39 55 49 42 TREGO 31 52 44 43 24 25 42 29 42 55 53 42
FALCON 29 64 40 43 36 32 40 31 41 56 54 42 SD97W650 30 53 45 39 27 28 26 30 39 55 57 42 Ch (SD97W604) 30 55 48 43 29 31 41 31 40 53 50 42 ALLIANCE 33 51 44 39 25 27 39 32 38 57 51 42 HARDING 30 56 41 44 29 25 27 28 45 53 51 42
STANTON 30 58 46 45 26 27 34 31 37 54 49 42 2137 27 50 44 46 22 29 36 31 38 57 50 42 NUPLAINS 27 50 40 41 30 26 33 29 36 52 65 41 5092107-5 28 57 40 46 30 27 28 25 45 51 53 41 NW98S059 29 59 46 37 29 27 30 28 42 52 52 41
$092107-3 27 49 37 46 34 30 36 28 46 50 51 41 JERRY 31 49 38 39 33 22 27 26 44 53 53 41 $098102 29 47 46 39 30 27 35 30 35 51 52 40 $097432 29 51 40 40 31 25 17 30 41 53 48 40 5097088 27 47 46 41 26 32 32 23 43 52 so 40
RANSOM 28 44 41 41 27 22 31 24 39 47 53 39 NUHORIZON 30 51 43 40 20 17 39 29 27 54 49 39 SD98W198 26 42 41 40 25 22 27 26 33 53 54 39 CRIMSON 26 44 40 40 31 23 23 27 38 51 50 39 AVALANCHE 31 53 47 43 27 26 49 29 23 48 48 39
SCOUT66 29 49 44 39 27 20 28 28 31 50 48 38 JAGGER 32 56 41 38 30 24 41 28 26 59 36 37
Mean 31 54 44 43 28 27 33 30 39 53 52 42 LSD 05··· 4 9 16 4.2 7 1 7.6 7 4 12 4.4 6 6 6.6 9 CV% •••• 12 18 7 8 1 7 16 17 11 12 9 12
HAY,. Hayes. MAA=Martin. Oel::Oelrichs, STU"Sturgts, HIG•Highmore. SEL•Selby. WIN .. Wlnner. WAL=Wall. WAT=Watertown. PlA=Platte, 8R0=8rookings. Data from Martin, Highmore. Selby, and Winner were not used in calculating slate average grain yleld due to high CV%.
• • • The LSD (least significant difference) Is the minimum value by which two entries must differ In order tor that difference to be meaningful (and not be due to random chance alone) It the difference between two entries is equal to or less than tile LSD value. lhe entries are not statistically 4itterent
• • • • The CV (coefficient of variablllty) Is a statistlcal measure o1 experimental error. In general, yield trials with a CV ot 16% or greater are considered to contain too much experimental error for reliable dai.a interpretation
C8nm11 Crops and Soils Resee�h $t81i()(I � R'1P()f12002
• 9 •
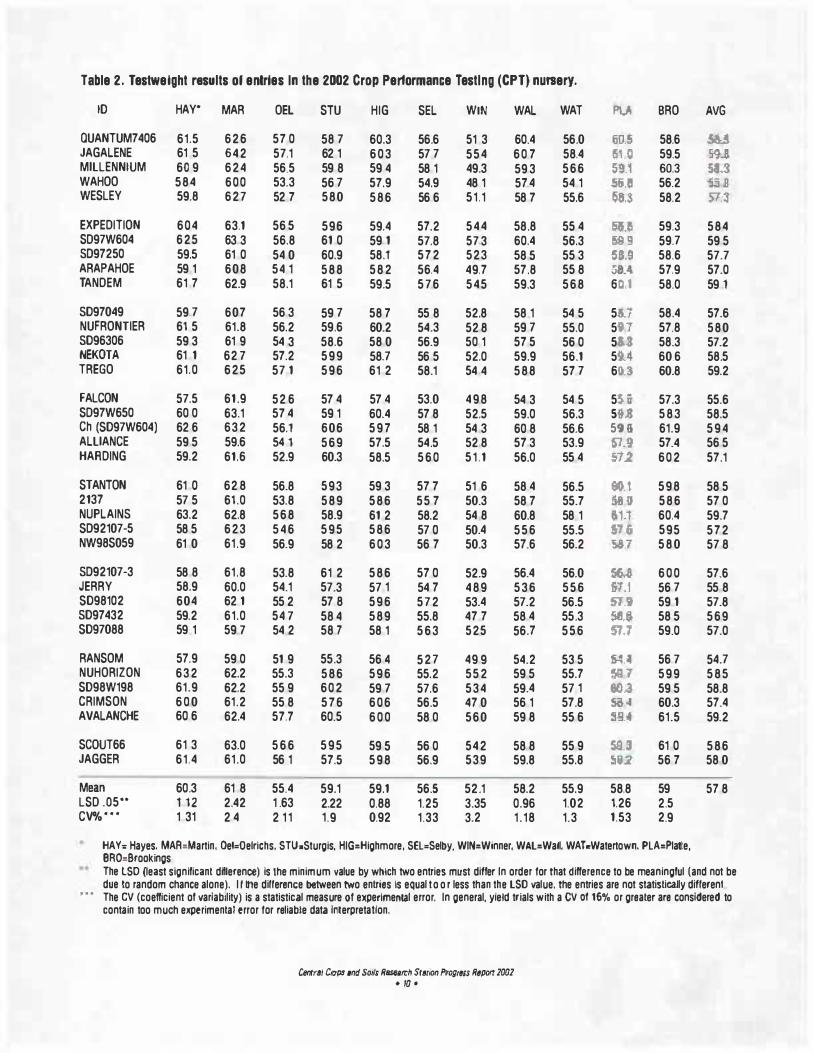
Table 2. Testwetght results of entries In the 2002 Crop Performance Testing (CPT) nursery.
10 HAY* MAR OEL STU HIG SEL WIN WAL WAT � BRO AVG
0UANTUM7406 61.5 626 57 0 58 7 60.3 56.6 51 3 60.4 56.0 fill� 58.6 !a.! JAGALENE 61 5 642 57.1 62 1 603 57 7 554 60 7 58.4 6, a 59.5 SU MILLENNIUM 60 9 624 56.5 59 8 59 4 58 1 49.3 59.3 566 59.1 60.3 M.3 WAHOO 584 600 53.3 56 7 57.9 54.9 48 1 57.4 54 1 5iU 56.2 i:i 1! WESLEY 59.8 627 52 7 580 586 56 6 51.1 58 7 55.6 �8.3 58.2 )7.3
EXPEDITION 604 63.1 56 5 596 59.4 57.2 544 58.8 55 4 Sl.6 59.3 584 SD97W604 625 63 3 56.8 61 0 59 1 57.8 57.3 60.4 56.3 !9.9 59.7 59 5 5097250 59.5 61 0 54 0 60.9 58.l 572 523 58 5 55 3 58.9 58.6 57.7 ARAPAHOE 59 1 608 54 1 588 582 56.4 49.7 57.8 55 8 58.4. 57.9 57.0 TANDEM 61 7 62.9 58.1 61 5 59.5 576 545 59.3 568 SC.I 58.0 59 1
5097049 59 7 607 56 3 59 7 58 7 55 8 52.8 58 1 54 5 511.r' 58.4 57.6 NUFRONTIER 61 5 61.8 56.2 59.6 60.2 54.3 52 8 59 7 55.0 5,1 57.8 580 5096306 59 3 61 9 54 3 58.6 58 0 56.9 50 1 57 5 56 0 5&3 58.3 57.2 NEKOTA 61 1 62 7 57.2 599 58.7 56 5 52.0 59.9 56.1 59..4 60.6 58.5 TREGO 61.0 625 57 1 596 61 2 58.1 54 4 588 57 7 60.3 60.8 59.2
FALCON 57.5 61.9 52 6 57 4 57 4 53.0 498 54 3 54 5 5-i� 57.3 55.6 SD97W650 60 0 63.1 57 4 59 1 60.4 57 8 52.5 59.0 56.3 SU 583 58.5 Ch ($097W604) 62 6 632 56.l 606 597 58 1 54 3 60 8 56.6 59 Ii 61.9 594 ALLIANCE 59 5 59.6 54 1 569 57.5 54.5 52 8 57 3 53.9 51-� 57.4 56 5 HARDING 59.2 61.6 52.9 60.3 58.5 560 51 .1 56.0 55 4 51.2. 602 57.1
STANTON 61 0 62�8 56.8 593 59 3 57 7 51 6 58 4 56.5 6tll 598 58 5 2137 57 5 61.0 53.8 589 586 55 7 50.3 58 7 55.7 Iii IJ 586 57 0 NUPLAIN5 63.2 62.8 568 58.9 61 2 58.2 54 8 60.8 58 1 611 60.4 59.7 $092107-5 58 5 623 546 595 586 57 0 50.4 556 55.5 fi g 595 572 NW98S059 61 0 61.9 56.9 58 2 603 56 7 50.3 57.6 56.2 i57 580 57 8
5092107-3 58 8 61.8 53.8 61 2 586 57 0 52.9 56.4 56.0 :56..B 600 57.6 JERRY 58.9 60.0 54.1 57.3 57 1 54 7 489 536 556 &'1.1 56 7 55 8 $098102 604 62 1 55 2 57 8 596 572 53.4 57.2 56.5 51.9 59 1 57.8 5097432 59.2 61.0 54 7 58 4 589 55.8 47 7 58 4 55.3 JB.8 58 5 569 $097088 59 1 59 7 54 2 58 7 58 1 563 525 56.7 556 JU 59.0 57.0
RANSOM 57.9 59 0 51 9 55.3 56 -4 527 49.9 54.2 53 5 �� 56 7 54.7 NUHORIZON 632 62.2 55.3 586 596 55.2 552 59 5 55.7 srn 599 585 SD98W198 61.9 62.2 55 9 602 59 7 57.6 534 59.4 57 1 eGJ 59 5 58.8 CRIMSON 600 61.2 55 8 576 606 56.5 47 0 56 1 57.8 sa..a 60.3 57.4 AVALANCHE 60 6 62.4 57.7 60.5 600 58 0 560 59 8 55 6 !9.il 61.5 59.2
SCOUT66 61 3 63.0 566 595 59 5 56 0 542 58 8 55 9 59.9 61 0 586 JAGGER 61.4 61.0 56 1 57.5 598 56.9 539 59.8 55.8 !ID.2 56 7 58 0
Mean 60.3 61 8 55.4 59.1 59.1 56.S 52.1 58.2 55.9 58.8 59 57 8 LSD .o5·. 1 12 2.42 1 .63 2.22 0.88 1.25 3.35 0.96 1.02 1.26 2.5 CV%••• 1 31 2 4 2 11 1.9 0.92 1.33 3.2 1.18 1.3 1.53 2.9
HAY: Hayes. MAA=Martin, Oel=Oelrichs. STUaSturgis, HIG=Highmore, SEL=Selby, WIN=Winner, WAL=Wall. WATcWatertown. PLA=Platte, 8R0=8rookings The LSD (least significant difference) is the minimum value by which two entries must differ In order tor that difference to be meaningful (and not be
. . . due to random chance alone). I I trte difference between two entries Is equal to o r less than the LSD value. the entries are not statistically different The CV (coefficient of variability) is a statistical measure ot experlmental error. In general. yleld trials with a CV ot 16% or greater are considered to contain too much el(perimental error tor reliable data ln1erpretallon.
C6ntr.t/ C/Tlps 1nd Soils R8Sl!ttrh Station Prog1,ss Raport 2002
• 10 •
2002 Report
Oat Research
Lon Hall South Dakota State University
Yield, yield stability. and test weight are the most important characteristics associated with the iden· tification and eventual release of oat varieties.
Several additional factors contribute to expression of these primary characteristics. Resistance to lodging. Barley Yellow Dwarf Virus (BYDV). stem rust, and crown rust all affect yield potential and test weight. Other traits that are considered prior to release include hull, protein, and oil percentages, along with maturity, hull color. plant height, and the hulled/hulless trait.
Consumers want different characteristics for specific needs. Millers generally want high protein oats. Livestock producers prefer taH varieties with high levels of protein and oil. The racehorse industry desires a high quality. white· hulled. or hulless oat variety. A considerable quantity of oats is shipped out of state as racehorse feed and seed for forage oats. Tall varieties, such as Troy. are popular forage oats.
Buff. a hulless oat released in 2002, has high yield potential, good test weight, and moderate crown rust and BYD resistance. Reeves, a white-hulled oat also released in 2002, is an early maturing, high yielding. excellent quality oat with good disease resistance; it may replace the popular variety Don,
The main emphasis of the oat breeding programs is development of white-hulled varieties. The racehorse industry desires white hulled varieties, and hull color is not a concern for livestock producers or millers. Recently there also has been interest in hulless oats for feed and other specialty uses; therefore, increased effort has gone into developing a high oil hulless oat.
Plant breeding is a long drawn-out process. The bulk breeding method takes, on average, at least 10
years from initial cross lo variety release. This may be shortened 2 years by using the single seed descent method, which involves two extra generations in the greenhouse. Each year there are approximately 37,000 non-segregating plants and head rows observed in this program. In 2002, there were 4414 unique non-segregating lines yield tested and 6720 yield p)ots.
Data from regiona) nurseries provide valuable information for variety release and germplasm selection for crossing in our program. The TriState regional nursery is made up of 30 lines and 6 checks. The 30 lines are 10 advanced lines each from Minnesota, North Dakota, and South Dakota. The best lines are then entered in either lhe Uniform Early Nursery (UEO) or the Uniform Midseason Nursery (UMO) the following year.
The UEO is a regional nursery made up of 20 early maturing lines from breeding programs across the U.S. We entered five lines in the UEO in 2002. Out of these five, SD00843 and SD00731 ranked number one and two, respectively. for yield averaged over two South Dakota locations.
The UMO is made up of 32 advanced medium· and late-maturing lines. usually one to three lines {we had two lines) from each participating state and Canadian breeding programs. In the 2002 UMO, SD96024A averaged third in yield for the three South Dakota locations. On average, it out· yielded its nearest competitor, Killdeer, by 8 bushels on a 3-year average in the 2000-2002 South Dakota Standard Variety Oat Trials.
SD96024A has been increased with intent to release in 2004, pending approval of the South Dakota Crop Improvement Association release committee.
�·
. , , .
2002 Report
Spring Wheat Breeding
Karl D. Gtov,r and Ravlndra N. Dtvkots South Dakota State University
Our primary objective is lo improve agronomic. milling, and baking characteristics of spring wheat varieties that are well adapted to South Dakota.
Prior to the release of a new variety to growers, its advantageous features must be well documented. Characterization of material within the breeding program begins during the second growing season after a cross has been made.
Thousands of breeding lines, each representing a potential variety. are created yearly and are subject to removal from consideration based on I.heir susceptibility to disease and lack of agronomic prom· ise. Lines chosen for additional testing are more heavily scrutinized with each successive testing year. Therefore. the number of lines included in preliminary and advanced yield tests is relatively few compared to early generation tests.
Spring wheat production environments in our state can be dramatically different from year-to· year and even from location-to-location within a year. Unfortunately, this prevents varieties from being optimally adapted to all production environments and necessitates that preliminary and advanced yield tests be conducted in several environments throughout the state.
This station is one of eight locations used for testing material in our Advanced Yield Trial {AYT) test. Generally, breeding lines that do very wen over 2 or 3 years of consideration in our AYT test
Cenrr,t Creps and Soils
are the most likely to be released as varieties. Dry conditions at the Central Crops and Soils Research Station led us to abandon our AYT plots in 2002.
Consequently. they were not harvested.
1\venty·seven lines that appear to hold potential for varietal release are grown each year in our AYT test along with nine released varieties used for comparative purposes. Not all 27 entries are advanced to a second year of AYT testing. Table 1 presents yield and test weight observations collected from 10 experimental entries, along with check varieties, that were grown in both the 2001 and 2002 AYT tests.
Among these potential varieties. 503546 appears most promising as it has above-average yield potential. high test weight, moderate scab resist· ance. and a high level of leaf rust resistance (disease data not presented).
503641 and SD3623 also appear to hold potential, although SD3641 is only moderately resistant to leaf rust and SD3623 is susceptible (rust data not presented). Regrettably. this level of susceptibility will likely prevent SD3623 from ever being released. even though its yield potential is quite high.
We appreciate the financial support provided by the SDSU Plant Science Deparunent, South Dakota Wheat Commission, and South Dakota Crop Improvement Association.
Ith Srs11on P1ogrsss Re{)O(I 2002 • 12 •
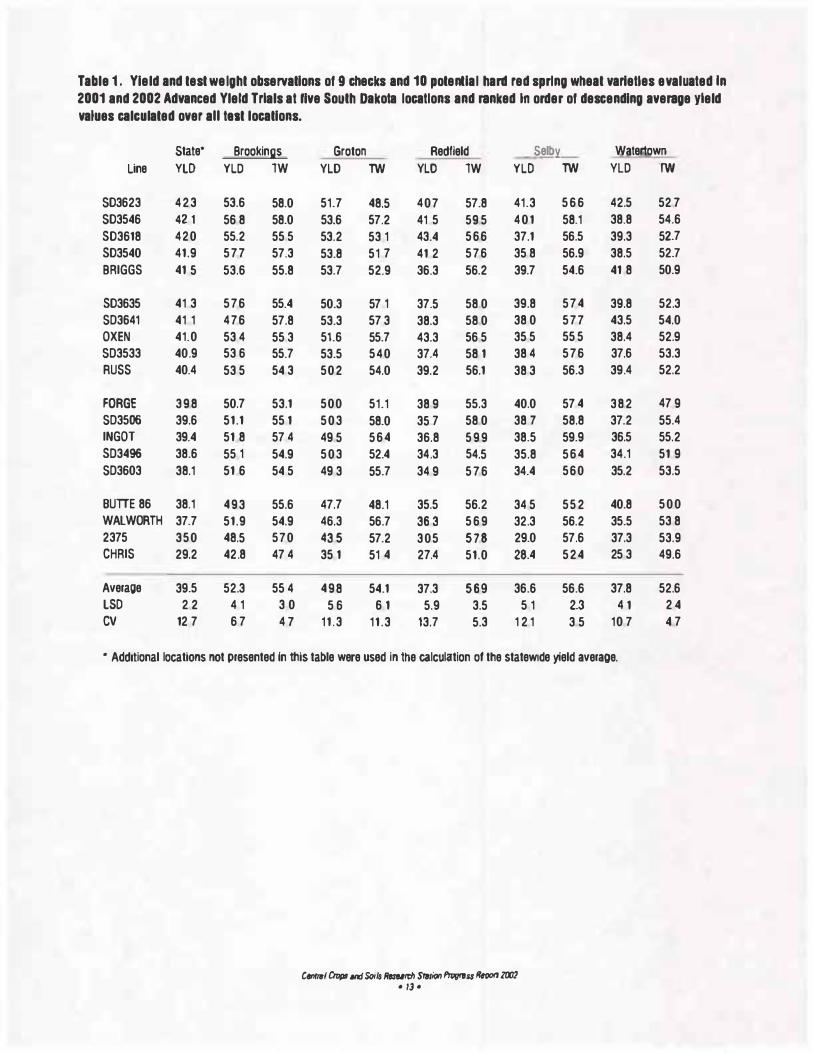
Table 1 . Yield and test weight observations of 9 checks and 10 potential hard red spring wheat varieties evaluated In 2001 and 2002 Advanced Yleld Trlals at five South Dakota locatlons and ranked In order or descending average yleld values calculated over au t11t locations.
State• Brookings Groton Redfield Selb:i Watertown
Line YLO YLD lW YLD lW YLO lW YLO lW YLD lW
$03623 423 53.6 58.0 51.7 48.5 407 57.8 41.3 566 42.5 52 7 $03546 42 1 56 8 58.0 53.6 57.2 41 5 59.5 401 58.1 38.8 54.6 503618 420 55.2 55 5 53.2 53 1 43.4 566 37.1 56.5 39.3 52.7 503540 41.9 577 57.3 53.8 51 7 41 2 576 35 8 56.9 38.5 52.7 BRIGGS 41 5 53.6 55.8 53.7 52.9 36.3 56.2 39.7 54.6 41 8 50.9
503635 41 3 576 55.4 50.3 57 1 37.5 58 0 39.8 574 39.8 52.3 $03641 41 1 476 57.8 53.3 57 3 38.3 58 0 38 0 577 43.5 54.0 OXEN 41.0 53 4 55 3 51.6 55.7 43.3 56 5 35 5 55 5 38.4 52.9 $03533 40.9 53 6 55.7 53.5 540 37.4 58 1 38 4 576 37.6 53.3 RUSS 40.4 53 5 54 3 502 54.0 39.2 56.1 38 3 56.3 39.4 52.2
FORGE 398 50.7 53.1 500 51.1 38 9 55.3 40.0 57 4 382 47 9 $03506 39.6 51.1 55 1 503 58.0 35 7 58 0 38 7 58.8 37.2 55.4 INGOT 39.4 51 8 57 4 49 5 564 36.8 599 38.5 59.9 36.5 55.2 503496 38.6 55 1 54.9 503 52.4 34.3 54.5 35.8 564 34.1 51 9 $03603 38.1 51 6 54 5 49 3 55.7 34 9 576 34.4 560 35.2 53.5
BUTTE 86 38.1 493 55.6 47.7 48.1 35.5 56.2 34 5 552 40.8 500 WALWORTH 37.7 51.9 54.9 46.3 56.7 36 3 569 32.3 56.2 35.5 53 8 2375 350 48.5 570 43 5 57.2 305 578 29.0 57.6 37.3 53.9 CHRIS 29.2 42.8 47 4 35 1 51 4 27.4 51.0 28.4 524 25 3 49.6
Average 39.5 52.3 55 4 498 54.1 37.3 569 36.6 56.6 37.8 52.6 LSD 2 2 4 1 3 0 5 6 6 1 5.9 3.5 5 1 2.3 4 1 24 CV 12 7 6 7 4 7 11.3 11.3 13.7 5.3 12 1 3 5 10 7 4 7
• Additional locations not presented In this table were used in the calculation ot the statewide yield average.
CftllT!II Crops lllld S</ils Ruu,rh Sr,,tion l'n)gttss R,pon 1002 • 13 •
2002 Report
Resistance of Sunflower Germplasm to the Red Sunflower Seed Weevil
Jsrry F. M/11,r and Kathleen A. Grady USDA·ARS, Northern Crop Science Laboratory, Fargo, N.D.
Plant Science Department. South Dakota State University, Brookings, S.D.
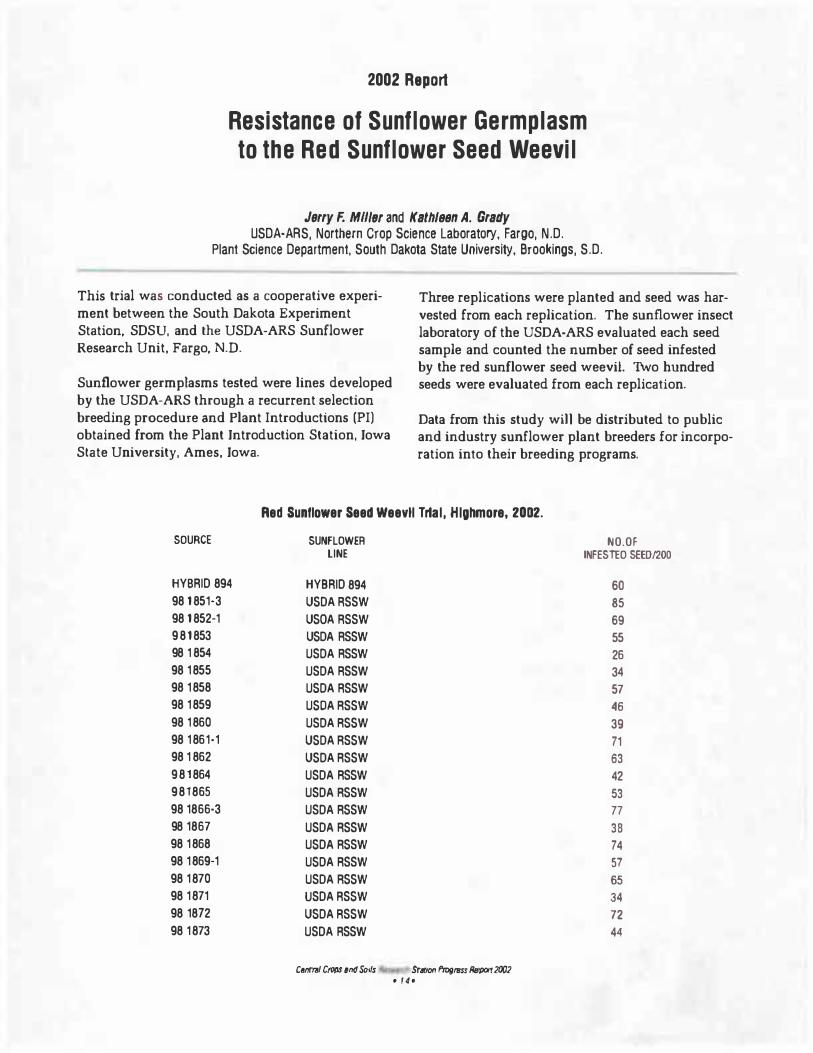
This trial was conducted as a cooperative experi· ment between the South Dakota Experiment Station, SDSU, and the USDA·ARS Sunflower Research Unit, Fargo, N.D.
Sunflower germptasms tested were lines developed by the USDA·ARS through a recurrent selection breeding procedure and Plant Introductions (PI) obtained from the Plant Introduction Station, Iowa State University, Ames. Iowa.
Three replications were planted and seed was harvested from each replication. The sunflower insect laboratory of the USDA·ARS evaluated each seed sample and counted the number of seed infested by the red sunflower seed weevil. 1\vo hundred seeds were evaluated from each replication.
Data from this study wiH be distributed to public and industry sunflower plant breeders for incorpo· ration into their breeding programs.
Red Sunflower Seed Weevtl Trlal, Highmore, 2002.
SOURCE SUNFLOWER NO.OF LINE INFESTI:O SEED/200
HYBRID 894 HYBRID 894 60 98 1851·3 USDA RSSW 85 98 1852·1 USOA RSSW 69 981853 USDA RSSW 55 98 1854 USDA RSSW 26 98 1855 USDA RSSW 34 98 1858 USDA RSSW 57 98 1859 USOA RSSW 46
98 1860 USDA RSSW 39 98 1861-1 USDA RSSW 71 98 1862 USDA RSSW 63 981864 USDA RSSW 42 981865 USDA RSSW 53 98 1866·3 USDA RSSW 77
98 1867 USDA RSSW 38 98 1868 USDA RSSW 74 98 1869·1 USDA RSSW 57 98 1870 USDA RSSW 65
98 1871 USDA RSSW 34
98 1872 USDA RSSW 72 98 1873 USDA RSSW 44
CMtral CtCfJS and Sc,ls St.tt1011 Progress Repcrt 2002 • r4.
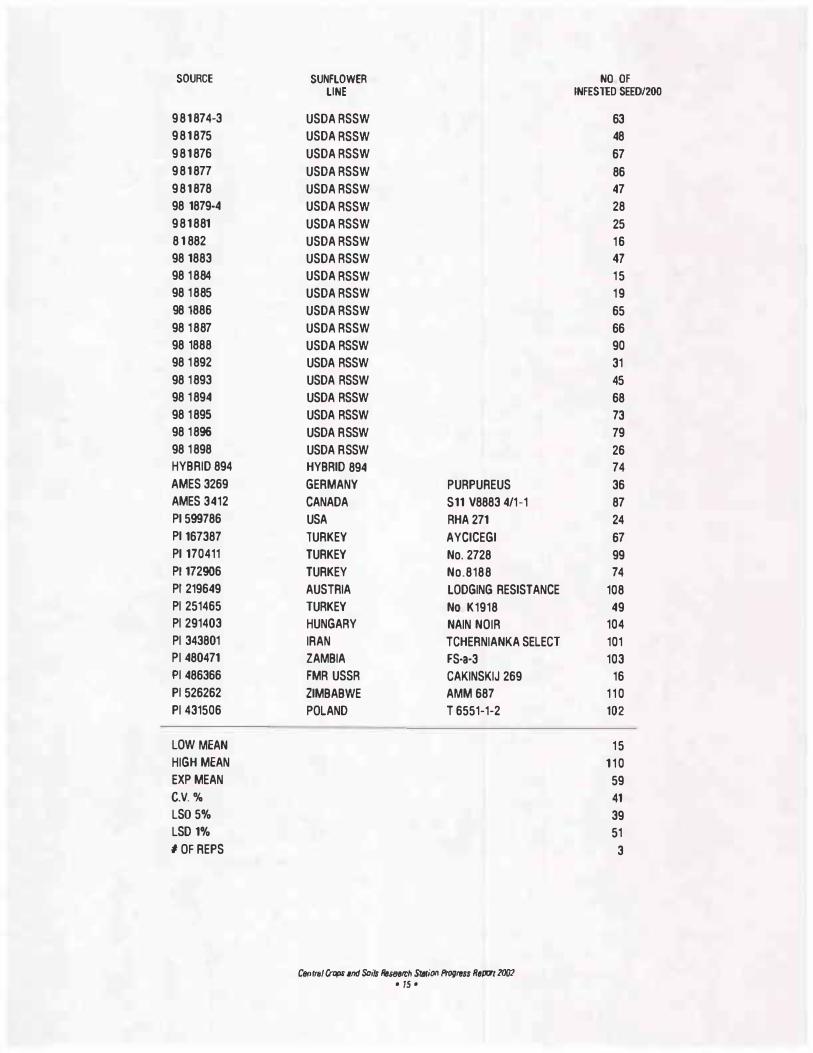
SOURCE
981874-3 981875 981876 981877 981878 98 1879-4 981881 81882 98 1883 98 1884 98 1885 98 1886 98 1887 98 1888 98 1892 98 1893 98 1894 98 1895 98 1896 98 1898 HYBRID 894 AMES 3269 AMES 3412 Pl 599786 Pl 167387 Pl 170411 P1 172906 Pl 219649 Pl 251465 Pl 291403 Pl 343801 Pl 480471 P1 486366 P1 526262 Pl 431506
LOW MEAN HIGH MEAN EXP MEAN C.V. %
LS0 5% LSD 1% I OF REPS
SUNFLOWER LINE
USDA RSSW USDA RSSW USDA RSSW USDA RSSW USDA RSSW USDA RSSW USDA RSSW USDA RSSW USDA RSSW USDA RSSW USDA RSSW USDA RSSW USDA RSSW USDA RSSW USDA RSSW USDA RSSW USDA RSSW USDA RSSW USDA RSSW USDA RSSW HYBRID 894 GERMANY PURPUREUS CANADA $11 V8883 4/1-1 USA RHA 271 TURKEY AYCICEGI TURKEY No. 2728 TURKEY No.8188 AUSTRIA LODGING RESISTANCE TURKEY No K1918 HUNGARY NAIN NOIR IRAN TCHERNIANKA SELECT ZAMBIA FS·a·3 FMR USSR CAKINSKIJ 269 ZIMBABWE AMM 687 POLAND T 6551-1-2
Central CrOfJ$ and Soils R11s,wth Sr4tiOll Prog111ss R11pcrt 20()2 • 15 •
NO OF INFES'TED SEE0/200
63 48 67 86 47 28 25 16 47
15 19 65 66 90 31 45 68 73 79 26 74 36 87 24 67 99 74
108 49
104 101 103 16
110 102
15 110 59 41 39 51 3
2002 Report
Weed Control
L. Wrags, D. D11neke, o. VO$, and B. Rook South Dakota State University
The Highmore station provides a strategic location for several weed control field evaluation and demonstration trials. The plots provide data for the statewide Extension weed control program and are used for field tours.
The station has been the primary site for evaluat· ing downy brome (cheatgrass) control in winter wheat. A block is devoted to maintaining the weed infestation and provides the winter wheat crop for comparing herbicides, including experimental products.
Comparisons of weed control programs in no-till cropping systems have been expanded.
2002 Projects
Projects initiated include cheatgrass and wild oat control in winter wheat, experimental Clearfield wheat, sunflower, herbicide-resistant sunflower,
wild oat in spring wheat, edible bean, soybean, grain sorghum, oats, and safflower.
Fall and winter precipitation was very limited. Cheatgrass emergence was primarily in the spring.
Drought conditions impacted crops and herbicide performance in 2002. Row crop emergence was uneven and delayed. Postemerge treatments could not be timed properly.
Wild oat tests in winter wheat and spring wheat could not be evaluated due to dessication from severe moisture stress. Alfalfa no·tilJ burndown was also affected; the normal stage for optimum control produced poor results.
Only early season plants had sufficient moisture for active growth. Weed control evaluations are reported and plots were harvested where there was sufficient crop to harvest yield.
NOTE: Data reported in this publication are results from field tests that include labeled product uses, experimental products or experimental rates, combinations, or other unlabeled uses for herbicide products. Tradenames of products used are listed; there frequently are other brand products available in the market. Refer to the appropriate weed control fact sheet available from county Extension offices for herbicide recommendations.
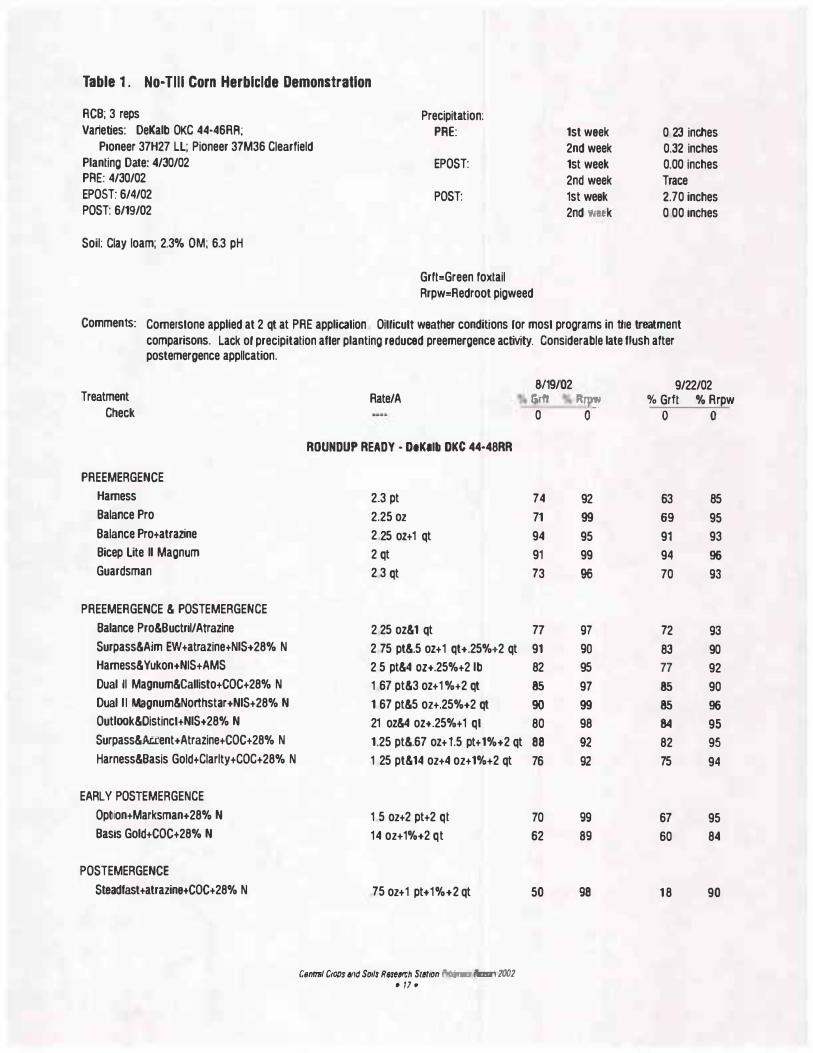
Table 1 . No· Tiii Corn Herbicide Demonstration
RCB; 3 reps Varieties: DeKalb OKC 44·46RA;
Pioneer 37H27 LL; Pioneer 37M36 Clearfield Planting Date: 4/30/02 PAE: 4/30/02 EPOST: 6/4/02 POST: 6/19/02
Soil: Clay loam; 2.3% OM; 6.3 pH
Precipitation: PRE:
EPOST:
POST:
Grtt=Green foxtail Rrpw=Redroot pigweed
1st week 0 23 inches 2nd week 0.32 inches 1st week 0.00 inches 2nd week Trace 1st week 2.70 inches 2nd imek 0 00 inches
Comments: Cornerstone applled at 2 qt at PRE application Oitticutt weather conditions ror most programs in tile treatment comparisons. Lack or precipitation after planting reduced preemergence activity. Considerable late flush after postemergence appllcation.
Treatment Check
PRE EMERGENCE Harness Balance Pro
Balance Pro+atrazine Bicep lite II Magnum Guardsman
PREEMERGENCE & POSTEMERGENCE
Balance Pro&Buctril/Atrazine
Surpass&Aim EW+atrazine+NIS+28% N Harness& Yukon+NIS+AMS
Dual II Magnum&callisto+COC+28% N Dual II Magnum&Northstar+NIS+28% N Outlook&Oistinct+NIS+28% N
Surpass&ment+Atrazine+COC+28% N
Harness&Basis Gold+Clarlty+COC+28% N
EARLY POSTEMERGENCE
Option+Marksman+28% N Basts Gold+COC+28% N
POSTEMERGENCE
Steadfast+atrazine+COC+28% N
Rate/A
ROUNDUP READY • DtKalb DKC 44·48RR
2.3 pt
2.25 oz 2 25 oz+1 qt 2 qt 2 3 qt
2 25 oz&1 qt 2 75 pt&.5 oz+ 1 qt+.25%+2 qt 2 5 pt&4 OZ+.25%+2 lb 1 67 pt&3 oz+ 1 %+2 qt 1 67 pt&5 oz+.25%+2 qt 21 oz&4 oz+.25%+1 qt
1.25 pt&.67 oz+ 1.5 pt+ 1%+2 qt 1 25 pt&14 oz+4 oz+1%+2 qt
1 5 oz+2 pt+2 qt 14 oz+1%+2 qt
75 oz+ 1 pt+ 1 %+2 qt
Csnrml C10{)s 41ld Soils Re:e611:h Station 1'11,..,., i1r:m120()2 " 17 "
8/19/02 9/22/02 6rff R!r:w. o/o Grtt % Rrpw 0 0 0 0
74 92 63 85 71 99 69 95 94 95 91 93 91 99 94 96 73 96 70 93
77 97 72 93
91 90 83 90 82 95 77 92 85 97 85 90 90 99 85 96 80 98 84 95 88 92 82 95
76 92 75 94
70 99 67 95 62 89 60 84
50 98 18 90
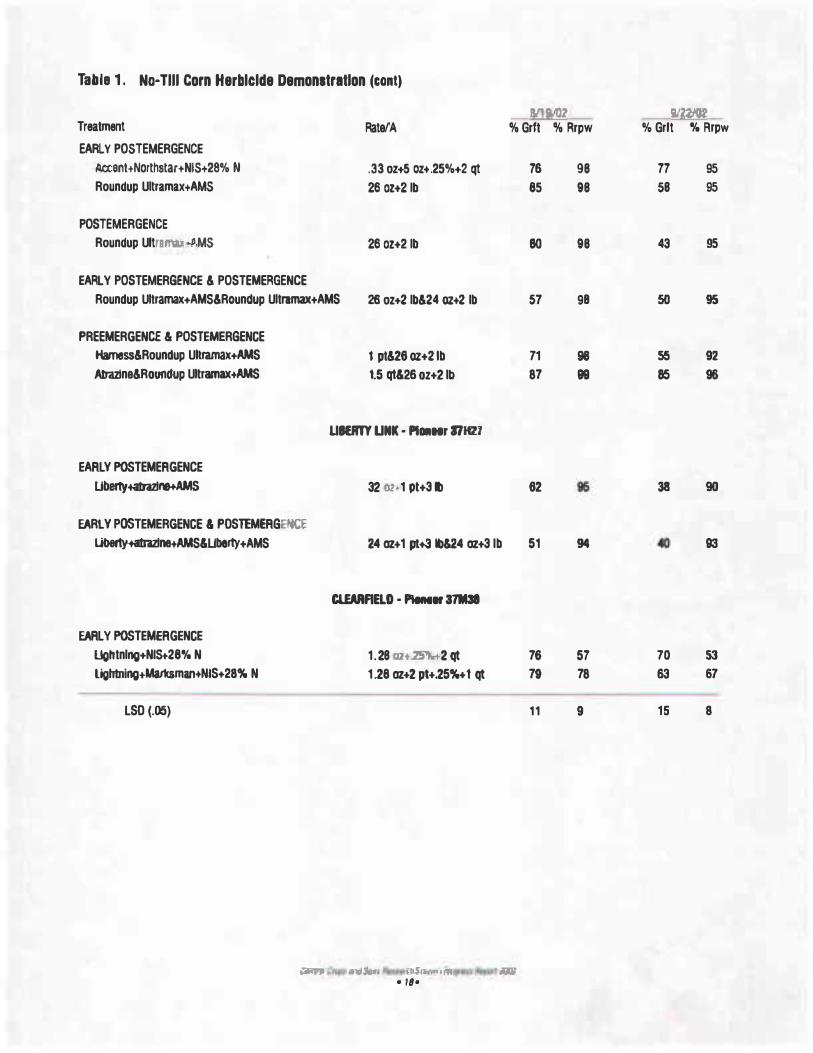
Table 1 . No· Tiii Corn Herbicide Demonstration (cont)
lll11'1l2 Treatment Rate/A o/o Grft o/o Rrpw
EARLY POSTEMERGENCE Ao:ent+Northstar+NIS+28% N .33 oz+S oz+ .25%+2 qt 76 Roundup Ultramax+AMS 26 oz+2 lb 85
POSTEMERGENCE Roundup Uftmffl,b • O,MS 26 oz+2 lb 80
EARLY POSTEMERGENCE & POSTEMERGENCE Roundup Ultramax+AMS&Roundup Ultramax+AMS 26 oz+2 lb&24 oz+2 lb 57
PREEMERGENC.E & POSTEMERGENCE Harness&Roundup Uttrarnax+AMS Atrazlne&Roundup Ultramax+AMS
EARLY POSTEMERGENCE Uberty+atrazlne+AMS
EARLY POSTEMERGENCE & POSTEMERGEtea Libefty.atrazine+AMS&Uberty+AMS
EARLY POSTEMERGENCE Ughtnlng+NIS+28% N Lightning+Ma.rksman+NIS+28% N
LSO (.05)
1 pt&26 oz+2 tb 71
1.5 qt&26 oz+2 lb 87
UIERTY UNK • PfDIINr 17HZ1
32 11!" 1 pt+3 lb 62
24 oz+ 1 pt+3 lb&24 oz+3 lb 51
Cl.EARAELO • Pllnl• 37lUI
1.28 ga.J:i\..t2 qt 76
1 .28 oz+2 pt+.25%+ t qt 79
11
r� •ielii • 111s1111 ., • RJ:
• 18•
98
98
98
98
98 99
94
57 78
9
!l/�iilt % Grft % Rrpw
77 95 58 95
43 95
50 95
55 92
85 96
38 90
93
70 53
63 67
15 8
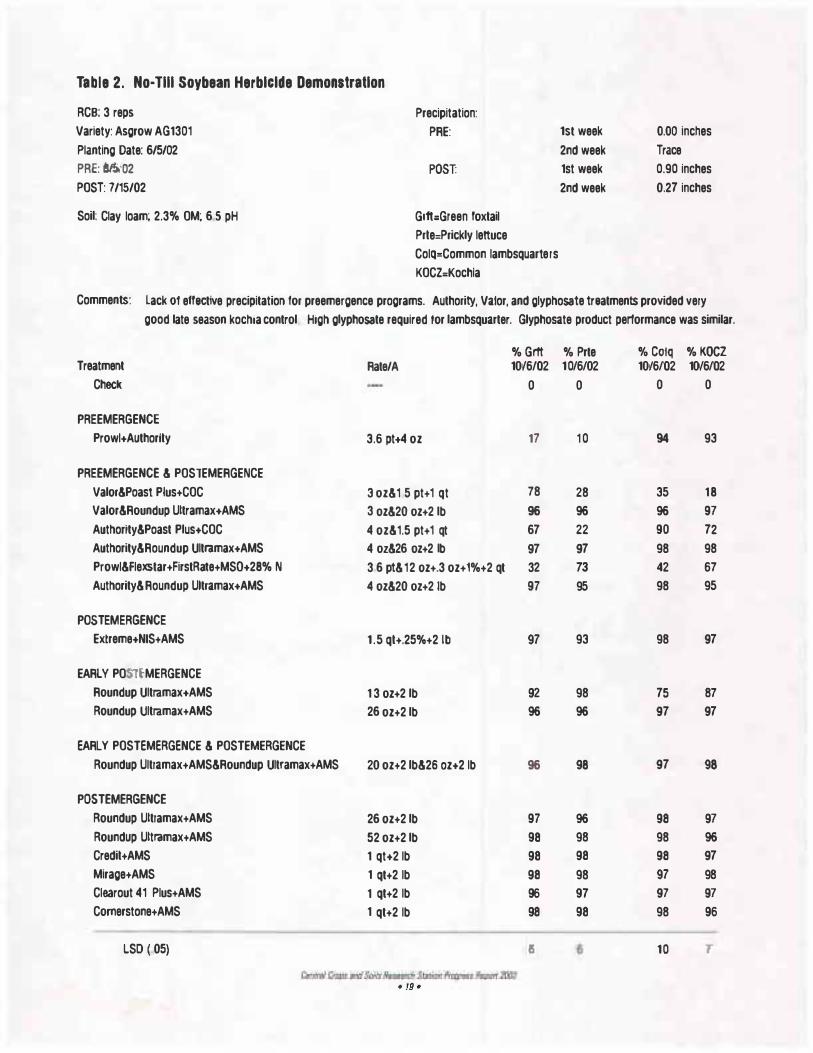
Table 2. No· Tiii Soybean Herbicide Demonstration
RCB: 3 reps
Variety: Asgrow AG1301
Planting Date: 6/5/02
PRE: tll!i,i02
POST: 7/15/02
Soil: Clay loam; 2.3% OM; 6 s pH
Precipitation:
PRE:
POST:
Gr1t:Green foxtail
Prte=Prickly lettuce
ColQ=Common lambsquarters
KOCZ:Kochla
1st week
2nd week
1st week
2nd week
o.oo inches
Trace
0.90 inches
0.27 inches
Comments: Lack 01 effective precipitation tor preemergence programs. Authority, Valor, and glyphosate treatments provided very
good late season kochia control High glyphosate required tor lambsquarter. Glyphosate product performance was similar.
Treatment
Check
PREEMERGENCE
Prowl+Authortty
PREEMERGENCE & POSTEMERGENCE
Valor&Poast Plus+COC
Valor&Roundup Ultramax+AMS
Authority&Poast Plus+COC
Authority&Roundup Ultramax+AMS
Prowl&flexstar+FirstRate+MS0+28% N
Authority&Roundup Ultramax+AMS
POSTEMERGENCE
Extreme+NIS+AMS
EARLY POSTtMERGENCE
Roundup Ultramax+AMS
Roundup Ultramax+AMS
EARLY POSTEMERGENCE & POSTEMERGENCE
Roundup Ultramax+AMS&Roundup Ultramax+AMS
POSTEMERGENCE
Roundup Ultramax+AMS
Roundup Ultramax+AMS
Credit+AMS
Mirage+AMS
Clearout 41 Plus+AMS
Comerstone+AMS
LSD ( 05)
Rate/A % Gr1t % Prte 10/6/02 10/6/02
0 0
3.6 pt+4 oz 17
3 oz&1 5 pt+1 qt 78
3 oz&20 oz+2 lb 96
4 oz&1.5 pt+1 qt 67
4 oz&26 oz+2 lb 97
3�6 pt&12 oz+.3 oz+1%+2 qt 32
4 oz&20 oz+2 lb 97
1.5 qt+.25%+2 lb
13 oz+2 lb
26 oz+2 lb
20 oz+2 lb&26 oz+2 lb
26 oz+2 lb
52 oz+2 lb
1 qt+2 lb
1 qt+2 lb
1 qt+2 lb
1 qt+2 lb
97
92
96
96
97
98
98
98
96
98
6
10
28 96 22
97
73
95
93
98 96
98
96 98 98
98 97
98
% Colq % KOCZ 10/6/02 10/6/02
0 0
94
35
96 90
98 42 98
98
75
97
97
98
98 98
97
97
98
10
93
18
97
72
98 67 95
97
87 97
98
97
96 97
98 97
96
T
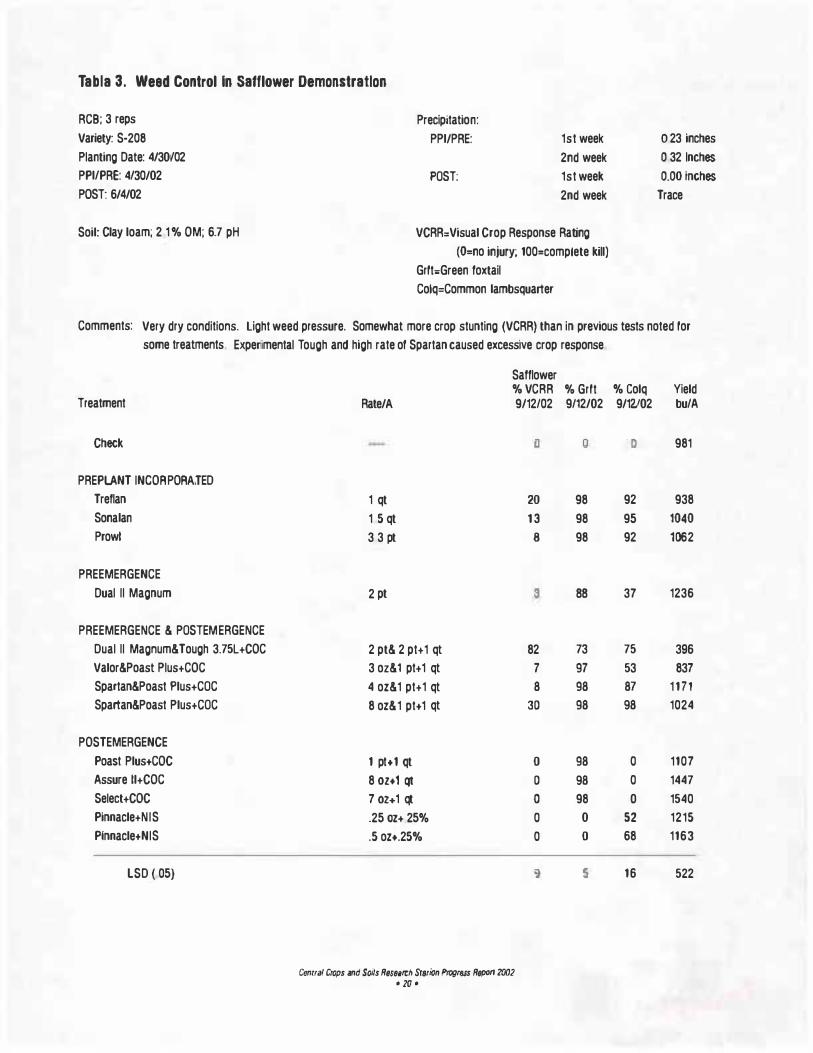
Tabla 3. Wead Control in Safflower Demonstration
RCB: 3 reps Precipitation: Variety: S·208 PPI/PRE: 1st week O 23 inches Planting Date: 4/30/02 2nd week o 32 Inches PPIIPRE: 4130/02 POST: 1st week o.oo inches POST: 6/4/02 2nd week Trace
Soil: Clay loam; 2 1% OM; 6.7 pH VCRR=Visual Crop Response Rating (O=no injury; 100=comptete kill)
Grtt=Green foxtail Colq=Common lambsquarter
Comments: Very dry conditions. Light weed pressure. Somewhat more crop stunting (VCRR) than in previous tests noted tor some treatments. Experimental Tough and high rate of Spartan caused excessive crop response
Treatment
Check
PREPLANT INCOAPOAATED Treflan
Sona Ian Prowl
PREEMERGENCE
Dual II Magnum
PREEMERGENCE & POSTEMERGENCE Dual II Magnum&Tough 3.75L+COC Valor&Poast Plus+COC Spartan&Poast Plus+COC Spartan&Poast Plus+COC
POSTEMERGENCE
Poast Plus+COC Assure ll+COC
Select+COC Pinnacle+NIS Plnnacle+NIS
LSD ( 05)
Safflower % VCRR
Rate/A 9/12/02
u
1 qt 20
1 5 qt 13
3 3 pt 8
2 pt a
2 pt& 2 pt+1 qt 82 3 oz&1 pt+1 qt 7
4 oz&1 pt+1 qt 8
8 oz& 1 pt+ 1 qt 30
1 pt+1 Qt 0
8 OZ+1 Qt 0
7 02+1 qt 0
.25 OZ+ 25% 0
.5 oz+.25% 0
9
Cemra/ Crops and Soils Res,111:h Srsrion Progl'IJSs Report 2002 • 20 •
% Grtt 9/12/02
0
98
98 98
88
73 97
98
98
98
98
98 0 0
s
% Colq Yield 9/12/02 bu/A
' Q 981
92 938
95 1040
92 1062
37 1236
75 396 53 837 87 1171 98 1024
0 1107
0 1447
0 1540 52 1215 68 1163
16 522
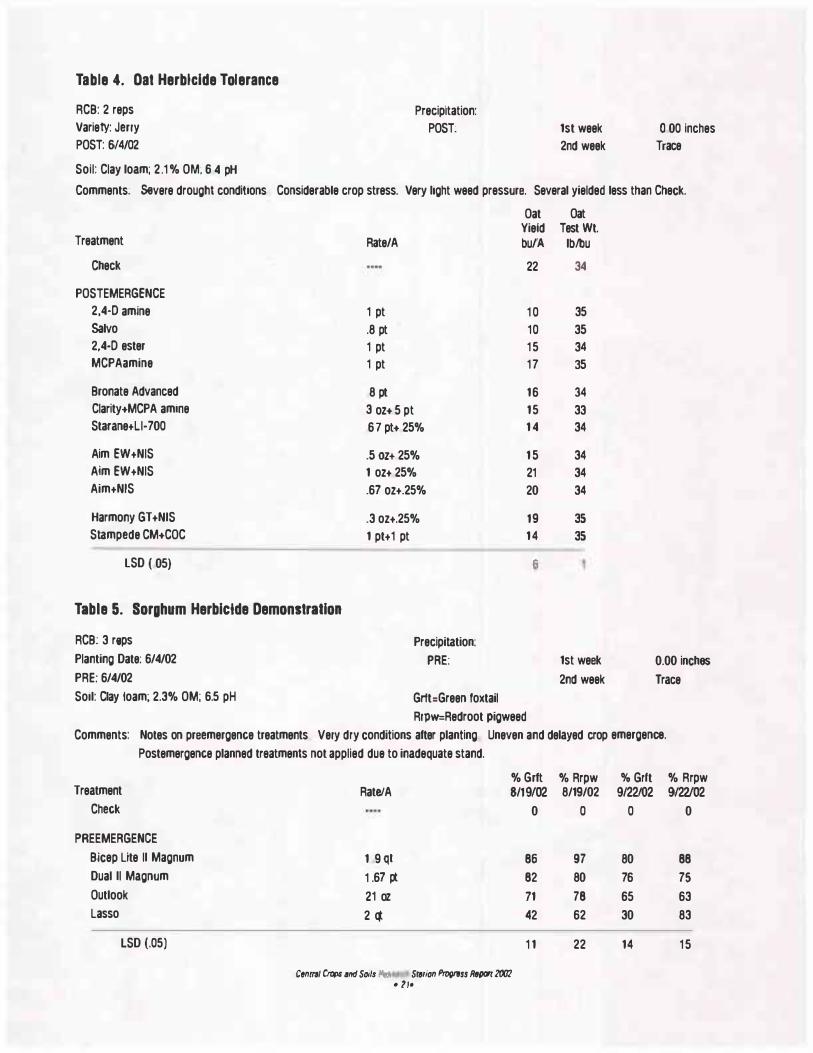
Table 4. Oat Herbicide Tolerance
RCB: 2 reps Variety: Jerry POST: 6/4/02
Soil: Clay loam; 2.1 % OM; 6 4 pH
Precipitation: POST: 1st week
2nd week O 00 inches
Trace
Comments: Severe drought conditions Considerable crop stress. Very light weed pressure. Several yielded less than Check.
Oat Oat Yield Test Wt.
Treatment Rate/A bu/A lb/bu
Check 22 34
POSTEMERGENCE 2,4·0 amine Salvo 2,4·0 ester MCPAamine
Bronate Advanced Clarity+MCPA amine Starane+LI· 700
Aim EW+NIS Aim EW+NIS Aim+NIS
Harmony GT +NIS Stampede CM+COC
LSD ( 05)
Table 5. Sorghum Herbicide Demonstration
RCB: 3 reps
Planting Date: 6/4/02
PRE: 6/4/02 Soil: Clay loam; 2.3% OM; 6.5 pH
1 pt 10 .8 pt 10 1 pt 15 1 pt 17
8 pt 16 3 oz+ 5 pt 15 67 pt+ 25% 14
.5 OZ+ 25% 15 1 oz+ 25% 21 .67 oz+.25% 20
.3 oz+.25% 19 1 pt+ 1 pt 14
6
Precipitation: PRE:
Gr1t:Green foxtail RrpW=Redroot pigweed
35 35 34 35
34
33 34
34 34 34
35
35
1st week
2nd week 0.00 inches
Trace
Comments: Notes on preemergence treatments Very dry conditions after planting Uneven and delayed crop emergence.
Postemergence planned treatments not applied due to inadequate stand.
Treatment Check
PREEMERGENCE
Bicep Lite II Magnum Dual II Magnum
Outlook Lasso
LSD (.05)
Rate/A
1 9 (11 1 .67 pt
21 oz
2 qt
% Grft 8119/02
0
86
82
71 42
1 1
Cennt C,rops artd Soils I'- St111ion Prc(pess RtP(lfl 2fXJ2 • 11•
% Rrpw o/o Gr1t % Rrpw 8/19/02 9122/02 9/22/02
0 0 0
97 80 88
80 76 75
78 65 63 62 30 83
22 14 15
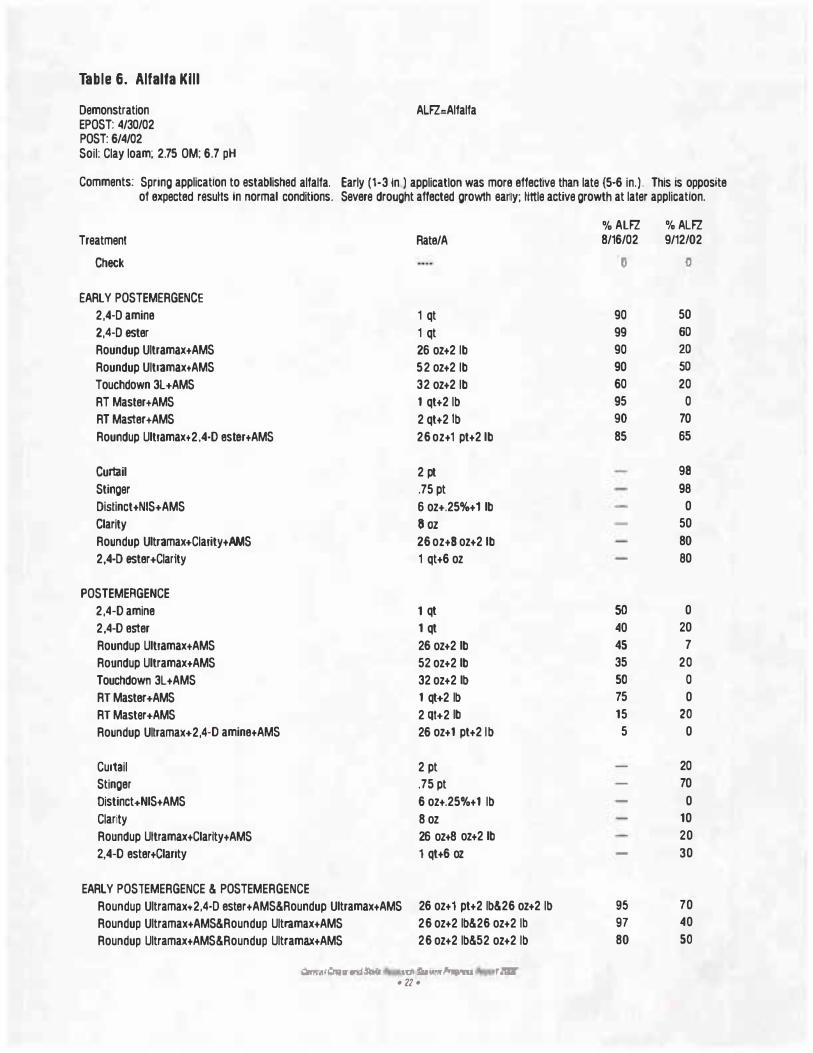
Table 6. Alfalfa Kill
Demonstration EPOST: 4/30/02 POST: 6/4/02 Soil: Clay loam; 2.75 OM; 6.7 pH
ALFZ:Al1alfa
Comments: Spring application to established alfalfa. Early (1·3 In ) application was more effective than late {5·6 in.). This is opposite of expected results In normal conditions. Severe drought affected growth early; llttle active growth at later application.
Treatment
Check
EARLY POSTEMERGENCE 2,4·0 amine 2,4·0 ester Roundup Ultramax+AMS Roundup Ultramax+AMS Touchdown 3L+AMS RT Master+AMS RT Master+AMS Roundup Ultramax+2.4·D ester+AMS
Curtail Stinger Distinct+NIS+AMS Clarity Roundup Ultramax+Clarity+AMS 2,4·D ester+Clarity
POSTEMEAGENCE 2,4-D amine 2.4-D ester Roundup Ultramax+AMS Roundup Ultramax+AMS Touchdown 3L+AMS RT Master+AMS RT Master+AMS Roundup Ultramax+2,4-0 amine+AMS
Curtail Stinger Oistinct+NIS+AMS Clarity Roundup Ultramax+Clarlty+AMS 2,4-0 ester+Clarity
EARLY POSTEMERGENCE & POSTEMERGENCE Roundup Ultramax+2.4·D ester+AMS&Roundup Ultramax+AMS Roundup Ultramax+AMS&Roundup Ultramax+AMS Roundup Ultramax+AMS&Roundup Ultramax+AMS
Rate/A
1 qt 1 qt 26 oz+2 lb 52 oz+2 lb 32 oz+2 lb 1 qt+2 lb 2 qt+2 1b 26 oz+ 1 pt+2 lb
2 pt .75 pt 6 oz+.25o/o+ 1 lb 8 oz 26 oz+B oz+2 lb 1 qt+6 oz
1 qt 1 qt 26 oz+2 lb 52 oz+2 lb 32 oz+2 lb 1 qt+2 lb 2 Qt+2 lb 26 oz+ 1 pt+2 lb
2 pt .75 pt 6 oz+.25%+ 1 lb 8 oz 26 oz+8 oz+2 lb 1 qt+6 oz
26 oz+ 1 pt+2 lb&26 oz+2 lb 26 oz+2 lb&26 oz+2 lb 26 oz+2 lb&52 oz+2 lb
i:'&m-,11 i!imr In.'� 'Cl 1:.tr 'T fmi �V f '!fl: • 22 •
% ALFZ 8/16/02
ll
90 99 90 90 60 95 90
85
50 40
45
35 so
75 15 5
95
97
80
% ALFZ 9/12102
0
50 60
20
50
20 0
70 65
98
98 0
50 80 80
0 20 7
20 0 0
20
0
20 70 0
10 20 30
70 40
50
2002 Report
Fertilizer and Soil Test Effects on Wheat Yield, Highmore
Jim Gerwlng, Ron Geldsrman, Anthony Bly, and Mike Volek South Dakota State University
Soil testing research has shown that knowledge of soil test levels can improve the profitability of fertilizer use. Profits increase if more fertilizer is used when soil test levels are low and or when little or no fertilizer is used when test levels are high. Frequently. however, the major nutrients (NPK) and sometimes zinc and sulfur are applied without a current soil test.
This experiment demonstrates the long-term effects of applying phosphorus, potassium. zinc. and sulfur regardless of soil test. The intent is to continue the experiment on the same location for a number of years. The planned rotation is soybean and wheat. The objective is to demonstrate soil testings' ability to predict crop response to fertilizer and fertilizer influence on soil tests.
Materials and Methods
The experiment was established on a Glenham loam soil series in 1997. Glenham soils are deep, well drained soils formed in friable glacial till. Fertilizer treatments consisted of a check where no fertilizer was applied, 25 lb/acre nitrogen and 25 lb/acre nitrogen plus either 35 lb phosphorus (O· 46-0}. 50 lb/acre potassium (0-0-60). 25 lb sulfur (21-0-0·24), or 5 lb zinc/acre (ZnS04 - 35%).
The nitrogen source was urea except in the sulfur treatment where the nitrogen was applied as part of the ammonium sulfate. The 25-lb nitrogen rate was determined by using SDSU fertilizer recommendations for a 65-bushel wheat yield goal, the 2-foot nitrate soil test {Table 1), and legume credits for the 2001 soybean crop.
Dry conditions in 2001 resulted in low yields and a very high nitrate soil test of 121 lb/acre. Therefore, only 25 lb of nitrogen was recommended for a 65-bushel wheat yield goal. In addition to the fertilizer treatments, 105 lb phosphorus was applied to all treatments except the nitrogen-only and the nitrogen plus phosphorus treatment to raise phosphorus soil test levels and make phosphorus non limiting in those treatments.
Fertilizer was broadcast into the untilled soybean residue from 2001 on April 10 and incorporated by disking. Oxen spring wheat was planted on April 11.
Results and Discussion
Soil analysis on samples taken on November 16, 2001. is reported in Table 1 . The 50 lb nitrogen applied to the previous soybean crop resulted in a 41 lb/acre increase in soil residual nitrate over the check where no nitrogen had been applied since the start of the study in 1997. No nitrogen would have been recommended for soybeans. For this study. however 50 lb N had been applied to determine its influence on soybean yield.
The sulfur soil test was high and no sulfur would have been recommended. Previous applications of sulfur increased sulfur soil test by 60 lb/acre. The 25 lb phosphorus and 50 lb potassium applied each year since 1997 increased phosphorus soil test from 9 ppm in the check to 20 ppm and potassium soil test from 482 to 632 ppm. The phosphorus test (9 ppm) was in the medium range, and 30 lb phosphorus fertilizer would have been recom-
Central Crops and $oils R6&earch Sr11r,on Prog1ess Rspcn 2002 • 23 •
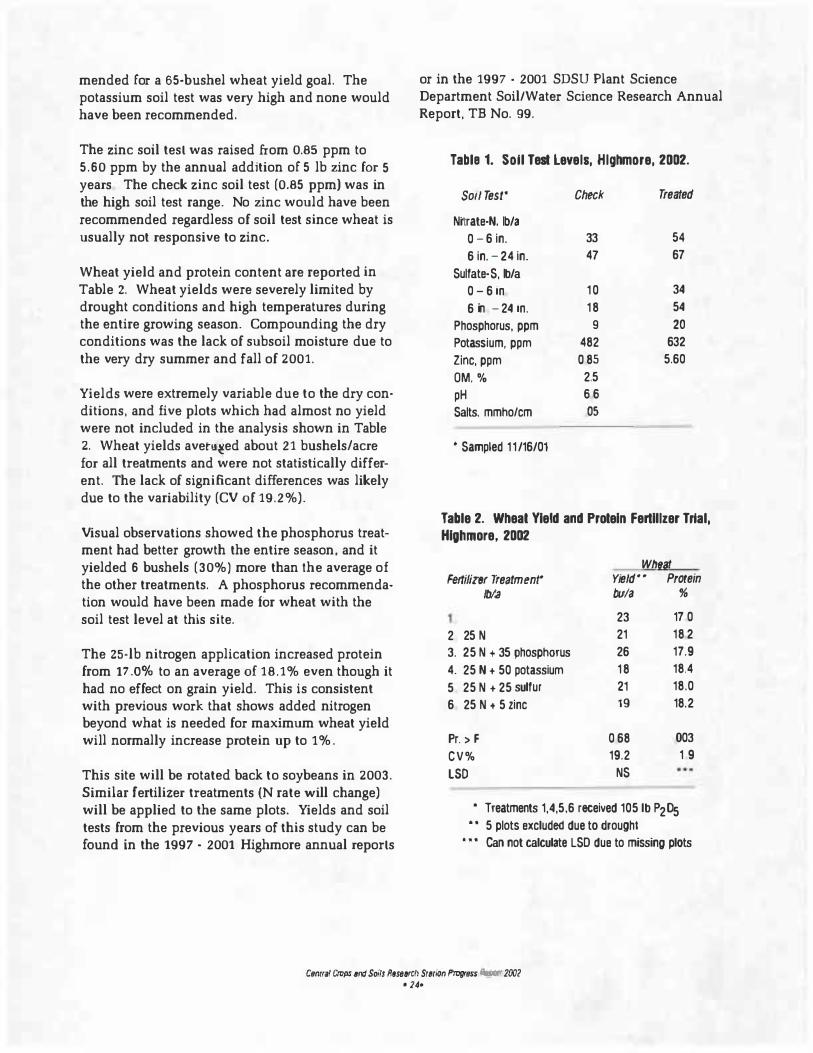
mended for a 65·bushel wheat yield goal. The potassium soil test was very high and none would have been recommended.
The zinc soil test was raised from 0.85 ppm to 5.60 ppm by the annual addition of 5 lb zinc for 5 years The check zinc soil test (0.85 ppm) was in the high soil test range. No zinc would have been recommended regardless of soil test since wheat is usually not responsive to zinc.
Wheat yield and protein content are reported in Table 2. Wheat yields were severely limited by drought conditions and high temperatures during the entire growing season. Compounding the dry conditions was the lack of subsoil moisture due to the very dry summer and fall of 2001.
Yields were extremely variable due to the dry con· ditions, and five plots which had almost no yield were not included in the analysis shown in Table 2. Wheat yields avero�ed about 21 bushels/acre for all treatments and were not statistically different. The lack of significant differences was likely due to the variability (CV of 19.2%).
Visual observations showed the phosphorus treatment had better growth the entire season. and it yielded 6 bushels (30%) more than the average of the other treatments. A phosphorus recommendation would have been made for wheat with the soil test level at this site.
The Z5·lb nitrogen application increased protein from 17 .0% to an average of 18.1 % even though it had no effect on grain yield. This is consistent with previous work that shows added nitrogen beyond what is needed for maximum wheat yield will normally increase protein up to 1 % .
This site will be rotated back to soybeans in 2003. Similar fertilizer treatments (N rate will change) will be applied to the same plots. Yields and soil tests from the previous years of this study can be found in the 1997 • 2001 Highmore annual reports
or in the 1997 • 2001 SDSU Plant Science Department Soil/Water Science Research Annual Report, TB No. 99.
Tabla 1. Soil Test Levels, Highmore, 2002.
Soil Test• Check Treated
Ni1rate-N. lb/a 0 - 6 in. 33 54
6 in. -24 in. 47 67
Sulfate·S. lb/a 0 - 6 in 10 34
6 in - 24 in. 18 54
Phosphorus, ppm 9 20
Potassium, ppm 482 632 Zinc. ppm 0 85 5.60 OM. % 2.5 pH 6 6
Salts. mmho/cm 05
• Sampled 11/16/01
Table 2. Wheat Yield and Protein fertilizer Trial, Highmore, 2002
Whfl,i,f
FertiliztJr Treatment• Yield0 Protein lb/a bu/a %
23 17 0
2 25 N 21 18 2 3. 25 N + 35 phosphorus 26 17.9 4. 25 N + 50 potassium 18 18.4
5 25 N + 25 sulfur 21 18.0
6 25 N + 5 zinc 19 18.2
Pr. > F 0 68 003 CV% 19.2 1 9
LSD NS
• Treatments 1,4,5.6 received 105 lb P205 • • 5 plots excluded due to droughl
• • • Can not calculate LSD due to missing plots
Cen11al Cfflf)S and Soi/s ll,searcll Sr6tion Pfflf}ress lluo'I' 2002 • 24•
2002 Report
Influence of Planting Date on Insect Infestations, Viral Plant Disease, Plant Growth, and Yield in Winter Wheat
Lou/$ Hesler, • Walter Riedell, • and Marla Langham"· *Northern Grain Insects Research Laboratory, USDA·AAS, Brookings
0South Dakota State University
Summary
1 Yields and test weights, respectively, did not differ among plantings of winter wheat. based on combine harvest. Winter wheat yielded 32.7
bu/a with a test weight of 62.2 lb/bu across all planting dates. Results obtained through hand harvesting showed no dramatic differences in yield or yield components across the three planting date treatments.
2. Measurements of the ratio of wheat-leaf area to the ground area upon which the wheat was grown (leaf area index - LAI} revealed that early-planted winter wheat had a thicker crop canopy than the other planting dates when measured at the late boot - early head crop development stage.
3. Cereal aphid infestations and damage from
chewing insects were light across all planting dates in fall 2001. Grasshopper infestations were also low in early summer 2002. In all cases. levels were below economic thresholds for each planting date.
4. Incidence of viral disease was relatively low and did not differ among three plantings. Overall. 3.7% of plants had symptoms of wheat streak mosaic, and 4.7% showed symptoms of barley yellow dwarf.
Winter wheat yield can be reduced by fall infesta· lions of insect pests such as cereal aphids and grasshoppers Also. some viral diseases of wheat, such as barley yellow dwarf (BYD) and wheat streak mosaic {WSM). become prevalent when cereal aphids and wheat curl mites, which transmit the viruses that cause the respective diseases, are abundant in the fall. Planting date of winter wheat
may potentially be a key factor in limiting fall infestations of arthropod pests and the incidence of viral plant diseases, but this has not been determined for
winter wheat in South Dakota.
Our objective was to measure insect population levels and damage. incidence of viral diseases, and plant growth and yield in winter wheat planted over a range of three dates.
Winter wheat plots
'Crimson' winter wheat was sown at three different planting dates {early. August 31; middle, September 10: and late. September 22, 2001) at the Central Research Station. Seed was sown about one inch deep using a Kirschman drill in furrows about 12 inches apart. Seed was treated with fungicides (mixture of 10% AI carboxin and 10% AI thiram, 6.8 fl oz (total product}/cwt)} to limit several seedand soil-borne diseases of wheat. Plots (30 by 60 ft) of each planting were randomized and replicated four times. Fertilizer (46·0·0 (N·P-K). 100 lb ac-• and 14·36·13, 52 lb ac 1) was applied at planting.
Insect sampling. We sampled 25 tillers (from five groups of five plants) per wheat plot for insect infestations and chewing insect damage on September 20 (early plots only), September 27 (early and intermediate plots}. and October 4 and October 18 (all plots}.
For each 25-tiller sample, we counted the number of cereal aphids per tiller. We also measured damage per 25 tillers by insects with chewing rnouthparts (e.g .. grasshoppers, wireworms, and cutworms} in fall 2001, and we counted grasshoppers along a 40-ft transect within each field plot in summer 2002.
Cen11111 Cr(Jf)S snd So,ts Resea11:h Stat1011 Progress .t.,i- 2002 • 25 •
Viral diseases. On June 13, we sampled incidence of viral diseases by walking through plots in a W· pattern and classifying about 300 randomly selected plants per plot as either having or not having symptoms of WSM or BYD.
Leaf area measurements. The ratio of wheat-leaf area to the ground area upon which the wheat was grown was measured on June 4 using the leaf-area index {LAI) feature of the LAI-2000 crop canopy analyzer An above-canopy reference measurement was a benchmark for four within-canopy measurements per plot. Data were averaged across treatments and standard error of data means calculated using SAS software.
Yield data. Plots were harvested by hand and by a Massey-Ferguson 8XP combine on July 15. Handharvested yield was taken from three 1 ·foot sections of row per plot. Plants were cut at ground level with scissors. Leaves. stems, and grain heads were put into paper bags and dried to ambient humidity in a greenhouse. Heads were counted. and grain was manually separated from the chaff. Total grain weight and 100-kemel weighl were then measured. Combine yield was taken from two 6-ft·wide combine strips within each plot; exact measurements of strips were made immediately after each pass. Moisture was measured for each strip. yield data were adjusted to equivalent weight at 13.5% moisture Test weight and moisture conlent of combined grain were measured with a Dickey·John seed tester.
Results
Insects. Cereal-aphid levels were low in fall 2001, with a peak of only 3.8 aphids per 25 tillers on October 4 in the middle planting. Samples of 25
tillers contained no cereal aphids on some sampling dates These low levels of cereal aphids are not damaging to the growth and yield of wheat. Damage by grasshoppers and other chewing insects was low in fall 2001 (peak incidence of 7% of plants damaged, middle planting, October 4), and grasshopper counts in summer 2002 were also low (less than 2.8 grasshoppers per 40-ft transect per planting). Such levels were too low to have an impact on yield.
Viral diseases Incidence of viral disease was relatively low and did not differ among the three plantings. Overall. 3.7% of plants had symptoms of WSM and 4.7% showed BYD symptoms.
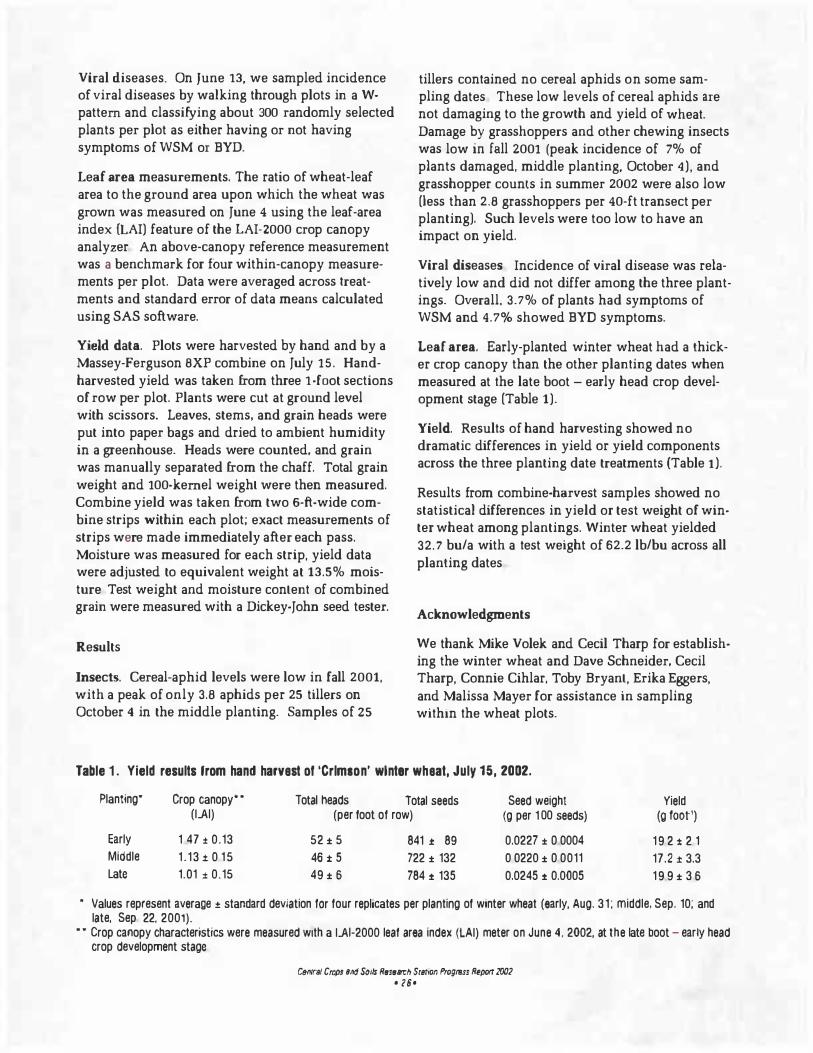
Leaf area. Early-planted winter wheat had a thicker crop canopy than the other planting dates when measured at the late boot - early head crop development stage (Table 1).
Yield. Results of hand harvesting showed no dramatic differences in yield or yield components across the three planting date treatments (Table 1).
Results from combine-harvest samples showed no statistical differences in yield or test weight of winter wheat among plantings. Winter wheat yielded 32. 7 bu/a with a test weight of 62.2 lb/bu across all planting dates
Acknowledgments
We thank Mike Volek and Cecil Tharp for establish· ing the winter wheat and Dave Schneider, Cecil Tharp, Connie Cihlar, Toby Bryanl, Erika Eggers, and Malissa Mayer for assistance in sampling within the wheat plots.
Table 1 . Yield results from hand harvest or 'Crimson' winter wheat, July 15, 2002.
Planting· Crop canopy .. Total heads Total seeds Seed weight Yield (LAI) (per foot of row) (g per 1 oo seeds) (g foot1)
Early 1 47 :t 0.13 52 :t 5 841 :t 89 0.0227 :t O 0004 19 2 :t 2 1 Middle 1.13 ± 0 15 46 ± 5 722 :t 132 0 0220 :t O 0011 17.2 ::t: 3.3 Late 1.01 :t 0.15 49 :t 6 784 :t 135 0.0245 :t 0.0005 19 9 :t 3 6
• Values represent average ± standard deviation tor four replicates per planting of winter wheat (early, Aug. 31: middle. Sep. 10; and late. Sep 22. 2001).
• • Crop canopy characteristics were measured with a LAl-2000 leaf area index (LAI) meter on June 4. 2002, at the late boot - early head crop development stage
Ce111ra1 Crops Bild Seils f/,s,a,i:h Srstion P1oglfJSs Report 2002 . ,s.
2002 Report
Influence of Planting Date on Insect Infestations, Viral Plant Diseases, Plant Growth, and Yield of Spring Wheat
Louis H,sler, • Walter R/sdsll, " and Marie Langham•* "Northern Grain Insects Research Laboratory. USDA·ARS, Brookings
• ·south Dakota State University
Summary
1. Results of combine harvest showed that yields in early and middle plantings were greater than thal of the late planting. Test weights declined significantly with later plantings. being greatest in the early planting, intermediate in the middle planting, and lowest in the late planting. Results obtained through hand harvesting showed a dramatic reduction in yield and yield components in the late-planted spring wheat when compared with the other date treatments.
2. Measurements of the ratio of wheat-leaf area to ground area upon which the wheat was grown (leaf area index - LAI} revealed that late-plant· ed spring wheat had a thinner crop canopy than other planting dates when measured at the late boot - early head crop development stage.
3. Cereal aphid infestations and damage from chewing insects were both light in spring wheat plots regardless of planting date and could not have directly limited plant growth or yield.
4. Incidence of viral disease was relatively low and did not differ among the three plantings. Overall, 3.4% of plants had symptoms of wheat streak mosaic, and 1.6% showed symptoms of barley yellow dwarf.
Introduction
Yield of spring wheat can be reduced by infesta· tions of insect pests such as cereal aphids and by viral diseases such as wheat steak mosaic (WSM) and barley yellow dwarf (BYD). Planting date can directly influence plant yield. It may also influence infestation levels of insects and the vectors of
viruses responsible for WSM and BYD. Specific differences in infestation levels and viral disease incidence have not been determined for various planting dates of spring wheat in South Dakota. Our objective was to measure insect infestation levels and damage. viral disease infection rates, plant growth. and yield of spring wheat planted over a range of three dates.
Spring wheat plots
'Ember' spring wheal was sown in 2002 at three different planting dates (early, April 11; middle, April 20; and late. April 30). Seed was sown about 1 inch deep using a John Deere press drill in 7.5· inch-wide rows. Seed was treated with fungicides to limit several seed· and soil-borne diseases. Plots of each planting (30 by 60 ft) were randomized within the study area and replicated four times. Fertilizer (46-0·0 (N-P-K}, 138 lb ac·• and 14-36-13,
52 lb ac·1) was applied at planting.
Insect sampling. We sampled 25 tillers (from five groups of five plants) per wheat plot for insect infestations and chewing insect damage several times from late April to mid-June. For each 25·
tiller sample, we counted number of cereal aphids per tiller and the percentage out of 25 tillers damaged by insects with chewing mouthparts (e.g., grasshoppers, wireworms. and cutworms).
Viral diseases. On June 28. we sampled for incidence of viral diseases in wheat by walking along three transects per plot and classifying about 300 randomly selected plants as either having or not having symptoms of WSM or BYD.
Leaf area measurements. The ratio of wheat-leaf area to the ground area upon which the wheat was
grown was measured using the leaf·area index (LAI) feature of the LAI·2000 crop canopy analyzer in the early. middle, and late plantings on June 16. An above-canopy reference measurement was used as a benchmark for four within-canopy measurements per plot. Data were averaged across treatments and standard error of data means calculated using SAS software.
Yield data. Plots were harvested by hand on July 23 and by Massey-Ferguson 8XP combine on July 15 (early planting} and July 23 (middle and late plantings). Hand-harvest yield was derived by taking three 1-foot sections of row per plot on July 23. Plants were cut at ground level using scissors. Leaves, stems, and grain heads were placed into paper bags and dried to ambient humidity in a greenhouse. Heads were counted, and grain manually separated from the chaff. Total grain weight and 100-kernel weight were then measured.
Combine yield was taken from two 6-ft wide combine strips within each plot; exact measurements of strips were made immediately after each pass. Moisture was measured for each strip sample. and yield data were adjusted to equivalent weight at 13.5% moisture. Test weight and moisture content of grain combined over date of planting treatments were measured using a Dickey-John seed tester.
Results
Insects. Cereal aphid infestations were extremely low across all plantings (peak of 1.8 aphids per 25 tillers, May 24, late planting), and damage from chewing insects (peak incidence of 8%, May 24, early planting) was low regardless of planting
date. Such levels were too low to directly limit plant growth or yield.
Viral diseases. Incidence of viral disease was relatively low and did not differ among the three plantings Overall, 3 4 % of plants had symptoms of WSM and 1.6% showed symptoms of B".iD.
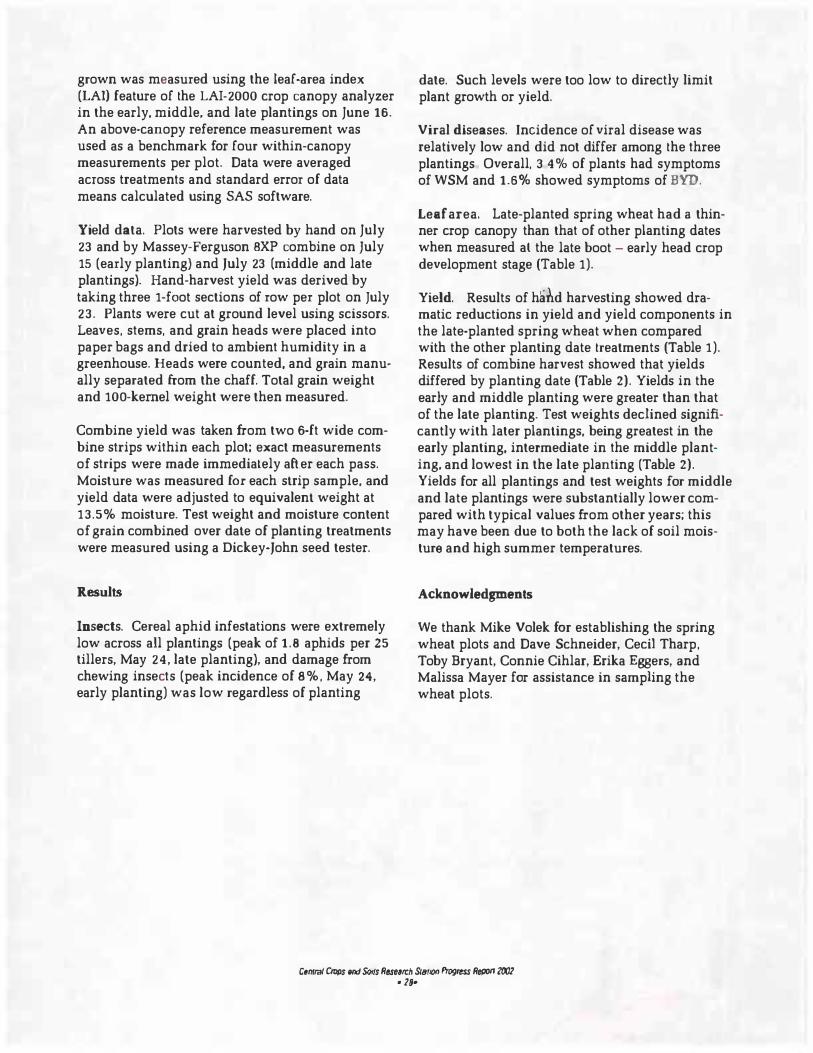
Leaf area. Late-planted spring wheat had a thinner crop canopy than that of other planting dates when measured al the late boot - early head crop development stage (Table 1).
Yield. Results of haild harvesting showed dramatic reductions in yield and yield components in the late-planted spring wheat when compared with the other planting date treatments (Table 1). Results of combine harvest showed that yields differed by planting date (Table 2). Yields in the early and middle planting were greater than that of the late planting. Test weights declined significantly with later plantings. being greatest in the early planting, intermediate in the middle planting. and lowest in the late planting (Table 2). Yields for all plantings and test weights for middle and late plantings were substantially lower compared with typical values from other years; this may have been due to both the lack of soil moisture and high summer temperatures.
Acknowledgments
We thank Mike Volek for establishing the spring wheat plots and Dave Schneider, Cecil Tharp, Toby Bryant, Connie Cihlar, Erika Eggers, and Malissa Mayer for assistance in sampling the wheat plots.
c,nm,1 Clops /Hid St;,ts Rese,n:h S//Jll()I) Prog� Refll)tl 2()()2 • 28•
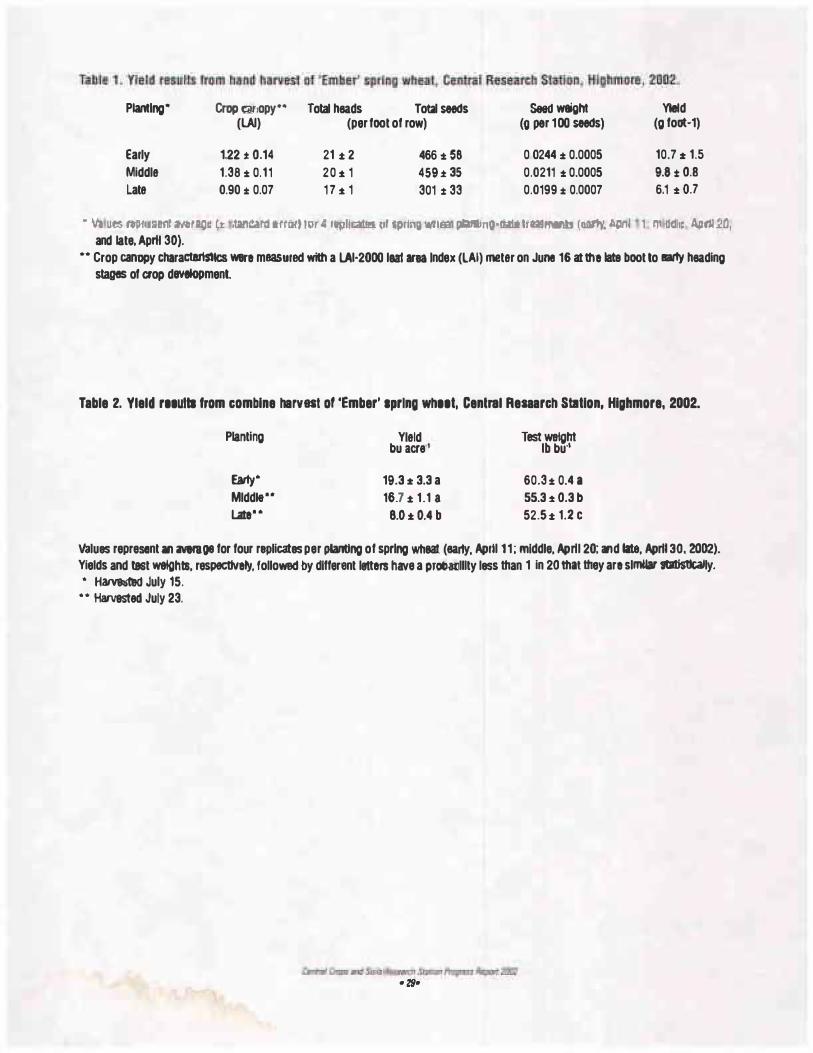
Planting'" Crop ca_nopy ... Total heads Total seeds Seed weight Yield (LAI) (per foot of row) (O per 100 seeds) (g foat-1)
Early 1.22 :t: 0.14 21 :t 2 466 :t: 58 0 0244 :t 0.0005 10.7 :t 1.5 Middle 1.38 :t 0.11 20 :t 1 459 :t 35 0.0211 :t 0.0005 9.8 :t 0.8
Late 0.90 :t: 0.07 17 :t 1 301 :t 33 0.0199 :t: 0.0007 6.1 t 0.7
• "/. u� rcoi:.umnr fflrlltlll (.t: l!lllli:.ffll trrm\ toe 4 t!iplli.i1l!l l!f iprfnw ll'lita1 •nQ-lrilti lfalffllfflJ r llll..'t)'. iri:ml 1 I'! oah; A.litU .2c1, and late. April 30).
•• Crop canopy charactans!lcs were measured with a LA1·2000 laa1 arta Index (LAI) meter on June 16 at the late boot to early heading stages of c,op development.
Table 2. Yleld r11u111 from combine harvest of 'Ember' spring wh11t, Cen1ral Reaaarch Station, Highmore, 2002.
Planting Yield bu acre· 1
Test �ht lb bu4
Early* 19.3 :t 3.3 a 60.3 :t 0.4 a Mldd1t•• 16.7 :t 1.1 a 55.3 :t 0.3 b Late•• 8.0 :t 0.4 b 52.S :t 1.2 c
Values represent an averaoe for four replicates per pfantlng of spring wheat. (earty. Apr11 11; middle, April 20: afld late, April 30. 2002). Yields and test weights, respectively, followed by different letters have a pm11:J:Jlllty less than 1 in 20 that they are slrnUar statfstlcally. • Harvested July 15.
** Harvested July 23.