Embed Size (px)
Citation preview
1
Affordability Analysis for the
Capital Debt Affordability
Committee
September 29, 2017
2
Topics of Discussion
1. Planning Assumptions
2. Three Approaches to Capital Budget Authorizations
3. Tax Supported Debt Affordability Metrics
4. General Obligation Bond Authorization
5. Academic Facilities Bond Authorization
Planning Assumptions
3
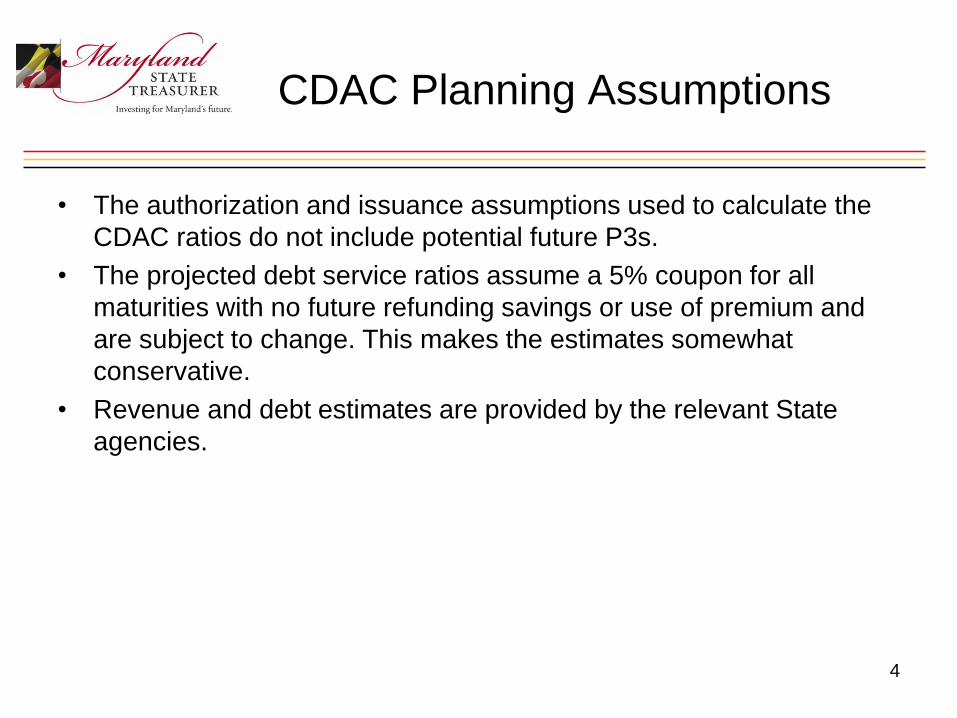
CDAC Planning Assumptions
• The authorization and issuance assumptions used to calculate the
CDAC ratios do not include potential future P3s.
• The projected debt service ratios assume a 5% coupon for all
maturities with no future refunding savings or use of premium and
are subject to change. This makes the estimates somewhat
conservative.
• Revenue and debt estimates are provided by the relevant State
agencies.
4
Three Approaches to General
Obligation Bond Authorizations
5
Three Approaches to General
Obligation Bond Authorizations
6
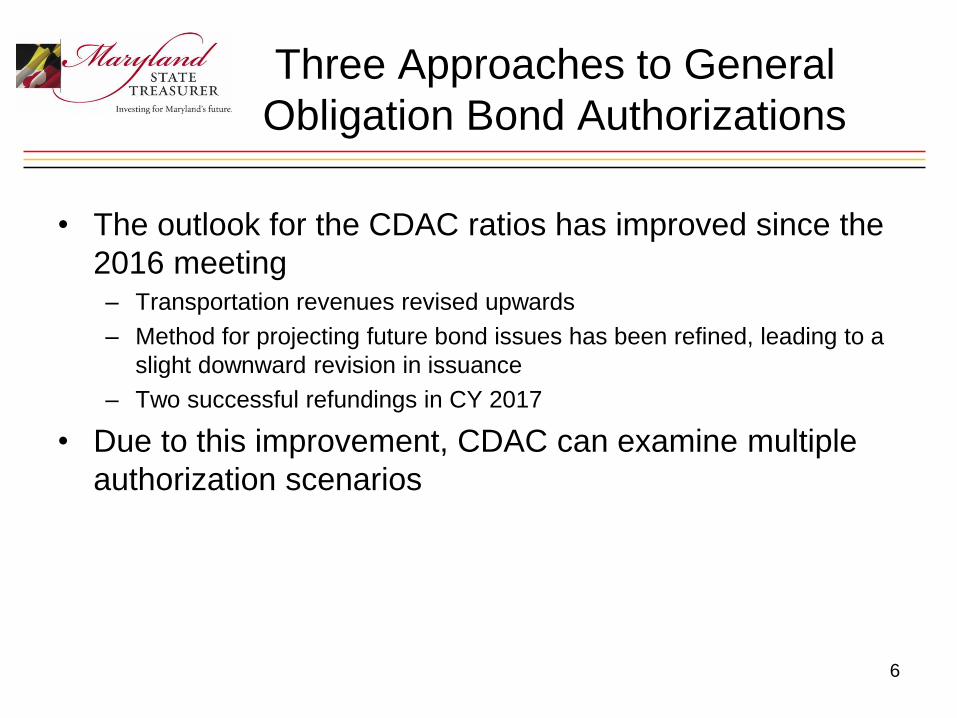
• The outlook for the CDAC ratios has improved since the
2016 meeting– Transportation revenues revised upwards
– Method for projecting future bond issues has been refined, leading to a
slight downward revision in issuance
– Two successful refundings in CY 2017
• Due to this improvement, CDAC can examine multiple
authorization scenarios
Three Approaches to General
Obligation Bond Authorizations
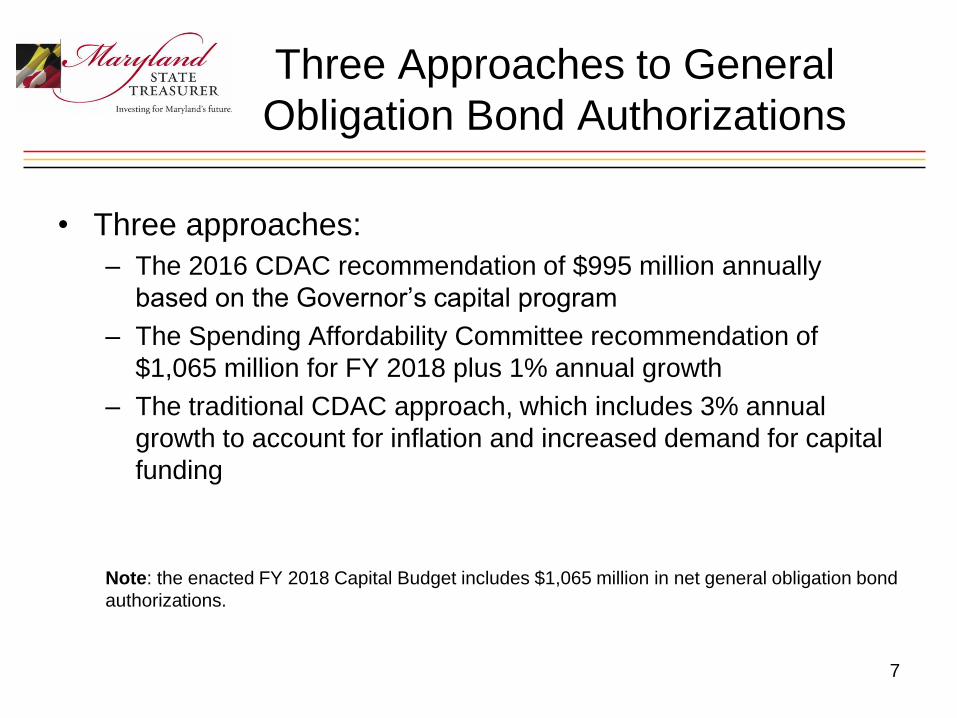
• Three approaches:
– The 2016 CDAC recommendation of $995 million annually
based on the Governor’s capital program
– The Spending Affordability Committee recommendation of
$1,065 million for FY 2018 plus 1% annual growth
– The traditional CDAC approach, which includes 3% annual
growth to account for inflation and increased demand for capital
funding
Note: the enacted FY 2018 Capital Budget includes $1,065 million in net general obligation bond
authorizations.
7
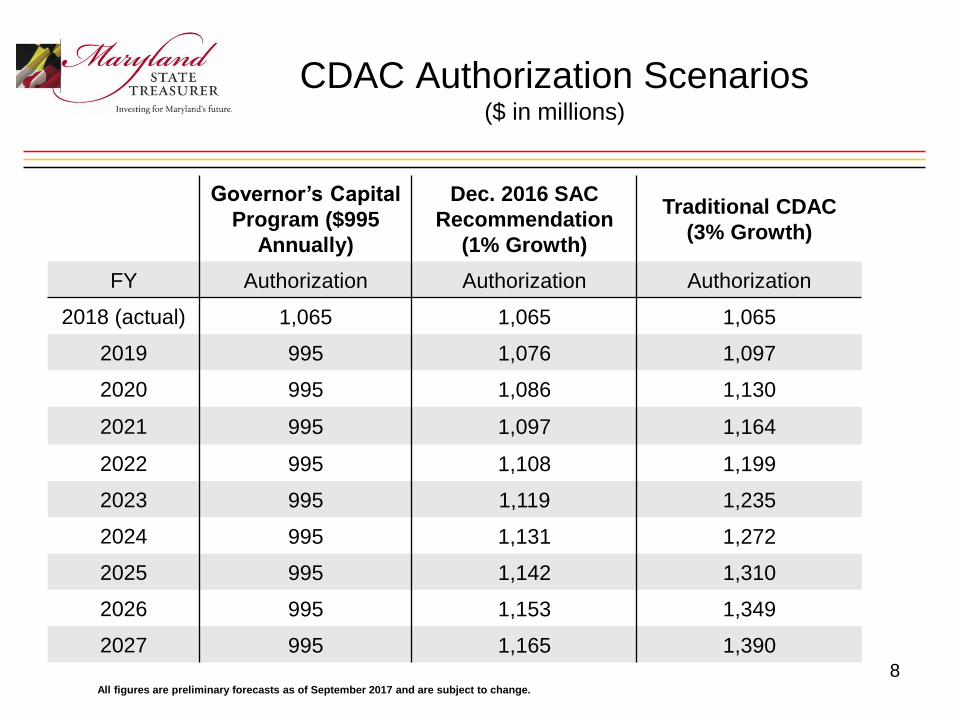
CDAC Authorization Scenarios($ in millions)
Governor’s Capital
Program ($995
Annually)
Dec. 2016 SAC
Recommendation
(1% Growth)
Traditional CDAC
(3% Growth)
FY Authorization Authorization Authorization
2018 (actual) 1,065 1,065 1,065
2019 995 1,076 1,097
2020 995 1,086 1,130
2021 995 1,097 1,164
2022 995 1,108 1,199
2023 995 1,119 1,235
2024 995 1,131 1,272
2025 995 1,142 1,310
2026 995 1,153 1,349
2027 995 1,165 1,3908
All figures are preliminary forecasts as of September 2017 and are subject to change.
Three Approaches to General
Obligation Bond Authorizations
9All figures are preliminary forecasts as of September 2017 and are subject to change.
$9
,52
2
$9
,66
3
$9
,76
7
$9
,85
8
$9
,90
6
$9
,92
4
$9
,92
5
$9
,86
2
$9
,81
5
$9
,77
5
$9
,52
2
$9
,67
3
$9
,82
7
$9
,99
8
$1
0,1
26
$1
0,2
45
$1
0,3
43
$1
0,3
97
$1
0,4
60
$1
0,5
24
$9
,52
2
$9
,69
8
$9
,86
7
$1
0,0
88
$1
0,2
89
$1
0,4
57
$1
0,6
74
$1
0,8
18
$1
1,0
18
$1
1,2
87
$-
$2,000
$4,000
$6,000
$8,000
$10,000
$12,000
FY 2018 FY 2019 FY 2020 FY 2021 FY 2022 FY 2023 FY 2024 FY 2025 FY 2026 FY 2027
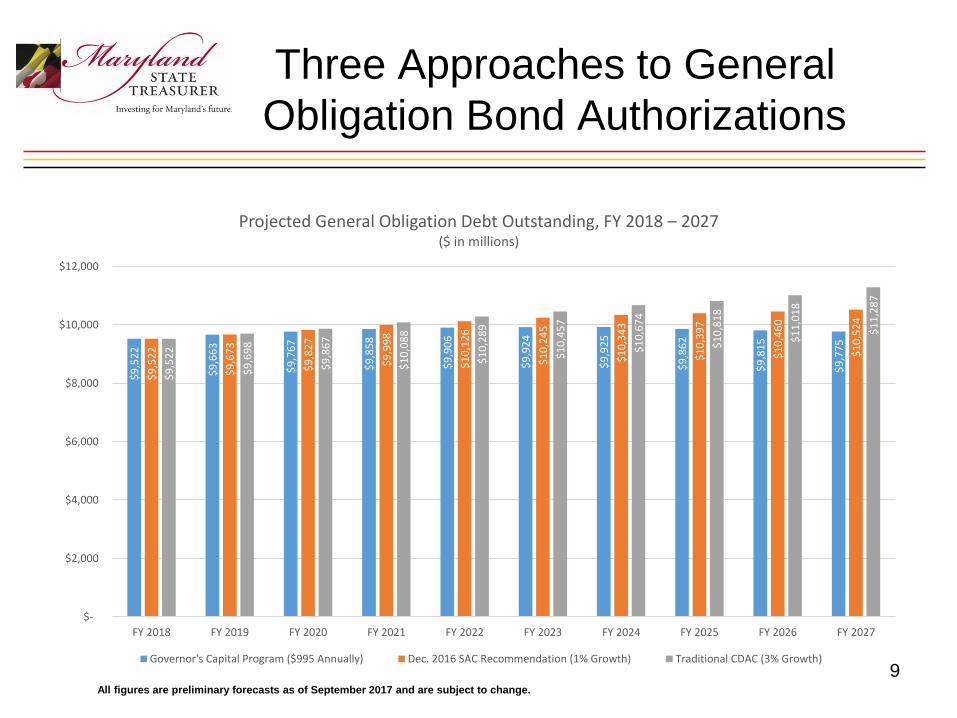
Projected General Obligation Debt Outstanding, FY 2018 – 2027($ in millions)
Governor's Capital Program ($995 Annually) Dec. 2016 SAC Recommendation (1% Growth) Traditional CDAC (3% Growth)
Three Approaches to General
Obligation Bond Authorizations
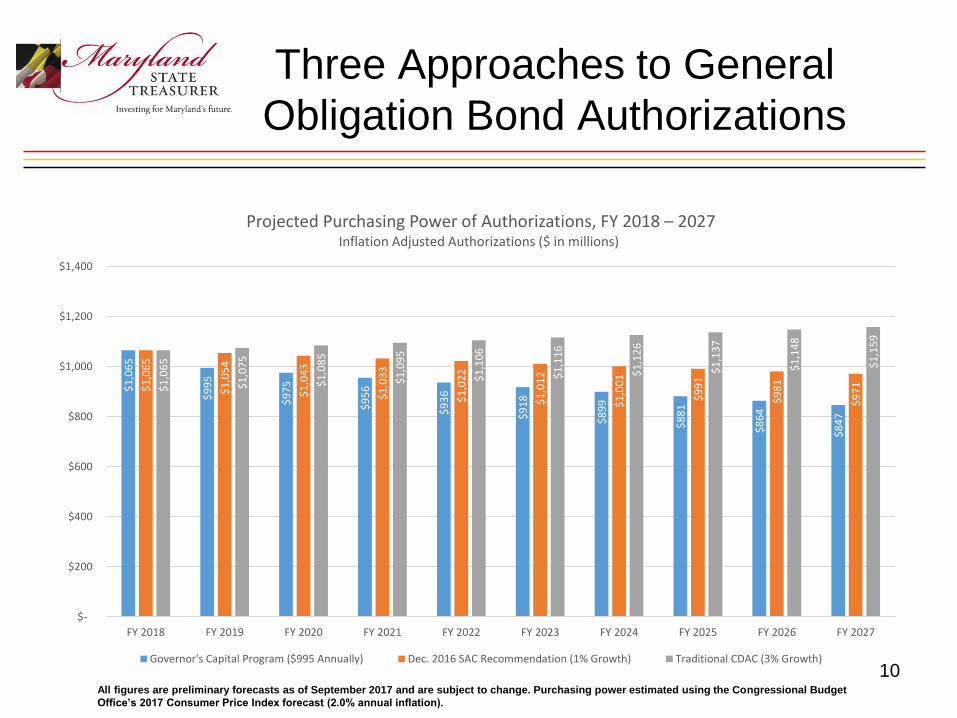
10All figures are preliminary forecasts as of September 2017 and are subject to change. Purchasing power estimated using the Congressional Budget
Office’s 2017 Consumer Price Index forecast (2.0% annual inflation).
$1
,06
5
$9
95
$9
75
$9
56
$9
36
$9
18
$8
99
$8
81
$8
64
$8
47
$1
,06
5
$1
,05
4
$1
,04
3
$1
,03
3
$1
,02
2
$1
,01
2
$1
,00
1
$9
91
$9
81
$9
71
$1
,06
5
$1
,07
5
$1
,08
5
$1
,09
5
$1
,10
6
$1
,11
6
$1
,12
6
$1
,13
7
$1
,14
8
$1
,15
9
$-
$200
$400
$600
$800
$1,000
$1,200
$1,400
FY 2018 FY 2019 FY 2020 FY 2021 FY 2022 FY 2023 FY 2024 FY 2025 FY 2026 FY 2027
Projected Purchasing Power of Authorizations, FY 2018 – 2027Inflation Adjusted Authorizations ($ in millions)
Governor's Capital Program ($995 Annually) Dec. 2016 SAC Recommendation (1% Growth) Traditional CDAC (3% Growth)
Three Approaches to General
Obligation Bond Authorizations
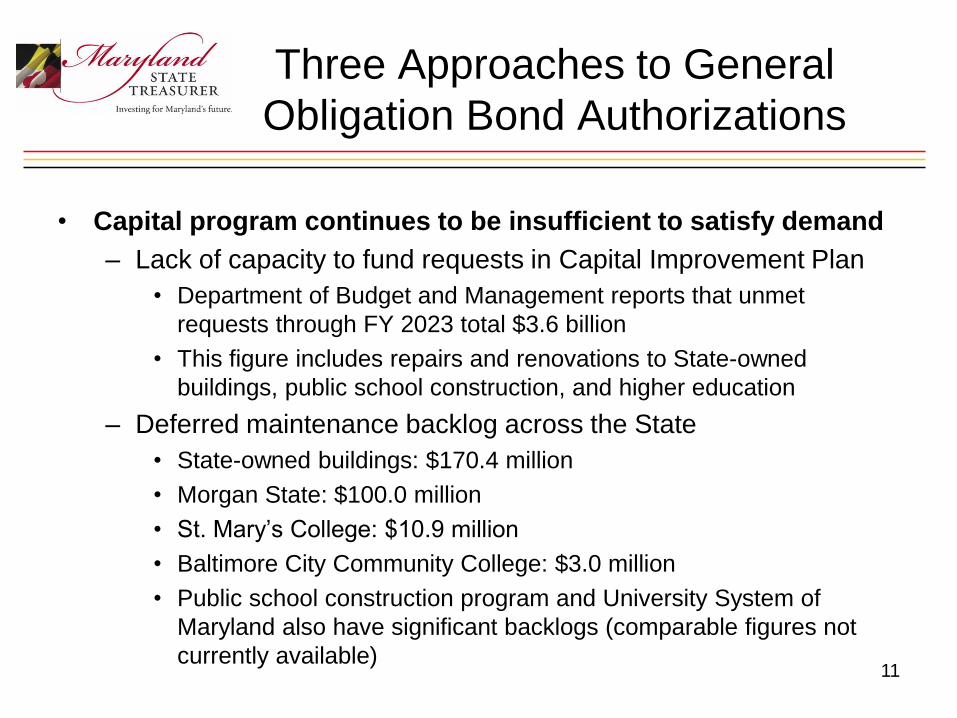
• Capital program continues to be insufficient to satisfy demand
– Lack of capacity to fund requests in Capital Improvement Plan
• Department of Budget and Management reports that unmet
requests through FY 2023 total $3.6 billion
• This figure includes repairs and renovations to State-owned
buildings, public school construction, and higher education
– Deferred maintenance backlog across the State
• State-owned buildings: $170.4 million
• Morgan State: $100.0 million
• St. Mary’s College: $10.9 million
• Baltimore City Community College: $3.0 million
• Public school construction program and University System of
Maryland also have significant backlogs (comparable figures not
currently available)11
Tax-Supported Debt
Affordability Metrics
12
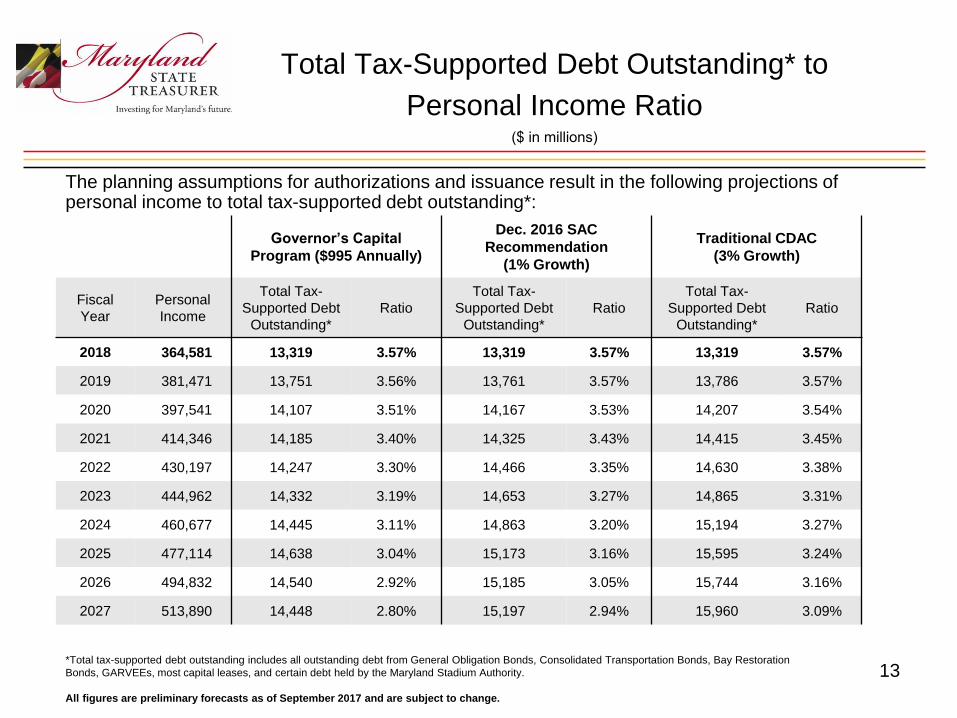
Total Tax-Supported Debt Outstanding* to
Personal Income Ratio($ in millions)
Governor’s Capital
Program ($995 Annually)
Dec. 2016 SAC
Recommendation
(1% Growth)
Traditional CDAC
(3% Growth)
Fiscal
Year
Personal
Income
Total Tax-
Supported Debt
Outstanding*
Ratio
Total Tax-
Supported Debt
Outstanding*
Ratio
Total Tax-
Supported Debt
Outstanding*
Ratio
2018 364,581 13,319 3.57% 13,319 3.57% 13,319 3.57%
2019 381,471 13,751 3.56% 13,761 3.57% 13,786 3.57%
2020 397,541 14,107 3.51% 14,167 3.53% 14,207 3.54%
2021 414,346 14,185 3.40% 14,325 3.43% 14,415 3.45%
2022 430,197 14,247 3.30% 14,466 3.35% 14,630 3.38%
2023 444,962 14,332 3.19% 14,653 3.27% 14,865 3.31%
2024 460,677 14,445 3.11% 14,863 3.20% 15,194 3.27%
2025 477,114 14,638 3.04% 15,173 3.16% 15,595 3.24%
2026 494,832 14,540 2.92% 15,185 3.05% 15,744 3.16%
2027 513,890 14,448 2.80% 15,197 2.94% 15,960 3.09%
13
The planning assumptions for authorizations and issuance result in the following projections of personal income to total tax-supported debt outstanding*:
*Total tax-supported debt outstanding includes all outstanding debt from General Obligation Bonds, Consolidated Transportation Bonds, Bay Restoration Bonds, GARVEEs, most capital leases, and certain debt held by the Maryland Stadium Authority.
All figures are preliminary forecasts as of September 2017 and are subject to change.

Total Tax-Supported Debt Outstanding*
to Personal Income Ratio (Governor’s Capital Program - $995 Annually)
14*Total tax-supported debt outstanding includes all outstanding debt from General Obligation Bonds, Consolidated Transportation Bonds, Bay Restoration
Bonds, GARVEEs, most capital leases, and certain debt held by the Maryland Stadium Authority.
All figures are preliminary forecasts as of September 2017 and are subject to change.
1,589 1,681
1,958 2,514 3,044 3,615 4,151 4,593 5,378 6,200
0
2,500
5,000
7,500
10,000
12,500
15,000
17,500
20,000
22,500
2018 2019 2020 2021 2022 2023 2024 2025 2026 2027
in $
millions
Tax Supported Debt Outstanding to Personal Income
Available Debt Capacity using the 4.0% Benchmark
FY2018 - FY2027
Total Tax Supported Debt Remaining Capacity 4.0% Benchmark
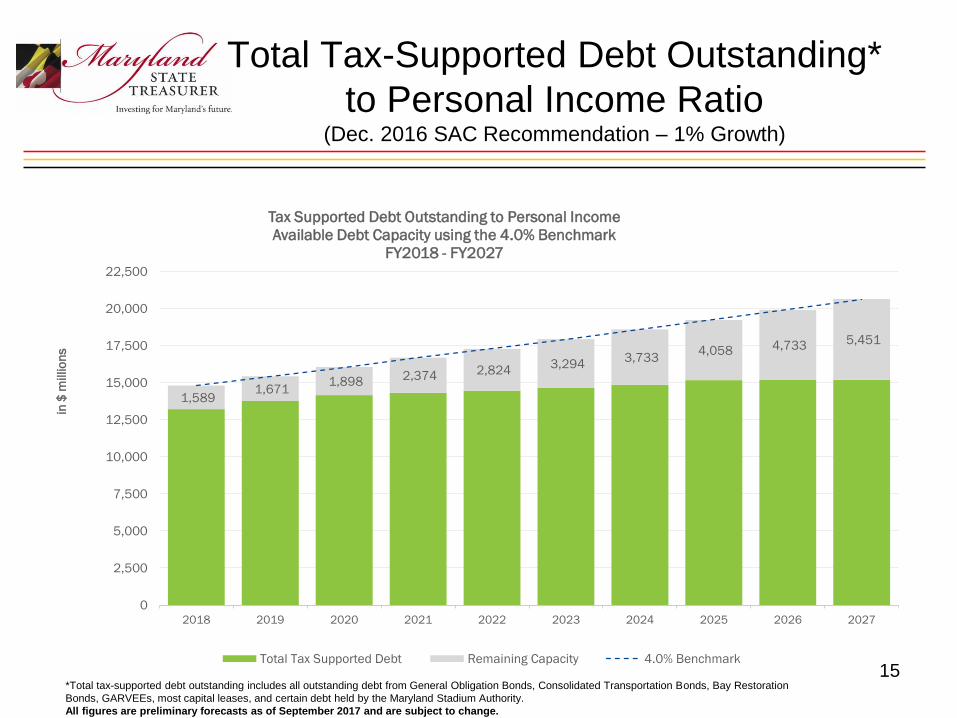
Total Tax-Supported Debt Outstanding*
to Personal Income Ratio (Dec. 2016 SAC Recommendation – 1% Growth)
15*Total tax-supported debt outstanding includes all outstanding debt from General Obligation Bonds, Consolidated Transportation Bonds, Bay Restoration
Bonds, GARVEEs, most capital leases, and certain debt held by the Maryland Stadium Authority.
All figures are preliminary forecasts as of September 2017 and are subject to change.
1,589 1,671
1,898 2,374 2,824 3,294
3,733 4,058 4,733 5,451
0
2,500
5,000
7,500
10,000
12,500
15,000
17,500
20,000
22,500
2018 2019 2020 2021 2022 2023 2024 2025 2026 2027
in $
millions
Tax Supported Debt Outstanding to Personal Income
Available Debt Capacity using the 4.0% Benchmark
FY2018 - FY2027
Total Tax Supported Debt Remaining Capacity 4.0% Benchmark
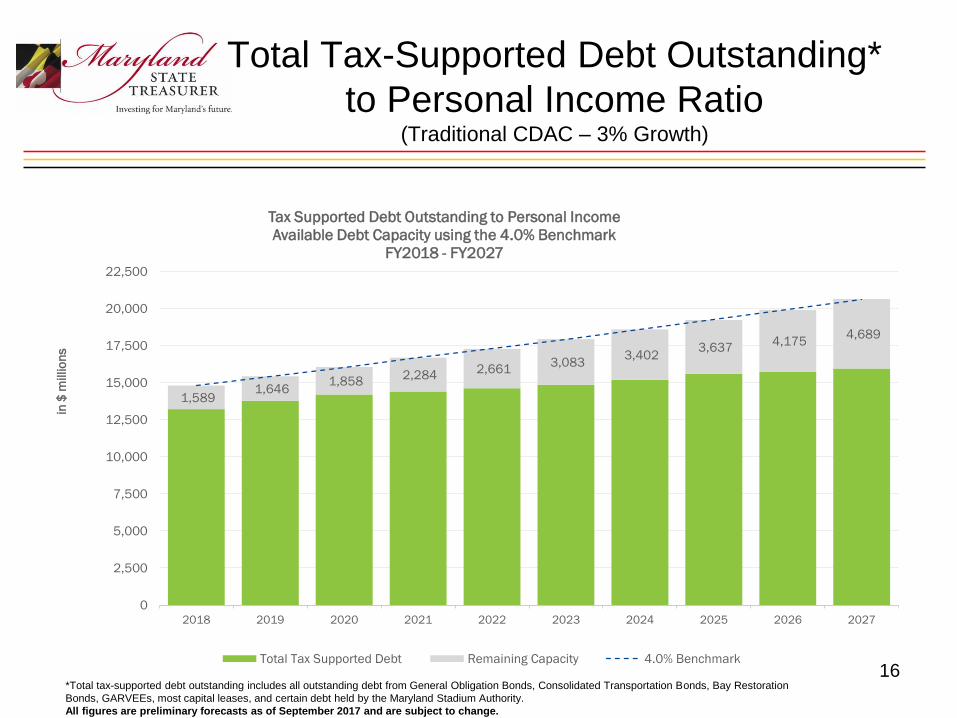
Total Tax-Supported Debt Outstanding*
to Personal Income Ratio (Traditional CDAC – 3% Growth)
16*Total tax-supported debt outstanding includes all outstanding debt from General Obligation Bonds, Consolidated Transportation Bonds, Bay Restoration
Bonds, GARVEEs, most capital leases, and certain debt held by the Maryland Stadium Authority.
All figures are preliminary forecasts as of September 2017 and are subject to change.
1,589 1,646
1,858 2,284
2,661 3,083
3,402 3,637
4,175 4,689
0
2,500
5,000
7,500
10,000
12,500
15,000
17,500
20,000
22,500
2018 2019 2020 2021 2022 2023 2024 2025 2026 2027
in $
millions
Tax Supported Debt Outstanding to Personal Income
Available Debt Capacity using the 4.0% Benchmark
FY2018 - FY2027
Total Tax Supported Debt Remaining Capacity 4.0% Benchmark
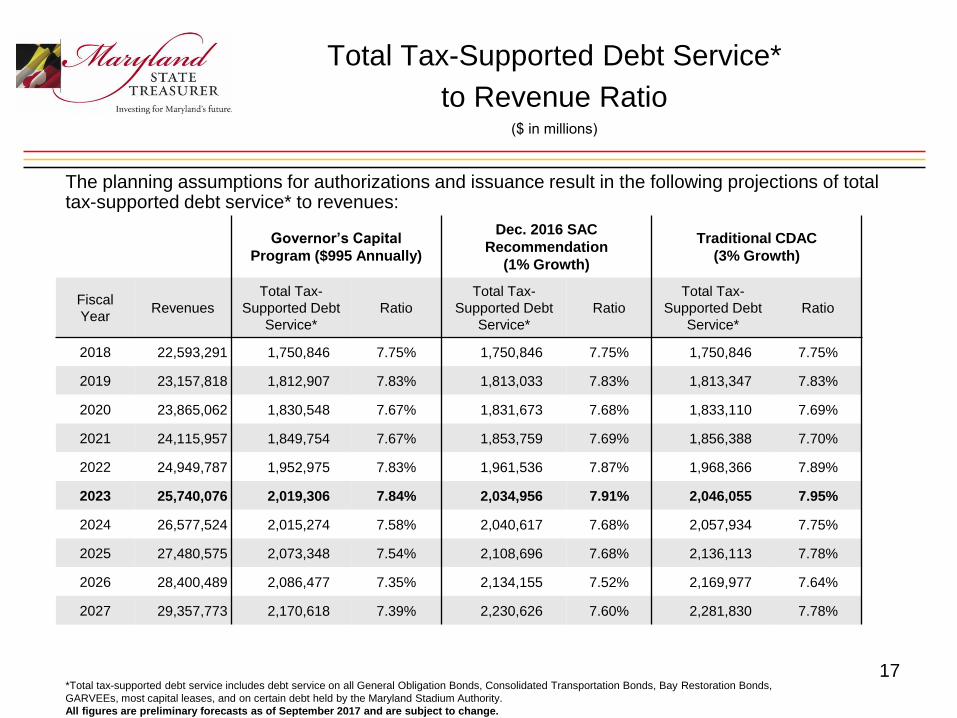
Total Tax-Supported Debt Service*
to Revenue Ratio($ in millions)
Governor’s Capital
Program ($995 Annually)
Dec. 2016 SAC
Recommendation
(1% Growth)
Traditional CDAC
(3% Growth)
Fiscal
YearRevenues
Total Tax-
Supported Debt
Service*
Ratio
Total Tax-
Supported Debt
Service*
Ratio
Total Tax-
Supported Debt
Service*
Ratio
2018 22,593,291 1,750,846 7.75% 1,750,846 7.75% 1,750,846 7.75%
2019 23,157,818 1,812,907 7.83% 1,813,033 7.83% 1,813,347 7.83%
2020 23,865,062 1,830,548 7.67% 1,831,673 7.68% 1,833,110 7.69%
2021 24,115,957 1,849,754 7.67% 1,853,759 7.69% 1,856,388 7.70%
2022 24,949,787 1,952,975 7.83% 1,961,536 7.87% 1,968,366 7.89%
2023 25,740,076 2,019,306 7.84% 2,034,956 7.91% 2,046,055 7.95%
2024 26,577,524 2,015,274 7.58% 2,040,617 7.68% 2,057,934 7.75%
2025 27,480,575 2,073,348 7.54% 2,108,696 7.68% 2,136,113 7.78%
2026 28,400,489 2,086,477 7.35% 2,134,155 7.52% 2,169,977 7.64%
2027 29,357,773 2,170,618 7.39% 2,230,626 7.60% 2,281,830 7.78%
17
The planning assumptions for authorizations and issuance result in the following projections of total tax-supported debt service* to revenues:
*Total tax-supported debt service includes debt service on all General Obligation Bonds, Consolidated Transportation Bonds, Bay Restoration Bonds,
GARVEEs, most capital leases, and on certain debt held by the Maryland Stadium Authority.
All figures are preliminary forecasts as of September 2017 and are subject to change.
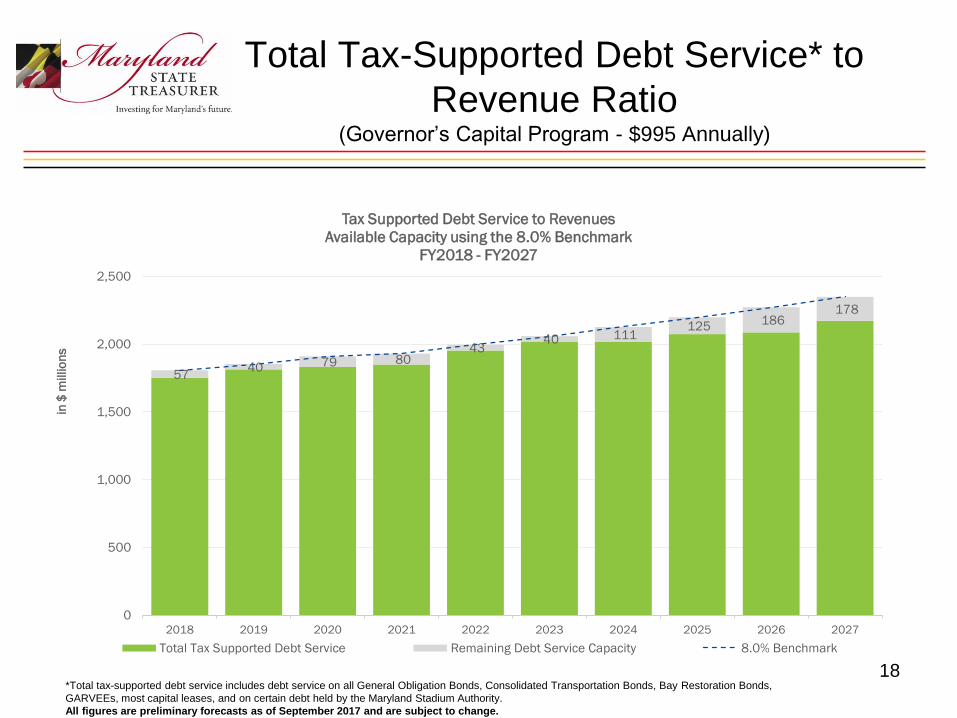
Total Tax-Supported Debt Service* to
Revenue Ratio(Governor’s Capital Program - $995 Annually)
18*Total tax-supported debt service includes debt service on all General Obligation Bonds, Consolidated Transportation Bonds, Bay Restoration Bonds,
GARVEEs, most capital leases, and on certain debt held by the Maryland Stadium Authority.
All figures are preliminary forecasts as of September 2017 and are subject to change.
57 40 79 80
43 40 111
125 186 178
0
500
1,000
1,500
2,000
2,500
2018 2019 2020 2021 2022 2023 2024 2025 2026 2027
in $
millions
Tax Supported Debt Service to Revenues
Available Capacity using the 8.0% Benchmark
FY2018 - FY2027
Total Tax Supported Debt Service Remaining Debt Service Capacity 8.0% Benchmark

Total Tax-Supported Debt Service* to
Revenue Ratio(Dec. 2016 SAC Recommendation – 1% Growth)
19*Total tax-supported debt service includes debt service on all General Obligation Bonds, Consolidated Transportation Bonds, Bay Restoration Bonds,
GARVEEs, most capital leases, and on certain debt held by the Maryland Stadium Authority.
All figures are preliminary forecasts as of September 2017 and are subject to change.
57 40 77 75
33 23 85
89 137
117
0
500
1,000
1,500
2,000
2,500
2018 2019 2020 2021 2022 2023 2024 2025 2026 2027
in $
millions
Tax Supported Debt Service to Revenues
Available Capacity using the 8.0% Benchmark
FY2018 - FY2027
Total Tax Supported Debt Service Remaining Debt Service Capacity 8.0% Benchmark
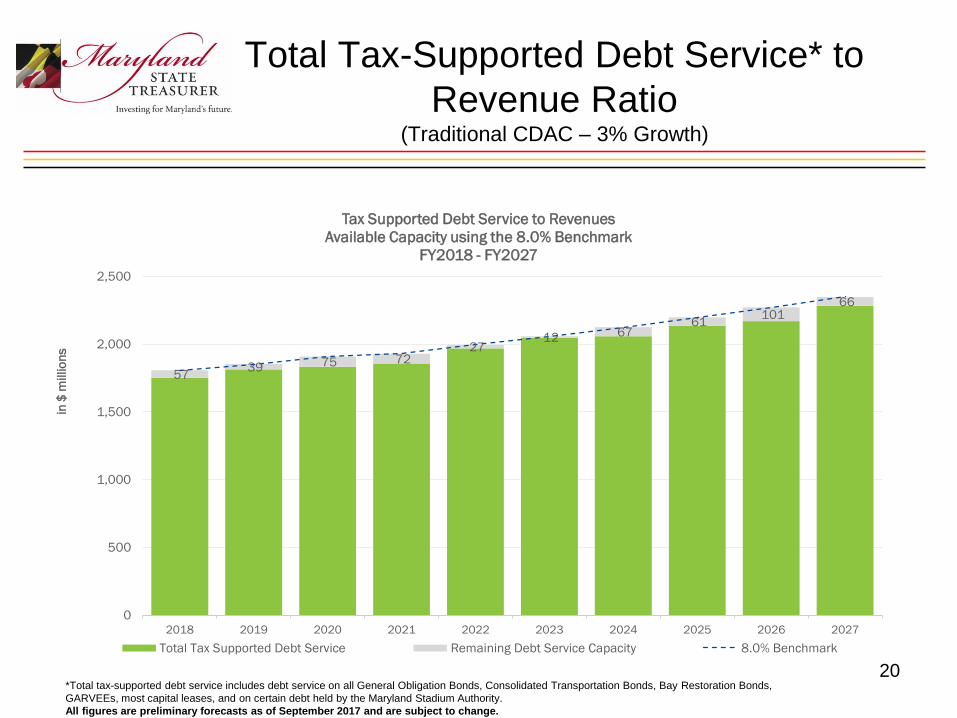
Total Tax-Supported Debt Service* to
Revenue Ratio(Traditional CDAC – 3% Growth)
20*Total tax-supported debt service includes debt service on all General Obligation Bonds, Consolidated Transportation Bonds, Bay Restoration Bonds,
GARVEEs, most capital leases, and on certain debt held by the Maryland Stadium Authority.
All figures are preliminary forecasts as of September 2017 and are subject to change.
57 39 75 72
27 12 67
61 101
66
0
500
1,000
1,500
2,000
2,500
2018 2019 2020 2021 2022 2023 2024 2025 2026 2027
in $
millions
Tax Supported Debt Service to Revenues
Available Capacity using the 8.0% Benchmark
FY2018 - FY2027
Total Tax Supported Debt Service Remaining Debt Service Capacity 8.0% Benchmark
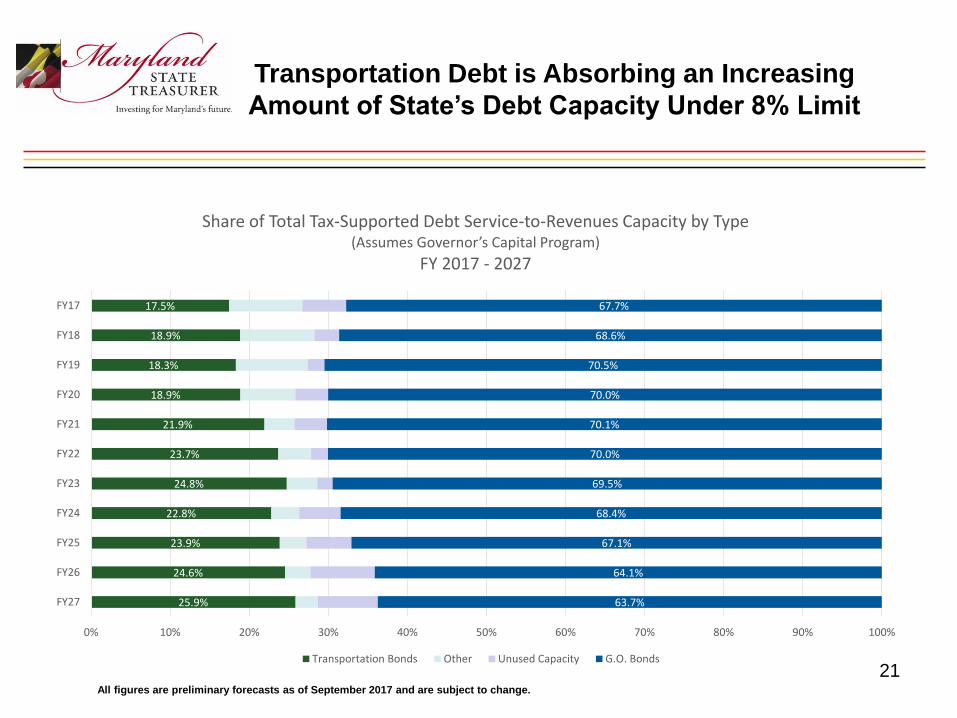
Transportation Debt is Absorbing an Increasing
Amount of State’s Debt Capacity Under 8% Limit
21All figures are preliminary forecasts as of September 2017 and are subject to change.
17.5%
18.9%
18.3%
18.9%
21.9%
23.7%
24.8%
22.8%
23.9%
24.6%
25.9%
67.7%
68.6%
70.5%
70.0%
70.1%
70.0%
69.5%
68.4%
67.1%
64.1%
63.7%
0% 10% 20% 30% 40% 50% 60% 70% 80% 90% 100%
FY17
FY18
FY19
FY20
FY21
FY22
FY23
FY24
FY25
FY26
FY27
Share of Total Tax-Supported Debt Service-to-Revenues Capacity by Type(Assumes Governor’s Capital Program)
FY 2017 - 2027
Transportation Bonds Other Unused Capacity G.O. Bonds
General Obligation Bond
Authorization
22
2017 CDAC General Obligation
Bond Authorization
• CDAC needs to vote on its recommendation for a General
Obligation Bond authorization for FY 2019.
• CDAC votes on the upcoming fiscal year’s authorization (FY 2019).
Assumed authorizations for FY 2020 – 2027 are for planning
purposes only and subject to change.
23
Academic Facilities Bonds
Authorization
24
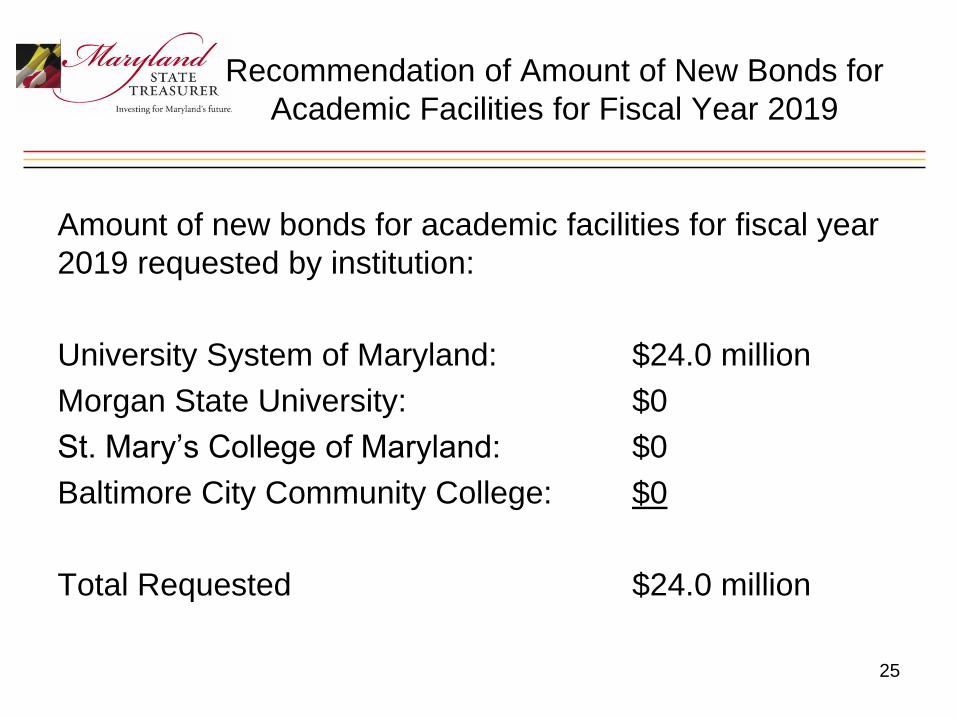
Recommendation of Amount of New Bonds for
Academic Facilities for Fiscal Year 2019
Amount of new bonds for academic facilities for fiscal year
2019 requested by institution:
University System of Maryland: $24.0 million
Morgan State University: $0
St. Mary’s College of Maryland: $0
Baltimore City Community College: $0
Total Requested $24.0 million
25