Embed Size (px)
Citation preview
2021 Income and Affordability Study April 15, 2021 N
ew Y
ork
Cit
y R
ent G
uid
elin
es B
oa
rd
Board Members
Chair: David Reiss Public Members: Christina DeRose • Christian Gonzalez-Rivera • Cecilia Joza • Alex Schwartz Owner Members: Scott Walsh • Vacant Tenant Members: Sheila Garcia • Leah Goodridge
Staff Members
Executive Director: Andrew McLaughlin Research Director: Brian Hoberman Deputy Research Director: Danielle Burger Office Manager: Charmaine Superville

New York City Rent Guidelines Board 1 Centre Street, Suite 2210, New York, NY 10007 l 212-669-7480 l nyc.gov/rgb
New York City Rent Guidelines Board • April 15, 2021 • Page 3
New York City Rent Guidelines Board 2021 Income and Affordability Study
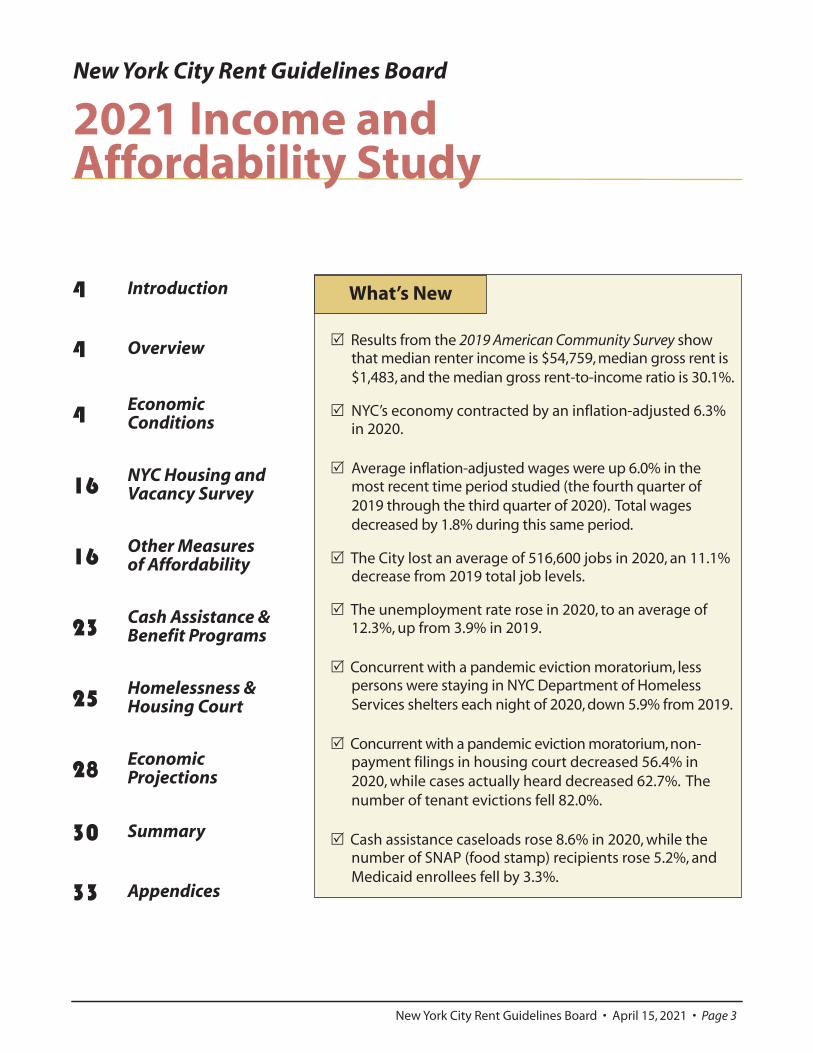
R Results from the 2019 American Community Survey show that median renter income is $54,759, median gross rent is $1,483, and the median gross rent-to-income ratio is 30.1%.
R NYC’s economy contracted by an inflation-adjusted 6.3%
in 2020. R Average inflation-adjusted wages were up 6.0% in the
most recent time period studied (the fourth quarter of 2019 through the third quarter of 2020). Total wages decreased by 1.8% during this same period.
R The City lost an average of 516,600 jobs in 2020, an 11.1%
decrease from 2019 total job levels. R The unemployment rate rose in 2020, to an average of
12.3%, up from 3.9% in 2019. R Concurrent with a pandemic eviction moratorium, less
persons were staying in NYC Department of Homeless Services shelters each night of 2020, down 5.9% from 2019.
R Concurrent with a pandemic eviction moratorium, non-
payment filings in housing court decreased 56.4% in 2020, while cases actually heard decreased 62.7%. The number of tenant evictions fell 82.0%.
R Cash assistance caseloads rose 8.6% in 2020, while the
number of SNAP (food stamp) recipients rose 5.2%, and Medicaid enrollees fell by 3.3%.
What’s New4 Introduction
4 Overview
4 Economic Conditions
16 NYC Housing and Vacancy Survey
16 Other Measures of Affordability
23 Cash Assistance & Benefit Programs
25 Homelessness & Housing Court
28 Economic Projections
30 Summary
33 Appendices
2021 Income and Affordability Study
Page 4 • April 15, 2021 • New York City Rent Guidelines Board
Introduction Section 26-510(b) of the Rent Stabilization Law requires the Rent Guidelines Board (RGB) to consider “relevant data from the current and projected cost of living indices” and permits consideration of other measures of housing affordability in its deliberations. To assist the Board in meeting this obligation, the RGB research staff produces an annual Income and Affordability Study, which reports on housing affordability and tenant income in the New York City (NYC) rental market.
This study highlights year-to-year changes in many of the major economic factors affecting NYC’s tenant population and takes into consideration a broad range of market forces and public policies affecting housing affordability, such as unemployment rates; wages; housing court and eviction data; and rent and poverty levels.
This report focuses on data from 2020, which includes the first two to three months of 2020 (pre-pandemic), when the economy in NYC was strong. As such, special attention will be given in this report to highlight quarterly 2020 data to provide a better comparison of the current economic condition of NYC and its residents.
Overview NYC’s economy in 2020 showed many weaknesses as compared with the preceding year. Negative indicators include shrinking employment levels, which fell for the first time in 11 years, decreasing 11.1% in 2020. Gross City Product (GCP) decreased for the first time in 12 years, falling in inflation-adjusted terms by 6.3% in 2020. The unemployment rate rose, increasing by 8.4 percentage points, to 12.3%, the highest level recorded in at least the last 45 years. There was also an increase in cash assistance caseloads of 8.6%, while SNAP caseloads rose 5.2%.
Positive indicators during 2020 include a decrease in both the number of non-payment filings and calendared cases in Housing Court, which fell by 56.4% and 62.7%, respectively, as well as a decrease in tenant evictions, which fell by 82.0% (all largely due to various eviction moratoriums in place since the start of the pandemic). Homeless
levels also fell for the second consecutive year, by 5.9%. There was also a decrease in Medicaid enrollees, which fell 3.3%. Concurrent with Court closures, bankruptcy filings also decreased sharply, falling 40.7%, to the lowest level since at least 2000. In addition, average inflation-adjusted wages rose during the most recent 12-month period for which data is available (the fourth quarter of 2019 through the third quarter of 2020), rising 6.0% over the corresponding time period of the prior year (note that while average wages rose, total wages paid within NYC fell, by an inflation-adjusted 1.8%). Inflation remained steady between 2019 and 2020, at 1.7% in each year.
The most recent numbers, from the fourth quarter of 2020 (as compared to the fourth quarter of 2019), show many negative indicators, including cash assistance levels up 15.4%; SNAP recipients up 11.2%; Medicaid enrollees, up 1.2%; GCP falling, by 6.6% in real terms; employment levels down 13.2%; and the unemployment rate up 8.3 percentage points. However, homeless levels are down 10.6%; and in Housing Court, the number of cases heard (calendared) are down 50.9%1 and the number of non-payment filings are down 43.5%.2 A new appendix, Appendix 12, summarizes the change in each of these data points for each quarter of 2020.
We can also examine fourth quarter data in relation to the third quarter of 2020, which illustrates potentially positive trends. Accounting for seasonal changes in jobs, there was a decrease of 4.0 percentage points in the NYC unemployment rate in the fourth quarter of 2020 as compared to the third, and an increase of 2.6% in total employment. There was also a decrease of 2.1% in both homelessness and cash assistance recipients, while SNAP caseloads declined by 1.5% and Medicaid enrollment was virtually unchanged. On an annualized basis, GCP increased by 6.0% in the fourth quarter of 2020 as compared to the third.
Economic Conditions Economic Output and Consumer Prices NYC’s economy contracted during 2020, shrinking for the first time in 12 years.3 NYC’s Gross City
2021 Income and Affordability Study
New York City Rent Guidelines Board • April 15, 2021 • Page 5
Product (GCP), which measures the total value of goods and services produced, decreased by 6.3% in inflation-adjusted (“real”) terms during 2020, following an increase of 1.2% in 2019. Prior to 2020, there had been positive economic growth in real terms in all but four quarters since the first of 2009. During 2020, as compared to the preceding quarter, GCP (in real terms) fell an annualized 6.8% during the first quarter and 35.6% during the second quarter, before rising 19.9% during the third quarter and 6.0% during the fourth quarter. For 2020 as a whole, United States Gross Domestic Product (GDP), decreased by a lesser amount than NYC, contracting a “real” 3.5% during 2020, compared to an increase of 2.2% during 2019.4
The Consumer Price Index (CPI), which measures the change in the cost of typical household goods, increased 1.7% in the NYC metropolitan area during 2020, the same rate of inflation as seen in the
previous year.5 While in many recent years inflation in the NYC area has been lower than that in the U.S. as a whole, in 2020 inflation nationwide was half a percentage point lower than that of the local area, rising 1.2%.
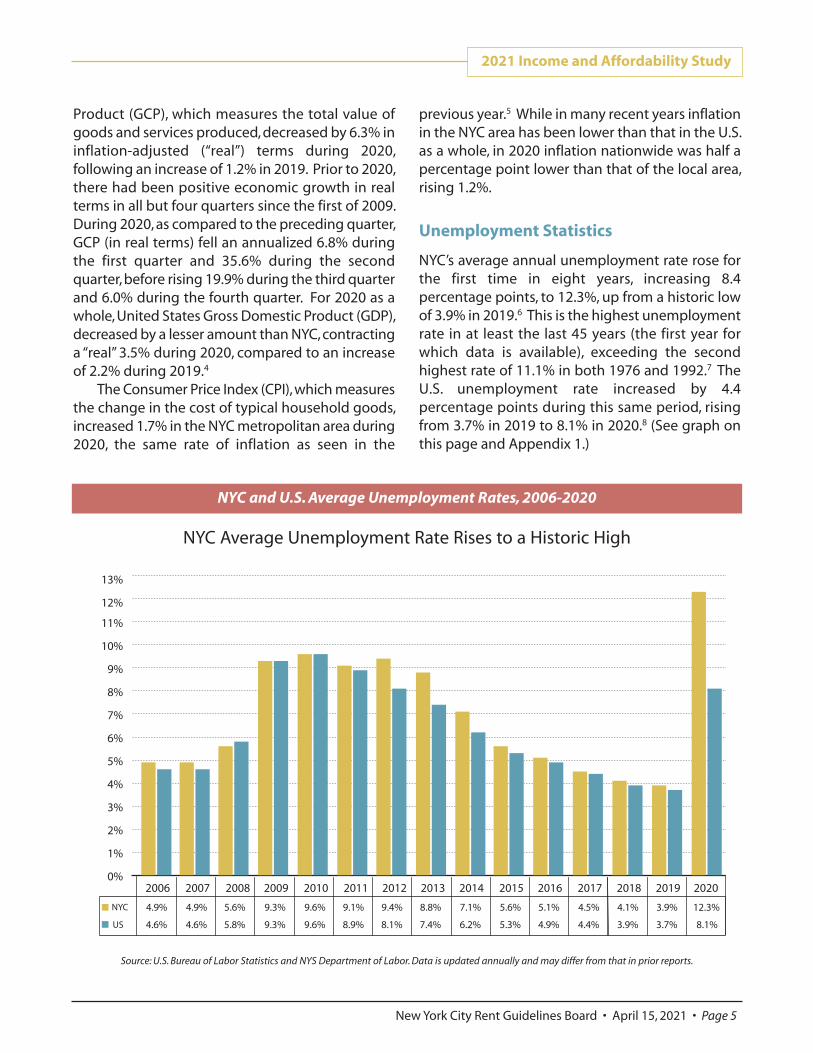
Unemployment Statistics NYC’s average annual unemployment rate rose for the first time in eight years, increasing 8.4 percentage points, to 12.3%, up from a historic low of 3.9% in 2019.6 This is the highest unemployment rate in at least the last 45 years (the first year for which data is available), exceeding the second highest rate of 11.1% in both 1976 and 1992.7 The U.S. unemployment rate increased by 4.4 percentage points during this same period, rising from 3.7% in 2019 to 8.1% in 2020.8 (See graph on this page and Appendix 1.)
0%
1%
2%
3%
4%
5%
6%
7%
8%
9%
10%
11%
12%
13%
4.9%
4.6%
NYC
US
2006
4.9%
4.6%
5.6%
5.8%
9.3%
9.3%
2007 2009
9.6% 9.1%
9.6% 8.9%
9.4%
8.1%
2010 2011 2012
8.8%
7.4%
2013
7.1%
6.2%
5.6%
5.3%
2014 2015
5.1%
4.9%
20162008
4.5%
4.4%
2017
4.1%
3.9%
2018
3.9%
3.7%
2019 2020
12.3%
8.1%
Source: U.S. Bureau of Labor Statistics and NYS Department of Labor. Data is updated annually and may differ from that in prior reports.
NYC Average Unemployment Rate Rises to a Historic High
NYC and U.S. Average Unemployment Rates, 2006-2020
Annual unemployment data includes the first quarter of 2020, largely before the pandemic hit the nation. While the unemployment rate fell half a percentage point during the first quarter of 2020, to 3.9%, it was 18.1% in the second quarter; 16.1% in the third quarter; and 11.7% in the fourth quarter. These are increases in the second, third, and fourth quarters of 14.4, 12.3, and 8.3 percentage points, respectively, as compared to the same quarters of the previous year. Comparing the second through fourth quarters of 2019 to 2020, average unemployment levels rose from 3.7% to 15.3%.
For 2020 as a whole, at the borough level, Manhattan had the lowest average unemployment rate, 9.5%, with Staten Island at 10.6%; Brooklyn and Queens, both at 12.5%; and the Bronx, consistently the borough with the highest unemployment rate, 16.0%. Unemployment rates rose in every borough during 2020, increasing 6.1 percentage points in Manhattan; 6.8 percentage points in Staten Island; 8.5 percentage points in Brooklyn; 9.1 percentage points in Queens; and 10.7 percentage points in the Bronx. Rates decreased in each borough during the first quarter of 2020 as compared to the same quarter of 2019, but increased in the second through fourth quarters of 2020, including the greatest proportional increase, 17.1 percentage points, during the second quarter of 2020 (in the Bronx). (See Appendix 12 for unemployment data by quarter.)
In January and February of 2021, the most recently available data, the unemployment rate for NYC (13.1% and 13.2%, respectively) was above that of the same months of the previous year, with the rate 9.3 percentage points higher in January and 9.4 percentage points higher in February. The seasonally adjusted unemployment rate (which allows for comparisons of the unemployment rate from month to month by accounting for seasonal changes in employment), was 12.0% in each month from October through December of 2020, before rising in 2021, to 12.6% in January and 12.9% in February (the most recently available data). At the national level, the unemployment rate was 6.8% in January of 2021 and 6.6% in February, 2.8 percentage points higher than both January and February of 2020. The seasonally adjusted national unemployment rate fell in each of the first two
months of 2021, down from 6.7% in both November and December of 2020, to 6.3% in January and 6.2% in February of 2021.
Initial Unemployment Claims The NYS Department of Labor (for the period of March 21, 2020 through March 27, 2021) and the U.S. Department of Labor publish weekly estimates of initial unemployment claims, defined as a claimant request for a determination of basic eligibility for unemployment insurance.9
While the number of initial claims for unemployment insurance is an imperfect proxy for the unemployment rate (as not all persons who initially claim are deemed eligible, and the number of persons receiving unemployment insurance is normally fluid, as people lose work and receive unemployment insurance, and others obtain work and no longer collect), it is the most recent data currently available in regard to the labor force.
For context, in the last full month before the COVID-19 virus caused wide-spread shutdowns, there were 4.12 million persons in the NYC labor force. The unemployment rate was 3.8% and there were 154,700 persons unemployed.10 The number of initial claims for unemployment insurance was approximately 5,000 persons per week.11
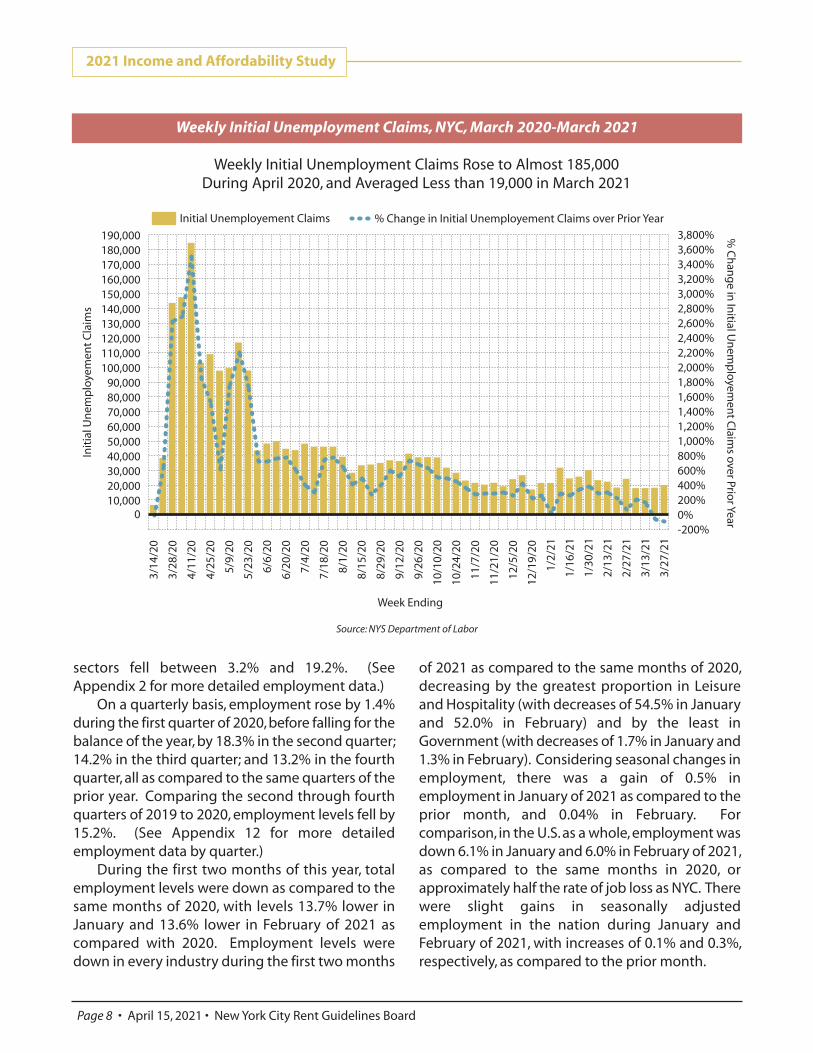
Initial unemployment claims in the first weeks of the pandemic rose exponentially (see graph on Page 8), rising by the greatest proportion in the week ending April 11, 2020, when initial claims in NYC rose by 3,516% (from 5,103 in the same week of the prior year to 184,525). This was a greater proportional increase than that seen in the U.S. as a whole in the same week, an increase of 2,394%. For the 52-week period of March 14, 2020 through March 6, 2021 (the first full year of the pandemic), the total number of initial claims is up 647% (or 2,133,298 claims) in NYC as compared to the same period in the prior year (see table on the next page). As the table on the next page also illustrates, at the borough level, for the first full year of the pandemic, claims rose by the smallest proportion in Manhattan, rising approximately 515% (or 321,810 claims); followed by Staten Island, at 534% (or 96,397 claims); Brooklyn, at 637% (or 648,191
2021 Income and Affordability Study
Page 6 • April 15, 2021 • New York City Rent Guidelines Board
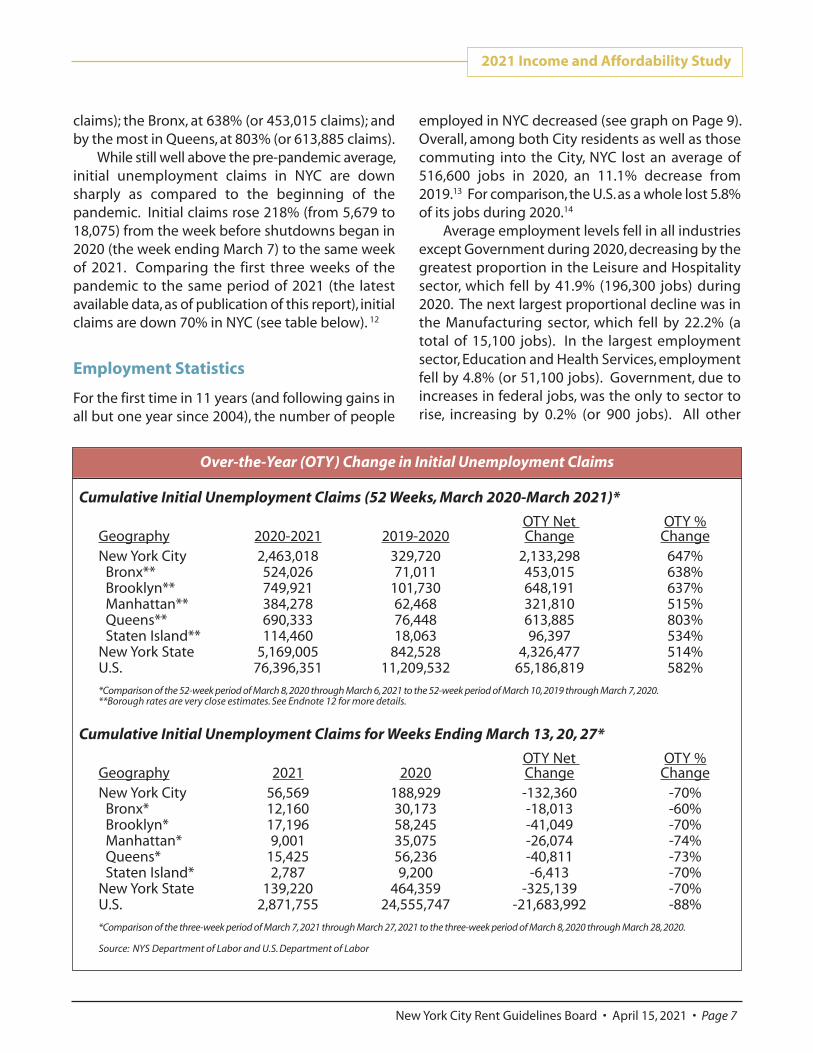
claims); the Bronx, at 638% (or 453,015 claims); and by the most in Queens, at 803% (or 613,885 claims). While still well above the pre-pandemic average, initial unemployment claims in NYC are down sharply as compared to the beginning of the pandemic. Initial claims rose 218% (from 5,679 to 18,075) from the week before shutdowns began in 2020 (the week ending March 7) to the same week of 2021. Comparing the first three weeks of the pandemic to the same period of 2021 (the latest available data, as of publication of this report), initial claims are down 70% in NYC (see table below). 12
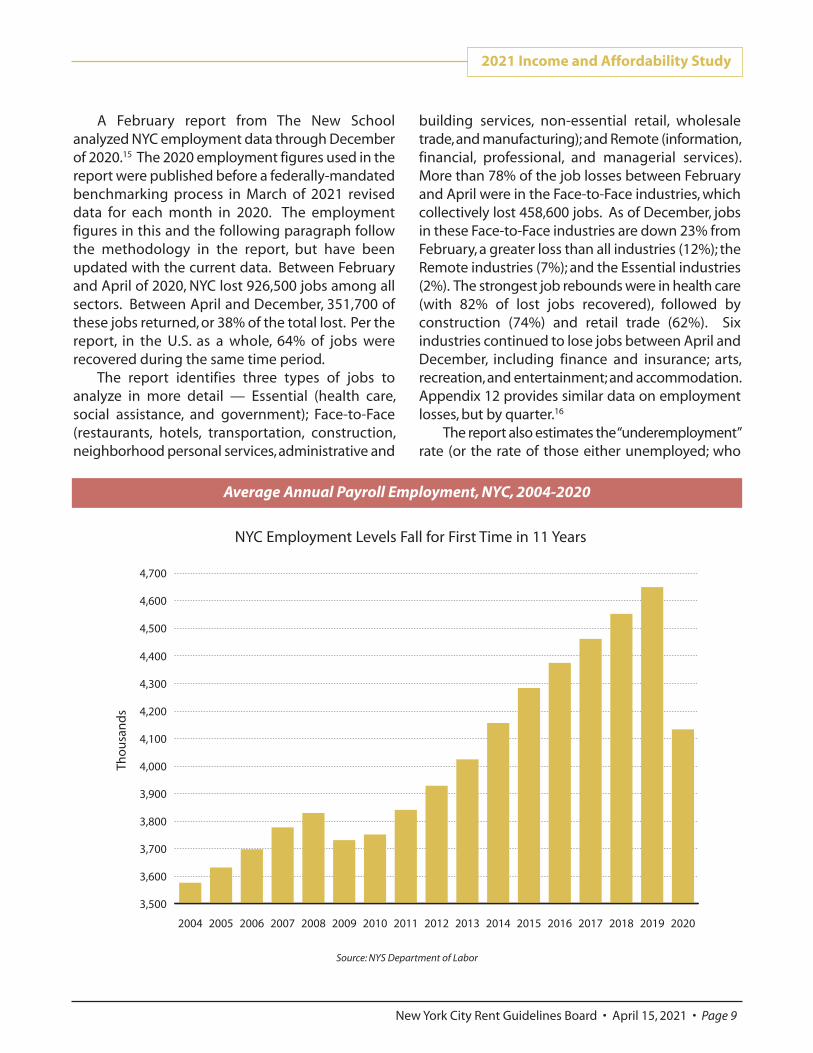
Employment Statistics For the first time in 11 years (and following gains in all but one year since 2004), the number of people
employed in NYC decreased (see graph on Page 9). Overall, among both City residents as well as those commuting into the City, NYC lost an average of 516,600 jobs in 2020, an 11.1% decrease from 2019.13 For comparison, the U.S. as a whole lost 5.8% of its jobs during 2020.14
Average employment levels fell in all industries except Government during 2020, decreasing by the greatest proportion in the Leisure and Hospitality sector, which fell by 41.9% (196,300 jobs) during 2020. The next largest proportional decline was in the Manufacturing sector, which fell by 22.2% (a total of 15,100 jobs). In the largest employment sector, Education and Health Services, employment fell by 4.8% (or 51,100 jobs). Government, due to increases in federal jobs, was the only to sector to rise, increasing by 0.2% (or 900 jobs). All other
2021 Income and Affordability Study
New York City Rent Guidelines Board • April 15, 2021 • Page 7
Cumulative Initial Unemployment Claims (52 Weeks, March 2020-March 2021)*
OTY Net OTY % Geography 2020-2021 2019-2020 Change Change New York City 2,463,018 329,720 2,133,298 647% Bronx** 524,026 71,011 453,015 638% Brooklyn** 749,921 101,730 648,191 637% Manhattan** 384,278 62,468 321,810 515% Queens** 690,333 76,448 613,885 803% Staten Island** 114,460 18,063 96,397 534% New York State 5,169,005 842,528 4,326,477 514% U.S. 76,396,351 11,209,532 65,186,819 582% *Comparison of the 52-week period of March 8, 2020 through March 6, 2021 to the 52-week period of March 10, 2019 through March 7, 2020. **Borough rates are very close estimates. See Endnote 12 for more details.
Cumulative Initial Unemployment Claims for Weeks Ending March 13, 20, 27*
OTY Net OTY % Geography 2021 2020 Change Change New York City 56,569 188,929 -132,360 -70% Bronx* 12,160 30,173 -18,013 -60% Brooklyn* 17,196 58,245 -41,049 -70% Manhattan* 9,001 35,075 -26,074 -74% Queens* 15,425 56,236 -40,811 -73% Staten Island* 2,787 9,200 -6,413 -70% New York State 139,220 464,359 -325,139 -70% U.S. 2,871,755 24,555,747 -21,683,992 -88% *Comparison of the three-week period of March 7, 2021 through March 27, 2021 to the three-week period of March 8, 2020 through March 28, 2020. Source: NYS Department of Labor and U.S. Department of Labor
Over-the-Year (OTY) Change in Initial Unemployment Claims
sectors fell between 3.2% and 19.2%. (See Appendix 2 for more detailed employment data.)
On a quarterly basis, employment rose by 1.4% during the first quarter of 2020, before falling for the balance of the year, by 18.3% in the second quarter; 14.2% in the third quarter; and 13.2% in the fourth quarter, all as compared to the same quarters of the prior year. Comparing the second through fourth quarters of 2019 to 2020, employment levels fell by 15.2%. (See Appendix 12 for more detailed employment data by quarter.)
During the first two months of this year, total employment levels were down as compared to the same months of 2020, with levels 13.7% lower in January and 13.6% lower in February of 2021 as compared with 2020. Employment levels were down in every industry during the first two months
of 2021 as compared to the same months of 2020, decreasing by the greatest proportion in Leisure and Hospitality (with decreases of 54.5% in January and 52.0% in February) and by the least in Government (with decreases of 1.7% in January and 1.3% in February). Considering seasonal changes in employment, there was a gain of 0.5% in employment in January of 2021 as compared to the prior month, and 0.04% in February. For comparison, in the U.S. as a whole, employment was down 6.1% in January and 6.0% in February of 2021, as compared to the same months in 2020, or approximately half the rate of job loss as NYC. There were slight gains in seasonally adjusted employment in the nation during January and February of 2021, with increases of 0.1% and 0.3%, respectively, as compared to the prior month.
2021 Income and Affordability Study
Page 8 • April 15, 2021 • New York City Rent Guidelines Board
010,00020,00030,00040,00050,00060,00070,00080,00090,000
100,000110,000120,000130,000140,000150,000160,000170,000180,000190,000
-200%0%200%400%600%800%1,000%1,200%1,400%1,600%1,800%2,000%2,200%2,400%2,600%2,800%3,000%3,200%3,400%3,600%3,800%
3/27
/21
3/13
/21
2/27
/21
2/13
/21
1/30
/21
1/16
/21
1/2/
21
12/1
9/20
12/5
/20
11/2
1/20
11/7
/20
10/2
4/20
10/1
0/20
9/26
/20
9/12
/20
8/29
/20
8/15
/20
8/1/
20
7/18
/20
7/4/
20
6/20
/20
6/6/
20
5/23
/20
5/9/
20
4/25
/20
4/11
/20
3/28
/20
3/14
/20
% Change in Initial Unemployement Claims over Prior YearInitial Unemployement Claims
Init
ial U
nem
plo
yem
ent
Cla
ims
% C
han
ge in
Initial U
nem
ployem
ent C
laims over Prio
r Year
Week Ending
Weekly Initial Unemployment Claims Rose to Almost 185,000 During April 2020, and Averaged Less than 19,000 in March 2021
Source: NYS Department of Labor
Weekly Initial Unemployment Claims, NYC, March 2020-March 2021
A February report from The New School analyzed NYC employment data through December of 2020.15 The 2020 employment figures used in the report were published before a federally-mandated benchmarking process in March of 2021 revised data for each month in 2020. The employment figures in this and the following paragraph follow the methodology in the report, but have been updated with the current data. Between February and April of 2020, NYC lost 926,500 jobs among all sectors. Between April and December, 351,700 of these jobs returned, or 38% of the total lost. Per the report, in the U.S. as a whole, 64% of jobs were recovered during the same time period.
The report identifies three types of jobs to analyze in more detail — Essential (health care, social assistance, and government); Face-to-Face (restaurants, hotels, transportation, construction, neighborhood personal services, administrative and
building services, non-essential retail, wholesale trade, and manufacturing); and Remote (information, financial, professional, and managerial services). More than 78% of the job losses between February and April were in the Face-to-Face industries, which collectively lost 458,600 jobs. As of December, jobs in these Face-to-Face industries are down 23% from February, a greater loss than all industries (12%); the Remote industries (7%); and the Essential industries (2%). The strongest job rebounds were in health care (with 82% of lost jobs recovered), followed by construction (74%) and retail trade (62%). Six industries continued to lose jobs between April and December, including finance and insurance; arts, recreation, and entertainment; and accommodation. Appendix 12 provides similar data on employment losses, but by quarter.16
The report also estimates the “underemployment” rate (or the rate of those either unemployed; who
2021 Income and Affordability Study
New York City Rent Guidelines Board • April 15, 2021 • Page 9
3,500
3,600
3,700
3,800
3,900
4,000
4,100
4,200
4,300
4,400
4,500
4,600
4,700
20202019201820172016201520142013201220112010200920082007200620052004
Tho
usa
nd
s
NYC Employment Levels Fall for First Time in 11 Years
Source: NYS Department of Labor
Average Annual Payroll Employment, NYC, 2004-2020
have dropped out of the labor force; or are involuntarily working part-time). Based on estimates of the change in the labor force and the number of persons receiving partial unemployment insurance benefits, the report estimates an “underemployment” rate of 24.5% in NYC as of December of 2020. The actual unemployment rate was 12.3% in December, per the NYS Department of Labor.
The report also estimates the change in total wages for the three previously identified types of jobs (similar data is also explored in more detail in the Wage Data section of this report, below, and in Appendix 13). It is estimated that although average wages in both the Face-to-Face and Essential industries are approximately one-third that of the Remote industries ($61,521, $65,128, and $188,718, respectively, as of 2019), in 2020 total wages in Face-to-Face industries may have declined by as much as $27.9 billion, while falling an estimated $5.3 billion in Essential industries, and $11.4 billion in Remote industries.
Two other employment indices are tracked in the I&A Study. The NYC labor force participation rate measures the proportion of all non-institutionalized people, age 16 and older, who are employed or actively looking for work. This ratio decreased in 2020, to 58.6%, down from 60.4% in 2019, and the lowest level since at least 2001.17 This was lower than the U.S. rate, which fell from 63.1% in 2019 to 61.7% in 2020, and is at its lowest level since 1976.18 A related statistic, the NYC employment/population ratio, measures the proportion of those who are actually employed as a ratio of all non-institutionalized people age 16 or older. This rate fell to its lowest level since at least 2000, from 58.1% in 2019 to 51.4% in 2020. The U.S. employment/population ratio also fell in 2020, decreasing 4.0 percentage points from 2019, to reach 56.8%. This is the lowest level since 1976 (when it was also 56.8%).
Wage Data This report also examines wage data of employees working in NYC (regardless of where they live). Highly accurate wage data can be derived from the NYS Department of Labor’s Quarterly Census of Employment and Wages (QCEW), though the
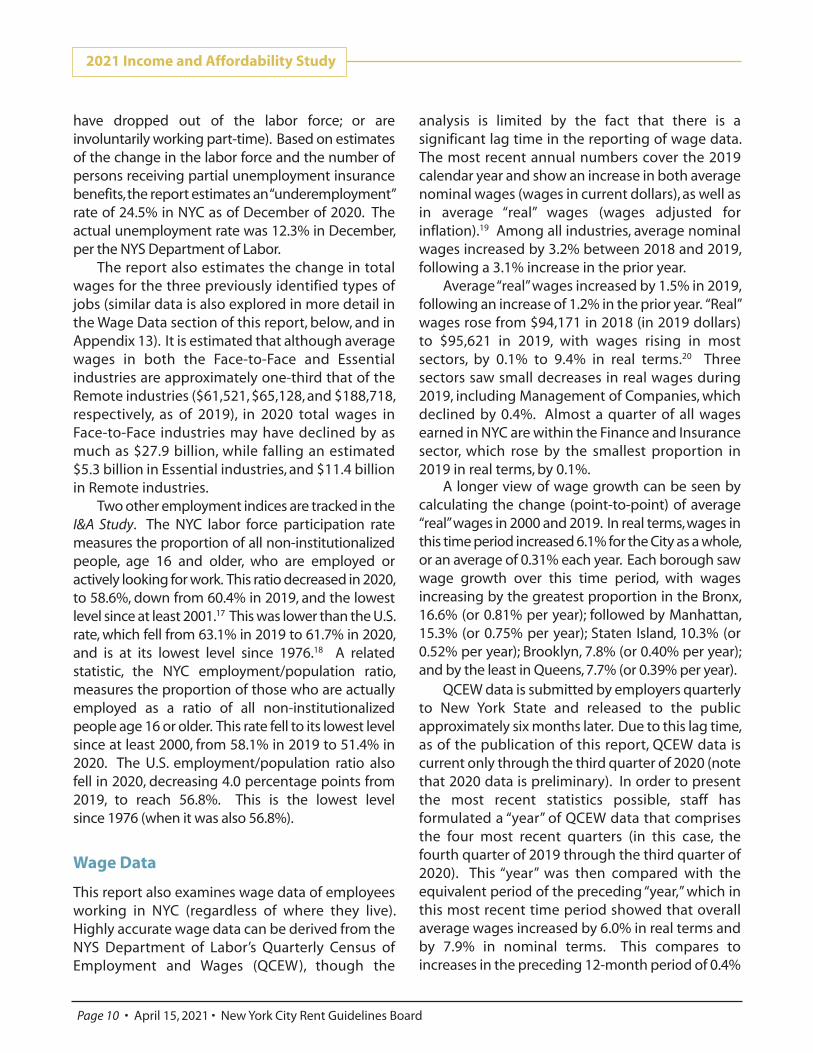
analysis is limited by the fact that there is a significant lag time in the reporting of wage data. The most recent annual numbers cover the 2019 calendar year and show an increase in both average nominal wages (wages in current dollars), as well as in average “real” wages (wages adjusted for inflation).19 Among all industries, average nominal wages increased by 3.2% between 2018 and 2019, following a 3.1% increase in the prior year.
Average “real” wages increased by 1.5% in 2019, following an increase of 1.2% in the prior year. “Real” wages rose from $94,171 in 2018 (in 2019 dollars) to $95,621 in 2019, with wages rising in most sectors, by 0.1% to 9.4% in real terms.20 Three sectors saw small decreases in real wages during 2019, including Management of Companies, which declined by 0.4%. Almost a quarter of all wages earned in NYC are within the Finance and Insurance sector, which rose by the smallest proportion in 2019 in real terms, by 0.1%.
A longer view of wage growth can be seen by calculating the change (point-to-point) of average “real” wages in 2000 and 2019. In real terms, wages in this time period increased 6.1% for the City as a whole, or an average of 0.31% each year. Each borough saw wage growth over this time period, with wages increasing by the greatest proportion in the Bronx, 16.6% (or 0.81% per year); followed by Manhattan, 15.3% (or 0.75% per year); Staten Island, 10.3% (or 0.52% per year); Brooklyn, 7.8% (or 0.40% per year); and by the least in Queens, 7.7% (or 0.39% per year).
QCEW data is submitted by employers quarterly to New York State and released to the public approximately six months later. Due to this lag time, as of the publication of this report, QCEW data is current only through the third quarter of 2020 (note that 2020 data is preliminary). In order to present the most recent statistics possible, staff has formulated a “year” of QCEW data that comprises the four most recent quarters (in this case, the fourth quarter of 2019 through the third quarter of 2020). This “year” was then compared with the equivalent period of the preceding “year,” which in this most recent time period showed that overall average wages increased by 6.0% in real terms and by 7.9% in nominal terms. This compares to increases in the preceding 12-month period of 0.4%
2021 Income and Affordability Study
Page 10 • April 15, 2021 • New York City Rent Guidelines Board
in real terms and 2.1% in nominal terms. (See Appendices 3 and 4, and graph on this page.)
Note that the average wage is the amount of total wages paid in NYC, divided by the total employment in NYC. Therefore, average wages can increase even as employment and total wages decrease. This was the case in NYC during the past year, when employment levels and total wages dropped in both the second and third quarters of 2020, but average wages increased. Detailed information on total wages and employment (as opposed to the data on average wages, which follows) can be found later in this section and in Appendix 13.
Average wages grew in each borough during the most recent 12-month time period, including an increase in “real” wages of 7.7% in Manhattan, which accounts for three-quarters of the wages earned within NYC. “Real” wages in the outer boroughs grew at a slower pace than Manhattan, with wages rising 2.7% in Queens, 2.9% in the Bronx, 3.6% in Brooklyn, and 4.1% in Staten Island.
Average wages in the Finance and Insurance sector, which account for a quarter of total wages during the most recent time period, increased by a
“real” 2.3% during the most recent 12-month time period. This compares to a decrease of 4.7% in the prior 12-month period. Average “real” wages in this sector increased in every quarter of the most recent time period. The sector with the second greatest weight, Professional and Technical Services sector (accounting for 14% of all wages) rose by a “real” 3.0%. The Government sector (with 11% of all wages) rose by 0.04%. The Health and Social Services sector (accounting for 10% of all wages), rose by a “real” 2.5% during this time period. Just two sectors saw average wages decrease in real terms, but account for only 3.9% of overall wages. (See Appendices 3 and 4 for more detailed wage data.)
On a quarterly basis, average “real” wages as reported by the QCEW rose by 0.6% in the first quarter of 2020, 11.8% in the second quarter, and 8.8% in the third quarter. “Yearly” wage growth also includes the fourth quarter of 2019, when average wages rose 2.0% in real terms. Each year this report estimates “yearly” QCEW average wage change absent the impact of the Finance and Insurance sector. Overall wages are often pulled higher or lower as a result of this sector, which has both the largest proportion of overall wages, as well as the highest average wages. In 2020, this sector had the effect of slightly increasing overall average wages. If the Finance and Insurance sector were removed from the analysis, average wages would have risen by 5.4% in real terms and 7.3% in nominal terms, lower than the overall growth of 6.0% and 7.9%, respectively.
As previously noted, average wage growth was strong in the most recent 12-month period, despite steep job losses. In 2020, while average wages rose for those who remained employed (mainly because a greater proportion of those who make higher wages retained their jobs than those who make a lower wage), hundreds of thousands of individuals working in NYC lost employment. Total wages are the amount of wages paid to all employees during each quarter. During the most recent 12-month time period, total wages fell by 1.8% in inflation-adjusted, “real” terms and by 0.04% in nominal terms. Average employment for this period fell by 7.3%. While there were gains in both average employment and total wages during the fourth quarter of 2019 and the first
2021 Income and Affordability Study
New York City Rent Guidelines Board • April 15, 2021 • Page 11
$65,000
$70,000
$75,000
$80,000
$85,000
$90,000
$95,000
$100,000
$105,000
2020
2019
2018
2017
2016
2015
2014
2013
2012
2011
2010
2009
2008
2007
2006
2005
Nominal Wages Real Wages (2020$)
Both Average “Real” and Nominal Wages Increase in 2020
Avg. “Real” and Nominal Wages, 2005-2020
Source: NYS Department of Labor
Note: Due to lag times in data reporting, each “year” consists of the first three quarters of that year, and the fourth quarter of the preceding year.
quarter of 2020, both declined during the second and third quarters of 2020.
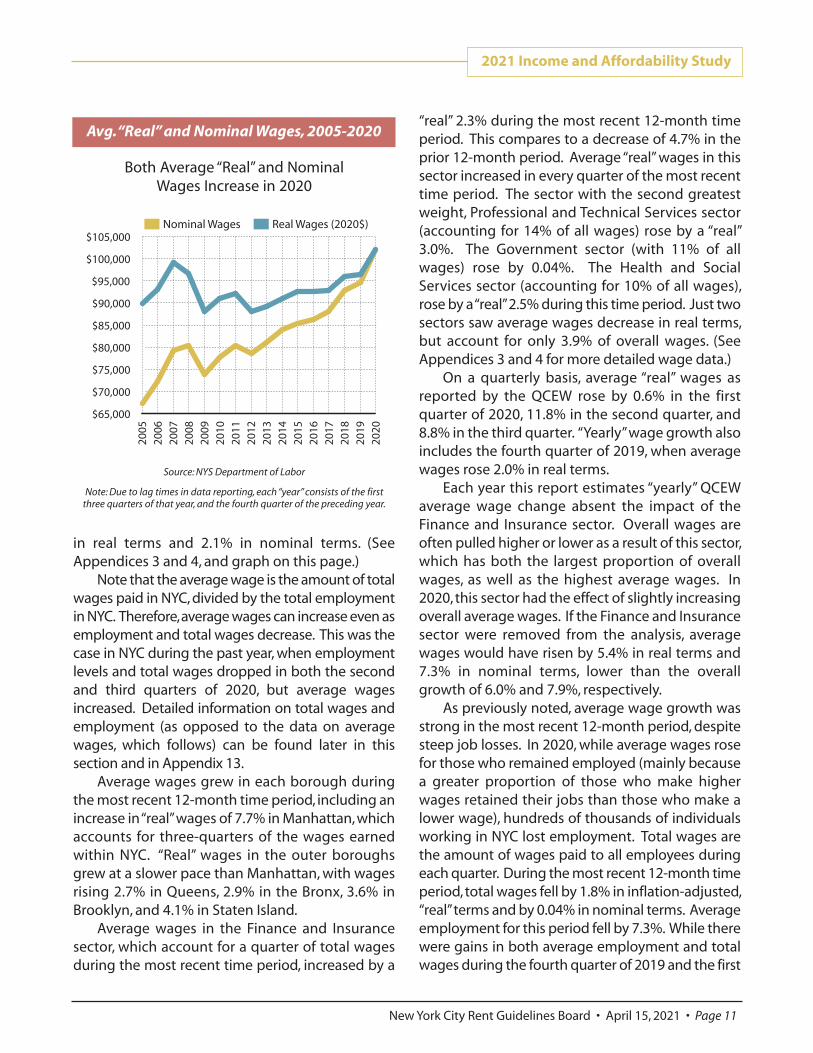
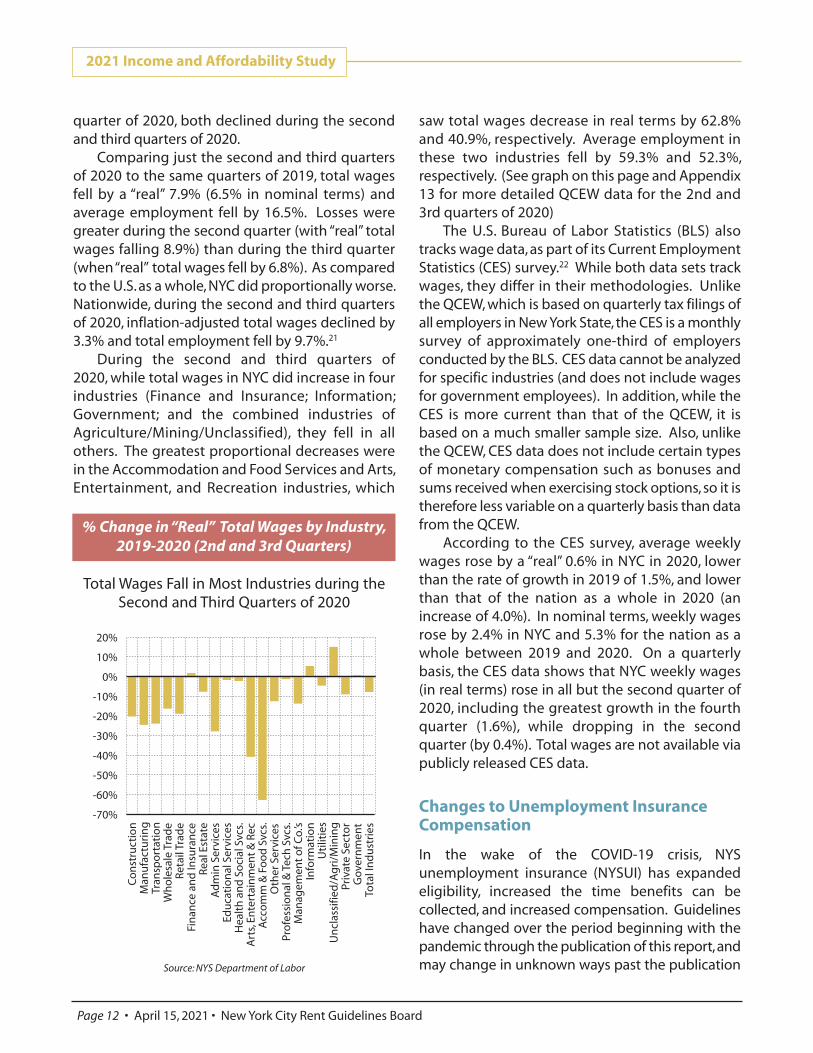
Comparing just the second and third quarters of 2020 to the same quarters of 2019, total wages fell by a “real” 7.9% (6.5% in nominal terms) and average employment fell by 16.5%. Losses were greater during the second quarter (with “real” total wages falling 8.9%) than during the third quarter (when “real” total wages fell by 6.8%). As compared to the U.S. as a whole, NYC did proportionally worse. Nationwide, during the second and third quarters of 2020, inflation-adjusted total wages declined by 3.3% and total employment fell by 9.7%.21
During the second and third quarters of 2020, while total wages in NYC did increase in four industries (Finance and Insurance; Information; Government; and the combined industries of Agriculture/Mining/Unclassified), they fell in all others. The greatest proportional decreases were in the Accommodation and Food Services and Arts, Entertainment, and Recreation industries, which
saw total wages decrease in real terms by 62.8% and 40.9%, respectively. Average employment in these two industries fell by 59.3% and 52.3%, respectively. (See graph on this page and Appendix 13 for more detailed QCEW data for the 2nd and 3rd quarters of 2020)
The U.S. Bureau of Labor Statistics (BLS) also tracks wage data, as part of its Current Employment Statistics (CES) survey.22 While both data sets track wages, they differ in their methodologies. Unlike the QCEW, which is based on quarterly tax filings of all employers in New York State, the CES is a monthly survey of approximately one-third of employers conducted by the BLS. CES data cannot be analyzed for specific industries (and does not include wages for government employees). In addition, while the CES is more current than that of the QCEW, it is based on a much smaller sample size. Also, unlike the QCEW, CES data does not include certain types of monetary compensation such as bonuses and sums received when exercising stock options, so it is therefore less variable on a quarterly basis than data from the QCEW.
According to the CES survey, average weekly wages rose by a “real” 0.6% in NYC in 2020, lower than the rate of growth in 2019 of 1.5%, and lower than that of the nation as a whole in 2020 (an increase of 4.0%). In nominal terms, weekly wages rose by 2.4% in NYC and 5.3% for the nation as a whole between 2019 and 2020. On a quarterly basis, the CES data shows that NYC weekly wages (in real terms) rose in all but the second quarter of 2020, including the greatest growth in the fourth quarter (1.6%), while dropping in the second quarter (by 0.4%). Total wages are not available via publicly released CES data.
Changes to Unemployment Insurance Compensation In the wake of the COVID-19 crisis, NYS unemployment insurance (NYSUI) has expanded eligibility, increased the time benefits can be collected, and increased compensation. Guidelines have changed over the period beginning with the pandemic through the publication of this report, and may change in unknown ways past the publication
2021 Income and Affordability Study
Page 12 • April 15, 2021 • New York City Rent Guidelines Board
-70%
-60%
-50%
-40%
-30%
-20%
-10%
0%
10%
20%
Tota
l In
du
stri
esG
over
nm
ent
Priv
ate
Sect
or
Un
clas
sifie
d/A
gri
/Min
ing
Uti
litie
sIn
form
atio
nM
anag
emen
t o
f Co.
’sPr
ofe
ssio
nal
& T
ech
Svc
s.O
ther
Ser
vice
sA
cco
mm
& F
oo
d S
vcs.
Art
s, En
tert
ain
men
t &
Rec
Hea
lth
an
d S
oci
al S
vcs.
Edu
cati
on
al S
ervi
ces
Ad
min
Ser
vice
sRe
al E
stat
eFi
nan
ce a
nd
Insu
ran
ceRe
tail
Trad
eW
ho
lesa
le T
rad
eTr
ansp
ort
atio
nM
anu
fact
uri
ng
Co
nst
ruct
ion
Total Wages Fall in Most Industries during the Second and Third Quarters of 2020
% Change in “Real” Total Wages by Industry, 2019-2020 (2nd and 3rd Quarters)
Source: NYS Department of Labor
of this report. Among the changes to NYSUI since March of 2020, the post-pandemic federal Pandemic Unemployment Assistance (PUA) program expands eligibility for some of those who do not typically qualify for unemployment insurance.23 The new eligibility guidelines include the self-employed, parents caring for children who are currently home-schooled, and those who are taking care of a family member with COVID-19 or who experienced the death of the head of household due to COVID-19, among other categories. Individuals who are eligible for PUA are compensated at the same rates as those who qualify for NYSUI.
In addition, during certain time periods, all recipients of either PUA or NYSUI received additional compensation through the federal Pandemic Unemployment Compensation (PUC) program. Prior to the COVID-19 crisis, the maximum NYSUI compensation was $504 per week (or $2,184 per month), for those making $52,416 per year or more. The typical compensation for those making below $52,416 is half of the salary the claimant was earning before becoming unemployed.24 For the period of March 30 through July 26, 2020, PUC added an extra $600 per week to both NYSUI and PUA compensation.25 This made the maximum payment $1,104 per week (or $4,784 per month), an increase of 110% over normal NYSUI levels. The lower the level of NYSUI compensation, the greater the proportional increase of total compensation after the addition of the $600 PUC payment. Those making $40,000 per year received $984 per week (or $4,264 per month), an increase of 156%, while those making $20,000 a year saw a 313% increase in their weekly unemployment compensation. Between August and December of 2020, compensation returned to pre-pandemic levels, with the exception of September, when the Lost Wages Assistance Program (LWA) provided retroactive payments of $300 per week for the six-week period from the end of July through the beginning of September to those beneficiaries who certified they lost employment due to COVID-19.26 Income then rose again beginning in the week ending January 3, 2021, by $300 per week, with this extra compensation lasting through at least the week ending September 4, 2021.27
Post-pandemic guidelines also increase the
maximum number of weeks benefits can be claimed. Instead of the pre-pandemic maximum of 26 weeks of NYSUI, benefits (as of the publication of this report) now last up to 99 weeks, or through at least September 5, 2021.28
The graph on the next page illustrates monthly unemployment compensation received by three hypothetical single-earner households since the start of the pandemic — a household with one minimum wage worker, previously making $31,200 per year; a one-income household previously making the estimated median rent stabilized household income in 2019, ($49,000 per year);29 and a single-earner, higher-income household, previously making $80,000 per year. The graph illustrates the monthly NYSUI or PUA payments that would be received by each of these sample households over time, beginning with March of 2020, when an unemployed person was solely eligible for NYSUI. The graph then estimates payments from April through July of 2020, when both the PUA and PUC programs began, and those receiving unemployment received an extra $600 per week through PUC. Between August and December of 2020 (with the exception of September, when qualified beneficiaries received retroactive LWA payments of up to $1,800), payments for NYSUI and PUA return to the same level as in March, because the legislation authorizing PUC payments expired. In both January and March of 2021, Congress authorized additional PUC payments, for $300 a week, lasting until at least the beginning of September of 2021.
The three dashed “baselines” show the amount of monthly income each of the sample households was making while working full-time. As the graph illustrates, both the minimum wage household and the rent stabilized household would receive half of their pre-unemployment income from NYSUI in March of 2020, while the higher-income household receives one-third of their former income, and only slightly more than the rent stabilized sample household. In April of 2020, both the minimum wage household and the rent stabilized household would receive more in NYSUI/PUA and PUC payments than they were making working full-time, while the higher-income household is still at a loss. With the exception
2021 Income and Affordability Study
New York City Rent Guidelines Board • April 15, 2021 • Page 13
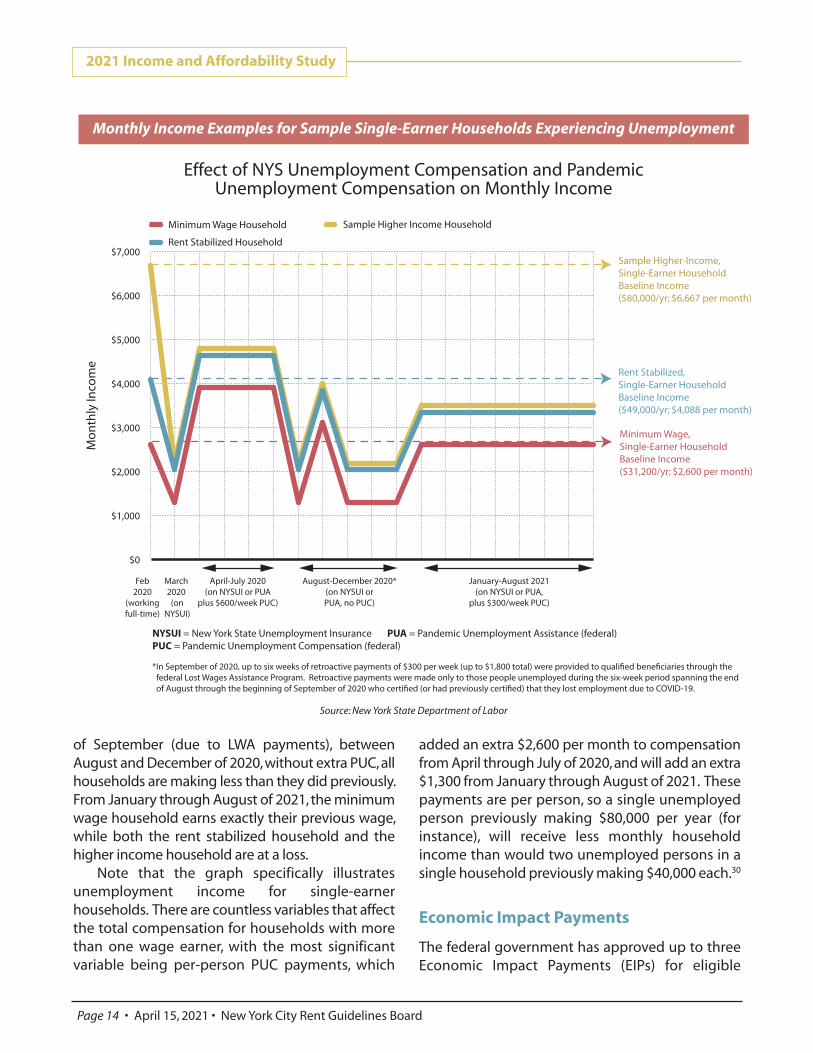
of September (due to LWA payments), between August and December of 2020, without extra PUC, all households are making less than they did previously. From January through August of 2021, the minimum wage household earns exactly their previous wage, while both the rent stabilized household and the higher income household are at a loss.
Note that the graph specifically illustrates unemployment income for single-earner households. There are countless variables that affect the total compensation for households with more than one wage earner, with the most significant variable being per-person PUC payments, which
added an extra $2,600 per month to compensation from April through July of 2020, and will add an extra $1,300 from January through August of 2021. These payments are per person, so a single unemployed person previously making $80,000 per year (for instance), will receive less monthly household income than would two unemployed persons in a single household previously making $40,000 each.30
Economic Impact Payments The federal government has approved up to three Economic Impact Payments (EIPs) for eligible
2021 Income and Affordability Study
Page 14 • April 15, 2021 • New York City Rent Guidelines Board
Minimum Wage, Single-Earner Household Baseline Income($31,200/yr; $2,600 per month)
Rent Stabilized, Single-Earner Household Baseline Income($49,000/yr; $4,088 per month)
Sample Higher-Income, Single-Earner Household Baseline Income($80,000/yr; $6,667 per month)
NYSUI = New York State Unemployment Insurance PUA = Pandemic Unemployment Assistance (federal)PUC = Pandemic Unemployment Compensation (federal) *In September of 2020, up to six weeks of retroactive payments of $300 per week (up to $1,800 total) were provided to qualified beneficiaries through the federal Lost Wages Assistance Program. Retroactive payments were made only to those people unemployed during the six-week period spanning the end of August through the beginning of September of 2020 who certified (or had previously certified) that they lost employment due to COVID-19.
Mo
nth
ly In
com
e
$0
$1,000
$2,000
$3,000
$4,000
$5,000
$6,000
$7,000
Minimum Wage Household
Rent Stabilized Household
Sample Higher Income Household
January-August 2021(on NYSUI or PUA,
plus $300/week PUC)
August-December 2020*(on NYSUI orPUA, no PUC)
April-July 2020(on NYSUI or PUA
plus $600/week PUC)
March 2020
(onNYSUI)
Feb2020
(workingfull-time)
Effect of NYS Unemployment Compensation and Pandemic Unemployment Compensation on Monthly Income
Monthly Income Examples for Sample Single-Earner Households Experiencing Unemployment
Source: New York State Department of Labor
households since the beginning of the pandemic. At the end of March, 2020, payments of up to $1,200 for individuals (or $2,400 for married couples), with an additional $500 for each qualifying child, were authorized for distribution.31 A second EIP was authorized at the end of December, 2020, with payments of up to $600 for individuals (or $1,200 for married couples), in addition to $600 per qualifying child.32 The third EIP was authorized in March, 2021, with payments of up to $1,400 for individuals (or $2,800 for married couples) and $1,400 for each qualifying dependent.33 For each of these EIPs, full payment was phased out at $75,000 (or $150,000 for married couples).
Bankruptcy Statistics In 2020, for the first time in five years, personal bankruptcy filings fell among NYC residents. There were 6,511 filings in 2020, a 40.7% decrease from the prior year and the lowest level since at least 2000. Filings in the U.S. also fell, by 30.5%.34 The United States Courts note that “Filings fell sharply in the early months of the pandemic, starting in March 2020, when many courts offered limited access to the public. In addition, bankruptcy filings can lag behind other economic indicators. Following the Great Recession, which began in 2007, new filings escalated until they peaked in 2010.”35
Poverty Statistics The most recently available data from the Census Bureau’s American Community Survey (ACS) reports that the NYC poverty rate for all individuals was 16.0% in 2019, 1.2 percentage points lower than in 2018.36 This compares to 12.3% for the nation as a whole, a decline of 0.8 percentage points from 2018. Poverty rates vary widely depending on borough. Rates range from a low of 8.3% in Staten Island, to 10.8% in Queens, 14.0% in Manhattan, 17.7% in Brooklyn, and 26.4% in the Bronx, consistently the highest rate of the boroughs. As compared to the prior year, rates fell in every borough, by as much as 3.2 percentage points. (See Appendix 8.)
Also reported are poverty rates by age. The poverty rate for persons under the age of 18 in NYC
was 22.2% in 2019. The rate was 13.5% for individuals 18 to 64 and 18.4% for persons 65 years and over. For families, 12.4% were living under the poverty line in 2019. This includes 3.9% of families in owner-occupied units and 17.8% of families in rental units (the lowest proportion for families in rental units since at least 2005, the first year for which data is available). For families containing related children under the age of 18, the figure is 17.9%, higher than that of all families. For married-couple families, the overall poverty rate was 7.5% in 2019, while for female- and male-headed families (i.e., no spouse present) it was 23.3% and 11.8%, respectively. As compared to the prior year, rates fell for every category noted here, including a decrease of 2.5 percentage points for female-headed families and 2.4 percentage points for families in renter-occupied units.
The Census Bureau now produces an annual “Supplemental Poverty Measure,” an additional measure of poverty that includes more components (such as non-cash benefits and location, among other factors) in estimating income and expenses.37 Using a similar methodology, the NYC Center for Economic Opportunity (CEO) calculated household poverty rates for NYC from 2005-2018 and found poverty rates higher than official rates released by the Census Bureau.38 For instance, the official household poverty rate in 2018 was 16.1% and the CEO estimate was 19.1%. The gap between official and CEO estimates has been as high as 3.0 percentage points (in both 2007 and 2018) over the 14 years studied by the CEO.
Researchers from three universities have created a model for estimating nationwide poverty levels in real time using data from the monthly Current Population Survey (conducted by the Census Bureau).39 Their research shows that during the first few months of the pandemic, poverty at the national level fell as the government provided enhanced unemployment benefits and a stimulus check. The poverty rate fell from an estimated 10.7 percent in January 2020 to 9.4 percent in June 2020. The authors report that, “In the last 6 months of 2020, however, poverty rose sharply, as some of the benefits that were part of the initial government relief package expired. Poverty rose by 2 percentage points from 9.4 percent in June to 11.4
2021 Income and Affordability Study
New York City Rent Guidelines Board • April 15, 2021 • Page 15
percent in December, adding 6.7 million people to the ranks of the poor. Poverty rose each month between June and November even though the unemployment rate fell by 40 percent (from 11.1 percent to 6.7 percent) during this period. This disconnect between poverty and unemployment is not surprising given that many government benefits expired, unemployment insurance benefits are typically only about half of pre-job loss earnings, and over five million people have left the labor force in the past year and therefore are not counted as unemployed.“ The researchers continue to update their estimates of poverty each month, and report that the estimated nationwide poverty rate in February of 2021 is 11.2%.40
2017 Housing & Vacancy Survey Results from the 2017 Housing and Vacancy Survey (HVS) were released in February of 2018.41 This triennial survey provides data on the housing and demographic characteristics of NYC residents, including affordability of housing, rents, incomes, and vacancy rates for both tenants and owners. It is also the only survey that is able to provide data specifically for rent stabilized tenants. Detailed 2017 HVS data can be found in the 2018 and 2019 I&A Studies. The most recent HVS survey was postponed from 2020 to 2021. Preliminary data from the 2021 HVS is expected to be released in 2022.
Other Measures of Income & Affordability American Community Survey In addition to the triennial HVS, the Census Bureau also publishes an annual study, the American Community Survey (ACS). 42 Unlike the HVS, the ACS cannot provide data specifically for rent stabilized tenants, but does provide in-depth data on contract rent (the rent received by the owner of a property); gross rent (contract rent, in addition to the cost of utilities); and incomes for renters as a whole. Detailed ACS data by borough, for NYC as a whole, the U.S., and comparison cities can be found in Appendices 9 through 11.
2021 Income and Affordability Study
Page 16 • April 15, 2021 • New York City Rent Guidelines Board
29.0%
29.5%
30.0%
30.5%
31.0%
31.5%
32.0%
32.5%
33.0%
2019
2018
2017
2016
2015
2014
2013
2012
2011
2010
2009
2008
2007
2006
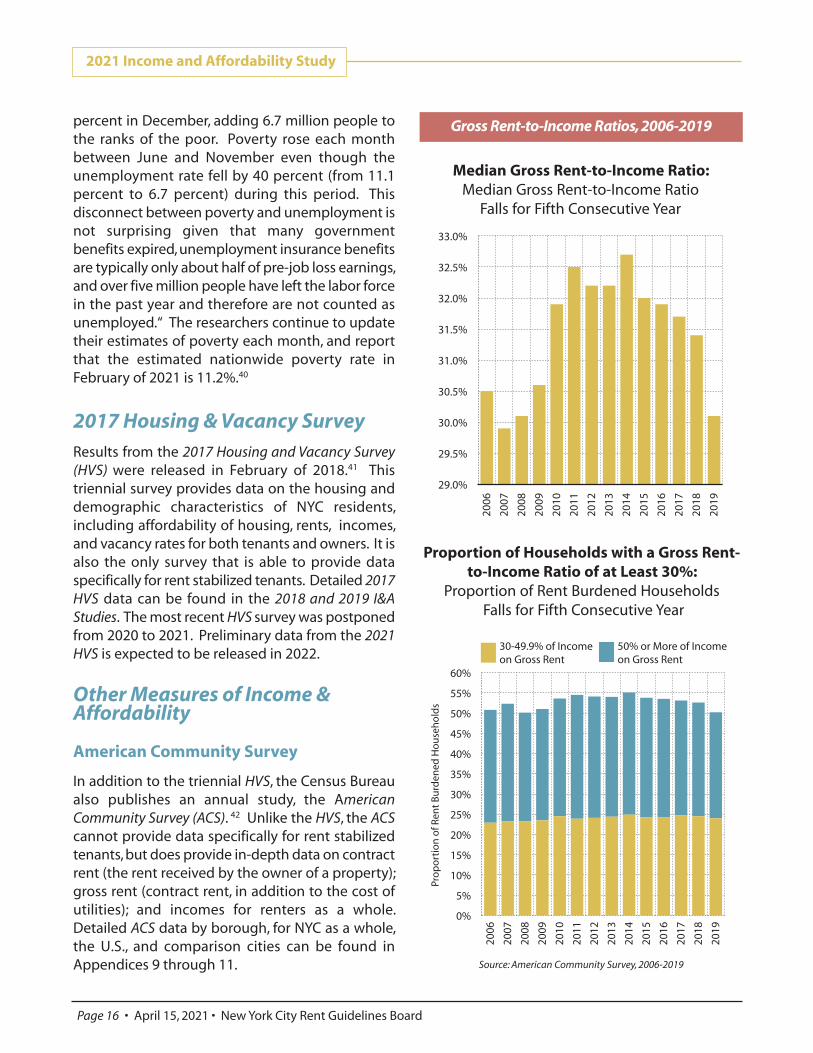
Median Gross Rent-to-Income Ratio: Median Gross Rent-to-Income Ratio
Falls for Fifth Consecutive Year
Gross Rent-to-Income Ratios, 2006-2019
0%
5%
10%
15%
20%
25%
30%
35%
40%
45%
50%
55%
60%
2019
2018
2017
2016
2015
2014
2013
2012
2011
2010
2009
2008
2007
2006
Pro
po
rtio
n o
f Ren
t B
urd
ened
Ho
use
ho
lds
50% or More of Income on Gross Rent
30-49.9% of Income on Gross Rent
Proportion of Households with a Gross Rent-to-Income Ratio of at Least 30%:
Proportion of Rent Burdened Households Falls for Fifth Consecutive Year
Source: American Community Survey, 2006-2019
According to the most recent survey, the 2019 ACS, NYC’s median gross rent-to-income ratio ranks 38th highest among 89 big cities (those with populations of at least 250,000), as compared to 24th highest in 2018. At 30.1%, the median gross rent-to-income ratio in NYC fell 1.3 percentage points from 2018 levels (see graph on the previous page). By borough, rates ranged from a low of 26.1% in Manhattan, to 29.5% in Staten Island, 30.2% in Brooklyn, 30.3% in Queens, and 35.2% in the Bronx. This ratio fell in every borough as compared to 2018, including declines of 1.8 percentage points in Queens, 1.6 percentage points in Manhattan, 1.5 percentage points in Brooklyn, 0.6 percentage points in the Bronx, and 0.4 percentage points in Staten Island.
The proportion of households Citywide paying 30% or more of their income towards gross rent fell for the fifth consecutive year, decreasing from 52.6% to 50.1% (see graph on the previous page). The proportion paying 50% or more also fell for the fifth consecutive year, decreasing from 28.1% to 26.2%. At the borough level, rates ranged from 21.0% of households paying at least 50% of their income towards gross rent in Manhattan, to 23.3% in Staten Island; 26.2% in Brooklyn; 26.6% in Queens; and 33.3% of households in the Bronx.
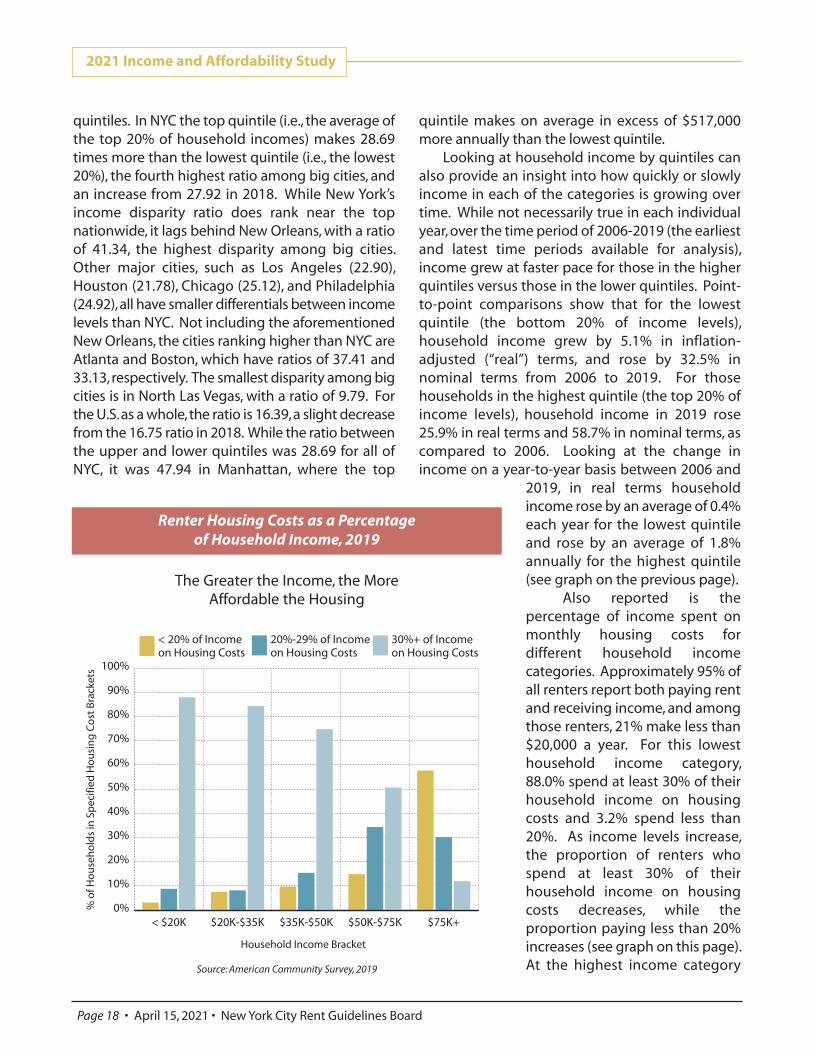
This survey also reports that the median contract rent in NYC in 2019 was $1,385, and the median gross rent was $1,483 (see graph on this page). Between 2018 and 2019, median monthly contract rents for all apartments in NYC increased an inflation-adjusted (“real”) 1.9% and median gross rents increased by 1.1%. In nominal terms the increases were 3.6% and 2.8%, respectively. Median gross rents were highest in Manhattan ($1,753) and lowest in the Bronx ($1,231). Inflation-adjusted gross rents fell by 1.2% in Manhattan and 1.0% in Staten Island, but rose by 1.7% in Queens, 1.8% in Brooklyn, and 1.9% in the Bronx.
During 2019, median household income rose both nominally and in real terms, by 8.8% and 7.0% respectively, to $69,407. Median household income for renters rose by a greater proportion than that of owner households, rising by a “real” 7.0% and 4.4%, respectively. Since the inception of this survey in 2005, renter income has fluctuated in “real” 2019 dollars from a low of $42,548 in 2011 to a high of $54,759 in 2019.
Measuring income inequality, the survey also provides average household income for cities in
2021 Income and Affordability Study
New York City Rent Guidelines Board • April 15, 2021 • Page 17
$1,050
$1,100
$1,150
$1,200
$1,250
$1,300
$1,350
$1,400
$1,450
$1,500
2019
2018
2017
2016
2015
2014
2013
2012
2011
2010
2009
2008
2007
2006
Contract Rent Gross Rent
Inflation-Adjusted Median Contract and Gross Rents Climb Annually
Source: American Community Survey, 2006-2019
Median Rent in Constant 2019 Dollars, 2006-2019
0.0%
0.5%
1.0%
1.5%
2.0%
2.5%
3.0%
3.5%
4.0%
HighestQuintile
FourthQuintile
ThirdQuintile
SecondQuintile
LowestQuintile
“Real” Change Nominal Change
Avg
. An
nu
al C
han
ge
in H
ou
seh
old
Inco
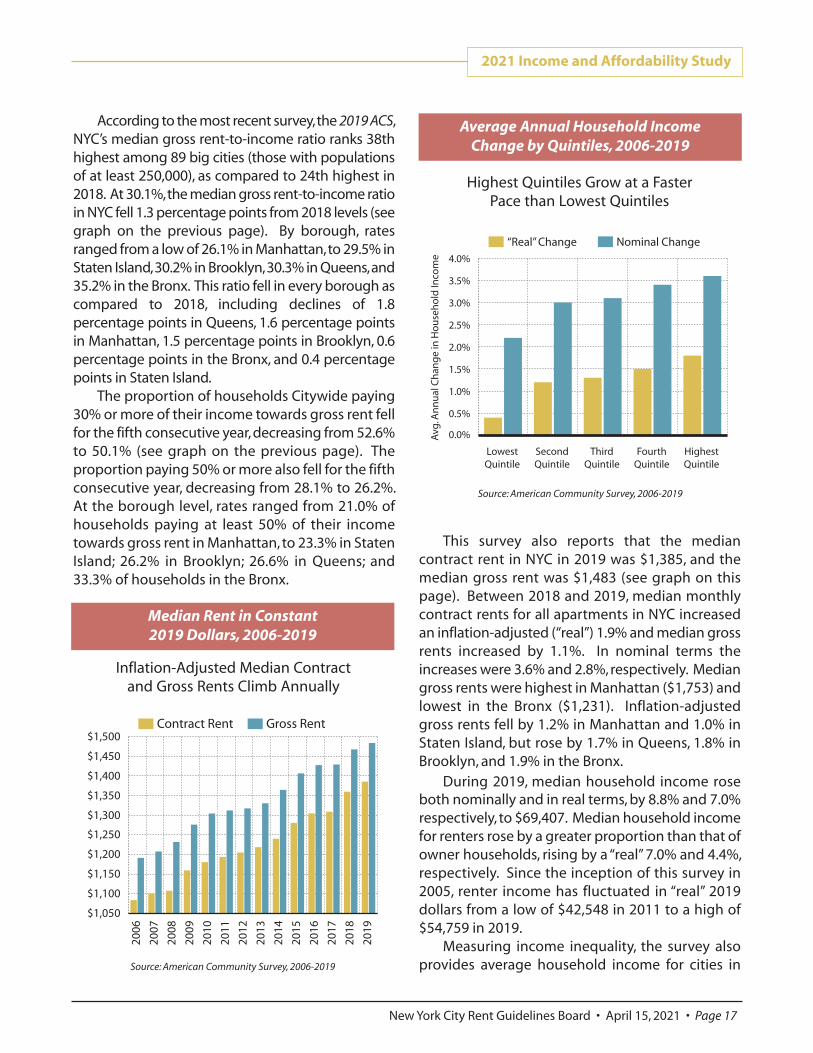
me
Highest Quintiles Grow at a Faster Pace than Lowest Quintiles
Source: American Community Survey, 2006-2019
Average Annual Household Income Change by Quintiles, 2006-2019
quintiles. In NYC the top quintile (i.e., the average of the top 20% of household incomes) makes 28.69 times more than the lowest quintile (i.e., the lowest 20%), the fourth highest ratio among big cities, and an increase from 27.92 in 2018. While New York’s income disparity ratio does rank near the top nationwide, it lags behind New Orleans, with a ratio of 41.34, the highest disparity among big cities. Other major cities, such as Los Angeles (22.90), Houston (21.78), Chicago (25.12), and Philadelphia (24.92), all have smaller differentials between income levels than NYC. Not including the aforementioned New Orleans, the cities ranking higher than NYC are Atlanta and Boston, which have ratios of 37.41 and 33.13, respectively. The smallest disparity among big cities is in North Las Vegas, with a ratio of 9.79. For the U.S. as a whole, the ratio is 16.39, a slight decrease from the 16.75 ratio in 2018. While the ratio between the upper and lower quintiles was 28.69 for all of NYC, it was 47.94 in Manhattan, where the top
quintile makes on average in excess of $517,000 more annually than the lowest quintile.
Looking at household income by quintiles can also provide an insight into how quickly or slowly income in each of the categories is growing over time. While not necessarily true in each individual year, over the time period of 2006-2019 (the earliest and latest time periods available for analysis), income grew at faster pace for those in the higher quintiles versus those in the lower quintiles. Point-to-point comparisons show that for the lowest quintile (the bottom 20% of income levels), household income grew by 5.1% in inflation-adjusted (“real”) terms, and rose by 32.5% in nominal terms from 2006 to 2019. For those households in the highest quintile (the top 20% of income levels), household income in 2019 rose 25.9% in real terms and 58.7% in nominal terms, as compared to 2006. Looking at the change in income on a year-to-year basis between 2006 and
2019, in real terms household income rose by an average of 0.4% each year for the lowest quintile and rose by an average of 1.8% annually for the highest quintile (see graph on the previous page).
Also reported is the percentage of income spent on monthly housing costs for different household income categories. Approximately 95% of all renters report both paying rent and receiving income, and among those renters, 21% make less than $20,000 a year. For this lowest household income category, 88.0% spend at least 30% of their household income on housing costs and 3.2% spend less than 20%. As income levels increase, the proportion of renters who spend at least 30% of their household income on housing costs decreases, while the proportion paying less than 20% increases (see graph on this page). At the highest income category
2021 Income and Affordability Study
Page 18 • April 15, 2021 • New York City Rent Guidelines Board
0%
10%
20%
30%
40%
50%
60%
70%
80%
90%
100%
$75K+$50K-$75K$35K-$50K$20K-$35K< $20K
Household Income Bracket
30%+ of Income on Housing Costs
20%-29% of Income on Housing Costs
< 20% of Income on Housing Costs
% o
f Ho
use
ho
lds
in S
pec
ified
Ho
usi
ng
Co
st B
rack
ets
Source: American Community Survey, 2019
The Greater the Income, the More Affordable the Housing
Renter Housing Costs as a Percentage of Household Income, 2019
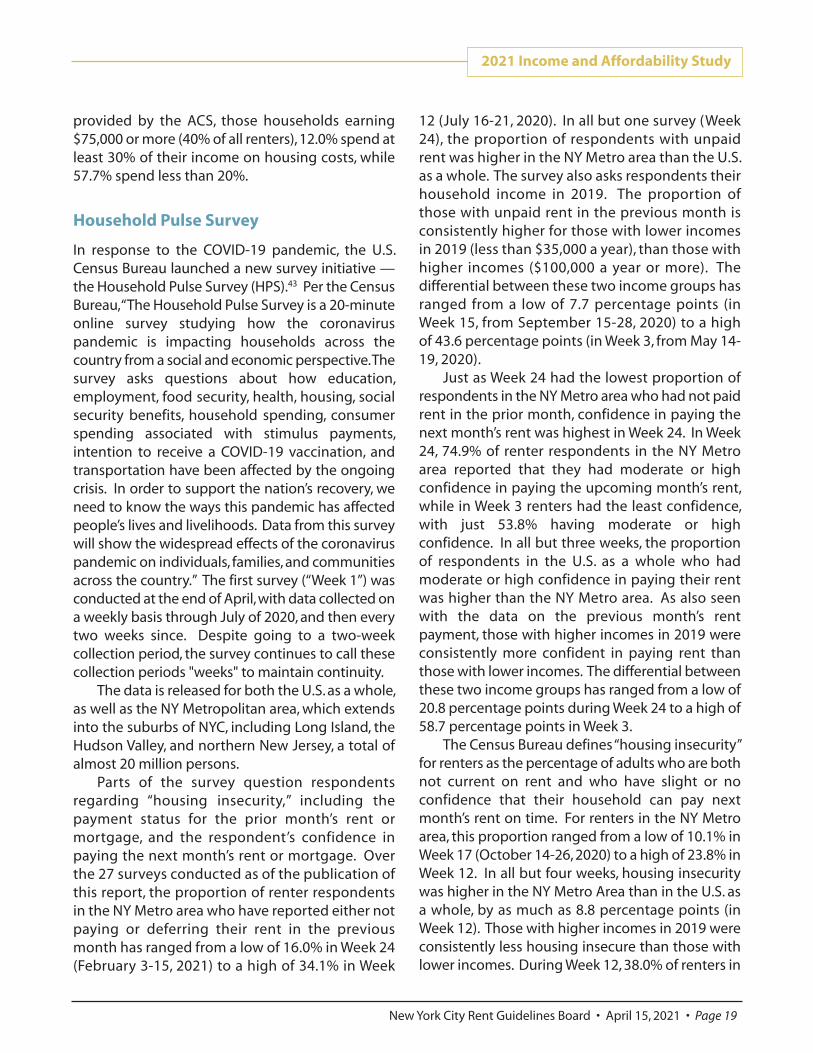
provided by the ACS, those households earning $75,000 or more (40% of all renters), 12.0% spend at least 30% of their income on housing costs, while 57.7% spend less than 20%.
Household Pulse Survey In response to the COVID-19 pandemic, the U.S. Census Bureau launched a new survey initiative — the Household Pulse Survey (HPS).43 Per the Census Bureau, “The Household Pulse Survey is a 20-minute online survey studying how the coronavirus pandemic is impacting households across the country from a social and economic perspective. The survey asks questions about how education, employment, food security, health, housing, social security benefits, household spending, consumer spending associated with stimulus payments, intention to receive a COVID-19 vaccination, and transportation have been affected by the ongoing crisis. In order to support the nation’s recovery, we need to know the ways this pandemic has affected people’s lives and livelihoods. Data from this survey will show the widespread effects of the coronavirus pandemic on individuals, families, and communities across the country.” The first survey (“Week 1”) was conducted at the end of April, with data collected on a weekly basis through July of 2020, and then every two weeks since. Despite going to a two-week collection period, the survey continues to call these collection periods "weeks" to maintain continuity.
The data is released for both the U.S. as a whole, as well as the NY Metropolitan area, which extends into the suburbs of NYC, including Long Island, the Hudson Valley, and northern New Jersey, a total of almost 20 million persons.
Parts of the survey question respondents regarding “housing insecurity,” including the payment status for the prior month’s rent or mortgage, and the respondent’s confidence in paying the next month’s rent or mortgage. Over the 27 surveys conducted as of the publication of this report, the proportion of renter respondents in the NY Metro area who have reported either not paying or deferring their rent in the previous month has ranged from a low of 16.0% in Week 24 (February 3-15, 2021) to a high of 34.1% in Week
12 (July 16-21, 2020). In all but one survey (Week 24), the proportion of respondents with unpaid rent was higher in the NY Metro area than the U.S. as a whole. The survey also asks respondents their household income in 2019. The proportion of those with unpaid rent in the previous month is consistently higher for those with lower incomes in 2019 (less than $35,000 a year), than those with higher incomes ($100,000 a year or more). The differential between these two income groups has ranged from a low of 7.7 percentage points (in Week 15, from September 15-28, 2020) to a high of 43.6 percentage points (in Week 3, from May 14-19, 2020).
Just as Week 24 had the lowest proportion of respondents in the NY Metro area who had not paid rent in the prior month, confidence in paying the next month’s rent was highest in Week 24. In Week 24, 74.9% of renter respondents in the NY Metro area reported that they had moderate or high confidence in paying the upcoming month’s rent, while in Week 3 renters had the least confidence, with just 53.8% having moderate or high confidence. In all but three weeks, the proportion of respondents in the U.S. as a whole who had moderate or high confidence in paying their rent was higher than the NY Metro area. As also seen with the data on the previous month’s rent payment, those with higher incomes in 2019 were consistently more confident in paying rent than those with lower incomes. The differential between these two income groups has ranged from a low of 20.8 percentage points during Week 24 to a high of 58.7 percentage points in Week 3.
The Census Bureau defines “housing insecurity” for renters as the percentage of adults who are both not current on rent and who have slight or no confidence that their household can pay next month’s rent on time. For renters in the NY Metro area, this proportion ranged from a low of 10.1% in Week 17 (October 14-26, 2020) to a high of 23.8% in Week 12. In all but four weeks, housing insecurity was higher in the NY Metro Area than in the U.S. as a whole, by as much as 8.8 percentage points (in Week 12). Those with higher incomes in 2019 were consistently less housing insecure than those with lower incomes. During Week 12, 38.0% of renters in
2021 Income and Affordability Study
New York City Rent Guidelines Board • April 15, 2021 • Page 19
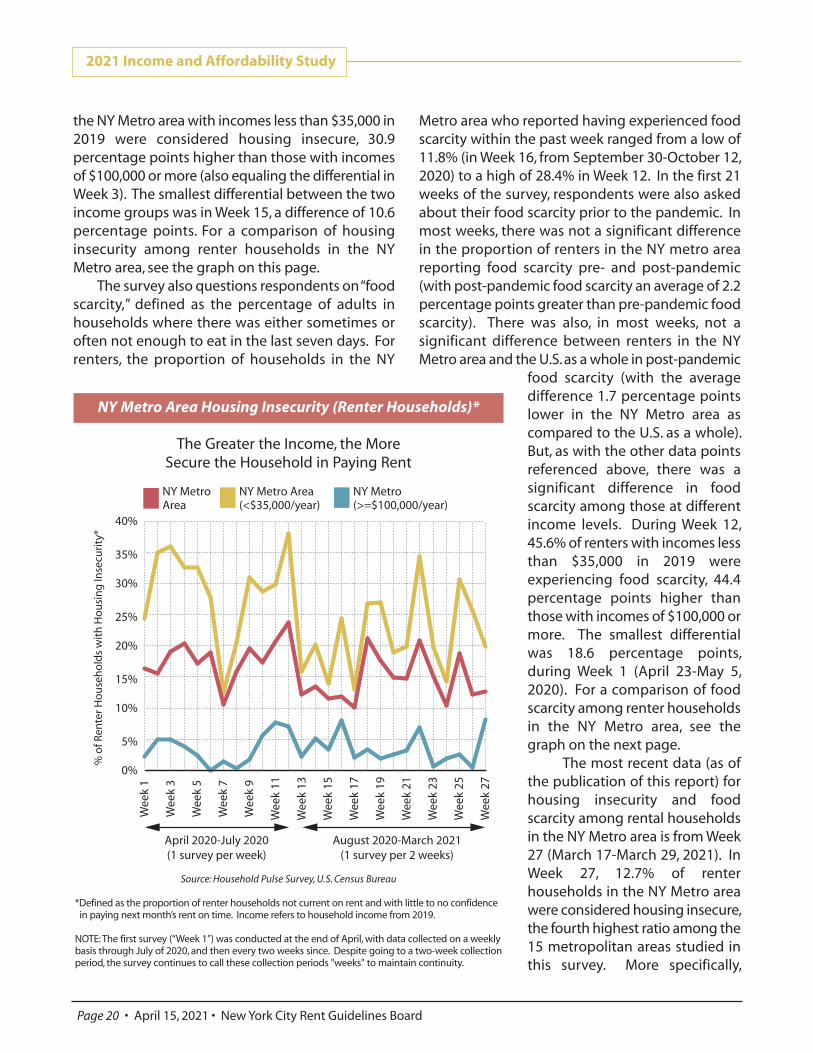
the NY Metro area with incomes less than $35,000 in 2019 were considered housing insecure, 30.9 percentage points higher than those with incomes of $100,000 or more (also equaling the differential in Week 3). The smallest differential between the two income groups was in Week 15, a difference of 10.6 percentage points. For a comparison of housing insecurity among renter households in the NY Metro area, see the graph on this page.
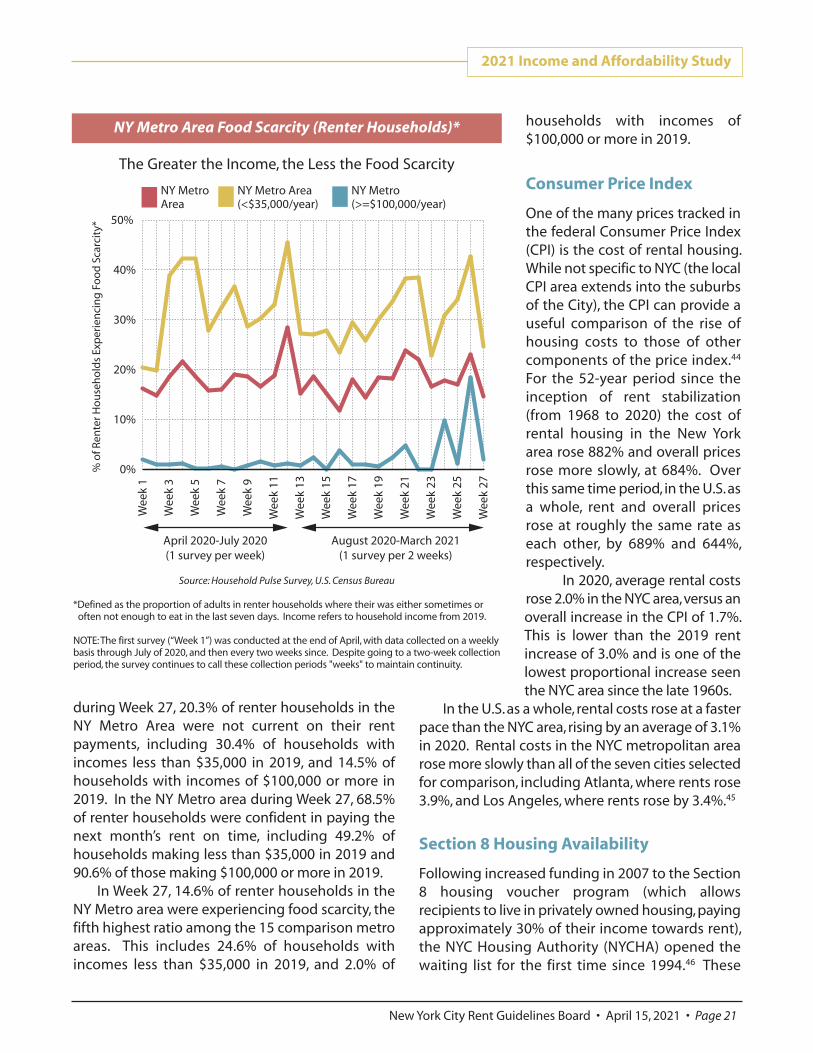
The survey also questions respondents on “food scarcity,” defined as the percentage of adults in households where there was either sometimes or often not enough to eat in the last seven days. For renters, the proportion of households in the NY
Metro area who reported having experienced food scarcity within the past week ranged from a low of 11.8% (in Week 16, from September 30-October 12, 2020) to a high of 28.4% in Week 12. In the first 21 weeks of the survey, respondents were also asked about their food scarcity prior to the pandemic. In most weeks, there was not a significant difference in the proportion of renters in the NY metro area reporting food scarcity pre- and post-pandemic (with post-pandemic food scarcity an average of 2.2 percentage points greater than pre-pandemic food scarcity). There was also, in most weeks, not a significant difference between renters in the NY Metro area and the U.S. as a whole in post-pandemic
food scarcity (with the average difference 1.7 percentage points lower in the NY Metro area as compared to the U.S. as a whole). But, as with the other data points referenced above, there was a significant difference in food scarcity among those at different income levels. During Week 12, 45.6% of renters with incomes less than $35,000 in 2019 were experiencing food scarcity, 44.4 percentage points higher than those with incomes of $100,000 or more. The smallest differential was 18.6 percentage points, during Week 1 (April 23-May 5, 2020). For a comparison of food scarcity among renter households in the NY Metro area, see the graph on the next page.
The most recent data (as of the publication of this report) for housing insecurity and food scarcity among rental households in the NY Metro area is from Week 27 (March 17-March 29, 2021). In Week 27, 12.7% of renter households in the NY Metro area were considered housing insecure, the fourth highest ratio among the 15 metropolitan areas studied in this survey. More specifically,
2021 Income and Affordability Study
Page 20 • April 15, 2021 • New York City Rent Guidelines Board
0%
5%
10%
15%
20%
25%
30%
35%
40%
Wee
k 27
Wee
k 25
Wee
k 23
Wee
k 21
Wee
k 19
Wee
k 17
Wee
k 15
Wee
k 13
Wee
k 11
Wee
k 9
Wee
k 7
Wee
k 5
Wee
k 3
Wee
k 1
NY Metro(>=$100,000/year)
NY Metro Area(<$35,000/year)
NY MetroArea
% o
f Ren
ter H
ou
seh
old
s w
ith
Ho
usi
ng
Inse
curi
ty*
April 2020-July 2020(1 survey per week)
August 2020-March 2021(1 survey per 2 weeks)
Source: Household Pulse Survey, U.S. Census Bureau *Defined as the proportion of renter households not current on rent and with little to no confidence in paying next month’s rent on time. Income refers to household income from 2019. NOTE: The first survey (“Week 1”) was conducted at the end of April, with data collected on a weekly basis through July of 2020, and then every two weeks since. Despite going to a two-week collection period, the survey continues to call these collection periods "weeks" to maintain continuity.
The Greater the Income, the More Secure the Household in Paying Rent
NY Metro Area Housing Insecurity (Renter Households)*
during Week 27, 20.3% of renter households in the NY Metro Area were not current on their rent payments, including 30.4% of households with incomes less than $35,000 in 2019, and 14.5% of households with incomes of $100,000 or more in 2019. In the NY Metro area during Week 27, 68.5% of renter households were confident in paying the next month’s rent on time, including 49.2% of households making less than $35,000 in 2019 and 90.6% of those making $100,000 or more in 2019.
In Week 27, 14.6% of renter households in the NY Metro area were experiencing food scarcity, the fifth highest ratio among the 15 comparison metro areas. This includes 24.6% of households with incomes less than $35,000 in 2019, and 2.0% of
households with incomes of $100,000 or more in 2019.
Consumer Price Index One of the many prices tracked in the federal Consumer Price Index (CPI) is the cost of rental housing. While not specific to NYC (the local CPI area extends into the suburbs of the City), the CPI can provide a useful comparison of the rise of housing costs to those of other components of the price index.44 For the 52-year period since the inception of rent stabilization (from 1968 to 2020) the cost of rental housing in the New York area rose 882% and overall prices rose more slowly, at 684%. Over this same time period, in the U.S. as a whole, rent and overall prices rose at roughly the same rate as each other, by 689% and 644%, respectively.
In 2020, average rental costs rose 2.0% in the NYC area, versus an overall increase in the CPI of 1.7%. This is lower than the 2019 rent increase of 3.0% and is one of the lowest proportional increase seen the NYC area since the late 1960s.
In the U.S. as a whole, rental costs rose at a faster pace than the NYC area, rising by an average of 3.1% in 2020. Rental costs in the NYC metropolitan area rose more slowly than all of the seven cities selected for comparison, including Atlanta, where rents rose 3.9%, and Los Angeles, where rents rose by 3.4%.45
Section 8 Housing Availability Following increased funding in 2007 to the Section 8 housing voucher program (which allows recipients to live in privately owned housing, paying approximately 30% of their income towards rent), the NYC Housing Authority (NYCHA) opened the waiting list for the first time since 1994.46 These
2021 Income and Affordability Study
New York City Rent Guidelines Board • April 15, 2021 • Page 21
0%
10%
20%
30%
40%
50%
Wee
k 27
Wee
k 25
Wee
k 23
Wee
k 21
Wee
k 19
Wee
k 17
Wee
k 15
Wee
k 13
Wee
k 11
Wee
k 9
Wee
k 7
Wee
k 5
Wee
k 3
Wee
k 1
NY Metro(>=$100,000/year)
NY Metro Area(<$35,000/year)
NY MetroArea
% o
f Ren
ter H
ou
seh
old
s Ex
per
ien
cin
g F
oo
d S
carc
ity*
April 2020-July 2020(1 survey per week)
August 2020-March 2021(1 survey per 2 weeks)
Source: Household Pulse Survey, U.S. Census Bureau *Defined as the proportion of adults in renter households where their was either sometimes or often not enough to eat in the last seven days. Income refers to household income from 2019. NOTE: The first survey (“Week 1”) was conducted at the end of April, with data collected on a weekly basis through July of 2020, and then every two weeks since. Despite going to a two-week collection period, the survey continues to call these collection periods "weeks" to maintain continuity.
The Greater the Income, the Less the Food Scarcity
NY Metro Area Food Scarcity (Renter Households)*
expanded funding levels led to increases in the number of Section 8 occupied units funded by NYCHA (which increased from an average of 82,801 in Fiscal Year (FY) 2007 to a high of 100,570 in FY 2010), as well as significant increases in the number of people placed through Section 8 vouchers during those years. The average number of Section 8 occupied units (as of the first four months of FY 2021) has since fallen, to 86,965 units, a 0.9% increase from the same period of the prior year.47 NYCHA also tracks the number of applicants newly placed through the program. For the second consecutive year, placements rose, from 2,438 in FY 2019 to 3,632 in FY 2020, an increase of 49.0%. However, placements fell in the first four months of FY 2021 as compared to the first four months of FY 2020, from 1,166 to 320. There are approximately 40,000 households currently on the NYCHA Section 8 waiting list.
The NYC Department of Housing Preservation and Development (HPD) also maintains a Section 8 program, although unlike NYCHA, applicants must fall within specific HPD preference categories or special admission programs, and applications are not accepted from the general public.48 As of October of 2020, HPD was funding 40,792 Section 8 vouchers, or more than 400 more vouchers than in March of 2020. Notably, 47.8% of HPD’s Section 8 vouchers are utilized by tenants with disabilities. Among HPD Section 8 rentals, the average tenant share of rent is $394, with an average income level of $17,556.49
Non-Government Sources of Affordability Data Each year, Con Edison reports on the average cost of electricity bills for residential customers using 300kWh of electricity per month. Per their data, electricity costs rose 7.9% during 2020, following a decrease of 3.4% during 2019.50 New Yorkers pay some of the highest electricity bills in the nation, with the average cost per kWh in 2019 almost two times that of the nation as a whole.51 In late 2019, Con Edison received permission from State utility regulators to raise electricity rates in each of the next three years. At the time, Con Edison estimated that for a residential apartment in NYC, using 300kWh
hours per month of electricity, bills would rise by 3.9% in 2020, 4.5% in 2021, and 3.8% in 2022.52
Another measure of affordability is the Council for Community and Economic Research’s Cost of Living Index (COLI), which tracks the cost of living in 269 urban areas, including Manhattan, Brooklyn, and Queens. Based on 60 different items, the survey collects more than 90,000 prices for housing, utilities, groceries, transportation, health care, and miscellaneous goods and services on a quarterly basis. During the first three quarters of 2020, the COLI found that Manhattan and Brooklyn ranked as numbers one and four, respectively, on the list of the 10 most expensive urban areas.53 The study calculated that Manhattan was approximately 2.4 times as expensive to live in as the national average, while Brooklyn was approximately 1.8 times more expensive, and Queens was 1.5 times as expensive. Per the study, overall housing costs rose in Queens and Manhattan as compared with the same period of the prior year (by 1.4% and 4.9%, respectively), and fell in Brooklyn, by 1.4%. The subcategory of apartment rents rose in Brooklyn (by 2.6%), but fell in both Manhattan and Queens (by 1.3% and 6.2%, respectively). Overall prices were found to have fallen 1.1% in Queens and 1.3% in Brooklyn, while rising 2.7% in Manhattan between 2019 and 2020.54 Another quarterly index, the Housing Opportunity Index (HOI), showed that during the fourth quarter of 2020 the New York metropolitan area was the nineteenth least affordable area (of 268 HUD-defined metro areas) to buy a home, making it relatively more expensive than the fourth quarter of 2019, when it was the twenty-third highest metro area. The survey found that 29.2% of owner-occupied housing in the metropolitan area was affordable to households earning the median household income in the fourth quarter of 2020, down from 36.4% in the fourth quarter of 2019.55
Over the last nine years,56 the survey’s quarterly data found that anywhere from 20.8% (in the third quarter of 2015) to 38.4% (in the second quarter of 2016) of owner-occupied homes were affordable to buyers earning the median household income.
Every year the National Low Income Housing Coalition (NLIHC) issues a study to determine whether rents are affordable to the lowest wage
2021 Income and Affordability Study
Page 22 • April 15, 2021 • New York City Rent Guidelines Board
earners. The 2021 study has not been released as of the publication of this report, but in line with their methodology,57 in order to afford a two-bedroom apartment at the City’s Fair Market Rent,58 ($2,053 a month, as determined by HUD) a full-time worker must earn $39.48 per hour, or $82,120 a year. Alternately, those who earn minimum wage would have to work 105 hours a week (or two persons would each have to work 52.5 hours a week) to be able to afford a two-bedroom unit priced at the Fair Market Rent. Because the Fair Market Rent rose by $102, the amount of annual wages necessary to afford this apartment went up by 5.2%. Over the last ten years the number of hours working at minimum wage needed to afford a two-bedroom apartment at the current Fair Market Rent has ranged from a high of 156 in 2013, to a low of 94 in 2019.
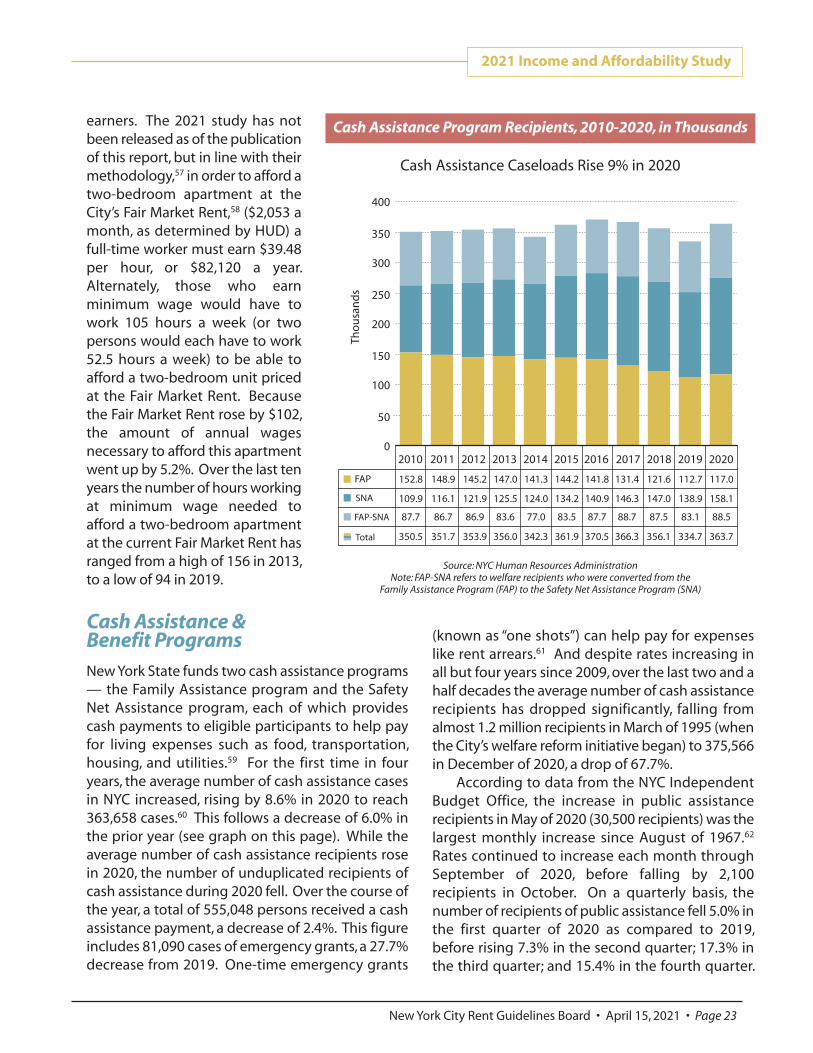
Cash Assistance & Benefit Programs New York State funds two cash assistance programs — the Family Assistance program and the Safety Net Assistance program, each of which provides cash payments to eligible participants to help pay for living expenses such as food, transportation, housing, and utilities.59 For the first time in four years, the average number of cash assistance cases in NYC increased, rising by 8.6% in 2020 to reach 363,658 cases.60 This follows a decrease of 6.0% in the prior year (see graph on this page). While the average number of cash assistance recipients rose in 2020, the number of unduplicated recipients of cash assistance during 2020 fell. Over the course of the year, a total of 555,048 persons received a cash assistance payment, a decrease of 2.4%. This figure includes 81,090 cases of emergency grants, a 27.7% decrease from 2019. One-time emergency grants
(known as “one shots”) can help pay for expenses like rent arrears.61 And despite rates increasing in all but four years since 2009, over the last two and a half decades the average number of cash assistance recipients has dropped significantly, falling from almost 1.2 million recipients in March of 1995 (when the City’s welfare reform initiative began) to 375,566 in December of 2020, a drop of 67.7%.
According to data from the NYC Independent Budget Office, the increase in public assistance recipients in May of 2020 (30,500 recipients) was the largest monthly increase since August of 1967.62
Rates continued to increase each month through September of 2020, before falling by 2,100 recipients in October. On a quarterly basis, the number of recipients of public assistance fell 5.0% in the first quarter of 2020 as compared to 2019, before rising 7.3% in the second quarter; 17.3% in the third quarter; and 15.4% in the fourth quarter.
2021 Income and Affordability Study
New York City Rent Guidelines Board • April 15, 2021 • Page 23
0
50
100
150
200
250
300
350
400
SNA
FAP
FAP-SNA
Tho
usa
nd
s
2016 2017 2018 2019201520142013201220112010
87.7
109.9
152.8 148.9
116.1
86.7
145.2
121.9
86.9
147.0
125.5
83.6
141.3
124.0
77.0
144.2
134.2
83.5
141.8
140.9
87.7
131.4
146.3
88.7
121.6
147.0
87.5
112.7
138.9
83.1
2020
117.0
158.1
350.5 351.7 353.9 356.0 342.3 361.9 370.5 366.3 356.1 334.7 363.7
88.5
Total
Source: NYC Human Resources Administration Note: FAP-SNA refers to welfare recipients who were converted from the
Family Assistance Program (FAP) to the Safety Net Assistance Program (SNA)
Cash Assistance Caseloads Rise 9% in 2020
Cash Assistance Program Recipients, 2010-2020, in Thousands
Comparing the second through fourth quarters of 2019 to 2020, levels increased an average of 13.3%.
The number of applications for cash assistance fell in 2020, decreasing 6.7% from 2019 levels, including a decrease of 22.0% in approved applications, and a 19.3% increase in denied applications.63 In addition, the number of reported job placements among cash assistance recipients decreased during 2020, falling by 33.9%, or 12,422 jobs (to 24,230), after decreasing 9.5% in the prior year.64
Other major benefit programs include the Supplemental Nutrition Assistance Program (SNAP, formerly known as food stamps) and Medicaid. The number of recipients of SNAP increased for the first time in seven years, by 5.2% in 2020, to an average of 1.61 million. Despite drops in the previous six years, SNAP levels have doubled in the last 20 years, rising from an average of just over 800,000 in the early 2000s, to more than 1.6 million today.65 On a quarterly basis, the number of recipients of SNAP fell 5.2% in the first quarter of 2020 as compared to 2019, before rising 3.8% in the second quarter; 11.4% in the third quarter; and 11.2% in the fourth quarter. Comparing the second through fourth quarters of 2019 to 2020, levels increased an average of 8.8%.
The number of Medicaid enrollees fell for the seventh consecutive year, decreasing 3.3% during 2020 to 1.53 million recipients.66 On a quarterly basis, the number of recipients of Medicaid enrollees fell 8.2% in the first quarter of 2020 as compared to 2019; 4.9% in the second quarter; and 1.0% in the third quarter. Rates then rose 1.2% in the fourth quarter. Comparing the second through fourth quarters of 2019 to 2020, levels decreased an average of 1.6%.
A new benefit in 2020 came in the form of the COVID Rent Relief Program, administered by NYS Homes and Community Renewal (HCR), which began taking applications in July of 2020.67 The program, with a spending cap of $100 million, was designed to allow vouchers paid directly to building owners to cover the gap between tenants’ pre-COVID rent burden and their new rent burden, up to 125% of Fair Market Rent, for a period of up to four months (April through July of 2020). The original program requirements included being rent-burdened prior to March 1, 2020 (defined as paying more than 30 percent of gross monthly income towards rent);
having a household income below 80% of the Area Median Income; and a loss of employment between April 1 and July 31, 2020. Although the program received almost 100,000 applications, the strict requirements resulted in only 15,000 households in New York State being approved for rent relief, with a total distribution of $40 million, or 40% of the available budget for the program.68
The program requirements were changed in December of 2020, with the new guidelines specifying that households need not be rent-burdened before the pandemic, as long as they could prove a rent burden between April and July of 2020.69 New applications were accepted until February 1, 2021, and previously denied applications were reconsidered with the new guidelines. HCR has not publicly released statistics on the new version of the program as of publication of this report, but news outlets report that only an additional 1,000 households in New York State qualified, at a cost of $7 million.70
The recently enacted NYS FY 2022 budget allocates $2.4 billion towards the "COVID-19 Emergency Rental Assistance Program of 2021.” Using a combination of $2.3 billion in federal funding, and $100 million in State funding, the program is aimed towards helping New Yorkers pay rent and utilities arrears.71 Per the program’s guidelines, applicants are required to meet certain standards to qualify, including a household income at or below 80% of the area median; unemployment, a reduction in income, significant costs or other financial hardship that are directly or indirectly due to the COVID-19 outbreak; and demonstrating a risk of homelessness or housing instability. Income can be calculated based on either total income for 2020 or the household's current monthly income at the time of application. The program will prioritize certain households, including those below 50% of the area median income; households where there has been extended unemployment; households with a pending eviction case; and households who reside in a building with twenty or fewer units, which are considered owned by “small” landlords. The program provides for up to 12 months of rent or utility arrears. It also permits up to three months of additional assistance to be paid if it is deemed that
2021 Income and Affordability Study
Page 24 • April 15, 2021 • New York City Rent Guidelines Board
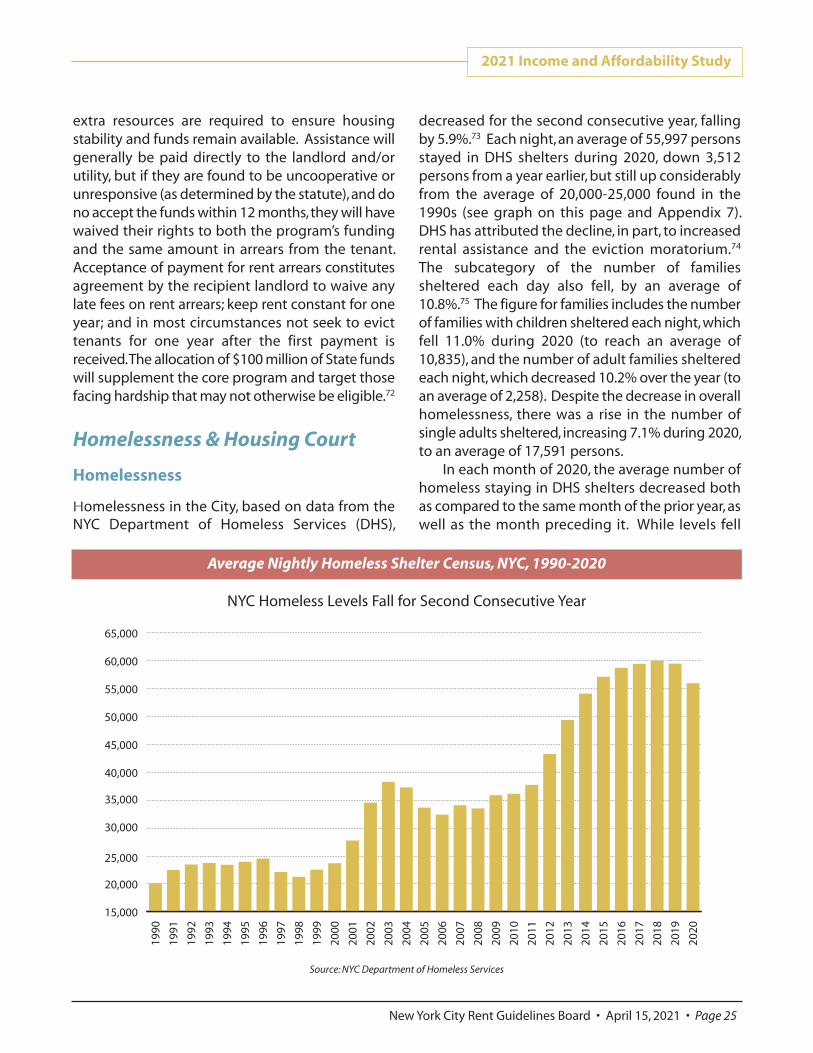
extra resources are required to ensure housing stability and funds remain available. Assistance will generally be paid directly to the landlord and/or utility, but if they are found to be uncooperative or unresponsive (as determined by the statute), and do no accept the funds within 12 months, they will have waived their rights to both the program’s funding and the same amount in arrears from the tenant. Acceptance of payment for rent arrears constitutes agreement by the recipient landlord to waive any late fees on rent arrears; keep rent constant for one year; and in most circumstances not seek to evict tenants for one year after the first payment is received. The allocation of $100 million of State funds will supplement the core program and target those facing hardship that may not otherwise be eligible.72
Homelessness & Housing Court Homelessness Homelessness in the City, based on data from the NYC Department of Homeless Services (DHS),
decreased for the second consecutive year, falling by 5.9%.73 Each night, an average of 55,997 persons stayed in DHS shelters during 2020, down 3,512 persons from a year earlier, but still up considerably from the average of 20,000-25,000 found in the 1990s (see graph on this page and Appendix 7). DHS has attributed the decline, in part, to increased rental assistance and the eviction moratorium.74 The subcategory of the number of families sheltered each day also fell, by an average of 10.8%.75 The figure for families includes the number of families with children sheltered each night, which fell 11.0% during 2020 (to reach an average of 10,835), and the number of adult families sheltered each night, which decreased 10.2% over the year (to an average of 2,258). Despite the decrease in overall homelessness, there was a rise in the number of single adults sheltered, increasing 7.1% during 2020, to an average of 17,591 persons.
In each month of 2020, the average number of homeless staying in DHS shelters decreased both as compared to the same month of the prior year, as well as the month preceding it. While levels fell
2021 Income and Affordability Study
New York City Rent Guidelines Board • April 15, 2021 • Page 25
15,000
20,000
25,000
30,000
35,000
40,000
45,000
50,000
55,000
60,000
65,000
2020
2019
2018
2017
2016
2015
2014
2013
2012
2011
2010
2009
2008
2007
2006
2005
2004
2003
2002
2001
2000
1999
1998
1997
1996
1995
1994
1993
1992
1991
1990
NYC Homeless Levels Fall for Second Consecutive Year
Source: NYC Department of Homeless Services
Average Nightly Homeless Shelter Census, NYC, 1990-2020
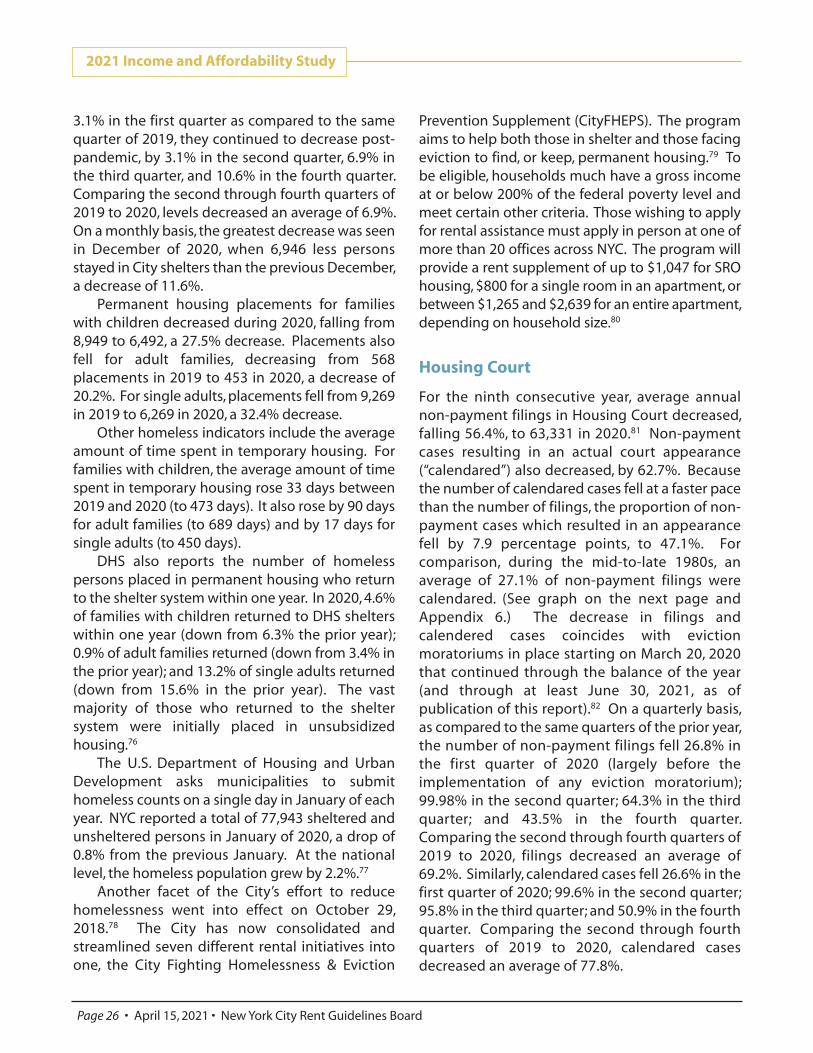
3.1% in the first quarter as compared to the same quarter of 2019, they continued to decrease post-pandemic, by 3.1% in the second quarter, 6.9% in the third quarter, and 10.6% in the fourth quarter. Comparing the second through fourth quarters of 2019 to 2020, levels decreased an average of 6.9%. On a monthly basis, the greatest decrease was seen in December of 2020, when 6,946 less persons stayed in City shelters than the previous December, a decrease of 11.6%.
Permanent housing placements for families with children decreased during 2020, falling from 8,949 to 6,492, a 27.5% decrease. Placements also fell for adult families, decreasing from 568 placements in 2019 to 453 in 2020, a decrease of 20.2%. For single adults, placements fell from 9,269 in 2019 to 6,269 in 2020, a 32.4% decrease.
Other homeless indicators include the average amount of time spent in temporary housing. For families with children, the average amount of time spent in temporary housing rose 33 days between 2019 and 2020 (to 473 days). It also rose by 90 days for adult families (to 689 days) and by 17 days for single adults (to 450 days). DHS also reports the number of homeless persons placed in permanent housing who return to the shelter system within one year. In 2020, 4.6% of families with children returned to DHS shelters within one year (down from 6.3% the prior year); 0.9% of adult families returned (down from 3.4% in the prior year); and 13.2% of single adults returned (down from 15.6% in the prior year). The vast majority of those who returned to the shelter system were initially placed in unsubsidized housing.76
The U.S. Department of Housing and Urban Development asks municipalities to submit homeless counts on a single day in January of each year. NYC reported a total of 77,943 sheltered and unsheltered persons in January of 2020, a drop of 0.8% from the previous January. At the national level, the homeless population grew by 2.2%.77
Another facet of the City’s effort to reduce homelessness went into effect on October 29, 2018.78 The City has now consolidated and streamlined seven different rental initiatives into one, the City Fighting Homelessness & Eviction
Prevention Supplement (CityFHEPS). The program aims to help both those in shelter and those facing eviction to find, or keep, permanent housing.79 To be eligible, households much have a gross income at or below 200% of the federal poverty level and meet certain other criteria. Those wishing to apply for rental assistance must apply in person at one of more than 20 offices across NYC. The program will provide a rent supplement of up to $1,047 for SRO housing, $800 for a single room in an apartment, or between $1,265 and $2,639 for an entire apartment, depending on household size.80
Housing Court For the ninth consecutive year, average annual non-payment filings in Housing Court decreased, falling 56.4%, to 63,331 in 2020.81 Non-payment cases resulting in an actual court appearance (“calendared”) also decreased, by 62.7%. Because the number of calendared cases fell at a faster pace than the number of filings, the proportion of non-payment cases which resulted in an appearance fell by 7.9 percentage points, to 47.1%. For comparison, during the mid-to-late 1980s, an average of 27.1% of non-payment filings were calendared. (See graph on the next page and Appendix 6.) The decrease in filings and calendered cases coincides with eviction moratoriums in place starting on March 20, 2020 that continued through the balance of the year (and through at least June 30, 2021, as of publication of this report).82 On a quarterly basis, as compared to the same quarters of the prior year, the number of non-payment filings fell 26.8% in the first quarter of 2020 (largely before the implementation of any eviction moratorium); 99.98% in the second quarter; 64.3% in the third quarter; and 43.5% in the fourth quarter. Comparing the second through fourth quarters of 2019 to 2020, filings decreased an average of 69.2%. Similarly, calendared cases fell 26.6% in the first quarter of 2020; 99.6% in the second quarter; 95.8% in the third quarter; and 50.9% in the fourth quarter. Comparing the second through fourth quarters of 2019 to 2020, calendared cases decreased an average of 77.8%.
2021 Income and Affordability Study
Page 26 • April 15, 2021 • New York City Rent Guidelines Board
Approximately 7.3% of non-payment filings and 8.2% of calendared cases in 2020 were against tenants of public housing (NYCHA). If these cases were taken out of the analysis, filings against non-NYCHA tenants would have fallen 49.6% between 2019 and 2020, and calendared cases would have fallen by 57.9%. The percentage of calendared cases to non-payment filings in 2020 among non-NYCHA tenants is 46.6%, 0.5 percentage points lower than the overall proportion.
Average annual evictions of tenants also fell during 2020, by 82.0%, with decreases in six of the last seven years.83 Evictions are down 89.4% over 2013 levels. This is also the fewest number of evictions since at least 1983 (the first year data is available for). As noted above, evictions for non-payment of rent have largely been prohibited by State law since March 20, 2020 (with protections
extended through federal law through at least June 30, 2021, as of publication of this report).84 The proportion of non-payment proceedings Citywide that resulted in an eviction/possession ruling in 2020 decreased from 21.3% to 10.3%. This translates to 3,056 court decisions (virtually all pre-pandemic) ruling for the tenant’s eviction from a total of 29,814 non-payment proceedings calendared (see graph on this page).
In August of 2017, a City bill granting all households under 200% of the federal poverty level eligibility for free legal representation in Housing Court was signed into law.85 Prior to the COVID-19 pandemic, the program was being phased in zip code by zip code, with full implementation planned in 2022, at a cost of $166 million.86 It is estimated that the number of tenants in Housing Court with legal representation rose from 1% in 2013 to more than 30% in 2019, with figures indicating that 84% of households facing eviction in Housing Court who have City counsel had been able to avoid eviction.87
With most evictions halted, the City is now providing counsel to any resident of NYC, regardless of zip code or income level.88 Reflecting changes to the Housing Court process during the pandemic, the NYC Human Resources Administration reports that the number of cases in Housing Court that received legal representation in FY 2020 fell by 25.1% (to 24,109) as compared to the prior year, after increasing sharply in the previous two years (almost doubling between FY 2017 and FY 2019, to reach more than 32,000 cases). During the first four months of FY 2021 there was a 74.6% decline as compared to the same period of the previous year (to reach 2,753 cases).89
To help more tenants understand the changing rules regarding Housing Court and connect with legal help, in August of 2020 the City announced the creation of the new NYC Tenant Resource Portal. Tenants will respond to a series of questions about their unique circumstances and be directed to the most relevant resources, such as help navigating an illegal lockout or eviction. Tenants who do not have access to the internet can call 311 and ask for the “Tenant Helpline,” where they will connect with a Tenant Support Specialist to receive free, individualized assistance.90
2021 Income and Affordability Study
New York City Rent Guidelines Board • April 15, 2021 • Page 27
10%
15%
20%
25%
30%
35%
40%
45%
50%
55%
60%
65%
2020
*
2018
2016
2014
2012
2010
2008
2006
2004
2002
2000
1998
1996
1994
1992
1990
1988
Proportion of Calendared that Result in Eviction/Possession
Proportion of Filingsthat are Calendared
Source: Civil Court of NYC and NYC Department of Investigations
*Note that an eviction moratorium was in place from March 20, 2020 through the end of the year, and only 592 non-payment cases were calendared in the second and third quarters of 2020.
Both Proportion of Non-Payment Cases Calendared and
Proportion of Evictions Fall
Housing Court Statistics, 1988-2020
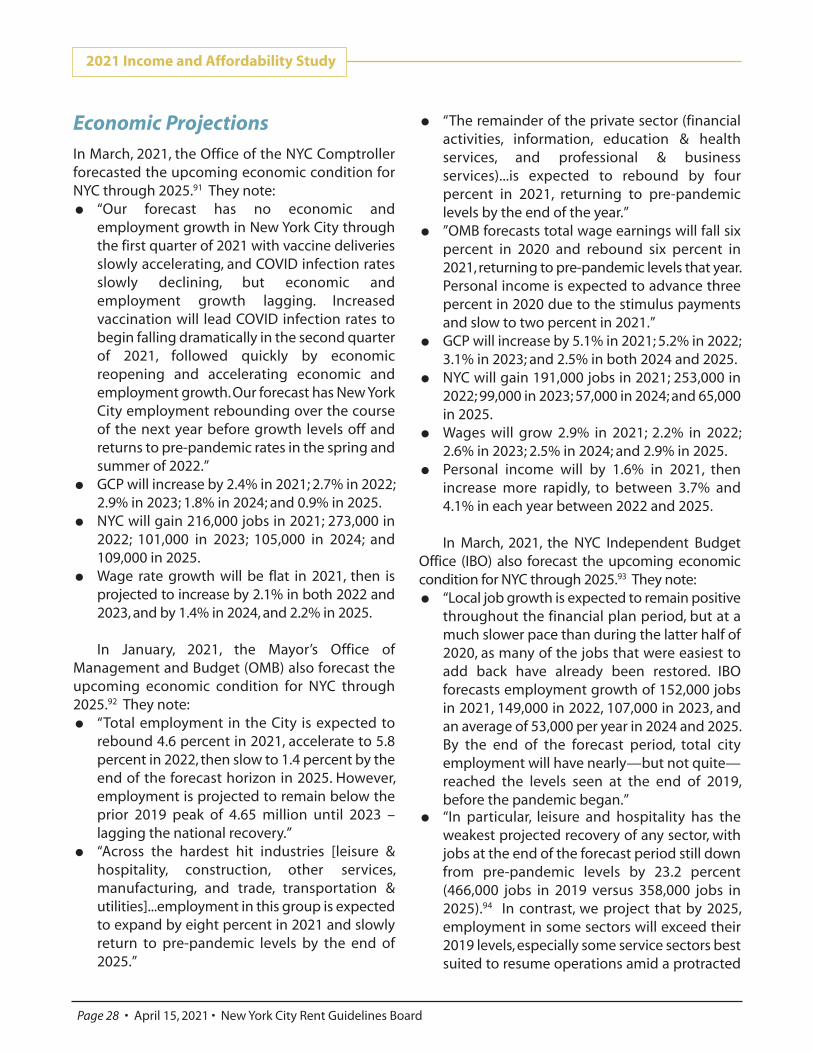
Economic Projections In March, 2021, the Office of the NYC Comptroller forecasted the upcoming economic condition for NYC through 2025.91 They note:
“Our forecast has no economic and ⚫employment growth in New York City through the first quarter of 2021 with vaccine deliveries slowly accelerating, and COVID infection rates slowly declining, but economic and employment growth lagging. Increased vaccination will lead COVID infection rates to begin falling dramatically in the second quarter of 2021, followed quickly by economic reopening and accelerating economic and employment growth. Our forecast has New York City employment rebounding over the course of the next year before growth levels off and returns to pre-pandemic rates in the spring and summer of 2022.” GCP will increase by 2.4% in 2021; 2.7% in 2022; ⚫2.9% in 2023; 1.8% in 2024; and 0.9% in 2025. NYC will gain 216,000 jobs in 2021; 273,000 in ⚫2022; 101,000 in 2023; 105,000 in 2024; and 109,000 in 2025. Wage rate growth will be flat in 2021, then is ⚫projected to increase by 2.1% in both 2022 and 2023, and by 1.4% in 2024, and 2.2% in 2025.
In January, 2021, the Mayor’s Office of
Management and Budget (OMB) also forecast the upcoming economic condition for NYC through 2025.92 They note:
“Total employment in the City is expected to ⚫rebound 4.6 percent in 2021, accelerate to 5.8 percent in 2022, then slow to 1.4 percent by the end of the forecast horizon in 2025. However, employment is projected to remain below the prior 2019 peak of 4.65 million until 2023 – lagging the national recovery.” “Across the hardest hit industries [leisure & ⚫hospitality, construction, other services, manufacturing, and trade, transportation & utilities]...employment in this group is expected to expand by eight percent in 2021 and slowly return to pre-pandemic levels by the end of 2025.”
“The remainder of the private sector (financial ⚫activities, information, education & health services, and professional & business services)...is expected to rebound by four percent in 2021, returning to pre-pandemic levels by the end of the year.” ”OMB forecasts total wage earnings will fall six ⚫percent in 2020 and rebound six percent in 2021, returning to pre-pandemic levels that year. Personal income is expected to advance three percent in 2020 due to the stimulus payments and slow to two percent in 2021.” GCP will increase by 5.1% in 2021; 5.2% in 2022; ⚫3.1% in 2023; and 2.5% in both 2024 and 2025. NYC will gain 191,000 jobs in 2021; 253,000 in ⚫2022; 99,000 in 2023; 57,000 in 2024; and 65,000 in 2025. Wages will grow 2.9% in 2021; 2.2% in 2022; ⚫2.6% in 2023; 2.5% in 2024; and 2.9% in 2025. Personal income will by 1.6% in 2021, then ⚫increase more rapidly, to between 3.7% and 4.1% in each year between 2022 and 2025.
In March, 2021, the NYC Independent Budget
Office (IBO) also forecast the upcoming economic condition for NYC through 2025.93 They note:
“Local job growth is expected to remain positive ⚫throughout the financial plan period, but at a much slower pace than during the latter half of 2020, as many of the jobs that were easiest to add back have already been restored. IBO forecasts employment growth of 152,000 jobs in 2021, 149,000 in 2022, 107,000 in 2023, and an average of 53,000 per year in 2024 and 2025. By the end of the forecast period, total city employment will have nearly—but not quite—reached the levels seen at the end of 2019, before the pandemic began.” “In particular, leisure and hospitality has the ⚫weakest projected recovery of any sector, with jobs at the end of the forecast period still down from pre-pandemic levels by 23.2 percent (466,000 jobs in 2019 versus 358,000 jobs in 2025).94 In contrast, we project that by 2025, employment in some sectors will exceed their 2019 levels, especially some service sectors best suited to resume operations amid a protracted
2021 Income and Affordability Study
Page 28 • April 15, 2021 • New York City Rent Guidelines Board
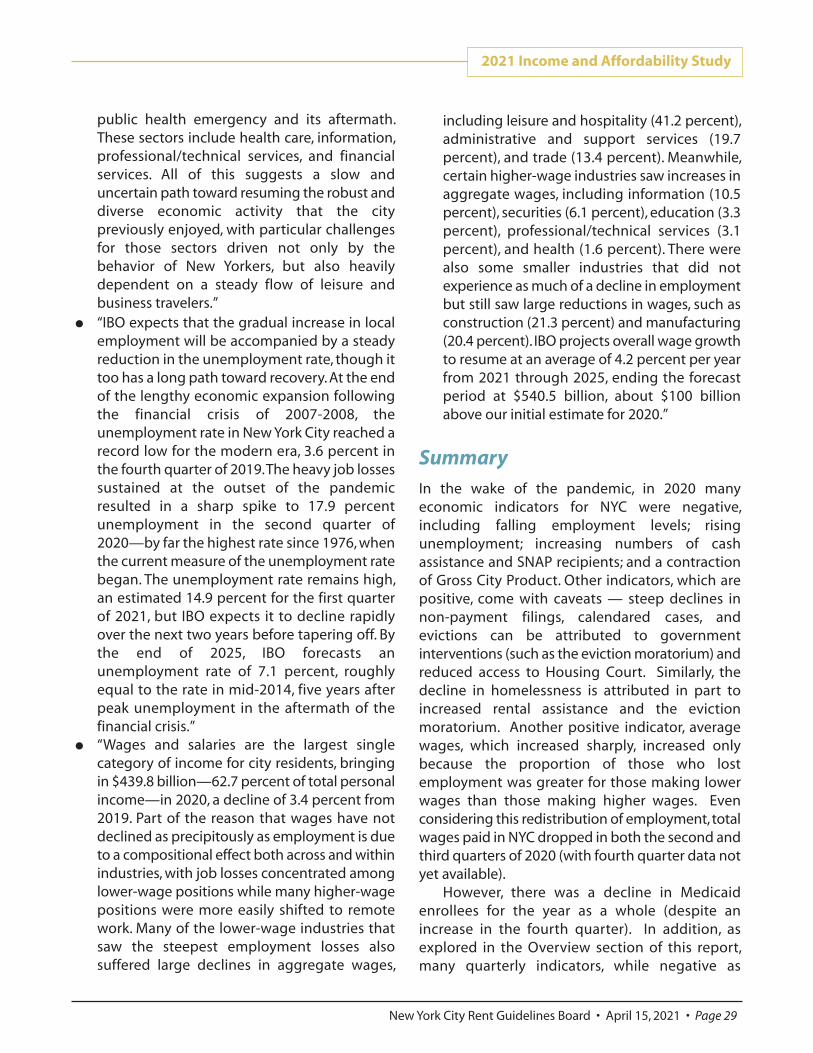
public health emergency and its aftermath. These sectors include health care, information, professional/technical services, and financial services. All of this suggests a slow and uncertain path toward resuming the robust and diverse economic activity that the city previously enjoyed, with particular challenges for those sectors driven not only by the behavior of New Yorkers, but also heavily dependent on a steady flow of leisure and business travelers.” “IBO expects that the gradual increase in local ⚫employment will be accompanied by a steady reduction in the unemployment rate, though it too has a long path toward recovery. At the end of the lengthy economic expansion following the financial crisis of 2007-2008, the unemployment rate in New York City reached a record low for the modern era, 3.6 percent in the fourth quarter of 2019. The heavy job losses sustained at the outset of the pandemic resulted in a sharp spike to 17.9 percent unemployment in the second quarter of 2020—by far the highest rate since 1976, when the current measure of the unemployment rate began. The unemployment rate remains high, an estimated 14.9 percent for the first quarter of 2021, but IBO expects it to decline rapidly over the next two years before tapering off. By the end of 2025, IBO forecasts an unemployment rate of 7.1 percent, roughly equal to the rate in mid-2014, five years after peak unemployment in the aftermath of the financial crisis.” “Wages and salaries are the largest single ⚫category of income for city residents, bringing in $439.8 billion—62.7 percent of total personal income—in 2020, a decline of 3.4 percent from 2019. Part of the reason that wages have not declined as precipitously as employment is due to a compositional effect both across and within industries, with job losses concentrated among lower-wage positions while many higher-wage positions were more easily shifted to remote work. Many of the lower-wage industries that saw the steepest employment losses also suffered large declines in aggregate wages,
including leisure and hospitality (41.2 percent), administrative and support services (19.7 percent), and trade (13.4 percent). Meanwhile, certain higher-wage industries saw increases in aggregate wages, including information (10.5 percent), securities (6.1 percent), education (3.3 percent), professional/technical services (3.1 percent), and health (1.6 percent). There were also some smaller industries that did not experience as much of a decline in employment but still saw large reductions in wages, such as construction (21.3 percent) and manufacturing (20.4 percent). IBO projects overall wage growth to resume at an average of 4.2 percent per year from 2021 through 2025, ending the forecast period at $540.5 billion, about $100 billion above our initial estimate for 2020.”
Summary In the wake of the pandemic, in 2020 many economic indicators for NYC were negative, including falling employment levels; rising unemployment; increasing numbers of cash assistance and SNAP recipients; and a contraction of Gross City Product. Other indicators, which are positive, come with caveats — steep declines in non-payment filings, calendared cases, and evictions can be attributed to government interventions (such as the eviction moratorium) and reduced access to Housing Court. Similarly, the decline in homelessness is attributed in part to increased rental assistance and the eviction moratorium. Another positive indicator, average wages, which increased sharply, increased only because the proportion of those who lost employment was greater for those making lower wages than those making higher wages. Even considering this redistribution of employment, total wages paid in NYC dropped in both the second and third quarters of 2020 (with fourth quarter data not yet available).
However, there was a decline in Medicaid enrollees for the year as a whole (despite an increase in the fourth quarter). In addition, as explored in the Overview section of this report, many quarterly indicators, while negative as
2021 Income and Affordability Study
New York City Rent Guidelines Board • April 15, 2021 • Page 29
compared to the same quarter of the prior year, are positive when comparing the fourth quarter of 2020 to the third. r Endnotes 1. This data is obtained from the Civil Court of the City of New York, which
cannot provide exact “quarterly” data. The Court has 13 terms in a year, each a little less than a month long. This data is for terms 10-13, which is from approximately the middle of September through the end of the year. It is compared to the same period of the prior year.
2. See Endnote 1. 3. Data from the Office of the NYC Comptroller as of March, 2021. GCP
figures are adjusted annually by the Office of the NYC Comptroller. The figures in this report are the latest available estimate from that office, based on inflation-adjusted 2012 chained dollars.
4. U.S. Bureau of Economic Analysis: https://www.bea.gov/data/gdp/gross-
domestic-product. 5. U.S. Bureau of Labor Statistics: http://www.bls.gov. 6. NYS Department of Labor: http://www.labor.state.ny.us; accessed March
2021. Data is revised annually and may not match data reported in prior years.
7. U.S. Bureau of Labor Statistics: http://www.bls.gov. 8. U.S. Bureau of Labor Statistics: http://www.bls.gov. 9. The full definition, as per the U.S. Department of Labor: “An initial claim is
a claim filed by an unemployed individual after a separation from an employer. The claimant requests a determination of basic eligibility for the UI [Unemployment Insurance] program. When an initial claim is filed with a state, certain programmatic activities take place and these result in activity counts including the count of initial claims. The count of U.S. initial claims for unemployment insurance is a leading economic indicator because it is an indication of emerging labor market conditions in the country. However, these are weekly administrative data which are difficult to seasonally adjust, making the series subject to some volatility.” https://www.dol.gov/ui/data.pdf.
10. NYS Department of Labor: https://dol.ny.gov; accessed March, 2021. 11. https://labor.ny.gov/stats/PDFs/Research-Notes-Initial-ClaimsWE-
3212020.pdf. 12. U.S. data: https://oui.doleta.gov/unemploy/claims_arch.asp; NY data:
https://dol.ny.gov/weekly-ui-claims-report. Note that comparison data from 2019 for initial unemployment claims for the period of March 8-21 was not available at the borough level and was estimated based on other known data. Note that the last weekly initial unemployment claims report that will be published by the NYS Department of Labor was the March 27, 2021 report.
13. NYS Department of Labor: https://dol.ny.gov/; accessed March 2021.
Data is revised annually and may not match data reported in prior years. 14. U.S. Bureau of Labor Statistics: http://www.bls.gov. 15. “New York City’s Covid-19 Economy Will Not Snap Back.” James A. Parrott
February, 2021. The New School, Center for New York City Affairs. 16. The data in Appendix 12 is not directly comparable to the data
summarized from the report from the New School. Our report focuses on the broadest categories of industries (e.g., Leisure and Hospitality), while the New School report breaks down some of these industries into smaller
sectors (e.g., Food Services, which is a part of Leisure and Hospitality). In addition, as noted in the write-up, the data in the New School report was released prior to a federally-mandated annual benchmarking process, which resulted in revised data published by the NYS Department of Labor in March, 2021. Per the U.S. Bureau of Labor Statistics: “In order to control for both sampling and nonsampling error, CES payroll employment estimates are benchmarked annually to employment counts from a census of the employer population... As part of the benchmark process for benchmark year 2020, census-derived employment counts replace CES payroll employment estimates.” As compared to the previously released estimates, for all industries, the revised numbers from February, April, and December 2020 (the three months of data used in the analysis) showed an increase of 0.1% in employment in February; a decrease of 0.2% in April; and a decrease of 1.5% in December. The “Face-to-Face” industries were revised to a greater degree than the other referenced industries, with a decrease of 0.6% in February, 1.0% in April, and 3.7% in December of 2020.
17. The NYC labor force participation rate and employment/population ratio
are derived from unpublished data from the U.S. Bureau of Labor Statistics, obtained from the Office of the NYC Comptroller. Note that prior years’ data are annually revised, and may differ from figures reported in prior reports.
18. U.S. Bureau of Labor Statistics: http://www.bls.gov. 19. NYS Department of Labor: https://dol.ny.gov/; accessed March 2021. 20. There was also an increase of 17.1% in the Agriculture/Mining/Unclassified
sector, the largest proportional increase, but which accounts for only 0.2% of all wages.
21. U.S. Bureau of Labor Statistics: http://www.bls.gov. 22. U.S. Bureau of Labor Statistics: http://www.bls.gov. 23. https://dol.ny.gov/pandemic-unemployment-assistance. 24. https://webapps.labor.ny.gov/dolweb/benefit-rate-calculator/. 25. https://dol.ny.gov/coronavirus-aid-relief-and-economic-security-cares-act. 26. https://dol.ny.gov/system/files/documents/2021/01/lwa-factsheet.pdf. 27. A $300 per week PUC payment was authorized in the December 2020
“Continued Assistance for Unemployed Workers Act of 2020.” and began payments the week ending January 3, 2021 and expired on March 14, 2021. A $300 per week PUC payment was authorized in the March 2021 “Coronavirus Aid, Relief and Economic Security (CARES) Act.” and began payments at the expiration of the prior Act, and continues through the week ending September 4, 2021.
28. https://dol.ny.gov/coronavirus-aid-relief-and-economic-security-cares-act. 29. The median rent stabilized household income, as reported in the
previous two triennial NYC Housing and Vacancy Surveys, rose in nominal terms by 9.7% between 2013 and 2016. As current data is not available, the 2016 median rent stabilized household income ($44,560) was increased by this same percentage to obtain an estimate for the current median rent stabilized household income. This sample household is meant for illustrative purposes only.
30. It is impossible to estimate monthly income for all household types.
Households can have any number of wage earners, some or all of whom may have become unemployed during the pandemic. As noted in the text, for those households with more than one wage earner, where all wage earners have become unemployed, each person receiving unemployment would be eligible for PUC payments. Therefore, the total compensation is not equal when considering a household in which one person is the sole wage earner, versus two persons each making half the amount. For instance, in a household with a single earner, making $49,000 per year and receiving NYSUI in April of 2020, the total household income would be $4,642 a month (including $600 per week PUC). If there were two earners in
2021 Income and Affordability Study
Page 30 • April 15, 2021 • New York City Rent Guidelines Board
the household, each making $24,500 (for a total household income of $49,000 a year), in April of 2020 that household would have received $7,242 in unemployment compensation because an extra $2,600 in PUC payments would be received by the household from the second wage earner. From January through August of 2021, each household member receiving PUC brings an additional $1,300 into the household. In addition, the maximum NYSUI/PUA payment, before PUC, is $504 a month. Those persons making more than $52,416 a year will not receive more than $504 a week, while those who make less receive half their former salary. Therefore, a single person making $80,000 a year, even without PUC payments, will receive less compensation than two persons each making $40,000 per year. This analysis also doesn’t consider households where one person may have retained employment while the other may be receiving unemployment.
31. https://www.irs.gov/newsroom/economic-impact-payments-what-you-
need-to-know. 32. https://www.irs.gov/newsroom/treasury-and-irs-begin-delivering-
second-round-of-economic-impact-payments-to-millions-of-americans. 33. https://www.irs.gov/newsroom/more-economic-impact-payments-set-
for-disbursement-in-coming-days-taxpayers-should-watch-mail-for-paper-checks-debit-cards.
34. Administrative Office of the U.S. Courts: https://www.uscourts.gov/
statistics-reports/caseload-statistics-data-tables. 35. Press Release, Administrative Office of the U.S. Courts. “Annual
Bankruptcy Filings Fall 29.7 Percent.” January 28, 2021. 36. Poverty statistics were researched on the U.S. Census Bureau’s data site:
http://data.census.gov in February of 2021. The U.S. Census Bureau reports that in 2020 the weighted average poverty threshold for a one-person household is $13,172; $16,725 for a two-person household; $20,586 for a three-person household; $26,495 for a four-person household; $31,404 for a five-person household; $35,562 for a six-person household; $40,510 for a seven-person household; $45,010 for an eight-person household; and $53,527 for a nine-person or more household.
37. U.S. Census Bureau: https://www.census.gov/newsroom/blogs/random-
samplings/2020/09/supplemental-poverty-measure.html. 38. “New York City Government Poverty Measure, 2018.” NYC Center for
Economic Opportunity. Note that the CEO poverty rates are adjusted periodically and may not match figures found in prior reports.
39. The three referenced universities are Zhejiang University, the University
of Chicago, and the University of Notre Dame. “Real-time Poverty Estimates During the COVID-19 Pandemic through February 2021.” March 18, 2021. http://povertymeasurement.org/wp-content/uploads/ 2021/03/Real-time-Poverty-Estimates-through-February-2021-Updated-March-18-2021.pdf.
40. The estimated poverty rate is also updated monthly and can be found
at: http://povertymeasurement.org/covid-19-poverty-dashboard/. Note that the most recent estimated poverty rate available as of the date of this publication is February, 2021, preceding the third stimulus check distribution in March, 2021.
41. The New York City Housing and Vacancy Survey (HVS) is sponsored by the
NYC Department of Housing Preservation and Development (HPD) and conducted by the U.S. Census Bureau. Also see “Selected Initial Findings of the 2017 New York City Housing and Vacancy Survey,” prepared by HPD.
42. 2019 American Community Survey, U.S. Census Bureau:
http://data.census.gov. American Community Survey data does not specifically identify rent stabilized units.
43. All data under the heading of “Household Pulse Survey” is from the U.S.
Census Bureau’s Household Pulse Survey: https://www.census.gov/ programs-surveys/household-pulse-survey.html. Data was derived in two ways — from data tables, and from the Public Use File.
44. U.S. Bureau of Labor Statistics: http://www.bls.gov. 45. The seven cities selected by the RGB for comparison are Philadelphia,
San Francisco, Boston, Chicago, Atlanta, Los Angeles, and Washington, D.C. Rent increases in these cities ranged from 2.5%-3.9%.
46. Press Release, Mayor’s Office. “Mayor Bloomberg and NYCHA Chairman
Hernandez Announce that Section 8 Voucher List Will Open For First Time in Twelve Years,” January 29, 2007.
47. Preliminary FY 2021 Mayor’s Management Report, NYC Housing Authority
section. The City’s FY runs from July 1 through June 30 of each year. 48. Eligibility guidelines via the NYC Housing Preservation and
Development: https://www1.nyc.gov/site/hpd/services-and-information/section-8-eligibility.page.
49. Division of Tenant Resources Section 8 General Program Indicators, HPD:
https://www1.nyc.gov/assets/hpd/downloads/pdfs/services/ hpd-section-8-program-statistics.pdf. October 19, 2020.
50. “CECONY Average Monthly NYC Residential Bills 300 kWh:”
http://www.coned.com/rates. 51. U.S. Energy Information Administration, Electric Sales, Revenue, and
Average Price (2019 Tables T6 and T5.a): http://www.eia.gov/ electricity/sales_revenue_price/.
52. “Con Ed on verge of three-year rate hike; prices expected to go up in
January.” New York Daily News, December 9, 2019. 53. “2019 Annual Average Cost of Living Index Release.” The Council for
Community and Economic Research: http://www.coli.org/media. 54. ACCRA cost of living report. The Council for Community and Economic
Research: https://store.coli.org/compare.asp. 55. National Association of Home Builders: https://www.nahb.org/news-and-
economics/housing-economics/indices/Housing-Opportunity-Index. Affordability is defined as no more than 28% of gross income spent on housing costs.
56. Current data can only be compared to data in 2012 or later, following a
methodological change in the way the data is calculated. 57. The methodology that the National Low Income Housing Coalition uses
can be found at: https://reports.nlihc.org/sites/default/files/oor/ OOR_2020.pdf.
58. Fair Market Rents (FMRs) are published annually by the U.S. Department
of Housing and Urban Development (HUD): https://www.huduser.gov/ portal/datasets/fmr.html. The FMR is defined by HUD as: “The FMR is the 40th percentile of gross rents for typical, non-substandard rental units occupied by recent movers in a local housing market.”
59. Cash assistance programs in New York State include the Family
Assistance program and the Safety Net Assistance program: https://www.nycbar.org/get-legal-help/article/public-benefits/new-york-state-cash-assistance-program/.
60. NYC Human Resources Administration. HRA Charts (Cash Assistance
Recipients): http://www1.nyc.gov/site/hra/about/facts.page#charts. 61. NYC Human Resources Administration. HRA Monthly Fact Sheets
(December 2020): http://www1.nyc.gov/site/hra/about/ facts.page#caseloads.
62. “Have NYC’s Cash Assistance Rolls Grown Following The Pandemic-Related
Rise in Unemployment?” NYC Independent Budget Office, July, 2020. 63. Data directly from the NYS Office of Temporary and Disability Assistance,
April, 2021.
2021 Income and Affordability Study
New York City Rent Guidelines Board • April 15, 2021 • Page 31
64. NYC Human Resources Administration. HRA Charts (Assisted Entries to Employment): http://www1.nyc.gov/site/hra/about/facts.page#charts.
65. NYC Human Resources Administration. HRA Charts (SNAP Recipients):
http://www1.nyc.gov/site/hra/about/facts.page#charts. 66. NYC Human Resources Administration. HRA Charts (HRA Administered
Medicaid Enrollees): http://www1.nyc.gov/site/hra/ about/facts.page#charts.
67. https://www.nysenate.gov/legislation/bills/2019/s8419. 68. https://hcr.ny.gov/system/files/documents/2020/10/covid-rrp-report.pdf. 69. https://hcr.ny.gov/system/files/documents/2021/01/covid-rent-relief-
program-extension.pdf. 70. “NY's Second Round Of Rent Relief Only Distributes $7 Million Of $60
Million Available.” Gothamist, March 23, 2021. 71. Press Release, Governor’s Office. “Governor Cuomo Announces
Highlights of FY 2022 Budget to Reimagine, Rebuild and Renew New York,” April 6, 2021.
72. https://www.nysenate.gov/legislation/bills/2021/s2506/amendment/c. 73. Data from NYC Department of Homeless Services (DHS), including DHS
daily reports, DHS Data Dashboard Tables, Local Law 37 reports, and Citywide Performance Reporting reports. Note that in addition, the NYC Department of Housing Preservation and Development, the NYC Department of Youth and Community Development, and the NYC Human Resources Administration also operate emergency shelters, which house as many as 8,000 persons per night, which is not included in the totals presented in this report. These figures are not reported in order to make year-to-year data comparable.
74. The decline in homelessness during an economic crisis may seem
counterintuitive. By way of explanation, in the Preliminary Fiscal 2021 Mayor’s Management Report, DHS summarizes changes in the shelter census during the period of July-November of 2020 as such: “During the first four months of Fiscal 2021, the average number of families with children and adult families in shelter per day both declined by over 14 percent compared to the same period of Fiscal 2020. The number families with children was trending down pre-COVID-19 due to investments in prevention and rehousing programs, including rental assistance, and the COVID-19 eviction moratorium contributed to further reductions in the family shelter census. At the same time, the average number of single adults in shelters per day rose by 8.8 percent, primarily due to increases in length of stay and fewer housing placements during the COVID-19 pandemic. DHS continues to focus on addressing the housing and service needs of those longest in shelter, including targeted interventions for elderly clients and clients with disabilities.”
75. The NYC Department of Homeless Services (DHS) splits families into two
groups – families with children and adult families (generally spouses and domestic partners). Approximately 83% of “families” in 2020 are families with children.
76. Based on data from annual Mayor’s Management Reports. 77. “The 2020 Annual Homeless Assessment Report (AHAR) to Congress:
Part 1, Point-in-Time Estimates of Homelessness.” U.S. Department of Housing and Urban Development, January 2021.
78. “Notice of Adoption of Amendment to Title 68 of the Rules of the City of
New York to Add a New Chapter 10 Establishing the City Fighting Homelessness and Eviction Prevention Supplement (CityFHEPS) Program.”
79. Press Release, NYC Department of Homeless Services. “City Proposes
Single Unified Rental Assistance Program to Streamline and Simplify Rehousing Process” July 18, 2018.
80. CityFHEPS Frequently Asked Questions: https://www1.nyc.gov/site/ hra/help/cityfheps.page.
81. RGB requested data from the Civil Court of the City of New York. 82. On December 28, 2020 Governor Cuomo signed into law the COVID-19
Emergency Eviction and Foreclosure Prevention Act of 2020. The Act stays pending residential eviction proceedings for sixty (60) days; stays residential eviction proceedings filed within 30 days of December 28, 2020 for 60 days; publishes a “Hardship Declarations” form to be used by tenant-respondents in eviction matters in reporting financial hardship during or due to the COVID-19 pandemic; and stays residential eviction proceedings until at least May 1, 2021 in proceedings where a tenant-respondent submits a completed Hardship Declaration. If tenants do not complete this declaration, the non-payment case is permitted to be filed with Housing Court. A federal eviction moratorium for households earning no more than $99,000 in 2020 (or $198,000 if filing jointly) who complete an “Eviction Protection Declaration“ is in effect until at least June 30, 2021 (https://www.cdc.gov/coronavirus/2019-ncov/more/pdf/CDC-Eviction-Moratorium-03292021.pdf ). Per the federal order, NYS has the option of imposing a stricter moratorium that would supersede the federal one. As of the publication of this report, NYS has not done so.
83. Eviction data from the NYC Department of Investigation, Bureau of
Auditors data. Note that eviction data is submitted to the NYC Department of Investigation by the marshals who execute the warrants. If more than one person is named on the lease for the apartment, each named tenant must have an executed warrant. In addition, there are occasionally cases where the tenant enters the apartment after a warrant is successfully executed and another warrant must be executed. A marshal may also report a separate warrant for each level of a multi-story private house. The RGB estimates that the actual number of units that experienced an eviction in both 2019 and 2020 was approximately 10% lower than the number of the evictions reported.
84. See Endnote 82. 85. Press Release, Mayor’s Office. “Mayor de Blasio Signs Legislation to
Provide Low-Income New Yorkers with Access to Counsel for Wrongful Evictions.” August 11, 2017.
86. Press Release, Mayor’s Office. “Amid Nationwide Increases, Mayor de
Blasio Announces Record-Breaking 41 Percent Decrease in Evictions Citywide.” February 24, 2020.
87. Press Release, Mayor’s Office. “350,000 New Yorkers Receiving Free Legal
Help to Fight Evictions Through Right to Counsel.” December 13, 2019. 88. https://www1.nyc.gov/site/hra/help/legal-services-for-tenants.page. 89. Preliminary FY 2021 Mayor’s Management Report, NYC Human
Resources Administration section. 90. https://www1.nyc.gov/content/tenantprotection/pages/tenant-
resource-portal. 91. “Comments on New York City’s Preliminary Budget for FY 2022 and
Financial Plan for Fiscal Years 2021-2025.” Office of the NYC Comptroller. March 2, 2021.
92. “January 2021 Financial Plan Detail, Fiscal Years 2021– 2025.” Mayor’s
Office of Management and Budget. January 14, 2021. 93. “Outlook for the City’s Economy: A Slow and Fragile Recovery.” New York
City Independent Budget Office. March 1, 2021. 94. Employment and Unemployment data from 2010-2020 was updated by
the NYS Department of Labor on March 11, 2021, after the publication of the IBO report. As a result, data from the IBO report may not match other data presented in this report.
2021 Income and Affordability Study
Page 32 • April 15, 2021 • New York City Rent Guidelines Board
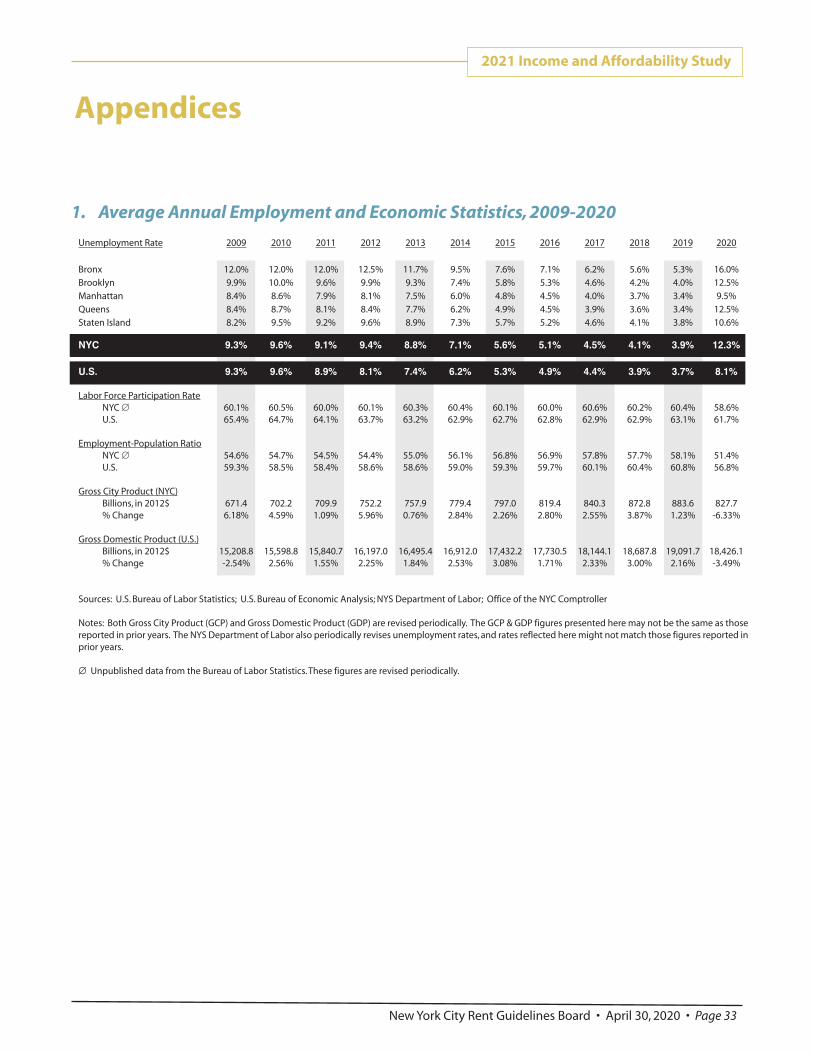
2021 Income and Affordability Study
Unemployment Rate 2009 2010 2011 2012 2013 2014 2015 2016 2017 2018 2019 2020 Bronx 12.0% 12.0% 12.0% 12.5% 11.7% 9.5% 7.6% 7.1% 6.2% 5.6% 5.3% 16.0% Brooklyn 9.9% 10.0% 9.6% 9.9% 9.3% 7.4% 5.8% 5.3% 4.6% 4.2% 4.0% 12.5% Manhattan 8.4% 8.6% 7.9% 8.1% 7.5% 6.0% 4.8% 4.5% 4.0% 3.7% 3.4% 9.5% Queens 8.4% 8.7% 8.1% 8.4% 7.7% 6.2% 4.9% 4.5% 3.9% 3.6% 3.4% 12.5% Staten Island 8.2% 9.5% 9.2% 9.6% 8.9% 7.3% 5.7% 5.2% 4.6% 4.1% 3.8% 10.6% NYC 9.3% 9.6% 9.1% 9.4% 8.8% 7.1% 5.6% 5.1% 4.5% 4.1% 3.9% 12.3%
U.S. 9.3% 9.6% 8.9% 8.1% 7.4% 6.2% 5.3% 4.9% 4.4% 3.9% 3.7% 8.1% Labor Force Participation Rate
NYC ∅ 60.1% 60.5% 60.0% 60.1% 60.3% 60.4% 60.1% 60.0% 60.6% 60.2% 60.4% 58.6% U.S. 65.4% 64.7% 64.1% 63.7% 63.2% 62.9% 62.7% 62.8% 62.9% 62.9% 63.1% 61.7%
Employment-Population Ratio
NYC ∅ 54.6% 54.7% 54.5% 54.4% 55.0% 56.1% 56.8% 56.9% 57.8% 57.7% 58.1% 51.4%U.S. 59.3% 58.5% 58.4% 58.6% 58.6% 59.0% 59.3% 59.7% 60.1% 60.4% 60.8% 56.8%
Gross City Product (NYC)
Billions, in 2012$ 671.4 702.2 709.9 752.2 757.9 779.4 797.0 819.4 840.3 872.8 883.6 827.7 % Change 6.18% 4.59% 1.09% 5.96% 0.76% 2.84% 2.26% 2.80% 2.55% 3.87% 1.23% -6.33%
Gross Domestic Product (U.S.)
Billions, in 2012$ 15,208.8 15,598.8 15,840.7 16,197.0 16,495.4 16,912.0 17,432.2 17,730.5 18,144.1 18,687.8 19,091.7 18,426.1 % Change -2.54% 2.56% 1.55% 2.25% 1.84% 2.53% 3.08% 1.71% 2.33% 3.00% 2.16% -3.49%
Sources: U.S. Bureau of Labor Statistics; U.S. Bureau of Economic Analysis; NYS Department of Labor; Office of the NYC Comptroller Notes: Both Gross City Product (GCP) and Gross Domestic Product (GDP) are revised periodically. The GCP & GDP figures presented here may not be the same as those reported in prior years. The NYS Department of Labor also periodically revises unemployment rates, and rates reflected here might not match those figures reported in prior years. ∅ Unpublished data from the Bureau of Labor Statistics. These figures are revised periodically.
1. Average Annual Employment and Economic Statistics, 2009-2020
Appendices
New York City Rent Guidelines Board • April 30, 2020 • Page 33
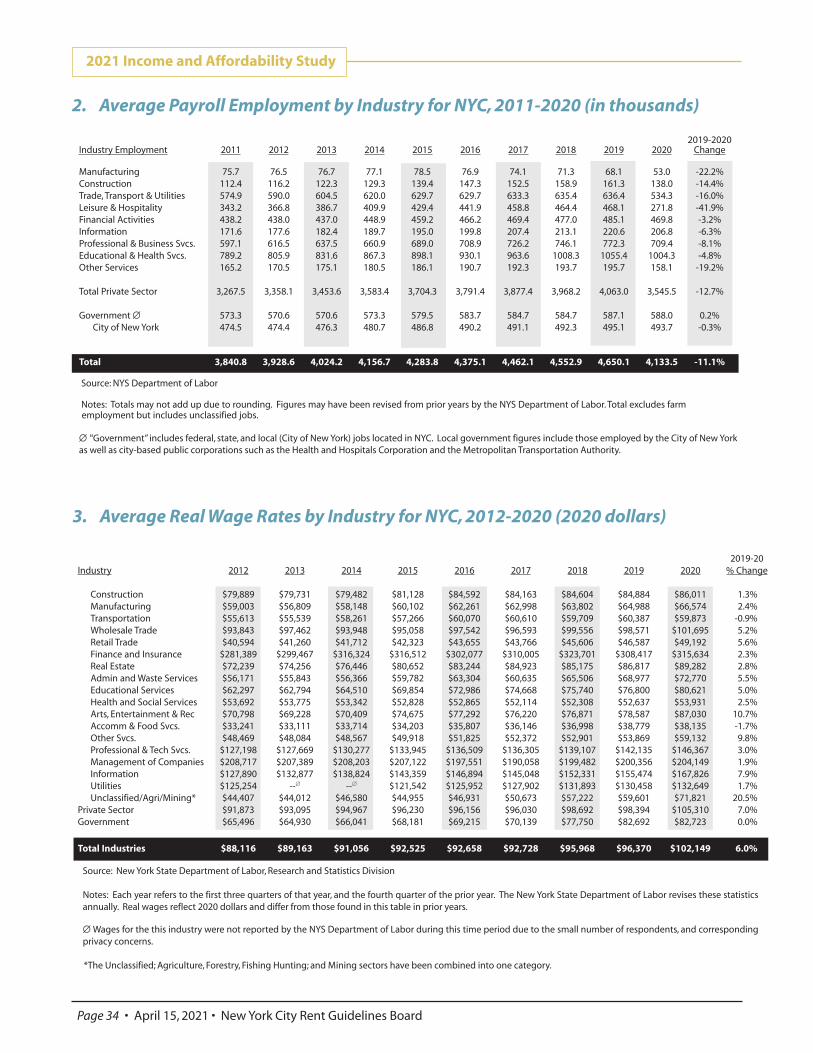
2021 Income and Affordability Study
Page 34 • April 15, 2021 • New York City Rent Guidelines Board
2019-2020
Industry Employment 2011 2012 2013 2014 2015 2016 2017 2018 2019 2020 Change Manufacturing 75.7 76.5 76.7 77.1 78.5 76.9 74.1 71.3 68.1 53.0 -22.2% Construction 112.4 116.2 122.3 129.3 139.4 147.3 152.5 158.9 161.3 138.0 -14.4% Trade, Transport & Utilities 574.9 590.0 604.5 620.0 629.7 629.7 633.3 635.4 636.4 534.3 -16.0% Leisure & Hospitality 343.2 366.8 386.7 409.9 429.4 441.9 458.8 464.4 468.1 271.8 -41.9% Financial Activities 438.2 438.0 437.0 448.9 459.2 466.2 469.4 477.0 485.1 469.8 -3.2% Information 171.6 177.6 182.4 189.7 195.0 199.8 207.4 213.1 220.6 206.8 -6.3% Professional & Business Svcs. 597.1 616.5 637.5 660.9 689.0 708.9 726.2 746.1 772.3 709.4 -8.1% Educational & Health Svcs. 789.2 805.9 831.6 867.3 898.1 930.1 963.6 1008.3 1055.4 1004.3 -4.8% Other Services 165.2 170.5 175.1 180.5 186.1 190.7 192.3 193.7 195.7 158.1 -19.2%
Total Private Sector 3,267.5 3,358.1 3,453.6 3,583.4 3,704.3 3,791.4 3,877.4 3,968.2 4,063.0 3,545.5 -12.7% Government ∅ 573.3 570.6 570.6 573.3 579.5 583.7 584.7 584.7 587.1 588.0 0.2%
City of New York 474.5 474.4 476.3 480.7 486.8 490.2 491.1 492.3 495.1 493.7 -0.3%
Total 3,840.8 3,928.6 4,024.2 4,156.7 4,283.8 4,375.1 4,462.1 4,552.9 4,650.1 4,133.5 -11.1% Source: NYS Department of Labor Notes: Totals may not add up due to rounding. Figures may have been revised from prior years by the NYS Department of Labor. Total excludes farm employment but includes unclassified jobs. ∅ “Government” includes federal, state, and local (City of New York) jobs located in NYC. Local government figures include those employed by the City of New York as well as city-based public corporations such as the Health and Hospitals Corporation and the Metropolitan Transportation Authority.
2. Average Payroll Employment by Industry for NYC, 2011-2020 (in thousands)
2019-20
Industry 2012 2013 2014 2015 2016 2017 2018 2019 2020 % Change
Construction $79,889 $79,731 $79,482 $81,128 $84,592 $84,163 $84,604 $84,884 $86,011 1.3% Manufacturing $59,003 $56,809 $58,148 $60,102 $62,261 $62,998 $63,802 $64,988 $66,574 2.4% Transportation $55,613 $55,539 $58,261 $57,266 $60,070 $60,610 $59,709 $60,387 $59,873 -0.9% Wholesale Trade $93,843 $97,462 $93,948 $95,058 $97,542 $96,593 $99,556 $98,571 $101,695 5.2% Retail Trade $40,594 $41,260 $41,712 $42,323 $43,655 $43,766 $45,606 $46,587 $49,192 5.6% Finance and Insurance $281,389 $299,467 $316,324 $316,512 $302,077 $310,005 $323,701 $308,417 $315,634 2.3% Real Estate $72,239 $74,256 $76,446 $80,652 $83,244 $84,923 $85,175 $86,817 $89,282 2.8% Admin and Waste Services $56,171 $55,843 $56,366 $59,782 $63,304 $60,635 $65,506 $68,977 $72,770 5.5% Educational Services $62,297 $62,794 $64,510 $69,854 $72,986 $74,668 $75,740 $76,800 $80,621 5.0% Health and Social Services $53,692 $53,775 $53,342 $52,828 $52,865 $52,114 $52,308 $52,637 $53,931 2.5% Arts, Entertainment & Rec $70,798 $69,228 $70,409 $74,675 $77,292 $76,220 $76,871 $78,587 $87,030 10.7% Accomm & Food Svcs. $33,241 $33,111 $33,714 $34,203 $35,807 $36,146 $36,998 $38,779 $38,135 -1.7% Other Svcs. $48,469 $48,084 $48,567 $49,918 $51,825 $52,372 $52,901 $53,869 $59,132 9.8% Professional & Tech Svcs. $127,198 $127,669 $130,277 $133,945 $136,509 $136,305 $139,107 $142,135 $146,367 3.0% Management of Companies $208,717 $207,389 $208,203 $207,122 $197,551 $190,058 $199,482 $200,356 $204,149 1.9% Information $127,890 $132,877 $138,824 $143,359 $146,894 $145,048 $152,331 $155,474 $167,826 7.9% Utilities $125,254 --∅ --∅ $121,542 $125,952 $127,902 $131,893 $130,458 $132,649 1.7%Unclassified/Agri/Mining* $44,407 $44,012 $46,580 $44,955 $46,931 $50,673 $57,222 $59,601 $71,821 20.5%
Private Sector $91,873 $93,095 $94,967 $96,230 $96,156 $96,030 $98,692 $98,394 $105,310 7.0% Government $65,496 $64,930 $66,041 $68,181 $69,215 $70,139 $77,750 $82,692 $82,723 0.0%
Total Industries $88,116 $89,163 $91,056 $92,525 $92,658 $92,728 $95,968 $96,370 $102,149 6.0%
3. Average Real Wage Rates by Industry for NYC, 2012-2020 (2020 dollars)
Source: New York State Department of Labor, Research and Statistics Division Notes: Each year refers to the first three quarters of that year, and the fourth quarter of the prior year. The New York State Department of Labor revises these statistics annually. Real wages reflect 2020 dollars and differ from those found in this table in prior years. ∅ Wages for the this industry were not reported by the NYS Department of Labor during this time period due to the small number of respondents, and corresponding privacy concerns. *The Unclassified; Agriculture, Forestry, Fishing Hunting; and Mining sectors have been combined into one category.
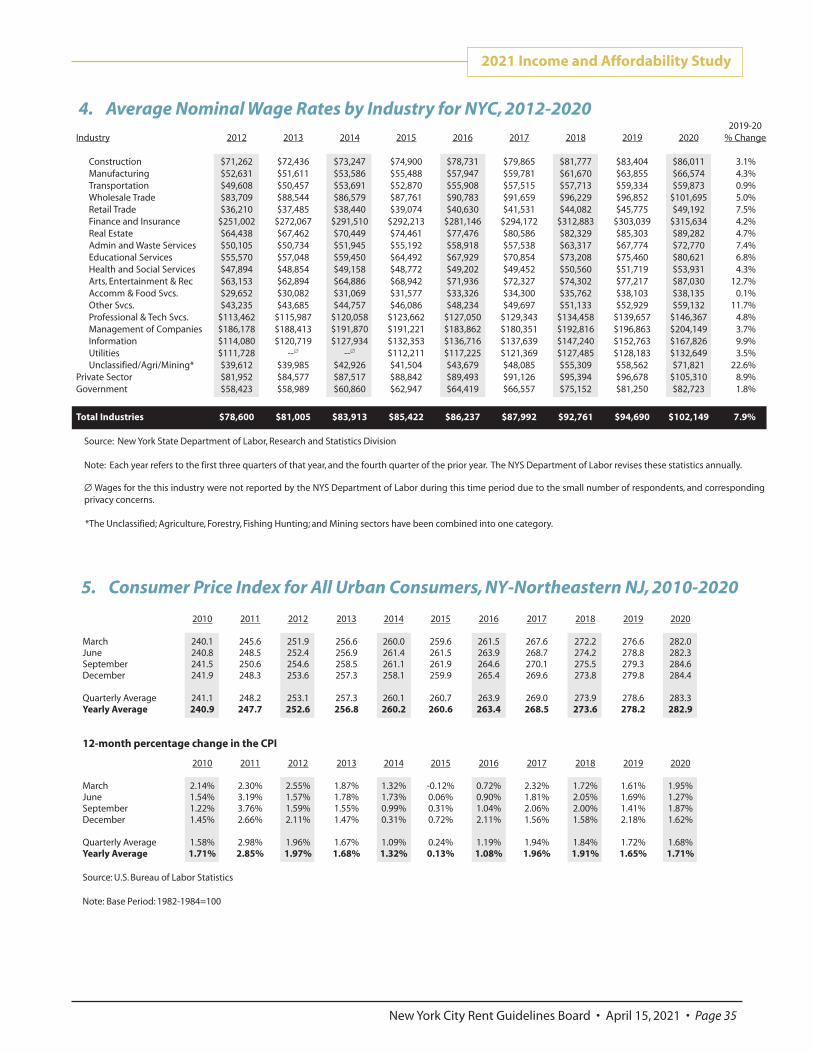
2021 Income and Affordability Study
New York City Rent Guidelines Board • April 15, 2021 • Page 35
2010 2011 2012 2013 2014 2015 2016 2017 2018 2019 2020
March 240.1 245.6 251.9 256.6 260.0 259.6 261.5 267.6 272.2 276.6 282.0 June 240.8 248.5 252.4 256.9 261.4 261.5 263.9 268.7 274.2 278.8 282.3 September 241.5 250.6 254.6 258.5 261.1 261.9 264.6 270.1 275.5 279.3 284.6 December 241.9 248.3 253.6 257.3 258.1 259.9 265.4 269.6 273.8 279.8 284.4
Quarterly Average 241.1 248.2 253.1 257.3 260.1 260.7 263.9 269.0 273.9 278.6 283.3 Yearly Average 240.9 247.7 252.6 256.8 260.2 260.6 263.4 268.5 273.6 278.2 282.9
12-month percentage change in the CPI
2010 2011 2012 2013 2014 2015 2016 2017 2018 2019 2020 March 2.14% 2.30% 2.55% 1.87% 1.32% -0.12% 0.72% 2.32% 1.72% 1.61% 1.95% June 1.54% 3.19% 1.57% 1.78% 1.73% 0.06% 0.90% 1.81% 2.05% 1.69% 1.27% September 1.22% 3.76% 1.59% 1.55% 0.99% 0.31% 1.04% 2.06% 2.00% 1.41% 1.87% December 1.45% 2.66% 2.11% 1.47% 0.31% 0.72% 2.11% 1.56% 1.58% 2.18% 1.62%
Quarterly Average 1.58% 2.98% 1.96% 1.67% 1.09% 0.24% 1.19% 1.94% 1.84% 1.72% 1.68% Yearly Average 1.71% 2.85% 1.97% 1.68% 1.32% 0.13% 1.08% 1.96% 1.91% 1.65% 1.71% Source: U.S. Bureau of Labor Statistics Note: Base Period: 1982-1984=100
5. Consumer Price Index for All Urban Consumers, NY-Northeastern NJ, 2010-2020
2019-20
Industry 2012 2013 2014 2015 2016 2017 2018 2019 2020 % Change
Construction $71,262 $72,436 $73,247 $74,900 $78,731 $79,865 $81,777 $83,404 $86,011 3.1% Manufacturing $52,631 $51,611 $53,586 $55,488 $57,947 $59,781 $61,670 $63,855 $66,574 4.3% Transportation $49,608 $50,457 $53,691 $52,870 $55,908 $57,515 $57,713 $59,334 $59,873 0.9% Wholesale Trade $83,709 $88,544 $86,579 $87,761 $90,783 $91,659 $96,229 $96,852 $101,695 5.0% Retail Trade $36,210 $37,485 $38,440 $39,074 $40,630 $41,531 $44,082 $45,775 $49,192 7.5% Finance and Insurance $251,002 $272,067 $291,510 $292,213 $281,146 $294,172 $312,883 $303,039 $315,634 4.2% Real Estate $64,438 $67,462 $70,449 $74,461 $77,476 $80,586 $82,329 $85,303 $89,282 4.7% Admin and Waste Services $50,105 $50,734 $51,945 $55,192 $58,918 $57,538 $63,317 $67,774 $72,770 7.4% Educational Services $55,570 $57,048 $59,450 $64,492 $67,929 $70,854 $73,208 $75,460 $80,621 6.8% Health and Social Services $47,894 $48,854 $49,158 $48,772 $49,202 $49,452 $50,560 $51,719 $53,931 4.3% Arts, Entertainment & Rec $63,153 $62,894 $64,886 $68,942 $71,936 $72,327 $74,302 $77,217 $87,030 12.7% Accomm & Food Svcs. $29,652 $30,082 $31,069 $31,577 $33,326 $34,300 $35,762 $38,103 $38,135 0.1% Other Svcs. $43,235 $43,685 $44,757 $46,086 $48,234 $49,697 $51,133 $52,929 $59,132 11.7% Professional & Tech Svcs. $113,462 $115,987 $120,058 $123,662 $127,050 $129,343 $134,458 $139,657 $146,367 4.8% Management of Companies $186,178 $188,413 $191,870 $191,221 $183,862 $180,351 $192,816 $196,863 $204,149 3.7% Information $114,080 $120,719 $127,934 $132,353 $136,716 $137,639 $147,240 $152,763 $167,826 9.9% Utilities $111,728 --∅ --∅ $112,211 $117,225 $121,369 $127,485 $128,183 $132,649 3.5%Unclassified/Agri/Mining* $39,612 $39,985 $42,926 $41,504 $43,679 $48,085 $55,309 $58,562 $71,821 22.6%
Private Sector $81,952 $84,577 $87,517 $88,842 $89,493 $91,126 $95,394 $96,678 $105,310 8.9% Government $58,423 $58,989 $60,860 $62,947 $64,419 $66,557 $75,152 $81,250 $82,723 1.8%
Total Industries $78,600 $81,005 $83,913 $85,422 $86,237 $87,992 $92,761 $94,690 $102,149 7.9%
4. Average Nominal Wage Rates by Industry for NYC, 2012-2020
Source: New York State Department of Labor, Research and Statistics Division Note: Each year refers to the first three quarters of that year, and the fourth quarter of the prior year. The NYS Department of Labor revises these statistics annually. ∅ Wages for the this industry were not reported by the NYS Department of Labor during this time period due to the small number of respondents, and corresponding privacy concerns. *The Unclassified; Agriculture, Forestry, Fishing Hunting; and Mining sectors have been combined into one category.
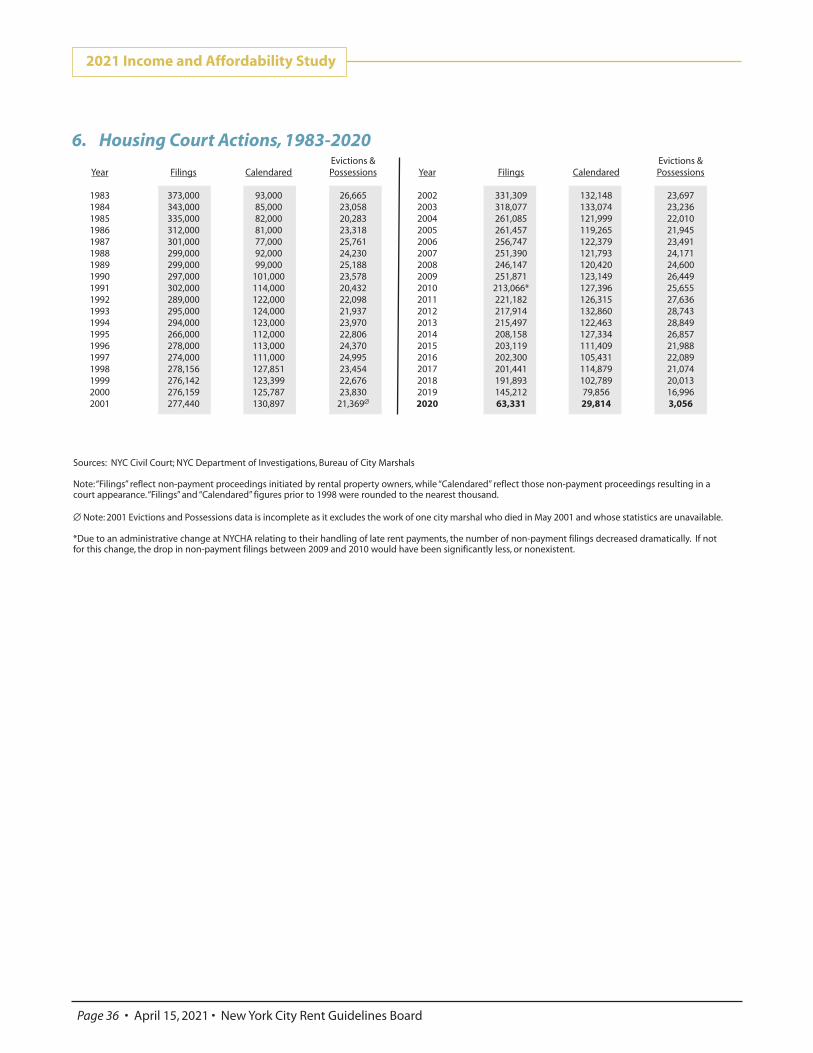
2021 Income and Affordability Study
Page 36 • April 15, 2021 • New York City Rent Guidelines Board
Sources: NYC Civil Court; NYC Department of Investigations, Bureau of City Marshals Note: “Filings” reflect non-payment proceedings initiated by rental property owners, while “Calendared” reflect those non-payment proceedings resulting in a court appearance. “Filings” and “Calendared” figures prior to 1998 were rounded to the nearest thousand. ∅ Note: 2001 Evictions and Possessions data is incomplete as it excludes the work of one city marshal who died in May 2001 and whose statistics are unavailable. *Due to an administrative change at NYCHA relating to their handling of late rent payments, the number of non-payment filings decreased dramatically. If not for this change, the drop in non-payment filings between 2009 and 2010 would have been significantly less, or nonexistent.
Evictions & Year Filings Calendared Possessions
1983 373,000 93,000 26,665 1984 343,000 85,000 23,058 1985 335,000 82,000 20,283 1986 312,000 81,000 23,318 1987 301,000 77,000 25,761 1988 299,000 92,000 24,230 1989 299,000 99,000 25,188 1990 297,000 101,000 23,578 1991 302,000 114,000 20,432 1992 289,000 122,000 22,098 1993 295,000 124,000 21,937 1994 294,000 123,000 23,970 1995 266,000 112,000 22,806 1996 278,000 113,000 24,370 1997 274,000 111,000 24,995 1998 278,156 127,851 23,454 1999 276,142 123,399 22,676 2000 276,159 125,787 23,830 2001 277,440 130,897 21,369∅
Evictions & Year Filings Calendared Possessions
2002 331,309 132,148 23,697 2003 318,077 133,074 23,236 2004 261,085 121,999 22,010 2005 261,457 119,265 21,945 2006 256,747 122,379 23,491 2007 251,390 121,793 24,171 2008 246,147 120,420 24,600 2009 251,871 123,149 26,449 2010 213,066* 127,396 25,655 2011 221,182 126,315 27,636 2012 217,914 132,860 28,743 2013 215,497 122,463 28,849 2014 208,158 127,334 26,857 2015 203,119 111,409 21,988 2016 202,300 105,431 22,089 2017 201,441 114,879 21,074 2018 191,893 102,789 20,013 2019 145,212 79,856 16,996 2020 63,331 29,814 3,056
6. Housing Court Actions, 1983-2020
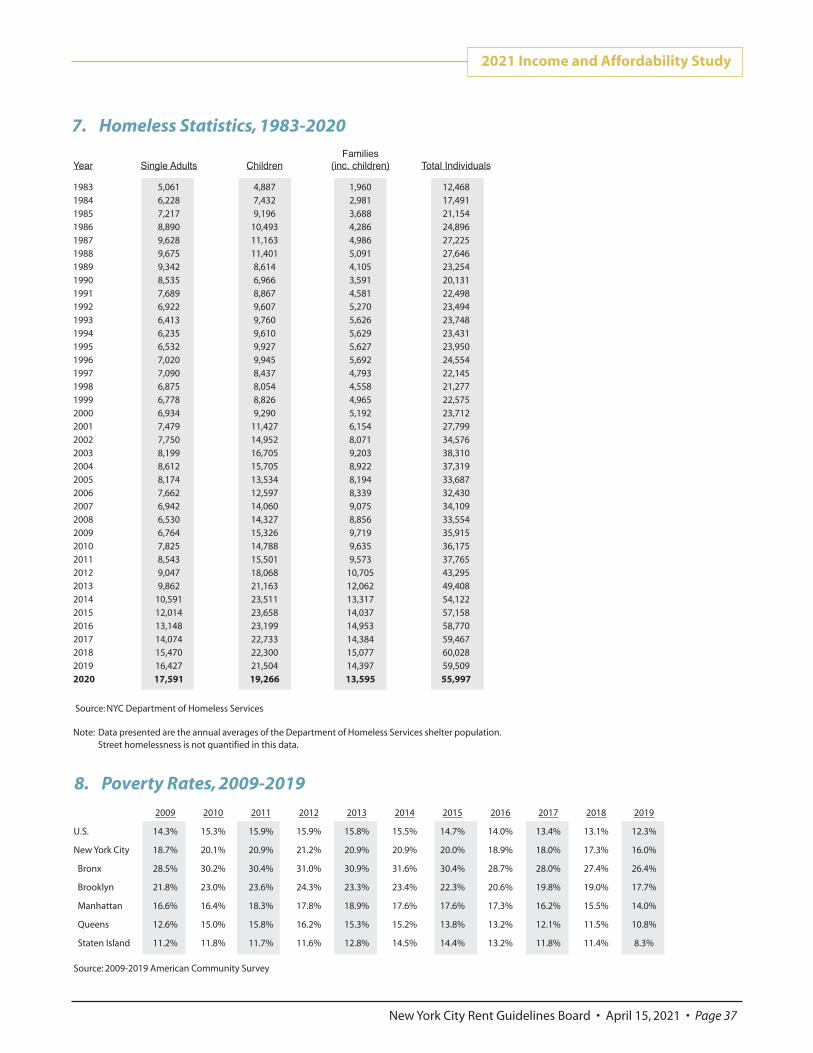
2021 Income and Affordability Study
New York City Rent Guidelines Board • April 15, 2021 • Page 37
7. Homeless Statistics, 1983-2020Families
Year Single Adults Children (inc. children) Total Individuals
1983 5,061 4,887 1,960 12,468 1984 6,228 7,432 2,981 17,491 1985 7,217 9,196 3,688 21,154 1986 8,890 10,493 4,286 24,896 1987 9,628 11,163 4,986 27,225 1988 9,675 11,401 5,091 27,646 1989 9,342 8,614 4,105 23,254 1990 8,535 6,966 3,591 20,131 1991 7,689 8,867 4,581 22,498 1992 6,922 9,607 5,270 23,494 1993 6,413 9,760 5,626 23,748 1994 6,235 9,610 5,629 23,431 1995 6,532 9,927 5,627 23,950 1996 7,020 9,945 5,692 24,554 1997 7,090 8,437 4,793 22,145 1998 6,875 8,054 4,558 21,277 1999 6,778 8,826 4,965 22,575 2000 6,934 9,290 5,192 23,712 2001 7,479 11,427 6,154 27,799 2002 7,750 14,952 8,071 34,576 2003 8,199 16,705 9,203 38,310 2004 8,612 15,705 8,922 37,319 2005 8,174 13,534 8,194 33,687 2006 7,662 12,597 8,339 32,430 2007 6,942 14,060 9,075 34,109 2008 6,530 14,327 8,856 33,554 2009 6,764 15,326 9,719 35,915 2010 7,825 14,788 9,635 36,175 2011 8,543 15,501 9,573 37,765 2012 9,047 18,068 10,705 43,295 2013 9,862 21,163 12,062 49,408 2014 10,591 23,511 13,317 54,122 2015 12,014 23,658 14,037 57,158 2016 13,148 23,199 14,953 58,770 2017 14,074 22,733 14,384 59,467 2018 15,470 22,300 15,077 60,028 2019 16,427 21,504 14,397 59,509 2020 17,591 19,266 13,595 55,997
Source: NYC Department of Homeless Services Note: Data presented are the annual averages of the Department of Homeless Services shelter population. Street homelessness is not quantified in this data.
8. Poverty Rates, 2009-2019
2009 2010 2011 2012 2013 2014 2015 2016 2017 2018 2019
U.S. 14.3% 15.3% 15.9% 15.9% 15.8% 15.5% 14.7% 14.0% 13.4% 13.1% 12.3%
New York City 18.7% 20.1% 20.9% 21.2% 20.9% 20.9% 20.0% 18.9% 18.0% 17.3% 16.0%
Bronx 28.5% 30.2% 30.4% 31.0% 30.9% 31.6% 30.4% 28.7% 28.0% 27.4% 26.4%
Brooklyn 21.8% 23.0% 23.6% 24.3% 23.3% 23.4% 22.3% 20.6% 19.8% 19.0% 17.7%
Manhattan 16.6% 16.4% 18.3% 17.8% 18.9% 17.6% 17.6% 17.3% 16.2% 15.5% 14.0%
Queens 12.6% 15.0% 15.8% 16.2% 15.3% 15.2% 13.8% 13.2% 12.1% 11.5% 10.8%
Staten Island 11.2% 11.8% 11.7% 11.6% 12.8% 14.5% 14.4% 13.2% 11.8% 11.4% 8.3%
Source: 2009-2019 American Community Survey
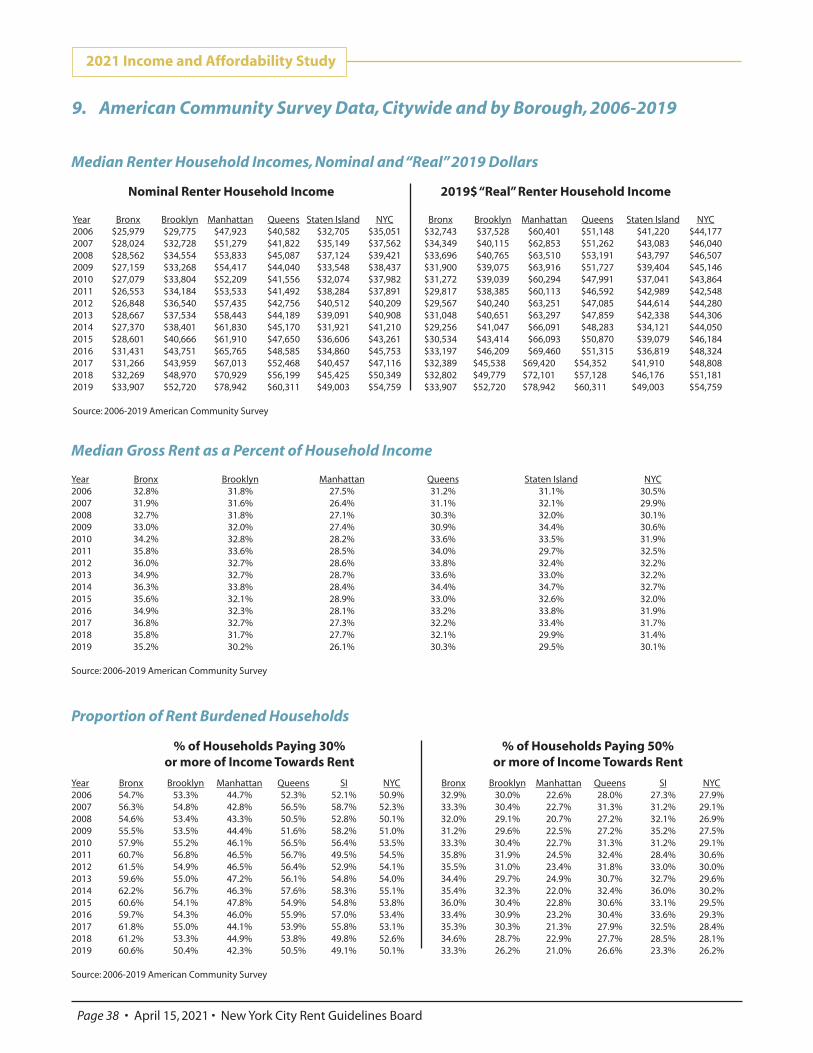
2021 Income and Affordability Study
Page 38 • April 15, 2021 • New York City Rent Guidelines Board
Nominal Renter Household Income 2019$ “Real” Renter Household Income
Year Bronx Brooklyn Manhattan Queens Staten Island NYC Bronx Brooklyn Manhattan Queens Staten Island NYC 2006 $25,979 $29,775 $47,923 $40,582 $32,705 $35,051 $32,743 $37,528 $60,401 $51,148 $41,220 $44,177 2007 $28,024 $32,728 $51,279 $41,822 $35,149 $37,562 $34,349 $40,115 $62,853 $51,262 $43,083 $46,040 2008 $28,562 $34,554 $53,833 $45,087 $37,124 $39,421 $33,696 $40,765 $63,510 $53,191 $43,797 $46,507 2009 $27,159 $33,268 $54,417 $44,040 $33,548 $38,437 $31,900 $39,075 $63,916 $51,727 $39,404 $45,146 2010 $27,079 $33,804 $52,209 $41,556 $32,074 $37,982 $31,272 $39,039 $60,294 $47,991 $37,041 $43,864 2011 $26,553 $34,184 $53,533 $41,492 $38,284 $37,891 $29,817 $38,385 $60,113 $46,592 $42,989 $42,548 2012 $26,848 $36,540 $57,435 $42,756 $40,512 $40,209 $29,567 $40,240 $63,251 $47,085 $44,614 $44,280 2013 $28,667 $37,534 $58,443 $44,189 $39,091 $40,908 $31,048 $40,651 $63,297 $47,859 $42,338 $44,306 2014 $27,370 $38,401 $61,830 $45,170 $31,921 $41,210 $29,256 $41,047 $66,091 $48,283 $34,121 $44,050 2015 $28,601 $40,666 $61,910 $47,650 $36,606 $43,261 $30,534 $43,414 $66,093 $50,870 $39,079 $46,184 2016 $31,431 $43,751 $65,765 $48,585 $34,860 $45,753 $33,197 $46,209 $69,460 $51,315 $36,819 $48,324 2017 $31,266 $43,959 $67,013 $52,468 $40,457 $47,116 $32,389 $45,538 $69,420 $54,352 $41,910 $48,808 2018 $32,269 $48,970 $70,929 $56,199 $45,425 $50,349 $32,802 $49,779 $72,101 $57,128 $46,176 $51,181 2019 $33,907 $52,720 $78,942 $60,311 $49,003 $54,759 $33,907 $52,720 $78,942 $60,311 $49,003 $54,759 Source: 2006-2019 American Community Survey
Median Renter Household Incomes, Nominal and “Real” 2019 Dollars
Year Bronx Brooklyn Manhattan Queens Staten Island NYC 2006 32.8% 31.8% 27.5% 31.2% 31.1% 30.5% 2007 31.9% 31.6% 26.4% 31.1% 32.1% 29.9% 2008 32.7% 31.8% 27.1% 30.3% 32.0% 30.1% 2009 33.0% 32.0% 27.4% 30.9% 34.4% 30.6% 2010 34.2% 32.8% 28.2% 33.6% 33.5% 31.9% 2011 35.8% 33.6% 28.5% 34.0% 29.7% 32.5% 2012 36.0% 32.7% 28.6% 33.8% 32.4% 32.2% 2013 34.9% 32.7% 28.7% 33.6% 33.0% 32.2% 2014 36.3% 33.8% 28.4% 34.4% 34.7% 32.7% 2015 35.6% 32.1% 28.9% 33.0% 32.6% 32.0% 2016 34.9% 32.3% 28.1% 33.2% 33.8% 31.9% 2017 36.8% 32.7% 27.3% 32.2% 33.4% 31.7% 2018 35.8% 31.7% 27.7% 32.1% 29.9% 31.4% 2019 35.2% 30.2% 26.1% 30.3% 29.5% 30.1% Source: 2006-2019 American Community Survey
Median Gross Rent as a Percent of Household Income
% of Households Paying 30% % of Households Paying 50% or more of Income Towards Rent or more of Income Towards Rent
Year Bronx Brooklyn Manhattan Queens SI NYC Bronx Brooklyn Manhattan Queens SI NYC 2006 54.7% 53.3% 44.7% 52.3% 52.1% 50.9% 32.9% 30.0% 22.6% 28.0% 27.3% 27.9% 2007 56.3% 54.8% 42.8% 56.5% 58.7% 52.3% 33.3% 30.4% 22.7% 31.3% 31.2% 29.1% 2008 54.6% 53.4% 43.3% 50.5% 52.8% 50.1% 32.0% 29.1% 20.7% 27.2% 32.1% 26.9% 2009 55.5% 53.5% 44.4% 51.6% 58.2% 51.0% 31.2% 29.6% 22.5% 27.2% 35.2% 27.5% 2010 57.9% 55.2% 46.1% 56.5% 56.4% 53.5% 33.3% 30.4% 22.7% 31.3% 31.2% 29.1% 2011 60.7% 56.8% 46.5% 56.7% 49.5% 54.5% 35.8% 31.9% 24.5% 32.4% 28.4% 30.6% 2012 61.5% 54.9% 46.5% 56.4% 52.9% 54.1% 35.5% 31.0% 23.4% 31.8% 33.0% 30.0% 2013 59.6% 55.0% 47.2% 56.1% 54.8% 54.0% 34.4% 29.7% 24.9% 30.7% 32.7% 29.6% 2014 62.2% 56.7% 46.3% 57.6% 58.3% 55.1% 35.4% 32.3% 22.0% 32.4% 36.0% 30.2% 2015 60.6% 54.1% 47.8% 54.9% 54.8% 53.8% 36.0% 30.4% 22.8% 30.6% 33.1% 29.5% 2016 59.7% 54.3% 46.0% 55.9% 57.0% 53.4% 33.4% 30.9% 23.2% 30.4% 33.6% 29.3% 2017 61.8% 55.0% 44.1% 53.9% 55.8% 53.1% 35.3% 30.3% 21.3% 27.9% 32.5% 28.4% 2018 61.2% 53.3% 44.9% 53.8% 49.8% 52.6% 34.6% 28.7% 22.9% 27.7% 28.5% 28.1% 2019 60.6% 50.4% 42.3% 50.5% 49.1% 50.1% 33.3% 26.2% 21.0% 26.6% 23.3% 26.2% Source: 2006-2019 American Community Survey
Proportion of Rent Burdened Households
9. American Community Survey Data, Citywide and by Borough, 2006-2019
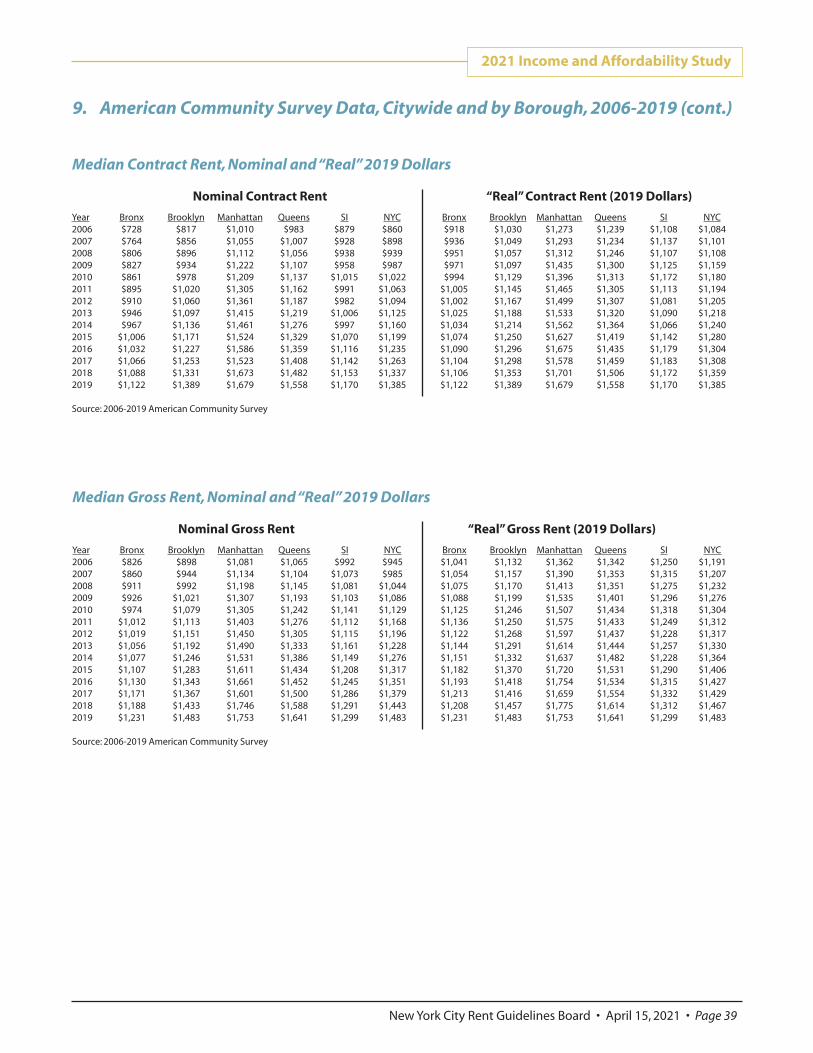
2021 Income and Affordability Study
New York City Rent Guidelines Board • April 15, 2021 • Page 39
Nominal Contract Rent “Real” Contract Rent (2019 Dollars)
Year Bronx Brooklyn Manhattan Queens SI NYC Bronx Brooklyn Manhattan Queens SI NYC 2006 $728 $817 $1,010 $983 $879 $860 $918 $1,030 $1,273 $1,239 $1,108 $1,084 2007 $764 $856 $1,055 $1,007 $928 $898 $936 $1,049 $1,293 $1,234 $1,137 $1,101 2008 $806 $896 $1,112 $1,056 $938 $939 $951 $1,057 $1,312 $1,246 $1,107 $1,108 2009 $827 $934 $1,222 $1,107 $958 $987 $971 $1,097 $1,435 $1,300 $1,125 $1,159 2010 $861 $978 $1,209 $1,137 $1,015 $1,022 $994 $1,129 $1,396 $1,313 $1,172 $1,180 2011 $895 $1,020 $1,305 $1,162 $991 $1,063 $1,005 $1,145 $1,465 $1,305 $1,113 $1,194 2012 $910 $1,060 $1,361 $1,187 $982 $1,094 $1,002 $1,167 $1,499 $1,307 $1,081 $1,205 2013 $946 $1,097 $1,415 $1,219 $1,006 $1,125 $1,025 $1,188 $1,533 $1,320 $1,090 $1,218 2014 $967 $1,136 $1,461 $1,276 $997 $1,160 $1,034 $1,214 $1,562 $1,364 $1,066 $1,240 2015 $1,006 $1,171 $1,524 $1,329 $1,070 $1,199 $1,074 $1,250 $1,627 $1,419 $1,142 $1,280 2016 $1,032 $1,227 $1,586 $1,359 $1,116 $1,235 $1,090 $1,296 $1,675 $1,435 $1,179 $1,304 2017 $1,066 $1,253 $1,523 $1,408 $1,142 $1,263 $1,104 $1,298 $1,578 $1,459 $1,183 $1,308 2018 $1,088 $1,331 $1,673 $1,482 $1,153 $1,337 $1,106 $1,353 $1,701 $1,506 $1,172 $1,359 2019 $1,122 $1,389 $1,679 $1,558 $1,170 $1,385 $1,122 $1,389 $1,679 $1,558 $1,170 $1,385 Source: 2006-2019 American Community Survey
Median Contract Rent, Nominal and “Real” 2019 Dollars
Nominal Gross Rent “Real” Gross Rent (2019 Dollars)
Year Bronx Brooklyn Manhattan Queens SI NYC Bronx Brooklyn Manhattan Queens SI NYC 2006 $826 $898 $1,081 $1,065 $992 $945 $1,041 $1,132 $1,362 $1,342 $1,250 $1,191 2007 $860 $944 $1,134 $1,104 $1,073 $985 $1,054 $1,157 $1,390 $1,353 $1,315 $1,207 2008 $911 $992 $1,198 $1,145 $1,081 $1,044 $1,075 $1,170 $1,413 $1,351 $1,275 $1,232 2009 $926 $1,021 $1,307 $1,193 $1,103 $1,086 $1,088 $1,199 $1,535 $1,401 $1,296 $1,276 2010 $974 $1,079 $1,305 $1,242 $1,141 $1,129 $1,125 $1,246 $1,507 $1,434 $1,318 $1,304 2011 $1,012 $1,113 $1,403 $1,276 $1,112 $1,168 $1,136 $1,250 $1,575 $1,433 $1,249 $1,312 2012 $1,019 $1,151 $1,450 $1,305 $1,115 $1,196 $1,122 $1,268 $1,597 $1,437 $1,228 $1,317 2013 $1,056 $1,192 $1,490 $1,333 $1,161 $1,228 $1,144 $1,291 $1,614 $1,444 $1,257 $1,330 2014 $1,077 $1,246 $1,531 $1,386 $1,149 $1,276 $1,151 $1,332 $1,637 $1,482 $1,228 $1,364 2015 $1,107 $1,283 $1,611 $1,434 $1,208 $1,317 $1,182 $1,370 $1,720 $1,531 $1,290 $1,406 2016 $1,130 $1,343 $1,661 $1,452 $1,245 $1,351 $1,193 $1,418 $1,754 $1,534 $1,315 $1,427 2017 $1,171 $1,367 $1,601 $1,500 $1,286 $1,379 $1,213 $1,416 $1,659 $1,554 $1,332 $1,429 2018 $1,188 $1,433 $1,746 $1,588 $1,291 $1,443 $1,208 $1,457 $1,775 $1,614 $1,312 $1,467 2019 $1,231 $1,483 $1,753 $1,641 $1,299 $1,483 $1,231 $1,483 $1,753 $1,641 $1,299 $1,483 Source: 2006-2019 American Community Survey
Median Gross Rent, Nominal and “Real” 2019 Dollars
9. American Community Survey Data, Citywide and by Borough, 2006-2019 (cont.)
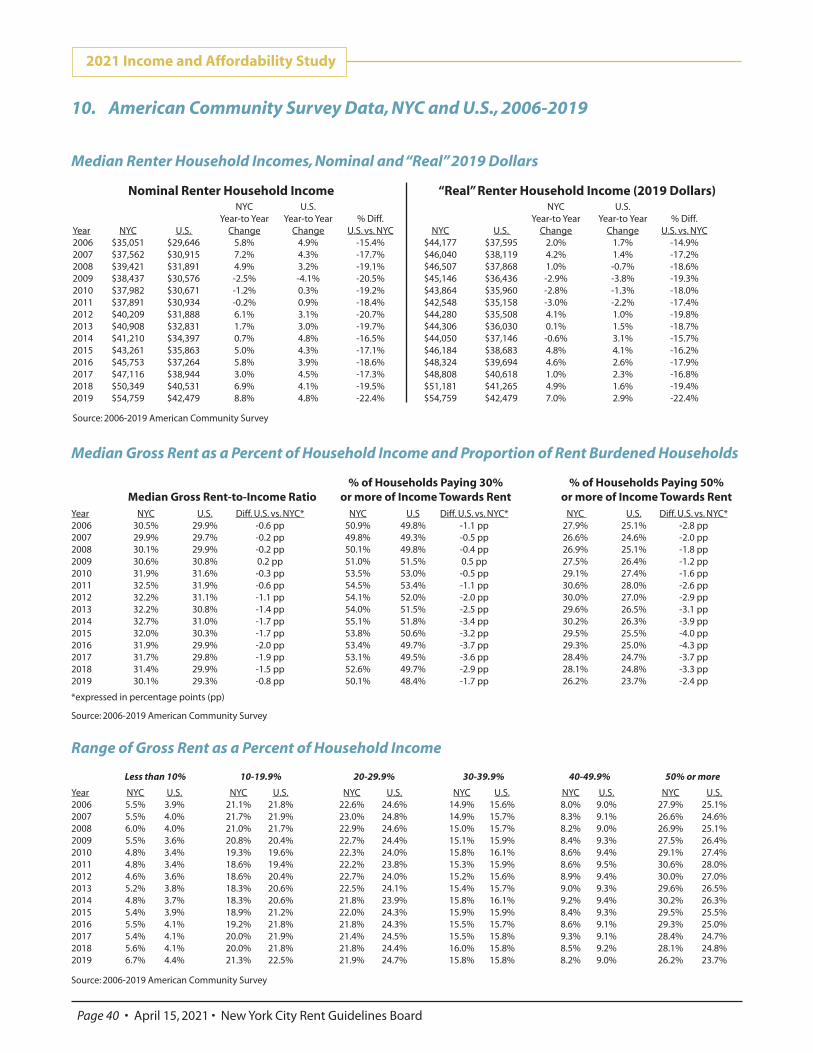
Nominal Renter Household Income “Real” Renter Household Income (2019 Dollars)
NYC U.S. NYC U.S. Year-to Year Year-to Year % Diff. Year-to Year Year-to Year % Diff.
Year NYC U.S. Change Change U.S. vs. NYC NYC U.S. Change Change U.S. vs. NYC 2006 $35,051 $29,646 5.8% 4.9% -15.4% $44,177 $37,595 2.0% 1.7% -14.9% 2007 $37,562 $30,915 7.2% 4.3% -17.7% $46,040 $38,119 4.2% 1.4% -17.2% 2008 $39,421 $31,891 4.9% 3.2% -19.1% $46,507 $37,868 1.0% -0.7% -18.6% 2009 $38,437 $30,576 -2.5% -4.1% -20.5% $45,146 $36,436 -2.9% -3.8% -19.3% 2010 $37,982 $30,671 -1.2% 0.3% -19.2% $43,864 $35,960 -2.8% -1.3% -18.0% 2011 $37,891 $30,934 -0.2% 0.9% -18.4% $42,548 $35,158 -3.0% -2.2% -17.4% 2012 $40,209 $31,888 6.1% 3.1% -20.7% $44,280 $35,508 4.1% 1.0% -19.8% 2013 $40,908 $32,831 1.7% 3.0% -19.7% $44,306 $36,030 0.1% 1.5% -18.7% 2014 $41,210 $34,397 0.7% 4.8% -16.5% $44,050 $37,146 -0.6% 3.1% -15.7% 2015 $43,261 $35,863 5.0% 4.3% -17.1% $46,184 $38,683 4.8% 4.1% -16.2% 2016 $45,753 $37,264 5.8% 3.9% -18.6% $48,324 $39,694 4.6% 2.6% -17.9% 2017 $47,116 $38,944 3.0% 4.5% -17.3% $48,808 $40,618 1.0% 2.3% -16.8% 2018 $50,349 $40,531 6.9% 4.1% -19.5% $51,181 $41,265 4.9% 1.6% -19.4% 2019 $54,759 $42,479 8.8% 4.8% -22.4% $54,759 $42,479 7.0% 2.9% -22.4%
Source: 2006-2019 American Community Survey
2021 Income and Affordability Study
Page 40 • April 15, 2021 • New York City Rent Guidelines Board
10. American Community Survey Data, NYC and U.S., 2006-2019
Median Renter Household Incomes, Nominal and “Real” 2019 Dollars
Less than 10% 10-19.9% 20-29.9% 30-39.9% 40-49.9% 50% or more
Year NYC U.S. NYC U.S. NYC U.S. NYC U.S. NYC U.S. NYC U.S. 2006 5.5% 3.9% 21.1% 21.8% 22.6% 24.6% 14.9% 15.6% 8.0% 9.0% 27.9% 25.1% 2007 5.5% 4.0% 21.7% 21.9% 23.0% 24.8% 14.9% 15.7% 8.3% 9.1% 26.6% 24.6% 2008 6.0% 4.0% 21.0% 21.7% 22.9% 24.6% 15.0% 15.7% 8.2% 9.0% 26.9% 25.1% 2009 5.5% 3.6% 20.8% 20.4% 22.7% 24.4% 15.1% 15.9% 8.4% 9.3% 27.5% 26.4% 2010 4.8% 3.4% 19.3% 19.6% 22.3% 24.0% 15.8% 16.1% 8.6% 9.4% 29.1% 27.4% 2011 4.8% 3.4% 18.6% 19.4% 22.2% 23.8% 15.3% 15.9% 8.6% 9.5% 30.6% 28.0% 2012 4.6% 3.6% 18.6% 20.4% 22.7% 24.0% 15.2% 15.6% 8.9% 9.4% 30.0% 27.0% 2013 5.2% 3.8% 18.3% 20.6% 22.5% 24.1% 15.4% 15.7% 9.0% 9.3% 29.6% 26.5% 2014 4.8% 3.7% 18.3% 20.6% 21.8% 23.9% 15.8% 16.1% 9.2% 9.4% 30.2% 26.3% 2015 5.4% 3.9% 18.9% 21.2% 22.0% 24.3% 15.9% 15.9% 8.4% 9.3% 29.5% 25.5% 2016 5.5% 4.1% 19.2% 21.8% 21.8% 24.3% 15.5% 15.7% 8.6% 9.1% 29.3% 25.0% 2017 5.4% 4.1% 20.0% 21.9% 21.4% 24.5% 15.5% 15.8% 9.3% 9.1% 28.4% 24.7% 2018 5.6% 4.1% 20.0% 21.8% 21.8% 24.4% 16.0% 15.8% 8.5% 9.2% 28.1% 24.8% 2019 6.7% 4.4% 21.3% 22.5% 21.9% 24.7% 15.8% 15.8% 8.2% 9.0% 26.2% 23.7%
Source: 2006-2019 American Community Survey
Range of Gross Rent as a Percent of Household Income
% of Households Paying 30% % of Households Paying 50% Median Gross Rent-to-Income Ratio or more of Income Towards Rent or more of Income Towards Rent
Year NYC U.S. Diff. U.S. vs. NYC* NYC U.S Diff. U.S. vs. NYC* NYC U.S. Diff. U.S. vs. NYC* 2006 30.5% 29.9% -0.6 pp 50.9% 49.8% -1.1 pp 27.9% 25.1% -2.8 pp 2007 29.9% 29.7% -0.2 pp 49.8% 49.3% -0.5 pp 26.6% 24.6% -2.0 pp 2008 30.1% 29.9% -0.2 pp 50.1% 49.8% -0.4 pp 26.9% 25.1% -1.8 pp 2009 30.6% 30.8% 0.2 pp 51.0% 51.5% 0.5 pp 27.5% 26.4% -1.2 pp 2010 31.9% 31.6% -0.3 pp 53.5% 53.0% -0.5 pp 29.1% 27.4% -1.6 pp 2011 32.5% 31.9% -0.6 pp 54.5% 53.4% -1.1 pp 30.6% 28.0% -2.6 pp 2012 32.2% 31.1% -1.1 pp 54.1% 52.0% -2.0 pp 30.0% 27.0% -2.9 pp 2013 32.2% 30.8% -1.4 pp 54.0% 51.5% -2.5 pp 29.6% 26.5% -3.1 pp 2014 32.7% 31.0% -1.7 pp 55.1% 51.8% -3.4 pp 30.2% 26.3% -3.9 pp 2015 32.0% 30.3% -1.7 pp 53.8% 50.6% -3.2 pp 29.5% 25.5% -4.0 pp 2016 31.9% 29.9% -2.0 pp 53.4% 49.7% -3.7 pp 29.3% 25.0% -4.3 pp 2017 31.7% 29.8% -1.9 pp 53.1% 49.5% -3.6 pp 28.4% 24.7% -3.7 pp 2018 31.4% 29.9% -1.5 pp 52.6% 49.7% -2.9 pp 28.1% 24.8% -3.3 pp 2019 30.1% 29.3% -0.8 pp 50.1% 48.4% -1.7 pp 26.2% 23.7% -2.4 pp
*expressed in percentage points (pp)
Source: 2006-2019 American Community Survey
Median Gross Rent as a Percent of Household Income and Proportion of Rent Burdened Households
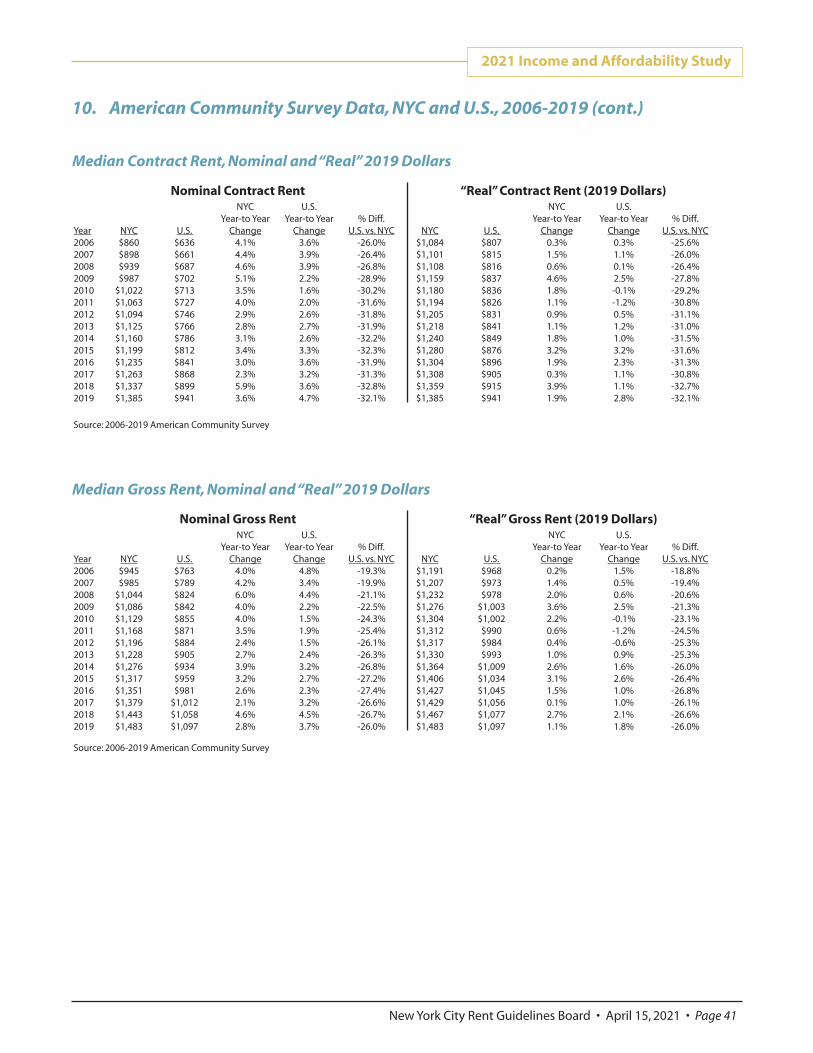
2021 Income and Affordability Study
New York City Rent Guidelines Board • April 15, 2021 • Page 41
10. American Community Survey Data, NYC and U.S., 2006-2019 (cont.)
Nominal Contract Rent “Real” Contract Rent (2019 Dollars)
NYC U.S. NYC U.S. Year-to Year Year-to Year % Diff. Year-to Year Year-to Year % Diff.
Year NYC U.S. Change Change U.S. vs. NYC NYC U.S. Change Change U.S. vs. NYC 2006 $860 $636 4.1% 3.6% -26.0% $1,084 $807 0.3% 0.3% -25.6% 2007 $898 $661 4.4% 3.9% -26.4% $1,101 $815 1.5% 1.1% -26.0% 2008 $939 $687 4.6% 3.9% -26.8% $1,108 $816 0.6% 0.1% -26.4% 2009 $987 $702 5.1% 2.2% -28.9% $1,159 $837 4.6% 2.5% -27.8% 2010 $1,022 $713 3.5% 1.6% -30.2% $1,180 $836 1.8% -0.1% -29.2% 2011 $1,063 $727 4.0% 2.0% -31.6% $1,194 $826 1.1% -1.2% -30.8% 2012 $1,094 $746 2.9% 2.6% -31.8% $1,205 $831 0.9% 0.5% -31.1% 2013 $1,125 $766 2.8% 2.7% -31.9% $1,218 $841 1.1% 1.2% -31.0% 2014 $1,160 $786 3.1% 2.6% -32.2% $1,240 $849 1.8% 1.0% -31.5% 2015 $1,199 $812 3.4% 3.3% -32.3% $1,280 $876 3.2% 3.2% -31.6% 2016 $1,235 $841 3.0% 3.6% -31.9% $1,304 $896 1.9% 2.3% -31.3% 2017 $1,263 $868 2.3% 3.2% -31.3% $1,308 $905 0.3% 1.1% -30.8% 2018 $1,337 $899 5.9% 3.6% -32.8% $1,359 $915 3.9% 1.1% -32.7% 2019 $1,385 $941 3.6% 4.7% -32.1% $1,385 $941 1.9% 2.8% -32.1% Source: 2006-2019 American Community Survey
Median Contract Rent, Nominal and “Real” 2019 Dollars
Nominal Gross Rent “Real” Gross Rent (2019 Dollars)
NYC U.S. NYC U.S. Year-to Year Year-to Year % Diff. Year-to Year Year-to Year % Diff.
Year NYC U.S. Change Change U.S. vs. NYC NYC U.S. Change Change U.S. vs. NYC 2006 $945 $763 4.0% 4.8% -19.3% $1,191 $968 0.2% 1.5% -18.8% 2007 $985 $789 4.2% 3.4% -19.9% $1,207 $973 1.4% 0.5% -19.4% 2008 $1,044 $824 6.0% 4.4% -21.1% $1,232 $978 2.0% 0.6% -20.6% 2009 $1,086 $842 4.0% 2.2% -22.5% $1,276 $1,003 3.6% 2.5% -21.3% 2010 $1,129 $855 4.0% 1.5% -24.3% $1,304 $1,002 2.2% -0.1% -23.1% 2011 $1,168 $871 3.5% 1.9% -25.4% $1,312 $990 0.6% -1.2% -24.5% 2012 $1,196 $884 2.4% 1.5% -26.1% $1,317 $984 0.4% -0.6% -25.3% 2013 $1,228 $905 2.7% 2.4% -26.3% $1,330 $993 1.0% 0.9% -25.3% 2014 $1,276 $934 3.9% 3.2% -26.8% $1,364 $1,009 2.6% 1.6% -26.0% 2015 $1,317 $959 3.2% 2.7% -27.2% $1,406 $1,034 3.1% 2.6% -26.4% 2016 $1,351 $981 2.6% 2.3% -27.4% $1,427 $1,045 1.5% 1.0% -26.8% 2017 $1,379 $1,012 2.1% 3.2% -26.6% $1,429 $1,056 0.1% 1.0% -26.1% 2018 $1,443 $1,058 4.6% 4.5% -26.7% $1,467 $1,077 2.7% 2.1% -26.6% 2019 $1,483 $1,097 2.8% 3.7% -26.0% $1,483 $1,097 1.1% 1.8% -26.0%
Source: 2006-2019 American Community Survey
Median Gross Rent, Nominal and “Real” 2019 Dollars
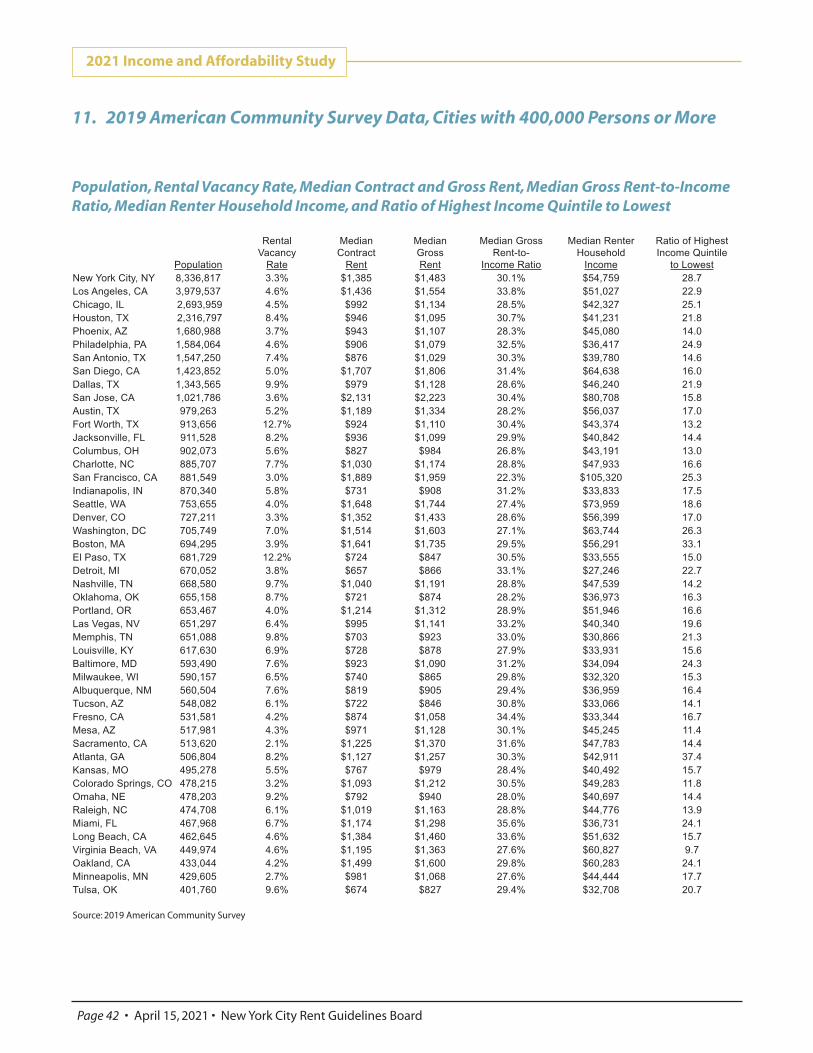
Rental Median Median Median Gross Median Renter Ratio of Highest Vacancy Contract Gross Rent-to- Household Income Quintile
Population Rate Rent Rent Income Ratio Income to Lowest
New York City, NY 8,336,817 3.3% $1,385 $1,483 30.1% $54,759 28.7
Los Angeles, CA 3,979,537 4.6% $1,436 $1,554 33.8% $51,027 22.9
Chicago, IL 2,693,959 4.5% $992 $1,134 28.5% $42,327 25.1
Houston, TX 2,316,797 8.4% $946 $1,095 30.7% $41,231 21.8
Phoenix, AZ 1,680,988 3.7% $943 $1,107 28.3% $45,080 14.0
Philadelphia, PA 1,584,064 4.6% $906 $1,079 32.5% $36,417 24.9
San Antonio, TX 1,547,250 7.4% $876 $1,029 30.3% $39,780 14.6
San Diego, CA 1,423,852 5.0% $1,707 $1,806 31.4% $64,638 16.0
Dallas, TX 1,343,565 9.9% $979 $1,128 28.6% $46,240 21.9
San Jose, CA 1,021,786 3.6% $2,131 $2,223 30.4% $80,708 15.8
Austin, TX 979,263 5.2% $1,189 $1,334 28.2% $56,037 17.0
Fort Worth, TX 913,656 12.7% $924 $1,110 30.4% $43,374 13.2
Jacksonville, FL 911,528 8.2% $936 $1,099 29.9% $40,842 14.4
Columbus, OH 902,073 5.6% $827 $984 26.8% $43,191 13.0
Charlotte, NC 885,707 7.7% $1,030 $1,174 28.8% $47,933 16.6
San Francisco, CA 881,549 3.0% $1,889 $1,959 22.3% $105,320 25.3
Indianapolis, IN 870,340 5.8% $731 $908 31.2% $33,833 17.5
Seattle, WA 753,655 4.0% $1,648 $1,744 27.4% $73,959 18.6
Denver, CO 727,211 3.3% $1,352 $1,433 28.6% $56,399 17.0
Washington, DC 705,749 7.0% $1,514 $1,603 27.1% $63,744 26.3
Boston, MA 694,295 3.9% $1,641 $1,735 29.5% $56,291 33.1
El Paso, TX 681,729 12.2% $724 $847 30.5% $33,555 15.0
Detroit, MI 670,052 3.8% $657 $866 33.1% $27,246 22.7
Nashville, TN 668,580 9.7% $1,040 $1,191 28.8% $47,539 14.2
Oklahoma, OK 655,158 8.7% $721 $874 28.2% $36,973 16.3
Portland, OR 653,467 4.0% $1,214 $1,312 28.9% $51,946 16.6
Las Vegas, NV 651,297 6.4% $995 $1,141 33.2% $40,340 19.6
Memphis, TN 651,088 9.8% $703 $923 33.0% $30,866 21.3
Louisville, KY 617,630 6.9% $728 $878 27.9% $33,931 15.6
Baltimore, MD 593,490 7.6% $923 $1,090 31.2% $34,094 24.3
Milwaukee, WI 590,157 6.5% $740 $865 29.8% $32,320 15.3
Albuquerque, NM 560,504 7.6% $819 $905 29.4% $36,959 16.4
Tucson, AZ 548,082 6.1% $722 $846 30.8% $33,066 14.1
Fresno, CA 531,581 4.2% $874 $1,058 34.4% $33,344 16.7
Mesa, AZ 517,981 4.3% $971 $1,128 30.1% $45,245 11.4
Sacramento, CA 513,620 2.1% $1,225 $1,370 31.6% $47,783 14.4
Atlanta, GA 506,804 8.2% $1,127 $1,257 30.3% $42,911 37.4
Kansas, MO 495,278 5.5% $767 $979 28.4% $40,492 15.7
Colorado Springs, CO 478,215 3.2% $1,093 $1,212 30.5% $49,283 11.8
Omaha, NE 478,203 9.2% $792 $940 28.0% $40,697 14.4
Raleigh, NC 474,708 6.1% $1,019 $1,163 28.8% $44,776 13.9
Miami, FL 467,968 6.7% $1,174 $1,298 35.6% $36,731 24.1
Long Beach, CA 462,645 4.6% $1,384 $1,460 33.6% $51,632 15.7
Virginia Beach, VA 449,974 4.6% $1,195 $1,363 27.6% $60,827 9.7
Oakland, CA 433,044 4.2% $1,499 $1,600 29.8% $60,283 24.1
Minneapolis, MN 429,605 2.7% $981 $1,068 27.6% $44,444 17.7
Tulsa, OK 401,760 9.6% $674 $827 29.4% $32,708 20.7
Source: 2019 American Community Survey
2021 Income and Affordability Study
Page 42 • April 15, 2021 • New York City Rent Guidelines Board
11. 2019 American Community Survey Data, Cities with 400,000 Persons or More
Population, Rental Vacancy Rate, Median Contract and Gross Rent, Median Gross Rent-to-Income Ratio, Median Renter Household Income, and Ratio of Highest Income Quintile to Lowest
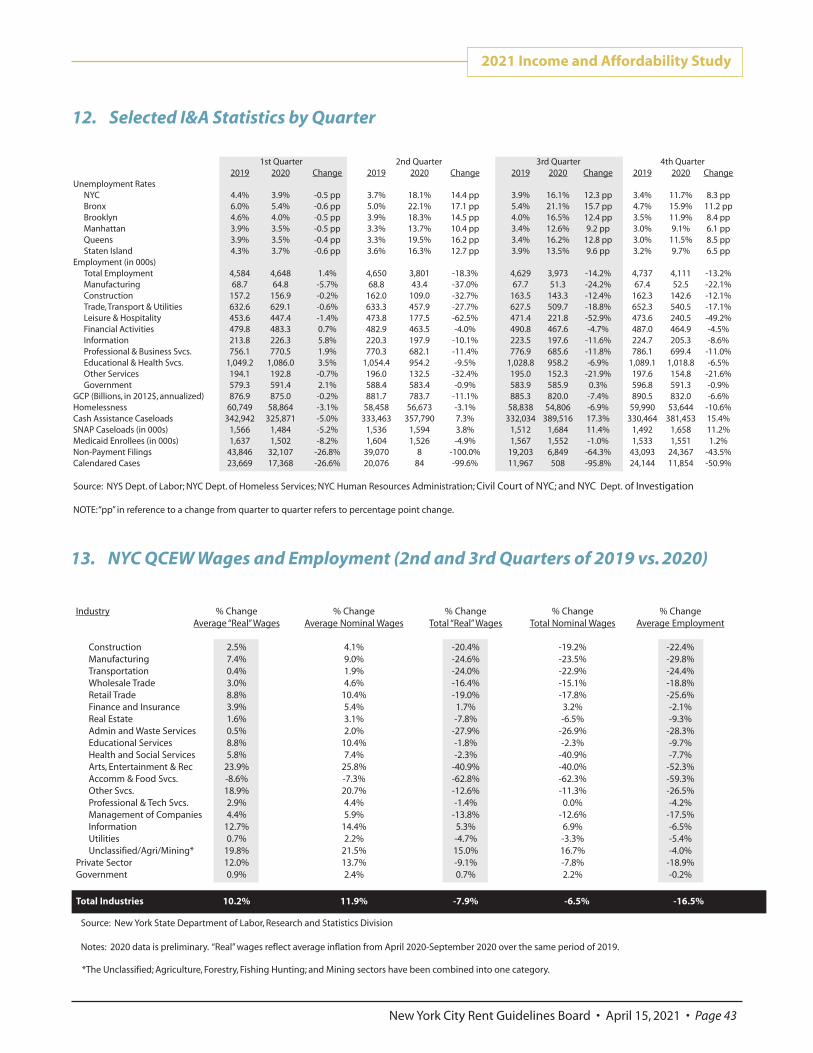
2021 Income and Affordability Study
New York City Rent Guidelines Board • April 15, 2021 • Page 43
1st Quarter 2nd Quarter 3rd Quarter 4th Quarter 2019 2020 Change 2019 2020 Change 2019 2020 Change 2019 2020 Change
Unemployment Rates NYC 4.4% 3.9% -0.5 pp 3.7% 18.1% 14.4 pp 3.9% 16.1% 12.3 pp 3.4% 11.7% 8.3 pp Bronx 6.0% 5.4% -0.6 pp 5.0% 22.1% 17.1 pp 5.4% 21.1% 15.7 pp 4.7% 15.9% 11.2 pp Brooklyn 4.6% 4.0% -0.5 pp 3.9% 18.3% 14.5 pp 4.0% 16.5% 12.4 pp 3.5% 11.9% 8.4 pp Manhattan 3.9% 3.5% -0.5 pp 3.3% 13.7% 10.4 pp 3.4% 12.6% 9.2 pp 3.0% 9.1% 6.1 pp Queens 3.9% 3.5% -0.4 pp 3.3% 19.5% 16.2 pp 3.4% 16.2% 12.8 pp 3.0% 11.5% 8.5 pp Staten Island 4.3% 3.7% -0.6 pp 3.6% 16.3% 12.7 pp 3.9% 13.5% 9.6 pp 3.2% 9.7% 6.5 pp
Employment (in 000s) Total Employment 4,584 4,648 1.4% 4,650 3,801 -18.3% 4,629 3,973 -14.2% 4,737 4,111 -13.2% Manufacturing 68.7 64.8 -5.7% 68.8 43.4 -37.0% 67.7 51.3 -24.2% 67.4 52.5 -22.1% Construction 157.2 156.9 -0.2% 162.0 109.0 -32.7% 163.5 143.3 -12.4% 162.3 142.6 -12.1% Trade, Transport & Utilities 632.6 629.1 -0.6% 633.3 457.9 -27.7% 627.5 509.7 -18.8% 652.3 540.5 -17.1% Leisure & Hospitality 453.6 447.4 -1.4% 473.8 177.5 -62.5% 471.4 221.8 -52.9% 473.6 240.5 -49.2% Financial Activities 479.8 483.3 0.7% 482.9 463.5 -4.0% 490.8 467.6 -4.7% 487.0 464.9 -4.5%Information 213.8 226.3 5.8% 220.3 197.9 -10.1% 223.5 197.6 -11.6% 224.7 205.3 -8.6% Professional & Business Svcs. 756.1 770.5 1.9% 770.3 682.1 -11.4% 776.9 685.6 -11.8% 786.1 699.4 -11.0% Educational & Health Svcs. 1,049.2 1,086.0 3.5% 1,054.4 954.2 -9.5% 1,028.8 958.2 -6.9% 1,089.1 1,018.8 -6.5% Other Services 194.1 192.8 -0.7% 196.0 132.5 -32.4% 195.0 152.3 -21.9% 197.6 154.8 -21.6% Government 579.3 591.4 2.1% 588.4 583.4 -0.9% 583.9 585.9 0.3% 596.8 591.3 -0.9%
GCP (Billions, in 2012$, annualized) 876.9 875.0 -0.2% 881.7 783.7 -11.1% 885.3 820.0 -7.4% 890.5 832.0 -6.6% Homelessness 60,749 58,864 -3.1% 58,458 56,673 -3.1% 58,838 54,806 -6.9% 59,990 53,644 -10.6% Cash Assistance Caseloads 342,942 325,871 -5.0% 333,463 357,790 7.3% 332,034 389,516 17.3% 330,464 381,453 15.4% SNAP Caseloads (in 000s) 1,566 1,484 -5.2% 1,536 1,594 3.8% 1,512 1,684 11.4% 1,492 1,658 11.2% Medicaid Enrollees (in 000s) 1,637 1,502 -8.2% 1,604 1,526 -4.9% 1,567 1,552 -1.0% 1,533 1,551 1.2% Non-Payment Filings 43,846 32,107 -26.8% 39,070 8 -100.0% 19,203 6,849 -64.3% 43,093 24,367 -43.5% Calendared Cases 23,669 17,368 -26.6% 20,076 84 -99.6% 11,967 508 -95.8% 24,144 11,854 -50.9%
Source: NYS Dept. of Labor; NYC Dept. of Homeless Services; NYC Human Resources Administration; Civil Court of NYC; and NYC Dept. of Investigation NOTE: “pp” in reference to a change from quarter to quarter refers to percentage point change.
12. Selected I&A Statistics by Quarter
13. NYC QCEW Wages and Employment (2nd and 3rd Quarters of 2019 vs. 2020)
Source: New York State Department of Labor, Research and Statistics Division Notes: 2020 data is preliminary. “Real” wages reflect average inflation from April 2020-September 2020 over the same period of 2019. *The Unclassified; Agriculture, Forestry, Fishing Hunting; and Mining sectors have been combined into one category.
Industry % Change % Change % Change % Change % Change Average “Real” Wages Average Nominal Wages Total “Real” Wages Total Nominal Wages Average Employment
Construction 2.5% 4.1% -20.4% -19.2% -22.4% Manufacturing 7.4% 9.0% -24.6% -23.5% -29.8% Transportation 0.4% 1.9% -24.0% -22.9% -24.4% Wholesale Trade 3.0% 4.6% -16.4% -15.1% -18.8% Retail Trade 8.8% 10.4% -19.0% -17.8% -25.6% Finance and Insurance 3.9% 5.4% 1.7% 3.2% -2.1% Real Estate 1.6% 3.1% -7.8% -6.5% -9.3% Admin and Waste Services 0.5% 2.0% -27.9% -26.9% -28.3% Educational Services 8.8% 10.4% -1.8% -2.3% -9.7% Health and Social Services 5.8% 7.4% -2.3% -40.9% -7.7% Arts, Entertainment & Rec 23.9% 25.8% -40.9% -40.0% -52.3% Accomm & Food Svcs. -8.6% -7.3% -62.8% -62.3% -59.3% Other Svcs. 18.9% 20.7% -12.6% -11.3% -26.5% Professional & Tech Svcs. 2.9% 4.4% -1.4% 0.0% -4.2% Management of Companies 4.4% 5.9% -13.8% -12.6% -17.5% Information 12.7% 14.4% 5.3% 6.9% -6.5% Utilities 0.7% 2.2% -4.7% -3.3% -5.4% Unclassified/Agri/Mining* 19.8% 21.5% 15.0% 16.7% -4.0%
Private Sector 12.0% 13.7% -9.1% -7.8% -18.9% Government 0.9% 2.4% 0.7% 2.2% -0.2%
Total Industries 10.2% 11.9% -7.9% -6.5% -16.5%