Embed Size (px)
Citation preview
Pesticide AnalysisPesticide Analysis Workflow Using
Hyphenated Mass Spectrometry
Techniques Chinkai (Kai) Meng, Ph.D.Senior Applications ChemistWilmington, Delaware USA
chin meng@agilent [email protected]
February 12, 2009
E-seminar, Feb 2009
Page 1
MS Techniques Outline
• MS Analyzers Selection
GC/MS deconvolution and backflush• GC/MS – deconvolution and backflush
• QQQ (MS/MS)
• LC/Q-TOF
• Summary
E-seminar, Feb 2009
Page 2

Analytical Instrumentations
Chromatography (Separation – the best friend of any detector)• GC – volatile and semi-volatile non-polar compounds• LC – polar or moderately polar or thermally labile compounds
Detectors• GC (element selective, FPD, NPD, ECD) – high sensitivity, poor specificity • LC (UV, FLD) – general purpose, limited sensitivity• MS –MS
– SQ: high confidence from spectral confirmation, limited MDL– QQQ: low detection limits of target compounds in dirty matrices (MRM)– TOF/Q-TOF: always full spectrum and accurate mass for screening– TOF-TOF, Q-Trap, …and others (generally not for ROUTINE use).
E-seminar, Feb 2009
Page 3

Guiding Principles in MS Analyzer Selection
The correct choice of analyzer depends on whether one is “LOOKING for UNKNOWNS” or whether one is “CONFIRMING & MEASURING KNOWNS”.
The correct choice of analyzer depends on theThe correct choice of analyzer depends on the COMPLEXITY of the MATRIX.
E-seminar, Feb 2009
Page 4
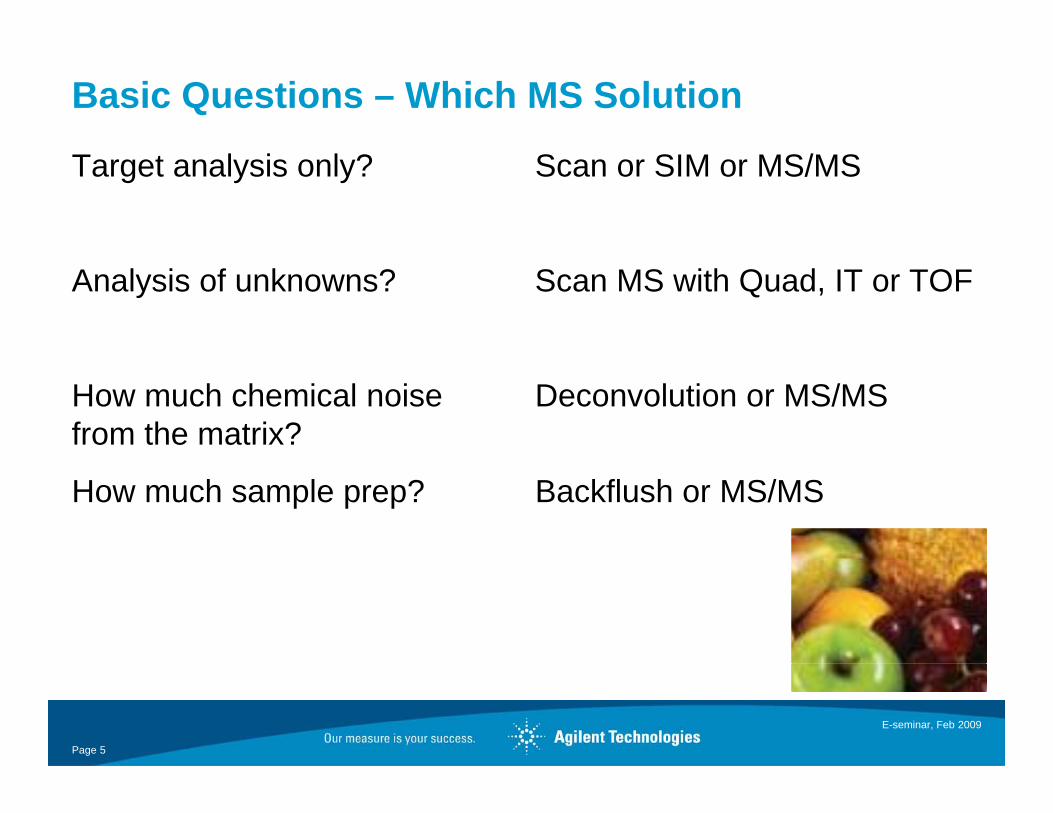
Basic Questions – Which MS Solution
Target analysis only? Scan or SIM or MS/MS
Analysis of unknowns? Scan MS with Quad, IT or TOF
How much chemical noise from the matrix?
Deconvolution or MS/MS
How much sample prep? Backflush or MS/MS
E-seminar, Feb 2009
Page 5

Representative
General Workflow: Screen , Confirm and Quantify S C Q
GC/MS (PTV) SIM/ScanRepresentative Sample
GC/MS (PTV) SIM/Scan– for known and unknown Final Report
S
C
Deconvolution
QuEChERS LC/QQQ MRM – for known targets SGC/QQQ MRM – for known targets S1
Q(+backflush)
Extraction C
Q
C
Q
3 1
Cl
LC/QTOF or TOF Full Spectrum– for unknown compounds
Exact Mass Database Search
A th
3 1
Clean-up
C16 H19 N3 P ClC15 H25 O P S Cl
SMolecular Formula Generation
Q CAnother injection for MS/MS (QQQ or QTOF)3
1
E-seminar, Feb 2009
Page 6
C15 H25 O P S ClC18 H21 O P Cl
MS Techniques Outline
• MS Analyzers Selection
GC/MS deconvolution and backflush• GC/MS – deconvolution and backflush
• QQQ (MS/MS)
• LC/Q-TOF
• Summary
E-seminar, Feb 2009
Page 7
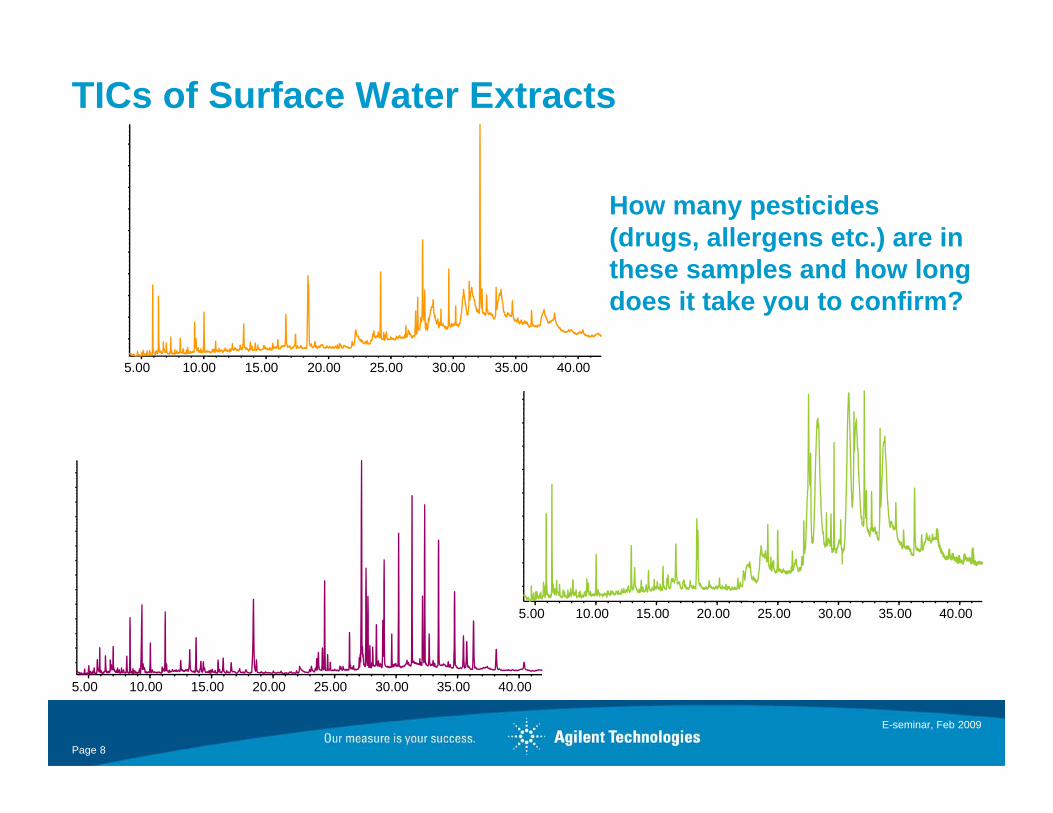
TICs of Surface Water Extracts
How many pesticides (drugs, allergens etc.) are in these samples and how long does it take you to confirm?
5.00 10.00 15.00 20.00 25.00 30.00 35.00 40.00
5.00 10.00 15.00 20.00 25.00 30.00 35.00 40.00
E-seminar, Feb 2009
Page 8
5.00 10.00 15.00 20.00 25.00 30.00 35.00 40.00
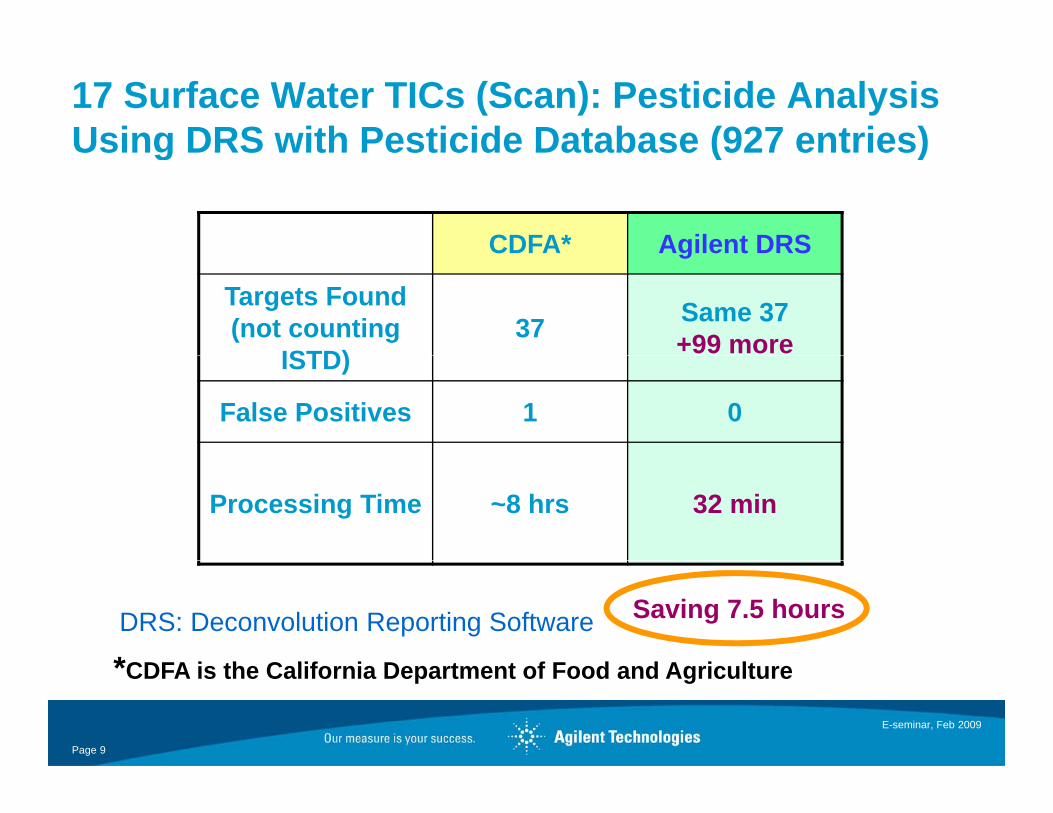
17 Surface Water TICs (Scan): Pesticide Analysis Using DRS with Pesticide Database (927 entries)Using DRS with Pesticide Database (927 entries)
CDFA* Agilent DRSCDFA Agilent DRS
Targets Found (not counting
ISTD)37 Same 37
+99 moreISTD)
False Positives 1 0
Processing Time ~8 hrs 32 min
*CDFA i th C lif i D t t f F d d A i lt
Saving 7.5 hoursDRS: Deconvolution Reporting Software
E-seminar, Feb 2009
Page 9
*CDFA is the California Department of Food and Agriculture
17 280
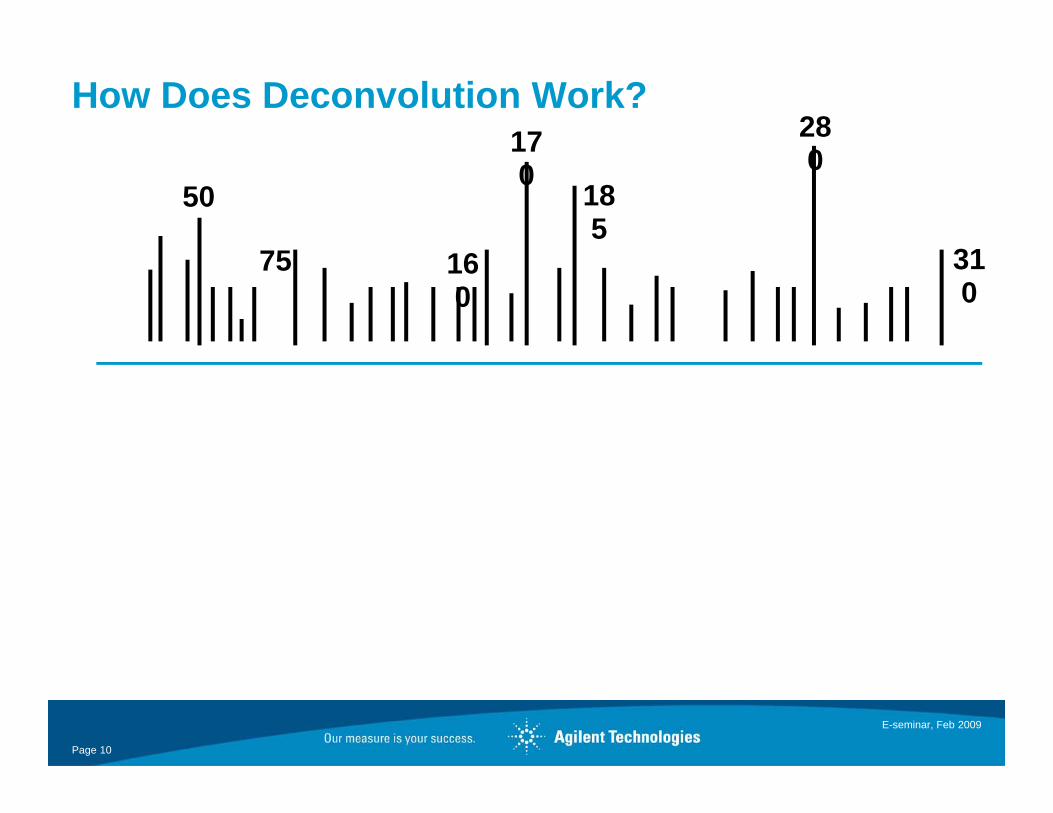
How Does Deconvolution Work?
50
170 0
3175
185
16 310
75 160
E-seminar, Feb 2009
Page 10
17 280
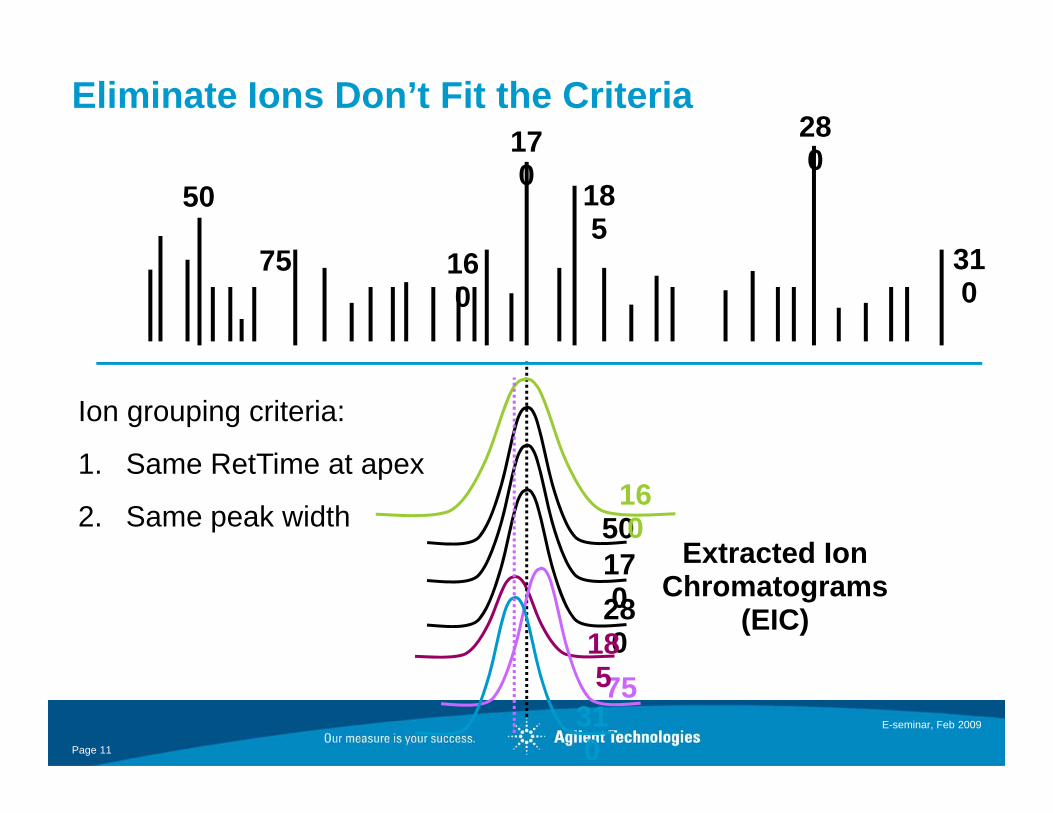
Eliminate Ions Don’t Fit the Criteria
50
170 0
3175
185
16 310
75 160
Ion grouping criteria:
1 S R tTi t
5017
160
Extracted Ion
1. Same RetTime at apex
2. Same peak width17028018
Extracted Ion Chromatograms
(EIC)
E-seminar, Feb 2009
Page 11
755310
17 280
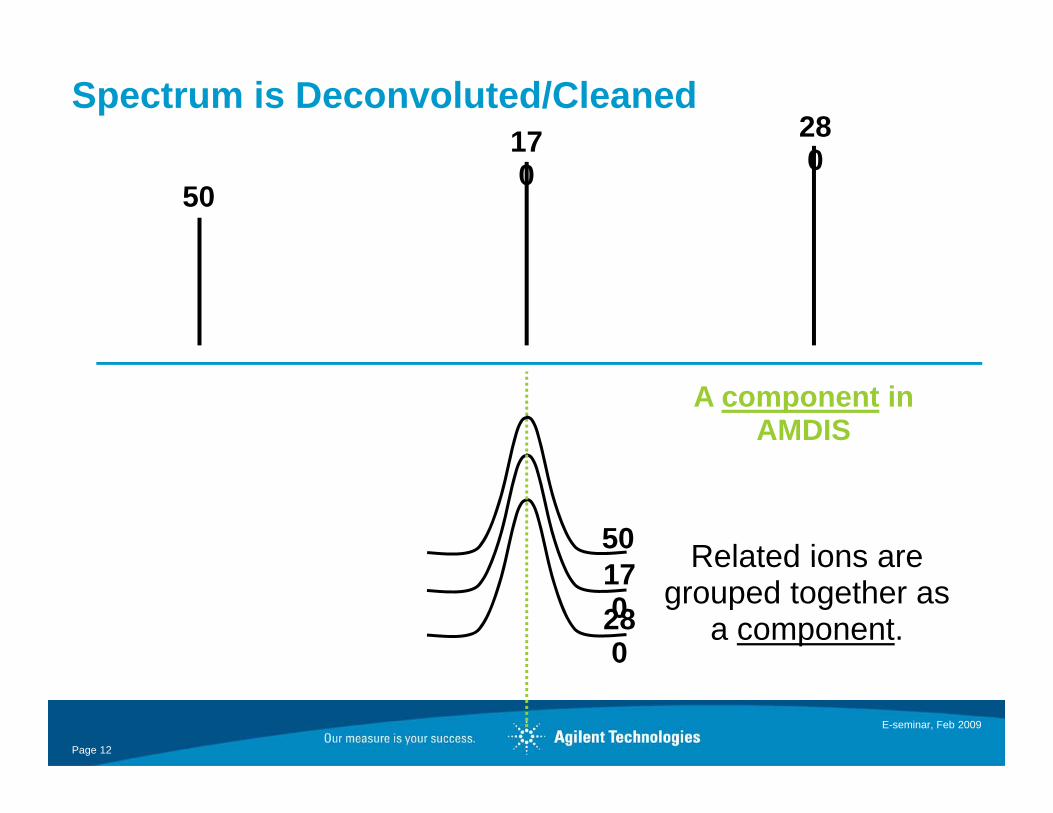
Spectrum is Deconvoluted/Cleaned
50
170 0
A component in AMDIS
50 Related ions are170280
Related ions are grouped together as
a component.
E-seminar, Feb 2009
Page 12
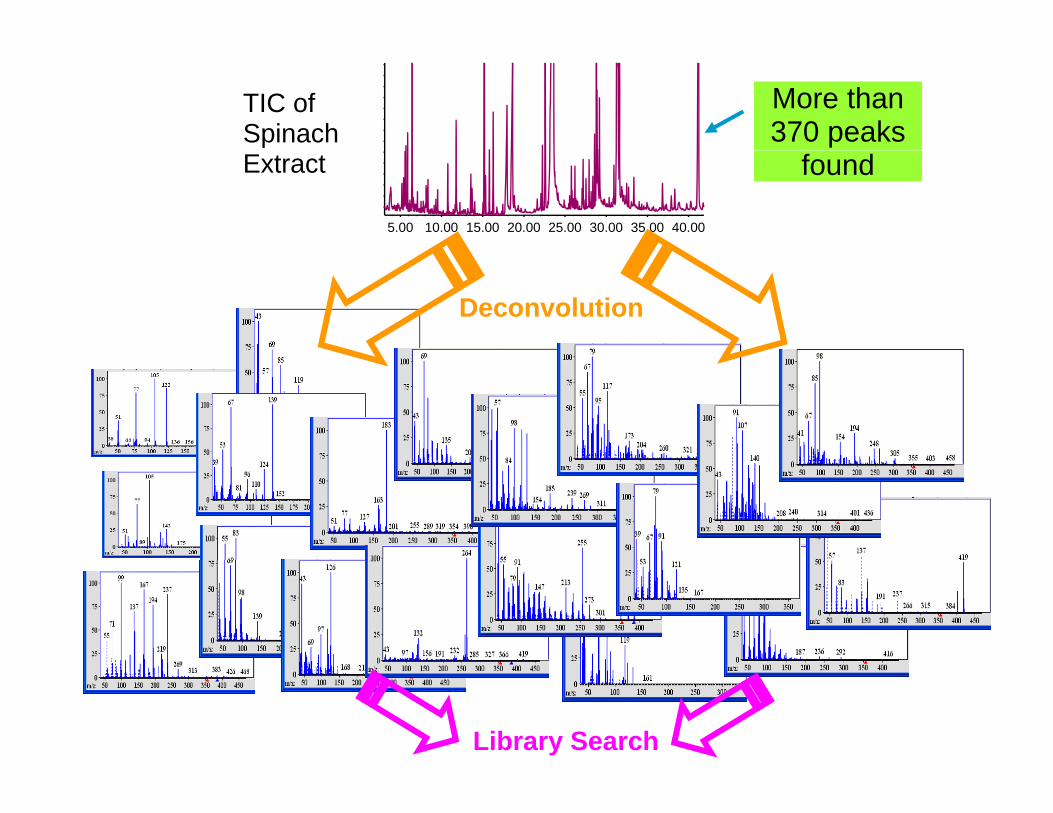
TIC of Spinach
More than 370 peaks
5.00 10.00 15.00 20.00 25.00 30.00 35.00 40.00
Extract found
Deconvolution
Library Search
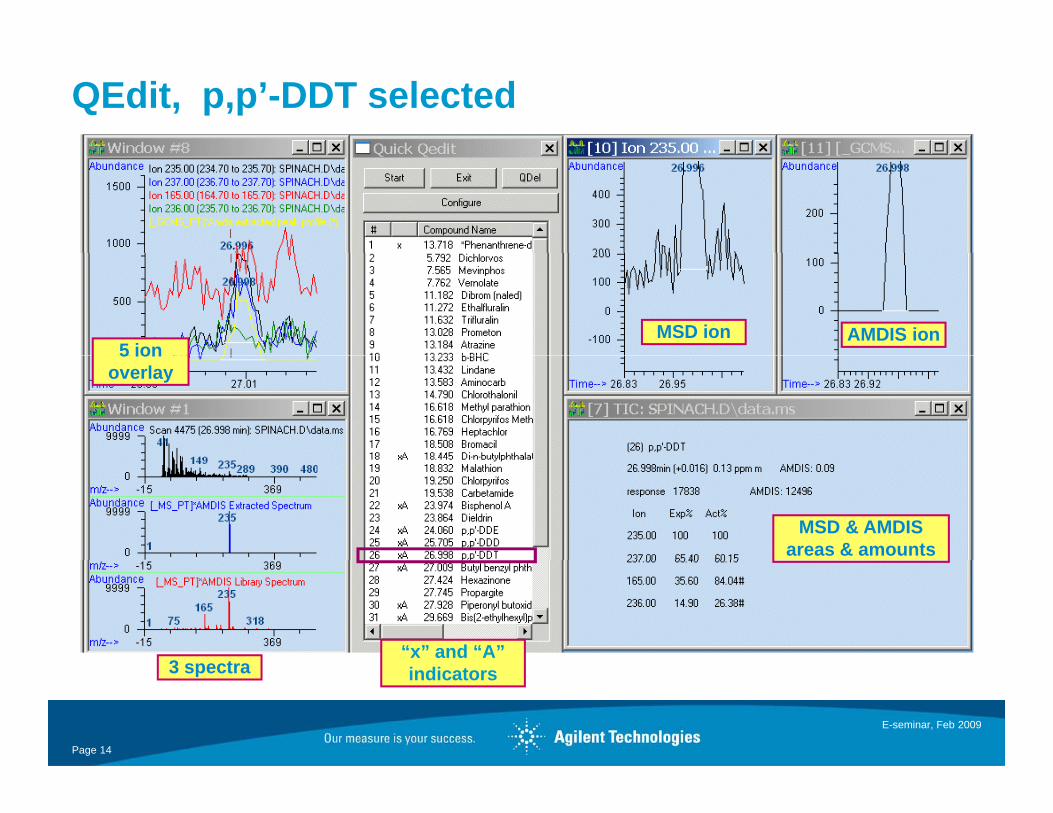
QEdit, p,p’-DDT selected
5 ionMSD ion AMDIS ion
5 ion overlay
MSD & AMDIS areas & amounts
3 t“x” and “A”
E-seminar, Feb 2009
Page 14
3 spectra indicators
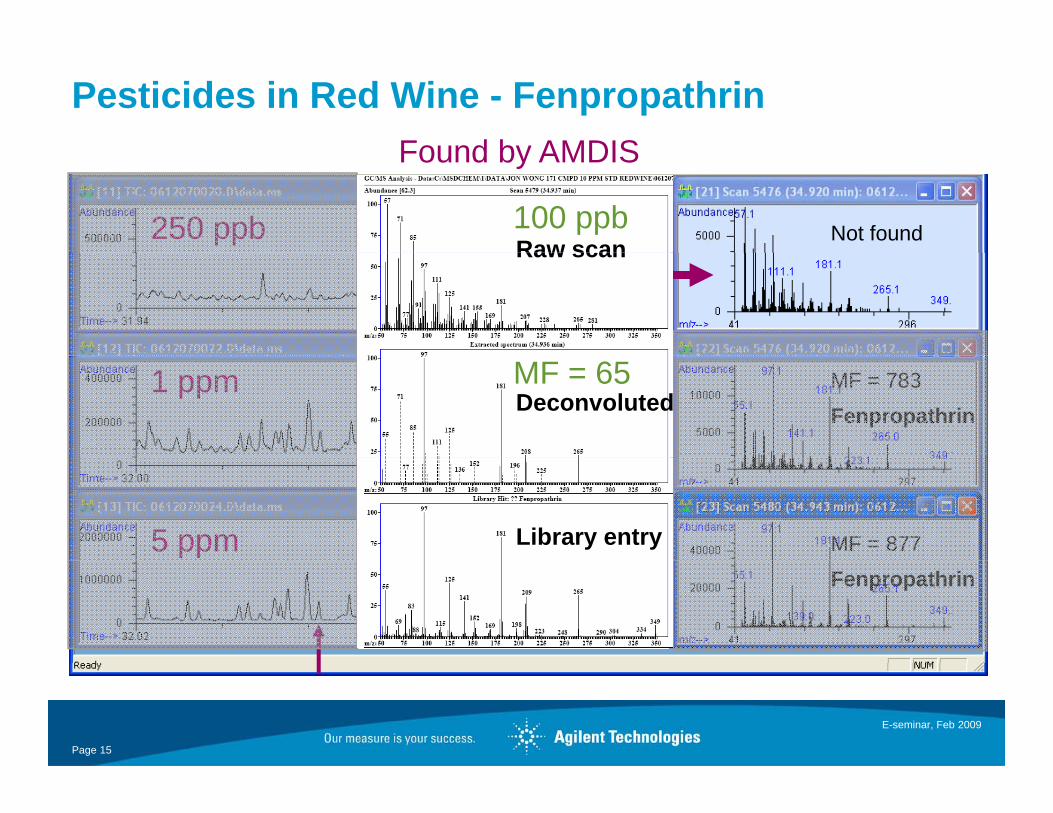
Pesticides in Red Wine - FenpropathrinFound by AMDIS
250 ppb Not found250 ppbRaw scan
Found by AMDIS
100 ppbRaw scanRaw scanRaw scan
1 ppm MF = 783Fenpropathrin
MF = 83DeconvolutedMF = 65Deconvoluted
5 ppm MF = 877Library entryLibrary entry
Fenpropathrin
E-seminar, Feb 2009
Page 15
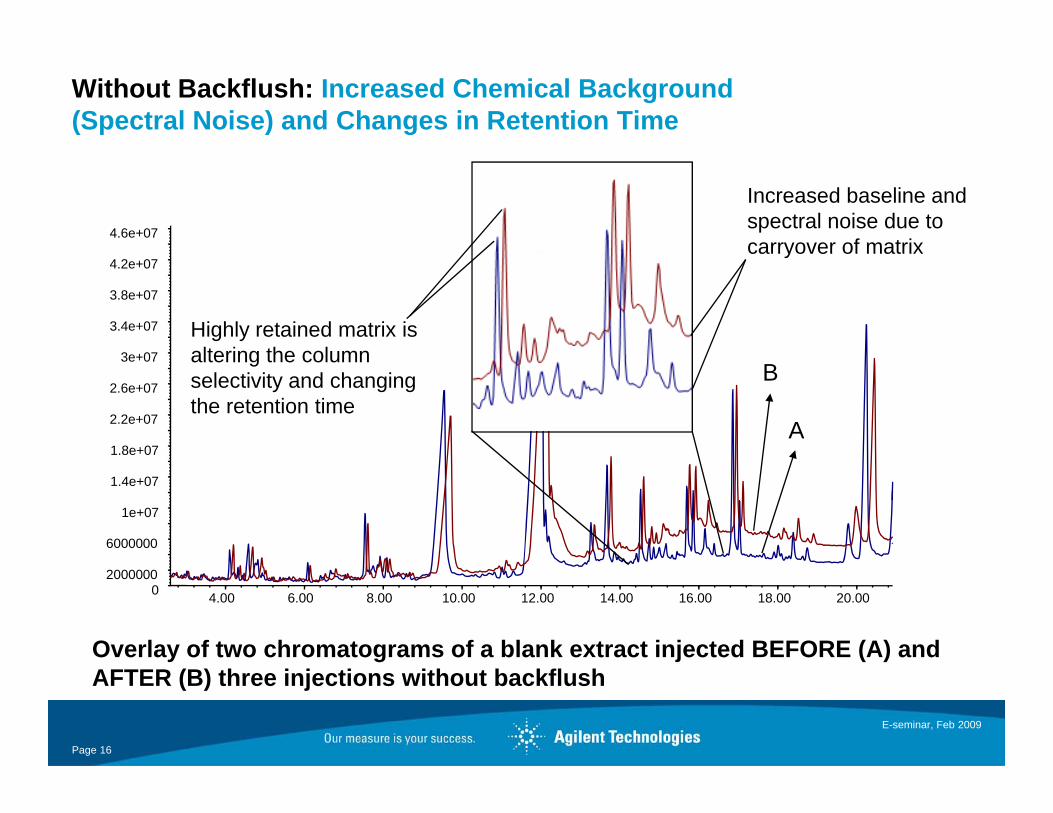
Without Backflush: Increased Chemical Background (Spectral Noise) and Changes in Retention Time
4.6e+07
Increased baseline and spectral noise due to carryover of matrix
3e+07
3.4e+07
3.8e+07
4.2e+07carryover of matrix
Highly retained matrix is altering the column
1.8e+07
2.2e+07
2.6e+07
3e+07B
A
altering the column selectivity and changing the retention time
6000000
1e+07
1.4e+07
4.00 6.00 8.00 10.00 12.00 14.00 16.00 18.00 20.0002000000
Overlay of two chromatograms of a blank extract injected BEFORE (A) and
E-seminar, Feb 2009
Page 16
AFTER (B) three injections without backflush

With Backflush: No Increased Chemical Background (Spectral Noise) and No Change in Retention Time
Stable retention times and baseline . . . less chemical noise- less maintenance4.2e+07
4.6e+07
- better results
3e+07
3.4e+07
3.8e+07
1 8e+07
2.2e+07
2.6e+07
3e+07
6000000
1e+07
1.4e+07
1.8e+07
4.00 6.00 8.00 10.00 12.00 14.00 16.00 18.00 20.000
2000000
6000000
E-seminar, Feb 2009
Page 17
Overlay of three chromatograms of lettuce extract run with 2 min of backflush
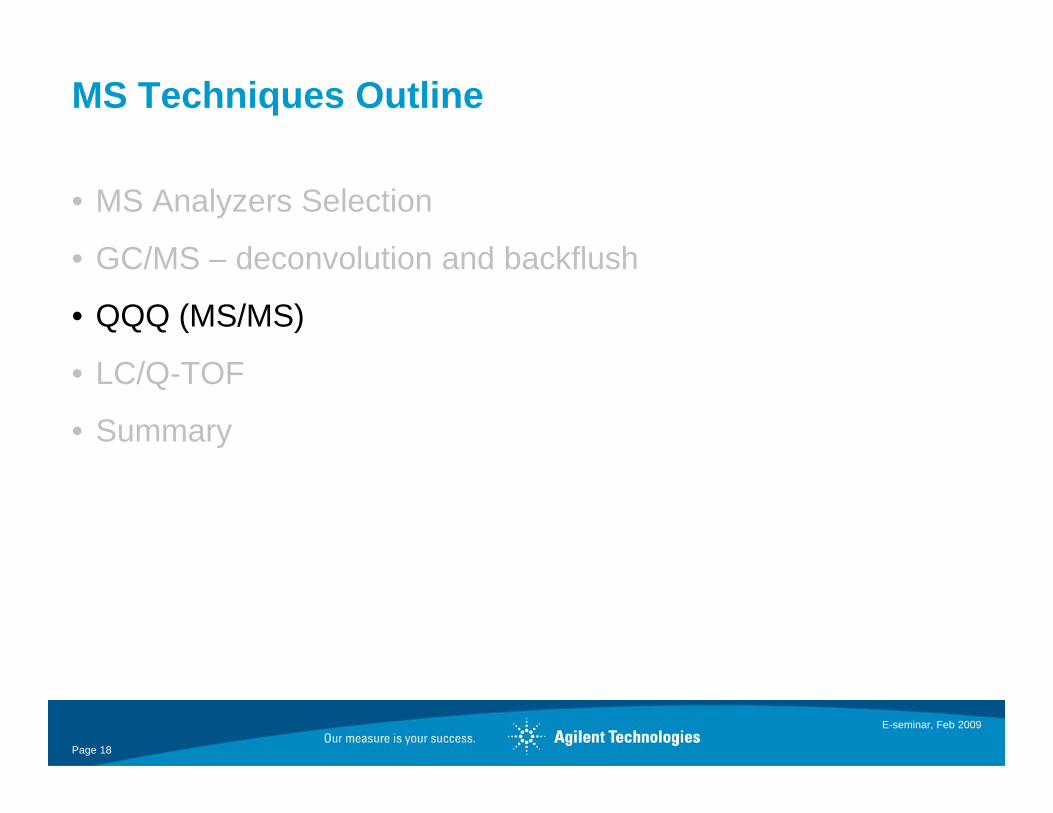
MS Techniques Outline
• MS Analyzers Selection
GC/MS deconvolution and backflush• GC/MS – deconvolution and backflush
• QQQ (MS/MS)
• LC/Q-TOF
• Summary
E-seminar, Feb 2009
Page 18
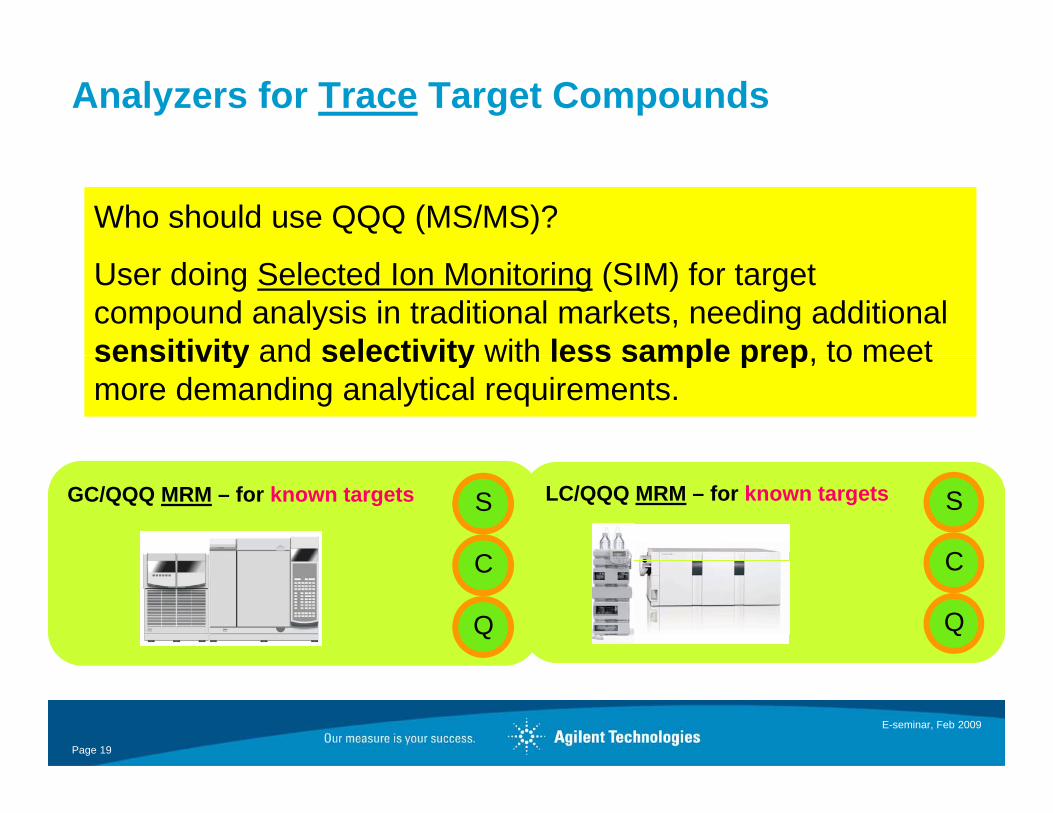
Analyzers for Trace Target Compounds
Who should use QQQ (MS/MS)?
User doing Selected Ion Monitoring (SIM) for target compound analysis in traditional markets, needing additional sensitivity and selectivity with less sample prep to meetsensitivity and selectivity with less sample prep, to meet more demanding analytical requirements.
LC/QQQ MRM – for known targets S
C
GC/QQQ MRM – for known targets S
C C
Q
C
Q
E-seminar, Feb 2009
Page 19
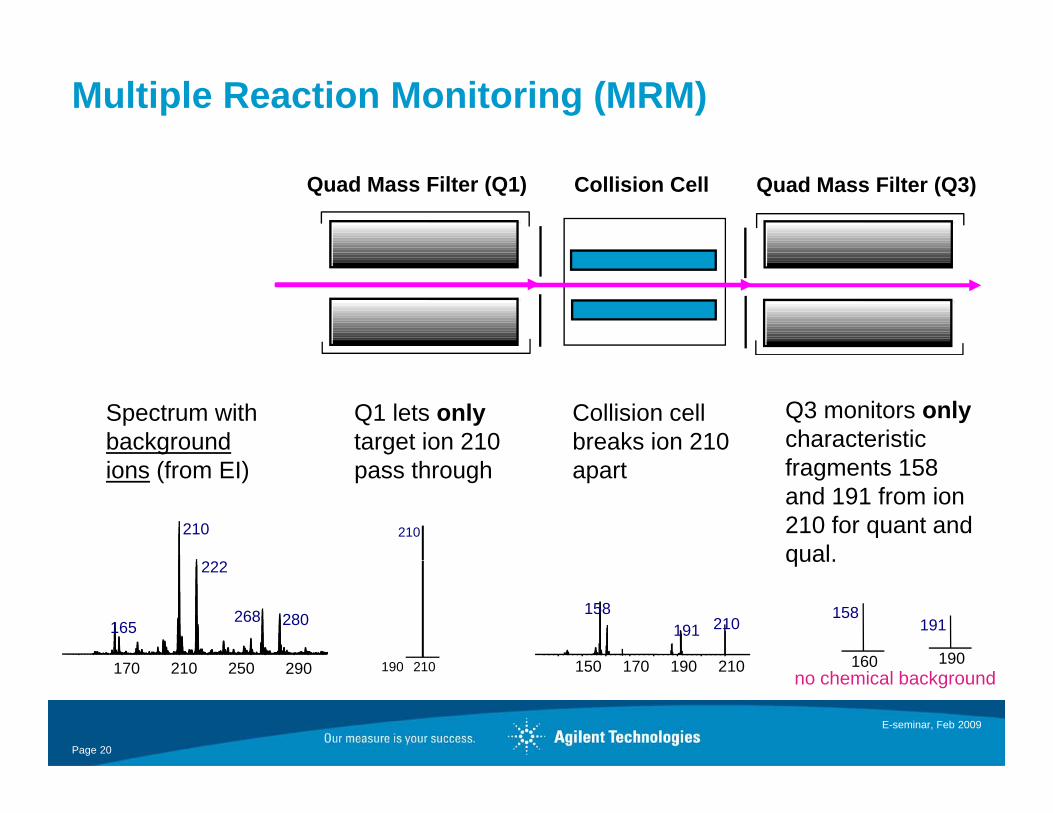
Multiple Reaction Monitoring (MRM)
Quad Mass Filter (Q3)Quad Mass Filter (Q1) Collision Cell
Spectrum with background
Q1 lets onlytarget ion 210
Collision cell breaks ion 210
Q3 monitors onlycharacteristic
210
ions (from EI) pass through
210
apart fragments 158 and 191 from ion 210 for quant and qual.
170 210 250 290
222
268 280165
190 210 150 170 190 210
210158
191
qual.
160
158
190
191
E-seminar, Feb 2009
Page 20
170 210 250 290 190 210 150 170 190 210 160 190no chemical background

Why MS/MS?Greater Selectivity Than SIMGreater Selectivity Than SIM
EI-SIM EI-MS/MSEI SIMselectivity proportional to
spectral resolutionno selectivity against ions
Precursor selectivity same as SIMHigh probability that at least one product ion will be a unique dissociation product of the precursor BUT not the interference
interference
Product 2
no selectivity against ions with same m/z
of the precursor BUT not the interference
analyte
Precursor
Product 1Product 3
interference
unit mass resolutionIon
The precursor ion should NOT be used for ion ratios or quantitation since the interferences will
E-seminar, Feb 2009
Page 21
ratios or quantitation since the interferences will be the same as the SIM ion

SIM vs MRM for HCB100 fg HCB in Clean Matrix100 fg HCB in Clean Matrix
M 2
83.8
Injecting 100 fg of
e M
S: S
IM S/N=26:1 RMS
Injecting 100 fg of Hexaclorobenzene (HCB)and analyzing in SIM.
Sing
le9 I j ti 100 f f
83.8
:213
.9
S/N=37:1 RMS
Injecting 100 fg of Hexaclorobenzene (HCB)and analyzing in MRM.
MS/
MS:
28 RMS y g
You obtain the same S/N!
E-seminar, Feb 2009
Page 22
M

SIM vs MRM for HCB100 fg HCB in Clean Matrix 300 fg HCB in Diesel100 fg HCB in Clean Matrix 300 fg HCB in Diesel
M 2
83.8
e M
S: S
IM S/N=6:1 RMSS/N=26:1 RMS
Sing
le9
83.8
:213
.9
S/N=86:1 RMS
S/N=37:1 RMS
MS/
MS:
28 RMSRMS
E-seminar, Feb 2009
Page 23
M

Comparing GC/Q SIM to GC/QQQ MRM in Various Matrices – Analysis of p,p’-DDE at 10 ppb (All injections = 1 µL)(All injections = 1 µL)
Apple
SIM - EIC (246) MRM (246->176,175)
S/N = 448pp
Cabbage S/N = 241
Ginseng S/N = 446
Orange S/N = 456
Spinach S/N = 260
E-seminar, Feb 2009
Page 24
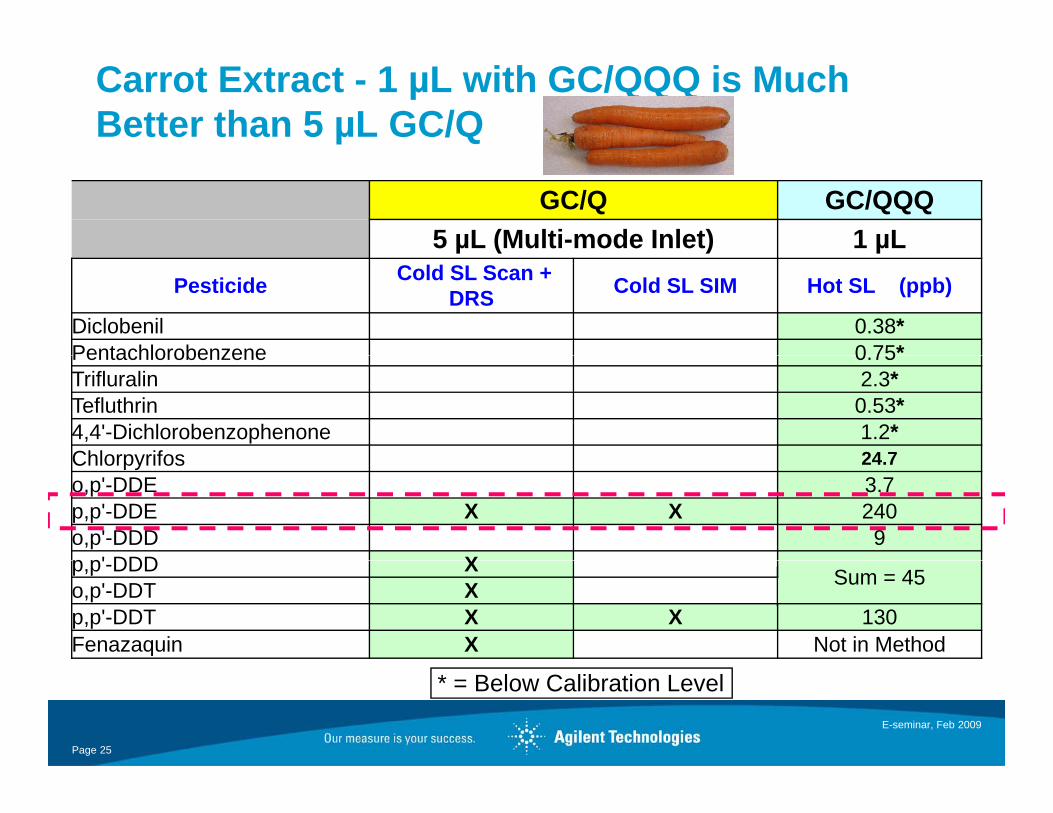
Carrot Extract - 1 µL with GC/QQQ is Much Better than 5 µL GC/Q
GC/Q GC/QQQ5 µL (Multi-mode Inlet) 1 µLµ ( ) µ
Pesticide Cold SL Scan + DRS Cold SL SIM Hot SL (ppb)
Diclobenil 0.38*Pentachlorobenzene 0 75*Pentachlorobenzene 0.75Trifluralin 2.3*Tefluthrin 0.53*4,4'-Dichlorobenzophenone 1.2*Chlorpyrifos 24 7Chlorpyrifos 24.7o,p'-DDE 3.7p,p'-DDE X X 240o,p'-DDD 9p p' DDD Xp,p'-DDD X Sum = 45o,p'-DDT Xp,p'-DDT X X 130Fenazaquin X Not in Method
E-seminar, Feb 2009
Page 25
* = Below Calibration Level
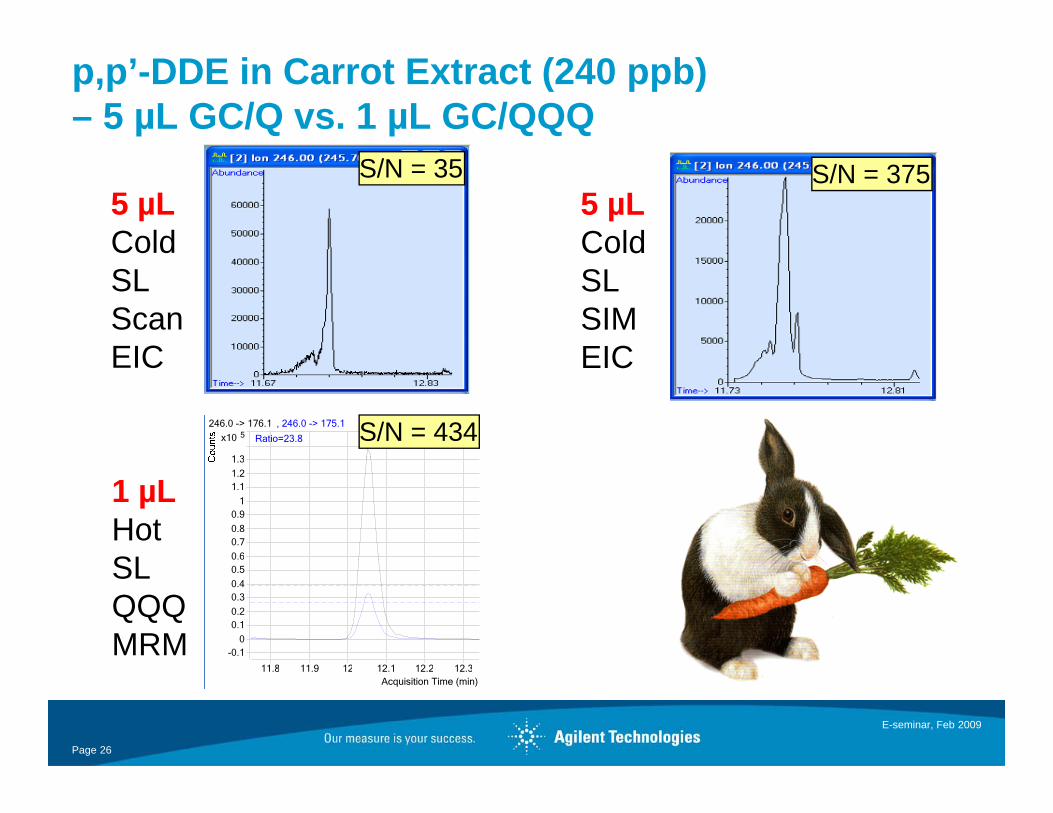
p,p’-DDE in Carrot Extract (240 ppb) – 5 µL GC/Q vs. 1 µL GC/QQQ
5 µLCold
S/N = 355 µLCold
S/N = 375
Co dSL ScanEIC
ColdSL SIMEICEIC EIC
5x10
1 3
246.0 -> 176.1 , 246.0 -> 175.1
Ratio=23.8 S/N = 434
0.6
0.70.8
0.91
1.11.2
1.3
1 µLHotSL
-0.10
0.10.2
0.30.4
0.5SL QQQMRM
E-seminar, Feb 2009
Page 26
Acquisition Time (min)11.8 11.9 12 12.1 12.2 12.3
Why a GC/MS/MS System?
• Allows for the selective quantitation of target compounds in high chemical background samples
• Better S/N in complex matrices than can be achieved by single quadrupole scan or SIM approaches.
• Newer regulations in some markets specify analytical power commensurate with GC/MS/MS
E-seminar, Feb 2009
Page 27
Technology
Agilent took the best technologies from their industry leading 597X Series GC/MSD:
– Heated monolithic gold plated quartz quadrupole– Proven reliable high performance source design
AUTOTUNE– AUTOTUNE
and the 6410A LC/QQQ:
– Linear acceleration enhanced Collision Cell– Wide Mass-Bandwidth QQQ ion optics
M H t ft– MassHunter software
E-seminar, Feb 2009
Page 28
Why Heated Quartz “Gold” Quads?
Unlike LC/MS, many high boiling neutral molecules enter the source and manifold of a GC/MS or GC/MS/MS
• Higher temperature reduces potential for contamination– 200C max – Virtually eliminates the need to clean quads
• Low coefficient for thermal expansion for quartzp q– Stable structure during maintenance cycles (hot-cool-hot) for source
or detector
More stable tunes and methods over a longer period of time in real world sample environments
E-seminar, Feb 2009
Page 29

MS Technique Outline
• MS Analyzers Selection
GC/MS deconvolution and backflush• GC/MS – deconvolution and backflush
• QQQ (MS/MS)
• LC/Q-TOF
• Summary
E-seminar, Feb 2009
Page 30

Agilent Q-TOF Fundamentals
Flight tubeCommon with TOF
Two key concepts for TOF:
1. Exact Mass
Collision cell
Ion Mirror2. Mass Error
Ion opticsCommon with Q & QQQ
Collision cellCommon with QQQ
Octopole 1Quad Mass Filter (Q1) Octopole 2
Detector
DC Quad
Rough Pump
Turbo Turbo Turbo
Collision CellLens 1 and 2Ion Pulser
Turbo
E-seminar, Feb 2009
Page 31 September, 2008Page 31
p
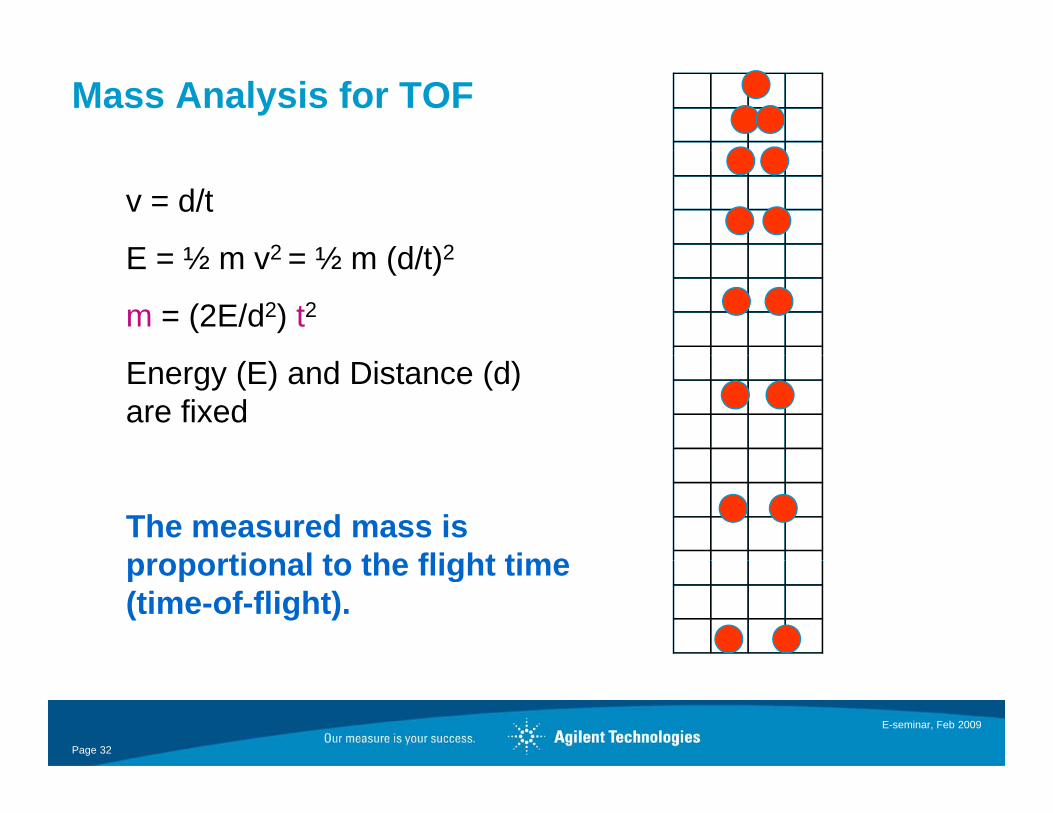
Mass Analysis for TOF
v = d/t
E ½ m v2 ½ m (d/t)2E = ½ m v2 = ½ m (d/t)2
m = (2E/d2) t2
Energy (E) and Distance (d) are fixed
The measured mass is proportional to the flight timeproportional to the flight time (time-of-flight).
E-seminar, Feb 2009
Page 32
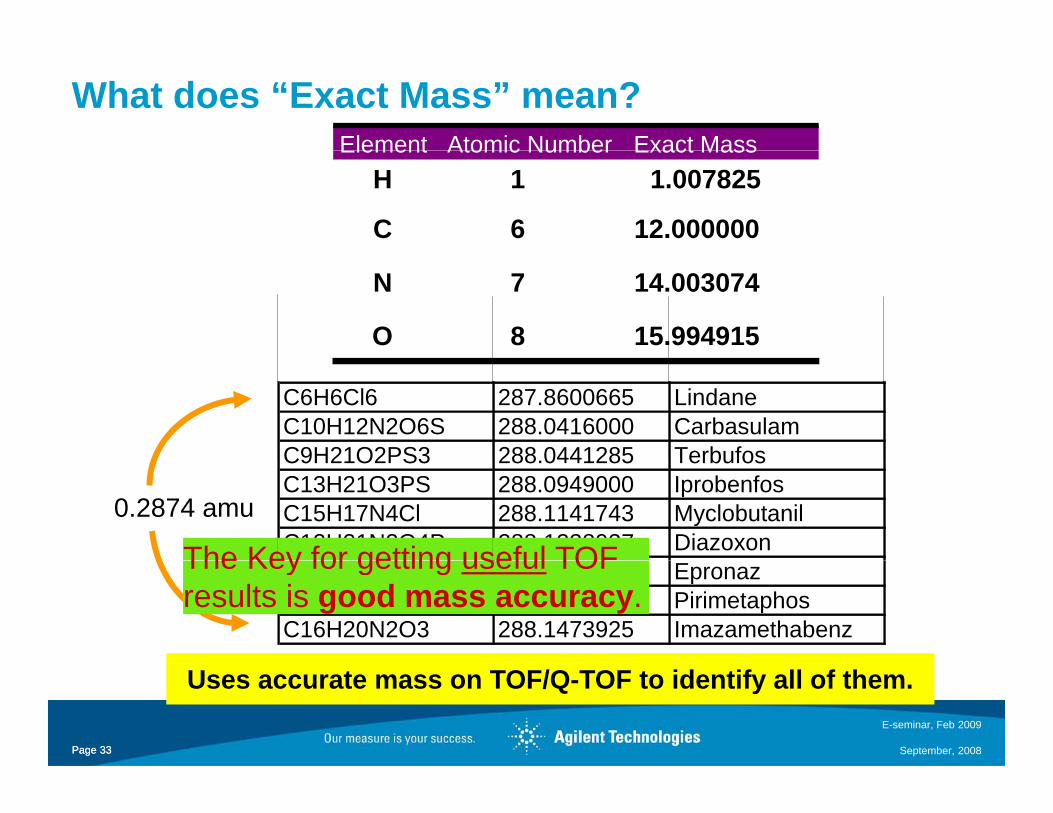
What does “Exact Mass” mean?Element Atomic Number Exact MassElement Atomic Number Exact Mass
H 1 1.007825
C 6 12.000000
N 7 14.003074
O 8 15.994915
C6H6Cl6 287.8600665 LindaneC10H12N2O6S 288.0416000 CarbasulamC9H21O2PS3 288 0441285 TerbufosC9H21O2PS3 288.0441285 TerbufosC13H21O3PS 288.0949000 IprobenfosC15H17N4Cl 288.1141743 MyclobutanilC12H21N2O4P 288.1238937 Diazoxon
0.2874 amu
The Key for getting useful TOFC11H20N4O3PS 288.1256000 EpronazC11H21N4O3P 288.1351000 PirimetaphosC16H20N2O3 288.1473925 Imazamethabenz
The Key for getting useful TOF results is good mass accuracy.
E-seminar, Feb 2009
Page 33 September, 2008Page 33
Uses accurate mass on TOF/Q-TOF to identify all of them.

Calculation of Error in Measured Mass (MH+) of Reserpine(MH ) of Reserpine
Atom Mass of Atom # of Atoms SumHydrogen 1.00783 40 40.31300Carbon 12 00000 33 396 00000Carbon 12.00000 33 396.00000Nitrogen 14.00307 2 28.00615Oxygen 15.99492 9 143.95424Total 608.27338Plus H 1.00783 1 1.00783Total 609.28121Minus e- 0.00055 1 0.00055
609 28066
NH
N
O
O OO
CH3CH3
CH3HH
609.28066
Calculated = exact
(Measured - Calculated) X 1 000 000O O
O
OOCH3CH3
CH3
H
R i (C H N O )
(Measured Calculated)Calculated
0.9027038 ppm
X 1,000,000 = ppm
E-seminar, Feb 2009
Page 34 September, 2008Page 34
Reserpine (C33H40N2O9)Error if the electron was not omitted!
TOF/Q-TOF Unlimited Number of Compound Screening
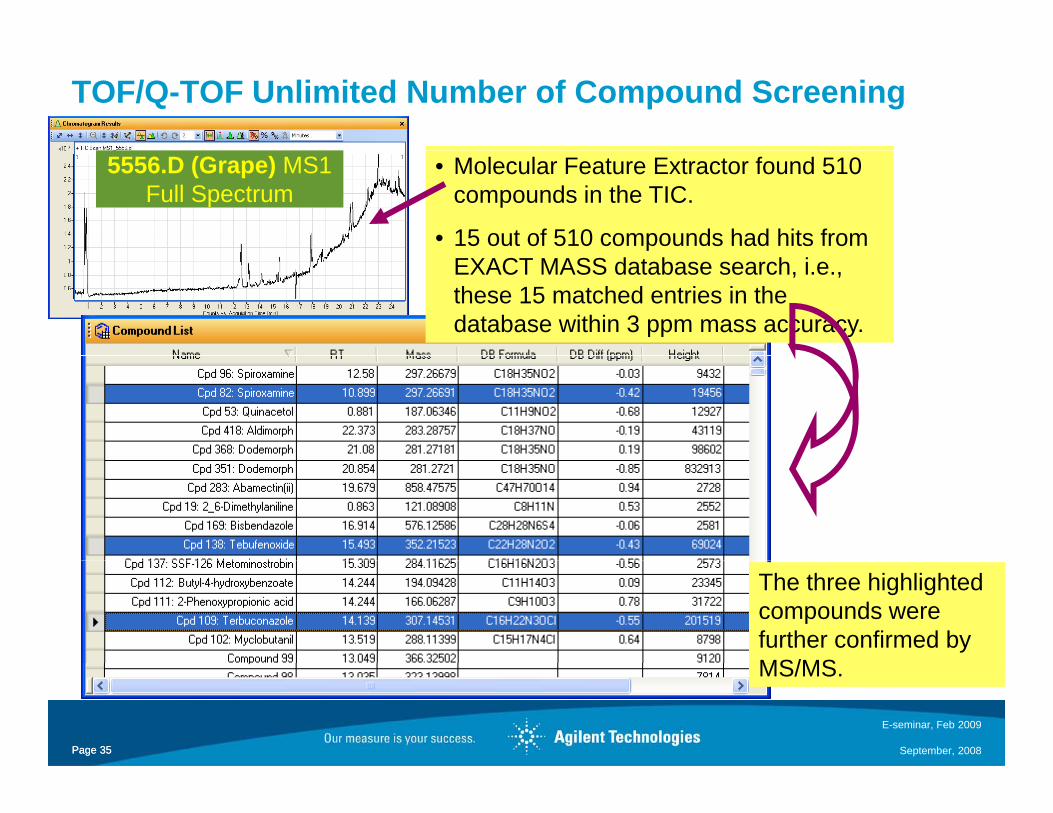
5556.D (Grape) MS1 Full Spectrum
• Molecular Feature Extractor found 510 compounds in the TIC.
• 15 out of 510 compounds had hits from EXACT MASS database search, i.e., these 15 matched entries in the database within 3 ppm mass accuracy.
The three highlighted compounds were further confirmed by MS/MS
E-seminar, Feb 2009
Page 35 September, 2008Page 35
MS/MS.
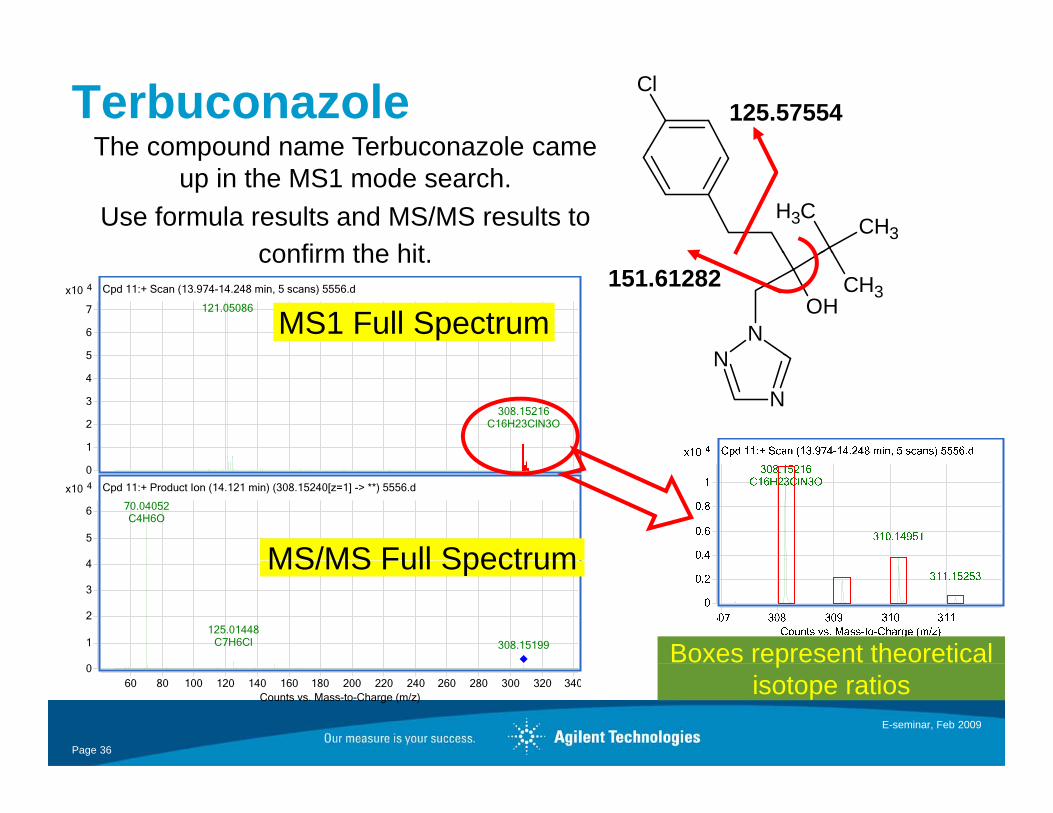
Cl125.57554Terbuconazole
The compound name Terbuconazole came
CH3 CH3
The compound name Terbuconazole came up in the MS1 mode search.
Use formula results and MS/MS results to confirm the hit
NN
OHCH34x10
5
6
7
Cpd 11:+ Scan (13.974-14.248 min, 5 scans) 5556.d
121.05086
MS1 Full Spectrum
confirm the hit.151.61282
N
N
1
2
3
4
5
308.15216C16H23ClN3O
04x10
4
5
6
Cpd 11:+ Product Ion (14.121 min) (308.15240[z=1] -> **) 5556.d
70.04052C4H6O
MS/MS Full Spectrum
1
2
3
4
125.01448C7H6Cl 308.15199
MS/MS Full Spectrum
Boxes represent theoretical
E-seminar, Feb 2009
Page 36
0
Counts vs. Mass-to-Charge (m/z)60 80 100 120 140 160 180 200 220 240 260 280 300 320 340
pisotope ratios
Screen Pesticides with LC-TOF/Q-TOF
• Accurate Mass provides added compound selectivity
• Higher resolution provides added interference selectivity
• Always full spectral data
• Unlimited number of compounds can be screened (searchUnlimited number of compounds can be screened (search exact mass compound database for identification)
• Sensitivity is the same regardless of number of compounds y g pscreened*
• MS/MS (Q-TOF) assists compound confirmation
*Triple quadrupole (QQQ) mass spectrometer can be more sensitive up to a limited
E-seminar, Feb 2009
Page 37
( )number of compounds. That limit has not been definitively determined.
MS Technique Outline
• MS Analyzers Selection
GC/MS deconvolution and backflush• GC/MS – deconvolution and backflush
• QQQ (MS/MS)
• LC/Q-TOF
• Summary
E-seminar, Feb 2009
Page 38

Summary
• GC/MS and Deconvolution to Screen, Confirm and Quantify • QQQ for routine Targeted trace analysis in complex matrix g y p
– MRM Sensitivity unsurpassed (up to a few hundred compounds)– Complex matrix with less clean-up
• TOF/Q-TOF for Targeted and Unknown Screening– Sensitive full scan analysis
Searching exact mass database leads to identification– Searching exact mass database leads to identification• Unlimited number of compounds• Sensitivity is the same regardless of number of compounds screened
– Quantitative– Accurate mass MS/MS for identification of fragments and structure
elucidation (hotlink available to search on-line databases)
E-seminar, Feb 2009
Page 39
( )
References
Application Note 5989-7670: Replacing Multiple 50-Minute GC and GC-MS/SIM Analyses with One 15-Minute Full-Scan GC-MS Analysis for Non-targeted Pesticides Screening and >10x Productivity Gaintargeted Pesticides Screening and >10x Productivity Gain
Pesticide Brochure 5989-8652
GC-QQQ Brochure 5990-3152
Current Trends in Mass Spectrometry, pp 33-38, Nov. 2008 (Supplement to LC/GC North America): Comprehensive Screening Confirmation andto LC/GC North America): Comprehensive Screening, Confirmation, and Quantification of Organic Pesticides in Foods by GC-MS and LC-MS
The Applications Book, LC/GC Europe, pp 9-11, Dec. 2008: The Benefits f I ti GC/QQQ i t P ti id A l i M th dof Incorporating GC/QQQ into Pesticide Analysis Methods
E-seminar, Feb 2009
Page 40
Thank you for your attention. Questions?
January in Amsterdam
E-seminar, Feb 2009
Page 41