Embed Size (px)
DESCRIPTION
SKOLKOVO Institute for Emerging Market Studies’ (SIEMS) research – “African Lions in the Making” (December 2011)
Citation preview
Sie
mS
em
er
gin
g m
ar
ke
t
br
ief
Sk
OLk
OV
O in
stitu
te fo
r e
mer
ging
mar
ket S
tudi
esm
osco
w S
choo
l of m
anag
emen
tD
ecem
ber
2011
/ V
ol. 1
1-11
african LiOnS in the making

research december, 2011
i. intrODuctiOn 2
ii. african ecOnOmic PerfOrmance in
retrOSPectiVe 6
iii. africa tODay anD the rOaD aheaD 16

2 /I. IntroductIon
research december, 2011
i. intrODuctiOn
research december, 2011
3I.IntroductIon /
In recent years, there have been significant reforms in macroeconomic
management, improved incentives for the private sector, and relatively
favorable international context for commodity exporting countries. This
environment has produced relatively high growth rates in many African
countries. The continent’s average growth is almost five times the Euro-
zone’s average growth; in fact, some of the world’s fastest growing econo-
mies are in Sub-Saharan Africa. Growth in 2011 is expected to average
5.5% and 6% in 2012 (World Bank, 2011).
Despite these recent developments, the nations of Sub-Saharan Af-
rica have been far less successful in raising per capita income, reducing
poverty, or transforming their economic structures. For example, in 2010,
the average real per capita income was USD $688 or just about the same
as in 1980. In contrast, during the same period, per capita incomes in East
Asia grew by almost seven times. In 2008, half of Africans lived in poverty
compared to 25% in the rest of the developing world.
In almost all African countries, the primary sector—either agriculture
or minerals—still dominates production. Foreign trade mirrors the produc-
tion structure: Exports are dominated by primary commodities that incor-
porate minimal application of science and technology, while the bulk of
manufactured goods and knowledge-based services are imported. From
the mid-1980s to mid-2000s, Africa’s exports have remained primary pro-
duction and resource-based, while exports from East Asian countries have
diversified to include medium- and high-technology manufactured prod-
ucts. Not surprisingly, the employment structure mirrors that of production,
with most African people engaged in low-productivity traditional agriculture,
services, and the informal sector, which account for the widespread pov-
erty observed in the continent.
Africa has recently experienced an increased eco-
nomic momentum. If true change is to become reality,
this momentum needs to be sustained. To tackle the
economic situation in Africa effectively, it is clear that it
is not enough to focus on the desirable ends of reducing
poverty and expanding access to basic needs in health
and education, as promoted by the Millennium Development Goals. Africa
must follow the path of East Asia and transform its economy. Growth with-
out structural transformation has not proved sustainable. The countries of
the region need to modernize and diversify their economies if they want
to become authentic economic lions. It is essential that they broaden their
base of production, increasing the share of manufacturing and knowledge-
based services. This would reduce economic volatility and provide greater
scope for increasing returns and learning-by-doing, which would enhance
the chances for further technological advances.
Africa has recently experienced an increased economic momentum
4 /I.IntroductIon
research december, 2011
Notwithstanding its structural weaknesses, the continent is once again
on an upward trajectory. The relevant question is whether the observed ac-
celeration is a sign of hard-earned progress or the result of the commodity
price boom of the last eight years. This paper shows that while the com-
modity boom might be one engine of growth in the continent, there are also
fundamental changes that allow for cautious optimism about the future of
the continent.
This study is structured in three sections. In the next section, I char-
acterize the performance of 15 Sub-Saharan African economies in the last
30 years vis a vis other emerging market economies, showing the abso-
lute and relative stagnation of most African economies. I have selected a
sample of Sub-Saharan countries for presentation convenience. The 15
countries are Botswana, Burkina Faso, Cameroon, Ethiopia, Ghana, Kenya,
Mauritius, Mozambique, Nigeria, Rwanda, Senegal, South Africa, Tanzania,
Uganda, and Zambia. In 2009, these countries accounted for 62% of the
population of Sub-Saharan Africa, 70% of its GDP, 64% of the total exports,
and 81% of the manufacturing exports. In the third section, I analyze the
recent economic improvement and the road ahead for Sub-Saharan Africa.

research december, 2011
5I.IntroductIon /
6 /II. afrIcan economIc Performance In retrosPectIve
research december, 2011
ii. african
ecOnOmic PerfOrmance in
retrOSPectiVe
research december, 2011
7II.afrIcan economIc Performance In retrosPectIve /
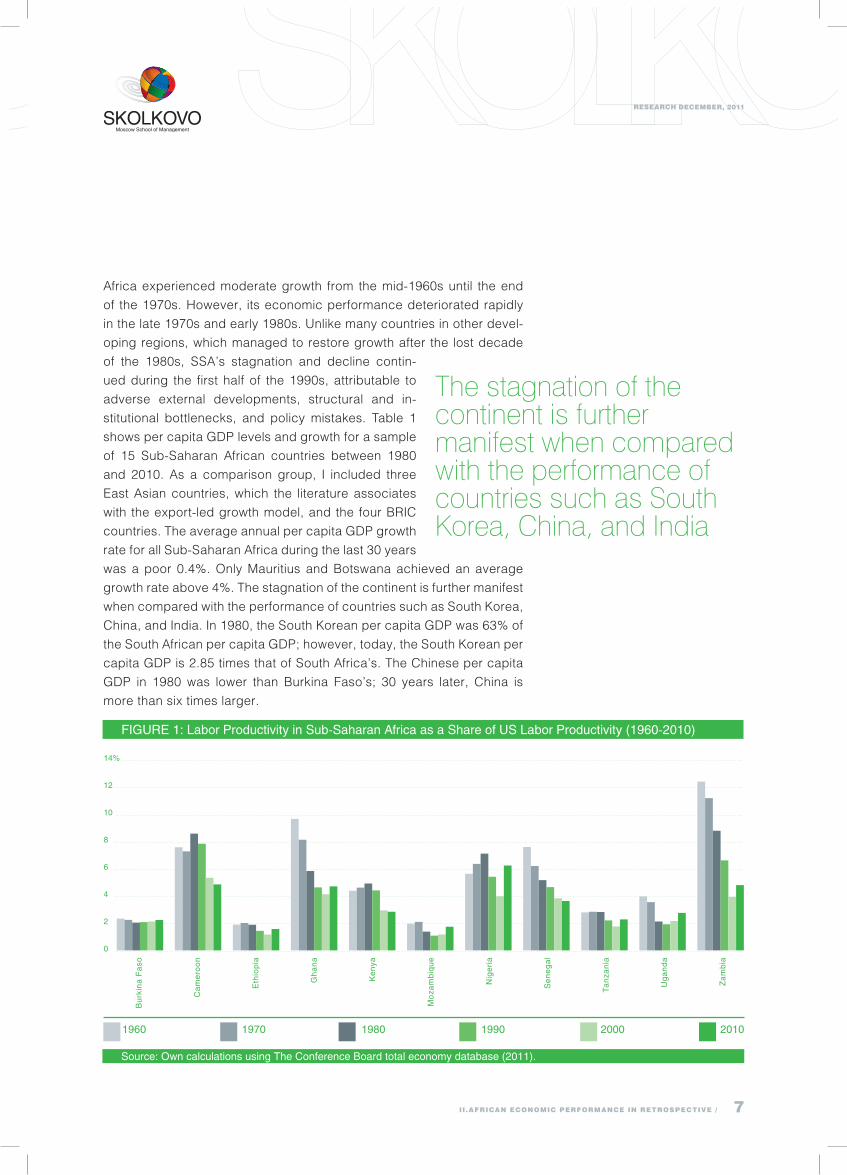
Africa experienced moderate growth from the mid-1960s until the end
of the 1970s. However, its economic performance deteriorated rapidly
in the late 1970s and early 1980s. Unlike many countries in other devel-
oping regions, which managed to restore growth after the lost decade
of the 1980s, SSA’s stagnation and decline contin-
ued during the first half of the 1990s, attributable to
adverse external developments, structural and in-
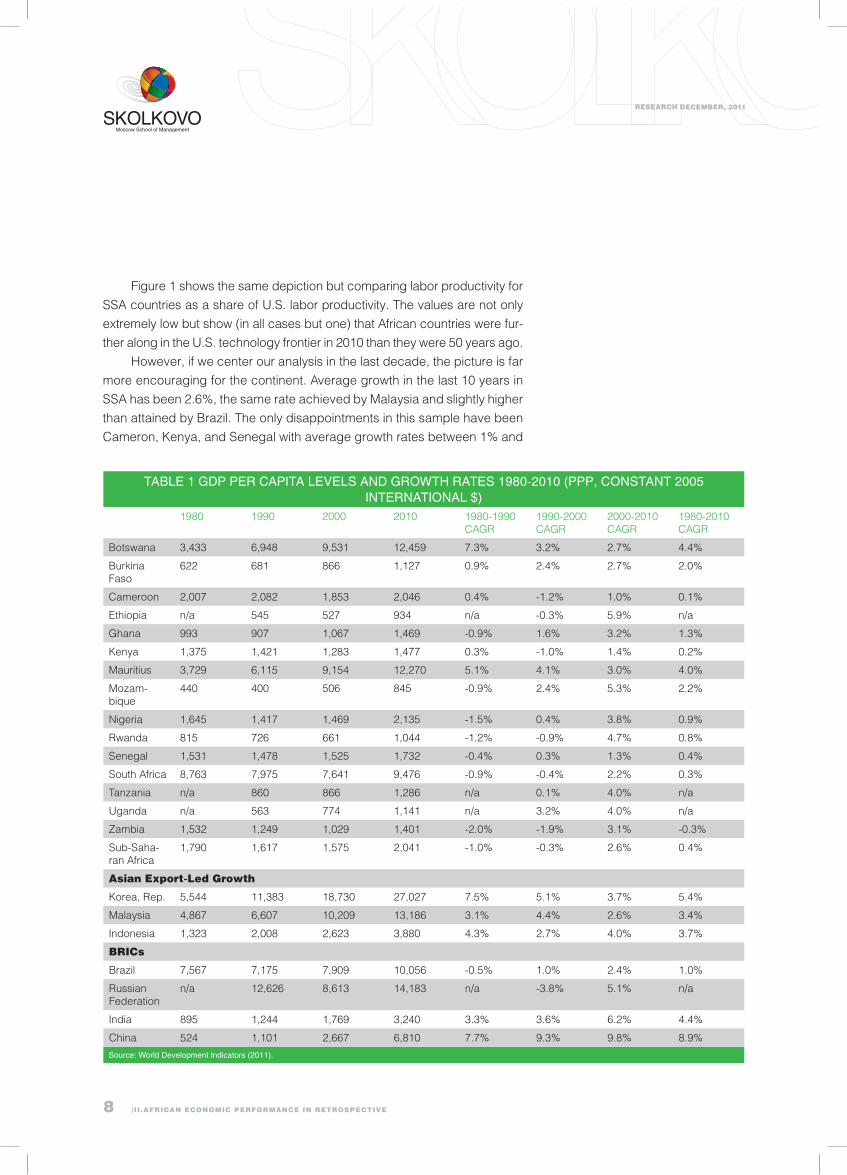
stitutional bottlenecks, and policy mistakes. Table 1
shows per capita GDP levels and growth for a sample
of 15 Sub-Saharan African countries between 1980
and 2010. As a comparison group, I included three
East Asian countries, which the literature associates
with the export-led growth model, and the four BRIC
countries. The average annual per capita GDP growth
rate for all Sub-Saharan Africa during the last 30 years
was a poor 0.4%. Only Mauritius and Botswana achieved an average
growth rate above 4%. The stagnation of the continent is further manifest
when compared with the performance of countries such as South Korea,
China, and India. In 1980, the South Korean per capita GDP was 63% of
the South African per capita GDP; however, today, the South Korean per
capita GDP is 2.85 times that of South Africa’s. The Chinese per capita
GDP in 1980 was lower than Burkina Faso’s; 30 years later, China is
more than six times larger.
14%
12
10
8
6
4
2
0
figure 1: Labor Productivity in Sub-Saharan africa as a Share of uS Labor Productivity (1960-2010)
Source: Own calculations using the conference board total economy database (2011).
bur
kina
fas
o
cam
eroo
n
eth
iopi
a
gha
na
ken
ya
moz
ambi
que
nig
eria
Sen
egal
tanz
ania
uga
nda
Zam
bia
1960 1970 1980 1990 2000 2010
The stagnation of the continent is further manifest when compared with the performance of countries such as South Korea, China, and India
8 /II.afrIcan economIc Performance In retrosPectIve
research december, 2011
Figure 1 shows the same depiction but comparing labor productivity for
SSA countries as a share of U.S. labor productivity. The values are not only
extremely low but show (in all cases but one) that African countries were fur-
ther along in the U.S. technology frontier in 2010 than they were 50 years ago.
However, if we center our analysis in the last decade, the picture is far
more encouraging for the continent. Average growth in the last 10 years in
SSA has been 2.6%, the same rate achieved by Malaysia and slightly higher
than attained by Brazil. The only disappointments in this sample have been
Cameron, Kenya, and Senegal with average growth rates between 1% and
tabLe 1 gDP Per caPita LeVeLS anD grOwth rateS 1980-2010 (PPP, cOnStant 2005 internatiOnaL $)
1980 1990 2000 2010 1980-1990 CAGR
1990-2000 CAGR
2000-2010 CAGR
1980-2010 CAGR
Botswana 3,433 6,948 9,531 12,459 7.3% 3.2% 2.7% 4.4%
Burkina Faso
622 681 866 1,127 0.9% 2.4% 2.7% 2.0%
Cameroon 2,007 2,082 1,853 2,046 0.4% -1.2% 1.0% 0.1%
Ethiopia n/a 545 527 934 n/a -0.3% 5.9% n/a
Ghana 993 907 1,067 1,469 -0.9% 1.6% 3.2% 1.3%
Kenya 1,375 1,421 1,283 1,477 0.3% -1.0% 1.4% 0.2%
Mauritius 3,729 6,115 9,154 12,270 5.1% 4.1% 3.0% 4.0%
Mozam-bique
440 400 506 845 -0.9% 2.4% 5.3% 2.2%
Nigeria 1,645 1,417 1,469 2,135 -1.5% 0.4% 3.8% 0.9%
Rwanda 815 726 661 1,044 -1.2% -0.9% 4.7% 0.8%
Senegal 1,531 1,478 1,525 1,732 -0.4% 0.3% 1.3% 0.4%
South Africa 8,763 7,975 7,641 9,476 -0.9% -0.4% 2.2% 0.3%
Tanzania n/a 860 866 1,286 n/a 0.1% 4.0% n/a
Uganda n/a 563 774 1,141 n/a 3.2% 4.0% n/a
Zambia 1,532 1,249 1,029 1,401 -2.0% -1.9% 3.1% -0.3%
Sub-Saha-ran Africa
1,790 1,617 1,575 2,041 -1.0% -0.3% 2.6% 0.4%
asian export-Led Growth
Korea, Rep. 5,544 11,383 18,730 27,027 7.5% 5.1% 3.7% 5.4%
Malaysia 4,867 6,607 10,209 13,186 3.1% 4.4% 2.6% 3.4%
Indonesia 1,323 2,008 2,623 3,880 4.3% 2.7% 4.0% 3.7%
brIcs
Brazil 7,567 7,175 7,909 10,056 -0.5% 1.0% 2.4% 1.0%
Russian Federation
n/a 12,626 8,613 14,183 n/a -3.8% 5.1% n/a
India 895 1,244 1,769 3,240 3.3% 3.6% 6.2% 4.4%
China 524 1,101 2,667 6,810 7.7% 9.3% 9.8% 8.9%
Source: world Development indicators (2011).
research december, 2011
9II.afrIcan economIc Performance In retrosPectIve /
1.4%. Both Ethiopia and Mozambique have averaged
more than 5% per year. Figure 1 also shows a modest
convergence for most African countries to the U.S. tech-
nology frontier in the last 10 years.
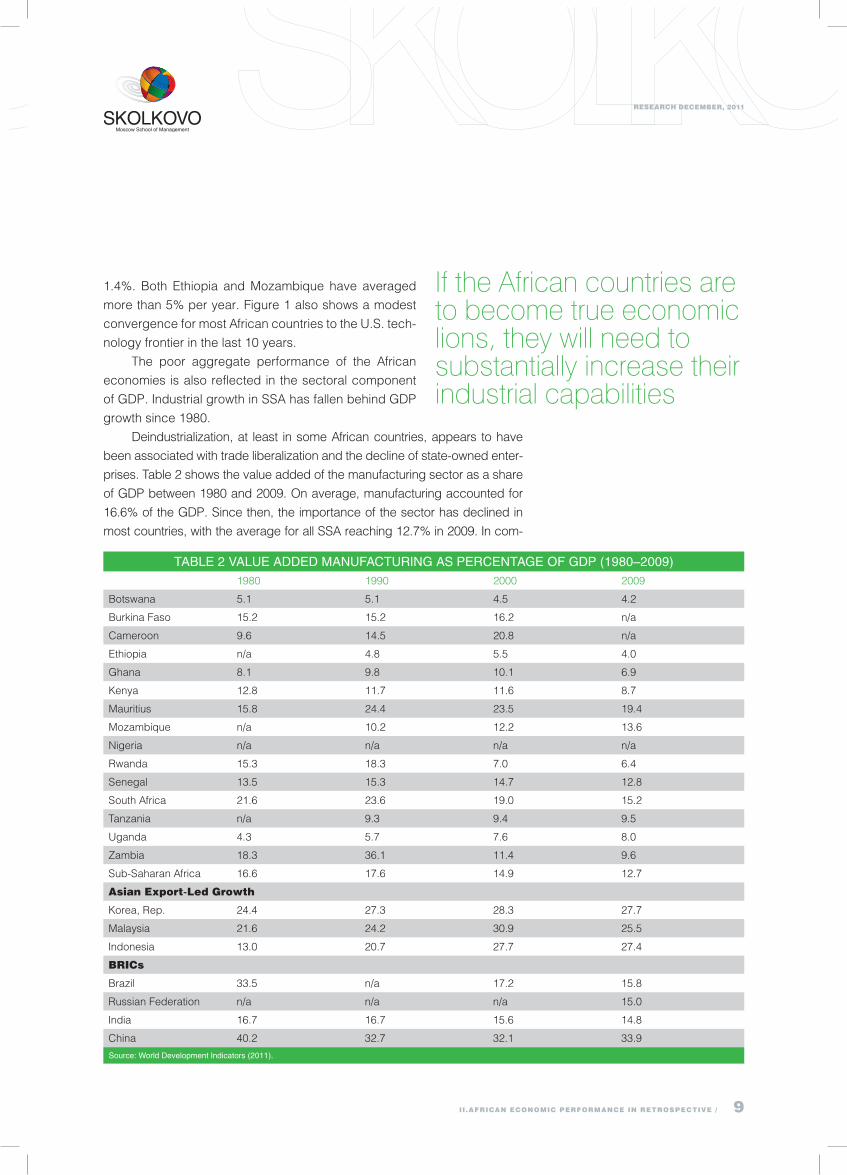
The poor aggregate performance of the African
economies is also reflected in the sectoral component
of GDP. Industrial growth in SSA has fallen behind GDP
growth since 1980.
Deindustrialization, at least in some African countries, appears to have
been associated with trade liberalization and the decline of state-owned enter-
prises. Table 2 shows the value added of the manufacturing sector as a share
of GDP between 1980 and 2009. On average, manufacturing accounted for
16.6% of the GDP. Since then, the importance of the sector has declined in
most countries, with the average for all SSA reaching 12.7% in 2009. In com-
tabLe 2 VaLue aDDeD manufacturing aS Percentage Of gDP (1980–2009)1980 1990 2000 2009
Botswana 5.1 5.1 4.5 4.2
Burkina Faso 15.2 15.2 16.2 n/a
Cameroon 9.6 14.5 20.8 n/a
Ethiopia n/a 4.8 5.5 4.0
Ghana 8.1 9.8 10.1 6.9
Kenya 12.8 11.7 11.6 8.7
Mauritius 15.8 24.4 23.5 19.4
Mozambique n/a 10.2 12.2 13.6
Nigeria n/a n/a n/a n/a
Rwanda 15.3 18.3 7.0 6.4
Senegal 13.5 15.3 14.7 12.8
South Africa 21.6 23.6 19.0 15.2
Tanzania n/a 9.3 9.4 9.5
Uganda 4.3 5.7 7.6 8.0
Zambia 18.3 36.1 11.4 9.6
Sub-Saharan Africa 16.6 17.6 14.9 12.7
asian export-Led Growth
Korea, Rep. 24.4 27.3 28.3 27.7
Malaysia 21.6 24.2 30.9 25.5
Indonesia 13.0 20.7 27.7 27.4
brIcs
Brazil 33.5 n/a 17.2 15.8
Russian Federation n/a n/a n/a 15.0
India 16.7 16.7 15.6 14.8
China 40.2 32.7 32.1 33.9
Source: world Development indicators (2011).
If the African countries are to become true economic lions, they will need to substantially increase their industrial capabilities
10 /II.afrIcan economIc Performance In retrosPectIve
research december, 2011
parison, South Korea, Malaysia, and Indonesia have more than 25% of their
GDPs generated by the manufacturing sector; in China, this number is around
34%. I will argue later that if the African countries are to become true economic
lions, they will need to substantially increase their industrial capabilities.
The countries that have historically managed to pull out of poverty are
those that have been successful in diversifying their economies away from
agriculture and natural resource-based activities. A productive agricultural
sector can provide inexpensive food and raw materials to start a process of
industrialization; however, in Africa, the agriculture sector has thus far failed
to become an engine of growth or economic transformation for most coun-
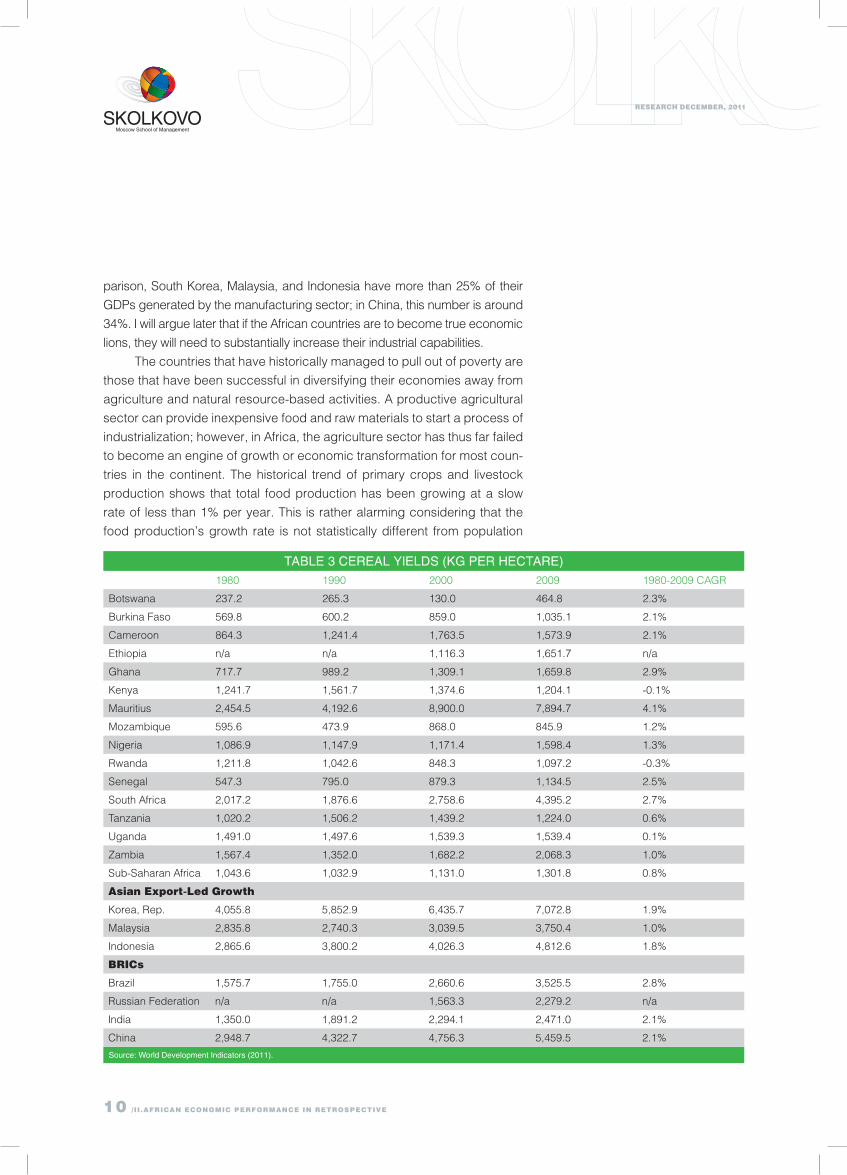
tries in the continent. The historical trend of primary crops and livestock
production shows that total food production has been growing at a slow
rate of less than 1% per year. This is rather alarming considering that the
food production’s growth rate is not statistically different from population
tabLe 3 cereaL yieLDS (kg Per hectare)1980 1990 2000 2009 1980-2009 CAGR
Botswana 237.2 265.3 130.0 464.8 2.3%
Burkina Faso 569.8 600.2 859.0 1,035.1 2.1%
Cameroon 864.3 1,241.4 1,763.5 1,573.9 2.1%
Ethiopia n/a n/a 1,116.3 1,651.7 n/a
Ghana 717.7 989.2 1,309.1 1,659.8 2.9%
Kenya 1,241.7 1,561.7 1,374.6 1,204.1 -0.1%
Mauritius 2,454.5 4,192.6 8,900.0 7,894.7 4.1%
Mozambique 595.6 473.9 868.0 845.9 1.2%
Nigeria 1,086.9 1,147.9 1,171.4 1,598.4 1.3%
Rwanda 1,211.8 1,042.6 848.3 1,097.2 -0.3%
Senegal 547.3 795.0 879.3 1,134.5 2.5%
South Africa 2,017.2 1,876.6 2,758.6 4,395.2 2.7%
Tanzania 1,020.2 1,506.2 1,439.2 1,224.0 0.6%
Uganda 1,491.0 1,497.6 1,539.3 1,539.4 0.1%
Zambia 1,567.4 1,352.0 1,682.2 2,068.3 1.0%
Sub-Saharan Africa 1,043.6 1,032.9 1,131.0 1,301.8 0.8%
asian export-Led Growth
Korea, Rep. 4,055.8 5,852.9 6,435.7 7,072.8 1.9%
Malaysia 2,835.8 2,740.3 3,039.5 3,750.4 1.0%
Indonesia 2,865.6 3,800.2 4,026.3 4,812.6 1.8%
brIcs
Brazil 1,575.7 1,755.0 2,660.6 3,525.5 2.8%
Russian Federation n/a n/a 1,563.3 2,279.2 n/a
India 1,350.0 1,891.2 2,294.1 2,471.0 2.1%
China 2,948.7 4,322.7 4,756.3 5,459.5 2.1%
Source: world Development indicators (2011).
research december, 2011
11II.afrIcan economIc Performance In retrosPectIve /
growth rate, which raises concerns about SSA’s ability to ensure against
food insecurity (Depetris Chauvin et al., 2011).
Table 3 displays cereal yields for SSA countries and other emerging
market economies between 1980 and 2009. On average, yields in the conti-
nent grew only 0.8% per year, far below the growth rates registered in emerg-
ing market economies. This slow growth is particularly worrying given the
initial average low yields. In the sample, only Mauritius and South Africa have
cereal yields of the same magnitude to ones observed in countries such as
China, South Korea, and Indonesia. Behind these low yields, there are a se-
ries of usual suspects: Agriculture activities in SSA are carried out mostly by
small farmers with little access to basics such as seeds, water, fertilizer, and
pesticides, let alone modern machineries and techniques. In addition, part of
the problem lies in the market structures and the poor institutions, policies,
and infrastructure serving the agriculture sector (Porto et al., 2011).
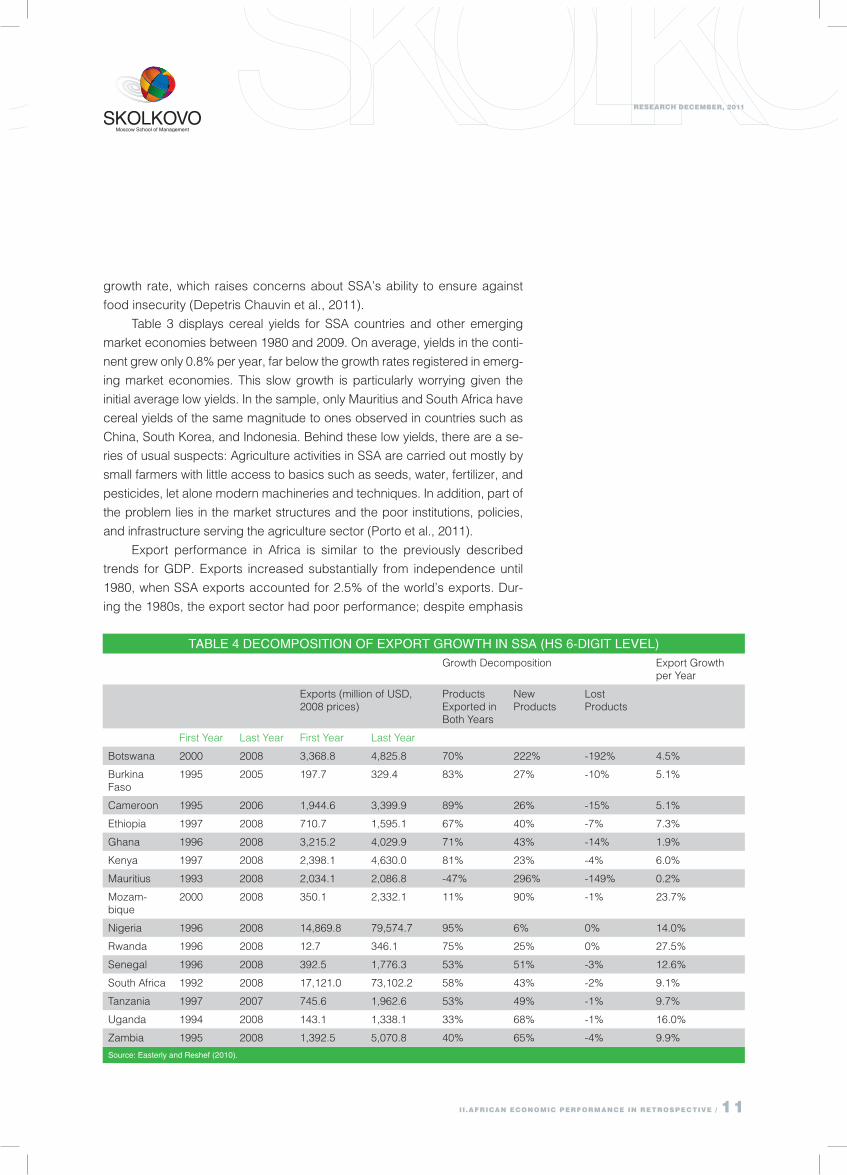
Export performance in Africa is similar to the previously described
trends for GDP. Exports increased substantially from independence until
1980, when SSA exports accounted for 2.5% of the world’s exports. Dur-
ing the 1980s, the export sector had poor performance; despite emphasis
tabLe 4 DecOmPOSitiOn Of exPOrt grOwth in SSa (hS 6-Digit LeVeL)Growth Decomposition Export Growth
per Year
Exports (million of USD, 2008 prices)
Products Exported in Both Years
New Products
Lost Products
First Year Last Year First Year Last Year
Botswana 2000 2008 3,368.8 4,825.8 70% 222% -192% 4.5%
Burkina Faso
1995 2005 197.7 329.4 83% 27% -10% 5.1%
Cameroon 1995 2006 1,944.6 3,399.9 89% 26% -15% 5.1%
Ethiopia 1997 2008 710.7 1,595.1 67% 40% -7% 7.3%
Ghana 1996 2008 3,215.2 4,029.9 71% 43% -14% 1.9%
Kenya 1997 2008 2,398.1 4,630.0 81% 23% -4% 6.0%
Mauritius 1993 2008 2,034.1 2,086.8 -47% 296% -149% 0.2%
Mozam-bique
2000 2008 350.1 2,332.1 11% 90% -1% 23.7%
Nigeria 1996 2008 14,869.8 79,574.7 95% 6% 0% 14.0%
Rwanda 1996 2008 12.7 346.1 75% 25% 0% 27.5%
Senegal 1996 2008 392.5 1,776.3 53% 51% -3% 12.6%
South Africa 1992 2008 17,121.0 73,102.2 58% 43% -2% 9.1%
Tanzania 1997 2007 745.6 1,962.6 53% 49% -1% 9.7%
Uganda 1994 2008 143.1 1,338.1 33% 68% -1% 16.0%
Zambia 1995 2008 1,392.5 5,070.8 40% 65% -4% 9.9%
Source: easterly and reshef (2010).
12 /II.afrIcan economIc Performance In retrosPectIve
research december, 2011
on trade liberalization and exports during the 1990s, the region accounted
for only 0.9% of the world’s exports in Year 2000 (see Table 5 for individual
country shares and comparison with emerging market economies). If the
focus is on only the past 10 or 15 years, the picture—as in the case of
GDP growth—is somewhat more promising. From 1994 to 2008, exports
per capita from Sub-Saharan Africa have increased an average of 13% per
year. This is compared with 4% for the United States, 8% for Germany, 13%
for India, and 19% for China (Easterly & Reshef, 2010). Among the countries
in Table 4’s sample, Mozambique, Nigeria, Rwanda, Senegal, and Uganda
have achieved double-digit annual growth rates in their exports.
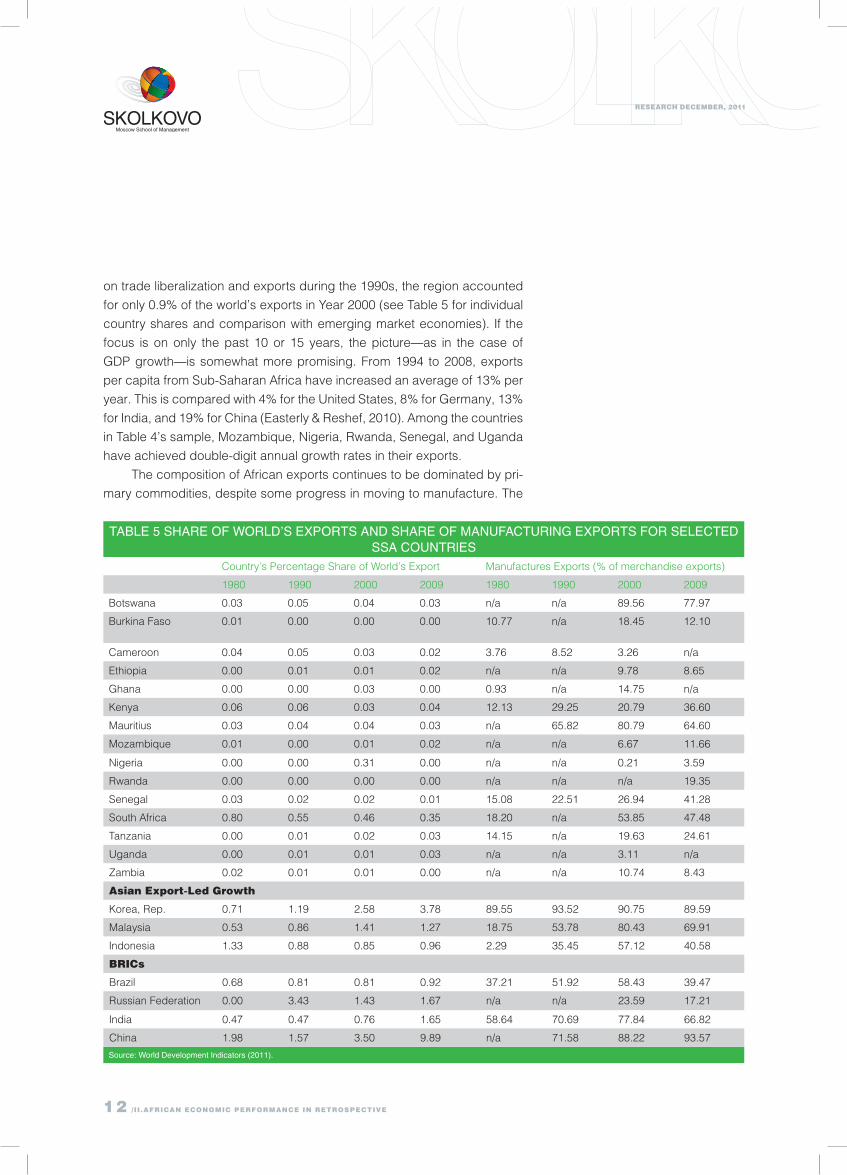
The composition of African exports continues to be dominated by pri-
mary commodities, despite some progress in moving to manufacture. The
tabLe 5 Share Of wOrLD’S exPOrtS anD Share Of manufacturing exPOrtS fOr SeLecteD SSa cOuntrieS
Country’s Percentage Share of World’s Export Manufactures Exports (% of merchandise exports)
1980 1990 2000 2009 1980 1990 2000 2009
Botswana 0.03 0.05 0.04 0.03 n/a n/a 89.56 77.97
Burkina Faso 0.01 0.00 0.00 0.00 10.77 n/a 18.45 12.10
Cameroon 0.04 0.05 0.03 0.02 3.76 8.52 3.26 n/a
Ethiopia 0.00 0.01 0.01 0.02 n/a n/a 9.78 8.65
Ghana 0.00 0.00 0.03 0.00 0.93 n/a 14.75 n/a
Kenya 0.06 0.06 0.03 0.04 12.13 29.25 20.79 36.60
Mauritius 0.03 0.04 0.04 0.03 n/a 65.82 80.79 64.60
Mozambique 0.01 0.00 0.01 0.02 n/a n/a 6.67 11.66
Nigeria 0.00 0.00 0.31 0.00 n/a n/a 0.21 3.59
Rwanda 0.00 0.00 0.00 0.00 n/a n/a n/a 19.35
Senegal 0.03 0.02 0.02 0.01 15.08 22.51 26.94 41.28
South Africa 0.80 0.55 0.46 0.35 18.20 n/a 53.85 47.48
Tanzania 0.00 0.01 0.02 0.03 14.15 n/a 19.63 24.61
Uganda 0.00 0.01 0.01 0.03 n/a n/a 3.11 n/a
Zambia 0.02 0.01 0.01 0.00 n/a n/a 10.74 8.43
asian export-Led Growth
Korea, Rep. 0.71 1.19 2.58 3.78 89.55 93.52 90.75 89.59
Malaysia 0.53 0.86 1.41 1.27 18.75 53.78 80.43 69.91
Indonesia 1.33 0.88 0.85 0.96 2.29 35.45 57.12 40.58
brIcs
Brazil 0.68 0.81 0.81 0.92 37.21 51.92 58.43 39.47
Russian Federation 0.00 3.43 1.43 1.67 n/a n/a 23.59 17.21
India 0.47 0.47 0.76 1.65 58.64 70.69 77.84 66.82
China 1.98 1.57 3.50 9.89 n/a 71.58 88.22 93.57
Source: world Development indicators (2011).
research december, 2011
13II.afrIcan economIc Performance In retrosPectIve /
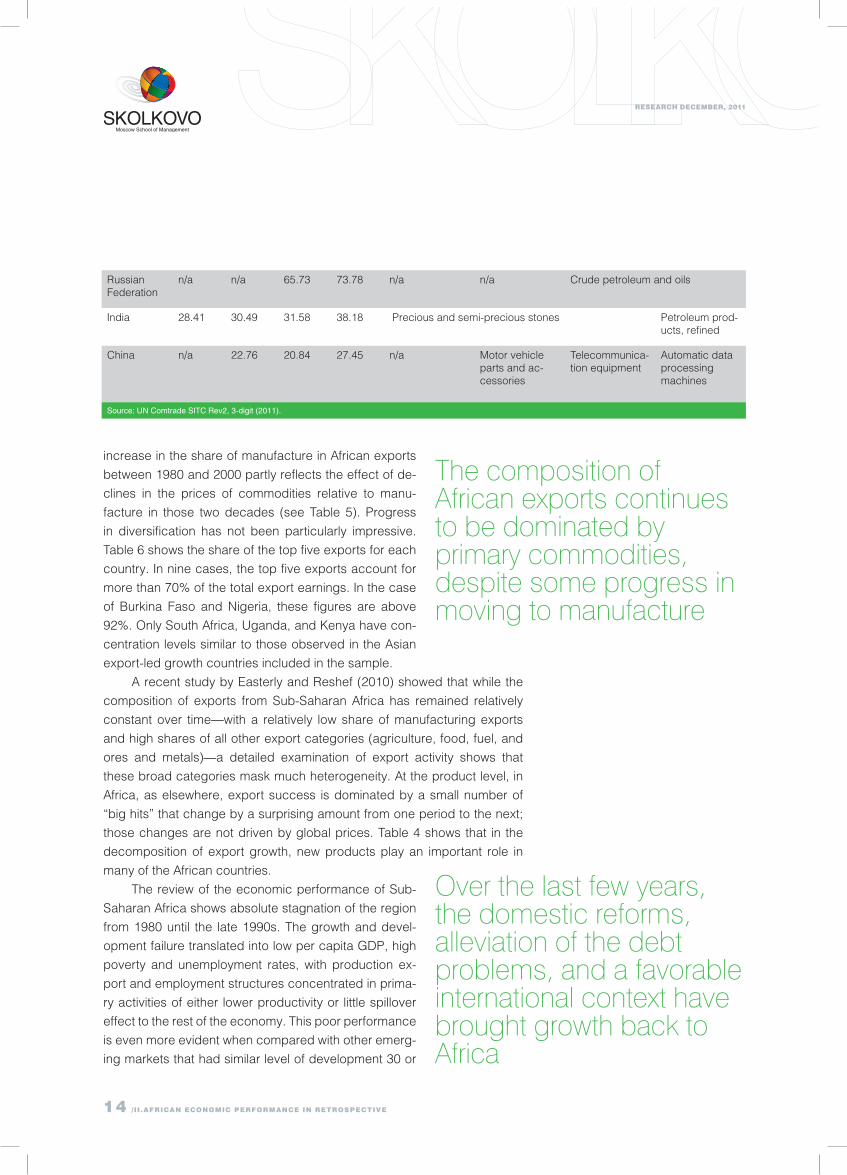
tabLe 6 Share Of tOP fiVe exPOrtS anD main exPOrt PrODuctSShare of Top Five Exports Most Important Export Product
1980 1990 2000 2010 1980 1990 2000 2010
Botswana n/a n/a 91.44 87.43 Precious and semi-precious stones
Burkina Faso
83.39 n/a 75.04 92.60 Cotton Cotton Gold Gold
Cameroon 87.44 80.32 78.95 77.80 Crude petroleum and oils
Ethiopia n/a n/a 86.89 76.04 n/a Coffee Coffee Coffee
Ghana n/a n/a 74.89 n/a Cocoa Cocoa Gold Gold
Kenya 70.95 52.41 61.43 46.26 Petroleum prod-ucts, refined
Tea Tea Tea
Mauritius 84.70 71.75 69.73 55.76 Sugar Under-garments, knitted or cro-cheted
Mozam-bique
n/a n/a 73.57 80.17 n/a n/a Crustaceans and molluscs, fresh, chilled, frozen, salted, etc
Aluminium
Nigeria n/a n/a 99.80 92.15 n/a n/a Crude petroleum and oils
Rwanda n/a n/a n/a 83.08 n/a n/a n/a Ores and concentrates of base metals
Senegal 62.35 61.02 64.82 58.88 Petroleum prod-ucts, refined
Fixed vegetable oils, soft, crude refined or puri-fied
Crustaceans and molluscs, fresh, chilled, frozen, salted, etc
Petroleum prod-ucts, refined
South Africa n/a n/a 34.59 41.17 n/a n/a Special transac-tions, commod-ity not classified
Silver, platinum and other metals of the platinum group
Tanzania n/a n/a n/a n/a n/a n/a Coconuts Gold
Uganda n/a n/a 64.90 38.75 n/a Coffee
Zambia n/a n/a 76.56 87.36 n/a n/a Copper
asian export-Led Growth
Korea, Rep. 23.71 27.34 38.55 41.70 Ships Thermionic, microcircuits, transis-tors, etc
Ships
Malaysia 70.10 43.73 50.64 40.57 Crude petro-leum and oils
Thermionic, microcircuits, transistors, etc
Indonesia 84.52 55.16 30.80 43.38 Crude petroleum and oils Gas, natural and manufactured
Coal, lignite and peat
brIcs
Brazil n/a 26.48 22.61 39.93 n/a Iron ore and concentrates
Aircraft and associated equipment
Iron ore and concentrates
14 /II.afrIcan economIc Performance In retrosPectIve
research december, 2011
Russian Federation
n/a n/a 65.73 73.78 n/a n/a Crude petroleum and oils
India 28.41 30.49 31.58 38.18 Precious and semi-precious stones Petroleum prod-ucts, refined
China n/a 22.76 20.84 27.45 n/a Motor vehicle parts and ac-cessories
Telecommunica-tion equipment
Automatic data processing machines
Source: un comtrade Sitc rev2, 3-digit (2011).
increase in the share of manufacture in African exports
between 1980 and 2000 partly reflects the effect of de-
clines in the prices of commodities relative to manu-
facture in those two decades (see Table 5). Progress
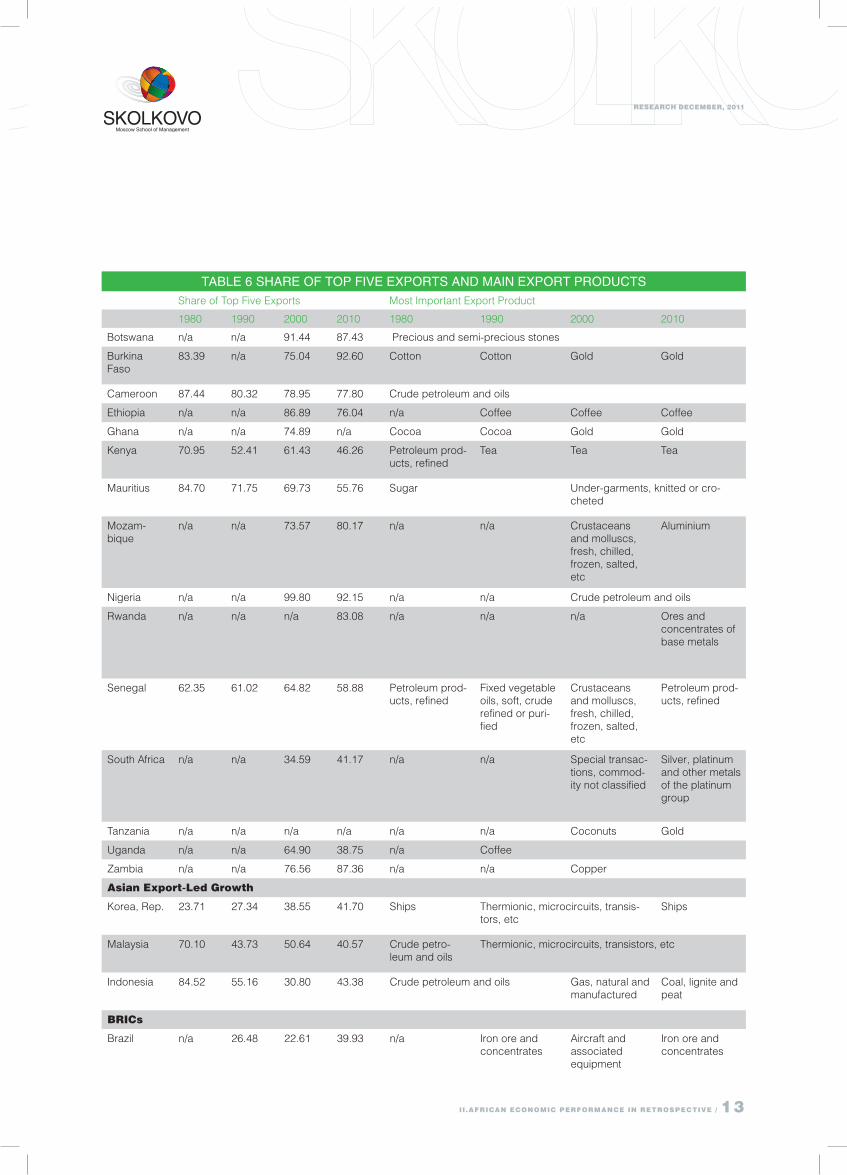
in diversification has not been particularly impressive.
Table 6 shows the share of the top five exports for each
country. In nine cases, the top five exports account for
more than 70% of the total export earnings. In the case
of Burkina Faso and Nigeria, these figures are above
92%. Only South Africa, Uganda, and Kenya have con-
centration levels similar to those observed in the Asian
export-led growth countries included in the sample.
A recent study by Easterly and Reshef (2010) showed that while the
composition of exports from Sub-Saharan Africa has remained relatively
constant over time—with a relatively low share of manufacturing exports
and high shares of all other export categories (agriculture, food, fuel, and
ores and metals)—a detailed examination of export activity shows that
these broad categories mask much heterogeneity. At the product level, in
Africa, as elsewhere, export success is dominated by a small number of
“big hits” that change by a surprising amount from one period to the next;
those changes are not driven by global prices. Table 4 shows that in the
decomposition of export growth, new products play an important role in
many of the African countries.
The review of the economic performance of Sub-
Saharan Africa shows absolute stagnation of the region
from 1980 until the late 1990s. The growth and devel-
opment failure translated into low per capita GDP, high
poverty and unemployment rates, with production ex-
port and employment structures concentrated in prima-
ry activities of either lower productivity or little spillover
effect to the rest of the economy. This poor performance
is even more evident when compared with other emerg-
ing markets that had similar level of development 30 or
The composition of African exports continues to be dominated by primary commodities, despite some progress in moving to manufacture
Over the last few years, the domestic reforms, alleviation of the debt problems, and a favorable international context have brought growth back to Africa
research december, 2011
15II.afrIcan economIc Performance In retrosPectIve /
40 years ago. However, over the last few years, the domestic reforms, al-
leviation of the debt problems, and a favorable international context have
brought growth back to Africa. This is the time for the African continent to
transform its economies and secure the path of prosperity of other emerg-
ing economies in recent years. The next section of this study focuses on the
future prospects for the continent.
16 /III. afrIca today and the road ahead
research december, 2011
iii. africa tODay
anD the rOaD aheaD
research december, 2011
17III.afrIca today and the road ahead /
DRIvING GROWTH IN AFRICA: COMMODITY BOOM OR GOOD POLICY?Growth has returned to Africa. Six of the 10 fastest-grow-
ing economies in the last 10 years are in Africa. There
seems to be dynamism and drive in the continent. Some
observers believe that Africa will play an increasingly im-
portant role in the global economy; others raise critical
questions on whether the current development is sustain-
able. Looking at the longer-term trends, many countries
seen as fast growers in 1970—such as the Ivory Coast—
are now stagnating. What can we learn from those expe-
riences? The sources of Africa’s increased economic momentum and likely
staying power are not well understood. Is the acceleration in growth a sign of
well-earned progress or the result of a commodity boom?
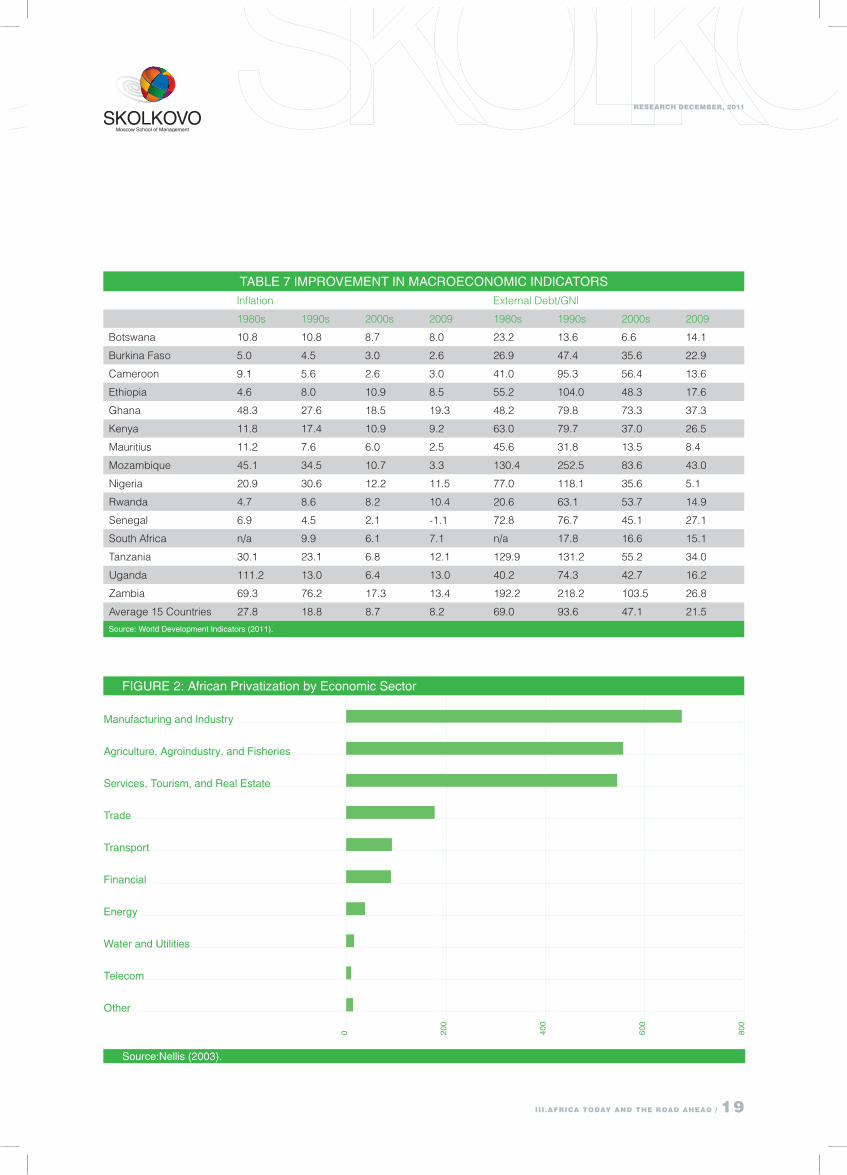
On one hand, the macroeconomic and business environment has
improved in most countries after nearly two decades of economic and
administrative reform, whereby inflation, budget deficits, and debt levels
were reduced (see Table 7). The reduction in external debt was particularly
dramatic because Heavily Indebted Poor Countries (HIPC) and Multilat-
eral Debt Reduction Initiative (MDRI) granted debt relief to several African
countries. In the sample of 15 Sub-Saharan African countries, the debt bur-
den—measured as the stock of external debt to GDP—decreased from an
average of 120% in 1994 to only 21% in 2009. During the last two decades,
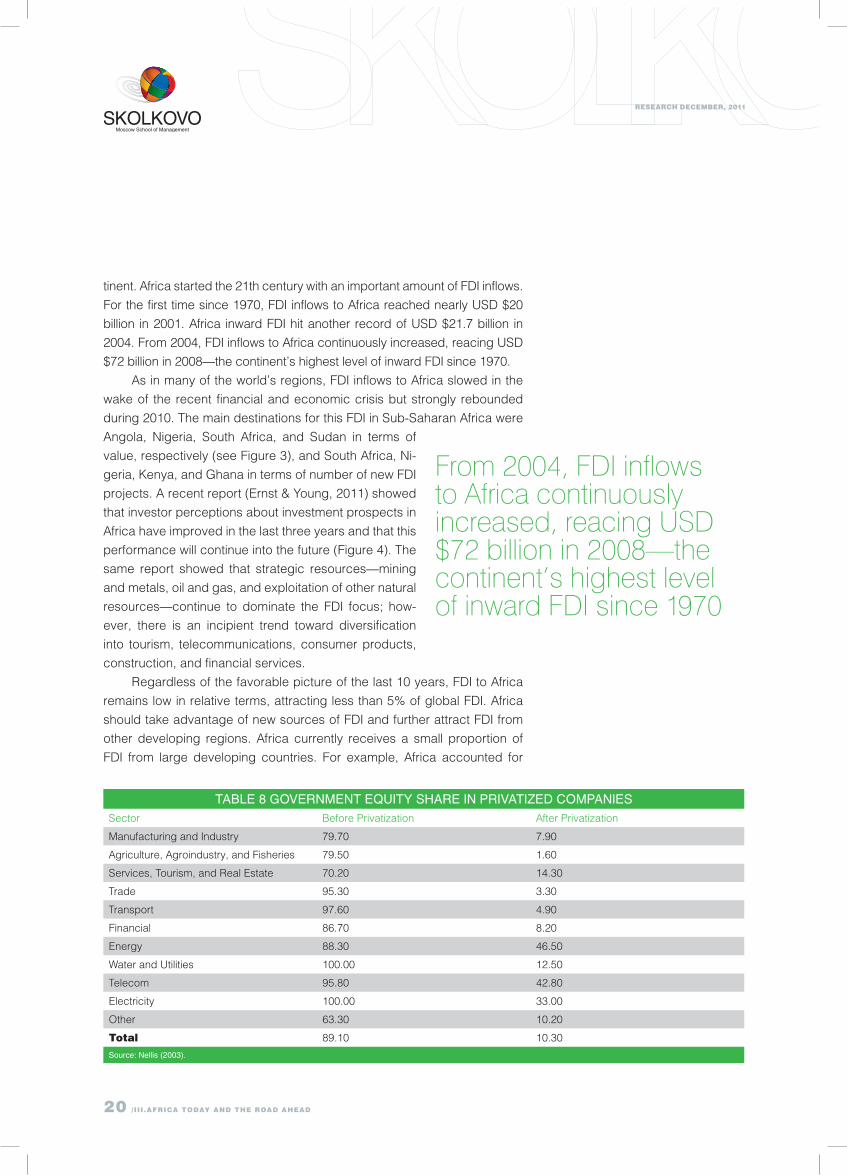
most state-owned companies were privatized. The process was particularly
intensive during the 1990s when privatization was a central element in re-
form programs. Between 1991 and 2002, there were about 2,300 privatiza-
tion transactions, generating a total sales value estimated in USD $9 billion.
Most of these privatizations took place in highly productive sector compa-
nies: Privatization in manufacturing and industry, agriculture, agroindustry,
and fisheries, and services, tourism and real estate accounted for 80% of
the total transactions (see Figure 2). As a result of the process, the govern-
ments’ equity share in the privatized companies was reduced from 89.1%
to only 10.3% (see Table 8).
Regulatory, legal, and business environments also improved. The
Africa Competitiveness Report (World Economic Forum, 2011) showed
improvements in several competitiveness indices for Sub-Saharan coun-
tries; however, on average, Sub-Saharan Africa is still outperformed by
Southeast Asia and all the BRIC economies. Only two countries from South
Sahara Africa figure in the top half of the overall rankings (out of 139 coun-
tries): South Africa (54th), and Mauritius (55th). Both countries are behind
China (27th) as well as behind Southeast Asia average and India (51st)
but ahead of Brazil (58th), Russia (63rd), and the other regional averages.
Growth has returned to Africa. Six of the 10 fastest-growing economies in the last 10 years are in Africa
18 /III.afrIca today and the road ahead
research december, 2011
Two countries—Namibia and Botswana—ranked 74th and 76th, respec-
tively, which are above the Latin American and the Caribbean averages.
The remaining Sub-Saharan African countries fare better than the regional
average: Rwanda (80th), Gambia (90th), Benin (103rd),
Senegal (104th), Kenya (106th), Cameroon (111th), Tan-
zania (113th), Ghana (114th), and Zambia (115th). The
Africa Competitiveness Report emphasizes the genu-
ine progress made by the continent in term of the first
generation of reforms. In addition to improvements in
the macroeconomic fundamentals already mentioned,
most economies have opened to trade and investment;
this has translated into an increase in labor productivity
growth that grew, on average, at -0.4% per year from
1980–2000 but at 2.8% since. However, according to
the report, substantial challenges remain: The top fac-
tors affecting business in most African countries been
insufficient access to financing, corruption, and inadequate infrastructure.
Despite the encouraging numbers, many economists account for Af-
rica’s recent performance as part of the commodity price boom. Surely,
Africa has benefited from the surge in commodity prices over the past dec-
ade. The data shows that the fastest-growing economies are ones exporting
oils and other minerals. Yet, the commodity boom explains only part of Af-
rica’s broader growth story. Natural resources—and the related government
spending they financed—generated just 32% of Africa’s GDP growth from
2000 through 2009 (McKinsey, 2009); the remaining two-thirds came from
other sectors, including wholesale and retail, transportation, telecommuni-
cations, real estate, expansion of the banking sector, and manufacturing.
Economic growth accelerated across the continent, with 27 of its 30 largest
economies growing, including resource-rich economies and others with less
generous natural endowments. The key reasons behind this growth surge in-
cluded government action to end armed conflicts, improved macroeconomic
conditions, and microeconomic reforms to create a better business climate.
The question that remains whether the growth rates observed over the
last few years can be maintained. It is likely that such growth is unsustain-
able for all but the most handsomely endowed countries; for the majority,
a steady long-term increase in per capita GDP will be predicated on deep-
ening the tradable goods sector—both manufacturing and services—and
exporting an increasingly more sophisticated mix of goods (Yusuf, 2011).
As shown next, there are a few positive trends in this regard.
FOREIGN DIRECT INvESTMENT FLOWING TO AFRICAIn addition to growth, foreign direct investment (FDI) has returned to the con-
Substantial challenges remain: The top factors affecting business in most African countries been insufficient access to financing, corruption, and inadequate infrastructure
research december, 2011
19III.afrIca today and the road ahead /
manufacturing and industry
agriculture, agroindustry, and fisheries
Services, tourism, and real estate
trade
transport
financial
energy
water and utilities
telecom
Other
figure 2: african Privatization by economic Sector
0 200
400
600
800
Source:nellis (2003).
tabLe 7 imPrOVement in macrOecOnOmic inDicatOrSInflation External Debt/GNI
1980s 1990s 2000s 2009 1980s 1990s 2000s 2009
Botswana 10.8 10.8 8.7 8.0 23.2 13.6 6.6 14.1
Burkina Faso 5.0 4.5 3.0 2.6 26.9 47.4 35.6 22.9
Cameroon 9.1 5.6 2.6 3.0 41.0 95.3 56.4 13.6
Ethiopia 4.6 8.0 10.9 8.5 55.2 104.0 48.3 17.6
Ghana 48.3 27.6 18.5 19.3 48.2 79.8 73.3 37.3
Kenya 11.8 17.4 10.9 9.2 63.0 79.7 37.0 26.5
Mauritius 11.2 7.6 6.0 2.5 45.6 31.8 13.5 8.4
Mozambique 45.1 34.5 10.7 3.3 130.4 252.5 83.6 43.0
Nigeria 20.9 30.6 12.2 11.5 77.0 118.1 35.6 5.1
Rwanda 4.7 8.6 8.2 10.4 20.6 63.1 53.7 14.9
Senegal 6.9 4.5 2.1 -1.1 72.8 76.7 45.1 27.1
South Africa n/a 9.9 6.1 7.1 n/a 17.8 16.6 15.1
Tanzania 30.1 23.1 6.8 12.1 129.9 131.2 55.2 34.0
Uganda 111.2 13.0 6.4 13.0 40.2 74.3 42.7 16.2
Zambia 69.3 76.2 17.3 13.4 192.2 218.2 103.5 26.8
Average 15 Countries 27.8 18.8 8.7 8.2 69.0 93.6 47.1 21.5
Source: world Development indicators (2011).
20 /III.afrIca today and the road ahead
research december, 2011
tinent. Africa started the 21th century with an important amount of FDI inflows.
For the first time since 1970, FDI inflows to Africa reached nearly USD $20
billion in 2001. Africa inward FDI hit another record of USD $21.7 billion in
2004. From 2004, FDI inflows to Africa continuously increased, reacing USD
$72 billion in 2008—the continent’s highest level of inward FDI since 1970.
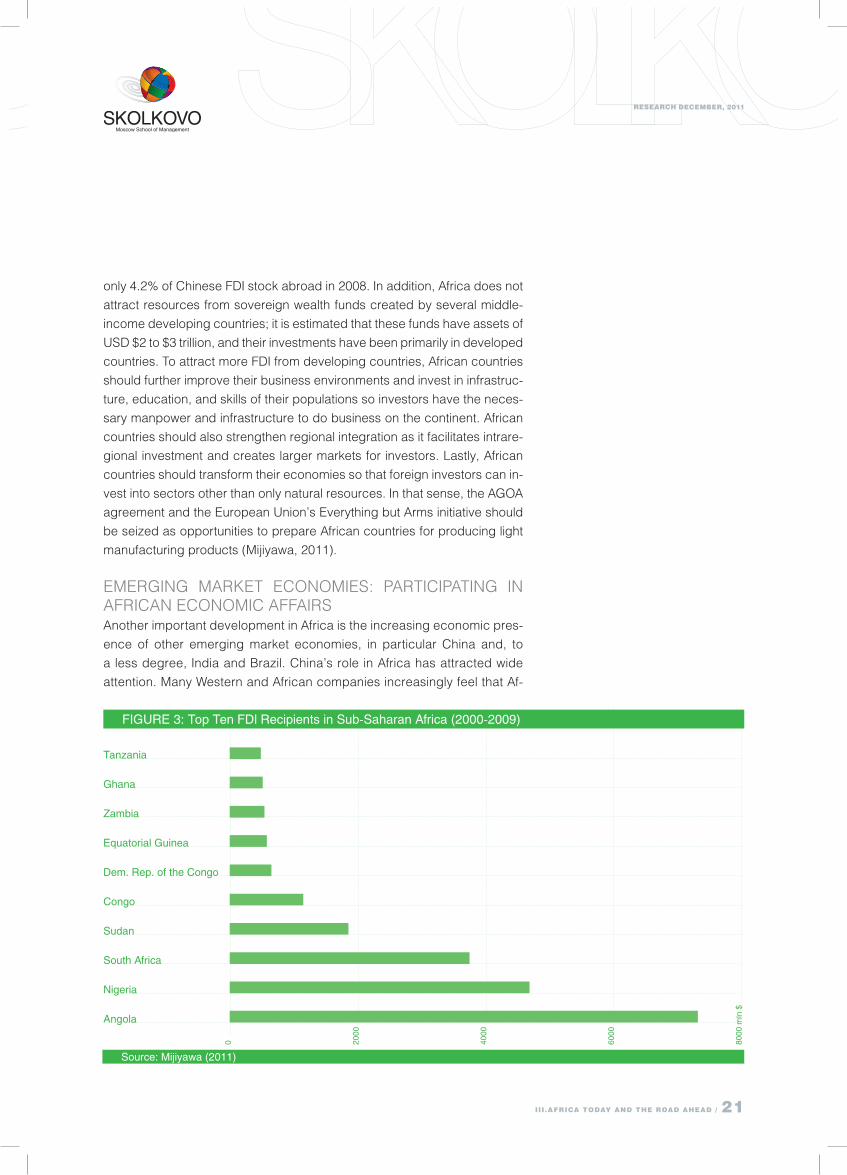
As in many of the world’s regions, FDI inflows to Africa slowed in the
wake of the recent financial and economic crisis but strongly rebounded
during 2010. The main destinations for this FDI in Sub-Saharan Africa were
Angola, Nigeria, South Africa, and Sudan in terms of
value, respectively (see Figure 3), and South Africa, Ni-
geria, Kenya, and Ghana in terms of number of new FDI
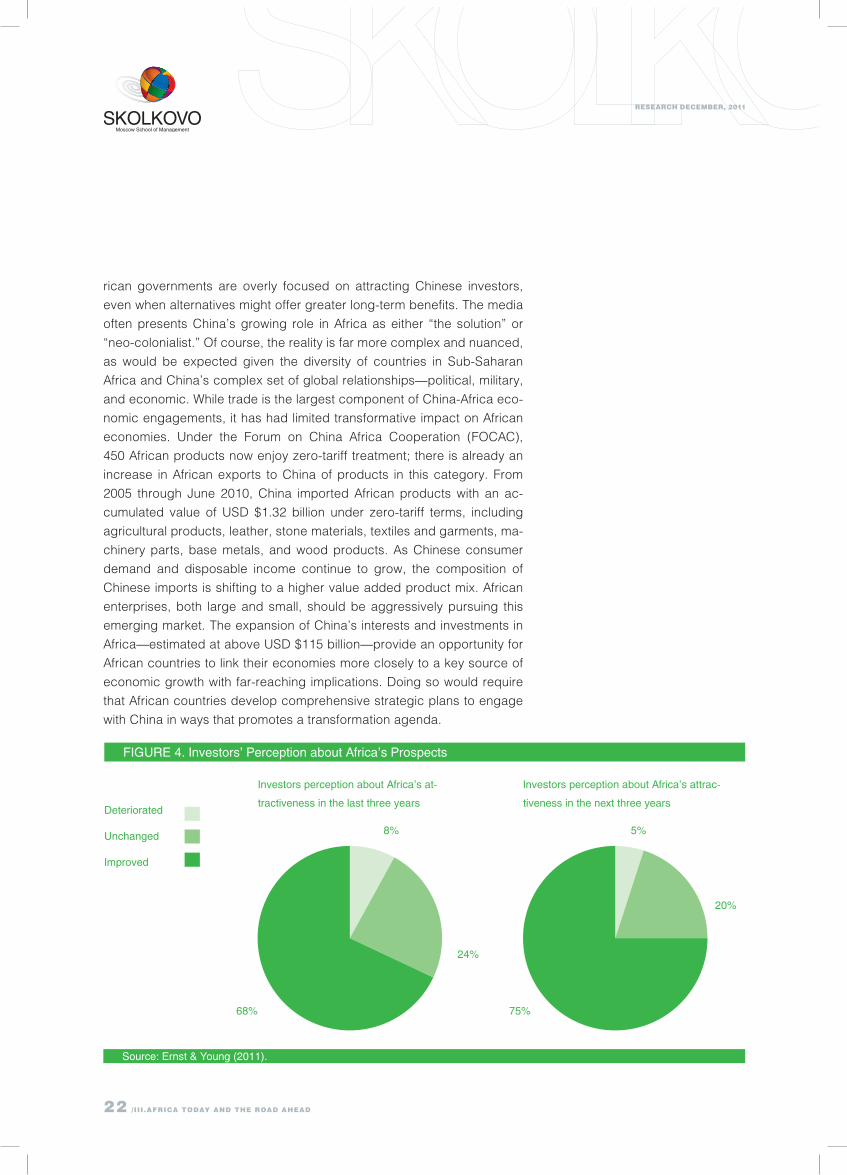
projects. A recent report (Ernst & Young, 2011) showed
that investor perceptions about investment prospects in
Africa have improved in the last three years and that this
performance will continue into the future (Figure 4). The
same report showed that strategic resources—mining
and metals, oil and gas, and exploitation of other natural
resources—continue to dominate the FDI focus; how-
ever, there is an incipient trend toward diversification
into tourism, telecommunications, consumer products,
construction, and financial services.
Regardless of the favorable picture of the last 10 years, FDI to Africa
remains low in relative terms, attracting less than 5% of global FDI. Africa
should take advantage of new sources of FDI and further attract FDI from
other developing regions. Africa currently receives a small proportion of
FDI from large developing countries. For example, Africa accounted for
tabLe 8 gOVernment equity Share in PriVatiZeD cOmPanieSSector Before Privatization After Privatization
Manufacturing and Industry 79.70 7.90
Agriculture, Agroindustry, and Fisheries 79.50 1.60
Services, Tourism, and Real Estate 70.20 14.30
Trade 95.30 3.30
Transport 97.60 4.90
Financial 86.70 8.20
Energy 88.30 46.50
Water and Utilities 100.00 12.50
Telecom 95.80 42.80
Electricity 100.00 33.00
Other 63.30 10.20
total 89.10 10.30
Source: nellis (2003).
From 2004, FDI inflows to Africa continuously increased, reacing USD $72 billion in 2008—the continent’s highest level of inward FDI since 1970
research december, 2011
21III.afrIca today and the road ahead /
tanzania
ghana
Zambia
equatorial guinea
Dem. rep. of the congo
congo
Sudan
South africa
nigeria
angola
figure 3: top ten fDi recipients in Sub-Saharan africa (2000-2009)
Source: mijiyawa (2011)
0 2000
4000
6000
8000
mln
$
only 4.2% of Chinese FDI stock abroad in 2008. In addition, Africa does not
attract resources from sovereign wealth funds created by several middle-
income developing countries; it is estimated that these funds have assets of
USD $2 to $3 trillion, and their investments have been primarily in developed
countries. To attract more FDI from developing countries, African countries
should further improve their business environments and invest in infrastruc-
ture, education, and skills of their populations so investors have the neces-
sary manpower and infrastructure to do business on the continent. African
countries should also strengthen regional integration as it facilitates intrare-
gional investment and creates larger markets for investors. Lastly, African
countries should transform their economies so that foreign investors can in-
vest into sectors other than only natural resources. In that sense, the AGOA
agreement and the European Union’s Everything but Arms initiative should
be seized as opportunities to prepare African countries for producing light
manufacturing products (Mijiyawa, 2011).
EMERGING MARKET ECONOMIES: PARTICIPATING IN AFRICAN ECONOMIC AFFAIRS Another important development in Africa is the increasing economic pres-
ence of other emerging market economies, in particular China and, to
a less degree, India and Brazil. China’s role in Africa has attracted wide
attention. Many Western and African companies increasingly feel that Af-
22 /III.afrIca today and the road ahead
research december, 2011
rican governments are overly focused on attracting Chinese investors,
even when alternatives might offer greater long-term benefits. The media
often presents China’s growing role in Africa as either “the solution” or
“neo-colonialist.” Of course, the reality is far more complex and nuanced,
as would be expected given the diversity of countries in Sub-Saharan
Africa and China’s complex set of global relationships—political, military,
and economic. While trade is the largest component of China-Africa eco-
nomic engagements, it has had limited transformative impact on African
economies. Under the Forum on China Africa Cooperation (FOCAC),
450 African products now enjoy zero-tariff treatment; there is already an
increase in African exports to China of products in this category. From
2005 through June 2010, China imported African products with an ac-
cumulated value of USD $1.32 billion under zero-tariff terms, including
agricultural products, leather, stone materials, textiles and garments, ma-
chinery parts, base metals, and wood products. As Chinese consumer
demand and disposable income continue to grow, the composition of
Chinese imports is shifting to a higher value added product mix. African
enterprises, both large and small, should be aggressively pursuing this
emerging market. The expansion of China’s interests and investments in
Africa—estimated at above USD $115 billion—provide an opportunity for
African countries to link their economies more closely to a key source of
economic growth with far-reaching implications. Doing so would require
that African countries develop comprehensive strategic plans to engage
with China in ways that promotes a transformation agenda.
figure 4. investors’ Perception about africa’s Prospects
Source: ernst & young (2011).
Deteriorated
unchanged
improved
8% 5%
24%
20%
68% 75%
investors perception about africa’s at-
tractiveness in the last three years
investors perception about africa’s attrac-
tiveness in the next three years
research december, 2011
23III.afrIca today and the road ahead /
PRIvATE SECTOR AND THE TRANSFORMATION PROCESSSome interesting private sector trends and opportunities could enable
economic transformation in Africa. The first is a growing recognition of
the importance of complex value chains that require more integrated and
systemic thinking to maximize value for countries and companies. This is
leading governments and companies to become more sophisticated about
finding win-win opportunities in these value chains. Examples are the re-
newed interest in local content policies and the creation of agricultural
growth corridors such as the one in Tanzania. A second private sector trend
is the greater awareness of the transformative power of “soft infrastructure,”
particularly around enabling transactions, providing access to information,
and basic financial services for previously excluded or underserved popu-
lations. For example, the experience in Kenya with mobile financial trans-
actions reveals the power of ICT to enable financial inclusion and broader
economic growth. There is also a greater recognition among African com-
panies of the importance of development, retention, and mobility of em-
ployable skills/talent for competitive success. A further trend involving the
private sector is the possibility that leapfrogging to decentralized solutions
might shift some challenges to allow wider private sector participation and
competition in sectors traditionally the domain of the public sector (for ex-
ample, in energy with solar home lighting systems that shift some of the
rural electrification burden to the private sector).
INDUSTRIAL POLICIES AND URBANIZATION STRATE-GIES: BACK ON THE POLICY AGENDAThere is increasing interest in African industrial policies. Inspired by the
performance of other emerging markets and new theories of structural
economics, countries are seeking to target industries compatible with com-
parative advantage. The sectors targeted often follow five criteria:
1. Growth and employment potential and scope for the privately
owned SMEs playing a leading role in the development of the selected
activity.
2. Modest capital intensity consistent with relative national resource
endowment.
3. Existing domestic market supported by a supply chain and a mar-
keting infrastructure.
4. Availability of most raw materials domestically or through conveni-
ent importation.
5. Transferability of labor skills needed to other industries.
For example, applying these criteria to Nigeria generates a list of
products including leather goods, consumer electronics, certain auto
24 /III.afrIca today and the road ahead
research december, 2011
parts, motorcycles, tractors, and a variety of petrochemical products, in-
cluding fertilizers. So far, most of the active industrial policy in Africa has
been conducted using Special Economic Zones (SEZs), as they continue
to be viewed as an instrument for testing the edges of policies that can
build political support for an export-led growth strategy before introducing it
more widely. In Africa, the experience with SEZs in Mauritius, Ghana, Mada-
gascar, and Lesotho has encouraged policymakers to believe that SEZs
can supplement nationwide policy initiatives to jumpstart industrialization.
viewed as one piece of an integrated export-oriented industrial strategy—
complemented by financial, infrastructure, skill development, and education
policies—SEZs could add value, but much depends upon the government’s
capacity to design an effective policy framework and implement policies in
coordinated manner (Yusuf, 2011).
Rapid and sustained long-term growth with rising employment will need
to be grounded not just in macro and industrial policies but also in urbaniza-
tion strategies, centered on key cities across Africa. The Asian experience
suggests that unless Africa’s cities hold onto the talented
and create opportunities for entrepreneurs, other policy
levers will not work. Industrial clusters are more likely to
germinate and grow in urban environments that are well
furnished with services providers, infrastructure, good
transport linkages, housing, and amenities valued by the
industrial workforce (Yusuf, 2011). Urbanization is an up-
ward trend across the continent, and getting it right would
be the key to the future success of the African Econom-
ic Lions. Mid-sized cities and urban corridors are set to
become increasingly important in the African economy.
Companies located close to these centers of activity will
be able to benefit from demand from foreign investors and
from general economic generation (Ernst & Young, 2011).
GOOD PERSPECTIvES Despite the crisis, international conditions are still favorable for most Afri-
can countries. The current rapid growth and urbanization in emerging mar-
kets—likely to continue—are influencing the consumption of commodities
and, therefore, their prices. The region’s low-cost labor, large and growing
internal market, and natural resources hold considerable potential for the
next 20 years (Standard Charted, 2010). The key challenges will be provid-
ing infrastructure and jobs for a population that is predicted to increase by
50% between 2010 and 2030. While Asia’s demand for commodities and
the Chinese investments in African infrastructure will help, a problem with
Rapid and sustained long-term growth with rising employment will need to be grounded not just in macro and industrial policies but also in urbanization strategies, centered on key cities across Africa
research december, 2011
25III.afrIca today and the road ahead /
commodity-driven growth is that it does not generate jobs. The develop-
ment of a non-commodity economy will be vital; this will require substantial
investment in infrastructure and human capital by local governments. Afri-
can governments need to prioritize and sequence reforms and investments
in the business environment and infrastructure to unleash the potential for
growth in their industries, bringing together policies to promote competitive-
ness within a coherent strategy rather than as a series of ad hoc interven-
tions that, in isolation, are likely to be ineffective.
These are good times for Africa, and the elusive path to prosperity
seems at hand for the first time in many decades. Hopes are high in the
continent: grounded in improved macroeconomic frameworks and policies,
the rise of an African middle-class, and the opportunity presented by tighter
links with fast-growing emerging markets. The future will depend on wheth-
er African policymakers grasp this opportunity, get the drivers of economic
transformation right, and transform—once and for all—the economy of a
continent that holds 20% percent of the world’s land, 15% of its population,
but just 4% of global GDP.
AUTHOR:Nicolas M. Depetris Chauvin, Ph.D. (African Center for Economic Transfor-
mation & visiting Senior Research Fellow at SIEMS)
EDITOR-IN-CHIEF:Sam Park, Ph.D. (President of SIEMS)
CONTACTS:[email protected]
26
research november, 2011
REFERENCES
• Boston Consulting Group (2010): “The African Challengers: Global Competitors Emerge from the Overlook
Continent.” Available at http://www.bcg.com/documents/file44610.pdf
• Depetris Chauvin, N., F. Mulangu, and G. Porto (2011): “Food Production and Consumption in Sub-Saharan
Africa.” African Center for Economic Transformation. Background paper for the First African Human Develop-
ment Report, UNDP.
• Easterly, W. and A. Reshef (2010): “African Export Successes: Surprises, Stylized Facts, and Explanations.”
NBER Working Paper No. 16597.
• Ernst & Young (2011): “It’s time for Africa.” Africa attractiveness survey 2011. Available at http://www.ey.com/
Publication/vwLUAssets/2011_Africa_Attractiveness_Survey/$FILE/11EDA187_attractiveness_africa_low_res-
olution_final.pdf
• McKinsey (2009): “What’s driving Africa’s growth?” McKinsey Quarterly. Available at http://www.mckinseyquar-
terly.com/Whats_driving_Africas_growth_2601
• Mijiyawa, A. (2011): “FDI inflows in Africa: Trends, Sources, and Sectoral Distribution.” Unpublished manuscript.
African Center for Economic Transformation.
• Nellis, J. (2003): “Privatization in Africa: What has happened? What is to be done?” Center for Global Develop-
ment, Working Paper No. 25. Available at http://www.cgdev.org/files/ 2765_file_cgd_wp025.pdf
• Porto, G., N. Depetris Chauvin, and M. Olarreaga (2011): “Supply Chains in Export Agriculture, Competition,
and Poverty in Sub-Saharan Africa.”
• Standard Charted (2010): “The Super-Cycle Report.” Standard Charted Global Research. Available at http://
www.standardchartered.com/id/_documents/press-releases/en/ The%20Super-cycle%20Report-12112010-fi-
nal.pdf
• World Bank (2011): “”Sub-Saharan Africa: Recovery and New Risks.” Regional Economic Outlook, April 2011.
• World Economic Forum (2011): “The Africa Competitiveness Report 2011”.
• Yusuf, S. (2011): “Bringing Export-Led Growth to Africa”. African Center for Economic Transformation.
research november, 2011
27
SiemS reSearch mOnthLy briefS
vol. 09-01 “The global financial crisis: impact and responses in China and Russia” (February 2009).
vol. 09-02 “Managing through the global recession: Opportunities and strategic responses in China and Rus-
sia” (March 2009).
vol. 09-03 “Global expansion of emerging multinationals: postcrisis adjustment” (May 2009).
vol. 09-04 “Operational challenges facing emerging multinationals from Russia and China” (June 2009).
vol. 09-05 “MNC Operations in Emerging Markets: Post-Crisis Adjustments of FDI Inflows in China and Rus-
sia” (August 2009).
vol. 09-06 “Is Demographics Destiny? How Demographic Changes Will Alter the Economic Futures of the BRICs”
(September 2009).
vol. 09-07 “Executive leadership structure in China and Russia” (December 2009).
vol. 10-01 “Size Matters: Just How Big Are The BRICs?” (January 2010).
vol. 10-02 “Decoupling Revisited: Can the BRICs Really Go Their Own Way?“ (February 2010).
vol. 10-03 “The “New Geography” of International Trade “How the Emerging Markets are Rapidly Changing
Global Trade” (March 2010).
vol. 10-04 “Chief Executive Officer Turnover in China and Russia: Implications for Corporate Governance
and Strategic Management” (April 2010).
vol. 10-05 “Sovereign Wealth Funds and the New Era of BRIC Wealth” (July 2010).
vol. 10-06 “Corporate Giants and Economic Growth — A Case for China and Russia” (August 2010).
vol. 10-07 “Is Low Wage Manufacturing in China Disappearing? - Who will be the World’s next Workshop?”
(November 2010).
vol. 11-01 “The New Oil Paradigm: Can the Developing World Live with $100 Plus Oil?” (January 2011).
vol. 11-02 “Beyond Business, Not Beyond Government: How Corporate Social Responsibility Leaders in
China and Russia Do Philanthropy” (February 2011)
vol. 11-03 “All Roads Lead to Rome: High Performance Firms in China and Russia” (June 2011).
vol. 11-04 “Stock Market Development and Performance in the Emerging Economies” (July 2011).
vol. 11-05 “The Political Dimension Of Doing Good: Managing the State Through Csr In Russia And China”
(August 2011).
vol. 11-06 “Food Prices: Drivers and Welfare Impacts in Emerging Market Economies” (September 2011).
vol. 11-07 “The Rapid Ascendency of the Emerging World’s Financial Markets. A Snapshot of their Develop-
ment” (September 2011).
vol. 11-08 “World Financial Crisis and Emerging Market Bank Performance: A Bank Efficiency Study” (Sep-
tember 2011).
vol. 11-09 “The Rising Cost of Doing Business in Emerging Markets: Targeting Entrepreneurs in Tough Eco-
nomic Times” (October 2011).
vol. 11-10 “victimizer, victim or What: Unraveling the Multinational Corporation’s Public Crisis in China and
Russia” (November 2011).
vol. 11-11 “African Lions in the Making” (December 2011).
SiemS iSSue rePOrtS
vol. 10-01 “The World’s Top Auto Markets in 2030: Emerging Markets Transforming the Global Automotive
Industry” (May 2010).
vol. 10-02 “The Productivity Prize. Accounting for Recent Economic Growth among the BRICs: Miracle or
Mirage?” (June 2010).
vol. 10-03 “The Great Equalizer. The Rise of the Emerging Market Global Middle Class” (September 2010).
vol. 10-04 “Central Bank Independence and the Global Financial Meltdown: A view from the Emerging Mar-
kets” (November 2010).
vol. 11-01 “Brave New World, Categorizing the Emerging Market Economies – A New Methodology, SKOLK-
OvO Emerging Market Index” (February 2011).
vol. 11-02 “The New Geography of Capital Flows” (March 2011).
vol. 11-03 “All That’s Old is New Again: Capital Controls and the Macroeconomic Determinants of Entrepre-
neurship in Emerging Markets” (April 2011).
research december, 2011
29III.afrIca today and the road ahead / 29III.afrIca today and the road ahead /
[email protected] www.skolkovo.ru
The Moscow school of Management skolkovo
is a joint project of Russian and international business
representatives, who joined their efforts to create a
business new-generation school from scratch. Focus-
ing on practical knowledge, the Moscow School of
Management dedicates itself to training leaders, who
intend to implement their professional knowledge in the
conditions of rapidly developing markets. SKOLKOvO
is defined by: leadership and business undertakings,
rapidly developing markets focus, innovative approach
towards educational methods.
The Moscow School of Management SKOLKOvO proj-
ect is fulfilled by the governmental-private partnership
within the framework of the Education Foreground Na-
tional Project. The project is financed by private inves-
tors, and doesn’t use governmental budget recourses.
The President of the Russian Federation Dmitry Ana-
tolyevich Medvedev is Chairman of the SKOLKOvO In-
ternational Advisory Board.
Since 2006 SKOLKOvO conducts short educational
Executive Education programmes for top and medium-
level managers – open programmes and specialized,
integrated modules based on the companies requests.
SKOLKOvO launched Executive МВА programme in
January 2009, first class of the international Full-time
MBA programme – in September 2009.
Moscow school of Management skolkovoNovaya ul. 100, Skolkovo village,
Odintsovsky district,
Moscow region, Russia
tel.: +7 495 580 30 03, fax: +7 495 994 46 68
skolkovo institute for Emerging Market studiesUnit 1607-1608, North Star Times Tower
No. 8 Beichendong Road, Chaoyang District
Beijing, 100101, China
tel./fax: +86 10 6498 1634
The skolkovo institute for Emerging Market studies (siEMs) is a knowledge centre at the Mos-
cow School of Management SKOLKOvO that special-
izes in the research of the economies and businesses
of the emerging markets. It provides a research plat-
form that attracts and links leading thinkers and ex-
perts from around the world, who can collaborate on
studying timely and critical issues in emerging markets.
Its research is rigorous, field-driven, and comparative
across emerging markets and offers practical, broadly
applicable, and valuable guidelines and frameworks for
business leaders, entrepreneurs, policy-makers, and
academics with interests in emerging markets.
It currently has offices in Moscow and Beijing and plans
to open the India office in the near future. Its research-
ers include several full-time and part-time research fel-
lows who are leading scholars and experts in various
fields. Its current research focus covers economic and
financial development, firm growth and sustainabil-
ity, CSR practices, and indigenous innovations in fast
growing countries. Its research output is distributed
through various forms of reports, publications, forums,
and seminars. We welcome feedback and suggestions
from our readers on the research findings and future
research directions.
moscow School of management SkOLkOVOnovaya ul. 100, Skolkovo village,Odintsovsky district,moscow region, russia tel.: +7 495 580 30 03, fax: +7 495 994 46 [email protected] SkOLkOVO institute for emerging market Studiesunit 1607-1608, north Star times towerno. 8 beichendong road, chaoyang Districtbeijing, 100101, chinatel./fax: +86 10 6498 1634
ernst & young is a global leader in assurance, tax, transaction and advisory services. worldwide, our 144,000 people are united by our shared values and an unwavering commitment to quality. we make a difference by helping our people, our clients and our wider communities achieve their potential.
with the opening of our moscow office in 1989, we were the first professional services firm to establish operations in the commonwealth of independent States. ernst & young expands its services and resources in accordance with clients’ needs throughout the ciS. 3,400 professionals work at 16 offices throughout the ciS in moscow, St. Petersburg, novosibirsk, ekaterinburg, togliatti, yuzhno-Sakhalinsk, almaty, astana, atyrau, baku, kyiv, Donetsk, tashkent, tbilisi, yerevan, and minsk.
across all industries, and at local and international levels, our professionals are recognized for their leadership, know-how, and delivery of accomplished results. we aim to help you identify and reduce business risks, find solutions that will work, and open new opportunities for your company. through more than 20 years of our operations in the ciS, we have provided the critical information and the trusted resources to pave the way for improved business performance and profitability.
ernst & young Sadovnicheskaya nab. 77, bld. 1 | 115035 moscow | russia Phone: +7 (495) 755 9700 fax: +7 (495) 755 9701 e-mail: [email protected] website: www.ey.com