Embed Size (px)
Citation preview
https://doi.org/10.5559/di.29.2.01
AGE- AND CAUSE-SPECIFICCOMPONENTS OF RECENTLIFE EXPECTANCYIMPROVEMENTS IN CROATIA,SERBIA AND SLOVENIAAleša LOTRIČ DOLINARSchool of Economics and Business, Ljubljana
Ivan ČIPIN, Petra ME\IMURECFaculty of Economics and Business, Zagreb
Jelena STOJILKOVIĆ GNJATOVIĆFaculty of Geography, Belgrade
Jože SAMBTSchool of Economics and Business, Ljubljana
UDK: 314.118(497.5+497.11+497.4)”200”Izvorni znanstveni rad
Primljeno: 20. 6. 2019.
All ex-Yugoslav countries experienced improvements in life ex-pectancy during the last few decades. This study describes andcompares recent life expectancy trends in Croatia, Serbia andSlovenia. What age groups and what causes of death accountfor the largest mortality declines? Have the three countries joinedthe cardiovascular revolution? Do patterns differ between coun-tries? And, is there room for further improvements? We use lifetables and decomposition methods to address these questions.Our key findings are: 1) lower mortality from circulatory diseasesat older ages contributed most to life expectancy growth 2001–2017 for both sexes in all three countries; 2) despite this com-mon pattern, life expectancy in Slovenia grew fastest and thegap between countries increased; 3) under the Slovenian age--specific cardiovascular mortality schedule, Croatia added 1.79years to both female and male life expectancies, while Serbiaadded 3.97 and 3.26 to female and male life expectancies.
Keywords: life expectancy, age- and cause-specific mortality,past and potential gains in life expectancy, decompositionanalysis, ex-Yugoslav countries
Jože Sambt, School of Economics and Business, University ofLjubljana, Kardeljeva ploščad 17, 1000 Ljubljana, Slovenia.E-mail: [email protected]
�
INTRODUCTIONDemographic transition – i.e., a long-term shift from high tolow death and birth rates (e.g., Kirk, 1996) – inevitably leadsto population ageing: fewer births increase the share of olderpeople and longer lives augment their numbers. A nicknamefor this widespread phenomenon has already been coined,'the silver tsunami' (e.g., Bartels & Naslund, 2013).
Life expectancy has been increasing worldwide over thelast two centuries (Oeppen & Vaupel, 2002). While at thebeginning of the demographic transition, most of the gains inlife expectancy came as a result of declining infant and childmortality, developed countries are nowadays at the forefrontof the 'longevity transition' (Eggleston & Fuchs, 2012), where-in most of the gains in life expectancy are realised later in life.Thus, the economic and social burden of raising children thatis typical of the onset of the demographic transition has now-adays shifted towards securing support for the elderly. Eventhe most developed countries are struggling to find resourcesfor the retirement income, health care costs and long-term carefor the bulging elderly population (Ogura & Jakovljevic, 2014).The growing burden of the ageing population necessitates apolicy response, but insufficient fiscal capacities often limit thescope of policy interventions.
The theory of epidemiologic transition (Omran, 1971) pro-vides a framework for a more detailed explanation of mortalitydecline over the course of the demographic transition. Thetheory posits that initial gains in life expectancy are driven bydeclining mortality from communicable diseases that mainlyaffect the young. During the final transition stage, mortalityfrom communicable diseases drops to very low levels, with de-generative diseases or 'lifestyle illnesses' (e.g., diseases of thecirculatory system or neoplasms) emerging as the leading causeof death (Eggleston & Fuchs, 2012; Canudas-Romo & Schoen,2005; Klenk, Keil, Jaensch, Christiansen, & Nagel, 2016). The endresult of the epidemiologic transition is a slow-down in life ex-pectancy growth. This, however, has not proven to be the ex-perience of developed countries, where life expectancy con-tinued to rise rather quickly throughout the latter half of thetwentieth century (Timonin et al., 2016), with most of the im-provements arising from declining cardiovascular mortality(Grigoriev et al., 2014). The health transition theory (Frenk, Bo-badilla, Stern, Frejka, & Lozano, 1991) has established a broaderframework to explain these developments, and subsequentextensions of the model (Vallin & Meslé, 2004) introduce theconcept of the 'cardiovascular revolution' (steady reductions incardiovascular mortality) as a major contributor to contempo-rary increases in life expectancy (Foege, 1987; Vallin & Meslé,2004).176
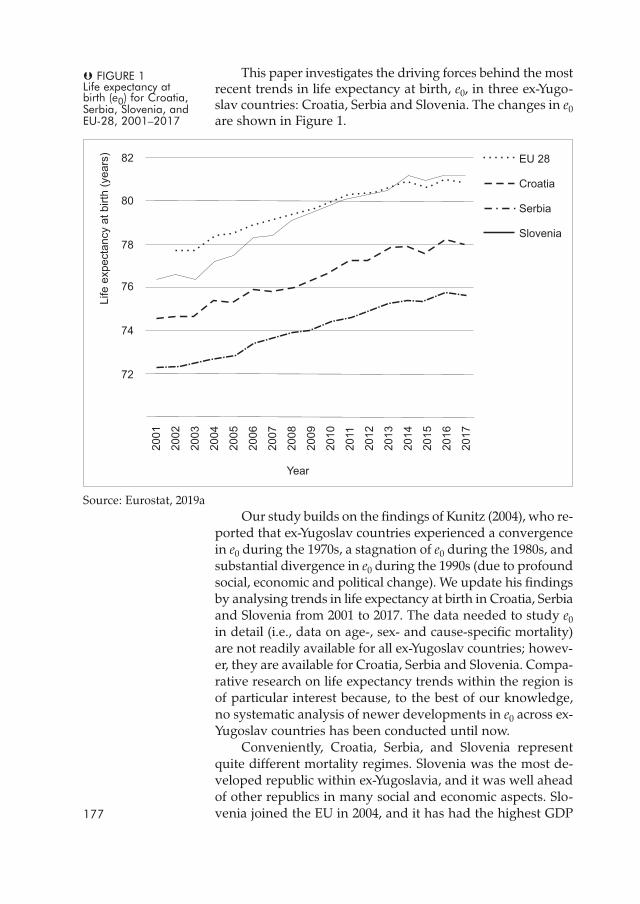
This paper investigates the driving forces behind the mostrecent trends in life expectancy at birth, e0, in three ex-Yugo-slav countries: Croatia, Serbia and Slovenia. The changes in e0are shown in Figure 1.
Source: Eurostat, 2019aOur study builds on the findings of Kunitz (2004), who re-
ported that ex-Yugoslav countries experienced a convergencein e0 during the 1970s, a stagnation of e0 during the 1980s, andsubstantial divergence in e0 during the 1990s (due to profoundsocial, economic and political change). We update his findingsby analysing trends in life expectancy at birth in Croatia, Serbiaand Slovenia from 2001 to 2017. The data needed to study e0in detail (i.e., data on age-, sex- and cause-specific mortality)are not readily available for all ex-Yugoslav countries; howev-er, they are available for Croatia, Serbia and Slovenia. Compa-rative research on life expectancy trends within the region isof particular interest because, to the best of our knowledge,no systematic analysis of newer developments in e0 across ex-Yugoslav countries has been conducted until now.
Conveniently, Croatia, Serbia, and Slovenia representquite different mortality regimes. Slovenia was the most de-veloped republic within ex-Yugoslavia, and it was well aheadof other republics in many social and economic aspects. Slo-venia joined the EU in 2004, and it has had the highest GDP177
� FIGURE 1Life expectancy atbirth (e0) for Croatia,Serbia, Slovenia, andEU-28, 2001–2017
per capita and the highest e0 compared with all other ex-Yu-goslav countries. Compared to other South-Eastern Europeancountries, the health expenditure of the countries that joinedthe EU in 2004 grew most rapidly over the 1989–2012 periodand, coupled with growing societal welfare, ultimately led tolongevity gains (Jakovljevic, Vukovic, & Fontanesi, 2016). Slo-venian e0 today surpasses the EU-28 average (see Figure 1).Croatia, an EU member since 2013, experienced war devasta-tion both in terms of lives lost and infrastructure damage dur-ing the 1990s. During and after the war, the health care sys-tem had to overcome a serious shortage of resources (Kovačić& Šošić, 1998). Serbia has been negotiating its EU accessionsince 2014. Although Serbia had no direct war conflicts in itsterritory, it experienced an economic collapse and a deterio-ration of public health infrastructure, both of which wereexacerbated by UN and US sanctions (Garfield, 2001). Serbiais at the bottom end of the e0 spectrum, with the lowest e0 inthe region (Eurostat, 2019a).
As Figure 1 shows, between 2001 and 2017, life expectan-cy at birth increased in all three countries, but not to the sameextent. Life expectancy at birth increased most for Slovenianmen, and least for Croatian women.
In this paper, we not only describe and compare theabove-mentioned trends in life expectancy at birth in Croatia,Serbia and Slovenia, but we also broaden the understandingof within- and between-country variations in e0 by decompos-ing changes by age and cause of death. Our main goal is toidentify age-cause-specific contributions to gains in e0, sepa-rately by sex. Several research questions guide the analysis:What drove the latest increase in life expectancy at birth?More specifically, what age groups and what causes of deathaccount for the largest mortality declines? Have the threecountries joined the cardiovascular revolution? Do patternsdiffer between countries? And is there room for furtherimprovements? We use life tables and decomposition meth-ods to address these questions.
The remainder of this paper is organised as follows. Inthe next section, we describe the data and methods. Followingthat, we present the results and in the last section we concludewith a policy-oriented discussion of our main findings.
DATA AND METHODSIn analysing life expectancy at birth, we used Eurostat data onthe Croatian, Serbian and Slovenian populations by age groupand sex (Eurostat, 2019b), and data on the number of deathsby sex, age group, and the cause of death provided by nation-al institutes of the three countries (Croatian Bureau of Statis-tics, 2019; Statistical Office of the Republic of Serbia, 2019;178
DRU[. ISTRA@. ZAGREBGOD. 29 (2020), BR. 2,STR. 175-193
LOTRIČ DOLINAR, A.ET AL.:AGE- AND CAUSE...
National Institute of Public Health, Slovenia, 2019). Our analy-sis begins in the year 2001 when all three countries adoptedcomparable death recording methodologies, with the latestdata on cause of death referring to 2017.
We used data on deaths in 5-year age groups, with thefirst age group (less than 5 years) split into two (aged less than1 and aged 1–4), because of the mortality peak in infancy.
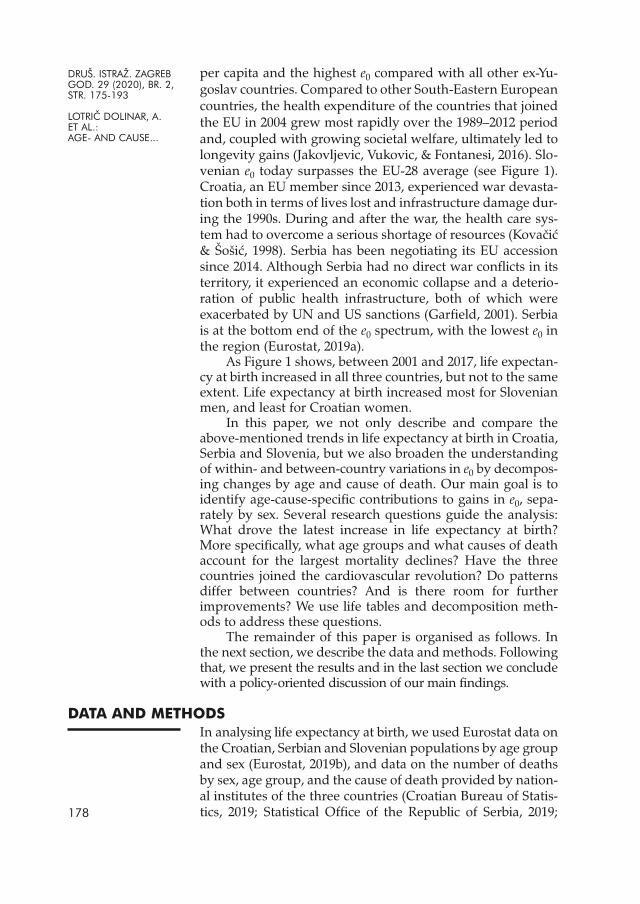
We analysed deaths by the five main groups of causes ofdeath (ICD-10), which accounted for more than 80% of alldeaths in the EU over the last years (just below 90% in Cro-atia, around 86% in Serbia, and slightly above 90% in Slove-nia): 1) diseases of the circulatory system, 2) neoplasms, 3)diseases of the respiratory system, 4) diseases of the digestivesystem, and 5) external causes of morbidity and mortality.Age-standardised cause-specific mortality rates for 2016 usingthe European standard population (Eurostat, 2013) are pre-sented in Figure 2.
Source: Eurostat, 2019c (the latest available data for age-standardised cause-specific mortalityrates are for 2016)
All the remaining causes of death are combined in a groupcalled 'other causes of death', where the main causes vary byage and also by country (with the exception of the youngestage, when other causes of death mainly refer to perinatal com-plications in all analysed countries).179
DRU[. ISTRA@. ZAGREBGOD. 29 (2020), BR. 2,STR. 175-193
LOTRIČ DOLINAR, A.ET AL.:AGE- AND CAUSE...
� FIGURE 2Age-standardisedcause-specificmortality rates (deathsper 100 000inhabitants) for fivemajor groups ofcauses of death in2016 in Croatia,Serbia, Slovenia, andEU-28
Life tables and life expectancy at birth e0We performed the analysis of life expectancy using life tables,which are statistical models describing age-specific mortalityrates of an actual population in a given year (Malačič, 2006;Kintner, 2003). A life table is a rectangular matrix which showshow various life table functions, such as probability of dyingand number of survivors, change with age (Shkolnikov, 2015)and, as such, imitate the dying-off process. We used abridgedperiod life tables for 5-year age groups. We began by calculat-ing death rates nmx by age and cause of death, separately formen and women, from which all other functions in the lifetable were then derived. Life expectancy at birth e0 shows theaverage remaining lifetime (in years) for a newborn, assumingthat throughout his or her life the mortality pattern would beaccording to the life table. It is the most synthetic and widelyused measure of mortality. Because it is not affected by agedistribution and is therefore comparable geographically andacross time, it is traditionally also used as one of the indicatorsof country development.
Decomposition of e0 changeTo distinguish contributions to the observed increase in e0 dueto specific age groups and causes of death, we performed thee0 decomposition. We decomposed the change in e0 from theage perspective using the Pressat (1985) formula, which fixes theshortcomings of the underlying approaches by Arriaga (1984)and Pollard (1988):
ωe0
t+i – e0t ≅ ∑ [0.5 (lxt + lxt+i) (ext+i – ext) – 0,5 (lx+nt + lx+nt+i) (ex+nt+i – ex+nt)] / 100 000
x=0
where notations represent the standard life table functionswith a 100 000 radix, and t and t + i denote different points intime, different countries, or any other different populations.
In addition to this decomposition of e0 change by age, wesimultaneously conducted decomposition by cause of death(Arriaga, 1995). This technique requires mutually exclusiveand exhaustive causes of death (this is the reason for gener-ating the sixth group of causes of death, called 'other'). Usingthis procedure, we assumed that the contribution cSACj(nex) ofan individual cause of death c to the age specific life expectan-cy change in each age group j SACj (nex) was proportional tothe share of mortality change cCj due to the relevant cause ofdeath in the relevant age group within the change Cj of thetotal mortality rate in the same age group:
cSACj (nex) = SACj (nex) cCj / Cj ,
where cCj =cmjt+i – cmj
t and Cj = ∑ cCj .c180
Potential gains in life expectancy (PGLE)The approach presented in the previous section can be usedalso for decomposing potential gains in life expectancy by age(Liu et al., 2014; Tsai, Lee, & Hardy, 1978), after elimination ofan individual cause or for decomposing the difference in e0between two countries simultaneously by age and cause.
The increase in life expectancy due to reduced mortalityfrom an individual cause of death can be estimated in differ-ent ways. It is often assumed that a particular cause of deathcan be either completely or partially eliminated (Tsai et al., 1978).
To calculate potential gains in life expectancy (PGLEs) foreach country sex combination using an individual cause elim-ination approach, we prepared six separate life tables (one foreach of the five major causes of death plus one for 'other'causes). In every life table we eliminated a different cause ofdeath, assuming no changes in the other causes of death. Suchlife tables are called cause-deleted life tables (Beltrán-Sánches,Preston, & Canudas-Romo, 2008). Compared with the masterlife table, the only difference is the number of deaths for theanalysed cause, which is now set to 0, whereas the number ofdeaths for the other causes remains unchanged. Cause-elimi-nation life tables thus answer the hypothetical question ofhow much lower mortality could be expected if a particularcause of death was eliminated. The obtained PGLEs can betherefore considered to be a measure of importance of eachcause of death. By constructing cause deleted life tables, it isassumed that there are no interdependencies between thecauses of death. In reality, however, eradication of a certaindisease is likely to result in an increase in other diseases, espe-cially in older ages, when people often have more than oneillness (Kintner, 2003; Manton, Patrick, & Stallard, 1980).
Of course, complete elimination of certain causes ofdeath is unrealistic and PGLE serves mostly as an indicator ofthe importance of a cause of death. In addition to PGLEs basedon cause-deleted life tables, we therefore calculated also theeffects of partial reduction in mortality for each cause (Tsai etal., 1978). We decomposed the hypothetical increase in e0 ifthe probability of dying of a certain country could decrease tothe level of a comparable country with lower mortality.
We took Slovenia as a benchmark because it is compara-ble with Croatia and Serbia (the three countries shared morethan 70 years of common history in the twentieth century) andbecause it is the best performing country among the three (from2014 on, its e0 has been higher than the EU-28 average). Wecalculated the increase in e0 for Croatia and Serbia under the as-sumption that by 2017 the Croatian and Serbian probabilitiesnqx would have decreased to Slovenian levels. By decompos-181
ing this difference, we identified age groups and causes of deathwhere there are the most possibilities for improvement.
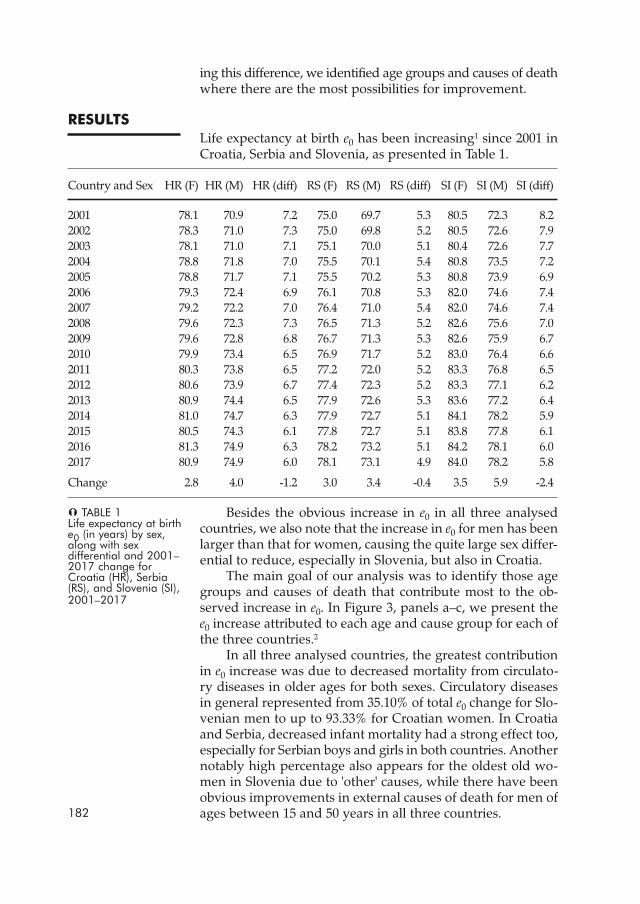
RESULTSLife expectancy at birth e0 has been increasing1 since 2001 inCroatia, Serbia and Slovenia, as presented in Table 1.
Country and Sex HR (F) HR (M) HR (diff) RS (F) RS (M) RS (diff) SI (F) SI (M) SI (diff)
2001 78.1 70.9 7.2 75.0 69.7 5.3 80.5 72.3 8.22002 78.3 71.0 7.3 75.0 69.8 5.2 80.5 72.6 7.92003 78.1 71.0 7.1 75.1 70.0 5.1 80.4 72.6 7.72004 78.8 71.8 7.0 75.5 70.1 5.4 80.8 73.5 7.22005 78.8 71.7 7.1 75.5 70.2 5.3 80.8 73.9 6.92006 79.3 72.4 6.9 76.1 70.8 5.3 82.0 74.6 7.42007 79.2 72.2 7.0 76.4 71.0 5.4 82.0 74.6 7.42008 79.6 72.3 7.3 76.5 71.3 5.2 82.6 75.6 7.02009 79.6 72.8 6.8 76.7 71.3 5.3 82.6 75.9 6.72010 79.9 73.4 6.5 76.9 71.7 5.2 83.0 76.4 6.62011 80.3 73.8 6.5 77.2 72.0 5.2 83.3 76.8 6.52012 80.6 73.9 6.7 77.4 72.3 5.2 83.3 77.1 6.22013 80.9 74.4 6.5 77.9 72.6 5.3 83.6 77.2 6.42014 81.0 74.7 6.3 77.9 72.7 5.1 84.1 78.2 5.92015 80.5 74.3 6.1 77.8 72.7 5.1 83.8 77.8 6.12016 81.3 74.9 6.3 78.2 73.2 5.1 84.2 78.1 6.02017 80.9 74.9 6.0 78.1 73.1 4.9 84.0 78.2 5.8
Change 2.8 4.0 -1.2 3.0 3.4 -0.4 3.5 5.9 -2.4
Besides the obvious increase in e0 in all three analysedcountries, we also note that the increase in e0 for men has beenlarger than that for women, causing the quite large sex differ-ential to reduce, especially in Slovenia, but also in Croatia.
The main goal of our analysis was to identify those agegroups and causes of death that contribute most to the ob-served increase in e0. In Figure 3, panels a–c, we present thee0 increase attributed to each age and cause group for each ofthe three countries.2
In all three analysed countries, the greatest contributionin e0 increase was due to decreased mortality from circulato-ry diseases in older ages for both sexes. Circulatory diseasesin general represented from 35.10% of total e0 change for Slo-venian men to up to 93.33% for Croatian women. In Croatiaand Serbia, decreased infant mortality had a strong effect too,especially for Serbian boys and girls in both countries. Anothernotably high percentage also appears for the oldest old wo-men in Slovenia due to 'other' causes, while there have beenobvious improvements in external causes of death for men ofages between 15 and 50 years in all three countries.182
� TABLE 1Life expectancy at birthe0 (in years) by sex,along with sexdifferential and 2001–2017 change forCroatia (HR), Serbia(RS), and Slovenia (SI),2001–2017
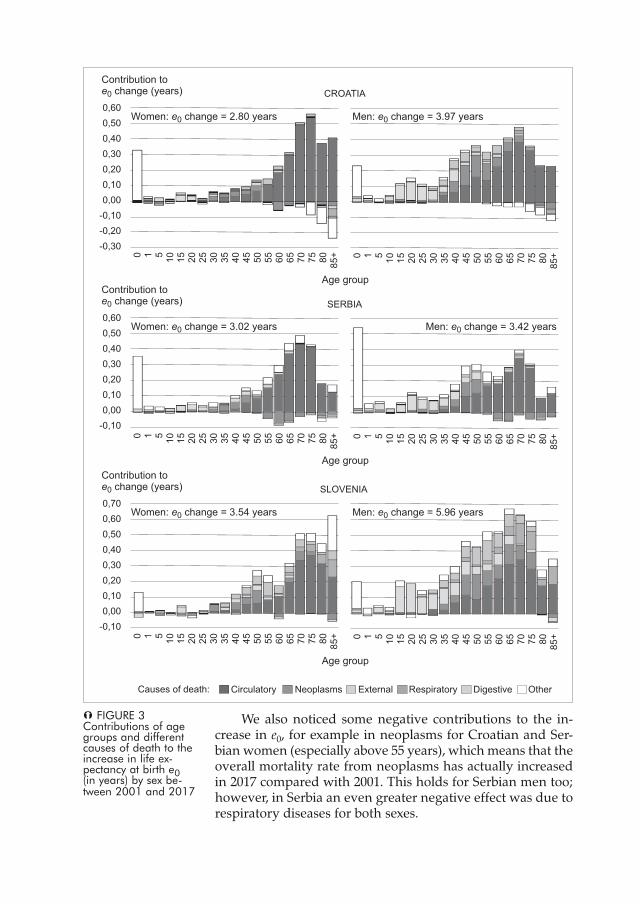
We also noticed some negative contributions to the in-crease in e0, for example in neoplasms for Croatian and Ser-bian women (especially above 55 years), which means that theoverall mortality rate from neoplasms has actually increasedin 2017 compared with 2001. This holds for Serbian men too;however, in Serbia an even greater negative effect was due torespiratory diseases for both sexes.
� FIGURE 3Contributions of agegroups and differentcauses of death to theincrease in life ex-pectancy at birth e0(in years) by sex be-tween 2001 and 2017
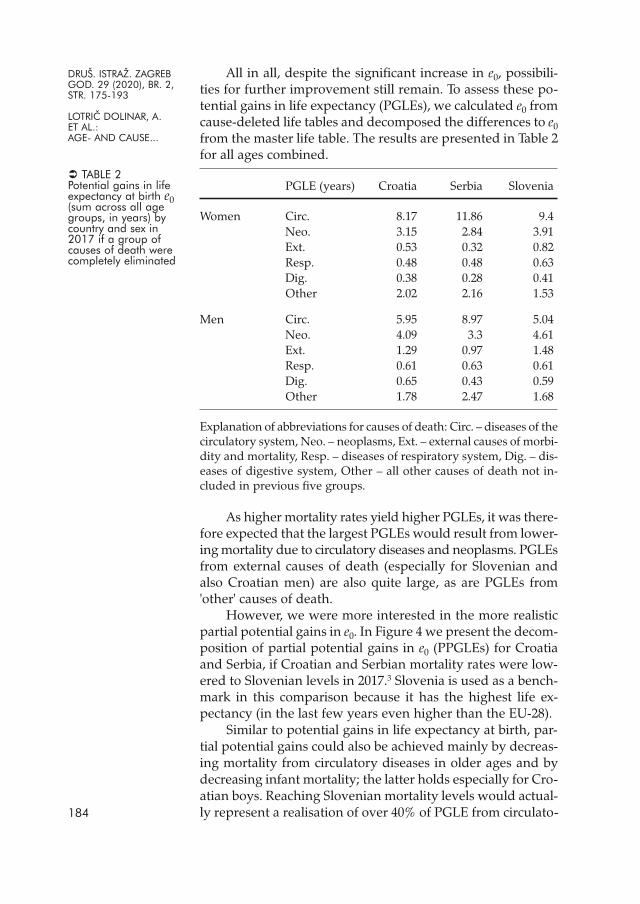
All in all, despite the significant increase in e0, possibili-ties for further improvement still remain. To assess these po-tential gains in life expectancy (PGLEs), we calculated e0 fromcause-deleted life tables and decomposed the differences to e0from the master life table. The results are presented in Table 2for all ages combined.
PGLE (years) Croatia Serbia Slovenia
Women Circ. 8.17 11.86 9.4Neo. 3.15 2.84 3.91Ext. 0.53 0.32 0.82Resp. 0.48 0.48 0.63Dig. 0.38 0.28 0.41Other 2.02 2.16 1.53
Men Circ. 5.95 8.97 5.04Neo. 4.09 3.3 4.61Ext. 1.29 0.97 1.48Resp. 0.61 0.63 0.61Dig. 0.65 0.43 0.59Other 1.78 2.47 1.68
Explanation of abbreviations for causes of death: Circ. – diseases of thecirculatory system, Neo. – neoplasms, Ext. – external causes of morbi-dity and mortality, Resp. – diseases of respiratory system, Dig. – dis-eases of digestive system, Other – all other causes of death not in-cluded in previous five groups.
As higher mortality rates yield higher PGLEs, it was there-fore expected that the largest PGLEs would result from lower-ing mortality due to circulatory diseases and neoplasms. PGLEsfrom external causes of death (especially for Slovenian andalso Croatian men) are also quite large, as are PGLEs from'other' causes of death.
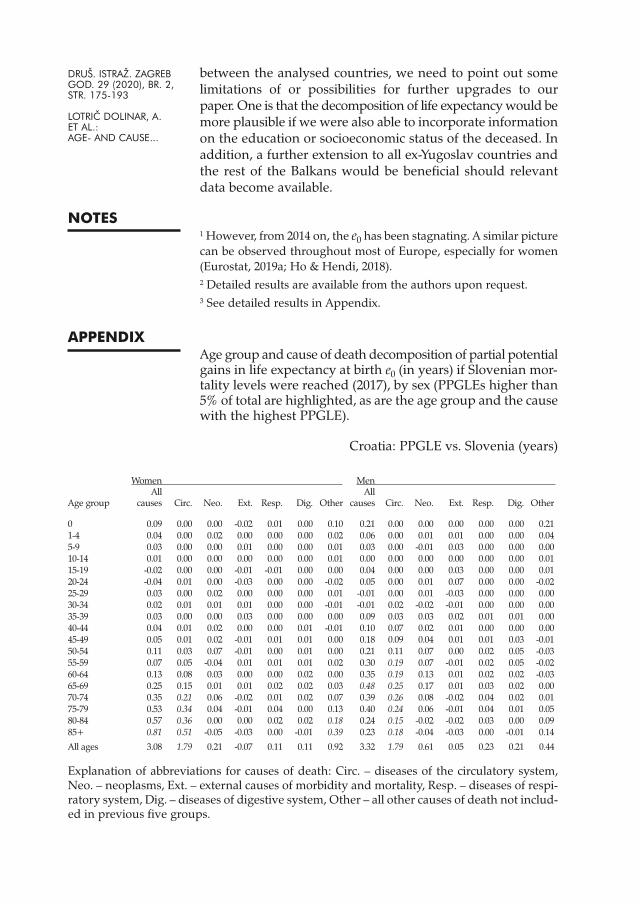
However, we were more interested in the more realisticpartial potential gains in e0. In Figure 4 we present the decom-position of partial potential gains in e0 (PPGLEs) for Croatiaand Serbia, if Croatian and Serbian mortality rates were low-ered to Slovenian levels in 2017.3 Slovenia is used as a bench-mark in this comparison because it has the highest life ex-pectancy (in the last few years even higher than the EU-28).
Similar to potential gains in life expectancy at birth, par-tial potential gains could also be achieved mainly by decreas-ing mortality from circulatory diseases in older ages and bydecreasing infant mortality; the latter holds especially for Cro-atian boys. Reaching Slovenian mortality levels would actual-ly represent a realisation of over 40% of PGLE from circulato-184
DRU[. ISTRA@. ZAGREBGOD. 29 (2020), BR. 2,STR. 175-193
LOTRIČ DOLINAR, A.ET AL.:AGE- AND CAUSE...
� TABLE 2Potential gains in lifeexpectancy at birth e0(sum across all agegroups, in years) bycountry and sex in2017 if a group ofcauses of death werecompletely eliminated
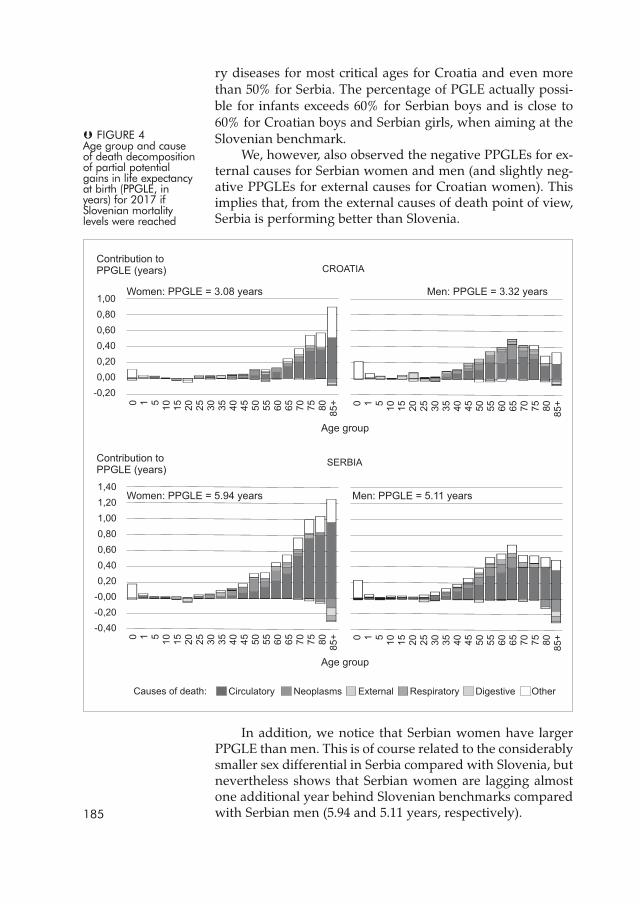
ry diseases for most critical ages for Croatia and even morethan 50% for Serbia. The percentage of PGLE actually possi-ble for infants exceeds 60% for Serbian boys and is close to60% for Croatian boys and Serbian girls, when aiming at theSlovenian benchmark.
We, however, also observed the negative PPGLEs for ex-ternal causes for Serbian women and men (and slightly neg-ative PPGLEs for external causes for Croatian women). Thisimplies that, from the external causes of death point of view,Serbia is performing better than Slovenia.
In addition, we notice that Serbian women have largerPPGLE than men. This is of course related to the considerablysmaller sex differential in Serbia compared with Slovenia, butnevertheless shows that Serbian women are lagging almostone additional year behind Slovenian benchmarks comparedwith Serbian men (5.94 and 5.11 years, respectively).185
� FIGURE 4Age group and causeof death decompositionof partial potentialgains in life expectancyat birth (PPGLE, inyears) for 2017 ifSlovenian mortalitylevels were reached
DISCUSSIONIn Croatia, Serbia and Slovenia, life expectancy at birth (e0)has been increasing rapidly over the last few decades, whichis a consequence of lower mortality. At the global scale, prog-ress has been faster than expected on the basis of develop-ment measured by the Socio-demographic Index (Wang et al.,2016). According to predictions that, in the future, e0 could in-crease even further, although at a slower pace, to close to 100years (e.g., Ediev, 2011; Mayhew & Smith, 2015), there is stillpotential for improvement in e0 for all three countries analysed.
Based on age and cause-specific mortality data, we tooka closer look at increases in e0 between 2001 and 2017, sepa-rately by sex, and we calculated the contributions of individ-ual age groups and causes of death to this increase. Sloveniahas already been demonstrated (Lotrič Dolinar, DošenovićBonča, & Sambt, 2017) to have entered the 'cardiovascular re-volution' stage of epidemiologic transition (Bongaarts, 2014).We also found that in Croatia and Serbia, the greatest effecton e0 increase can be attributed to lower mortality due to cir-culatory diseases in ages between around 65 and 80 years forboth sexes. However, some negative contributions to changein e0 are also present, especially due to increased deaths fromneoplasms for Croatian and Serbian women above 55 years.Because lung cancer is by far the most common type of can-cer in Europe and in the three analysed countries (Eurostat,2019c), one of the reasons for the increase in cancer death rates,especially in Croatia, can be found in the significant increasein the prevalence of smoking for Croatian women over the lastfew decades (World Health Organization, 2015).
Another phenomenon observed in all three countries isthe reduction in sex differential during the analysed period.The source of greatest disadvantage for men under the age of45 years are risk-taking behaviours: tobacco (Bobak, 2003), al-cohol and other drug abuse, accidents, injuries, and suicides(Phillips, 2013) – these are strikingly male phenomena (Möller--Leimkühler, 2003). When mortality attributable to these sourcesdecreases, the gap between the e0 of men and women narrows.
Besides being the main driver in increasing e0 so far, dis-eases of the circulatory system still offer the largest room forimprovement in longevity in all three analysed countries, es-pecially for older ages, and reduction in mortality from neo-plasms mainly for older ages. There is also some potential forreducing mortality in external causes of death for Slovenian(and also Croatian) men and in 'other' causes of death, espe-cially for infants in Croatia and Serbia as well as for the oldestage group in all three countries, especially for women. Partial186
potential gains in e0, if Croatia and Serbia reached Slovenianmortality rates, show that a great share of hypothetical gainscould actually be realised, especially for circulatory diseasesand infant mortality.
These results provide detailed information; it is suggestedthat these can be used by authorities to appropriately focusdemographic, health and social policies in light of unavoid-able population ageing, especially because sensible choicesregarding prevention and disease control programmes havebecome a core issue. Research (Heijink, Koolman, & Westert,2013) has reported a negative association between healthcarespending and avoidable mortality (i.e., deaths that should notoccur in the presence of timely and effective healthcare). As thepandemic of chronic non-communicable diseases poses sub-stantial challenges to the health financing sustainability (Ja-kovljevic et al., 2019), a thorough knowledge of mortalitytrends and patterns is very important when considering thelimited resources for healthcare and the various possibilitiesto invest in the prevention of avoidable deaths, in order toallocate funds in a way which will achieve maximum outcomewith minimum expense. All countries could benefit from anexchange of best practices. The successful example of Slove-nia might help Croatia and Serbia to be more efficient in im-plementing strategies and technologies that lead to lifeexpectancy improvements, while Slovenia can look up toSerbia for managing the external causes of death. This sug-gests that good practices in handling different causes of mor-tality should be exchanged in both directions, as pointed outalready by Jakovljevic et al. (2017).
It needs to be kept in mind, however, that mortality pat-terns in a given year are usually the consequence of morbidi-ty related to the same disease several years earlier for corre-spondingly younger people, which is crucial in managingpreventable causes of death (Lotrič Dolinar, Sambt, & Kore-njak-Černe, 2019). There are findings that, for example, phys-ical activity can reduce up to 10% of mortality for certain can-cers (Lee et al., 2012). Because people reach old age healthier(Vaupel, 2010), deaths from certain causes will be delayedand, according to Manton et al. (1980), a moderate delay ofdeath from a certain cause can increase e0 substantially. This inturn also implies at least some relief for the health and socialcosts of longevity, because people will also be able to worklonger in life.
Despite providing detailed information which could helpto formulate and enforce suitable policies in order to improvehealth situations through the exchange of good practices187
DRU[. ISTRA@. ZAGREBGOD. 29 (2020), BR. 2,STR. 175-193
LOTRIČ DOLINAR, A.ET AL.:AGE- AND CAUSE...
between the analysed countries, we need to point out somelimitations of or possibilities for further upgrades to ourpaper. One is that the decomposition of life expectancy would bemore plausible if we were also able to incorporate informationon the education or socioeconomic status of the deceased. Inaddition, a further extension to all ex-Yugoslav countries andthe rest of the Balkans would be beneficial should relevantdata become available.
NOTES1 However, from 2014 on, the e0 has been stagnating. A similar picturecan be observed throughout most of Europe, especially for women(Eurostat, 2019a; Ho & Hendi, 2018).2 Detailed results are available from the authors upon request.3 See detailed results in Appendix.
APPENDIXAge group and cause of death decomposition of partial potentialgains in life expectancy at birth e0 (in years) if Slovenian mor-tality levels were reached (2017), by sex (PPGLEs higher than5% of total are highlighted, as are the age group and the causewith the highest PPGLE).
Croatia: PPGLE vs. Slovenia (years)
Women MenAll All
Age group causes Circ. Neo. Ext. Resp. Dig. Other causes Circ. Neo. Ext. Resp. Dig. Other
0 0.09 0.00 0.00 -0.02 0.01 0.00 0.10 0.21 0.00 0.00 0.00 0.00 0.00 0.211-4 0.04 0.00 0.02 0.00 0.00 0.00 0.02 0.06 0.00 0.01 0.01 0.00 0.00 0.045-9 0.03 0.00 0.00 0.01 0.00 0.00 0.01 0.03 0.00 -0.01 0.03 0.00 0.00 0.0010-14 0.01 0.00 0.00 0.00 0.00 0.00 0.01 0.00 0.00 0.00 0.00 0.00 0.00 0.0115-19 -0.02 0.00 0.00 -0.01 -0.01 0.00 0.00 0.04 0.00 0.00 0.03 0.00 0.00 0.0120-24 -0.04 0.01 0.00 -0.03 0.00 0.00 -0.02 0.05 0.00 0.01 0.07 0.00 0.00 -0.0225-29 0.03 0.00 0.02 0.00 0.00 0.00 0.01 -0.01 0.00 0.01 -0.03 0.00 0.00 0.0030-34 0.02 0.01 0.01 0.01 0.00 0.00 -0.01 -0.01 0.02 -0.02 -0.01 0.00 0.00 0.0035-39 0.03 0.00 0.00 0.03 0.00 0.00 0.00 0.09 0.03 0.03 0.02 0.01 0.01 0.0040-44 0.04 0.01 0.02 0.00 0.00 0.01 -0.01 0.10 0.07 0.02 0.01 0.00 0.00 0.0045-49 0.05 0.01 0.02 -0.01 0.01 0.01 0.00 0.18 0.09 0.04 0.01 0.01 0.03 -0.0150-54 0.11 0.03 0.07 -0.01 0.00 0.01 0.00 0.21 0.11 0.07 0.00 0.02 0.05 -0.0355-59 0.07 0.05 -0.04 0.01 0.01 0.01 0.02 0.30 0.19 0.07 -0.01 0.02 0.05 -0.0260-64 0.13 0.08 0.03 0.00 0.00 0.02 0.00 0.35 0.19 0.13 0.01 0.02 0.02 -0.0365-69 0.25 0.15 0.01 0.01 0.02 0.02 0.03 0.48 0.25 0.17 0.01 0.03 0.02 0.0070-74 0.35 0.21 0.06 -0.02 0.01 0.02 0.07 0.39 0.26 0.08 -0.02 0.04 0.02 0.0175-79 0.53 0.34 0.04 -0.01 0.04 0.00 0.13 0.40 0.24 0.06 -0.01 0.04 0.01 0.0580-84 0.57 0.36 0.00 0.00 0.02 0.02 0.18 0.24 0.15 -0.02 -0.02 0.03 0.00 0.0985+ 0.81 0.51 -0.05 -0.03 0.00 -0.01 0.39 0.23 0.18 -0.04 -0.03 0.00 -0.01 0.14
All ages 3.08 1.79 0.21 -0.07 0.11 0.11 0.92 3.32 1.79 0.61 0.05 0.23 0.21 0.44
Explanation of abbreviations for causes of death: Circ. – diseases of the circulatory system,Neo. – neoplasms, Ext. – external causes of morbidity and mortality, Resp. – diseases of respi-ratory system, Dig. – diseases of digestive system, Other – all other causes of death not includ-ed in previous five groups.
DRU[. ISTRA@. ZAGREBGOD. 29 (2020), BR. 2,STR. 175-193
LOTRIČ DOLINAR, A.ET AL.:AGE- AND CAUSE...
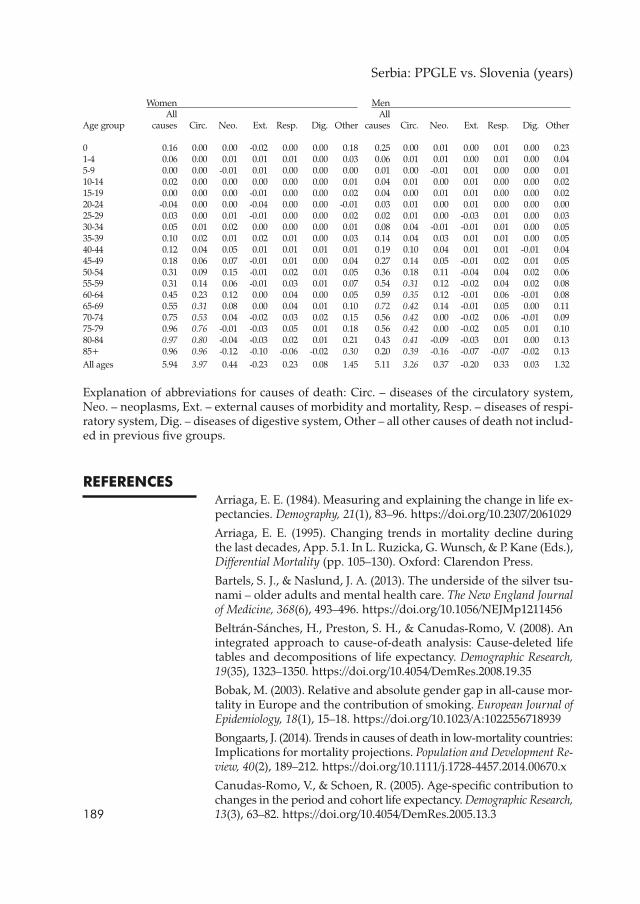
Serbia: PPGLE vs. Slovenia (years)
Women MenAll All
Age group causes Circ. Neo. Ext. Resp. Dig. Other causes Circ. Neo. Ext. Resp. Dig. Other
0 0.16 0.00 0.00 -0.02 0.00 0.00 0.18 0.25 0.00 0.01 0.00 0.01 0.00 0.231-4 0.06 0.00 0.01 0.01 0.01 0.00 0.03 0.06 0.01 0.01 0.00 0.01 0.00 0.045-9 0.00 0.00 -0.01 0.01 0.00 0.00 0.00 0.01 0.00 -0.01 0.01 0.00 0.00 0.0110-14 0.02 0.00 0.00 0.00 0.00 0.00 0.01 0.04 0.01 0.00 0.01 0.00 0.00 0.0215-19 0.00 0.00 0.00 -0.01 0.00 0.00 0.02 0.04 0.00 0.01 0.01 0.00 0.00 0.0220-24 -0.04 0.00 0.00 -0.04 0.00 0.00 -0.01 0.03 0.01 0.00 0.01 0.00 0.00 0.0025-29 0.03 0.00 0.01 -0.01 0.00 0.00 0.02 0.02 0.01 0.00 -0.03 0.01 0.00 0.0330-34 0.05 0.01 0.02 0.00 0.00 0.00 0.01 0.08 0.04 -0.01 -0.01 0.01 0.00 0.0535-39 0.10 0.02 0.01 0.02 0.01 0.00 0.03 0.14 0.04 0.03 0.01 0.01 0.00 0.0540-44 0.12 0.04 0.05 0.01 0.01 0.01 0.01 0.19 0.10 0.04 0.01 0.01 -0.01 0.0445-49 0.18 0.06 0.07 -0.01 0.01 0.00 0.04 0.27 0.14 0.05 -0.01 0.02 0.01 0.0550-54 0.31 0.09 0.15 -0.01 0.02 0.01 0.05 0.36 0.18 0.11 -0.04 0.04 0.02 0.0655-59 0.31 0.14 0.06 -0.01 0.03 0.01 0.07 0.54 0.31 0.12 -0.02 0.04 0.02 0.0860-64 0.45 0.23 0.12 0.00 0.04 0.00 0.05 0.59 0.35 0.12 -0.01 0.06 -0.01 0.0865-69 0.55 0.31 0.08 0.00 0.04 0.01 0.10 0.72 0.42 0.14 -0.01 0.05 0.00 0.1170-74 0.75 0.53 0.04 -0.02 0.03 0.02 0.15 0.56 0.42 0.00 -0.02 0.06 -0.01 0.0975-79 0.96 0.76 -0.01 -0.03 0.05 0.01 0.18 0.56 0.42 0.00 -0.02 0.05 0.01 0.1080-84 0.97 0.80 -0.04 -0.03 0.02 0.01 0.21 0.43 0.41 -0.09 -0.03 0.01 0.00 0.1385+ 0.96 0.96 -0.12 -0.10 -0.06 -0.02 0.30 0.20 0.39 -0.16 -0.07 -0.07 -0.02 0.13All ages 5.94 3.97 0.44 -0.23 0.23 0.08 1.45 5.11 3.26 0.37 -0.20 0.33 0.03 1.32
Explanation of abbreviations for causes of death: Circ. – diseases of the circulatory system,Neo. – neoplasms, Ext. – external causes of morbidity and mortality, Resp. – diseases of respi-ratory system, Dig. – diseases of digestive system, Other – all other causes of death not includ-ed in previous five groups.
REFERENCESArriaga, E. E. (1984). Measuring and explaining the change in life ex-pectancies. Demography, 21(1), 83–96. https://doi.org/10.2307/2061029
Arriaga, E. E. (1995). Changing trends in mortality decline duringthe last decades, App. 5.1. In L. Ruzicka, G. Wunsch, & P. Kane (Eds.),Differential Mortality (pp. 105–130). Oxford: Clarendon Press.
Bartels, S. J., & Naslund, J. A. (2013). The underside of the silver tsu-nami – older adults and mental health care. The New England Journalof Medicine, 368(6), 493–496. https://doi.org/10.1056/NEJMp1211456
Beltrán-Sánches, H., Preston, S. H., & Canudas-Romo, V. (2008). Anintegrated approach to cause-of-death analysis: Cause-deleted lifetables and decompositions of life expectancy. Demographic Research,19(35), 1323–1350. https://doi.org/10.4054/DemRes.2008.19.35
Bobak, M. (2003). Relative and absolute gender gap in all-cause mor-tality in Europe and the contribution of smoking. European Journal ofEpidemiology, 18(1), 15–18. https://doi.org/10.1023/A:1022556718939
Bongaarts, J. (2014). Trends in causes of death in low-mortality countries:Implications for mortality projections. Population and Development Re-view, 40(2), 189–212. https://doi.org/10.1111/j.1728-4457.2014.00670.x
Canudas-Romo, V., & Schoen, R. (2005). Age-specific contribution tochanges in the period and cohort life expectancy.Demographic Research,13(3), 63–82. https://doi.org/10.4054/DemRes.2005.13.3189
Croatian Bureau of Statistics, Population Statistics Department (2019).→ Data on deaths by sex, age and cause. Data were obtained uponrequest.Ediev, D. M. (2011). Life expectancy in developed countries is higherthan conventionally estimated. Implications from improved mea-surement of human longevity. Journal of Population Ageing, 4(1-2), 5–32.https://doi.org/10.1007/s12062-011-9040-xEggleston, K. N., & Fuchs, V. R (2012). The new demographic transi-tion: Most gains in life expectancy now realized late in life. Journal ofEconomic Perspectives, 26(3), 137–156. https://doi.org/10.1257/jep.26.3.137Eurostat (2013). Revision of the European standard population, Report ofEurostat's task force. Eurostat Methodologies and Working Papers, 2013edition. Luxembourg: Publications Office of the European Union.Eurostat (2019a). Available at https://ec.europa.eu/eurostat/data/database→Database by themes→ Population and social conditions→Demo-graphy and migration→Mortality→ Life expectancy by age and sex.Accessed 15 April 2019.Eurostat (2019b). Available at https://ec.europa.eu/eurostat/data/database→Database by themes→ Population and social conditions→Demo-graphy and migration → Population → Population on 1 January byage and sex. Accessed 15 April 2019.Eurostat (2019c). Available at https://ec.europa.eu/eurostat/data/database→Database by themes→ Population and social conditions→ Health→ Causes of death → General mortality → Causes of death – stan-dardised death rate by residence. Accessed 15 April 2019.Foege, W. H. (1987). Public health: Moving from debt to legacy, 1986presidential address. American Journal of Public Health, 77(10), 1276–1278.https://doi.org/10.2105/AJPH.77.10.1276Frenk, J., Bobadilla, J. L., Stern, C., Frejka, T., & Lozano, R. (1991). Ele-ments for a theory of the health transition. Health Transition Review,1(1), 21–38. https://dx.doi.org/10.2307/40608615Garfield, R. (2001) Economic sanctions, health, and welfare in the FederalRepublic of Yugoslavia 1990–2000. Belgrade: UNICEF.Grigoriev, P., Meslé, F., Shkolnikov, V. M., Andreev, E., Fihel, A., Pech-holdova, M., & Vallin, J. (2014). The recent mortality decline in Russia:Beginning of the cardiovascular revolution? Population and DevelopmentReview, 40(1), 107–129. https://doi.org/10.1111/j.1728-4457.2014.00652.xHeijink, R., Koolman, X., & Westert, G. P. (2013). Spending more mo-ney, saving more lives? The relationship between avoidable mortali-ty and healthcare spending in 14 countries. European Journal of HealthEconomics, 14(3), 527–538. https://doi.org/10.1007/s10198-012-0398-3Ho, J. Y., & Hendi, A. S. (2018). Recent trends in life expectancy acrosshigh income countries: Retrospective observational study. BMJ, 362,k2562. https://doi.org/10.1136/bmj.k2562ICD-10: International statistical classification of diseases and relatedhealth problems, 10th revision (2016). Available at https://icd.who.int/browse 10/2010/en. Accessed 15 April 2019.Jakovljevic, M., Arsenijevic, J., Pavlova, M., Verhaeghe, N., Laaser, U., &Groot, W. (2017). Within the triangle of healthcare legacies: Compar-ing the performance of South-Eastern European health systems.190
DRU[. ISTRA@. ZAGREBGOD. 29 (2020), BR. 2,STR. 175-193
LOTRIČ DOLINAR, A.ET AL.:AGE- AND CAUSE...
Journal of Medical Economics, 20(5), 483–492. https://doi.org/10.1080/13696998.2016.1277228
Jakovljevic, M., Jakab, M., Gerdtham, U., McDaid, D., Ogura, S., Vara-vikova, E., Merrick, J., Adany, R., Okunade, A., & Getzen, T. E. (2019).Comparative financing analysis and political economy of noncom-municable diseases. Journal of Medical Economics, 22(8), 722–727. https://doi.org/10.1080/13696998.2019.1600523
Jakovljevic, M. B., Vukovic, M., & Fontanesi, J. (2016). Life expectancyand health expenditure evolution in Eastern Europe – DiD and DEAanalysis. Expert Review of Pharmacoeconomics and Outcomes Research,16(4), 537–546. https://doi.org/10.1586/14737167.2016.1125293
Kintner, H. J. (2003). The life table. In D. A. Swanson & J. S. Siegel(Eds.), The methods and materials of demography (pp. 301–340). San Diego:Elsevier Science. https://doi.org/10.1016/B978-012641955-9/50047-3
Kirk, D. (1996). Demographic transition theory. Population Studies – aJournal of Demography, 50(3), 361–387. https://doi.org/10.1080/0032472031000149536
Klenk, J., Keil, U., Jaensch, A., Christiansen, M. C., & Nagel, G. (2016).Changes in life expectancy 1950–2010: Contributions from age- anddisease-specific mortality in selected countries. Population Health Met-rics, 14, 20. https://doi.org/10.1186/s12963-016-0089-x
Kovačić, L., & Šošić, Z. (1998). Organization of health care in Croatia:Needs and priorities.CroatianMedical Journal, 39(3), 249–255. Available athttps://www.researchgate.net/publication/13544496_Organization_of_health_care_in_Croatia_Needs_and_priorities
Kunitz, S. J. (2004). The making and breaking of Yugoslavia and itsimpact on health. American Journal of Public Health, 94(11), 1894–1904.https://doi.org/10.2105/AJPH.94.11.1894
Lee, I. M., Shiroma, E. J., Lobelo, F., Puska, P., Blair, S. N., & Katzmar-zyk, P. T. (2012). Effect of physical inactivity on major non-communi-cable diseases worldwide: An analysis of burden of disease and lifeexpectancy. Lancet, 380(9838), 219–229. https://doi.org/10.1016/S0140-6736(12)61031-9
Liu, P., Li, C., Wang, Y., Zeng, W., Wang, H., Wu, H., Lu, J., Sun, M., Li,X., Chang, F., & Hao, M. (2014). The impact of the major causes ofdeath on life expectancy in China: A 60-year longitudinal study. BMCPublic Health, 14(1193), 2–8. https://doi.org/10.1186/1471-2458-14-1193
Lotrič Dolinar, A., Došenović Bonča, P., & Sambt, J. (2017). Longevityin Slovenia: Past and potential gains in life expectancy by age andcauses of death. Zdravstveno varstvo, 56(2),124–130. https://doi.org/10.1515/sjph-2017-0016
Lotrič Dolinar, A., Sambt, J., & Korenjak-Černe, S. (2019). Clustering EUcountries by causes of death. Population Research and Policy Review,38(2), 157–172. https://doi.org/10.1007/s11113-019-09518-1
Malačič, J. (2006). Demografija – teorija, analiza, metode in modeli [De-mography – Theory, analysis, methods and models]. Ljubljana: Eko-nomska fakulteta.
Manton, K. G., Patrick, C. H., & Stallard, E. (1980). Mortality modelbased on delays in progression of chronic diseases: Alternative to cause191
DRU[. ISTRA@. ZAGREBGOD. 29 (2020), BR. 2,STR. 175-193
LOTRIČ DOLINAR, A.ET AL.:AGE- AND CAUSE...
elimination model. Public Health Reports, 95(6), 580–588. Available athttps://www.ncbi.nlm.nih.gov/pmc/articles/PMC1422793/Mayhew, L., & Smith, D. (2015). On the decomposition of life ex-pectancy and limits to life. Population Studies – A Journal of Demography,69(1), 73–89. https://doi.org/10.1080/00324728.2014.972433Möller-Leimkühler, A. M. (2003). The gender gap in suicide and pre-mature death or: Why are men so vulnerable? European Archives ofPsychiatry and Clinical Neuroscience, 253(1), 1–8. https://doi.org/10.1007/s00406-003-0397-6National institute of public health, Health Data Center, Slovenia (2019).→Data on deaths by sex, age and cause. Data were obtained by request.Oeppen, J., & Vaupel, J. W. (2002). Broken limits to life expectancy.Science, 296(5570), 1029–1031. https://doi.org/10.1126/science.1069675Ogura, S., & Jakovljevic, M. M. (2018). Global population aging – healthcare, social and economic consequences. Frontiers in Public Health, 6,335. https://doi.org/10.3389/fpubh.2018.00335Omran, A. R. (1971). The epidemiologic transition: A theory of theepidemiology of population change. TheMilbankMemorial Fund Quarter-ly, 49(4-1), 509–538. https://doi.org/10.2307/3349375Phillips, S. P. (2013). Risky business: Explaining the gender gap inlongevity. Journal of Men's Health and Gender, 3(1), 43–46. https://doi.org/10.1016/j.jmhg.2005.08.004Pollard, J. H. (1988). On the decomposition of changes in expectationof life and differentials in life expectancy. Demography, 25(2), 265–276.https://doi.org/10.2307/2061293Pressat, R. (1985). Contribution des écarts de mortalité par âge à ladifférence des vies moyennes [The significance of variations in mor-tality by age on differences in life expectancy]. Population, 40(4/5),766–770. https://doi.org/10.2307/1532986Shkolnikov, V. (2015). Methodology note on the Human Life-Table Data-base (HLD). Available at http://www.lifetable.de/methodology.pdfStatistical Office of the Republic of Serbia, Demography Division(2019). → Data on deaths by sex, age and cause. Data were obtainedby request.Timonin, S., Shkolnikov, V., Jasilionis, D., Grigoriev, P., Jdanov, D. A.,& Leon, D. A. (2016). Disparities in length of life across developedcountries: Measuring and decomposing changes over time withinand between country groups. Population Health Metrics, 14(29), 1–19.https://doi.org/10.1186/s12963-016-0094-0Tsai, S. P., Lee, E. S., & Hardy, R. J. (1978). The effect of a reduction in lead-ing causes of death: Potential gains in life expectancy. American Journalof Public Health, 68(10), 966–971. https://doi.org/10.2105/AJPH.68.10.966Vallin, J., & Meslé, F. (2004). Convergences and divergences in mor-tality. A new approach to health transition.Demographic Research, special2(2), 11–44. https://doi.org/10.4054/DemRes.2004.S2.2Vaupel, J. W. (2010). Biodemography of human aging.Nature, 464(7288),536–542. https://doi.org/10.1038/nature08984
Wang, H., Naghavi, M., Allen, C., Barber, R. M., Bhutta, Z. A., Carter, A.,..., & Coggeshall, M. (2016). Global, regional, and national life ex-192
DRU[. ISTRA@. ZAGREBGOD. 29 (2020), BR. 2,STR. 175-193
LOTRIČ DOLINAR, A.ET AL.:AGE- AND CAUSE...
pectancy, all-cause mortality, and cause-specific mortality for 249causes of death, 1980–2015: A systematic analysis for the Global Burdenof Disease Study 2015. The Lancet, 388(10053), 1459–1544. https://doi.org/10.1016/S0140-6736(16)31012-1
World Health Organization (2015). WHO global report on trends inprevalence of tobacco smoking 2015. Geneva: WHO.
Porast očekivanog trajanja životas obzirom na dob i uzroke uHrvatskoj, Srbiji i SlovenijiAleša LOTRIČ DOLINAREkonomski fakultet, Ljubljana
Ivan ČIPIN, Petra ME\IMURECEkonomski fakultet, Zagreb
Jelena STOJILKOVIĆ GNJATOVIĆGeografski fakultet, Beograd
Jože SAMBTEkonomski fakultet, Ljubljana
Očekivano trajanje života raste u svim zemljama bivšeJugoslavije. Ovaj rad opisuje i uspoređuje recentne trendove uočekivanom trajanju života u Hrvatskoj, Srbiji i Sloveniji. Što jepotaknulo najnoviji porast? U kojim se dobnim skupinama ikod kojih se uzroka smrti bilježi najveći pad mortaliteta? Jesuli se tri zemlje pridružile kardiovaskularnoj revoluciji? Postoje lirazlike među zemljama? Ima li prostora za daljnji napredak?Kako bismo ponudili odgovore na ova pitanja, u istraživanjuupotrebljavamo tablice doživljenja i dekompozicijsku analizu.Ključni su nalazi: 1) pad smrtnosti od bolesti cirkulacijskogasustava među starijim stanovništvom najviše je pridonio rastuočekivanoga trajanja života 2001–2017 kod obaju spolova usvim trima zemljama, 2) očekivano trajanje života u Slovenijiraslo je najbrže i povećao se jaz među zemljama, 3) podslovenskim stopama kardiovaskularnoga mortaliteta premadobi, u Hrvatskoj bi očekivano trajanje života poraslo za 1,79godina i kod žena i kod muškaraca, a u Srbiji za 3,97 godinakod žena, odnosno za 3,26 godina kod muškaraca.
Ključne riječi: očekivano trajanje života, smrtnost prema dobii uzroku, prošli i budući rast očekivanog trajanja života,dekompozicijska analiza, zemlje bivše Jugoslavije
193
DRU[. ISTRA@. ZAGREBGOD. 29 (2020), BR. 2,STR. 175-193
LOTRIČ DOLINAR, A.ET AL.:AGE- AND CAUSE...
Međunarodna licenca / International License:Imenovanje-Nekomercijalno / Attribution-NonCommercial