Embed Size (px)
Citation preview

DEMOGRAPHIC RESEARCH VOLUME 31, ARTICLE 5, PAGES 119–136 PUBLISHED 8 JULY 2014 http://www.demographic-research.org/Volumes/Vol31/5/ DOI: 10.4054/DemRes.2014.31.5 Descriptive Finding
Age-specific fertility by educational level in the Finnish male cohort born 1940‒1950
Jessica Nisén
Pekka Martikainen
Karri Silventoinen
Mikko Myrskylä
© 2014 Nisén, Martikainen, Silventoinen & Myrskylä. This open-access work is published under the terms of the Creative Commons Attribution NonCommercial License 2.0 Germany, which permits use, reproduction & distribution in any medium for non-commercial purposes, provided the original author(s) and source are given credit. See http:// creativecommons.org/licenses/by-nc/2.0/de/
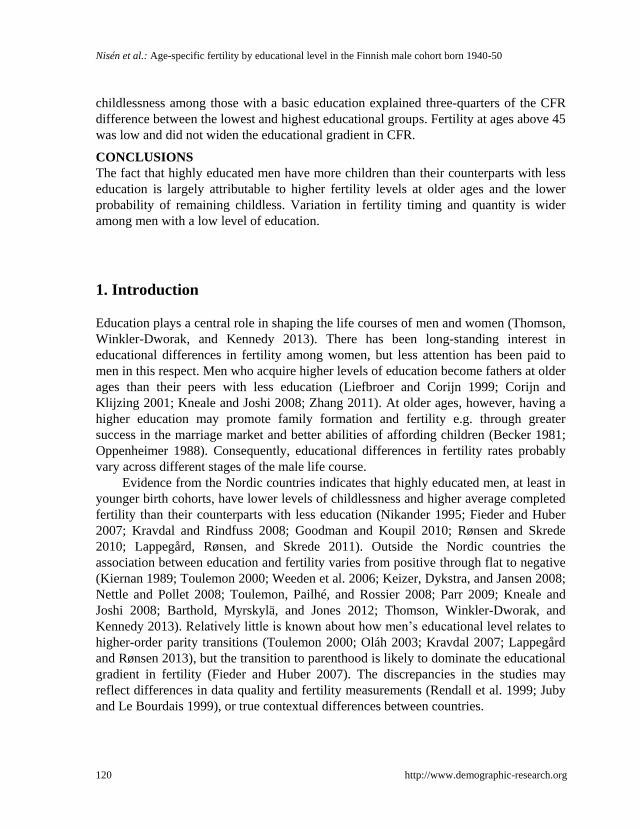
Table of Contents
1 Introduction 120 2 Data and methods 121 3 Results 123 4 Conclusion 130 5 Acknowledgments 131 References 132

Demographic Research: Volume 31, Article 5
Descriptive Finding
http://www.demographic-research.org 119
Age-specific fertility by educational level in the Finnish male cohort
born 1940‒1950
Jessica Nisén1
Pekka Martikainen2
Karri Silventoinen3
Mikko Myrskylä4
Abstract
BACKGROUND
Education is positively associated with completed fertility rate (CFR) among men in
Nordic countries, but the age patterns of fertility by educational level are poorly
documented. Moreover, it is not known what parities contribute to the higher CFR
among more highly educated men.
OBJECTIVE
To describe men’s fertility by age, parity, and education in Finland.
METHODS
The study is based on register data covering the male cohort born in 1940‒1950
(N=38,838). Education was measured at ages 30‒34 and classified as basic, lower
secondary, upper secondary, and tertiary. Fertility was measured until ages 59‒69. We
calculated completed and age-specific fertility rates, and decomposed the educational
gradient in CFR into parity-specific contributions.
RESULTS
The more highly educated men had more children (CFR: basic 1.71 and tertiary 2.06),
had them later (mean age at having the first child: basic 26.1 and tertiary 28.1), and had
them within a shorter interval (interquartile range of age at having the first child: basic
5.8 and tertiary 5.2). The educational gradient in the cumulative fertility rate was
negative at young ages but turned positive by the early thirties. High levels of
1 Population Research Unit, Department of Social Research, P.O. Box 18 (Unioninkatu 35), 00014-FIN.
University of Helsinki, Finland. E-Mail: [email protected]. 2 University of Helsinki, Finland. E-Mail: [email protected]. 3 University of Helsinki, Finland. E-Mail: [email protected]. 4 London School of Economics, U.K. E-Mail: [email protected].
Nisén et al.: Age-specific fertility by educational level in the Finnish male cohort born 1940-50
120 http://www.demographic-research.org
childlessness among those with a basic education explained three-quarters of the CFR
difference between the lowest and highest educational groups. Fertility at ages above 45
was low and did not widen the educational gradient in CFR.
CONCLUSIONS
The fact that highly educated men have more children than their counterparts with less
education is largely attributable to higher fertility levels at older ages and the lower
probability of remaining childless. Variation in fertility timing and quantity is wider
among men with a low level of education.
1. Introduction
Education plays a central role in shaping the life courses of men and women (Thomson,
Winkler-Dworak, and Kennedy 2013). There has been long-standing interest in
educational differences in fertility among women, but less attention has been paid to
men in this respect. Men who acquire higher levels of education become fathers at older
ages than their peers with less education (Liefbroer and Corijn 1999; Corijn and
Klijzing 2001; Kneale and Joshi 2008; Zhang 2011). At older ages, however, having a
higher education may promote family formation and fertility e.g. through greater
success in the marriage market and better abilities of affording children (Becker 1981;
Oppenheimer 1988). Consequently, educational differences in fertility rates probably
vary across different stages of the male life course.
Evidence from the Nordic countries indicates that highly educated men, at least in
younger birth cohorts, have lower levels of childlessness and higher average completed
fertility than their counterparts with less education (Nikander 1995; Fieder and Huber
2007; Kravdal and Rindfuss 2008; Goodman and Koupil 2010; Rønsen and Skrede
2010; Lappegård, Rønsen, and Skrede 2011). Outside the Nordic countries the
association between education and fertility varies from positive through flat to negative
(Kiernan 1989; Toulemon 2000; Weeden et al. 2006; Keizer, Dykstra, and Jansen 2008;
Nettle and Pollet 2008; Toulemon, Pailhé, and Rossier 2008; Parr 2009; Kneale and
Joshi 2008; Barthold, Myrskylä, and Jones 2012; Thomson, Winkler-Dworak, and
Kennedy 2013). Relatively little is known about how men’s educational level relates to
higher-order parity transitions (Toulemon 2000; Oláh 2003; Kravdal 2007; Lappegård
and Rønsen 2013), but the transition to parenthood is likely to dominate the educational
gradient in fertility (Fieder and Huber 2007). The discrepancies in the studies may
reflect differences in data quality and fertility measurements (Rendall et al. 1999; Juby
and Le Bourdais 1999), or true contextual differences between countries.

Demographic Research: Volume 31, Article 5
http://www.demographic-research.org 121
We analyse a Finnish cohort born in 1940-1950 and provide a detailed description
of men’s fertility by age, parity, and educational level. Our aim is to enhance
understanding of the role of age in men’s education‒fertility gradient. Our specific
study questions are:
How does fertility vary by age and educational group?
What parities drive the educational differences in completed fertility?
Until what age does fertility need to be measured to fully capture the
educational gradient in completed fertility?
We stratify the analysis by marital history because fertility is higher among
married men (Goodman and Koupil 2010) and education is a significant determinant of
marital status (Lyngstad and Jalovaara 2010; Jalovaara 2012). In addition, we make
comparisons with Finnish women comprising the respective birth cohort in order to
contextualize our findings.
2. Data and methods
The data were based on a 10% sample of households drawn from the 1950 Finnish
Census of Population (Statistics Finland 1997). These data have subsequently been
linked to quinquennial census information in 1970‒1995, and to birth records up to
2009. Of the 48,460 men in the original sample who were born in 1940‒1950 and
belonged to the household population in 1950, 91% could be linked to other sources of
information via personal identification codes. Of these, 41,226 were present in the
census at the age of 30‒34 (1970/75/80), and information on the level of education was
thus available. Those not present in the census at the age of 45-49 were excluded from
the dataset (N=2,386). Two observations were further dropped due to the unrealistic
value of age at having the first child. The final sample consisted of 38,838 men. Loss to
follow-up was mainly attributable to emigration, in particular to Sweden in the late
1960s and early 1970s, and to a lesser extent to mortality between 1950 and the year of
reaching the age of 45‒49. The data on women were derived from the original dataset
with the same criterion as for the men (N=36,806).
Monthly information on biological children born alive was linked to data on birth
records from 1970 to 2009. Children born before 1970 were included except for those
who did not live with their fathers at the time of the population census in 1970, when
personal identification codes were in use. This may introduce selective bias in our
fertility measurement (see Nelson 2004). With regard to the 1970 census, among
women born in the early 1940s in these data, those with a low level of education were

Nisén et al.: Age-specific fertility by educational level in the Finnish male cohort born 1940-50
122 http://www.demographic-research.org
more likely to be living alone with children. According to a survey of women, however,
only 5% of children were born out of wedlock in the period 1966-1970 (Finnäs 1993).
The study participants were 59‒69 years old at the end of the follow-up. In our sample,
completed fertility rate (CFR) was similar among men (1.81) and women (1.86), thus
we expect any bias attributable to unknown paternity to be small.
The level of education was measured at the age of 30‒34 and categorized as basic
(45%), lower secondary (28%), upper secondary (14%), and tertiary (14%). The basic
level refers to nine years or less of general education; lower secondary education refers
to a brief period of vocational training (<3 years) in addition to general education;
upper secondary education refers to either further general studies (the matriculation
examination) or vocational training (≥3 years) in addition to general education; and
tertiary education refers to a university degree or vocational training at the highest level.
Marital history was categorized as never-married (18%), intact-married (first
marriage not dissolved due to divorce or the partner’s death: 52%), divorced/widowed
(20%), and remarried (11%), based on longitudinal information on the formation and
dissolution of marital unions. Marriages that were formed and dissolved before 1970
were not observed. Longitudinal information on cohabitation was not available, but it
was still relatively uncommon in the birth cohort under study, becoming more common
in Finland from the early 1970s (Finnäs 1993). According to a survey of men born in
1943-1947, around 5% were cohabiting when their first child was born, and a similar
proportion were neither cohabiting nor married (Nikander 1995). Having the first child
in a cohabiting union was more common among men with a lower level of education.
Age-specific fertility rates were calculated for each one-year age group and
educational group separately. Given that we were calculating fertility for a cohort
surviving to the age of 45‒49, for all ages in the denominator we used a constant
number of person years at risk, the number of men in the sample who were alive and
resident in Finland at the age of 45‒49. The results were robust for men who were
present in the data at the age of 30‒34 but not at 45‒49 (N=2,386). We used arithmetic
means and interquartile ranges (IQR) for location and variation in fertility. We also
calculated standard deviations, the results of which were similar to those of the IQRs.
Educational gradient in CFR was decomposed into differences in progress to
parities one, two, three, and four or higher. Those with a basic education comprised the
reference group. The decomposition was based on deriving the cohort’s completed
fertility rate from its parity progression ratios:
∑∏

Demographic Research: Volume 31, Article 5
http://www.demographic-research.org 123
where Pi expresses the probability of progressing from parity i to parity i+1 conditional
on having progressed to parity i. The contribution of each Pi to the total difference in
CFR between the two educational groups was approximated by
∑(
)
where each partial derivative
was calculated as an average between the reference
group and the other educational group, and is the difference in parity progression
ratio i between the educational groups (Pullum, Tedrow, and Herting 1989). Stata
version 11 (StataCorp 2009) was used for the data analysis.
3. Results
The level of education in the Finnish male cohort born in 1940‒1950 was low: almost
half of the men (45%) were educated only to the basic level. Completed fertility rate
(CFR) was 1.81 children. The CFR in the group with a tertiary education was 20%
higher than among those with a basic education (over two at 2.06 and well under two at
1.71 respectively: see Table 1).
The average number of children among those who had any (80.6%) was 2.24. The
mean age at having the first child was 26.6, as opposed to 30.1 and 34.0 for the second
and third children respectively. The mean age at having a child of any parity was 29.6.
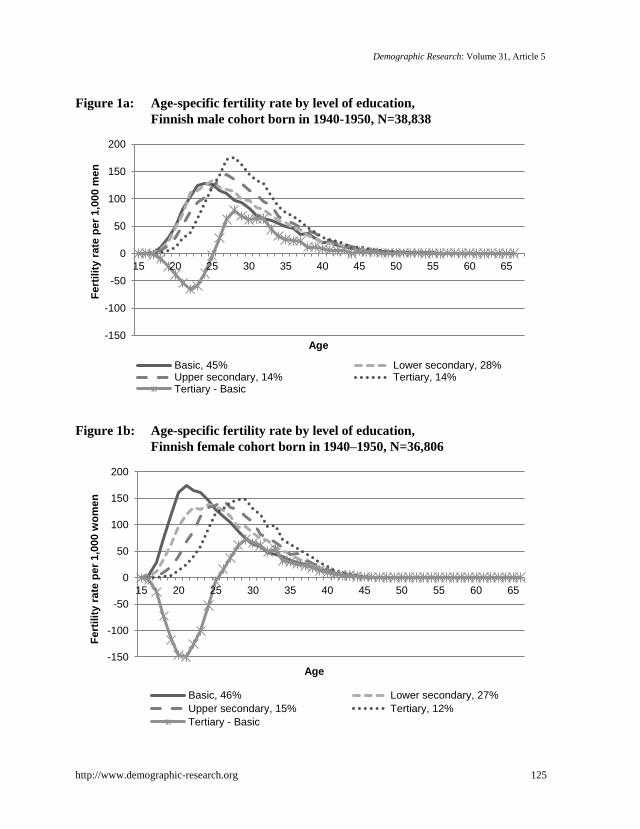
Figures 1a‒b show men’s age-specific fertility by education and in contrast to that
of women. Men made the transition to parenthood later than women (mean age at
having the first child: 26.6 and 24.5 respectively) and had higher fertility levels at older
ages. Men reached 90% (95%, 99%) of their cumulative fertility rate at age 38.3 (41.6,
48.4), whereas women reached this percentile at the age of 35.1 (37.6, 41.6). In general,
fertility was slightly less concentrated around the mean childbearing age among men
than among women (the IQR of having a child of any parity was 7.9 years for women
and 8.4 for men).
The fertility rate peaked later in the more highly educated groups of men: namely
at the age of 24 among those with a basic education compared with 28 among those
with a tertiary education (Figure 1a). Men in their late teens and early twenties with a
lower level of education had higher fertility levels than their more highly educated
counterparts. The difference narrowed in their mid-twenties, and by their late twenties
the positions had reversed: from the age of 26 onwards those with a tertiary education
had higher fertility rates than their counterparts with a basic education (except for a few
older age groups registering very few births).

Nisén et al.: Age-specific fertility by educational level in the Finnish male cohort born 1940-50
124 http://www.demographic-research.org
Table 1: Completed fertility rate (CFR) and fertility timing,
Finnish male cohort born in 1940‒1950, N=38,838
N Mean SE
1 N Mean SE
1
CFR CFR of children born after the first one
2
Basic 17,422 1.71 0.01 13,250 1.25 0.01
Lower secondary 10,778 1.80 0.01 8,845 1.19 0.01
Upper secondary 5,271 1.90 0.02 4,511 1.22 0.02
Tertiary 5,367 2.06 0.02 4,716 1.35 0.02
Total 38,838 1.81 0.01 31,322 1.24 0.01
N Mean SE
1 IQR Lower quart. Upper quart.
Age at having a child of any parity
Basic 29,817 29.0 0.05 8.7 24.2 32.9
Lower secondary 19,401 29.3 0.06 8.5 24.5 33.0
Upper secondary 10,001 30.3 0.08 7.9 25.8 33.7
Tertiary 11,071 31.1 0.07 7.2 27.0 34.2
Total 70,290 29.6 0.03 8.4 24.9 33.3
Age at having the 1st child
Basic 13,250 26.1 0.05 5.8 22.6 28.4
Lower secondary 8,845 26.3 0.05 5.8 22.8 28.6
Upper secondary 4,511 27.2 0.07 5.8 23.8 29.6
Tertiary 4,716 28.1 0.07 5.2 25.1 30.3
Total 31,322 26.6 0.03 5.9 23.1 29.0
Age at having the 2nd child
Basic 9,987 29.4 0.06 7.1 25.5 32.6
Lower secondary 6,721 30.0 0.07 6.8 26.1 32.9
Upper secondary 3,573 30.9 0.09 6.2 27.4 33.6
Tertiary 3,919 31.4 0.08 5.5 28.2 33.7
Total 24,200 30.1 0.04 6.7 26.4 33.1
Age at having the 3rd child
Basic 4,177 33.2 0.10 8.5 28.6 37.1
Lower secondary 2,585 33.9 0.11 7.5 29.9 37.4
Upper secondary 1,305 35.0 0.16 7.4 31.1 38.5
Tertiary 1,665 35.3 0.14 6.6 31.5 38.1
Total 9,732 34.0 0.06 7.7 29.8 37.5
1
In the calculation of standard errors of means the clustering of the dataset (the data include brothers who lived in the same
households in 1950 as children) was taken into account by Taylor-linearized variance estimation (which slightly increases the
SE estimates). 2
Among fathers only.
Demographic Research: Volume 31, Article 5
http://www.demographic-research.org 125
Figure 1a: Age-specific fertility rate by level of education,
Finnish male cohort born in 1940-1950, N=38,838
Figure 1b: Age-specific fertility rate by level of education,
Finnish female cohort born in 1940‒1950, N=36,806
-150
-100
-50
0
50
100
150
200
15 20 25 30 35 40 45 50 55 60 65
Fert
ilit
y r
ate
per
1,0
00 m
en
Age
Basic, 45% Lower secondary, 28%Upper secondary, 14% Tertiary, 14%Tertiary - Basic
-150
-100
-50
0
50
100
150
200
15 20 25 30 35 40 45 50 55 60 65
Fert
ilit
y r
ate
per
1,0
00 w
om
en
Age
Basic, 46% Lower secondary, 27%
Upper secondary, 15% Tertiary, 12%
Tertiary - Basic
Nisén et al.: Age-specific fertility by educational level in the Finnish male cohort born 1940-50
126 http://www.demographic-research.org
The pattern was qualitatively similar among women (Figure 1b), although the
differences between educational groups in their late teens and early twenties were much
larger than among the men. Although men had higher fertility rates than women in their
late thirties and early forties (23 vs. 14 per 1,000 respectively at the age of 40), the
absolute differences between men with a tertiary and a basic education were of the same
magnitude as those among women at these ages (8 vs. 9 per 1,000 respectively at the
age of 40).
Fertility timing among the men with a higher level of education was characterized
by both a later start and less dispersion compared with their less highly educated
counterparts (Table 1). The IQR of the age at having a child of any parity was 8.7 years
among those with a basic education and 7.2 years among those with a tertiary
education. This pattern of lower variance among the more highly educated was also
present for the first, second, and third parities. With regard to the timing of the first
child, men with a tertiary education had the smallest IQR (5.2), but there were no
differences between the other educational groups (5.8 for each).
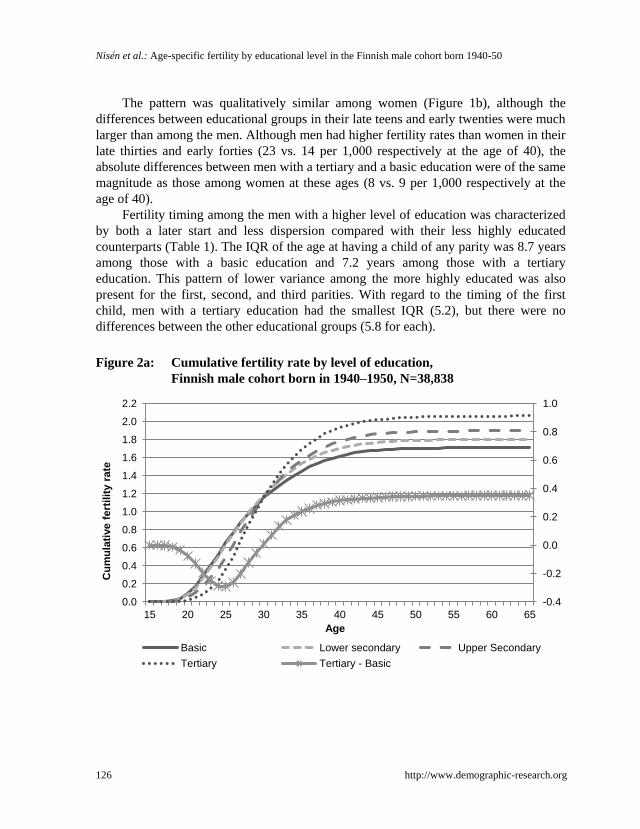
Figure 2a: Cumulative fertility rate by level of education,
Finnish male cohort born in 1940‒1950, N=38,838
-0.4
-0.2
0.0
0.2
0.4
0.6
0.8
1.0
0.0
0.2
0.4
0.6
0.8
1.0
1.2
1.4
1.6
1.8
2.0
2.2
15 20 25 30 35 40 45 50 55 60 65
Cu
mu
lati
ve f
ert
ilit
y r
ate
Age
Basic Lower secondary Upper Secondary
Tertiary Tertiary - Basic

Demographic Research: Volume 31, Article 5
http://www.demographic-research.org 127
Figure 2b: Cumulative share of fathers by level of education,
Finnish male cohort born in 1940‒1950, N=38,838
The positive gradient of cumulative fertility emerged in the early thirties, being
higher in the group with a tertiary education than among those with a basic education
from the age of 30 (Figure 2a). The difference widened thereafter until the early forties,
after which the gap increased only moderately. Of the difference in CFR between men
with a tertiary and a basic education (0.35) 90% was achieved by the age of 41 and 95%
by the age of 45. The 95% level was reached in all educational groups by the age of 41‒
42.
On the cumulative level (Figure 2b), by the age of 29 those with a tertiary
education had overtaken those with lower levels of education in terms of fatherhood.
This positive educational gradient emerged in the early thirties, and 95% of the final
proportional difference between those with a tertiary and a basic education was evident
by the age of 39.
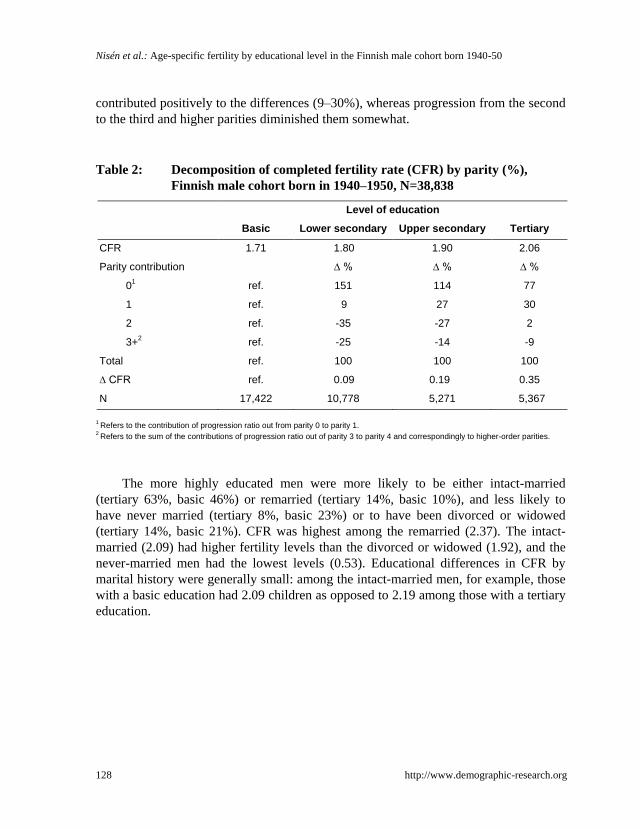
Table 2 shows the differences between educational groups in CFR decomposed
into differences in progress to parities one, two, and three or higher. Men with a basic
education comprised the reference group. Progression to the first parity accounted for
most of the positive gradient (>77%), and progression to the second parity also
-0.4
-0.2
0.0
0.2
0.4
0.6
0.8
1.0
0.0
0.2
0.4
0.6
0.8
1.0
15 20 25 30 35 40 45 50 55 60 65
Cu
mu
lati
ve s
hare
of
fath
ers
Age
Basic Lower secondary Upper Secondary
Tertiary Tertiary - Basic
Nisén et al.: Age-specific fertility by educational level in the Finnish male cohort born 1940-50
128 http://www.demographic-research.org
contributed positively to the differences (9‒30%), whereas progression from the second
to the third and higher parities diminished them somewhat.
Table 2: Decomposition of completed fertility rate (CFR) by parity (%),
Finnish male cohort born in 1940‒1950, N=38,838
Level of education
Basic Lower secondary Upper secondary Tertiary
CFR 1.71 1.80 1.90 2.06
Parity contribution ∆ % ∆ % ∆ %
01 ref. 151 114 77
1 ref. 9 27 30
2 ref. -35 -27 2
3+2 ref. -25 -14 -9
Total ref. 100 100 100
∆ CFR ref. 0.09 0.19 0.35
N 17,422 10,778 5,271 5,367
1
Refers to the contribution of progression ratio out from parity 0 to parity 1. 2
Refers to the sum of the contributions of progression ratio out of parity 3 to parity 4 and correspondingly to higher-order parities.
The more highly educated men were more likely to be either intact-married
(tertiary 63%, basic 46%) or remarried (tertiary 14%, basic 10%), and less likely to
have never married (tertiary 8%, basic 23%) or to have been divorced or widowed
(tertiary 14%, basic 21%). CFR was highest among the remarried (2.37). The intact-
married (2.09) had higher fertility levels than the divorced or widowed (1.92), and the
never-married men had the lowest levels (0.53). Educational differences in CFR by
marital history were generally small: among the intact-married men, for example, those
with a basic education had 2.09 children as opposed to 2.19 among those with a tertiary
education.
Demographic Research: Volume 31, Article 5
http://www.demographic-research.org 129
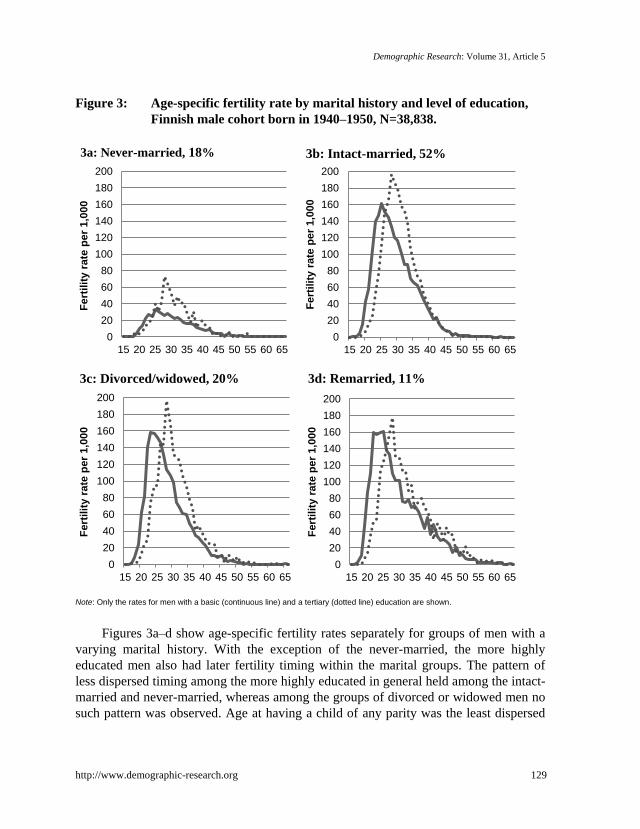
Figure 3: Age-specific fertility rate by marital history and level of education,
Finnish male cohort born in 1940‒1950, N=38,838.
Note: Only the rates for men with a basic (continuous line) and a tertiary (dotted line) education are shown.
Figures 3a‒d show age-specific fertility rates separately for groups of men with a
varying marital history. With the exception of the never-married, the more highly
educated men also had later fertility timing within the marital groups. The pattern of
less dispersed timing among the more highly educated in general held among the intact-
married and never-married, whereas among the groups of divorced or widowed men no
such pattern was observed. Age at having a child of any parity was the least dispersed
0
20
40
60
80
100
120
140
160
180
200
15 20 25 30 35 40 45 50 55 60 65
Fert
ilit
y r
ate
per
1,0
00
3a: Never-married, 18%
0
20
40
60
80
100
120
140
160
180
200
15 20 25 30 35 40 45 50 55 60 65
Fert
ilit
y r
ate
per
1,0
00
3b: Intact-married, 52%
0
20
40
60
80
100
120
140
160
180
200
15 20 25 30 35 40 45 50 55 60 65
Fert
ilit
y r
ate
per
1,0
00
3c: Divorced/widowed, 20%
0
20
40
60
80
100
120
140
160
180
200
15 20 25 30 35 40 45 50 55 60 65
Fert
ilit
y r
ate
per
1,0
00
3d: Remarried, 11%
Nisén et al.: Age-specific fertility by educational level in the Finnish male cohort born 1940-50
130 http://www.demographic-research.org
in the intact-married group and the most widely spread in the remarried group (IQR: 7.9
vs. 11.3 years).
We considered cohort trends by stratifying the analysis to the 1940‒1944 and
1945‒1950 birth cohorts, but the results were largely similar for both.
4. Conclusion
Among Finnish men born in the 1940s, those who acquired higher education showed
later, higher, and more concentrated fertility. Educational differences in fertility rates
crucially depended on age: the more highly educated had higher fertility rates from the
age of 26 onwards and higher cumulative fertility in their early thirties. Most of the
differences in completed fertility between the educational groups were shown by the
age of 45. Staying childless accounted for more than three-quarters of the educational
gradient in completed fertility, and only small differences by educational level were
found within the different marital groups.
Educational differences in age-specific fertility varied the most between men and
women in early adulthood. As reported elsewhere (Kiernan and Diamond 1983),
educational differences in fertility were larger among women than men in their late
teens and early twenties, the patterns becoming more similar as ages increased. In the
case of cumulative fertility, however, the educational gradients remained divergent
between men and women in this birth cohort, the more highly educated women ending
up having fewer children (see Nisén et al. 2014). Finland is a relatively gender-neutral
and egalitarian society, with income differentials that are modest on the international
level and similar levels of labour-market participation among men and women (Rønsen
and Sundström 2002; Jäntti, Saari, and Vartiainen 2006). Thus fertility differentials
between men and women by educational level may be closer in Finland than in other
countries.
Variation in the number of children among men with a basic education compared
to other educational groups (Toulemon 2000) is likely to contribute to their higher
overall variance in fertility timing. Relatively large numbers of the men with a low level
of education in the birth cohort under investigation remained childless or had one child
only – or went on to have three or more children. Given that the timing of the different
parities (especially the second and third) was more dispersed in the groups with lower
levels of education, we suggest that the differences in parity composition are not the
only reason for the pattern. The lower likelihood of men with a lower level of education
having an intact marriage seemed to be relevant to their more dispersed fertility timing.
These results support previous suggestions that fertility may be relatively heterogeneous
among men with a low educational level: both childlessness and having children with

Demographic Research: Volume 31, Article 5
http://www.demographic-research.org 131
multiple partners were found to be relatively common among such men in Norway
(Lappegård, Rønsen, and Skrede 2011; Lappegård and Rønsen 2013).
Overall, this article summarizes and details the current picture of men’s fertility in
the Nordic countries with respect to education (Kravdal 2007; Kravdal and Rindfuss
2008; Rønsen and Skrede 2010; Lappegård, Rønsen, and Skrede 2011; Lappegård and
Rønsen 2013). Methodological issues, such as response bias in surveys, may have
contributed to the fact that a positive educational gradient in fertility is not a standard
finding in the literature outside the Nordic countries. Differences due to contextual
factors such as family‒work reconciliation or the ethnic composition of the population
are also possible. A positive gradient in completed fertility among men may be more
likely in contexts in which it is more common for both women and men to have
children alongside other interests: this possibility is reflected in previously reported
cohort differences in educational gradients (Kravdal and Rindfuss 2008). The results of
this study emphasize the importance of life course in the occurrence of educational
differences in fertility among men.
5. Acknowledgements
Jessica Nisén acknowledges the support received from the Finnish Cultural Foundation
and the opportunity to work on the topic at the MPIDR. Pekka Martikainen (grants
1255388 and 9501264539) and Karri Silventoinen (grant 266592) were supported by
the Academy of Finland. Mikko Myrskylä was supported by the European Research
Council grant 2013-StG-336475. We thank Sandra Krapf, Mauri Nieminen, and Timo
Nikander for their helpful comments. We also thank anonymous reviewers and the
associate editor for their feedback.
Nisén et al.: Age-specific fertility by educational level in the Finnish male cohort born 1940-50
132 http://www.demographic-research.org
References
Barthold, J.A., Myrskylä, M., and Jones, O.R. (2012). Childlessness Drives the Sex
Difference in the Association Between Income and Reproductive Success of
Modern Europeans. Evolution and Human Behavior 33(6): 628‒638.
doi:10.1016/j.evolhumbehav.2012.03.003.
Becker, G.S. (1981). A Treatise on the Family. Cambridge, Massachusetts: Harvard
University Press.
Corijn, M. and Klijzing, E. (Eds.) (2001). Transitions to Adulthood in Europe.
European Studies of Population, Vol. 10. Dordrecht: Kluwer Academic
Publishers. doi:10.1007/978-94-015-9717-3.
Fieder, M. and Huber, S. (2007). The Effects of Sex and Childlessness on the
Association Between Status and Reproductive Output in Modern Society.
Evolution and Human Behavior 28(6): 392‒398. doi:10.1016/j.evolhumbehav.
2007.05.004.
Finnäs, F. (1993). Formation of Unions and Families in Finnish Cohorts Born 1938‒
67. Helsinki: Statistics Finland.
Goodman, A. and Koupil, I. (2010). The Effect of School Performance Upon Marriage
and Long-term Reproductive Success in 10,000 Swedish Males and Females
Born 1915-1929. Evolution and Human Behavior 31(6): 425‒435. doi:10.1016/
j.evolhumbehav.2010.06.002.
Jalovaara, M. (2012). Socio-Economic Resources and First-Union Formation in
Finland, Cohorts Born 1969-81. Population Studies 66(1): 69‒85. doi:10.1080/
00324728.2011.641720.
Jäntti, M., Saari, J., and Vartiainen, J. (2006). Growth and Equity in Finland. Helsinki:
World Institute for Development Economic Research. Working Paper
(DP2006/06).
Juby, H. and Le Bourdais, C. (1999). Where Have All the Children Gone? – Comparing
Mothers’ and Fathers’ Declarations in Retrospective Surveys. Canadian Studies
in Population 26(1): 1‒20.
Keizer, R., Dykstra, P., and Jansen, M.D. (2008). Pathways Into Childlessness:
Evidence of Gendered Dynamics. Journal of Biosocial Science 40(6): 863‒878.
doi:10.1017/S0021932007002660.

Demographic Research: Volume 31, Article 5
http://www.demographic-research.org 133
Kiernan, K.E. (1989). Who Remains Childless? Journal of Biosocial Science 21(4):
387‒398. doi:10.1017/S0021932000018125.
Kiernan, K.E. and Diamond, I. (1983). The Age at Which Childbearing Starts ‒ a
Longitudinal Study. Population Studies 37(3): 363‒380. doi:10.1080/003247
28.1983.10408867.
Kneale, D. and Joshi, H. (2008). Postponement and Childlessness: Evidence From Two
British Cohorts. Demographic Research 19(58): 1935‒1968. doi:10.4054/
DemRes.2008.19.58.
Kravdal, Ø. (2007). Effects of Current Education on Second- and Third-Birth Rates
Among Norwegian Women and Men Born in 1964: Substantive Interpretations
and Methodological Issues. Demographic Research 17(9): 211‒246.
doi:10.4054/DemRes.2007.17.9.
Kravdal, Ø. and Rindfuss, R.R. (2008). Changing Relationships Between Education and
Fertility – a Study of Women and Men Born 1940-64. American Sociological
Review 73(5): 854‒873. doi:10.1177/000312240807300508.
Lappegård, T. and Rønsen, M. (2013). Socioeconomic Differences in Multipartner
Fertility Among Norwegian Men. Demography 50(3): 1135-1153. doi:10.1007/
s13524-012-0165-1.
Lappegård, T., Rønsen, M., and Skrede, K. (2011). Fatherhood and Fertility. Fathering
9(1): 103‒120. doi:10.3149/fth.0901.103.
Liefbroer, A.C. and Corijn, M. (1999). Who, What, Where, and When? Specifying the
Impact of Educational Attainment and Labour Force Participation on Family
Formation. European Journal of Population 15(1): 45‒75. doi:10.1023/A:1
006137104191.
Lyngstad, T.H. and Jalovaara, M. (2010). A Review of the Antecedents of Union
Dissolution. Demographic Research 23(10): 257‒292. doi:10.4054/DemRes.
2010.23.10.
Nelson, T.J. (2004). Low-Income Fathers. Annual Review of Sociology 30(1): 427‒451.
doi:10.1146/annurev.soc.29.010202.095947.
Nettle, D. and Pollet, T.V. (2008). Natural Selection on Male Wealth in Humans. The
American Naturalist 172(5): 658‒666. doi:10.1086/591690.
Nikander, T. (1995). Suomalaismiehen perheellistyminen [Family formation of a
Finnish man]. Population 1995: 1. Helsinki: Statistics Finland.

Nisén et al.: Age-specific fertility by educational level in the Finnish male cohort born 1940-50
134 http://www.demographic-research.org
Nisén, J., Myrskylä, M., Silventoinen, K., and Martikainen, P. (2014). Effect of family
background on the educational gradient in lifetime fertility of Finnish women
born 1940–50. Population Studies Forthcoming: 1-17. doi:10.1080/00324728.
2014.913807.
Oláh, L. Sz. (2003). Gendering Fertility: Second Births in Sweden and Hungary.
Population Research and Policy Review 22(2): 171‒200. doi:10.1023/A:10
25089031871.
Oppenheimer, V.K. (1988). A Theory of Marriage Timing. American Journal of
Sociology 94(3): 563‒591. doi:10.1086/229030.
Parr, N. (2009). Childlessness Among Men in Australia. Population Research and
Policy Review 29(3): 319‒338.doi:10.1007/s11113-009-9142-9.
Pullum, T.W., Tedrow, L.M., and Herting, J.R. (1989). Measuring Change and
Continuity in Parity Distributions. Demography 26(3): 485‒498. doi:10.2307/
2061608.
Rendall, M.S., Clarke, L., Peters, H.E., Ranjit, N., and Verropoulou, G. (1999).
Incomplete Reporting of Men's Fertility in the United States and Britain: a
Research Note. Demography 36(1): 135–144. doi:10.2307/2648139.
Rønsen, M. and Skrede, K. (2010). Can Public Policies Sustain Fertility in the Nordic
Countries? Lessons from the Past and Questions for the Future. Demographic
Research 22(13): 321‒346. doi:10.4054/DemRes.2010.22.13.
Rønsen, M. and Sundström, M. (2002). Family Policy and After-Birth Employment
Among New Mothers – a Comparison of Finland, Norway and Sweden.
European Journal of Population 18(2): 121‒152. doi:10.1023/A:1015532305
179.
StataCorp (2009). Stata Statistical Software: Release 11. College Station, TX:
StataCorp LP.
Statistics Finland (1997). Vuoden 1950 väestölaskennan otosaineiston käsikirja
[Handbook of the 1950 census sample]. Handbooks 38. Helsinki: Statistics
Finland.
Thomson, E. ,Winkler-Dworak, M., and Kennedy, S. (2013). The Standard Family Life
Course: An Assessment of Variability in Life Course Pathways. In: Evans, A.
and Baxter, J. (eds.). Negotiating the Life Course: Stability and Change in Life
Pathways. Dordrecht: Springer: 35‒52. doi:10.1007/978-90-481-8912-0_3.

Demographic Research: Volume 31, Article 5
http://www.demographic-research.org 135
Toulemon, L. (2000). Demographic Patterns of Motherhood and Fatherhood in France.
In: Bledsoe, C., Lerner, S., and Guyer, J.I. (eds.) Fertility and the Male Life-
Cycle in the Era of Fertility Decline. New York: Oxford University Press Inc.:
293‒330.
Toulemon, L., Pailhé, A., and Rossier, C. (2008). France: High and Stable Fertility.
Demographic Research 19(16): 503‒556.doi:10.4054/DemRes.2008.19.16.
Weeden, J., Abrams, M.J., Green, M.C. and Sabini, J. (2006). Do Higher-Status People
Really Have Fewer Children? Human Nature 17(4): 377‒392. doi:10.1007/
s12110-006-1001-3.
Zhang, L. (2011). Male Fertility Patterns and Determinants. (Springer Series on
Demographic Methods and Population Analysis 27). Dordrecht: Springer.
doi:10.1007/978-90-481-8939-7.

Nisén et al.: Age-specific fertility by educational level in the Finnish male cohort born 1940-50
136 http://www.demographic-research.org