Embed Size (px)
Citation preview

AID 590
123
AGENCY FOR INTERNATIONAL DEVELOPMENT PPC/CDIE/DI REPORT PROCESSING FORM
ENTER INFORMATION ONLY IF NOT INCLUDED ON COVER OR TITLE PAGE OF DOCUMENT 1. Project/Subproject Number 2. Contract/Grant Number 3. Publication Date 4. Docum 5. Autho
6. Contr
7. Pagina 10. Abst
11. Subj 1. Ind 2. Sm 3. SM 12. Supp 13. Subm
…...…… 16. DOC
497-C-00-98-00045-00
Surve
Natha
497-0357
-7 (10/88)
. Ya
.
.
ent Title/Translated Title
r (s)
ibuting Organization (s)
tion 8. Report Number 9. Sponsoring A.I.D. Office
ract (optional - 250 word limit)
ect Keywords (optional)
onesia 4. ICT Use all & Medium Enterprises 5. Information & Communications TechE Exporters 6.
lementary Notes
itting Official 14. Telephone Number 15. Today’s
…………………………………….……………DO NOT write below this line…………………
ID 17. Document Disposition
y on Uses of Information & Communications Technology by Indonesian SME Exp
n/Checchi Joint Venture/PEG Project
3 ECG, USAID/Jakarta
7
DOCRD [ ] INV [ ] DUPLICATE [ ]
September 2001
orters
di S.A. Suriadinata
76
PEG 5nology
Date
………………….……………
1
011-62-21-520-104
3 October 200 C. Stuart Callison, Chief of Party
Case Study: Medan, Bandar Lampung, Jakarta, Bandung, Yogyakarta, Surabaya, Denpasar, And Makassar
PEG – USAID September 2001 Project Number : 497 - 0357 Strategic Objective Number: SO - 1 Sponsored by: : ECG, USAID/Indonesia Contract No. : 497-C-00-98-00045-00 Contractor : Nathan/ Checchi Joint Venture
VI - i
FOREWORD This survey of Internet and communication technology is aimed to illustrate the profile of Internet and communication technology used by Indonesian small and medium enterprises exporters. Main reasons for conducting this survey are: first, to learn the level of ICT uses by the business communities, especially those who were dealing with the international market and to see whether there serious effort by the business communities of facing the global market challenge. The uses of global communication are also probably one of the indicators on how international interactions between businesses have occurred among the SME exporters in Indonesia. The second, and equally important is the domestic challenges of the government and business communities on facing the biggest policy ever put forward by the Indonesian over the last 50 years. Decentralization or the regional autonomy bill applied since January 2000, is a challenges as well as an opportunities where, the Indonesians will lay their future and it is up to them whether they can achieve the main objectives to increase economic performance in regions and national level. This objective of the survey is to obtain information and perceptions of the SME exporters regarding their level of uses of ICT and their perception on the regional autonomy bill. The research team would be very pleased to obtain inputs from readers of this report, as it will enrich the finding and conclusions put forward in this report. The research team would like to express our humble appreciations to PEG - USAID for the support of the survey, to Mr. Suhartono for his recommendation to undertake the survey, and also to the enumerator’s team who have help the team for undertaking the interview and data gathering. Finally, the team would like to express our appreciation to Mr. James L. Mudge who initiated the study and to Mr. David J. Ray for his guidance to undertake the survey. The views expressed in this report are those of the author and not necessarily those of USAID, the U.S. Government or the Government of Indonesia. The team wishes that the findings of the survey would convey a positive contribution to the SME development in Indonesia. Research team, Yadi S.A. Suriadinata Principal Researcher
THE SURVEY TEAM
Principal Researcher: Yadi S.A. Suriadinata
Research Assistant: Tejo Pramono
Field Coordinator: Ilen A Kailani
Enumerators:Medan : Maskur AbdullahBandar Lampung : Dini MerianzaJakarta : Asep SuhermanBandung : M. FatwadiYogyakarta : TriyatminingsihSurabaya : Candra WiyanaDenpasar : ArsonetriMakassar : Ilham Iskandar
VI - ii
TABLE OF CONTENTS
Page
FOREWORD ..................................................................................................... i
TABLE OF CONTENTS................................................................................... ii
LIST OF TABLES.................................................................................... v
LIST OF FIGURES ........................................................................................... vi
1. INTRODUCTION ......................................................................................... I-1
1.1. Background .................................................................................................. I-1
1.2. The Objectives .................................................................................... I-2
1.3. Description of The Study ................................................................... I-3
1.4. Methodology ..................................................................................... I-4
2. REVIEW OF INTERNET DEVELOPMENT, SMALL AND MEDIUM ENTERPRISES (SMEs), AND REGIONAL AUTONOMY IN INDONESIA........................................................... II-1
2.1. Information & Communication Technology (ICT)............................. II-1
2.2. Development of Information & Communication Technology in
Indonesia ............................................................................................. II-2
Development of Computers and the Internet....................................... II-2
Development of Telephone Lines in Indonesia.................................... II-5
Development of Web Sites in Indonesia ............................................. II-6
2.3. Small and Medium Enterprises Exporters in Indonesia ..................... II-7
2.4. Implementation of Regional Autonomy Bill....................................... II-8

VI - iii
3. SME EXPORTERS: PROFILE, USES OF ICT, AND PERCEPTION
OF REGIONAL AUTONOMY ....................................................... III-1
3.1. Profile of SME Exporter Respondents ............................................... III-1
Computer User And Computer Ownership ......................................... III-3
Telephone Lines................................................................................... III-3
Market Information ............................................................................. III-5
Sources of Raw Material ..................................................................... III-6
3.2 Uses of ICT By SME Exporters .......................................................... III-8
SME Exporters Awareness of Internet Use for Business..................... III-8
Reasons for Subscribing to the Internet .............................................. III-10
Reasons for Not Using the Internet ..................................................... III-12
Accessibility of Internet By SME Exporters ........................................ III-13
Warung Internet (Warnet) ................................................................... III-15
Uses of the Internet.............................................................................. III-16
3.3. Perception of SME Exporters Toward Regional Autonomy .............. III-26
Impact of Regional Autonomy on the Business Climate ..................... III-27
Business Climate Perspective Based on Different Categories of SME III-28
City Perspective on Business Climate ................................................. III-29
Business Activities Prior to The Implementation of OTDA................. III-30
Propensity of Local Government Prior to Implementation of OTDA III-33
Main Causes of The Unconducive Business Climate ......................... III-35
Different Business Categories’ Perspective on The Main Causes of The Unconducive Business Climate ............................................... III-36
Cities Perspective on Business Climate ............................................. III-38
Problem Faced by SME Exporters ..................................................... III-39

VI - iv
One Stop Service III-41 Protection Toward SME Exporters ..................................................... III-42
4. CONCLUSION AND RECOMMENDATIONS .............................. IV-1
4.1 Conclusion ........................................................................................... IV-1
The Use of the ICT By SME Exporters ................................................. IV-1
Business Climate Prior to The Implementation of the Regional Autonomy Bill ....................................................................................... IV-4
4.2 Recommendation ................................................................................. IV-7
The Use of the ICT By SME Exporters ................................................. IV-7
Business Climate Prior to The Implementation of Regional Autonomy Bill ....................................................................................... IV-8
BIBLIOGRAPHY

VI - v
LIST OF TABLES
Page Table 2.1 Customer and User of Internet in Indonesia II-3
Table 2.2 The Map of Indonesia ISP Market by 2000 – 2001 II-4
Table 2.3 Total Internet Use per Hundred Population in Several Asian Countries
II-4
Table 2.4 Fixed Line in Indonesia Year 2000 II-5
Table 2.5 Telephone Line in Asia and USA II-6
Table 2.6 Total Web-site Address Under The Indonesian Code II-7
Table 2.7 Development of Total Small Enterprises in 1992 & 1996 II-8
Table 3.1.1 SME Exporters Profile in 8 Cities III-2
Table 3.1.2 Use of Computers and Telecommunication by SME Exporters in 8 Cities
III-4

VI - vi
LIST OF FIGURE
Page
Figure 3.1.1 SME Exporters Source of Market Information III-5
Figure 3.1.2 Supply of Raw Material of the SME Exporters III-6
Figure 3.1.3 Flow of Raw Material From Different Island For SME Exporters
III-7
Figure 3.1.4 Market Destination of SME Exporters in 8 Cities III-7
Figure 3.2.1 SME Exporters’ Responses on Information and Communication Technology
III-8
Figure 3.2.2 Internet Subscriber Among Different Categories of SME Exporters
III-9
Figure 3.2.3 SME Exporters Awareness of ICT for Business in 8 Cities
III-10
Figure 3.2.4 Objective Use of Internet Use by SME Exporters III-10
Figure 3.2.5 Responses from Different Categories of SME Exporters on Using Internet
III-11
Figure 3.2.6 SME Exporters Responses in 8 Cities III-12
Figure 3.2.7 Reason for SME Exporters for Not Using Internet III-13
Figure 3.2.8 Level of Internet Accessibility III-14
Figure 3.2.9 Internet Accessibility Between Different Number of Employee
III-14
Figure 3.2.10 SME Exporter Used of Warnet III-15
Figure 3.2.11 SME Exporters Internet Access Through Warnet III-16
Figure 3.2.12 The Impact of Having Web Site for SME Exporters
III-17
Figure 3.2.13 Impact of Web Site Based on Different Categories of SME Exporters
III-18
Figure 3.2.14 SME Exporters Web Site User in 8 Cities III-19
Figure 3.2.15 Uses of Internet by SME Exporter III-20
Figure 3.2.16 Use of Internet Based on Different Categories of SME Exporters
III-21
Figure 3.2.17 Use of Internet By SME Exporters in 8 Cities III-22
Figure 3.2.18 SME Exporters Visit to Government Web Site III-23
Figure 3.2.19 SME Exporters Access to Buyer and Raw Material Through Internet
III-24

VI - vii
Figure 3.2.20 Access to Buyer and Raw Material Between Different Categories of SME Exporters
III-24
Figure 3.2.21 Buyers and Raw Material Access Using Internet in 8 Cities
III-25
Figure 3.3. 1 Impact of New PERDA on Business Climate III-27
Figure 3.3. 2 Business Climate since Implementation of OTDA III-28
Figure 3.3. 3 SME Exporters Responses based on Different Categories
III-29
Figure 3.3. 4 Business Climate in 8 cities Prior Implementation of OTDA
III-30
Figure 3.3. 5 Problem Faced by SME Exporters Prior Implementation of OTDA
III-31
Figure 3.3. 6 Problem if Business based on Different Categories of SME Exporters
III-32
Figure 3.3. 7 SME Exporter Problem in 8 Cities III-33
Figure 3.3. 8 Perception of SME Exporters on Propensity of Local Government Prior to OTDA
III-34
Figure 3.3. 9 Perception of SME Exporters on Propensity of Local Bureaucracy Prior to the Implementation of OTDA
III-35
Figure 3.3. 10 Main Caused for The Unconducive Business Climate
III-36
Figure 3.3. 11 Main Caused for The Unconducive Business Climate Based on Local Condition
III-37
Figure 3.3. 12 SME Exporters Perception of Business Climate Based Attitude of Bureaucracy
III-38
Figure 3.3. 13 City Perspective on Business Climate Based on Local Condition
III-38
Figure 3.3. 14 City Perspective on The Attitude of Bureaucrat III-39
Figure 3.3. 15 Problems of Undertaking Export Activities III-40
Figure 3.3. 16 Problems of Obtaining Business Permit and Local Taxes
III-40
Figure 3.3. 17 Domestic and International Non-Tariff Barriers III-41
Figure 3.3. 18 One Stop Service III-42
Figure 3.3. 19 Protection for SME Exporters III-43

VI - 1
1. INTRODUCTION
1.1. Background
The rapid development of communication and information technology in recent
decades has provided changes in form of social, culture and economic relations to
among the communities in the world. These so-called globalization changes are
characterized by the ability of overcoming the space and time where human being
to communicate or sending data each other easily and cheaply. The ease of these
communication barriers has caused international economic activities become
faster as the whole continents were just as wide as the computer monitor.
Furthermore, the development of information technology have enable very large
amount of data and information organized in the web, which allow people to make
decisions more accurately and timely. This rapid development of information and
communication technology is a revolution to the social and economic interaction
among the history of human kind as some preferred to call as the new economy.
Economic crisis has taught us a lesson that the flawed structure of economic in
Indonesia relied on big-scales enterprises that have never capable to absorb the
large labor force in Indonesia have end up an economic disaster. The structure of
economic comprise of only few big-scale enterprises and millions of micro
enterprises that is unable to grow and become a formal small and medium
enterprise (SME) due to the economic and policy barrier. It is already too late
when the government realized that the largest employments were actually
provided by the informal sector of the SME. Study by USAID and other
institution indicated that the majority of SME in Indonesia consist of SME
without format status, due to the barriers created by the bureaucracy and illogical
policy of the government.
VI - 2
The fall of rupiah prior to the economic crisis have also open up the government
view of the importance aspects of encouraging export on resources based product
and this type of export commodity were mostly carried out by the SME. However,
the SME were experiencing lots of problems in undertaking these export
activities. Firstly, is the bureaucracy barrier concerning in obtaining business
license and permits and high business costs created by the bureaucracy. The other
is the implementation of the new regional autonomy bill starting on January 2000.
Furthermore, there is a crucial need of allowing the business and the communities
to keep pace with the global information era through use of the Information and
Communication Technology. In the context of the situation mentioned above, the
government of Indonesia has asked the support of PEG-USAID to learn and
exercise means to development the SMEs exporters in Indonesia. This study will
look into the uses of ICT by the SME exporters and also to obtain information of
their perception of the implementation of the new regional autonomy bill (U.U
No. 22 and 25 year 1999) in 8 big cities in Indonesia.
1.2 The Objectives
The purpose of this study is to obtain information on the:
1. Incidence of computer use by exporters
2. Incidence of Internet use by exporters
3. Degree to which exporters are using the Internet
4. The impact of decentralization on the business climate for SMEs
VI - 3
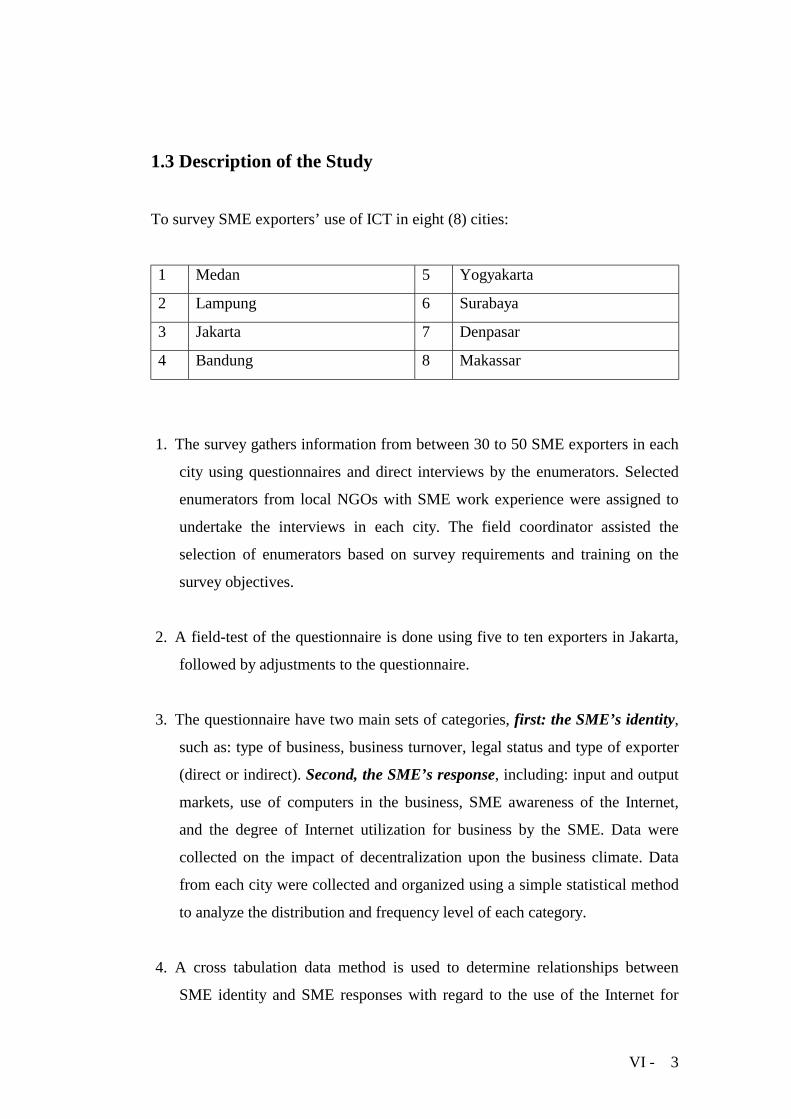
1.3 Description of the Study
To survey SME exporters’ use of ICT in eight (8) cities:
1 Medan 5 Yogyakarta
2 Lampung 6 Surabaya
3 Jakarta 7 Denpasar
4 Bandung 8 Makassar
1. The survey gathers information from between 30 to 50 SME exporters in each
city using questionnaires and direct interviews by the enumerators. Selected
enumerators from local NGOs with SME work experience were assigned to
undertake the interviews in each city. The field coordinator assisted the
selection of enumerators based on survey requirements and training on the
survey objectives.
2. A field-test of the questionnaire is done using five to ten exporters in Jakarta,
followed by adjustments to the questionnaire.
3. The questionnaire have two main sets of categories, first: the SME’s identity,
such as: type of business, business turnover, legal status and type of exporter
(direct or indirect). Second, the SME’s response, including: input and output
markets, use of computers in the business, SME awareness of the Internet,
and the degree of Internet utilization for business by the SME. Data were
collected on the impact of decentralization upon the business climate. Data
from each city were collected and organized using a simple statistical method
to analyze the distribution and frequency level of each category.
4. A cross tabulation data method is used to determine relationships between
SME identity and SME responses with regard to the use of the Internet for

VI - 4
business, and between different SMEs identities and responses. Furthermore,
cross tabulation data between different cities and different SMEs were
undertaken to explore the use of the Internet by different categories of SME
in different places.
1.4 Methodology
This study is conducted to describe or take a picture on how the small and
medium enterprise-exporters use computer and Internet to support their business
activity. By describing or taking a picture only, this study is, of course, unable to
answer the questions that expect the information on definite amount, type of
business, and scale of business of the small and medium enterprises-exporters in
using the computer and Internet.
However, the description or picture found in this study are sufficient to provide
information and as a base in preparing the policies related to the development of
export performance by small and medium enterprises and policies on the
development of information and communication technology as one of the main
infrastructure in business activity.
The method applied in this study is descriptive analysis from primary data
obtained through direct interview with exporters and secondary data available in
the area where this study was conducted. The manipulation or data processing
obtained in the survey was done by cross tabulation of the respondent’s answers
(small and medium enterprises-exporter) upon the questions as put forward
through the structured questionnaires.
The study’s survey was conducted in 8 big cities throughout Indonesia, namely,
Medan, Bandar Lampung, Jakarta, Bandung, Yogyakarta, Surabaya, Denpasar,
and Makassar. All are the capital cities of provincial and they are considered as

VI - 5
cities having high export performance, and having Internet network. In those
cities, the total small and medium enterprise-exporters being interviewed were 50
enterprises under the even distribution of the present type of business that is
agriculture, manufacture, trade and other services.
Apart from analyzing the use of computer and Internet rate by small and medium
enterprises-exporters, this study also observed the impact of regional autonomy or
decentralization implementation as it is applied since January 1st, 2001. Analyzing
on the impact of regional autonomy implementation, information from small and
mid enterprises was gathered on what their perception about the regional
autonomy implementation. The analysis on regional autonomy against SME-
exporters is also performed by using cross-tabulation from the answering
frequency upon the questionnaires.
VI - 1
2. REVIEW OF INTERNET DEVELOPMENT, SMALL AND
MEDIUM ENTERPRISES (SMEs) AND REGIONAL
AUTONOMY IN INDONESIA
2.1. Information & Communication Technology (ICT)
At the beginning, Internet is a technology developed for military defense purpose
in the United States of America military headquarter Pentagon, In its advanced
development, Internet technology eventually used widely by the world
community, and since then it had been growing very rapidly. The computer
technology prior to the Internet era were only used for words and data processing.
However, the combination of computer and Internet technology were now used as
the backbone of the world wide web network.
Through this web network, the computer user using Internet connection perform
data and information exchange throughout the world without distance barrier. The
requirement needed to be connected to this world wide web network simply a
telephone line or satellite through and the Internet service provider (ISP) to bridge
the telephone line and the world wide web network.
The development of World Wide Web network is growing very rapidly in the
developed nations due to the availability of the availability of infrastructure and
utilities to support the network, using very low cost digital data exchange via a
file transfer protocol (FTP). This digital data transfer is then used to transfer data
through email (electronic mail) where previously were transferred through
facsimile and courier services.
The information and communication technology keeps on developing, followed
by the innovation of HTML (hyper text markup language). The personal or

VI - 2
company web site can be developed using HTML to as an illustration window to
present visible information accessible from every part of the world. Through this
web site the presented information can be seen from anywhere, so the efforts to
find out information can be done virtually through the computer monitor. The web
site is mostly used for information and promotional media, and the further
progress is on-line transaction for comers and banking.
The development of Internet currently is not only enjoyed by the developed
countries but also in the developing countries. A survey conducted by Data Quest
assumed that the Asian Pacific region, included Japan in 2003 will be the biggest
Internet user in the world, with a total of 183,3 million customers. This total
number is bigger then the United States of America of having 162,8 million
customers and West Europe with 162,2 million customers.
Meanwhile, the total business value of information technology by 1998 was US$
274,3 million. And then increased in 1999 with total value of US$ 638,4 million.
Then in 2000 about US$ 772,9 million and it is estimated that by 2001 the total
value would be about US$ 982,4 million, and in 2002 estimated will be close to
US$ 1,2 billion.
2.2 Development of Internet & Communication Technology in Indonesia
Development of Computer and Internet
The user of Internet in Indonesia is classified into two categories, the Internet
subscribers of ISP and non-subscriber. Internet subscribers of ISP are considered
as the permanent subscriber Internet user, while non-subscribers of ISP are those
accessing Internet through Warung Internet (warnet). And in Indonesia the biggest
Internet user group is the non-subscribers of ISP (See Table 2.1. below).

VI - 3
Computer in Indonesia is still considered as luxury goods especially since the
economic crisis and the fall of rupiah, even after government have lift computer
from the luxury good lists quite recently. The majority of the warnet users
considered that the advantages of using warnet is because they don’t have to pay
telecommunication fee, spend money on computers, pay the subscriber fee to the
ISP. Based on the data issued by the warnet association ‘natnit.net’ web site, the
total existing warnet at present is approximately 1.151 kiosks
Table 2.1. Customer and User of Internet In Indonesia (1996 – 2001)
Year Customer User Remark 1996 31.000 110.000 1997 75.000 384.000 1998 134.000 512.000 1999 256.000 1.000.000 Estimation 2000 384.000 1.450.000 Estimation 2001 511.000 1.980.000 Estimation
Source : apjii.or.id
At present are about 147 licenses of ISP issued by the government, however; only
55 companies were in operational in the big cities. This situation has created
competitions among the ISP and have reduced subscriber fee to the lowest level,
which is beneficial for the costumer. According to the Indonesia Internet
services association (APJII) on February, 2001, only 10 ISPs were the choice of
80% customers, and among them 4 ISPs are with the biggest with 49 percent of
the existing customers. The tens ISPs were respectively idola.net.id, centrin.net.id,
cbn.net.id, dnet.net.id, indo.net.id, indosat.net.id, mega.net.id, wasantara.net.id,
rad.net.id, dan telkom.net.id (see Table 2.2, below). Furthermore, of these tens
ISPs wasantara.net.id has the widest branches to over 133 cities in Indonesia,
second in line is tekom.net.id with covers 125 cities in Indonesia. The services
provided by these ISPs were e-mail, browsing tools, file transfer protocol (FTP),
Internet relay chat (IRC), cyber café, web hosting, and web page design.

VI - 4
Table 2.2. The Map of Indonesia ISP Market by 2000 - 2001
ISP CUSTOMER (subscribers) LinkNet 100.000 TelkomNet 100.000 IndosatNet 41.000 CBN 35.000 IndoNet 15.000* RadNet >20.000 Centrin >20.000 Dnet >10.000 MegaNet >10.000 Idola 4.000**
Sourace: APJII Note: *) for Jakarta only **) majority of company
However, the Internet utility rate in Indonesia is still lower compared with other
country in Asia. This is indicated by only 2 million people or less than 1 percent
of the total 210 million population. Comparison of the Internet user in Indonesia
and the other Asian countries can be seen in the following table.
Table 2.3. Total Internet Use Per Hundred Populations in Several Asian Countries
Country Internet Penetration % Singapore 46.0 South Korea 43.0 Taiwan 36,4 Hong Kong 29.5 China 23.0
Source : Indonesia Cyber Industry and Market, 2001 The total Internet user in Asia Pacific at the moment 25.7 million user and it is
predicted to be 141 million users by 2004, while in Indonesia it is estimated will
reach by 8 million. This low of Internet utility rate in Indonesia is among others is
due the low of computer ownership. Based on a study conducted by International
Data Corporation indicated that in several big cities in Indonesia there are only 5

VI - 5
computers only per hundred person, and this is much lower and some time there
are no computer in rural area. Such condition is much different compared to
Malaysia, at the moment there are 8 computers per one hundred households and
Philippine 4 computers per 100 households.
Development of Telephone Lines in Indonesia
Apart from the low rate of computer ownership, the other reason for low Internet
user in Indonesia is the availability of telephone lines. Total capacity of telephone
line (SST) for personal use at present is only 8,46 million (report of PT. Telkom
second quarter of 2000), with 7,58 million total lines installed and 6,2 million
subscriber. This amount is excluded the existing 320.000 unit public phone
booths. Under this condition, there are only 3 telephone lines per 100 persons or
100 persons compete for 3 telephone lines (See Table 2.4).
Table 2.4. Fixed Line In Indonesia in Year 2000
Indicators Telkom Division KSO Division Total Capacity 4.533.167 3.929.204 8.462.371 Installed 4.057.693 3.525.655 7.853.348 Subscribers 3.336.823 2.871.024 6.207.847 Public Phone 202.257 125.675 327.932 Line in Services 3.539.080 2.996.699 6.535.779 New Lines 282.088 173.498 455.586
Source : PT Telkom, 2nd quarter 2000
VI - 6
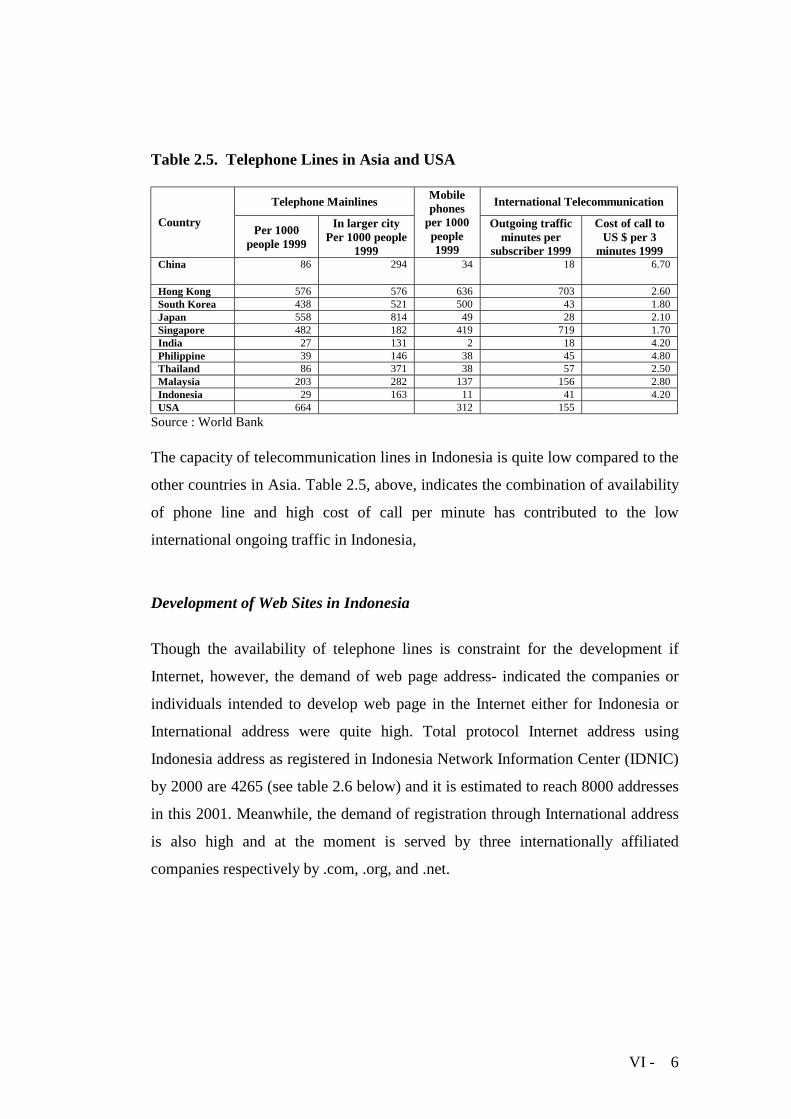
Table 2.5. Telephone Lines in Asia and USA
Telephone Mainlines International Telecommunication
Country Per 1000 people 1999
In larger city Per 1000 people
1999
Mobile phones
per 1000 people 1999
Outgoing traffic minutes per
subscriber 1999
Cost of call to US $ per 3
minutes 1999 China 86 294 34 18 6.70
Hong Kong 576 576 636 703 2.60 South Korea 438 521 500 43 1.80 Japan 558 814 49 28 2.10 Singapore 482 182 419 719 1.70 India 27 131 2 18 4.20 Philippine 39 146 38 45 4.80 Thailand 86 371 38 57 2.50 Malaysia 203 282 137 156 2.80 Indonesia 29 163 11 41 4.20 USA 664 312 155
Source : World Bank The capacity of telecommunication lines in Indonesia is quite low compared to the
other countries in Asia. Table 2.5, above, indicates the combination of availability
of phone line and high cost of call per minute has contributed to the low
international ongoing traffic in Indonesia,
Development of Web Sites in Indonesia
Though the availability of telephone lines is constraint for the development if
Internet, however, the demand of web page address- indicated the companies or
individuals intended to develop web page in the Internet either for Indonesia or
International address were quite high. Total protocol Internet address using
Indonesia address as registered in Indonesia Network Information Center (IDNIC)
by 2000 are 4265 (see table 2.6 below) and it is estimated to reach 8000 addresses
in this 2001. Meanwhile, the demand of registration through International address
is also high and at the moment is served by three internationally affiliated
companies respectively by .com, .org, and .net.

VI - 7
Table 2.6. Total Web Sites Address under the Indonesia Code
Domain Numbers co.id 2.159 Web.id 723 or.id 693 Sch.id 532 ac.id 78 net.id 48 war.net.id 31 mil.net 1 Total 4265
Source: Indonesia Cyber Industry & Market, 2001 2.3. Small and Medium Enterprise Exporters in Indonesia
Since the economic crisis, the Small and Medium Enterprises (SME) have become
the major attention of the government and other international agencies. This major
attention from the government is not only due to the fact that SME are more
flexible to overcome the financial crisis, but more importantly because the SME
were also the main sources of employments in Indonesia. As the government is
now really working hard to help the development of SME, however, on the other
hand the main sources of barrier to the development of SME were also in the hand
of the government itself.
This situation is mainly due to; first, government will always come up with
protection and support policies that are contradicting with the needs of the SME.
In most case the protection and support policies were always end up given to the
one that actually does not require any support from the government. Furthermore,
the extensive job opportunity created by SMEs, are extremely important to
accommodate the growing unemployment prior to the collapse of the big
companies. Total numbers of SME in Indonesia in 1996 were about 39 million
units, comprising of 38,895,262 small-scale enterprises and 41,173 medium scale
enterprises according to BPS, 1999 (see tabel.2.7 below).
VI - 8
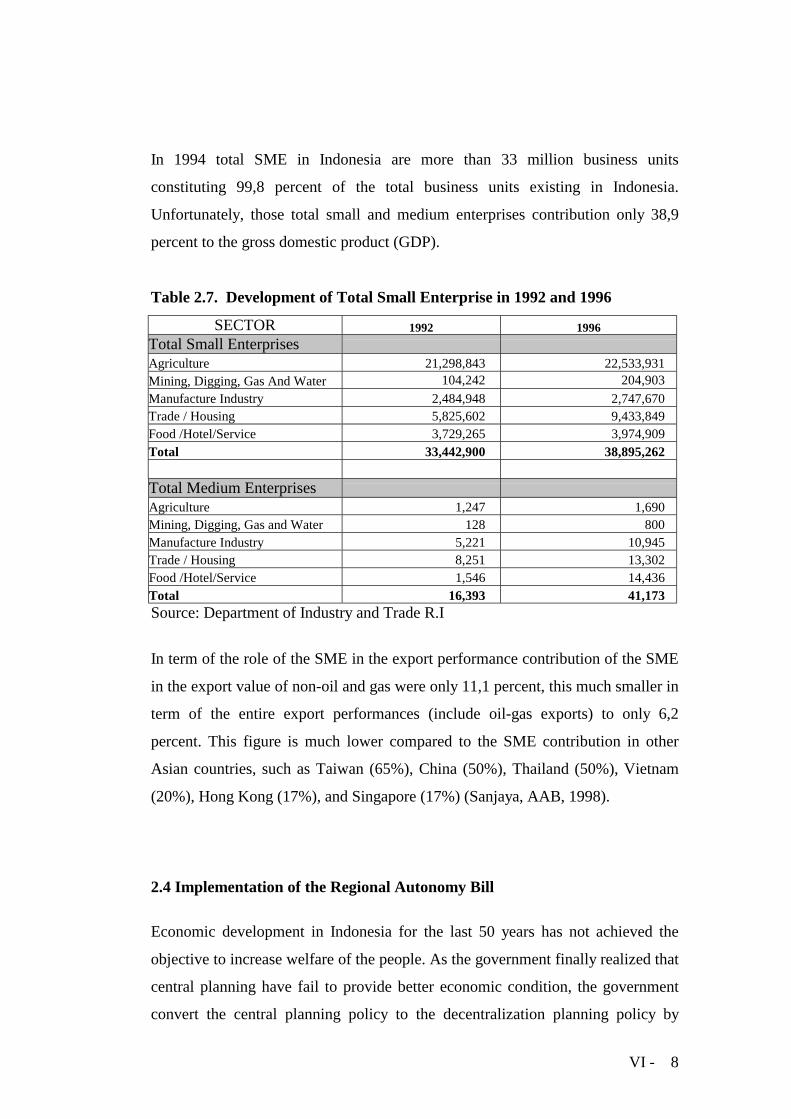
In 1994 total SME in Indonesia are more than 33 million business units
constituting 99,8 percent of the total business units existing in Indonesia.
Unfortunately, those total small and medium enterprises contribution only 38,9
percent to the gross domestic product (GDP).
Table 2.7. Development of Total Small Enterprise in 1992 and 1996
SECTOR 1992 1996 Total Small Enterprises Agriculture 21,298,843 22,533,931 Mining, Digging, Gas And Water 104,242 204,903 Manufacture Industry 2,484,948 2,747,670 Trade / Housing 5,825,602 9,433,849 Food /Hotel/Service 3,729,265 3,974,909 Total 33,442,900 38,895,262 Total Medium Enterprises Agriculture 1,247 1,690 Mining, Digging, Gas and Water 128 800 Manufacture Industry 5,221 10,945 Trade / Housing 8,251 13,302 Food /Hotel/Service 1,546 14,436 Total 16,393 41,173 Source: Department of Industry and Trade R.I
In term of the role of the SME in the export performance contribution of the SME
in the export value of non-oil and gas were only 11,1 percent, this much smaller in
term of the entire export performances (include oil-gas exports) to only 6,2
percent. This figure is much lower compared to the SME contribution in other
Asian countries, such as Taiwan (65%), China (50%), Thailand (50%), Vietnam
(20%), Hong Kong (17%), and Singapore (17%) (Sanjaya, AAB, 1998).
2.4 Implementation of the Regional Autonomy Bill Economic development in Indonesia for the last 50 years has not achieved the
objective to increase welfare of the people. As the government finally realized that
central planning have fail to provide better economic condition, the government
convert the central planning policy to the decentralization planning policy by

VI - 9
establishing new policy on authority is then materialized in the new Regional
Autonomy Bill (UU No. 22 and 25 year 1999) in active by January 1st 2001. The
main objectives of this regional autonomy bill are to transfer some of the the
authority and fiscal to the regional.
The main issues of the regional autonomy bill, is to enable regional government
utilized and allocated the regional resources to the benefit of the regional
communities. Regional planning should be under the decision of the regional
communities needs rather then what the central government needs.
Unfortunately, the implementation of the regional autonomy is taking place under
the uncertainty of the national politics and during the worse economic crises
occurred in Indonesia. It is also clearly seen that the main issues of regional
autonomy were overlapping with political agenda in the central government.
Therefore, this decentralization process were also have created the disintegration
threat in several regions. This disintegration threat is mainly due to the unequal
distribution of development occurred during the previous central planning policy.
Furthermore, regional resources previously were extracted from the region with
out proper composition to the regional communities and development.
There are still no sign of economic recovery after almost 20 months prior to the
implementation the regional autonomy bill. In most of the off Java regions, the
local government is having serious problem on budget allocation, due to their very
small local government revenues. The only possible sources of local government
income to date is by establishing additional taxes, local retribution and levies to
the communities, especially to the business. The other ironic, consequences are
there is a tendency on further degradation of environment caused by extraction of
the natural resources.

VI - 10
Regional government sometime have to deal with having to choose between
providing conducive business climate and have to faced with insufficient budget
for the regional needs or to enforce additional income by enforcing new taxes and
levies to the business that will also end up with slow regional economic
development.
VI - 1
3. SME EXPORTERS: PROFILE, USES OF ICT AND PERCEPTION OF REGIONAL AUTONOMY
3.1. Profile of SME Exporter Respondents
The interview conducted in this study is to collect the data of small and medium
enterprises-exporter from 8 big cities in Indonesia. The total of respondent
surveyed are 417 SME exporters with the total number of SME in each city as
follows: Medan (53), Lampung (50), Jakarta (63), Bandung (50), Yogyakarta (50),
Surabaya (50), Denpasar (51), dan Makasar (50).
Of the 414 responses given by SME exporter, the types of business were divided
into three categories, namely: industry/manufacture (52,2%), agriculture (9,2%),
trade (38.3%). The legal statuses of the enterprises are as follows: Limited
Liability Company, Ltd., Inc./ PT (52,4 %), Limited Partnership/CV (23,9%),
Cooperative (1,7%), Trade business (UD) and others (22%).
Based on 389 answers given by the SME exporter it is found the total employees
were as follows: total employees 1-6 persons (13,9 %), total employees 7 – 50
persons (45,2 %), total employees 51 – 100 persons (16,5 %), total employees 101
- 200 persons (12,6 %), total employees 201 – 499 persons (9 %), and total
employees more than 500 persons (2,8 %).
Based on the status of share ownership, the SME exporter (404 respondent’s)
answers were mostly under the status of private/national-owned enterprises
(90,3%), foreign-owned enterprises (2,2%), and joint-venture (7,4%).
In terms of the per annum turnover, of the 345 answers, the SME are consist of:
36,6 % of enterprises with turnover less than 200 million per annum, 38 % of
enterprises with turnover 200 million to 1 billion per annum, 17,7 % of enterprises

VI - 2
with turnover 1 to 10 billion per annum, and 7,5 % of enterprises with turnover
more than 10 billion per annum.
The survey is also indicated that based on the category of the modus of export,
from the 412 responses by the SME, 24,8% were under the non-direct exporter
categories, while those of the direct exporter are 75.2 %.
Table 3.1. SME Exporter Profile in 8 Cities
Description Total % Type of business
Industry/manufacture 216 51,8 Agriculture 38 9,1 Trade/comers 160 38,3 No answer 3 0,7 Total 417 100
Total employee 1 – 6 employee 54 12,9
7 – 50 employee 176 42,2 51 – 200 employee 113 27.1 201 – 499 employee 35 8,4 >500 employee 11 2,6 No answer 28 6,7 Total 417 100
Legal status Limited Company 217 52
Limited partnership 99 23,7 Cooperative 7 1,7 Other 91 21,8 No answer 3 0,7 Total 417 100 Share ownership National 365 87,5 Foreign 9 2,2 Join venture 30 7,2 No answer 13 3,1 Total 417 100 Per annum turnover < Rp 200 million 127 30,5 Rp 200 – Rp 1 billion 131 31,4 Rp 1 – Rp 10 billion 61 14,6 > Rp 10 billion 26 6,2 No answer 72 17,3 Total 417 100 Mode of Export Direct exporter 310 74,3 Non-direct exporter 102 24,5 No answer 5 1,2 Total 417 100

VI - 3
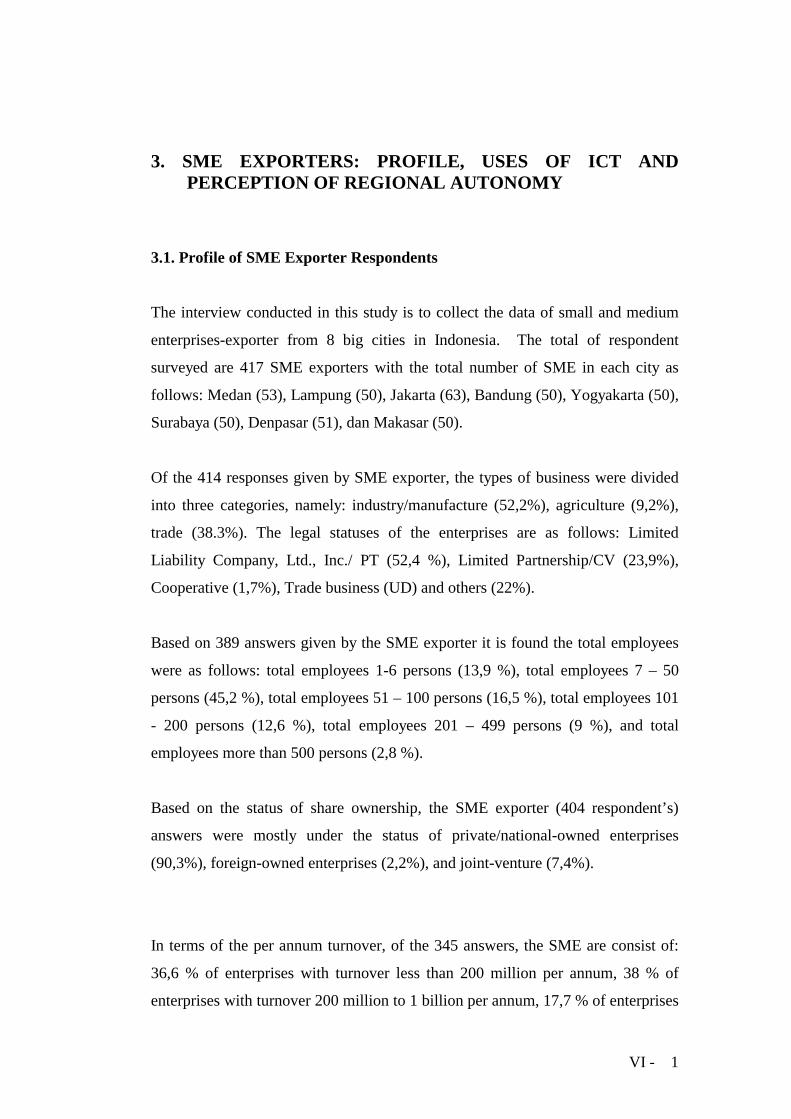
Computer User And Computer Ownership
Approximately 85,5% of the SME exporters have used computer to support their
business activity, while the remaining 14,5% have not used computer in their
business activities. The total computer ownership comprise of: 75 % from 1 to 5
computers, 6 to10 computers (16%), 10 to 15 computers (3,2%), and those having
more than 15 computers (4,9%).
The degrees of computer uses by SME exporters are as follows: 60 % stated to use
computer for management and Internet activity. While 20 % stated to use
computer for the company management only, and 4.1 % is for correspondence
only. Furthermore, only 31,2% of SME exporter used local area network (LAN)
and the remaining 57.3 % ware using stand-alone computer.
Telephone Lines
Most of the SME exporter have telephone lines, however, the number of phone
lines used by the SME are as follow: 1-3 telephone lines (74.6%), 4-7 telephone
lines (19.7%), 8-11 telephone lines (1.2%), the rests, 1,7% have more than 11 line.
Furthermore, approximately 58,2 % SME indicated that that it is difficult for them
to obtain additional, while the remaining 41,8% stated that there is no problem in
obtaining additional telephone lines and.
In the context of the phone line usage, 22.5 % of SME exporters indicated that
they have used special phone lines to access the Internet, 28.3% used the phone
lines for Internet access and fax machine, and the remaining 22.8 % used the
phone line for all purpose of communication (telephone, facsimile and Internet).
VI - 4
Table 3.2. Uses of Computers and Telecommunication by SME Exporters in
8 Cities
Description Total %
Computer used Yes 353 84,7
No 60 14,4 No answer 4 1 Total 417 100 Computer ownership 1 – 5 254 60,9 6 – 10 63 15,1 11 – 15 11 2,6 16-20 6 1,4 20-25 3 0,7 >25 8 1,9 No answer 72 17,3 Total 417 100 Uses of computer Correspondence 17 4,1
Administration & managements 84 20,1
Managements & Internet 250 60 No answer 66 15,8 Total 417 100 Local Area Network Yes 130 31,2 No 239 57,3 No answer 48 11,5 Total 417 100 Number of phone line 1 - 3 311 74,6 4 - 7 82 19,7 8 - 11 5 1,2 >11 7 1,7 No answer 12 2,9 Total 417 100 Problem to obtain additional lines Yes 166 39,8 No 231 55,4 No answer 20 4,8 Total 417 100 Uses of phone line Internet only 94 22,5 Internet and facsimile 118 28,3 All purpose of communication 110 26,4 No answer 95 22,8 Total 417 100

VI - 5
Market Information
In the context of market information on buyers and raw materials, the SME
exporters indicated that their business partner were the main sources of market
information for the SME. Figure 3.1.1, shows that the other resources for market
information is through promotions and exhibitions event, followed by government
and private agencies, printing media and Internet (see figure 3.1.1.)
Based on the figure above, market information sources from the Internet are very
low compared to the other sources. However, from the interview with the SME
exporter discussed in the next chapter, the use of Internet for market information
purpose is showing an increasing demand by the SME exporters. The SME also
indicated that the use of Internet will help them to remove information barrier in
the future, provided that the government set up policies on wider access on ICT.
0% 20% 40% 60% 80%
Printing media
Internet
Government & Private insttution
Exhibitions
Business Partners
Figure 3.1.1 SME Exporters Sources Of Market Information
Raw material informationMarket Information
VI - 6
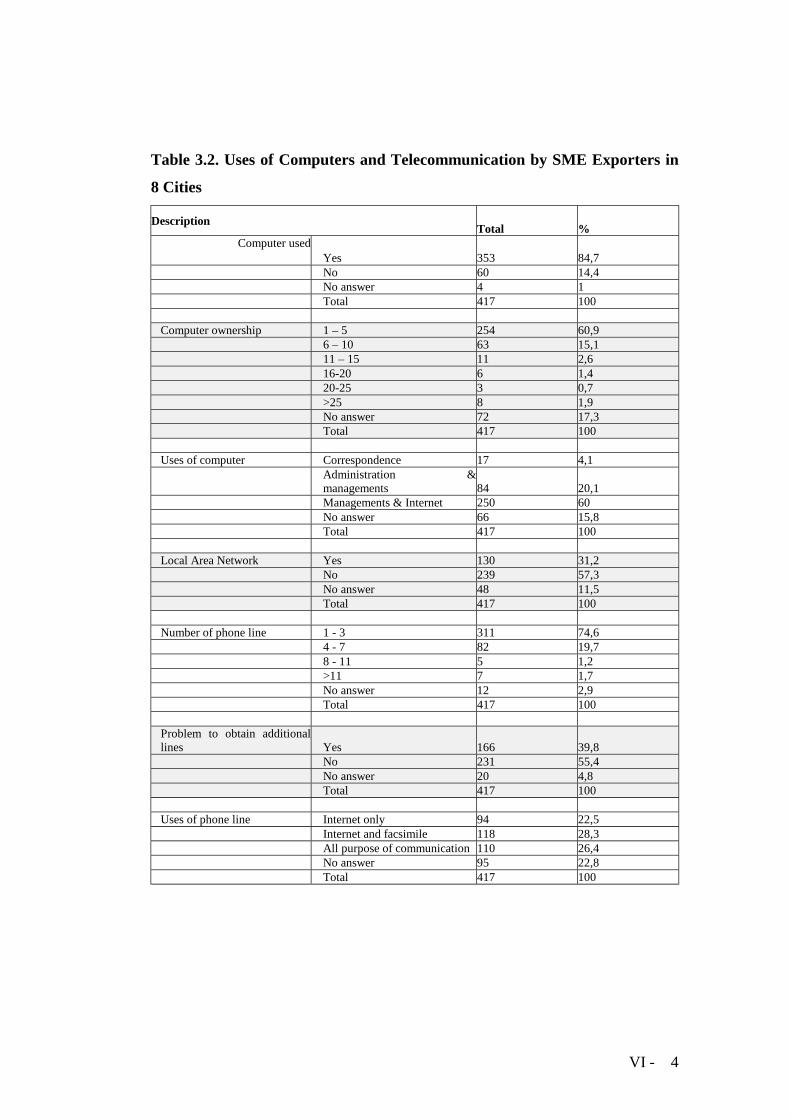
Sources of Raw material
Figure 3.1.2. and Figure 3.1.3, below indicated that the main sources of raw
material supply for the SME exporter were from their own surroundings areas.
This gave stronger indication that the main export products of the SME exporter
were the natural resources based product which is mostly produced by the local
communities. The import content of the SME exporters raw material needs were
mainly for the secondary material needs.
Figure 3.1.4, shows the local market destination of the product of the SME
exporter. The SME in Yogyakarta and Denpasar have a wider market compared to
the other cities, however most of the SME exporter in Lampung were selling their
product for export and to the other provinces.
0% 10% 20% 30% 40% 50% 60% 70% 80% 90%
Medan
Lampung
Jakarta
Bandung
Yogyakarta
Surabaya
Denpasar
Makassar
Figure 3.1.2 Supply of Raw Material of The SME Exporters
Within region Within province Outside province Imported

VI - 7
0% 10% 20% 30% 40% 50% 60% 70%
Medan
Lampung
Jakarta
Bandung
Yogyakarta
Surabaya
Denpasar
Makassar
Figure 3.1.4 Market Destination of SME Exporters in 8 Cities
Within city/region Within province Outside province Only for export
0% 10% 20% 30% 40% 50% 60% 70% 80% 90% 100%
Medan
Lampung
Jakarta
Bandung
Yogyakarta
Surabaya
Denpasar
Makassar
Figure 3.1.3 Flow of Raw Material From Different Island For SME Exporters
Sumatra Jawa Kalimantan Sulawesi Nusa Tenggara Maluku Irian

VI - 8
3.2. Use of ICT by SME Exporters
SME Exporter Awareness of Internet Use For Business
The rapid development of Internet in most of the big cities in Indonesia has made
this information and communication technology as a common tool of business by
SME exporters. Based on the survey, approximately 98% of the respondent
indicated that they have read articles concerning the use of Internet for business
purpose. However, only about 89% of them indicated that they understand the
application of Internet for business, and meanwhile only about 71% of the SME
exporters surveyed were subscriber of Internet (see Figure 3.2.1).
Figure 3.2.1 SME Exporters Responses on Information and Communication Technology
71%
89%
96%Read article on the use of internet for business
Understand The Use of Internet for Business
Internet subscriber
There are no significant different in use of Internet between different type of
business (manufacture, agriculture and trading) categories of the SME exporters,
however, the non-direct exporter SME were respondent with the lowest
knowledge of Internet and the lowest Internet subscriber among all categories.
Furthermore, form the graphic 3.2.2. (below), there is a tendency that the Internet
subscriber of the SME exporter is lower among the smaller yearly turnover
compare to the SME exporter with the bigger business turnover.

VI - 9
Figure 3.2.2 Internet Subscriber Among Different Categories of SME Exporters
0% 10% 20% 30% 40% 50% 60% 70% 80% 90% 100%
Manufacture
Trading
< Rp 200 million
Rp 1 - 10 billion
Yearly Turnover
Non-direct exporter
Understand The Use of Internet for Business Internet Subscriber
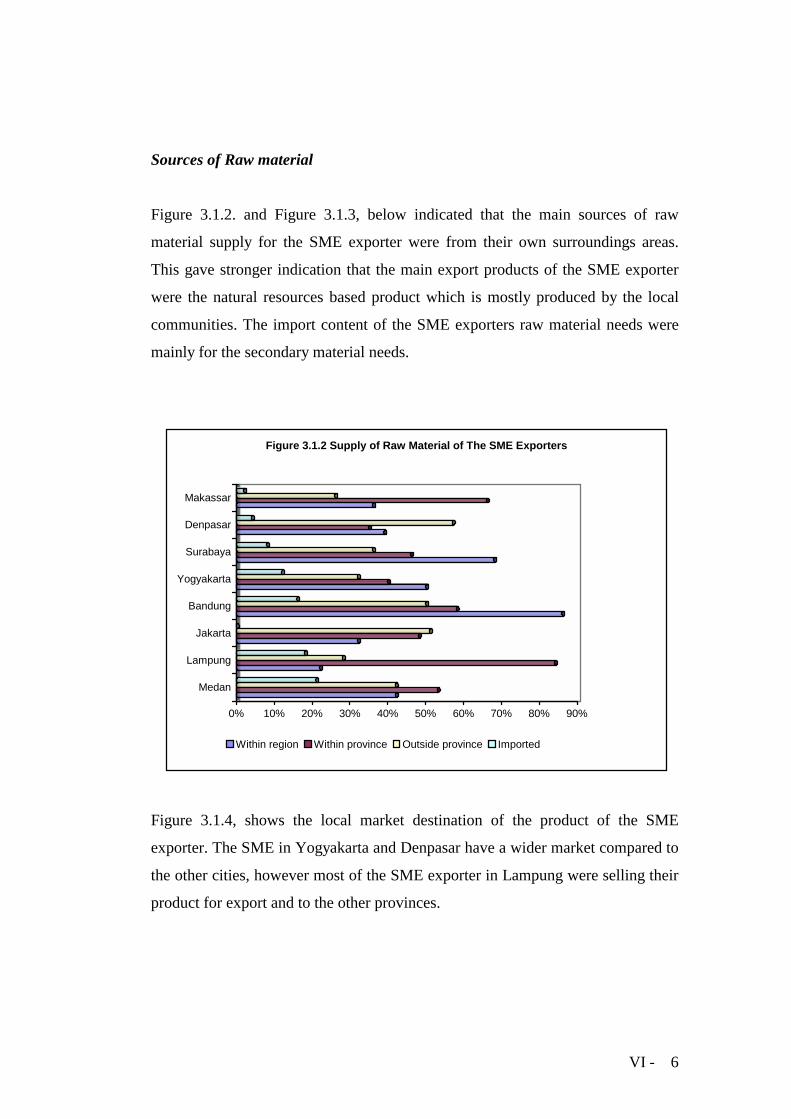
In the context of comparison between the 8 cities in this survey, the level of
understanding on the use of Internet for business and number of Internet
subscriber in figure 3.2.3. (below), indicated that the number of SME exporter in
Bandar Lampung have the lowest level of understanding the use of Internet in
business, and Medan has the lowest level on Internet subscriber. Meanwhile, the
SME exporters in Jakarta have the highest level of understanding on the use of
Internet for business and number of Internet subscriber between the 8 cities
surveyed.
The rate of SME’s understanding on the use of Internet for business were higher
than number of Internet subscriber. However, as exporters it is very important for
the SME to use the Internet for communication with their buyer, and the Internet
is a more practical and efficient communication tool for the SME. The reason for
use of Internet by SME exporters will discuss in the other part of this report.
VI - 10
Figure. 3.2.3 SME Exporters Awerness of Use of ICT for Business in 8 Cities
0% 10% 20% 30% 40% 50% 60% 70% 80% 90% 100%
Medan
Lampung
Jakarta
Bandung
Yogyakarta
Surabaya
Denpasar
Makassar
Understand the usage of Internet Internet user
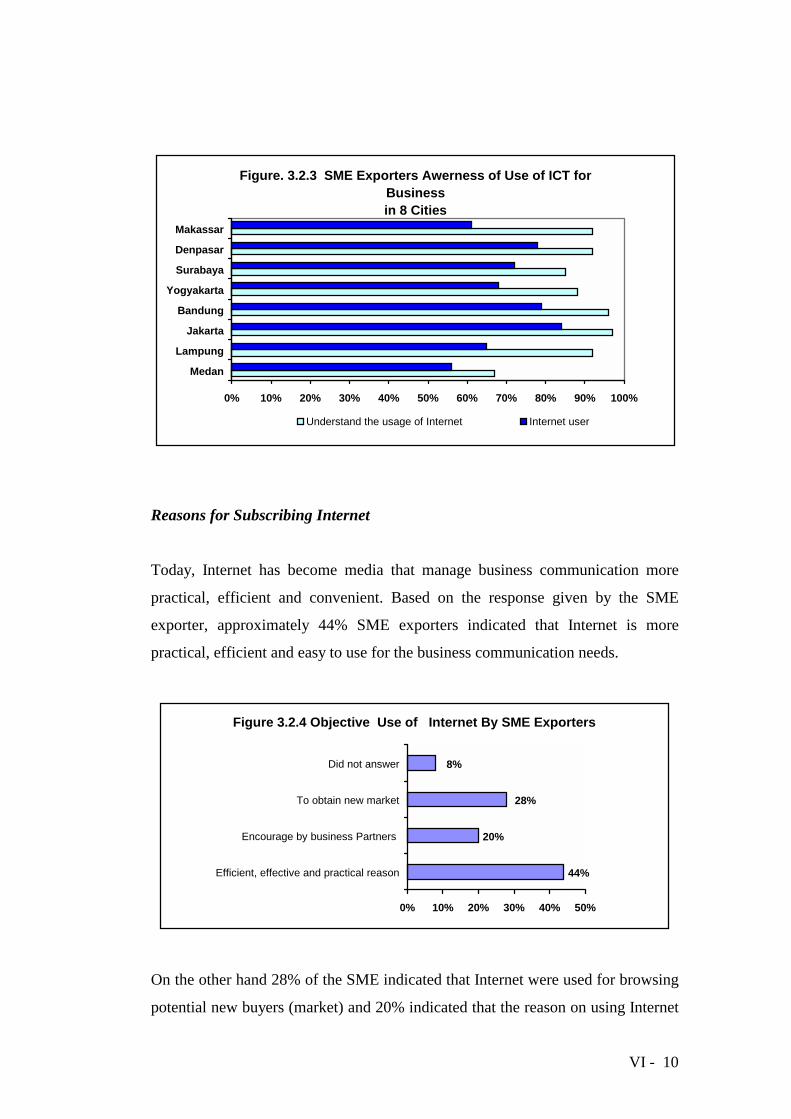
Reasons for Subscribing Internet
Today, Internet has become media that manage business communication more
practical, efficient and convenient. Based on the response given by the SME
exporter, approximately 44% SME exporters indicated that Internet is more
practical, efficient and easy to use for the business communication needs.
Figure 3.2.4 Objective Use of Internet By SME Exporters
44%
20%
28%
8%
0% 10% 20% 30% 40% 50%
Efficient, effective and practical reason
Encourage by business Partners
To obtain new market
Did not answer
On the other hand 28% of the SME indicated that Internet were used for browsing
potential new buyers (market) and 20% indicated that the reason on using Internet
VI - 11
is due to the encouragement from their business partners (buyers) for better
business communication, see figure 3.2.4. The decision to use Internet as
information and communication media as indicated by the SME is due fact that
the use of Internet have reduce communication, facsimiles and marketing costs.
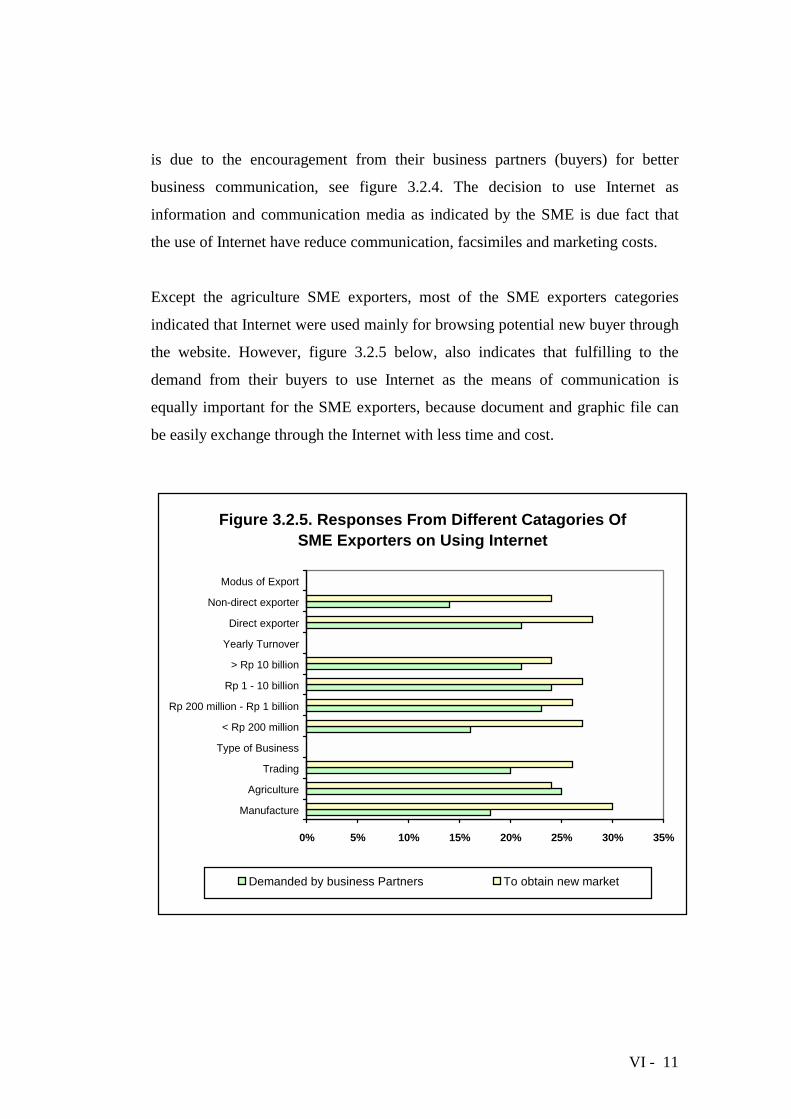
Except the agriculture SME exporters, most of the SME exporters categories
indicated that Internet were used mainly for browsing potential new buyer through
the website. However, figure 3.2.5 below, also indicates that fulfilling to the
demand from their buyers to use Internet as the means of communication is
equally important for the SME exporters, because document and graphic file can
be easily exchange through the Internet with less time and cost.
Figure 3.2.5. Responses From Different Catagories Of SME Exporters on Using Internet
0% 5% 10% 15% 20% 25% 30% 35%
Manufacture
Agriculture
Trading
Type of Business
< Rp 200 million
Rp 200 million - Rp 1 billion
Rp 1 - 10 billion
> Rp 10 billion
Yearly Turnover
Direct exporter
Non-direct exporter
Modus of Export
Demanded by business Partners To obtain new market

VI - 12
Figure 3.2.6. below indicated that the SME exporters in Bandung seemed to be the
most active SME in searching for new buyer compared to the other city. However,
the SME exporters in Lampung are the least active group for both reason on using
Internet as discuss in the chapter.
Reasons for Not Using Internet
Based on the 29% of the non-Internet-user SMEs, 43% indicated that their
business is running well without Internet and they could not find additional
advantage of using Internet in running their business. Secondly, it is difficult to
obtain information of the Internet provider (12%), thirdly, difficulty on obtaining
phone line (11%), lastly, only have 1 (one) phone line for communication and
Figure 3.2.6 SME Exporters Responses in 8 Cities
0% 5% 10% 15% 20% 25% 30% 35% 40% 45%
Medan
Lampung
Jakarta
Bandung
Yogyakarta
Surabaya
Denpasar
Makassar
Demaned by business Partners To obtain new market

VI - 13
facsimile transmission (see figure 3.2.7). The other reason as indicated by the
SME is that they did not have the staff to understand computer and Internet, and
to use Internet will require them to spend more money on equipment and staff.
12%
11%
10%
43%
24%
0% 5% 10% 15% 20% 25% 30% 35% 40% 45% 50%
Difficult to obtain information on ISP
Difficult to obtain new phone line
Only have 1 phoneline
No advantage in using internet
Others
Figure 3.2.7. Reason for SME Exporter of Not Subscribing Internet
Accessibility of Internet by SME Exporters
There are several factors determining SME employee’s Internet accessibility.
First, is the availability of communication facilities in the company (total
computer, total phone line and computer network or LAN); second, is the level of
employee knowledge computer and Internet; and third, is the availability of
infrastructure to support as the communication facilities (telephone line and
Internet provider).
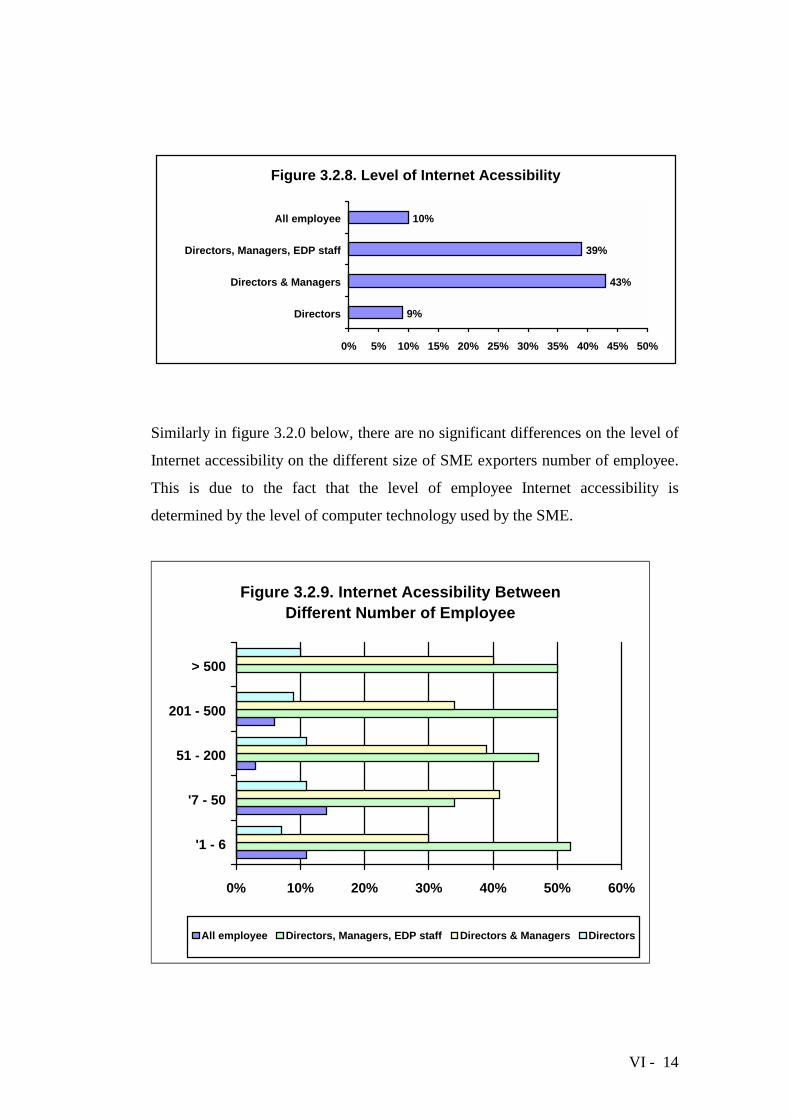
As indicated in Figure 3.2.8 below, Internet users among the SME exporter
employees were quite high on the middle level managers (43% director and
managers and 39% board of director and manager and electronic data processing
staff). Only 10% of the SME exporters provide Internet access to all employees in
the company.
VI - 14
Figure 3.2.8. Level of Internet Acessibility
9%
43%
39%
10%
0% 5% 10% 15% 20% 25% 30% 35% 40% 45% 50%
Directors
Directors & Managers
Directors, Managers, EDP staff
All employee
Similarly in figure 3.2.0 below, there are no significant differences on the level of
Internet accessibility on the different size of SME exporters number of employee.
This is due to the fact that the level of employee Internet accessibility is
determined by the level of computer technology used by the SME.
Figure 3.2.9. Internet Acessibility Between Different Number of Employee
0% 10% 20% 30% 40% 50% 60%
'1 - 6
'7 - 50
51 - 200
201 - 500
> 500
All employee Directors, Managers, EDP staff Directors & Managers Directors

VI - 15
Warung Internet (Warnet)
The other phenomena of ICT development in Indonesia, especially in the big
cities, are the booming of Internet kiosk (Warnet) and Internet café. The main
reason of this warnet booming is due to the fact that there is a wide gap between
the spread of global information among the community and the purchasing power
ability on to acquire ICT equipments. Figure 3.2.10, presented below showed that
approximately 30% of the SME exporters were using warnet as their means of
communication with the buyer.
30% 70%
0% 10% 20% 30% 40% 50% 60% 70% 80% 90% 100%
Use Warnet
Did not use Warnet
Figure. 3.2.10. SME Exporter Used of Warnet
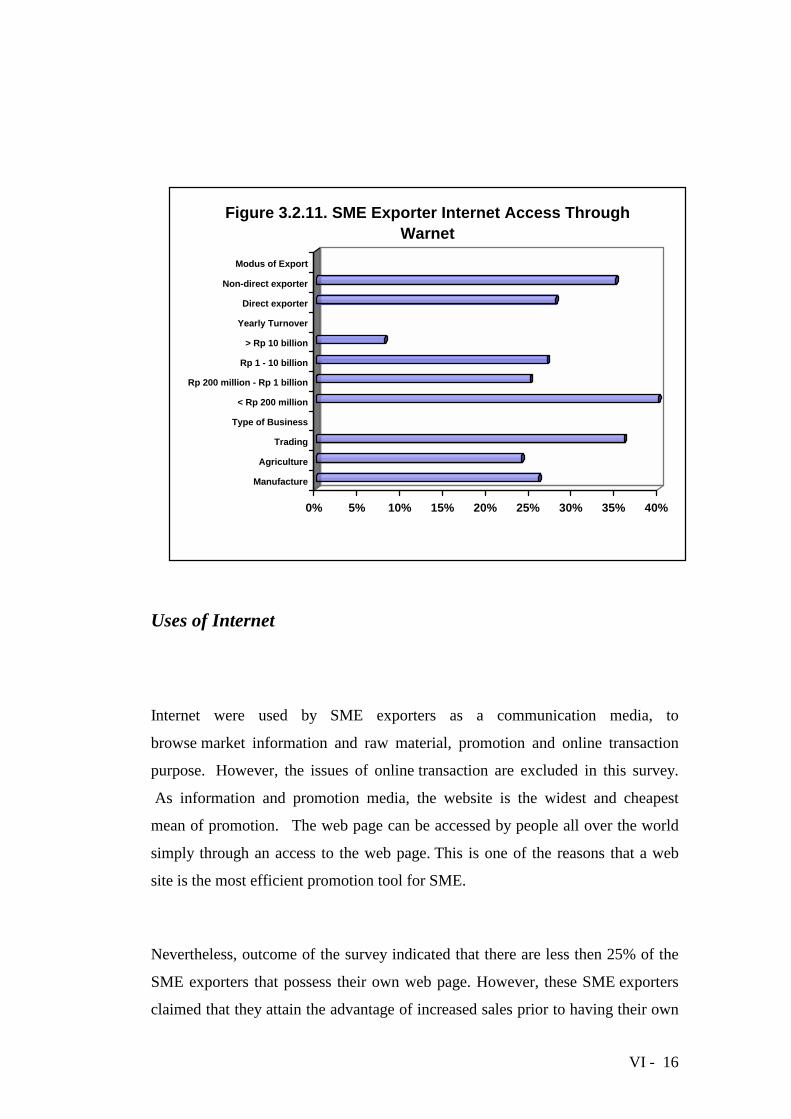
The cost of Internet access offered by warnet is quite cheap compared to ISP
subscriber fee and the cost of phone communication. The main users of warnet
were SME with below Rp 200 million yearly turnovers due to efficiently reason,
and the high mobility trading SME exporters to maintain communication with
their buyer or office while traveling (see figure 3.2.11.).
VI - 16
Uses of Internet
Internet were used by SME exporters as a communication media, to
browse market information and raw material, promotion and online transaction
purpose. However, the issues of online transaction are excluded in this survey.
As information and promotion media, the website is the widest and cheapest
mean of promotion. The web page can be accessed by people all over the world
simply through an access to the web page. This is one of the reasons that a web
site is the most efficient promotion tool for SME.
Nevertheless, outcome of the survey indicated that there are less then 25% of the
SME exporters that possess their own web page. However, these SME exporters
claimed that they attain the advantage of increased sales prior to having their own
0% 5% 10% 15% 20% 25% 30% 35% 40%
Manufacture
Agriculture
Trading
Type of Business
< Rp 200 million
Rp 200 million - Rp 1 billion
Rp 1 - 10 billion
> Rp 10 billion
Yearly Turnover
Direct exporter
Non-direct exporter
Modus of Export
Figure 3.2.11. SME Exporter Internet Access Through Warnet

VI - 17
web page. There also significant interest by the SMEs to develop web page in
future year (see Figure 3. 2. 12.). The main reason stated by the SMEs for not
having their own web page is because it would require them to have special staff
to develop the web page and maintain updated information on the web page
0% 5% 10% 15% 20% 25% 30% 35% 40% 45% 50%
Web site owner
Plan to develop web site
Market increases
Figure 3.2.12. The Impact of Having Web Site for The SME Exporters
Manufacture SMEs are the biggest web page owner compared to the other SME
exporters categories. However, even currently the trading SMEs were the smallest
web page owner, they are also the one having biggest interest to develop their own
web page in the near future.
In the case of the SME exporter yearly turn over and mode of export, SME with
turnover between Rp 200 million to Rp 1 billion and the direct exporter SME
were among the largest web page owner. Furthermore, they also claimed that they
are enjoying the advantage of an increase of sales due to having the web page.
These SMEs were among the larges categories indicated to develop their own web
page in the near future for marketing and promotion purpose (See Figure 3. 2.
13.).

VI - 18
0% 10% 20% 30% 40% 50% 60%
Manufacture
Agriculture
Trading
Type of Business
< Rp 200 million
Rp 200 million - Rp 1 billion
Rp 1 - 10 billion
> Rp 10 billion
Yearly Turnover
Direct exporter
Non-direct exporter
Modus of Export
Figure 3.2.13. Impact of Web Site Based on Different Catagories of SME Exporters
Web site owner Plan to develop web site Market incerses
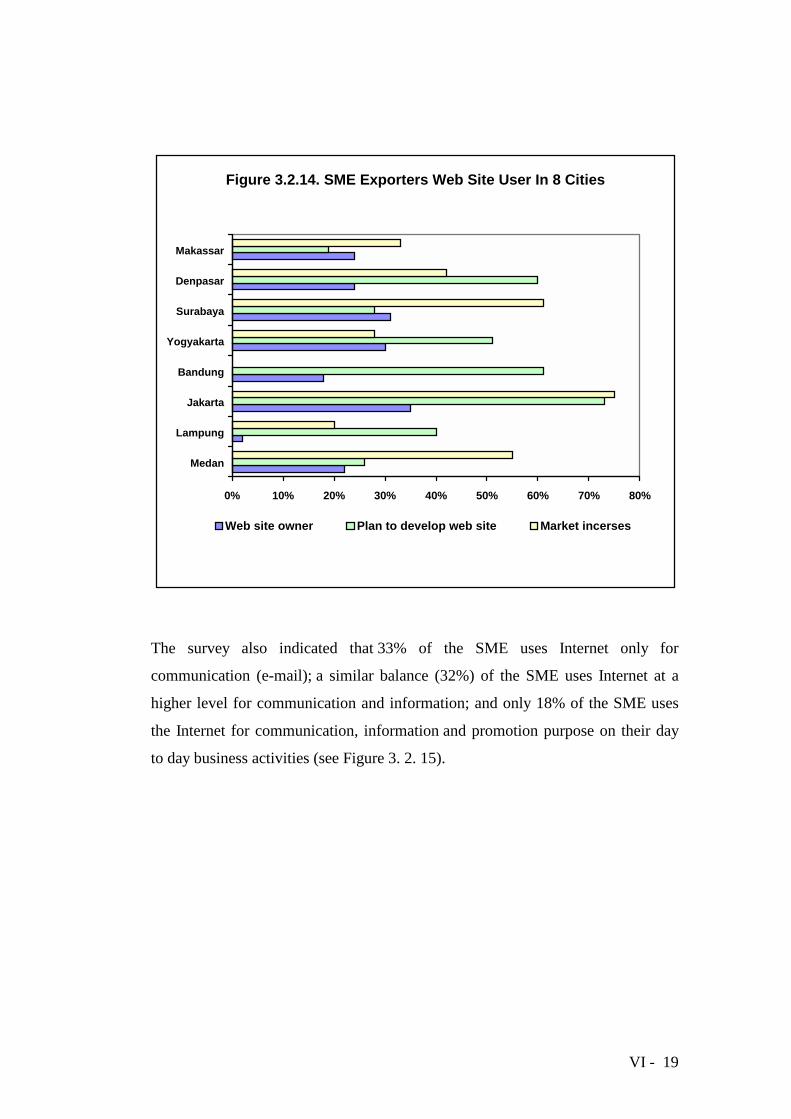
From figure 3.2.14 below, web page owner in Lampung were the smallest
compared to other cities, in the bigger cities due to better infrastructure there are
more SME exporters web page owner. However, the interests of developing web
page were quite big in all cities. The advantage of Internet as promotion media
have not widely used by the SME exporters, the majority of the SME exporters
interviewed in this survey mostly were still in the communication and information
level use of ICT.
VI - 19
Figure 3.2.14. SME Exporters Web Site User In 8 Cities
0% 10% 20% 30% 40% 50% 60% 70% 80%
Medan
Lampung
Jakarta
Bandung
Yogyakarta
Surabaya
Denpasar
Makassar
Web site owner Plan to develop web site Market incerses
The survey also indicated that 33% of the SME uses Internet only for
communication (e-mail); a similar balance (32%) of the SME uses Internet at a
higher level for communication and information; and only 18% of the SME uses
the Internet for communication, information and promotion purpose on their day
to day business activities (see Figure 3. 2. 15).

VI - 20
Figure 3.2.15. Uses of Internet By SME Exporters
Communication & Information
32%
Communication, Information and
promotion18%
Communication33%
No answer17%
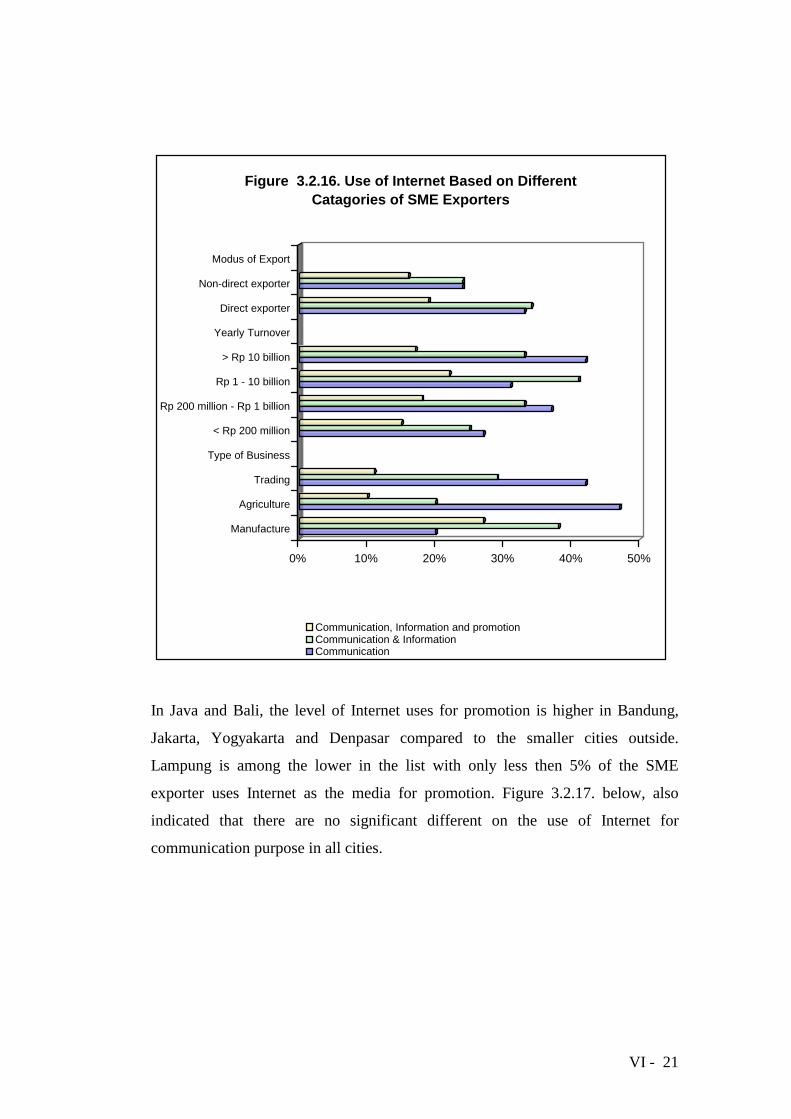
From figure 3.2.16 below, SME manufacture, direct exporter SME and SME
exporter with bigger turnover were among the biggest categories of SME exporter
that already using Internet as promotion media. Furthermore, SME producing
handicraft and furniture (included in the SME manufacture categories) were
among the biggest category in using web page as promotion tools. The figure also
indicated that there is no language barrier for the SME exporter to communicate
with their buyers and browsed through the Internet.
VI - 21
0% 10% 20% 30% 40% 50%
Manufacture
Agriculture
Trading
Type of Business
< Rp 200 million
Rp 200 million - Rp 1 billion
Rp 1 - 10 billion
> Rp 10 billion
Yearly Turnover
Direct exporter
Non-direct exporter
Modus of Export
Figure 3.2.16. Use of Internet Based on Different Catagories of SME Exporters
Communication, Information and promotionCommunication & InformationCommunication
In Java and Bali, the level of Internet uses for promotion is higher in Bandung,
Jakarta, Yogyakarta and Denpasar compared to the smaller cities outside.
Lampung is among the lower in the list with only less then 5% of the SME
exporter uses Internet as the media for promotion. Figure 3.2.17. below, also
indicated that there are no significant different on the use of Internet for
communication purpose in all cities.

VI - 22
0% 10% 20% 30% 40% 50% 60% 70%
Medan
Lampung
Jakarta
Bandung
Yogyakarta
Surabaya
Denpasar
Makassar
Figure 3.2.17. Use of Internet By SME Exporters In 8 Cities
No answerCommunication, Information and promotionCommunication & InformationCommunication
As sources of information, Internet were also used by government agencies to
distribute information on regulation or business event sponsored by the
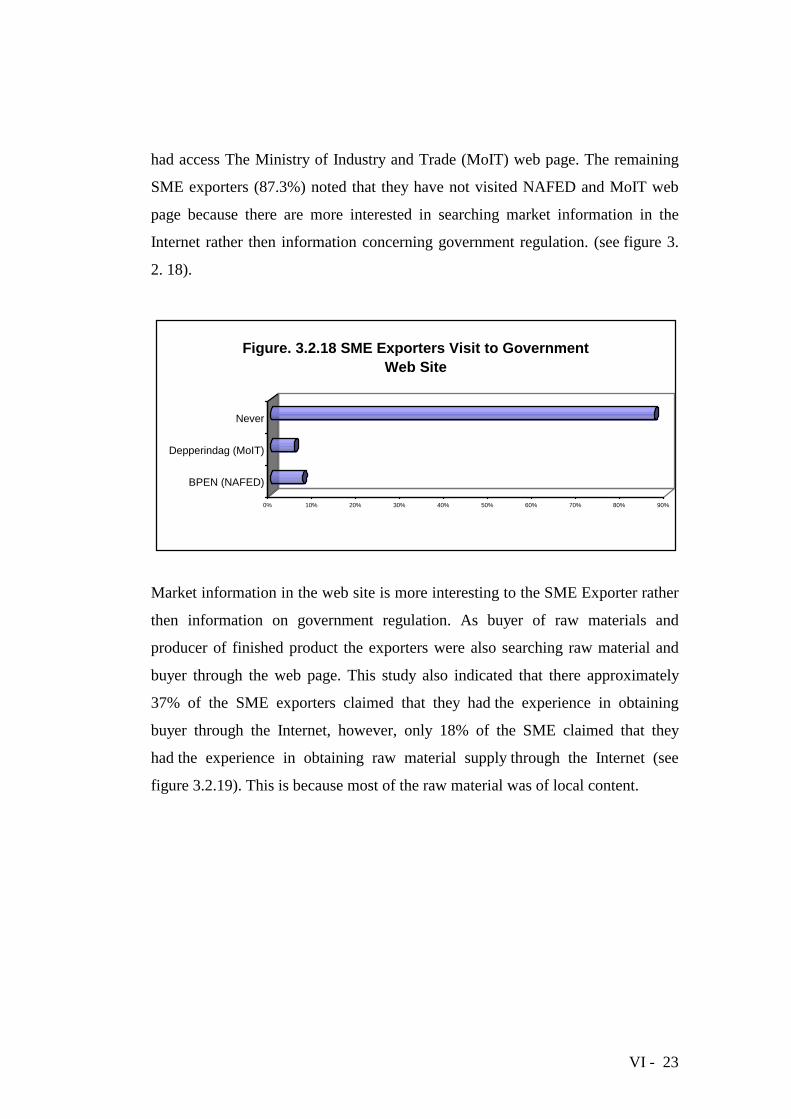
government through the web site. However the outcome of the survey indicated
that only 7.3% of the SME had access the web page developed by The National
Agency for Export Development (NAFED or BPEN) and only 5.4% of the SME
VI - 23
had access The Ministry of Industry and Trade (MoIT) web page. The remaining
SME exporters (87.3%) noted that they have not visited NAFED and MoIT web
page because there are more interested in searching market information in the
Internet rather then information concerning government regulation. (see figure 3.
2. 18).
0% 10% 20% 30% 40% 50% 60% 70% 80% 90%
BPEN (NAFED)
Depperindag (MoIT)
Never
Figure. 3.2.18 SME Exporters Visit to Government Web Site
Market information in the web site is more interesting to the SME Exporter rather
then information on government regulation. As buyer of raw materials and
producer of finished product the exporters were also searching raw material and
buyer through the web page. This study also indicated that there approximately
37% of the SME exporters claimed that they had the experience in obtaining
buyer through the Internet, however, only 18% of the SME claimed that they
had the experience in obtaining raw material supply through the Internet (see
figure 3.2.19). This is because most of the raw material was of local content.

VI - 24
37%
17%
0% 5% 10% 15% 20% 25% 30% 35% 40%
Buyer
Raw material
Figure 3.2.19. SME Exporter Access To Buyer and Raw Material Through Internet
The direct exporters SME have a higher percentage on obtaining buyers from the
Internet compared to the non-direct exporters. Likewise, for the SME with bigger
turnover have a higher percentage on obtaining buyer from the Internet (see figure
3.2.20). Both, the direct exporter and the SME with bigger turnover, were among
the higher level Internet users compared to the others.
0% 10% 20% 30% 40% 50% 60%
< Rp 200 million
Rp 200 million - Rp 1 billion
Rp 1 - 10 billion
> Rp 10 billion
Yearly Turnover
Direct exporter
Non-direct exporter
Modus of Export
Figure 3.2.20. Access to Buyer and Raw Material Between Different Catagories of SME Exporters
Raw material Buyer

VI - 25
Finally, figure 2.3.21, below indicated except from Medan, the cities outside Java
and Bali (Lampung & Makssar) were mainly considered as the producer or
suppliers raw material. This is the main reason that less then 10% of the SME in
both Lampung and Makassar have experience obtaining raw material supply from
the Internet, compared to the other cities. And for the same reason that this two
cities were also have a high percentage of SME exporters that are obtaining
buyers through the Internet.
0% 10% 20% 30% 40% 50% 60%
Medan
Lampung
Jakarta
Bandung
Yogyakarta
Surabaya
Denpasar
Makassar
Figure 3.2.21. Buyers and Raw Material Access Using Internet In 8 Cities
Buyers Raw materials

VI - 26
3. 3. Perceptions of SME Exporters Toward Regional Autonomy
The implementation of the Regional Autonomy Bill (act No. 22 and 25, 1999) on
January 2001, have created contradictive opinion in the society. First, is the
optimistic view that regional autonomy will serve as a development tools to
achieve prosperity in the regions and the other, is the pessimistic views on the
ability of the human resources in the region to undertake such responsibility
without adequate experiences. Implementation of a new act would generally the
hand over significant impact the social, political and economy environment.
Especially, since the act (UU No 22 and 25 Year 1999) objectives were to transfer
authority and fiscal matter from the central government to the regional
government.
The regional autonomy bill have enables the regional government (Pemda) with a
wider authority to develop regional regulation (PERDA) to dig out fund resources
to support the regional budget. After almost two-year prior to the implementation
of the act, there are significant tendency that the business communities were
unhappy with the current changes to the business environments in the region.
Local taxes and levies were among the problems that the business have to faced in
running their business, there are also growing concern due to the uncertainty on
which level of government agency has the authority of providing services to
obtain business permit.
This part of the study will discuss the perception of the SME exporters on what
has happen to their business environment since the implementation of the regional
autonomy bill.

VI - 27
Impact of Regional Autonomy Toward Business Climate
The emerge new PERDA in almost every region directly or indirectly, in the
assumption will affect the flow of business activities in the region, but
nevertheless the majority of the SME exporter surveyed (65 percent) indicated
that these new PERDA did not contributed any impact to toward the flow of their
business. The other 33 percent of the SME exporters indicated that the business
flow were affected by the new PERDA, while 2 percent claimed they do not know
(see Chart 3.3.1.)
Figure 3.3.1. Impact of New PERDA on Business Climate
Yes there are impact on business
33%
No knowledge2%
No impact on business
65%
From the figure above we noted that SME exporter were excluded from the group
of entrepreneur that is suffering as the result of this OTDA. The only possible
reason for this is that since the economic crisis occurred in 1997 and the fall of
rupiah, almost every region in Indonesia was encourage to boost export activities
in the regions.
Business Climate
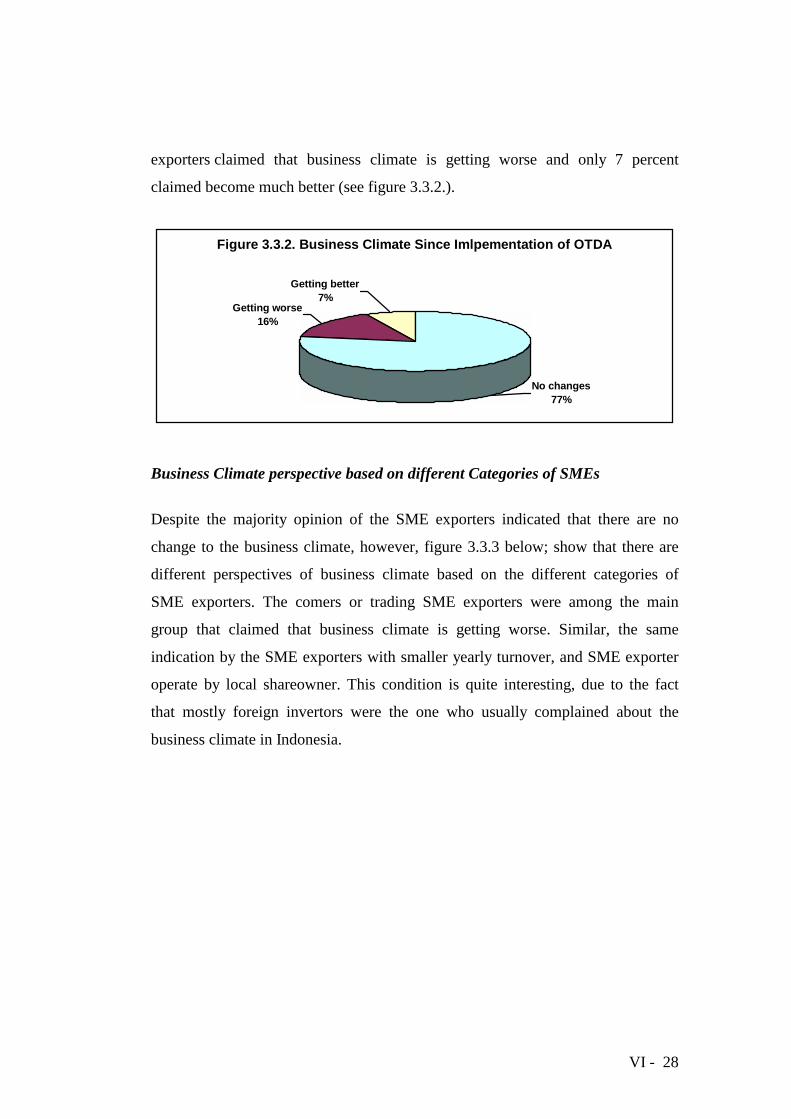
In the context of business climate, majority (77 percent) of the SME
exporters respondent indicated that the implementation OTDA have not caused
significant changes to the business climate. Nevertheless, 16 percent SME
VI - 28
exporters claimed that business climate is getting worse and only 7 percent
claimed become much better (see figure 3.3.2.).
Figure 3.3.2. Business Climate Since Imlpementation of OTDA
No changes77%
Getting worse16%
Getting better7%
Business Climate perspective based on different Categories of SMEs
Despite the majority opinion of the SME exporters indicated that there are no
change to the business climate, however, figure 3.3.3 below; show that there are
different perspectives of business climate based on the different categories of
SME exporters. The comers or trading SME exporters were among the main
group that claimed that business climate is getting worse. Similar, the same
indication by the SME exporters with smaller yearly turnover, and SME exporter
operate by local shareowner. This condition is quite interesting, due to the fact
that mostly foreign invertors were the one who usually complained about the
business climate in Indonesia.

VI - 29
Figure 3.3.3. SME Exporters Responses Based on Different Catagories
0% 5% 10% 15% 20% 25%
Manufacture
Agriculture
Trading
Type of business
< Rp 200 million
Rp 200 million - Rp 1 billionl
Rp 1 - Rp 10 billion
> Rp 10 billion
Annual turnover
Local
Foreign
Joint venture
Share ownership
Direct exporters
Non-direct exporters
Mode of Export
Getting betterGetting worse
City Perspective on Business Climate
SME exporter in the 8 city surveyed express different perspectives on the city
business climate. Compared to other cities, the majority of SMEs in Lampung and
Medan indicated that the business climate in their city is getting worse prior to the
implementation of the regional autonomy. On the other hand, the SMEs in Jakarta
and Makassar indicated differently, due to the lager SMEs indicating that the
business climate is getting better compared to the SMEs indicating that the
business climate is getting worse (see figure 3.3.4.).

VI - 30
0% 10% 20% 30% 40% 50%
Medan
Lampung
Jakarta
Bandung
Yogyakarta
Surabaya
Denpasar
Makassar
Figure 3.3.4. Business Climate in 8 Cities Prior Implementation of OTDA
Getting betterGetting worse
Business Activities Prior to The Implementation of OTDA
Lack of effort by the regional and central government on issues concerning the
implementation of OTDA is clearly marked by approximately 25 percent of the
SMEs who did not understand about OTDA. Furthermore, 32 percent SME
exporters indicate that they do not faced any problem related to OTDA.
However, 20 percent noted that they experience increased cost of business prior
to OTDA, 18 percent indicated that they are facing problem due to the
uncertainty between adapting the central government regulation or the regional
government regulation concerning to their business activities. Finally,
approximately 6 percent SMEs were having problems due to local government
discrimination on the protection of the local business (see figure 3.3.5.).

VI - 31
Figure 3.3.5. Problems Faced by SME Exporter Prior Implementation of OTDA
Uncertainty of authority18%
Discrimination6%
No problems32%
Don't know24%
Increase cost of doing business
20%
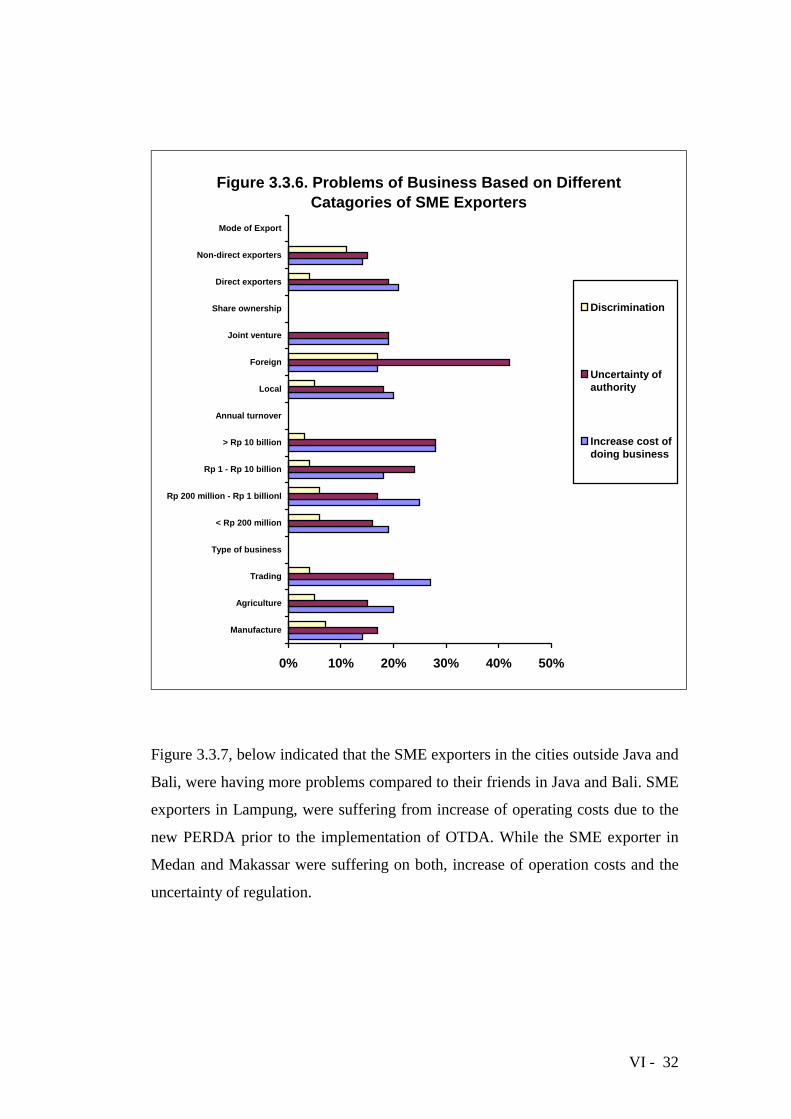
There are no significant different of perception concerning the problem mentioned
above by analyzing the responses by different categories of the SME. However,
based on the type of investment, it is clearly expressed from figure 3.3.6, that the
foreign SME Exporters is having problem with the uncertainty of the local
government in the implementation of central government or local government
regulation in the OTDA era. The foreign SME exporter only constitute of 9 SME
or 2 percent respondent in the survey, but the foreign company were mostly
require permit from both, central and local government, and the issue of
uncertainty of regulation is not conducive for the region to invite foreign investor
in the coming years.
VI - 32
Figure 3.3.6. Problems of Business Based on Different Catagories of SME Exporters
0% 10% 20% 30% 40% 50%
Manufacture
Agriculture
Trading
Type of business
< Rp 200 million
Rp 200 million - Rp 1 billionl
Rp 1 - Rp 10 billion
> Rp 10 billion
Annual turnover
Local
Foreign
Joint venture
Share ownership
Direct exporters
Non-direct exporters
Mode of Export
Discrimination
Uncertainty ofauthority
Increase cost ofdoing business
Figure 3.3.7, below indicated that the SME exporters in the cities outside Java and
Bali, were having more problems compared to their friends in Java and Bali. SME
exporters in Lampung, were suffering from increase of operating costs due to the
new PERDA prior to the implementation of OTDA. While the SME exporter in
Medan and Makassar were suffering on both, increase of operation costs and the
uncertainty of regulation.

VI - 33
Figure 3.3.7. SME Exporter Problems in 8 Cities
0% 10% 20% 30% 40% 50% 60%
Medan
Lampung
Jakarta
Bandung
Yogyakarta
Surabaya
Denpasar
Makassar
Discrimination
Uncertainty ofauthority
Increase cost ofdoing business
Propensity of Local Government Prior to Implementation of OTDA
The already small local government revenue (pendapatan asli daerah or PAD) in
the local government budget compared to the budget allocated from the central
government were the main reason that local government setup new PERDA. For
the regional government as a consequence of the small PAD they have to
maximize their local earnings through available resource in the region, and the
easiest way is to setup new PERDA and place local taxes or levies for the use of
local utilities and facilities. The direct impact of this new PERDA is the increases
of cost for doing business and at the same time the business will pass the costs to
the consumer. Figure 3.3.8 below, shows 46 percent of the SME exporters have
no knowledge of either the local government were more focused on increasing
income from PAD or more focused on establishing better business climate.
However, approximately 40 % of the SME exporters indicated the local

VI - 34
governments were more focused in increasing income from PAD and only 14
percent indicated that the local governments were more focused on establishing
better business climate.
Figure 3.3.8. Perception of SME Exporters on Propensity of Local Government Prior to OTDA
Focus on increasing local revenue
40%
Don't Know46%
Encourage better business climate
14%
In the context of propensity of local government between the 8 cities as seen in
figure 3.3.9, Lampung, Surabaya, Medan and Makassar, respectively were the
most expensive place for the SME exporter to undertake their business activities.
In contrast, the SME exporter in Yogyakarta has equal perception on either the
local government were more interested on increasing income from PAD or more
focused on establishing better business climate. However, it is quite interesting
that SME exporter in the big cities like Bandung, Denpasar and Jakarta have the
least knowledge on is happening on the business climate 20 month prior to the
implementation of OTDA.

VI - 35
0% 20% 40% 60% 80% 100%
Medan
Lampung
Jakarta
Bandung
Yogyakarta
Surabaya
Denpasar
Makassar
Figure 3.3.9. Perception of SME Expoters on Propensity Of Local Bureaucracy Prior To The Implementation Of OTDA
Do notunderstand
Focused onincrease of PAD
Focused onbetter businessclimate
Main Causes of The Unconducive Business Climate
The adequately high answer of the SME exporters (36 percent) that they have no
knowledge of the main issue associated to the business climate conduciveness,
were also an indication that maybe there are no significant changes to the business
climate for SME exporters, compared to the non exporters SME. Despite the
above answer reason, figure 3.3.10 showed, the SME exporters indicated that lack
of infrastructure and facilities (19 percent) were the main caused to the level of
business climate. Furthermore, 17 percent SME noted that the local government is
not capable to undertake OTDA; 16 percent SME noted that the local government
were against business; and, 12 percent indicated that the central government were
reluctant to transfer the authority to the local government.

VI - 36
Figure 3.3.10. Main Caused for The Unconducive Business Climate
Lack of infrastructure19%
Pemda is agains business16%
Incompetence of Pemda17%Don't know
36%
No delegation of authority from central government
12%
Different Business Categories Perspectives On The Main Causes of
Unconducive Business Climates
The availability and accessibility of infrastructure and facilities were of the most
important aspect to ensure the flow of goods, especially for export. Figure 3.3.11
shows that the lack of infrastructure is the main caused for the unconducive
business climate much expressed by the SMEs with higher annual turnover. It is
indicated that as the export volume grows bigger there are also growing demand
of the availability of infrastructure. In the context of the human resource
capabilities at the region, the commerce or trader SME and the smallest turn over
SME were among the categories that the local government were not capable in
undertaking the responsibility of the implementation of OTDA (see figure 3.3.12).

VI - 37
0% 5% 10% 15% 20% 25% 30% 35%
Manufacture
Agriculture
Trading
Type of business
< Rp 200 million
Rp 200 million - Rp 1 billionl
Rp 1 - Rp 10 billion
> Rp 10 billion
Annual turnover
Figure 3.3.11. Main Caused for the Unconducive Business Climate Based on Local Condition
Pemda is agains business Lack of infrastructure
0% 5% 10% 15% 20% 25%
Manufacture
Agriculture
Trading
Type of business
< Rp 200 million
Rp 200 million - Rp 1 billionl
Rp 1 - Rp 10 billion
> Rp 10 billion
Annual turnover
Figure 3.3.12. SME Exporters Perception on Business Climate Based on Attitude of Bureaucracy
No delegation of authority from central government Incompetence of Pemda

VI - 38
Cities Perspective on the Business Climate
Medan and Lampung were probably have become cities that were least friendly to
the SME exporters. Figure 3.3.13, indicated that while the SME in Jakarta,
Yogyakarta, Surabaya, Denpasar and Makassar indicated that inadequate
infrastructure were the main cause of the less conducive business climate, the
SME in Medan and Lampung indicated that the main problems is that the local
official were against business. Furthermore in Figure 3.3.14, indicated that the
SME exporters in Medan and Lampung were also concern that the local
government is not capable in undertaking the responsibility of the implementation
of OTDA.
0% 10% 20% 30% 40%
Medan
Lampung
Jakarta
Bandung
Yogyakarta
Surabaya
Denpasar
Makassar
Figure.3.3.13. City Perspective on Business Climate Based on Local Condition
Lack ofinfrastructure
Pemda isagainsbusiness

VI - 39
0% 5% 10% 15% 20% 25% 30% 35%
Medan
Lampung
Jakarta
Bandung
Yogyakarta
Surabaya
Denpasar
Makassar
Figure. 3.3.14. City Perspective on The Atitude of Bureaucrat
Incompetence ofPemda
No delegation ofauthority fromcentral government
Problems Faced by SME Exporters
The formal and informal form of local tax and levies are the main problems faced
by 44 percent the SME exporters in running their business. The second problem
faced by the SME is due to the time and cost of obtaining different kind permit
(29%) from the local government offices. Thirdly, is the international non-tariff
barrier (22%) and lastly, is the 5 % due to domestic non-tariff barrier (see figure
3.3.15).

VI - 40
Figure 3.3.15. Rroblems of ndertaking Export Activities
Business permit29%
International Tariff barriers22%
Domestic tariff-barriers5%
Local taxes44%
In the context dealing the bureaucracy of obtaining different kind and sometime
different layers of permits, the non-direct exporter SME and the foreign SME
exporters indicated that the main problem in undertaking their export activities is
when they have to apply permit form the government office. This is quit different
from the other categories of SME exporters who claimed that the biggest problem
they have to face is having to pay different kind of local tax and levies (see figure
3.3.16).
0% 5% 10% 15% 20% 25% 30% 35% 40% 45% 50%
Direct exporters
Non direct exporters
Mode of export
Local
Foreign
Joint venture
Share ownership
Figure 3.3.16. Problems of Obtaining Business Permit and Local Taxes
Business permit Local taxes
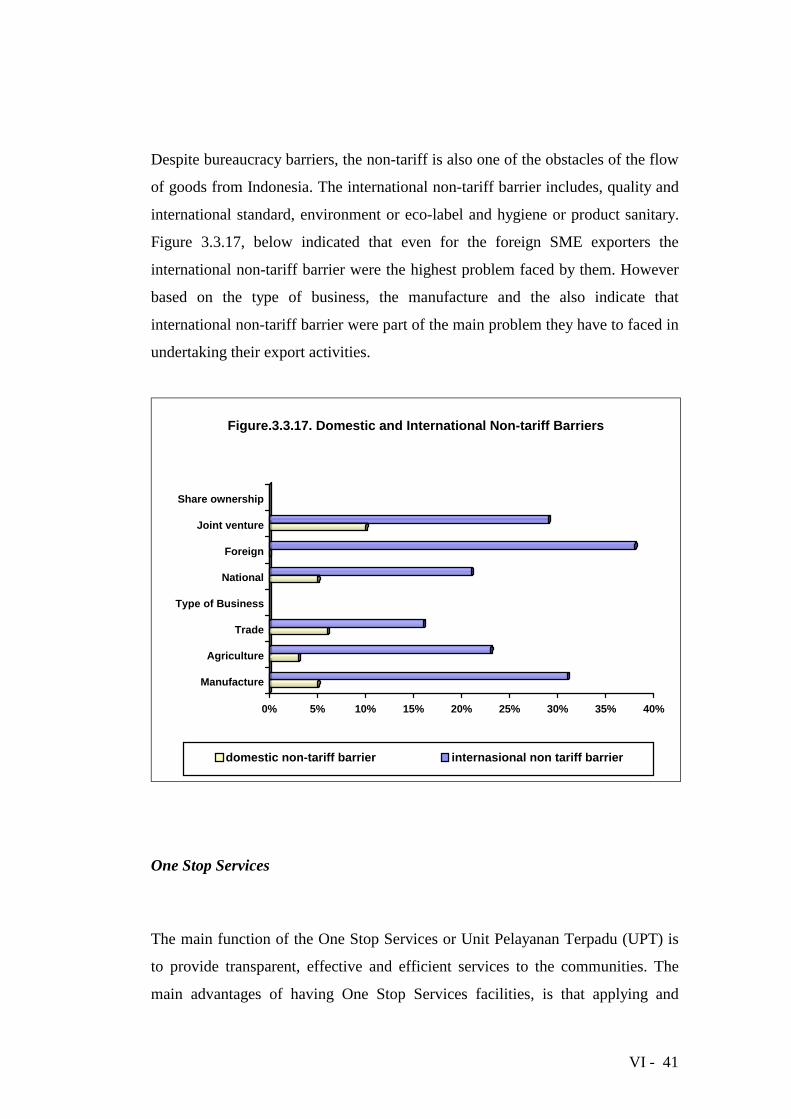
VI - 41
Despite bureaucracy barriers, the non-tariff is also one of the obstacles of the flow
of goods from Indonesia. The international non-tariff barrier includes, quality and
international standard, environment or eco-label and hygiene or product sanitary.
Figure 3.3.17, below indicated that even for the foreign SME exporters the
international non-tariff barrier were the highest problem faced by them. However
based on the type of business, the manufacture and the also indicate that
international non-tariff barrier were part of the main problem they have to faced in
undertaking their export activities.
0% 5% 10% 15% 20% 25% 30% 35% 40%
Manufacture
Agriculture
Trade
Type of Business
National
Foreign
Joint venture
Share ownership
Figure.3.3.17. Domestic and International Non-tariff Barriers
domestic non-tariff barrier internasional non tariff barrier
One Stop Services
The main function of the One Stop Services or Unit Pelayanan Terpadu (UPT) is
to provide transparent, effective and efficient services to the communities. The
main advantages of having One Stop Services facilities, is that applying and

VI - 42
processing such permit sometime require different supporting from different
agencies, but through One Stop Services, that the application treated as a package
and the applicant no longer have to go to the different office to obtain the
supporting document. Figure 3.3.18, indicated that the majority (58 percent) of
SME exporter have no knowledge of the existence of One Stop Services in their
own city. Furthermore, only 31% of the SME indicated that the One Stop Services
unit has help them to acquire business permits and 14 percent indicated that One
Stop Services unit has not help them to acquire business permits. It is illustrated
that the government socialization of the services provided by UPT to SME
exporters is still inadequate.
0% 10% 20% 30% 40% 50% 60%
Don't know
Yes
No
Figure 3.3.18. One Stop Services
One Stop Services help the SMEExistance of One Stop Servises
Protection Toward SME Exporters
Protection given by the NEW ORDER to the big companies was a big disaster and
has failed to establish a strong economic foundation in Indonesia. The SME who
have never really enjoyed protection from the government before, in this study
have also stated similar statement that the majority 63 percent of the SME
exporter claimed that they do not need protection in running their activities.

VI - 43
0 0,1 0,2 0,3 0,4 0,5 0,6 0,7
Doesn't needprotection
Need protection
Figure 3.3.19 Protection For SME Exporters
The SME further indicate that with the global economy facing them ahead, the
government should avoid giving any form of protection to any segment of the
business. The most important aspect for the government is to provide a fair and
conducive business climate, to allow competition and let the market lead. The
kind of protection that was asks by the SME exporter is mostly related to the
security aspect, such as security and safety, rather then the economic way of
protection.

VI - 1
4. CONCLUSIONS AND RECOMMENDATIONS
As discussed in the previous chapter, that the majority of the SME exporters
interviewed in this survey were the Internet user of SME and mainly consist of the
direct SME exporters. Having said that, the finding and recommendation in this
survey were exceptionally related by the characteristic of the respondent,
nevertheless, the finding of the survey concerning the use of ICT by exporters and
the impact of regional were justifiable due to the increasing awareness and use of
ICT for business purpose in Indonesia.
4. 1. Conclusions
The Use of ICT By SME Exporters
1. Computer has already become standard equipment used by the SME
exporters in the eight cities surveyed, due to the fact that approximately 85
percent of the SME respondent in a different level already used computer
to support their business activities. Nevertheless, only 60 percent of the
SME exporters have utilized the computer to the level of administration,
management and Internet. Furthermore, the majority of SME exporters (61
percent) have 1 – 5 computer in their office and this is the reason that only
43 percent of the SME exporters have installed local area network or LAN
in the office. Geographic factor and the availability of telecommunication
infrastructure and facilities were the main barriers of to the level of ICT
uses by the SME exporters, the SME computer user in Java and Bali
(Jakarta, Bandung, Yogyakarta, Surabaya and Denpasar) were higher
compared to the of Java and Bali cities (Medan, Bandar Lampung and
Makassar).

VI - 2
2. Majority of the SME exporters (89 percent) claimed that they already
possess adequate knowledge of the uses of ICT for business and support
for their communication, information and promotion needs. Furthermore,
the majority of the SME exporter (71 percent) were subscriber of the local
Internet services provider (ISP). Base on the above figure, this survey
concluded that the SME exporter were quite advance in use of ICT
compared to the overall ICT user in Indonesia.
3. The main reason for SME exporters on the use ICT is because Internet is
more practical, effective and efficient media compared to the traditional
means of communication by telex, phone, facsimile transmission and the
use of courier services for document delivery. Secondly, the use of ICT
have enable SME exporters to obtain wider information on new product,
supplier of raw material web site, and demand of product, simply by
clicking the small mouse and looking through monitor. Lastly, for the
SME exporters it is also equally important for them to communicate with
the same media and level of technology with their buyers. In the context of
placing the SME into different categories, the manufacture SME exporters
and the direct exporters SME were among the highest user of ICT in the
categories.
4. The SME exporter in the cities outside Java and Bali (Medan, Bandar
Lampung and Makassar) has a lower computer and Internet user compared
to the other 5 cities in Java. The use of ICT is highly depended to the
availability of basic infrastructure and facilities such as: availability and
quality of phone line in the area; number of computer and phone line
owned by the SME exporter; and, the availability of ISP in the area. It is
clearly indicated by the survey that cities with better infrastructure and
facilities have more ICT user SME compared the cities with less
infrastructure and facilities.

VI - 3
5. The main reason of not using Internet indicated by the non Internet
subscriber is mainly because, the have not seen the advantages on using
Internet for business. They indicated that the business is currently running
well even without the use of Internet. Secondly, it is difficult to obtain
additional phone line due to the limitation of the telecommunication
infrastructure and facilities in the area. Lastly, SME exporter notes that in
order to use Internet, they have to add additional cost to purchase
equipment and hire new staff. Furthermore, the level of Internet
accessibilities among SME exporter staff is still low due to the limitation
of computer and telephone line in their office. Access to Internet were
mainly only used among the mid level staff, except for the medium scale
exporter with better office equipment and facilities.
6. The existence of Café Internet or “Warung Internet” in Indonesia is
significantly important for the SME exporters. The smaller turnover SME
exporters, SME traders, and the non-direct exporter SME, were among the
user of Warnet to communicate with their buyers or business partner. The
above situation clearly indicates that the SME exporters were quite
flexible in removing barriers to undertake their business activities.
7. Web site ownership of the SME exporters is still small (only 25 percent of
the SME surveyed), but nevertheless almost 50 percent of the SME
exporters indicated that they are planning to develop their own web site in
the near future for promotion purpose. SME exporters that produce
handicrafts and furniture were among the main web page owner compared
to the other categories of SME exporters. Furthermore, these website
owner also indicated that web site is a quite effective promotion tools to
increase their market. However, price war among similar producer and
also violation of property right were the disadvantages that experienced by
the web site owner among SME exporters. Currently SME exporters in big
cities (Jakarta, Yogyakarta and Surabaya); SME manufacture; SME direct
exporter; and SME with bigger turnover, were the main owner of web site,

VI - 4
and the main reason for having this web site is to reduce the cost of
promotion and marketing and delivering promotion material.
8. The level of Internet use in the SME exporters is divided into three
categories that indicate: the lowest level (33 percent), utilized Internet for
communication only (e-mail); the second level (32 percent), utilized
Internet for communication and marketing; and the third level (18%)
utilized Internet as a communication, marketing and promotional tools.
Furthermore the third level of Internet users were from the SME
manufacturer, SME direct exporter; and SME with bigger turnover.
9. Exchanges of information on government regulation by the SME exporters
were mainly through business partner or by direct visit to the government
office. To date government web page is not an effective tools for
distribution on government program or new rule and regulation set by the
government. Only small portion of SME exporter ever visited
Pengembangan Ekspor Nasional (BPEN) and Office Perindustrian and
Traffic (Depperindag) web page. SME exporter were mostly interested on
market search trough the web site rather then visiting the government web
site.
Business Climate Prior To The Implementation Of The Regional
Autonomy Bill
10. The SME exporters indicated that there are no significant changes to
the business climate prior to the 20-month implementation of the
regional autonomy bill (UU No. 22 and 25) since January 2000.
However, 16 percent of the SME indicated that the business climate
are getting worse, especially by SME exporters in Bandar, Lampung
and Medan. In contrast, only 7 percent SME exporters indicated that
VI - 5
the business climate is getting better, which and mostly indicated by
the SME Jakarta and Makassar.
11. Majority of the SME exporters surveyed (65 percent) indicated that
the new regional regulation (Perda) had no direct impact to their
business activities and only 33 percent indicated that the Perda is
affecting their business activities. This situation is highly contradiction
to the common result of the survey conducted by other agency,
however, this condition is probably due to the fact that currently
regional governments are increasing their effort to increase regional
export by removing barrier on export activities.
12. The SME trader (trading company) and the bigger turnover in SME
exporters mostly indicated that since the implementation of the
regional autonomy bill, the cost of business have significantly increase
due to the new PERDA, issued by the regional government. Especially
for the exporters with bigger turnover and as a major concern of this
issue were indicated by the SME exporters in Bandar Lampung. In
contrast, the foreign SME exporters were having new problems due to
the uncertainty from the local government, either to implement the new
PERDA or to implement the old regulation from central government,
and this problem was also indicated by the SME exporters from
Medan and Makassar.
13. The adequately low level of understanding of the SME exporters about
the new autonomy bill is clearly justify base on the 46 percent
response by the SME saying “they have no idea” when ask whether the
regional government were more focus on increase of regional earning
(PAD) instead of more focus on the establishment of conducive
business climate. Nevertheless, 40 percent of the SME exporters
indicated that the regional government were more focus on increase of
regional earning (PAD), compared to only 14 percent who indicated
that they are more focus on increase of regional earning (PAD).

VI - 6
14. There are four main cause problems to the conducive business climate
in the region, the first is the condition of regional infrastructures and
facilities as mostly stated by the foreign SME exporters, especially in
Yogyakarta and Makassar. The second is the competency of the
regional government to undertake the task of regional autonomy, as
mostly stated by the joint venture and comers (trading) SME exporter,
especially in Medan and Bandar Lampung. The third, the regional
government is against (anti) business as mostly stated by the non-direct
SME exporter, especially in Bandar Lampung and Medan. The forth,
the central government were reluctant to transfer the authority to the
Local government as mostly indicated by SME exporters in Makassar
and Medan.
15. The direct problems faced by the SME exporter in undertaking the
export activities, were still due to the increase of production costs due
to high local tax, levies and high cost to obtain business permit.
Furthermore, the international non-tariff barrier due to standard and
quality problems, and mostly stated by the foreign SME exporter.
16. The inadequate effort by local government to provide information and
services regarding the business permit and licenses is seen by only 42
percent of the SME exporter were aware either there are a One Stop
Services is available in their area. Furthermore, only 31 percent of the
SME indicated that the One Stop Services have significantly help them
in obtaining business permits.
VI - 7
4. 2. Recommendations
The Use of ICT By SME Exporters
1. The development of information and communications technology will
only be achieve if supported by adequate infrastructure and facilities.
Government should prioritize the development by harmonizing and
reducing gap of infrastructure and facilities between the regions.
Furthermore, to increase the pace of development, the government should
reduce the barriers and provide wider access of global information to the
regional communities.
2. The ability to pay is the main barrier for the ICT accessibility of SME
exporters to utilize the advantages of ICT for business purpose.
Government should encourage investment and remove the barrier on ICT
to increase the ability to pay of the community on ICT equipment and
facilities.
3. The government should provide better services to the business
communities by undertaking a proactive approach and use ICT (Internet)
media as a direct information center. This could be established by sending
regular electronic mail (e-mail) to the SME exporter regarding new
regulation or government sponsored event. On the other hand the exporter
could send feedback to the government regarding problems faced by the
exporters and help the government by their participation on establishing
sound business policies and a conducive business climate.

VI - 8
Business Climate Prior To The Implementation Of The Regional
Autonomy Bill
4. Even if the implementation of the regional autonomy bill have not caused
significant impact to the export activities, however, serious attention on
the services delivery regarding business license and the use of public
facilities to ensure efficiency to the flow of goods and services.
5. The low public awareness of the impact of the regional autonomy bill to
the regional economic development is less threat compared to the
uncertainty situation created by both, local and center government on the
implementation of the regional autonomy bill, because this situation would
lengthen the economic crisis and lower the regional ability to faced the
global economy.
6. The achievement of smooth transitions from a central planning to a
decentralized government policy is to measure by how well the regional
government can manage the region, but will greatly measure by the ability
of the regional government to establish economic relation with other
region or other foreign country. This will only be achieving through
community participatory in the establishment of government policy and
regulation. The regional autonomy bill should focus on how regional
government utilize their natural resources by allowing a better business
climate for export and other economic activities.
VI - 9
BIBLIOGRAPHY
___________. 2001. Indonesia Cyber Industry and Market. Jakarta
___________. 2001. www.apjii.or.id
___________. 2001. Indonesia Small Enterprise : Crisis and Globalization
Challenge. The Asia Foundation, ISEI, and PERHEPI. Jakarta.
Sanjaya, AAB, 1998. Business Partnership in Increasing National Entrepreneurship in Indonesia Small Enterprise : Crisis and Globalization
Challenge. The Asia Foundation, PERHEPI, and ISEI. Jakarta
Santoso, Singgih. 1999. Statistical Product and Service Solutions, Process
Statistic Data Professionally. Elex Media Komputindo. Jakarta.
Suriadinata, Yadi S.A., 2000. Kajian Kondusifitas Lingkungan Usaha Bagi Usaha
Kecil dan Menengah (Studi Kasus: Medan, Palembang, Jakarta,
Bandung, Semarang, Yogyakarta, Surabaya, Denpasar, Bajarmasin
dan Makassar)
Tempo Magazine dated 3-7 August 2001. Asia Pacific, the Biggest Internet User.
Jakarta.