Embed Size (px)
Citation preview

Agenda
EPRI/MISO Pumped Storage Workshop October 3-4 St. Paul, MN
MISO Office
1125 Energy Drive, St. Paul, MN 55108
Monday October 3, 2011 12 PM-5 PM (CT)
Time Topic Presenter
12:00 p.m. Lunch All
12:45 p.m. Welcome, Meeting Objectives • Introductions • Goals of Workshop – share background and
results related to modeling energy storage in electricity markets
Rao Konidena, MISO Tom Key, EPRI
1:00 p.m. Overview of DOE/EPRI Hydro Grid Services Project
Lindsey Rogers, EPRI
1:20 p.m. Overview of MISO Current Studies on Energy Storage Rao Konidena & Zheng Zhou, MISO
1:50 p.m. Update on Hydro Operations Case Studies - (markets and non-markets)
Pat March, HPPi
2:20 p.m. Break
2:30 p.m. Utility Applications for Storage Assets • Manitoba Hydro • Xcel Energy • Consumers Energy/ DTE Energy
Kevin Gawne, Manitoba Hydro Frank Novachek, Xcel Energy Konstantin Korolyov, DTE Energy
3:40 p.m. Roundtable: How should energy storage assets be treated in electricity markets?
• Current market treatment, MISO perspective, National Lab perspective, discussion of NHA response to FERC ancillary services NOI
Facilitator: Abraham Ellis, SNL Brendan Kirby, Kirby Consulting Tom Key, EPRI Verne Loose, SNL Dale Osborn, MISO Nivad Navid, MISO
5:00 p.m. Adjourn
Quantifying the Value of Hydropower in the Electric Grid Project Overview
Lindsey Rogers Project Engineer MISO-EPRI Pumped Storage Workshop October 3, 2011
2 © 2011 Electric Power Research Institute, Inc. All rights reserved.
Purpose, Objectives, & Participants
• Purpose: Quantify the potential value of increased hydropower use
• Objective: Data and methods to value grid services • Participants:
– Researchers include EPRI, Oak Ridge National Lab, Sandia National Lab
– Consultants include HDR-DTA, HPPi, LCG and Brendan Kirby Consulting
– Industry sponsors include Case Study plant owners and Cost Share Partners
• Schedule – two years starting ~ Feb 2010
3 © 2011 Electric Power Research Institute, Inc. All rights reserved.
Industry Cost Share and Case Study Commitments
4 © 2011 Electric Power Research Institute, Inc. All rights reserved.
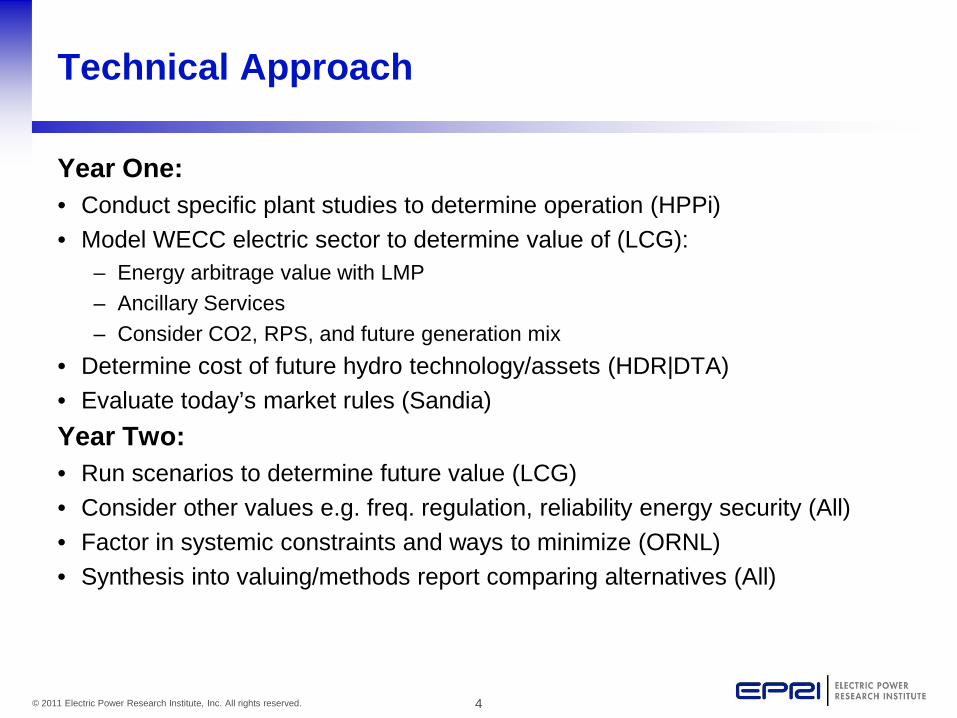
Technical Approach
Year One: • Conduct specific plant studies to determine operation (HPPi) • Model WECC electric sector to determine value of (LCG):
– Energy arbitrage value with LMP – Ancillary Services – Consider CO2, RPS, and future generation mix
• Determine cost of future hydro technology/assets (HDR|DTA) • Evaluate today’s market rules (Sandia) Year Two: • Run scenarios to determine future value (LCG) • Consider other values e.g. freq. regulation, reliability energy security (All) • Factor in systemic constraints and ways to minimize (ORNL) • Synthesis into valuing/methods report comparing alternatives (All)
5 © 2011 Electric Power Research Institute, Inc. All rights reserved.
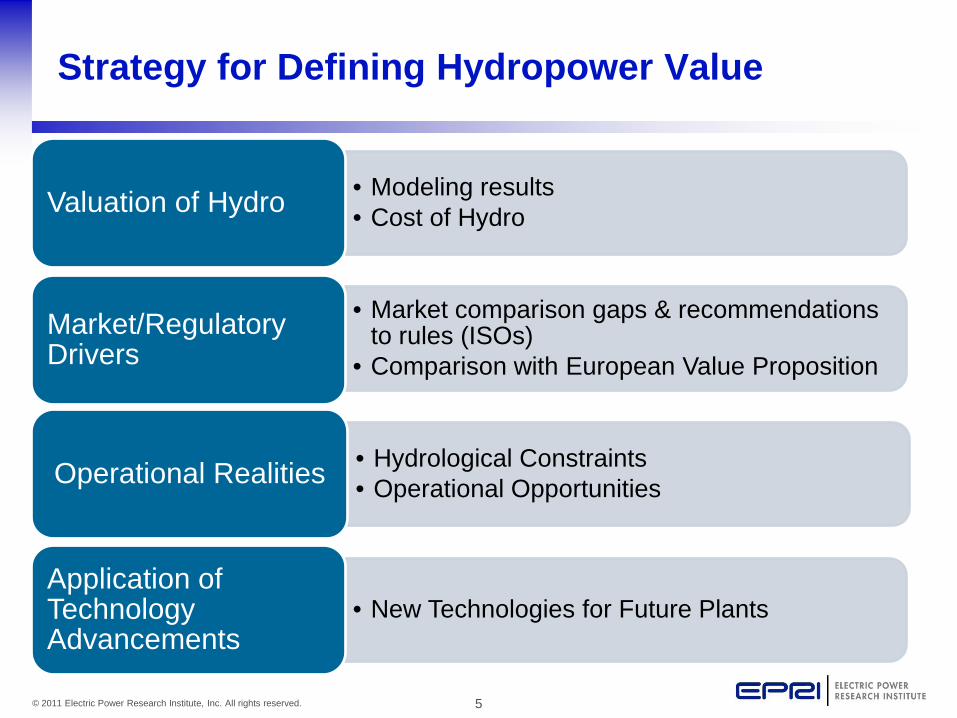
• Modeling results • Cost of Hydro Valuation of Hydro
• Market comparison gaps & recommendations to rules (ISOs)
• Comparison with European Value Proposition Market/Regulatory Drivers
• Hydrological Constraints • Operational Opportunities Operational Realities
• New Technologies for Future Plants Application of Technology Advancements
Strategy for Defining Hydropower Value
6 © 2011 Electric Power Research Institute, Inc. All rights reserved.
Valuation of Hydro
• Model Results (plant value $/GWh gained) – Developed reference cases for 2010, 2020 – Defined energy future scenarios – Input from pumped storage plant operators
• Hydro Plant Costs (cost of new/upgraded plants)
– Cost elements compiled – Cost comparison with available data – Final report published Oct 31
7 © 2011 Electric Power Research Institute, Inc. All rights reserved.
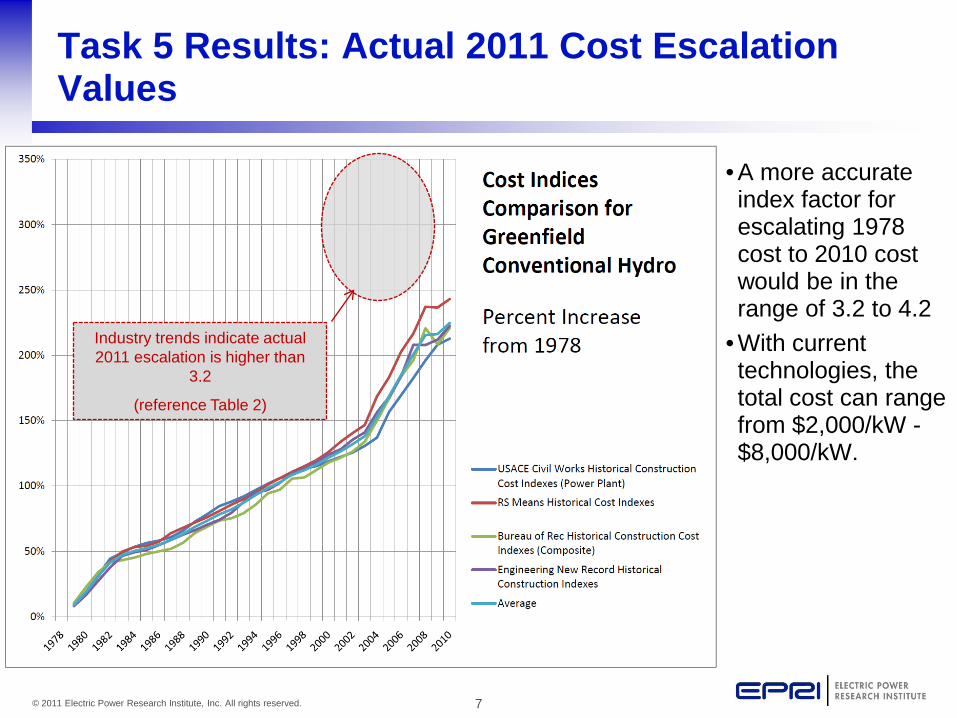
Task 5 Results: Actual 2011 Cost Escalation Values
• A more accurate
index factor for escalating 1978 cost to 2010 cost would be in the range of 3.2 to 4.2
• With current technologies, the total cost can range from $2,000/kW - $8,000/kW.
Industry trends indicate actual 2011 escalation is higher than
3.2
(reference Table 2)
8 © 2011 Electric Power Research Institute, Inc. All rights reserved.
Model Calibration: Plant Operator Feedback
Effort to reach out to plants owners to gain a more accurate picture of the operations and drivers of hydro plant operations. This work includes:
• Individual calls with plant owners to better understand operations and get feedback on main drivers and model results
• Improved treatment of ancillary services for hydro by comparing multiple test simulations to actual market data and modeling results.
Input/new learnings incorporated into the model
9 © 2011 Electric Power Research Institute, Inc. All rights reserved.
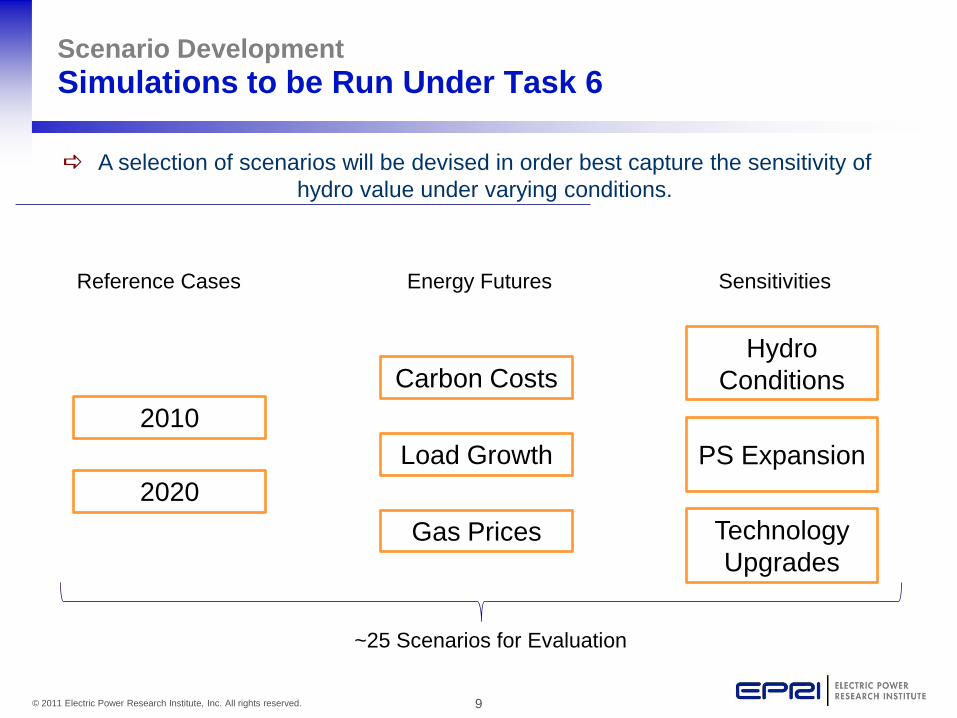
Scenario Development Simulations to be Run Under Task 6
A selection of scenarios will be devised in order best capture the sensitivity of hydro value under varying conditions.
2010
2020
Reference Cases Energy Futures Sensitivities
Carbon Costs
Load Growth
Gas Prices
Hydro Conditions
PS Expansion
Technology Upgrades
~25 Scenarios for Evaluation
10 © 2011 Electric Power Research Institute, Inc. All rights reserved.
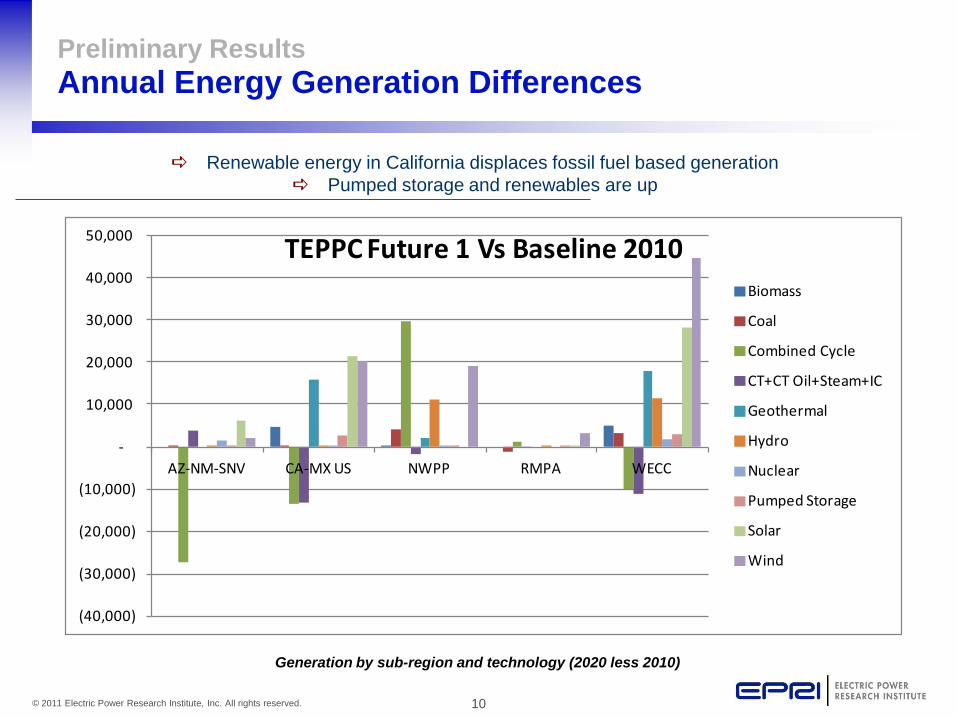
Preliminary Results Annual Energy Generation Differences
Renewable energy in California displaces fossil fuel based generation Pumped storage and renewables are up
Generation by sub-region and technology (2020 less 2010)
(40,000)
(30,000)
(20,000)
(10,000)
-
10,000
20,000
30,000
40,000
50,000
AZ-NM-SNV CA-MX US NWPP RMPA WECC
TEPPC Future 1 Vs Baseline 2010 Biomass
Coal
Combined Cycle
CT+CT Oil+Steam+IC
Geothermal
Hydro
Nuclear
Pumped Storage
Solar
Wind
11 © 2011 Electric Power Research Institute, Inc. All rights reserved.
Market/Regulatory Drivers
• Market comparison gaps & recommendations to rules (ISOs)
– Completed report on market treatment of generation and ancillary services
– Conducted workshop with WECC/CAISO
• Comparison with European Value Proposition – Input from stakeholders on pumped storage market
drivers
12 © 2011 Electric Power Research Institute, Inc. All rights reserved.
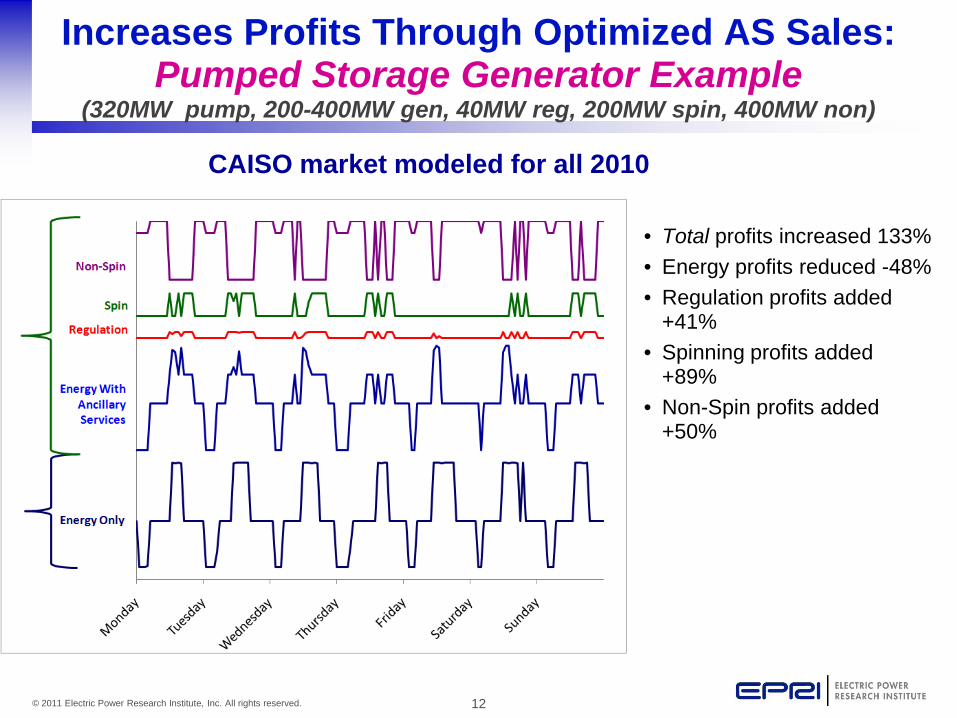
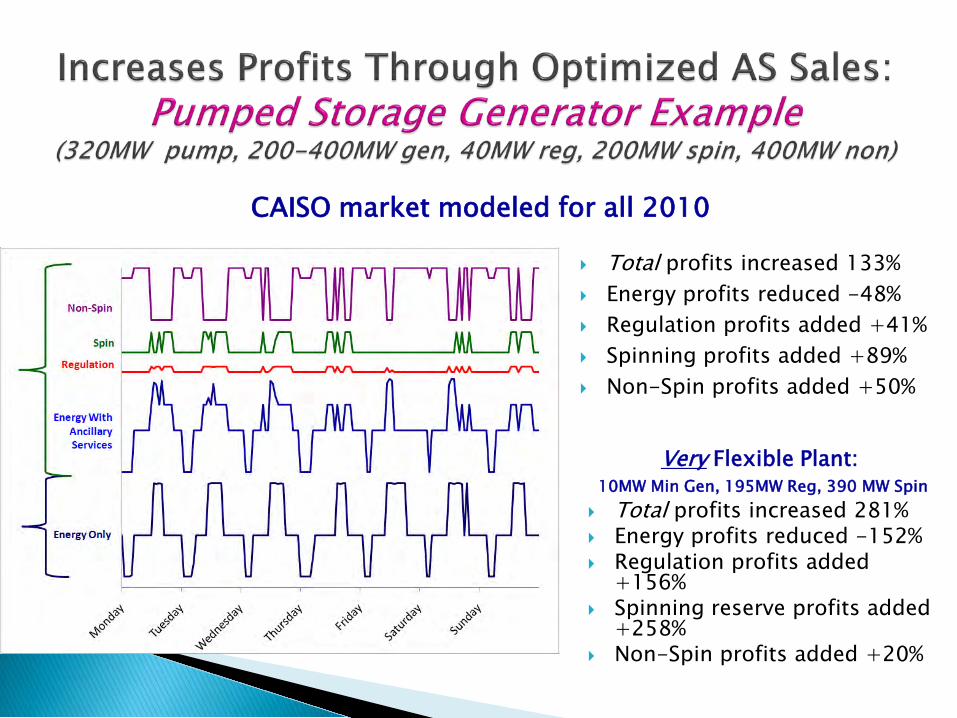
Increases Profits Through Optimized AS Sales: Pumped Storage Generator Example
(320MW pump, 200-400MW gen, 40MW reg, 200MW spin, 400MW non)
• Total profits increased 133% • Energy profits reduced -48% • Regulation profits added
+41% • Spinning profits added
+89% • Non-Spin profits added
+50%
CAISO market modeled for all 2010
13 © 2011 Electric Power Research Institute, Inc. All rights reserved.
Operational Realities
• Hydrological Constraints – Compiled water operations metrics for grid services – Began work to identify linkages between grid services
and water availability – Identify hydropower modeling needs
• Operational Opportunities – Continue work on case studies to identify operational
drivers
14 © 2011 Electric Power Research Institute, Inc. All rights reserved.
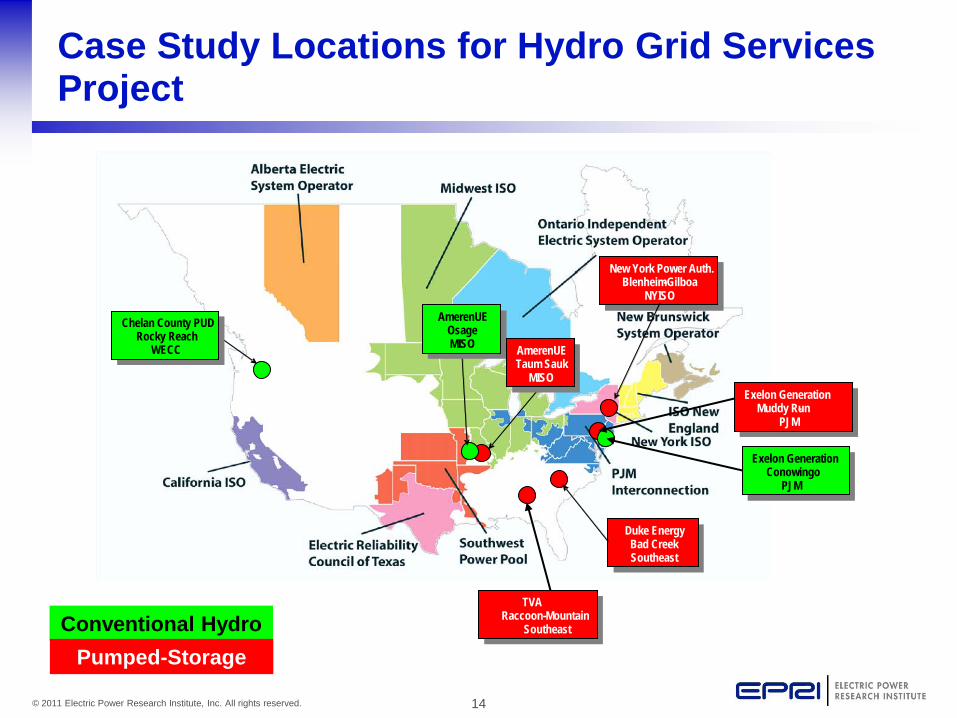
Case Study Locations for Hydro Grid Services Project
Pacific Gas & Electric Helms
CAISO, WECC
Pacific Gas & Electric Helms
CAISO, WECC
USACE
SWPA, MISO
USACE Harry S. Truman
Duke Energy Bad Creek Southeast
Duke Energy Bad Creek Southeast
AmerenUE Osage MISO
AmerenUE Osage MISO
AmerenUE Taum Sauk
MISO
AmerenUE Taum Sauk
MISO
Chelan County PUD Rocky Reach
WECC
Chelan County PUD Rocky Reach
WECC
Chelan County PUD Rocky Reach
WECC
Chelan County PUD Rocky Reach
WECC
New York Power Auth. Blenheim - Gilboa
NYISO
New York Power Auth. Blenheim - Gilboa
NYISO
New York Power Auth. Blenheim - Gilboa
NYISO
New York Power Auth. Blenheim - Gilboa
NYISO
Duke Energy Bad Creek Southeast
Duke Energy Bad Creek Southeast
AmerenUE Osage MISO
AmerenUE Osage MISO
AmerenUE Taum Sauk
MISO
AmerenUE Taum Sauk
MISO
New York Power Auth. Blenheim - Gilboa
NYISO
New York Power Auth. Blenheim - Gilboa
NYISO
New York Power Auth. Blenheim - Gilboa
NYISO
Exelon Generation Muddy Run -
PJM
Chelan County PUD Rocky Reach
WECC
Chelan County PUD Rocky Reach
WECC
Chelan County PUD Rocky Reach
WECC
Exelon Generation Conowingo
PJM
New York Power Auth. Blenheim - Gilboa
NYISO
New York Power Auth. Blenheim - Gilboa
NYISO
New York Power Auth. Blenheim - Gilboa
NYISO
TVA Raccoon Mountain -
Southeast Conventional Hydro Pumped-Storage
15 © 2011 Electric Power Research Institute, Inc. All rights reserved.
Application of Technology Advancements
• New Technologies for Future Plants – Investigate options for plant upgrades
» Provide more energy » Provide more services » Adding a turbine
– Investigate new plant technologies
» Variable speed
16 © 2011 Electric Power Research Institute, Inc. All rights reserved.
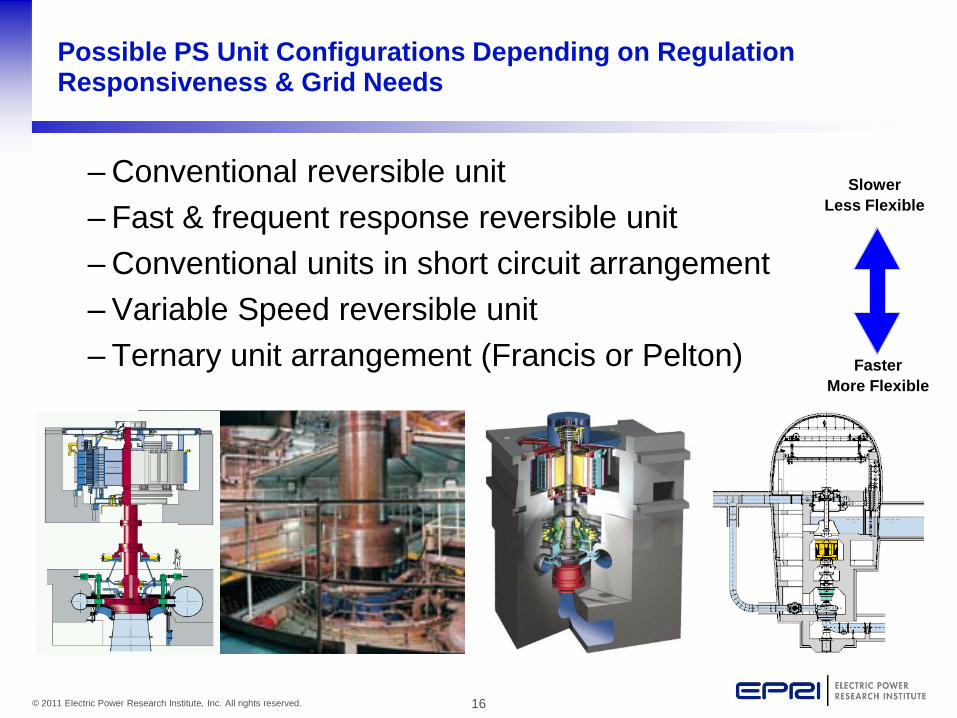
Possible PS Unit Configurations Depending on Regulation Responsiveness & Grid Needs
– Conventional reversible unit – Fast & frequent response reversible unit – Conventional units in short circuit arrangement – Variable Speed reversible unit – Ternary unit arrangement (Francis or Pelton)
Slower Less Flexible
Faster More Flexible

17 © 2011 Electric Power Research Institute, Inc. All rights reserved.
Together…Shaping the Future of Electricity
EPRI/MISO Hydro Workshop
October 3rd, 2011 Jordan Bakke

MISO Studies
• Energy Storage Study • Manitoba Hydro Wind Synergy Study
2

Energy Storage Modeling in EGEAS
Storage Modeling in EGEAS
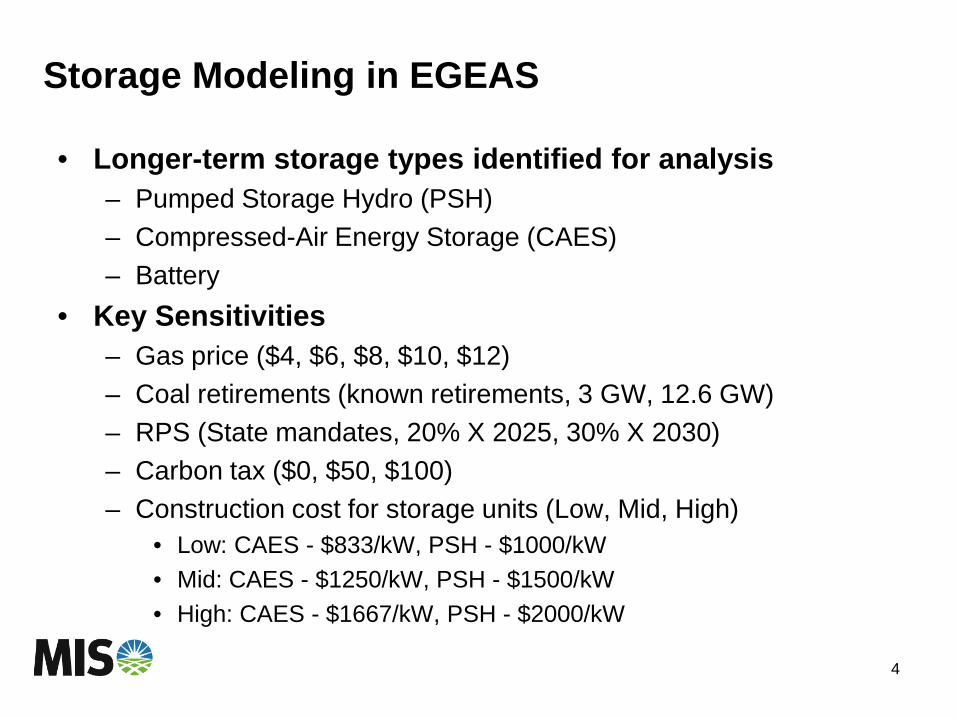
• Longer-term storage types identified for analysis – Pumped Storage Hydro (PSH) – Compressed-Air Energy Storage (CAES) – Battery
• Key Sensitivities – Gas price ($4, $6, $8, $10, $12) – Coal retirements (known retirements, 3 GW, 12.6 GW) – RPS (State mandates, 20% X 2025, 30% X 2030) – Carbon tax ($0, $50, $100) – Construction cost for storage units (Low, Mid, High)
• Low: CAES - $833/kW, PSH - $1000/kW • Mid: CAES - $1250/kW, PSH - $1500/kW • High: CAES - $1667/kW, PSH - $2000/kW
4
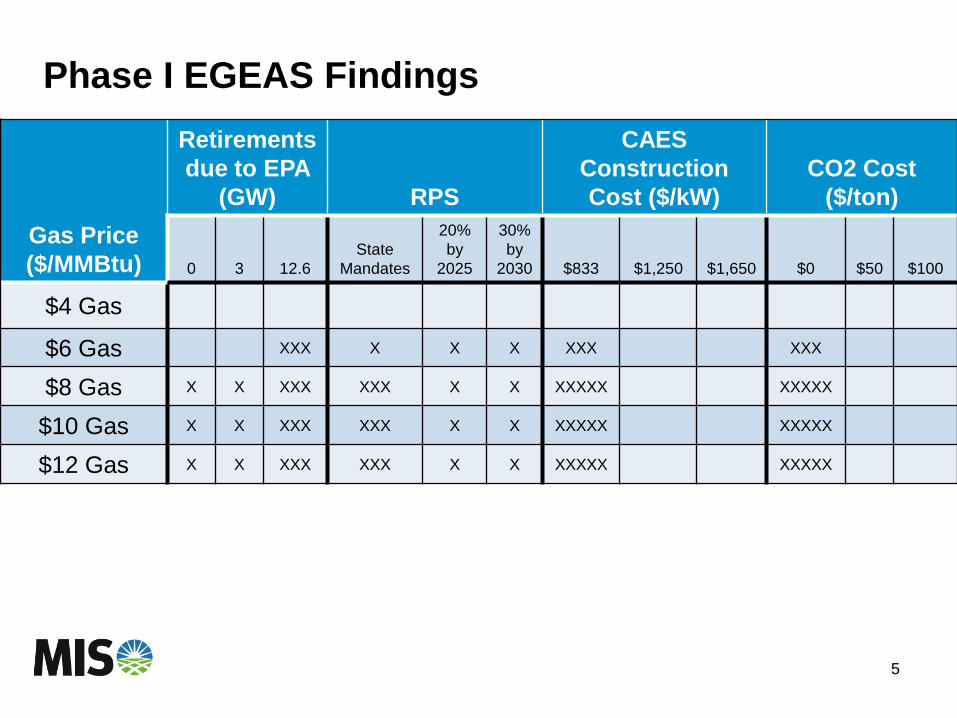
Phase I EGEAS Findings
Gas Price ($/MMBtu)
Retirements due to EPA
(GW) RPS
CAES Construction Cost ($/kW)
CO2 Cost ($/ton)
0 3 12.6 State
Mandates
20% by
2025
30% by
2030 $833 $1,250 $1,650 $0 $50 $100
$4 Gas
$6 Gas XXX X X X XXX XXX
$8 Gas X X XXX XXX X X XXXXX XXXXX
$10 Gas X X XXX XXX X X XXXXX XXXXX
$12 Gas X X XXX XXX X X XXXXX XXXXX
5
Additional Trends & Notes on Storage
• CAES was only picked in runs with $0 CO2
• As gas prices went up, storage tended to get picked earlier in the study period
• As RPS levels went up, the need for storage was pushed further out in the study horizon; also, the total amount of installed storage was reduced as RPS increased
• No CAES picked at $1,250/kW construction cost; only picked at $833/kW regardless of retirements, CO2, etc.
6
Next Steps
• Finish compiling results – Final EGEAS results presentation at TRG (10/4/11)
• Report writing – Phase I report expected completion date is 11/15/11
7
MH Hydro Wind Synergy Study - Scope
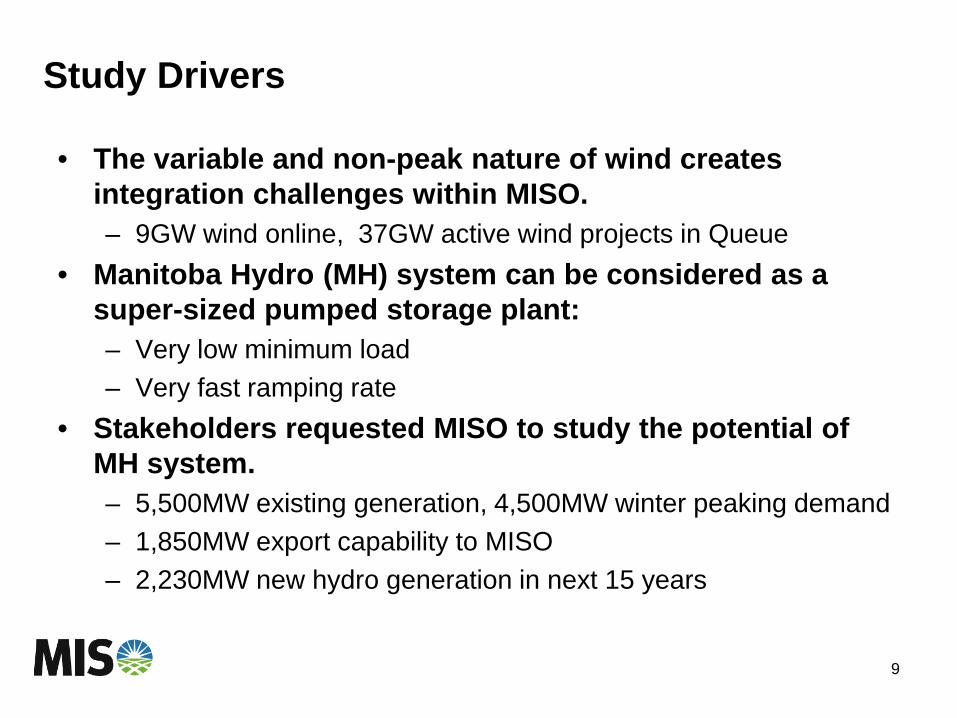
Study Drivers
• The variable and non-peak nature of wind creates integration challenges within MISO. – 9GW wind online, 37GW active wind projects in Queue
• Manitoba Hydro (MH) system can be considered as a super-sized pumped storage plant: – Very low minimum load – Very fast ramping rate
• Stakeholders requested MISO to study the potential of MH system. – 5,500MW existing generation, 4,500MW winter peaking demand – 1,850MW export capability to MISO – 2,230MW new hydro generation in next 15 years
9
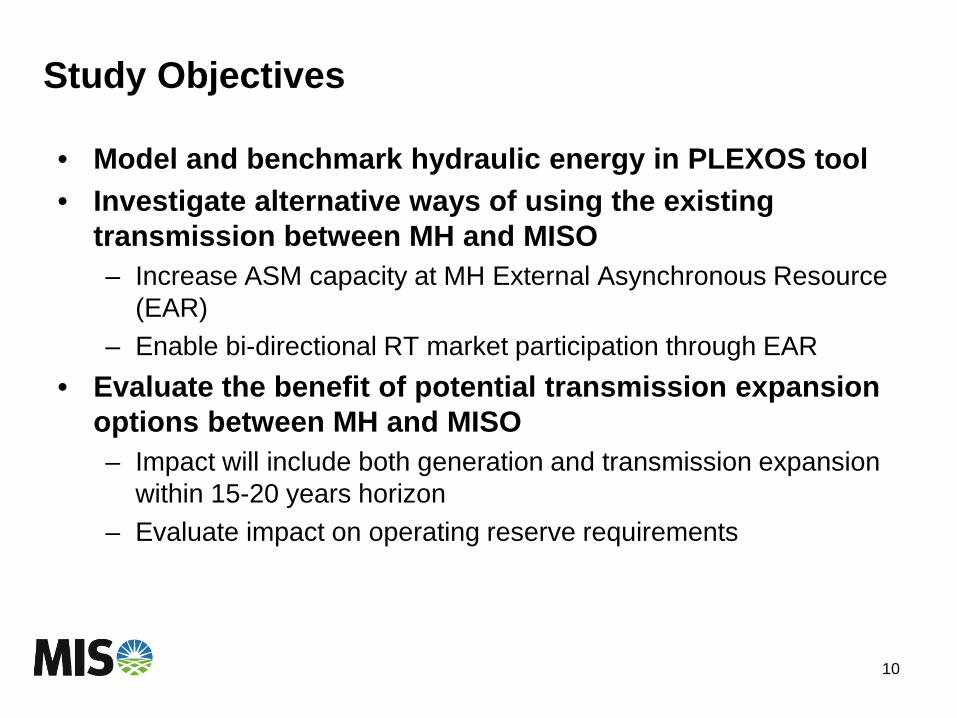
Study Objectives
• Model and benchmark hydraulic energy in PLEXOS tool • Investigate alternative ways of using the existing
transmission between MH and MISO – Increase ASM capacity at MH External Asynchronous Resource
(EAR) – Enable bi-directional RT market participation through EAR
• Evaluate the benefit of potential transmission expansion options between MH and MISO – Impact will include both generation and transmission expansion
within 15-20 years horizon – Evaluate impact on operating reserve requirements
10
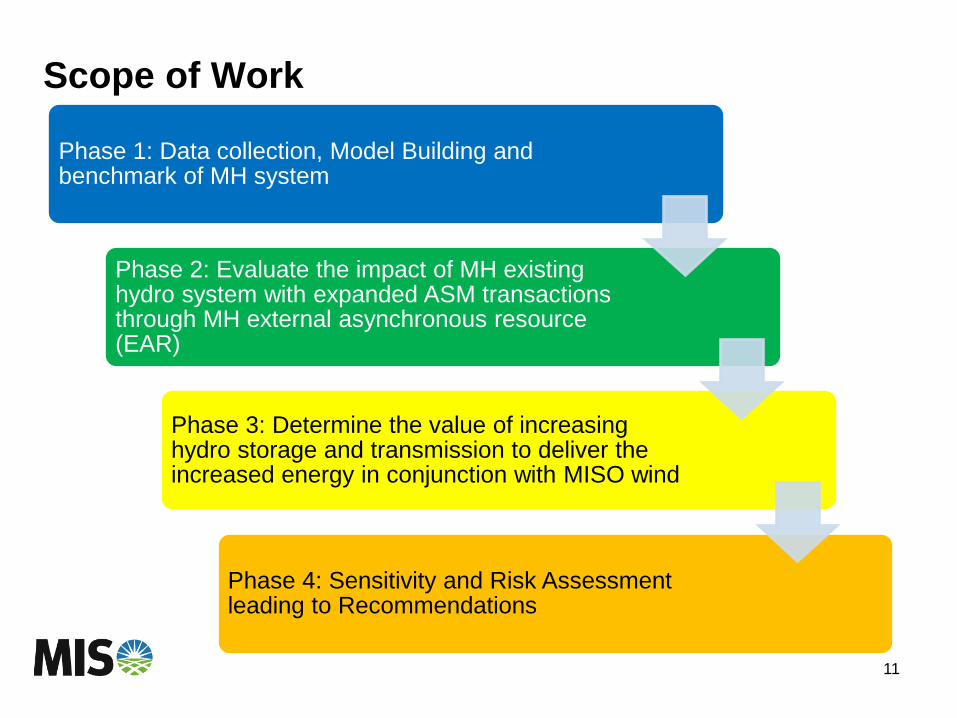
Scope of Work
11
Phase 1: Data collection, Model Building and benchmark of MH system
Phase 2: Evaluate the impact of MH existing hydro system with expanded ASM transactions through MH external asynchronous resource (EAR)
Phase 3: Determine the value of increasing hydro storage and transmission to deliver the increased energy in conjunction with MISO wind
Phase 4: Sensitivity and Risk Assessment leading to Recommendations
Methodology
• PLEXOS will be the primary simulation tool for this study. • Hourly and 5-min simulation will be performed to evaluate
the impact on energy and reserve market. • 3 hydrologic conditions and appropriate MTEP futures
will be considered as sensitivities. • Decision tree will be used to calculate the potential
benefit. • A Technical Review Group (TRG) will advise on study
methodology, verify the models, design the solutions and review results.
12
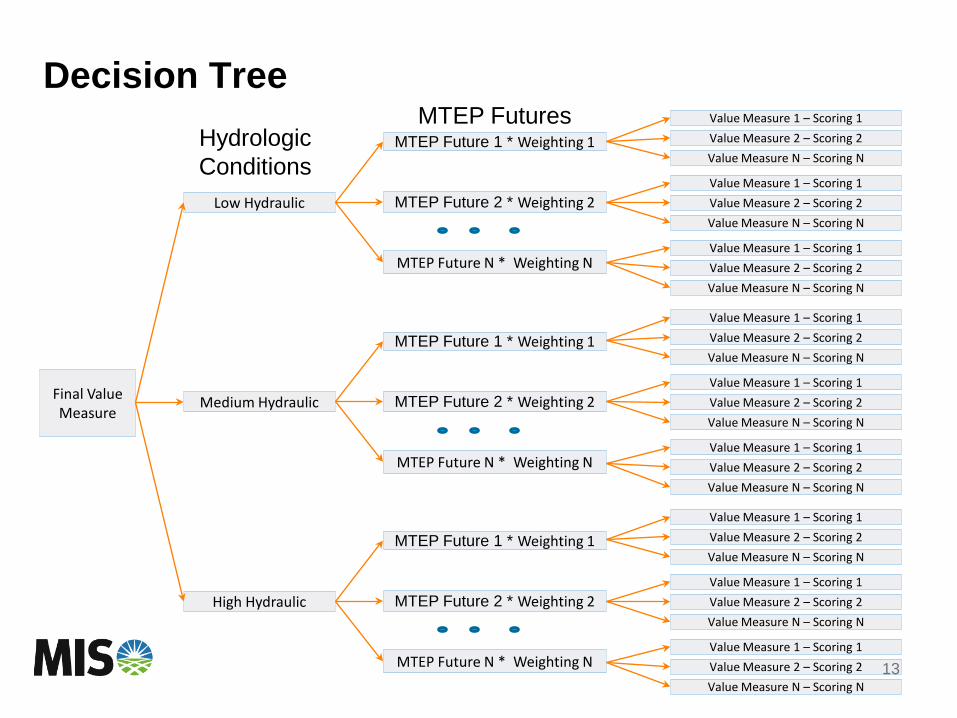
Decision Tree
13
Low Hydraulic
MTEP Future 1 * Weighting 1
MTEP Future N * Weighting N
Value Measure 2 – Scoring 2 Value Measure N – Scoring N
Value Measure 1 – Scoring 1
Value Measure 2 – Scoring 2 Value Measure N – Scoring N
Value Measure 1 – Scoring 1
MTEP Future 2 * Weighting 2 Value Measure 2 – Scoring 2 Value Measure N – Scoring N
Value Measure 1 – Scoring 1
Medium Hydraulic
Value Measure 2 – Scoring 2 Value Measure N – Scoring N
Value Measure 1 – Scoring 1
Value Measure 2 – Scoring 2 Value Measure N – Scoring N
Value Measure 1 – Scoring 1
Value Measure 2 – Scoring 2 Value Measure N – Scoring N
Value Measure 1 – Scoring 1
High Hydraulic
Value Measure 2 – Scoring 2 Value Measure N – Scoring N
Value Measure 1 – Scoring 1
Value Measure 2 – Scoring 2 Value Measure N – Scoring N
Value Measure 1 – Scoring 1
Value Measure 2 – Scoring 2 Value Measure N – Scoring N
Value Measure 1 – Scoring 1
Final Value Measure
MTEP Future 1 * Weighting 1
MTEP Future N * Weighting N
MTEP Future 2 * Weighting 2
MTEP Future 1 * Weighting 1
MTEP Future N * Weighting N
MTEP Future 2 * Weighting 2
Hydrologic Conditions
MTEP Futures
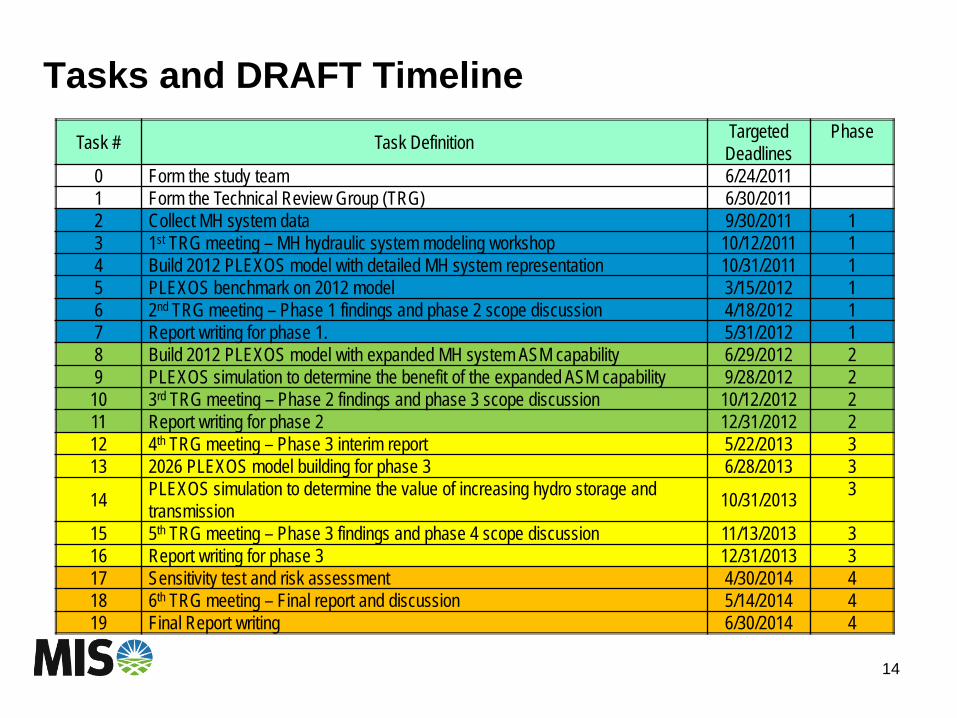
Tasks and DRAFT Timeline
14
Task # Task Definition Targeted Deadlines
Phase
0 Form the study team 6/24/2011 1 Form the Technical Review Group (TRG) 6/30/2011 2 Collect MH system data 9/30/2011 1 3 1st TRG meeting – MH hydraulic system modeling workshop 10/12/2011 1 4 Build 2012 PLEXOS model with detailed MH system representation 10/31/2011 1 5 PLEXOS benchmark on 2012 model 3/15/2012 1 6 2nd TRG meeting – Phase 1 findings and phase 2 scope discussion 4/18/2012 1 7 Report writing for phase 1. 5/31/2012 1 8 Build 2012 PLEXOS model with expanded MH system ASM capability 6/29/2012 2 9 PLEXOS simulation to determine the benefit of the expanded ASM capability 9/28/2012 2
10 3rd TRG meeting – Phase 2 findings and phase 3 scope discussion 10/12/2012 2 11 Report writing for phase 2 12/31/2012 2 12 4th TRG meeting – Phase 3 interim report 5/22/2013 3 13 2026 PLEXOS model building for phase 3 6/28/2013 3
14 PLEXOS simulation to determine the value of increasing hydro storage and transmission 10/31/2013 3
15 5th TRG meeting – Phase 3 findings and phase 4 scope discussion 11/13/2013 3 16 Report writing for phase 3 12/31/2013 3 17 Sensitivity test and risk assessment 4/30/2014 4 18 6th TRG meeting – Final report and discussion 5/14/2014 4 19 Final Report writing 6/30/2014 4
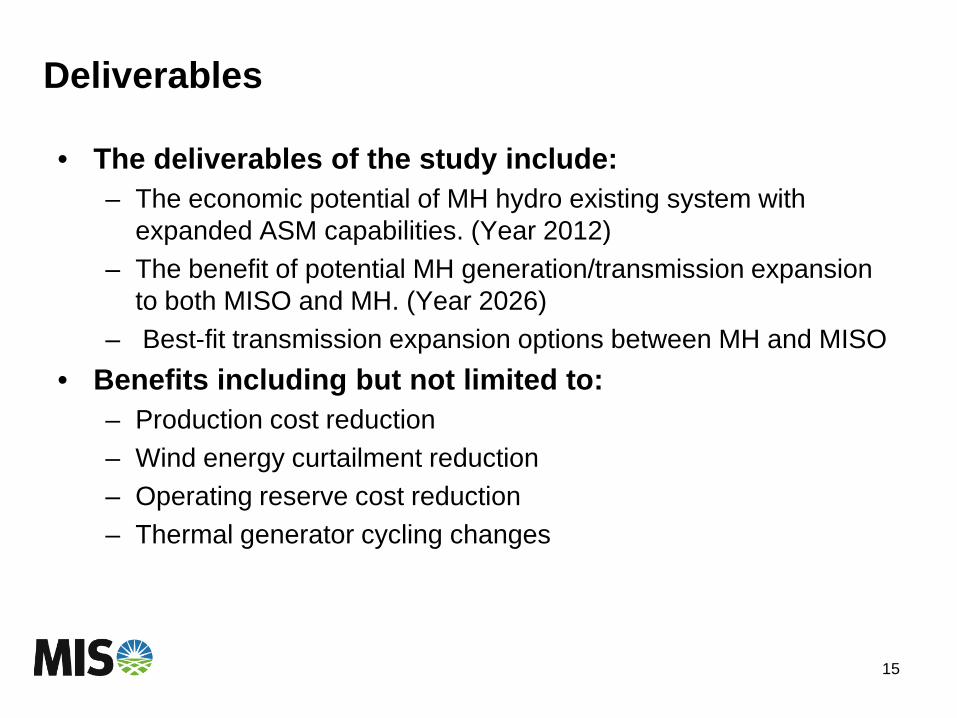
Deliverables
• The deliverables of the study include: – The economic potential of MH hydro existing system with
expanded ASM capabilities. (Year 2012) – The benefit of potential MH generation/transmission expansion
to both MISO and MH. (Year 2026) – Best-fit transmission expansion options between MH and MISO
• Benefits including but not limited to: – Production cost reduction – Wind energy curtailment reduction – Operating reserve cost reduction – Thermal generator cycling changes
15
Contact Info – Energy Storage
EGEAS SME David Van Beek [email protected] Energy Storage Project Manager Rao Konidena [email protected]
16
Contact Info – MH Hydro Wind Synergy Study
Executive Sponsor John Lawhorn [email protected]
Project Consultant Dale Osborn [email protected]
Project Manager Zheng Zhou [email protected]
Scheduling Project Manager Ryan Pulkrabek [email protected]
17
1 © 2011 Electric Power Research Institute, Inc. All rights reserved.
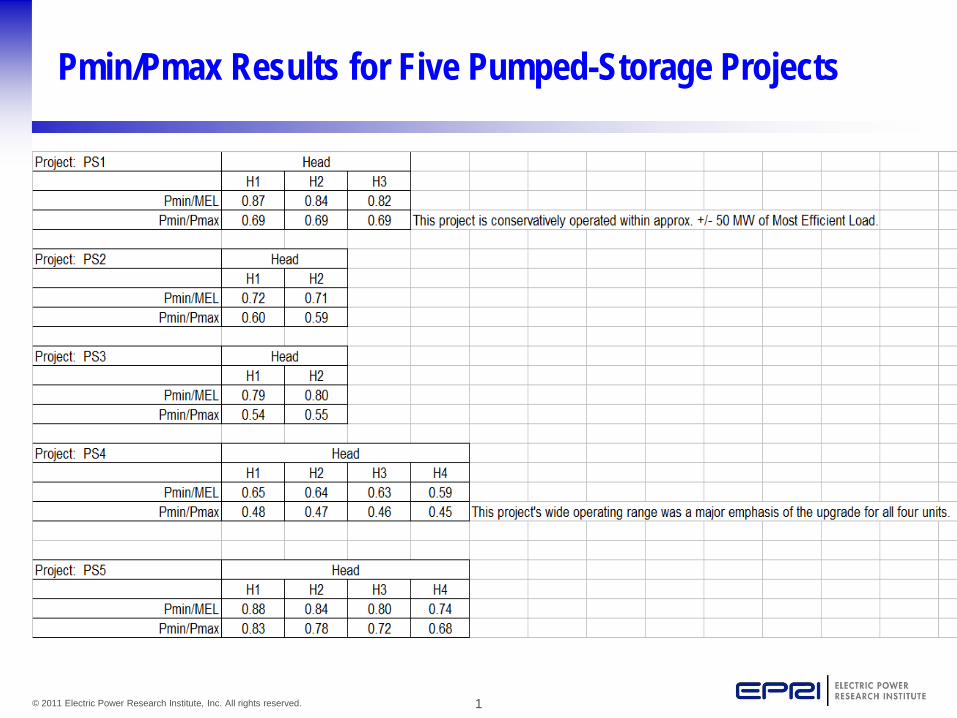
Pmin/Pmax Results for Five Pumped-Storage Projects
2 © 2011 Electric Power Research Institute, Inc. All rights reserved.
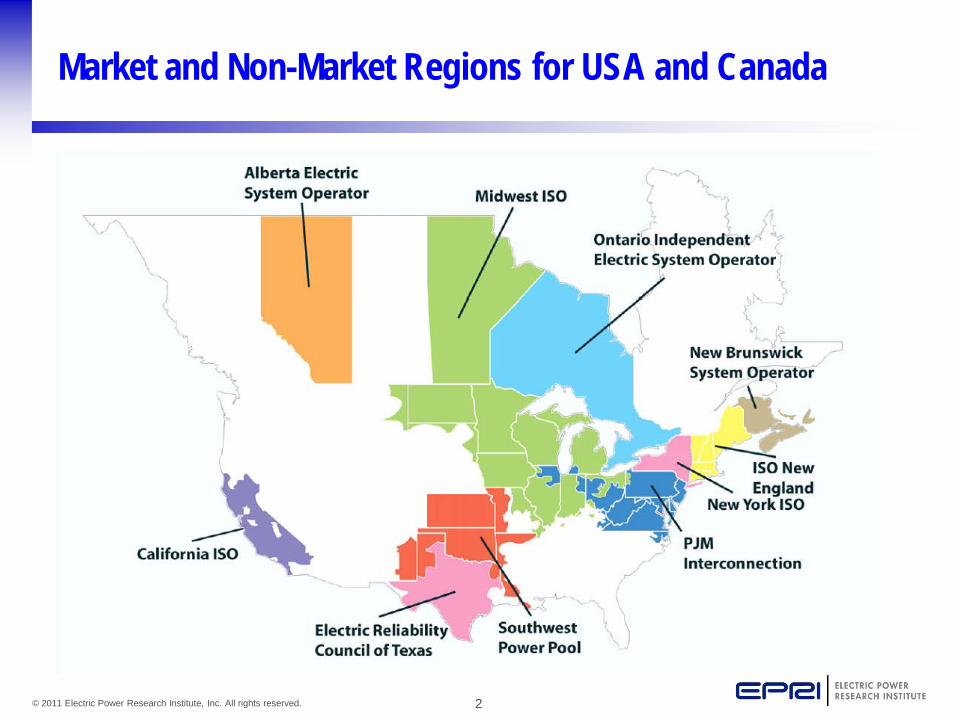
Market and Non-Market Regions for USA and Canada
Pacific Gas & Electric Helms
CAISO, WECC
Pacific Gas & Electric Helms
CAISO, WECC
USACE
SWPA, MISO
USACE Harry S. Truman
Duke Energy Bad Creek Southeast
Duke Energy Bad Creek Southeast
AmerenUE Osage MISO
AmerenUE Osage MISO
AmerenUE Taum Sauk
MISO
AmerenUE Taum Sauk
MISO
3 © 2011 Electric Power Research Institute, Inc. All rights reserved.
HGS Case Studies Task: Purpose and Project Integration
Knowledge gaps that this task addresses: ● Understanding market-related and non-market operational
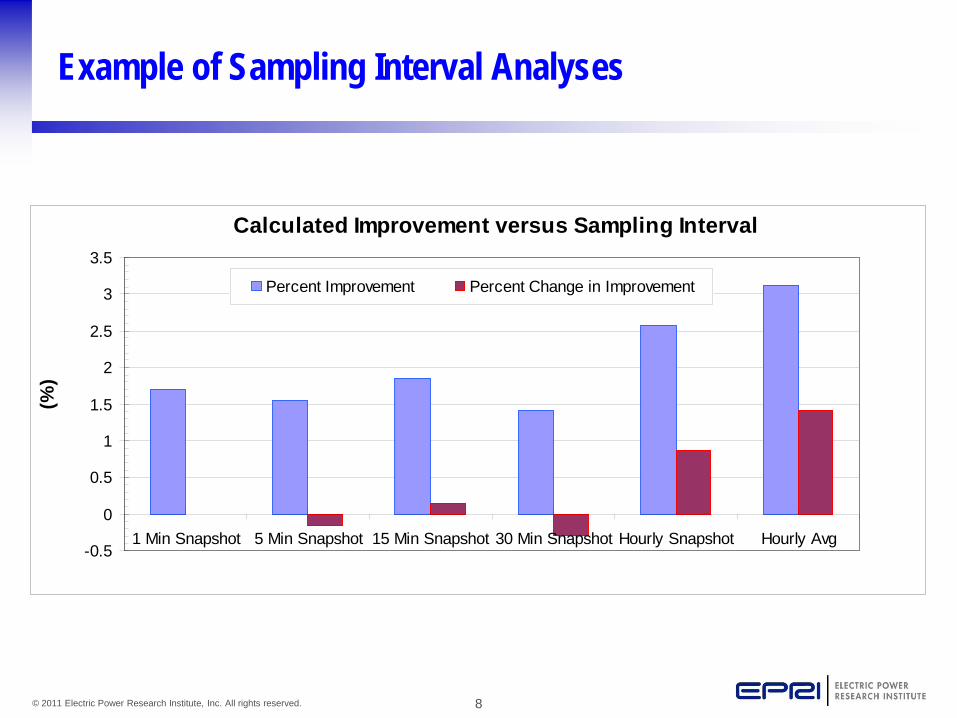
patterns ● Quantifying suboptimization due to these operational patterns ● Comparing near-real-time operations with hourly averages
Integration of task results into overall HGS Project: ● Assisting the verification of the UPLAN model for WECC ● Providing “rules of thumb” for market-related suboptimization to
inform model assumptions for future scenarios ● Providing recommendations for further investigation
4 © 2011 Electric Power Research Institute, Inc. All rights reserved.
Technical Approach for Case Studies
Procedure: ●Conduct site visits, collect operational data, collect market data ●Conduct detailed performance analyses for each plant ● Prepare confidential reports to utilities and HGS summary report using non-confidential results
Unique aspects: ●Utilization of optimization engine and automated data analysis engine to perform quantitative performance analyses ● Evaluation of multiple owner/operators, multiple market regions (and non-market regions), and multiple plant and unit types
5 © 2011 Electric Power Research Institute, Inc. All rights reserved.
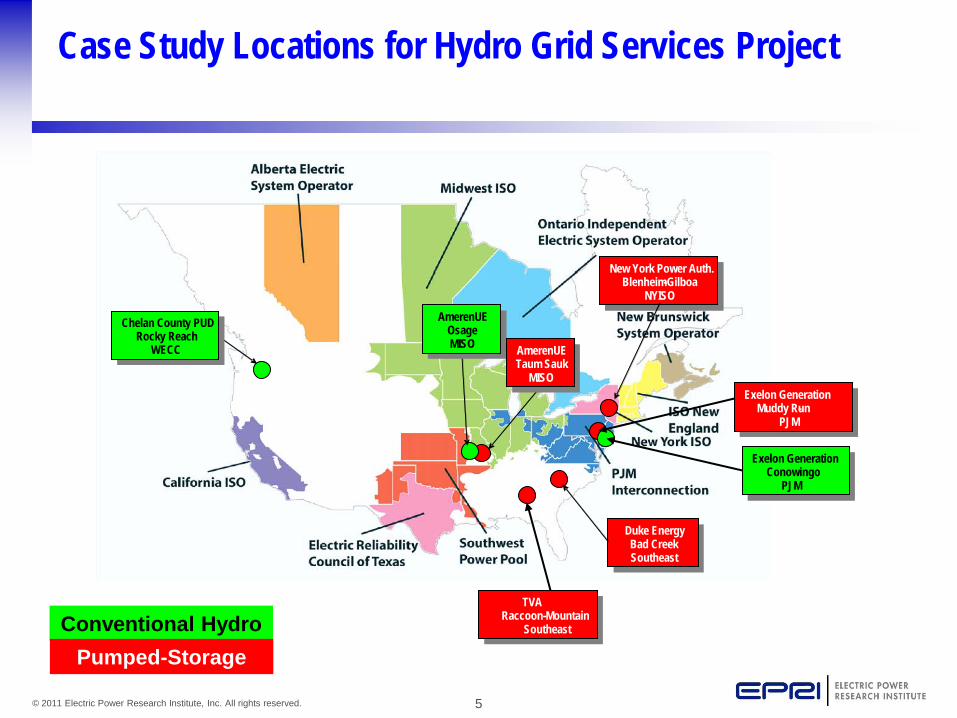
Case Study Locations for Hydro Grid Services Project
Pacific Gas & Electric Helms
CAISO, WECC
Pacific Gas & Electric Helms
CAISO, WECC
USACE
SWPA, MISO
USACE Harry S. Truman
Duke Energy Bad Creek Southeast
Duke Energy Bad Creek Southeast
AmerenUE Osage MISO
AmerenUE Osage MISO
AmerenUE Taum Sauk
MISO
AmerenUE Taum Sauk
MISO
Chelan County PUD Rocky Reach
WECC
Chelan County PUD Rocky Reach
WECC
Chelan County PUD Rocky Reach
WECC
Chelan County PUD Rocky Reach
WECC
New York Power Auth. Blenheim - Gilboa
NYISO
New York Power Auth. Blenheim - Gilboa
NYISO
New York Power Auth. Blenheim - Gilboa
NYISO
New York Power Auth. Blenheim - Gilboa
NYISO
Duke Energy Bad Creek Southeast
Duke Energy Bad Creek Southeast
AmerenUE Osage MISO
AmerenUE Osage MISO
AmerenUE Taum Sauk
MISO
AmerenUE Taum Sauk
MISO
New York Power Auth. Blenheim - Gilboa
NYISO
New York Power Auth. Blenheim - Gilboa
NYISO
New York Power Auth. Blenheim - Gilboa
NYISO
Exelon Generation Muddy Run -
PJM
Chelan County PUD Rocky Reach
WECC
Chelan County PUD Rocky Reach
WECC
Chelan County PUD Rocky Reach
WECC
Exelon Generation Conowingo
PJM
New York Power Auth. Blenheim - Gilboa
NYISO
New York Power Auth. Blenheim - Gilboa
NYISO
New York Power Auth. Blenheim - Gilboa
NYISO
TVA Raccoon Mountain -
Southeast Conventional Hydro Pumped-Storage
6 © 2011 Electric Power Research Institute, Inc. All rights reserved.
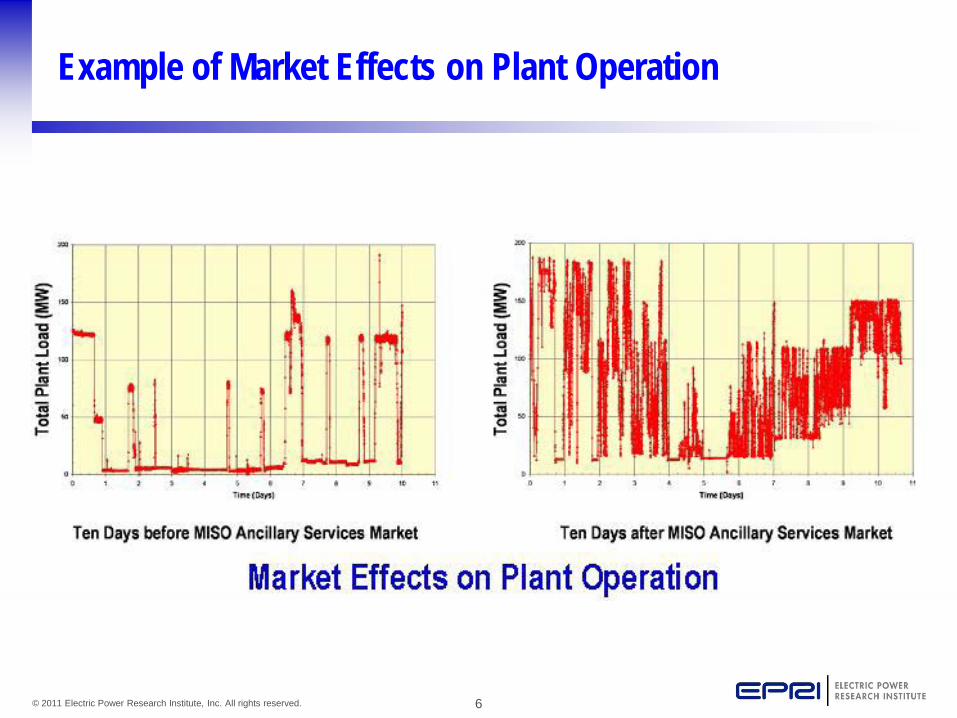
Example of Market Effects on Plant Operation
7 © 2011 Electric Power Research Institute, Inc. All rights reserved.
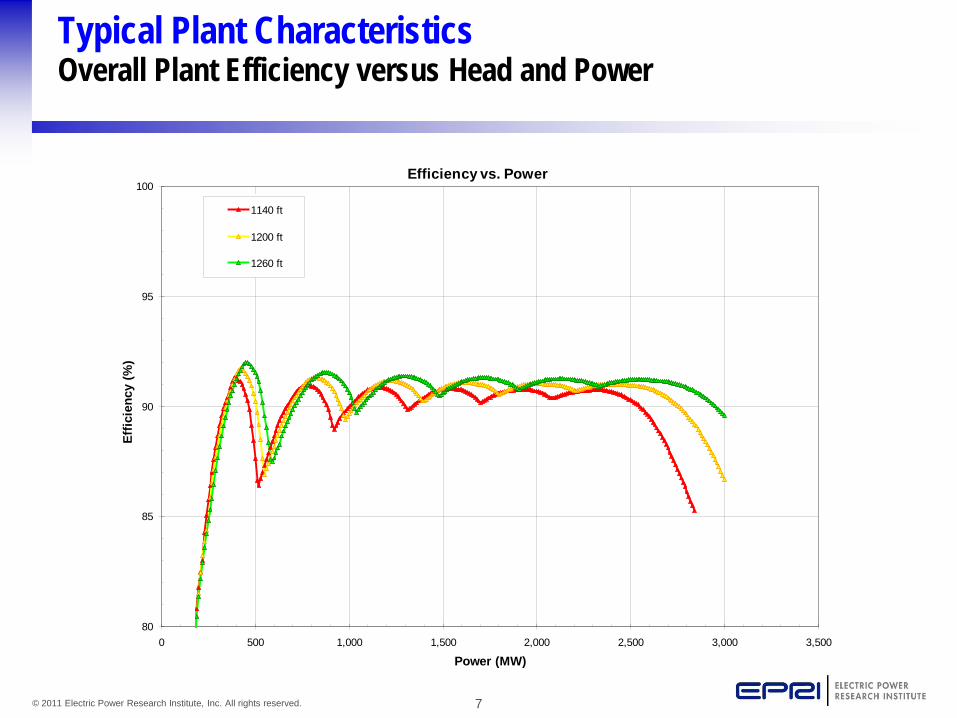
Typical Plant Characteristics Overall Plant Efficiency versus Head and Power
Efficiency vs. Power
80
85
90
95
100
0 500 1,000 1,500 2,000 2,500 3,000 3,500
Power (MW)
Effic
ienc
y (%
)
1140 ft
1200 ft
1260 ft
8 © 2011 Electric Power Research Institute, Inc. All rights reserved.
Example of Sampling Interval Analyses
Calculated Improvement versus Sampling Interval
-0.5
0
0.5
1
1.5
2
2.5
3
3.5
1 Min Snapshot 5 Min Snapshot 15 Min Snapshot 30 Min Snapshot Hourly Snapshot Hourly Avg
(%)
Percent Improvement Percent Change in Improvement
9 © 2011 Electric Power Research Institute, Inc. All rights reserved.
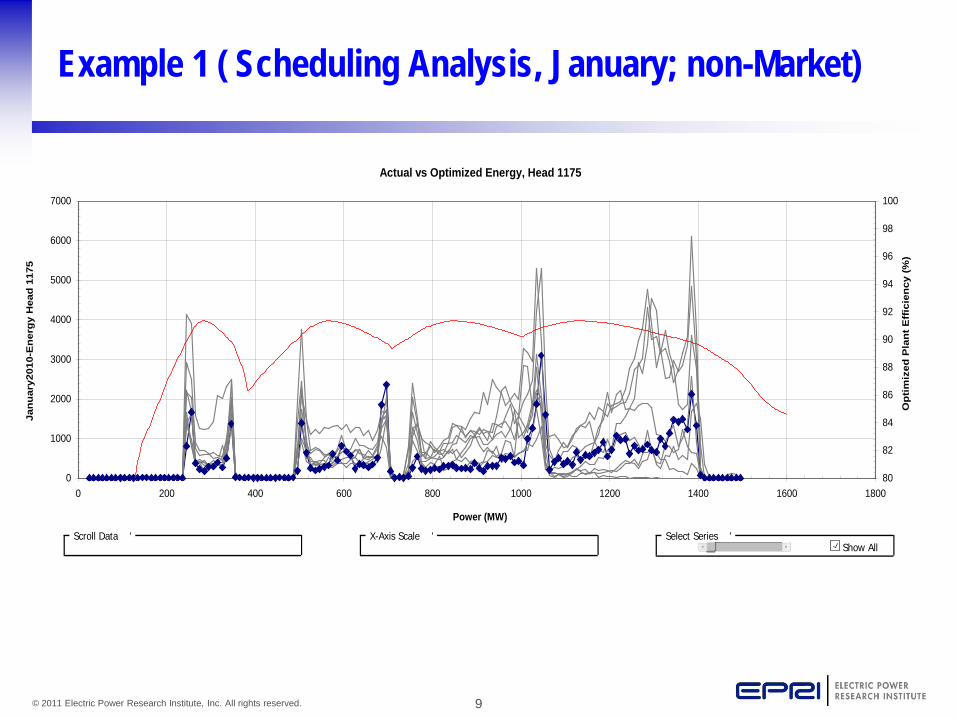
Example 1 ( Scheduling Analysis, January; non-Market)
Actual vs Optimized Energy, Head 1175
0
1000
2000
3000
4000
5000
6000
7000
0 200 400 600 800 1000 1200 1400 1600 1800
Power (MW)
Jan
uar
y201
0-E
ner
gy
Hea
d 1
175
80
82
84
86
88
90
92
94
96
98
100
Op
tim
ized
Pla
nt
Eff
icie
ncy
(%
)
Scroll Data 'Show All
Select Series 'X-Axis Scale '
10 © 2011 Electric Power Research Institute, Inc. All rights reserved.
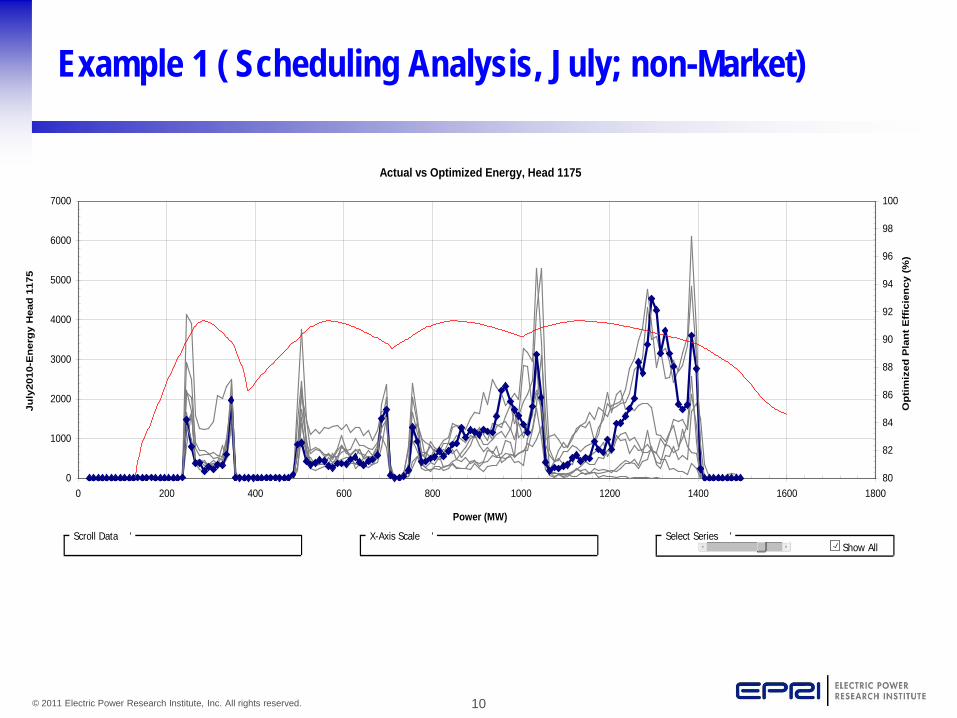
Example 1 ( Scheduling Analysis, July; non-Market)
Actual vs Optimized Energy, Head 1175
0
1000
2000
3000
4000
5000
6000
7000
0 200 400 600 800 1000 1200 1400 1600 1800
Power (MW)
July
2010
-En
erg
y H
ead
117
5
80
82
84
86
88
90
92
94
96
98
100
Op
tim
ized
Pla
nt
Eff
icie
ncy
(%
)
Scroll Data 'Show All
Select Series 'X-Axis Scale '
11 © 2011 Electric Power Research Institute, Inc. All rights reserved.
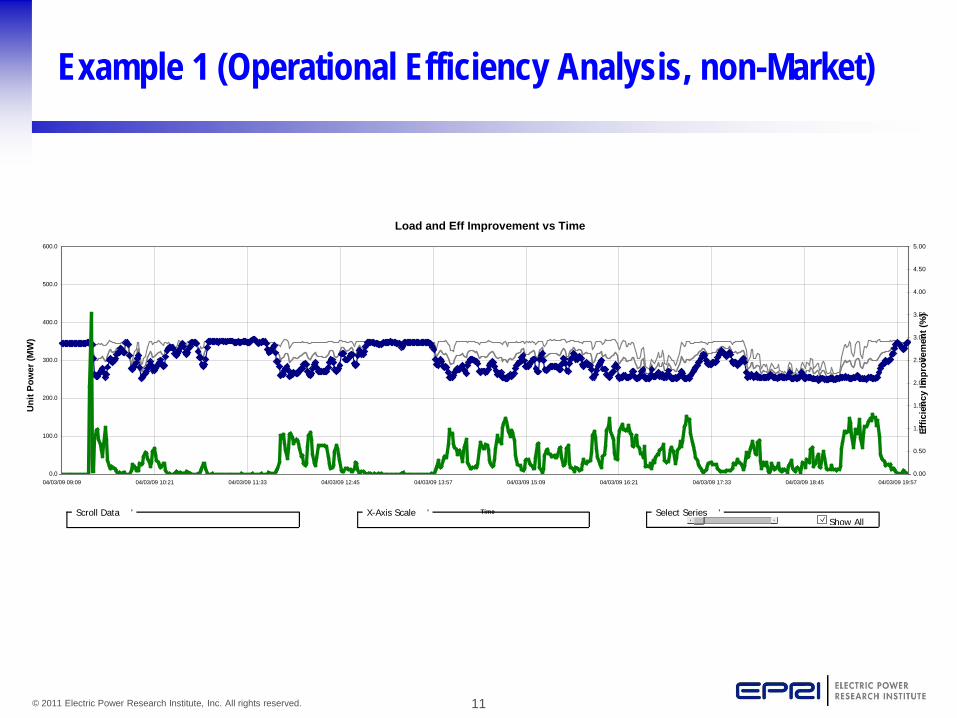
Example 1 (Operational Efficiency Analysis, non-Market)
Load and Eff Improvement vs Time
0.0
100.0
200.0
300.0
400.0
500.0
600.0
04/03/09 09:09 04/03/09 10:21 04/03/09 11:33 04/03/09 12:45 04/03/09 13:57 04/03/09 15:09 04/03/09 16:21 04/03/09 17:33 04/03/09 18:45 04/03/09 19:57
Time
Uni
t Pow
er (M
W)
0.00
0.50
1.00
1.50
2.00
2.50
3.00
3.50
4.00
4.50
5.00
Effic
ienc
y Im
prov
emen
t (%
)
Scroll Data 'Show All
Select Series 'X-Axis Scale '
12 © 2011 Electric Power Research Institute, Inc. All rights reserved.
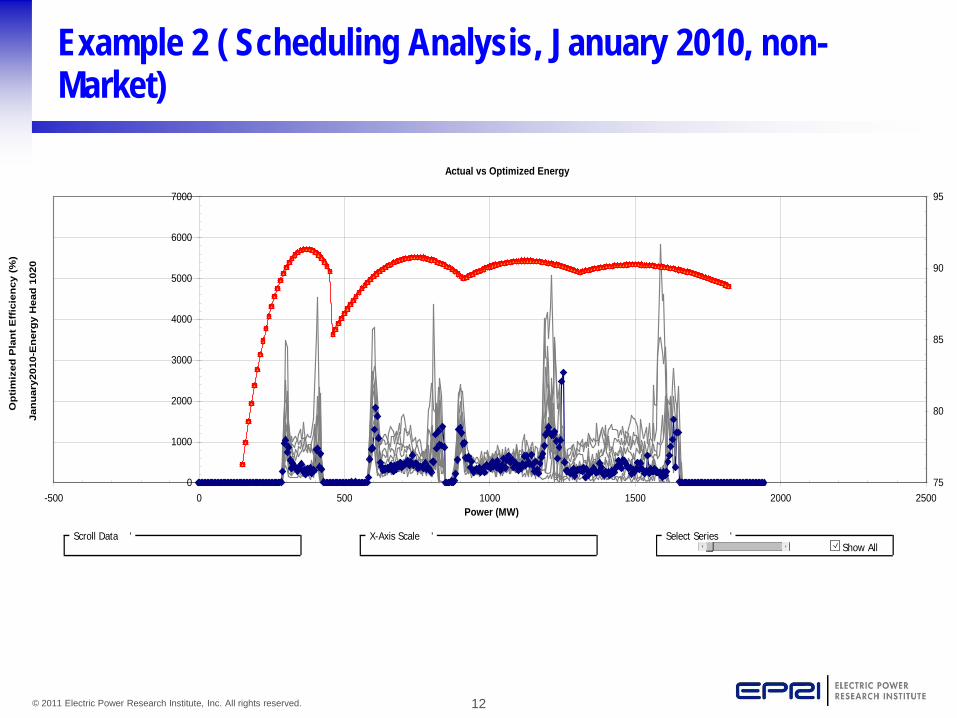
Example 2 ( Scheduling Analysis, January 2010, non-Market)
Actual vs Optimized Energy
0
1000
2000
3000
4000
5000
6000
7000
-500 0 500 1000 1500 2000 2500Power (MW)
Jan
uar
y201
0-E
ner
gy
Hea
d 1
020
75
80
85
90
95
Op
tim
ized
Pla
nt
Eff
icie
ncy
(%
)
Scroll Data 'Show All
Select Series 'X-Axis Scale '
13 © 2011 Electric Power Research Institute, Inc. All rights reserved.
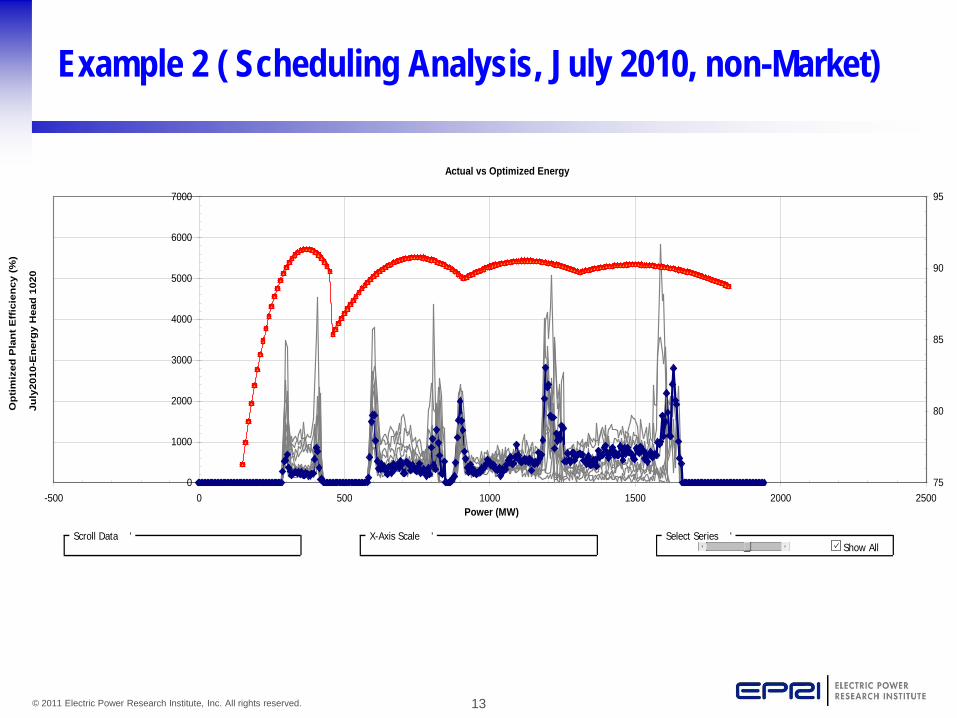
Example 2 ( Scheduling Analysis, July 2010, non-Market)
Actual vs Optimized Energy
0
1000
2000
3000
4000
5000
6000
7000
-500 0 500 1000 1500 2000 2500Power (MW)
July
2010
-En
erg
y H
ead
102
0
75
80
85
90
95
Op
tim
ized
Pla
nt
Eff
icie
ncy
(%
)
Scroll Data 'Show All
Select Series 'X-Axis Scale '
14 © 2011 Electric Power Research Institute, Inc. All rights reserved.
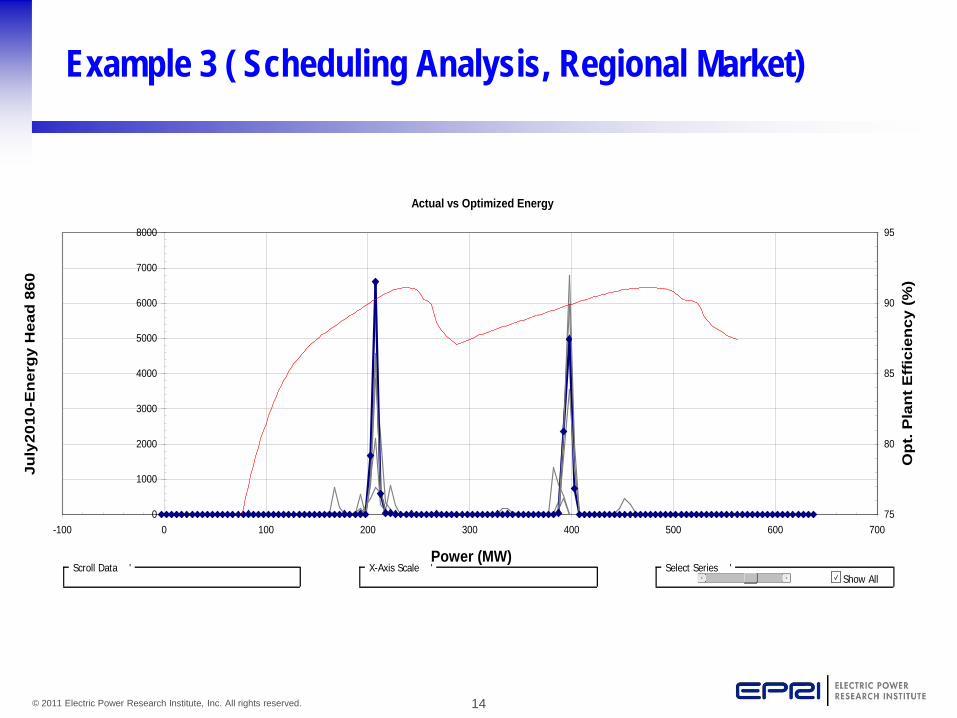
Example 3 ( Scheduling Analysis, Regional Market)
Actual vs Optimized Energy
0
1000
2000
3000
4000
5000
6000
7000
8000
-100 0 100 200 300 400 500 600 700
Power (MW)
July
2010
-Ene
rgy
Hea
d 86
0
75
80
85
90
95
Opt
. Pla
nt E
ffic
ienc
y (%
)
Scroll Data 'Show All
Select Series 'X-Axis Scale '
15 © 2011 Electric Power Research Institute, Inc. All rights reserved.
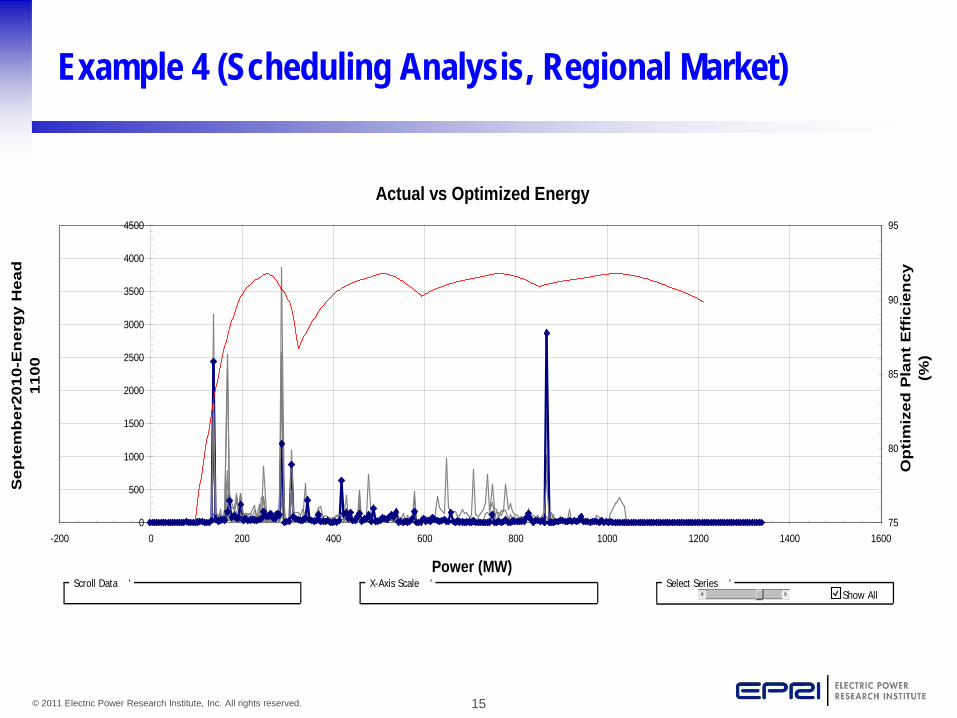
Example 4 (Scheduling Analysis, Regional Market)
Actual vs Optimized Energy
0
500
1000
1500
2000
2500
3000
3500
4000
4500
-200 0 200 400 600 800 1000 1200 1400 1600
Power (MW)
Sep
tem
ber
2010
-En
erg
y H
ead
11
00
75
80
85
90
95
Op
tim
ized
Pla
nt
Eff
icie
ncy
(%
)
Scroll Data 'Show All
Select Series 'X-Axis Scale '
16 © 2011 Electric Power Research Institute, Inc. All rights reserved.
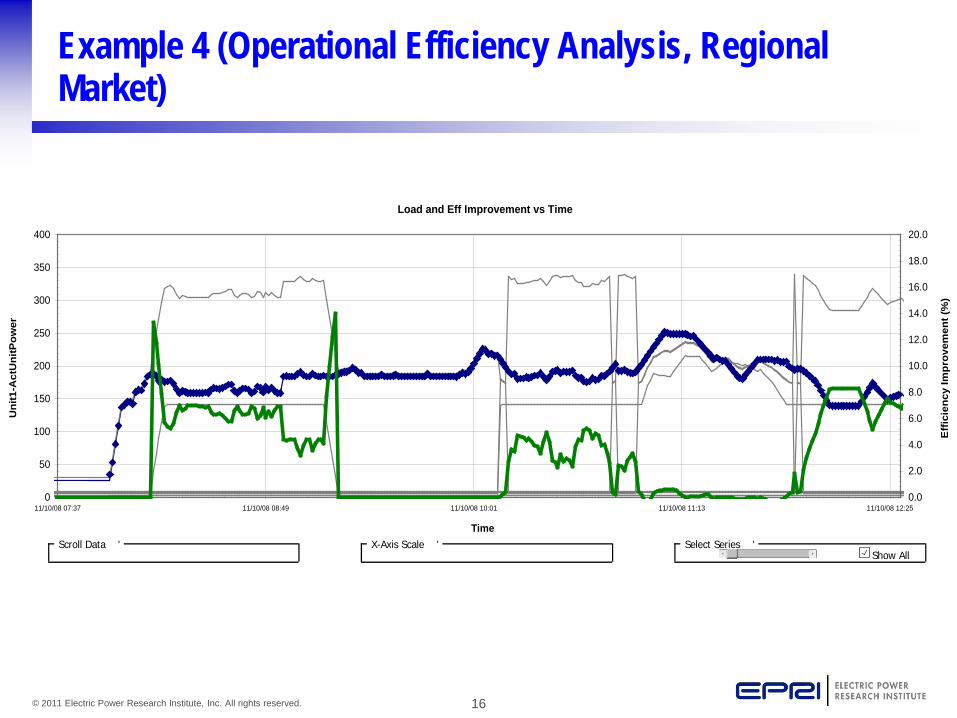
Example 4 (Operational Efficiency Analysis, Regional Market)
Load and Eff Improvement vs Time
0
50
100
150
200
250
300
350
400
11/10/08 07:37 11/10/08 08:49 11/10/08 10:01 11/10/08 11:13 11/10/08 12:25
Time
Uni
t1-A
ctU
nitP
ower
0.0
2.0
4.0
6.0
8.0
10.0
12.0
14.0
16.0
18.0
20.0
Eff
icie
ncy
Impr
ovem
ent (
%)
Scroll Data 'Show All
Select Series 'X-Axis Scale '
17 © 2011 Electric Power Research Institute, Inc. All rights reserved.
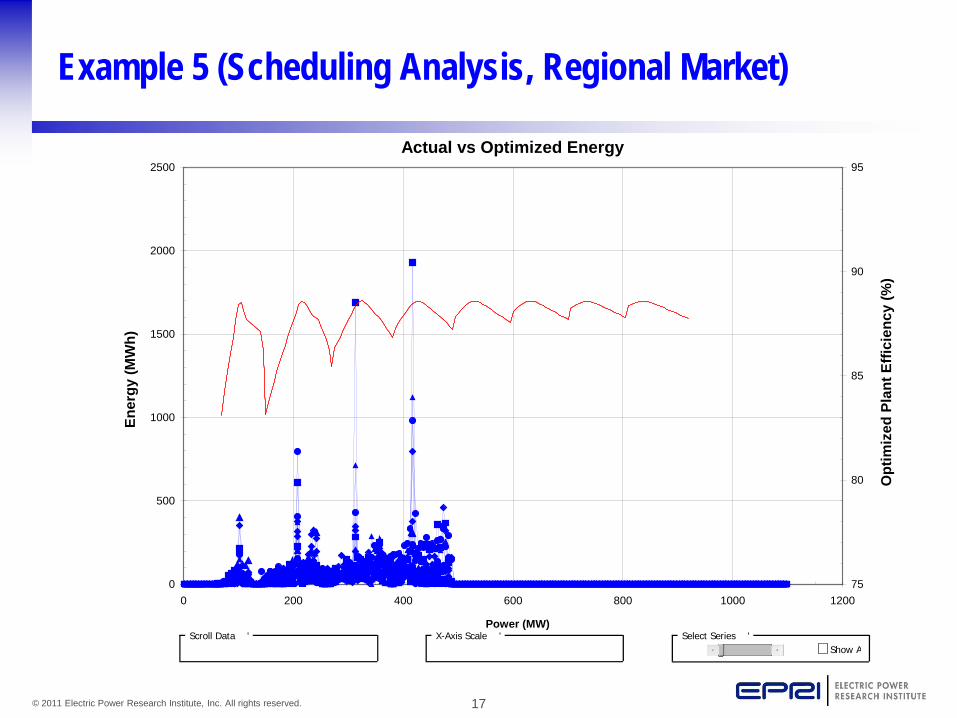
Example 5 (Scheduling Analysis, Regional Market)
Actual vs Optimized Energy
0
500
1000
1500
2000
2500
0 200 400 600 800 1000 1200
Power (MW)
Ener
gy (M
Wh)
75
80
85
90
95
Opt
imiz
ed P
lant
Effi
cien
cy (%
)
Scroll Data 'Show A
Select Series 'X-Axis Scale '
18 © 2011 Electric Power Research Institute, Inc. All rights reserved.
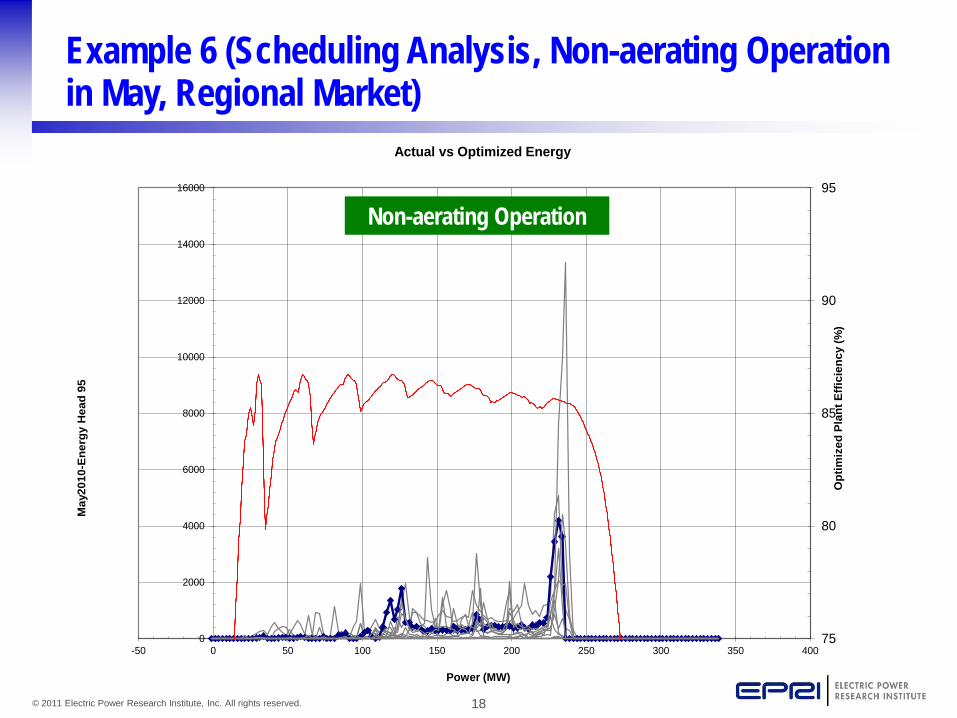
Example 6 (Scheduling Analysis, Non-aerating Operation in May, Regional Market)
75
80
85
90
95
0
2000
4000
6000
8000
10000
12000
14000
16000
-50 0 50 100 150 200 250 300 350 400
Opt
imiz
ed P
lant
Effi
cien
cy (%
)
May
2010
-Ene
rgy
Hea
d 95
Power (MW)
Actual vs Optimized Energy
Non-aerating Operation
19 © 2011 Electric Power Research Institute, Inc. All rights reserved.
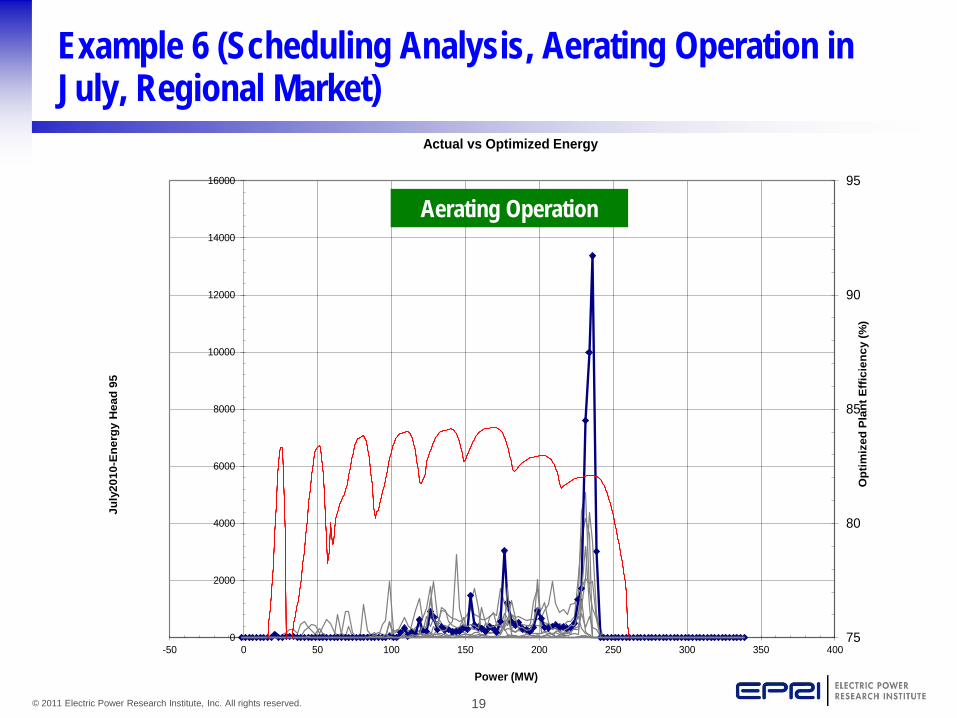
Example 6 (Scheduling Analysis, Aerating Operation in July, Regional Market)
75
80
85
90
95
0
2000
4000
6000
8000
10000
12000
14000
16000
-50 0 50 100 150 200 250 300 350 400
Opt
imiz
ed P
lant
Eff
icie
ncy
(%)
July
2010
-Ene
rgy
Hea
d 95
Power (MW)
Actual vs Optimized Energy
Aerating Operation
20 © 2011 Electric Power Research Institute, Inc. All rights reserved.
Preliminary Results from Case Studies
● Markets (particularly ancillary services markets) can lead to significant energy suboptimization of hydro assets at the unit level and the plant level: ● Profitability increases, but ● Quantitative maintenance cost increases are unknown.
● Environmental operations can lead to significant energy suboptimization of hydro assets at the unit and plant levels. ● “Smarter” markets could better address energy limited
resources, including pumped-storage. ● Opportunities for low-cost production improvement typically
exist in both market and non-market environments.

Manitoba Hydro Reservoir Storage EPRI/MISO Pumped Storage Workshop St Paul, MN Oct 3, 2011
Kevin Gawne & Dan Prowse Manitoba Hydro, Coordinating Sector 1
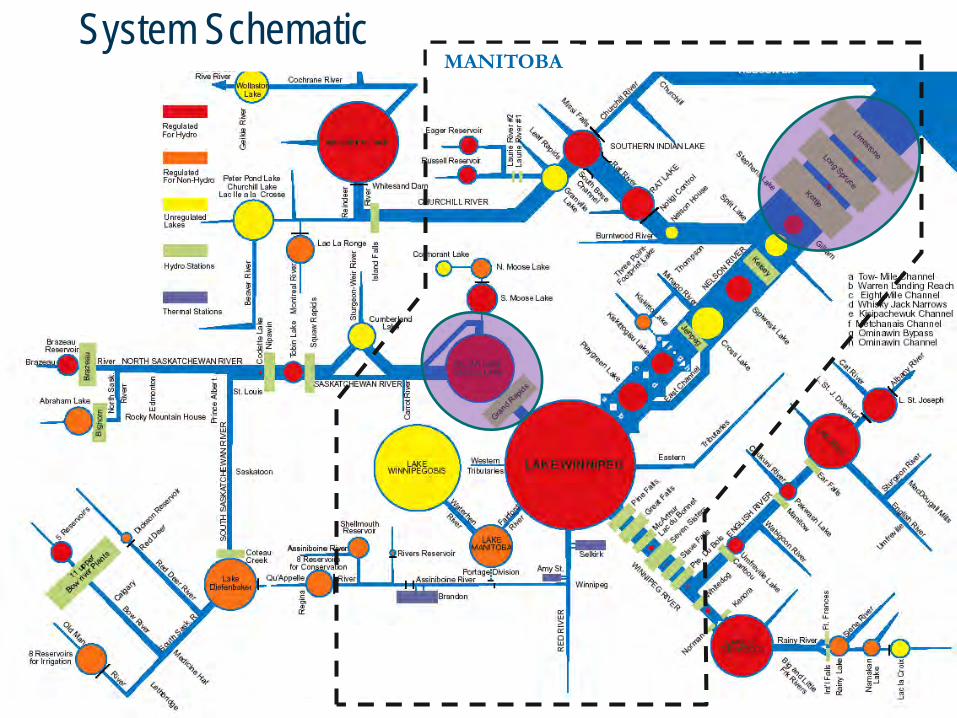
MANITOBA System Schematic
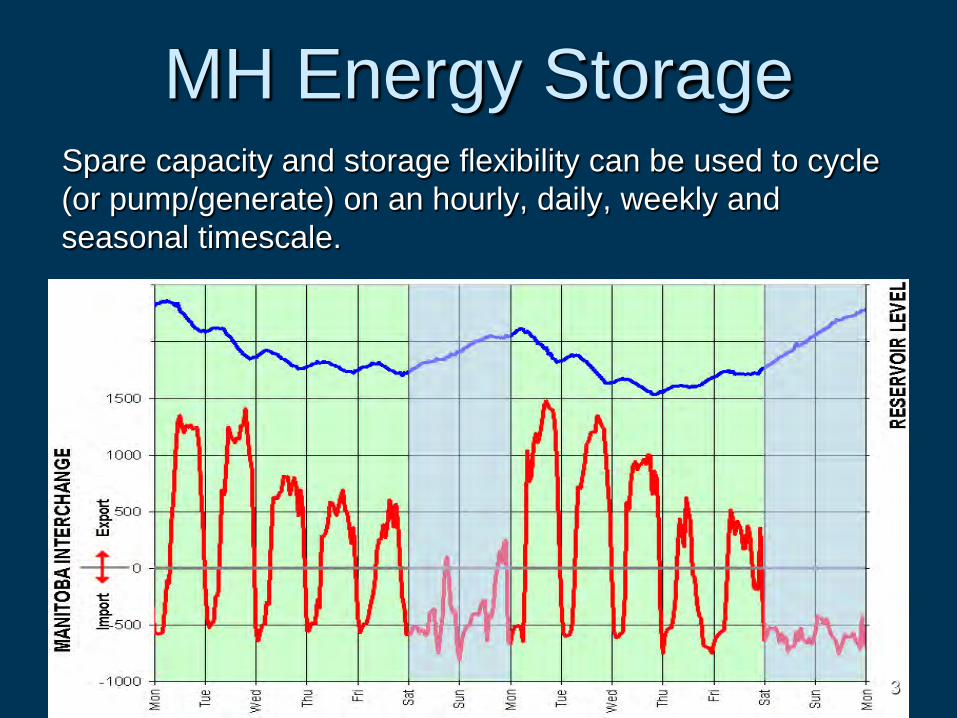
MH Energy Storage
3
Spare capacity and storage flexibility can be used to cycle (or pump/generate) on an hourly, daily, weekly and seasonal timescale.
4
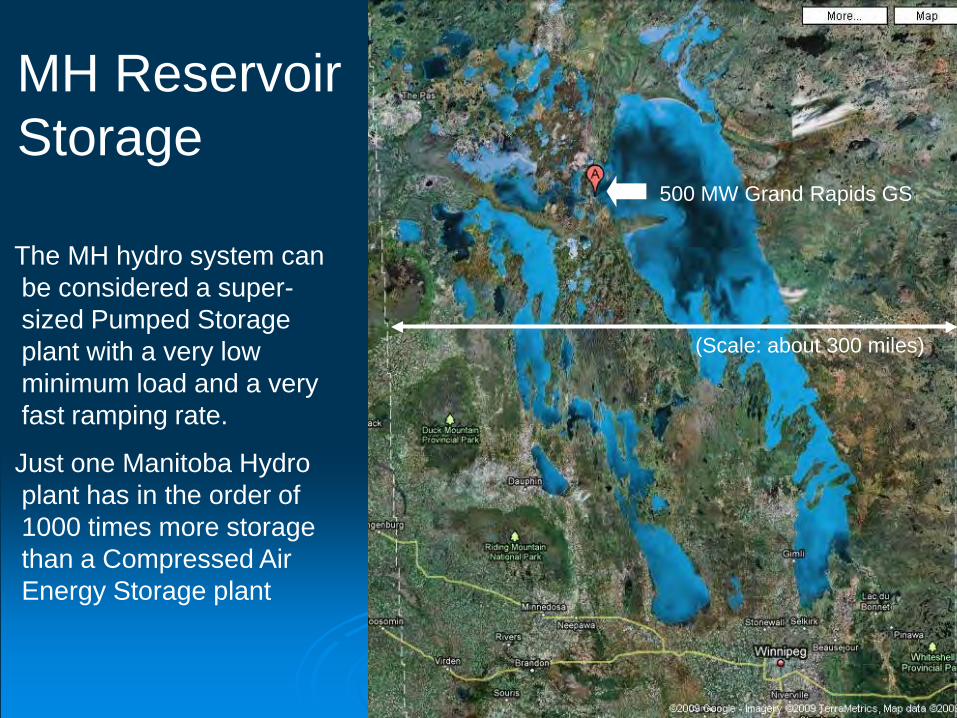
The MH hydro system can be considered a super-sized Pumped Storage plant with a very low minimum load and a very fast ramping rate.
Just one Manitoba Hydro plant has in the order of 1000 times more storage than a Compressed Air Energy Storage plant
MH Reservoir Storage
500 MW Grand Rapids GS
(Scale: about 300 miles)
5
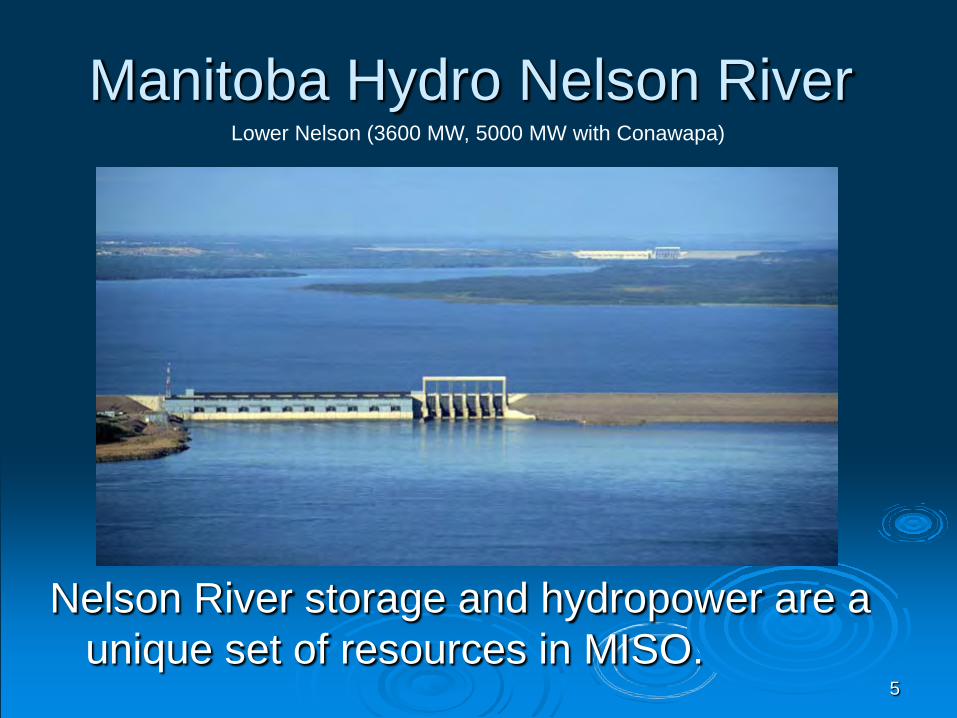
Manitoba Hydro Nelson River
Nelson River storage and hydropower are a unique set of resources in MISO.
Lower Nelson (3600 MW, 5000 MW with Conawapa)
6
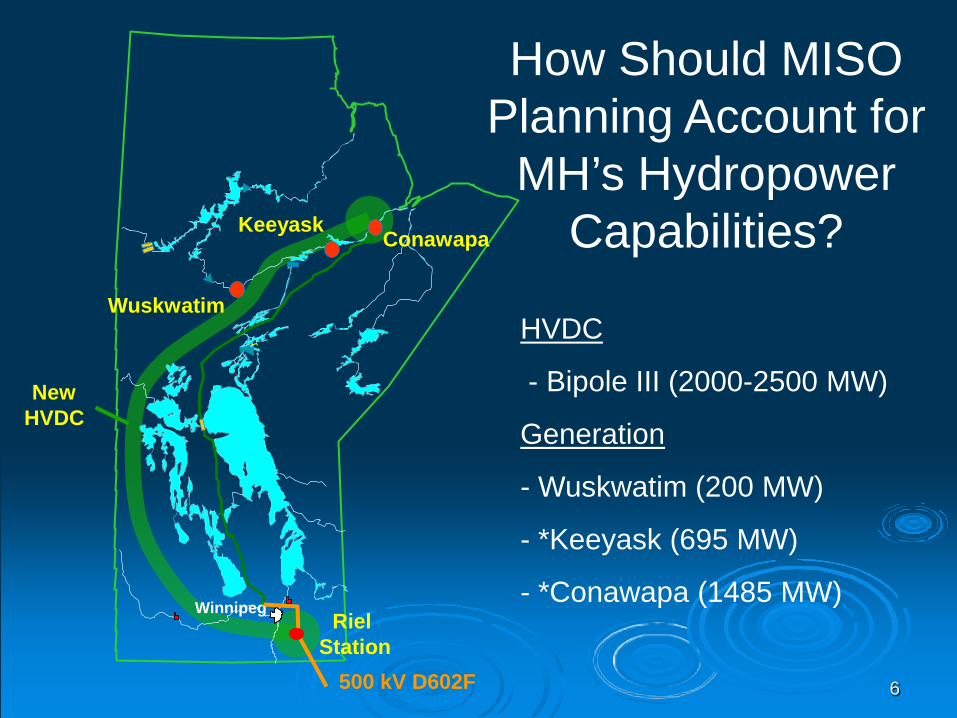
HVDC
- Bipole III (2000-2500 MW)
Generation
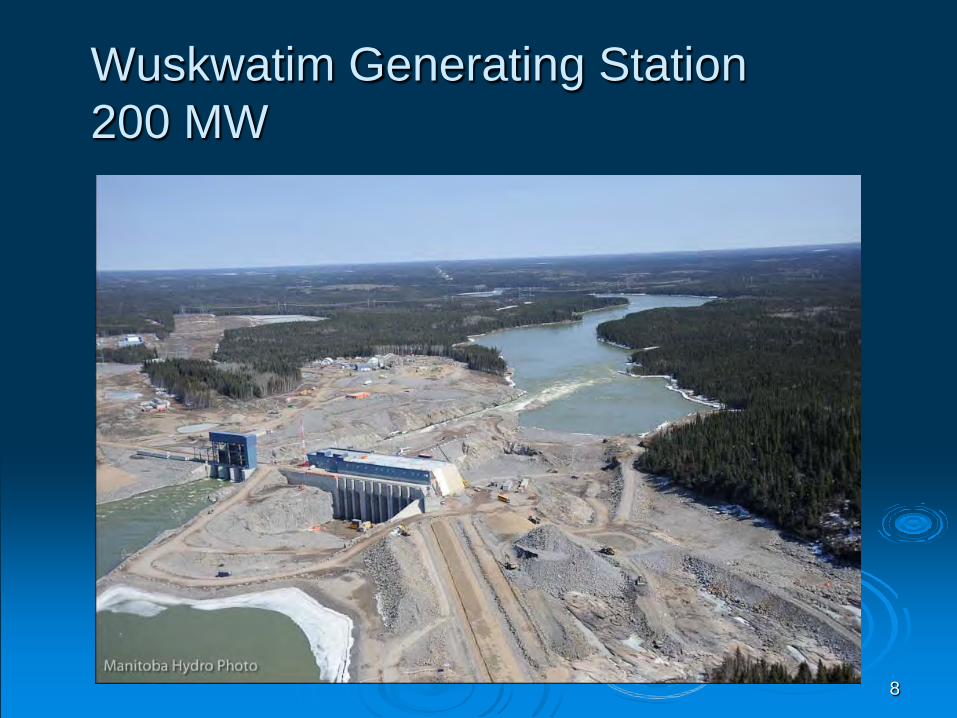
- Wuskwatim (200 MW)
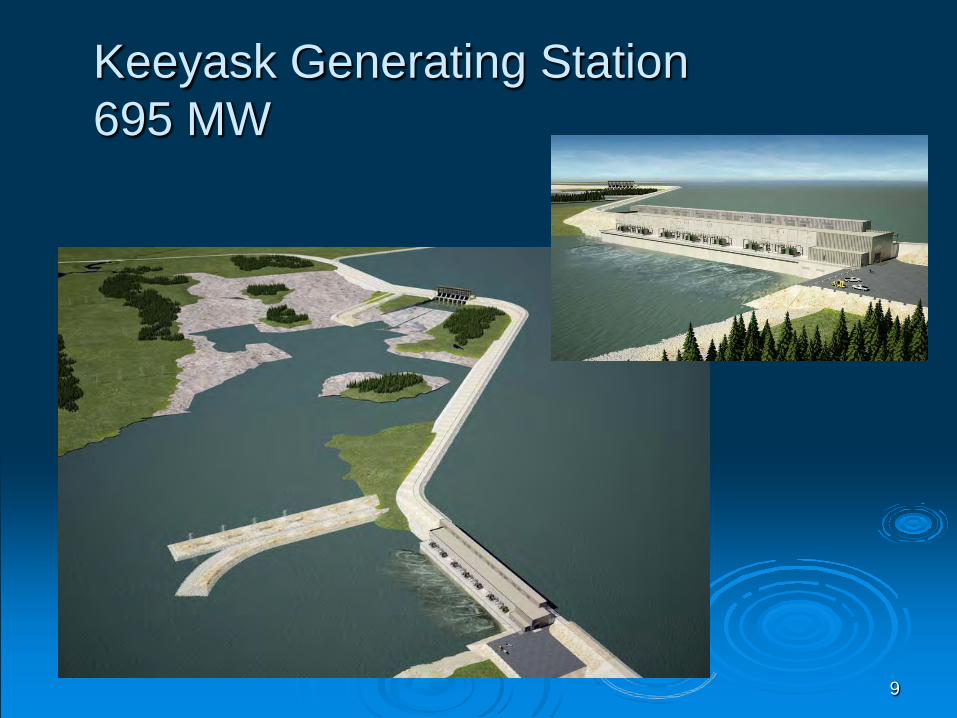
- *Keeyask (695 MW)
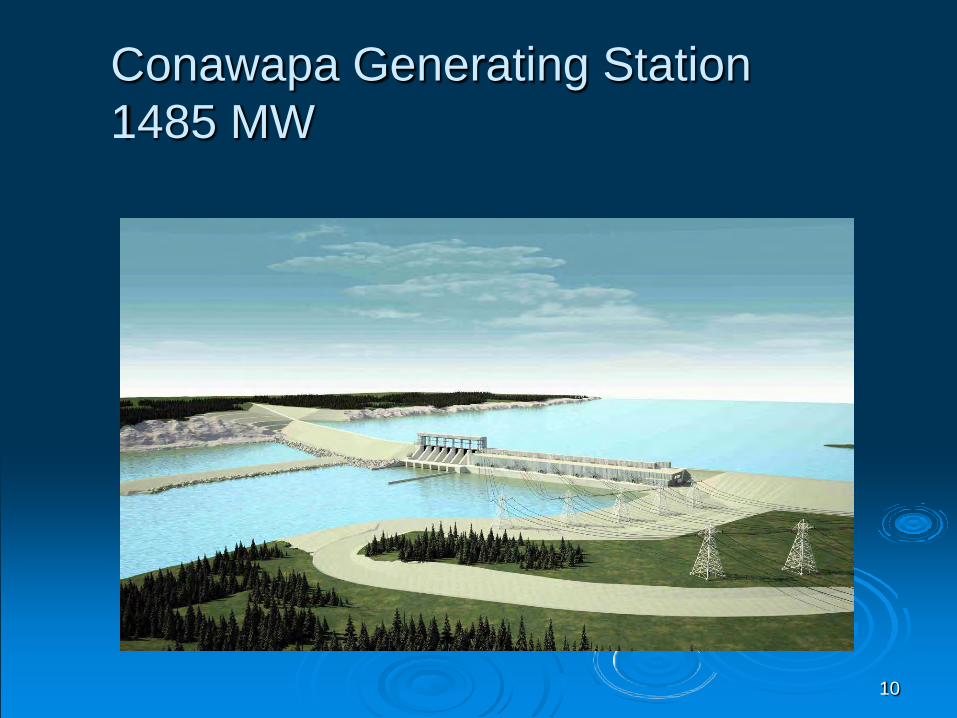
- *Conawapa (1485 MW)
How Should MISO Planning Account for
MH’s Hydropower Capabilities?
Winnipeg
Wuskwatim
Keeyask Conawapa
New HVDC
Riel Station
500 kV D602F
7
WINNIPEG
THOMPSON
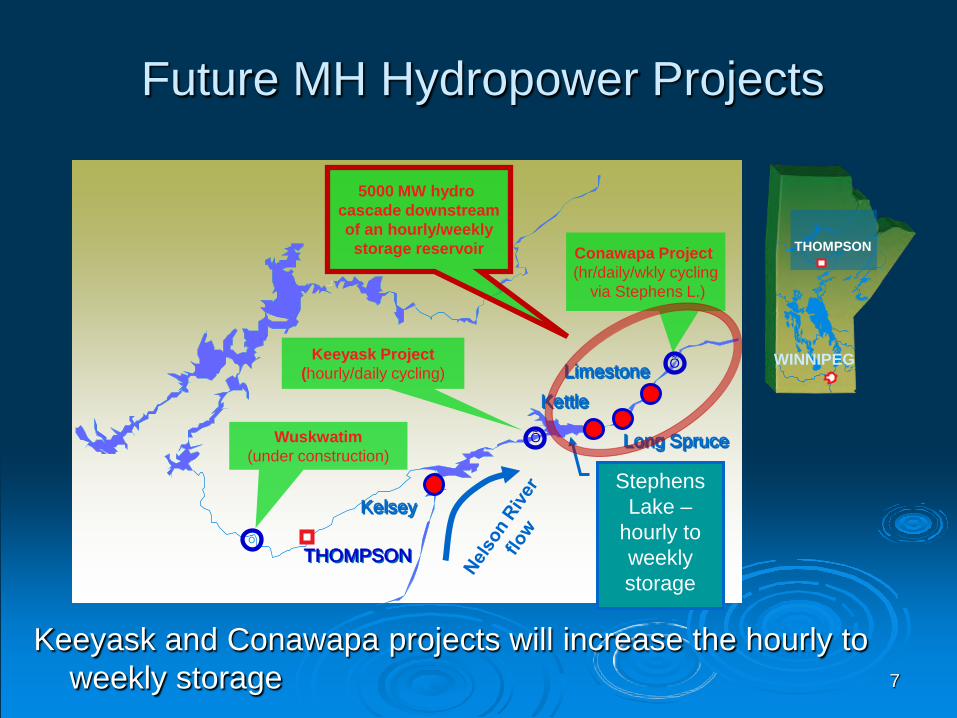
Future MH Hydropower Projects
THOMPSON
Long Spruce
Keeyask Project
(hourly/daily cycling)
Conawapa Project (hr/daily/wkly cycling
via Stephens L.)
Wuskwatim (under construction)
Õ
Õ
Õ
Õ
Õ
Õ
Limestone Kettle
Kelsey Stephens
Lake – hourly to weekly storage
Keeyask and Conawapa projects will increase the hourly to weekly storage
5000 MW hydro cascade downstream of an hourly/weekly storage reservoir
8
Wuskwatim Generating Station 200 MW
9
Keeyask Generating Station 695 MW
10
Conawapa Generating Station 1485 MW
Experience in MISO Markets Mutual benefits, e.g.:
Load diversity Contingency Reserve Sharing External Asynchronous Resource (EAR) is
a useful mechanism for MH to offer benefits of hydropower and storage (ramping, capacity, regulation)
11
12
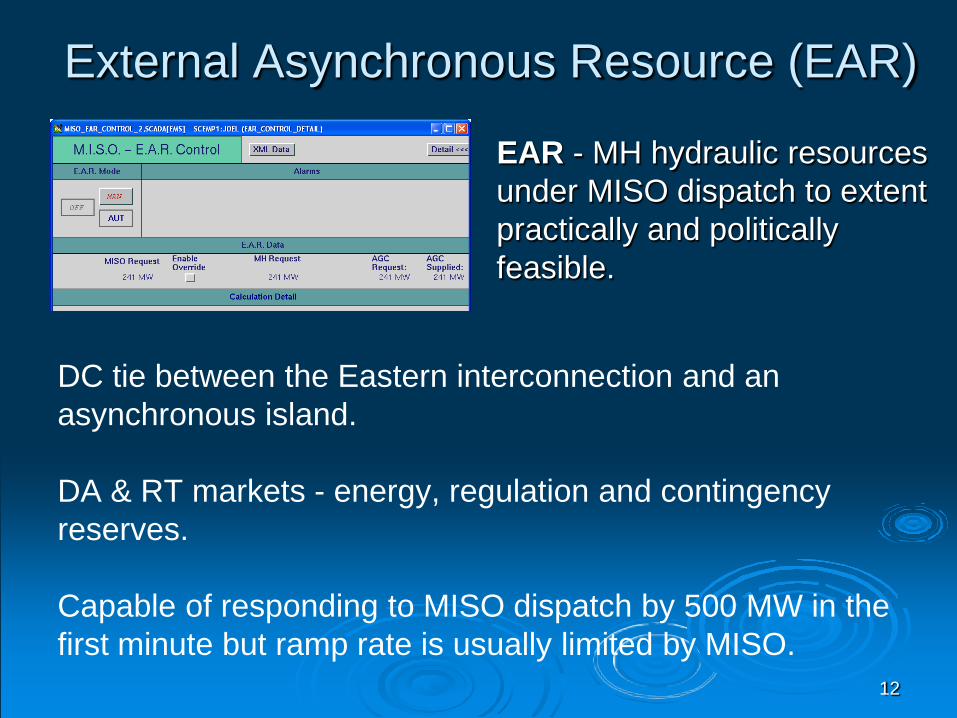
External Asynchronous Resource (EAR)
EAR - MH hydraulic resources under MISO dispatch to extent practically and politically feasible.
DC tie between the Eastern interconnection and an asynchronous island. DA & RT markets - energy, regulation and contingency reserves. Capable of responding to MISO dispatch by 500 MW in the first minute but ramp rate is usually limited by MISO.
Experience in MISO Markets Challenges:
Storage charge/discharge less reliable than desired
Some charges act as a tax on the storage/discharge cycle Marginal loss over-collection Cost allocation for transmission if applied to recharge
cycle of energy storage resources Point-to-point transmission charges for energy
charge/discharge cycles of storage resources treated as externals
13
Experience in MISO Markets Challenges:
Ancillary services payments do not reflect full value of service provided
Transmission development to exploit value of storage is important for hydro reservoir storage
14
MISO Market Changes Enhancements to EAR Reduced risk of curtailment of off-peak MISO exports used
to recharge storage Consideration of whether MISO charges reduce economic
efficiency of storage resources Adopt FERC proposal for a “mileage” charge for
regulating/load following resources with enhanced compensation for rapid, reliable response to MISO dispatch
Transmission planning and cost allocation initiatives so that the grid is developed with a broad perspective of benefits
15

16
Manitoba Hydro Reservoir Storage
Lake Winnipeg at Victoria Beach
Kevin Gawne & Dan Prowse Manitoba Hydro, Coordinating Sector
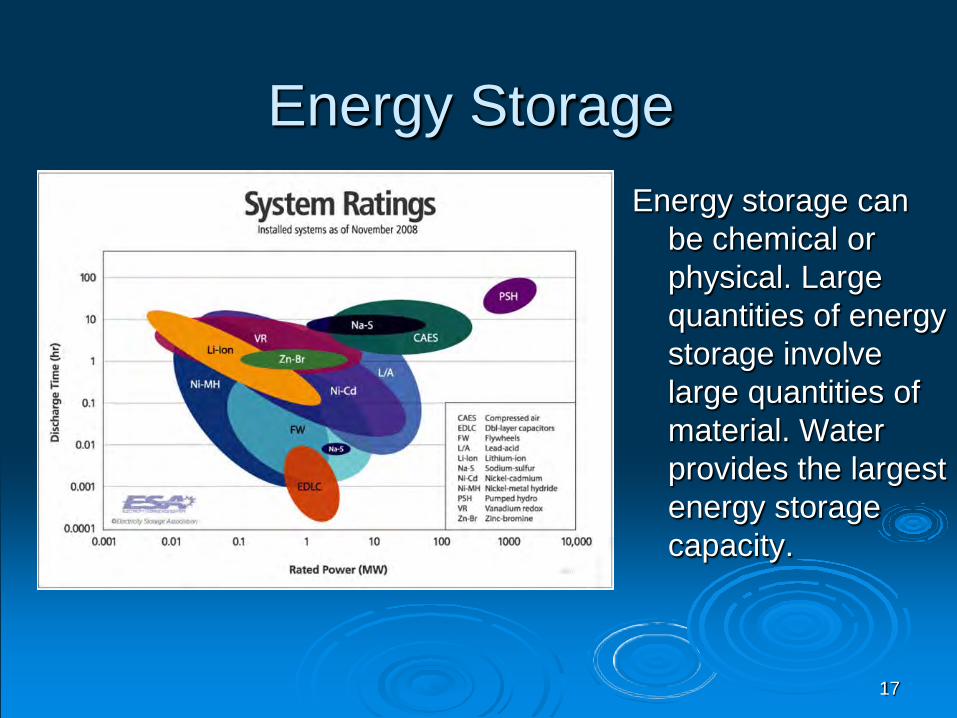
Energy Storage Energy storage can
be chemical or physical. Large quantities of energy storage involve large quantities of material. Water provides the largest energy storage capacity.
17
Experience in MISO Markets Concerns:
Storage charge/discharge less reliable than desired
The Ideal: “On June 13, 2011 Former US ambassador to Canada, David Wilkins said ”I believe we need to do everything we can as a country to promote and facilitate the movement of Canadian energy to the U.S., whether it be a pipeline or hydroelectricity or whatever the form of the energy is.”
18
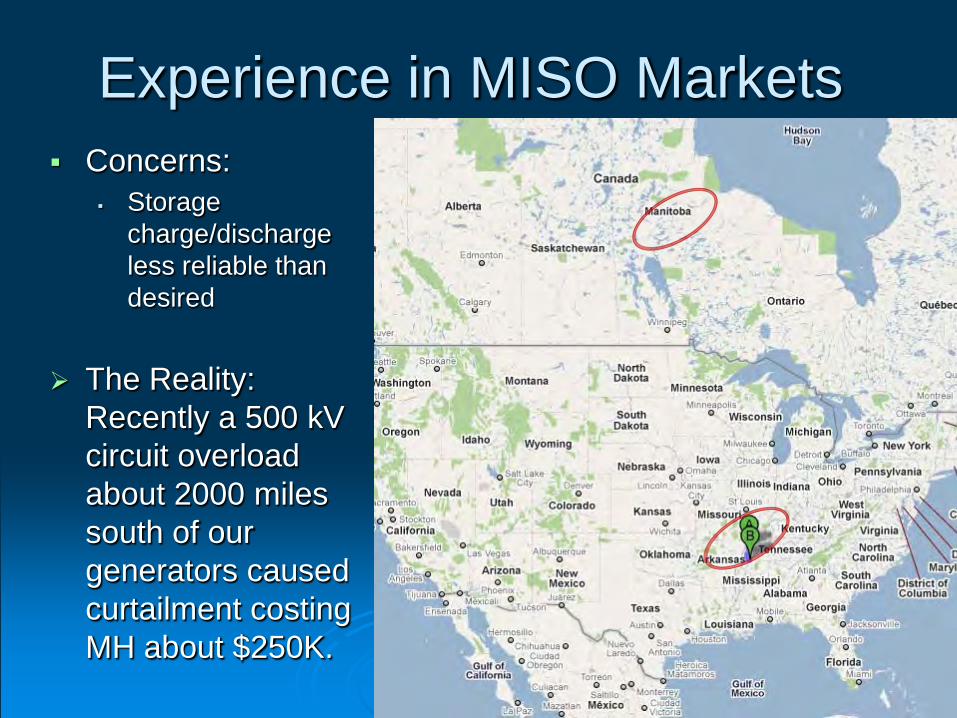
Experience in MISO Markets Concerns:
Storage charge/discharge less reliable than desired
The Reality: Recently a 500 kV circuit overload about 2000 miles south of our generators caused curtailment costing MH about $250K.
19
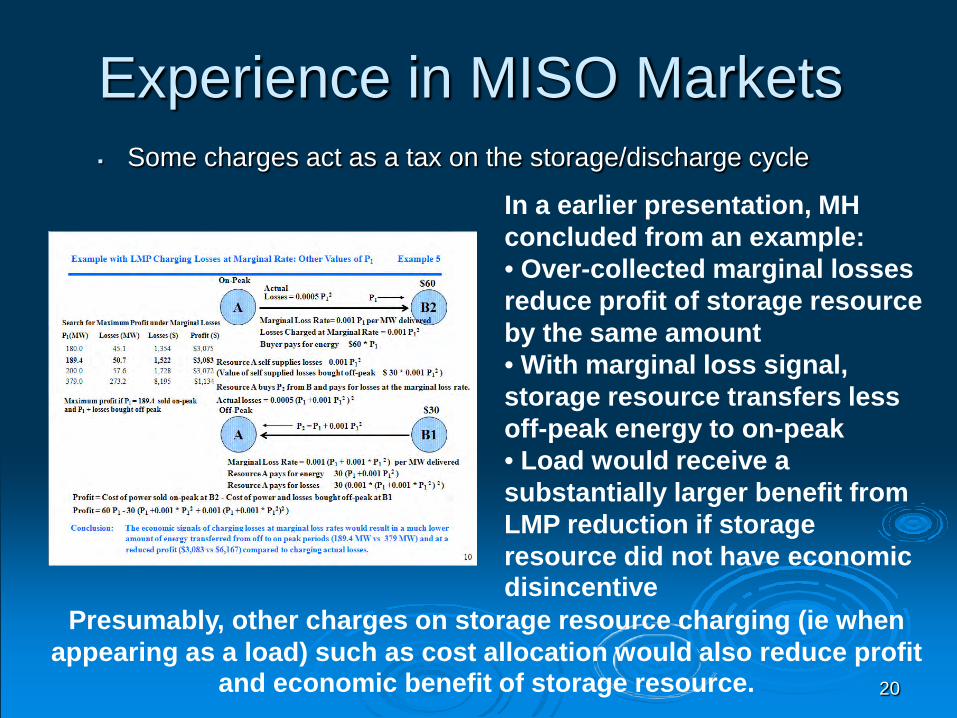
Experience in MISO Markets Some charges act as a tax on the storage/discharge cycle
20
In a earlier presentation, MH concluded from an example: • Over-collected marginal losses reduce profit of storage resource by the same amount • With marginal loss signal, storage resource transfers less off-peak energy to on-peak • Load would receive a substantially larger benefit from LMP reduction if storage resource did not have economic disincentive
Presumably, other charges on storage resource charging (ie when appearing as a load) such as cost allocation would also reduce profit
and economic benefit of storage resource.
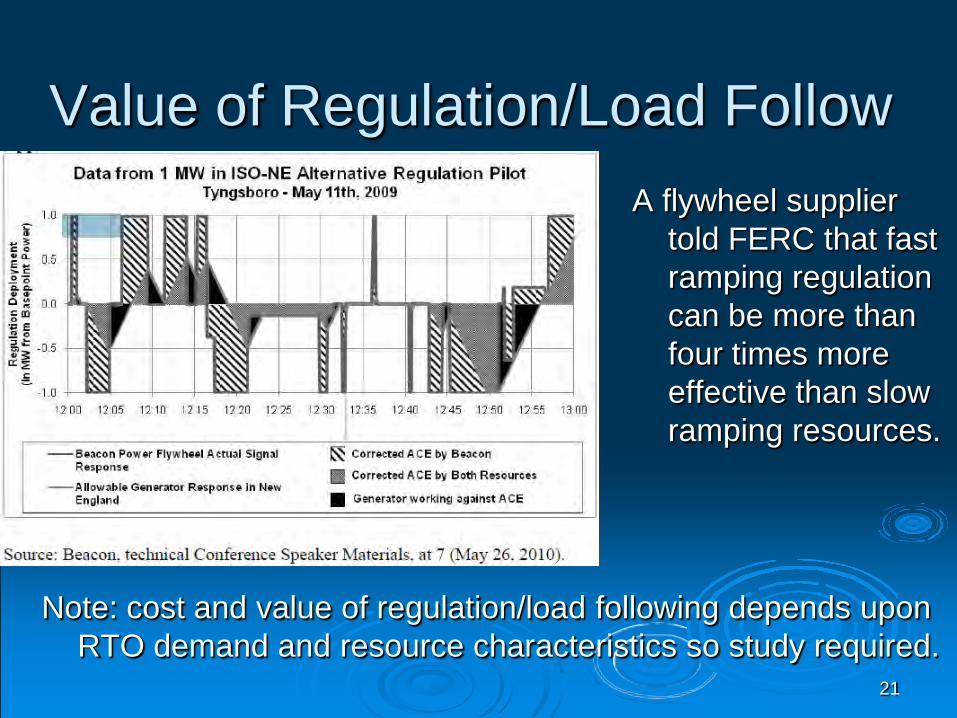
Value of Regulation/Load Follow A flywheel supplier
told FERC that fast ramping regulation can be more than four times more effective than slow ramping resources.
Note: cost and value of regulation/load following depends upon RTO demand and resource characteristics so study required.
21
22
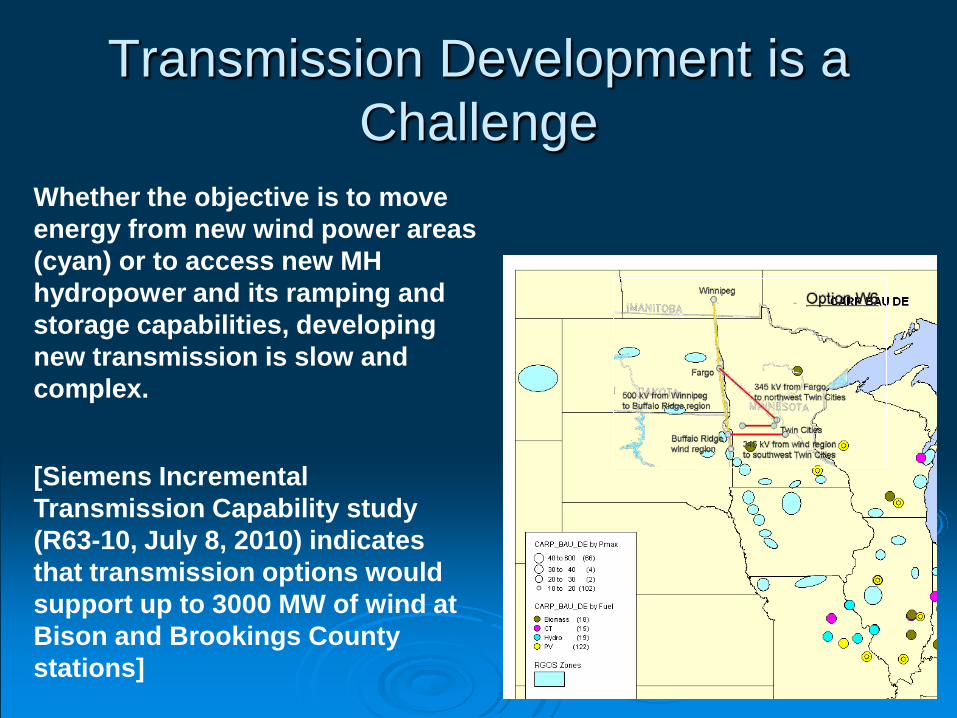
Transmission Development is a Challenge
Whether the objective is to move energy from new wind power areas (cyan) or to access new MH hydropower and its ramping and storage capabilities, developing new transmission is slow and complex.
[Siemens Incremental Transmission Capability study (R63-10, July 8, 2010) indicates that transmission options would support up to 3000 MW of wind at Bison and Brookings County stations]
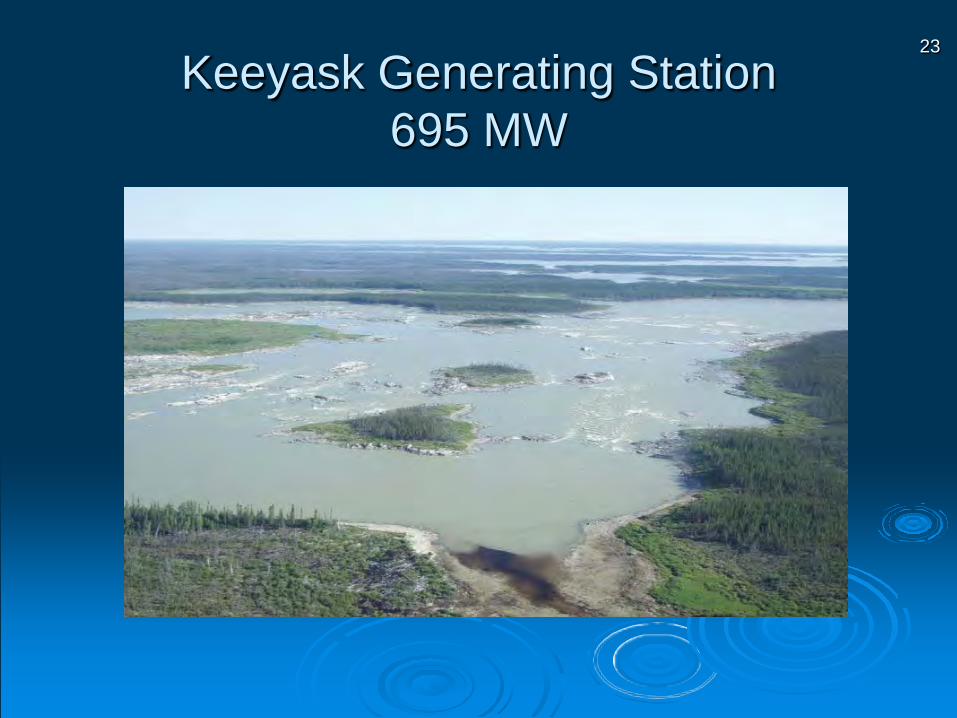
23
Keeyask Generating Station 695 MW
1
Enabling Renewables with Energy Storage
MISO Energy Storage Workshop
June 29, 2011
Frank Novachek
2
Energy Storage at Xcel Energy
►Storage is a means to provide more system control, supporting: ► Generation – Shaping wind output to minimize impact of
renewables variability; potentially reduce peaking cost; reduce wear and tear on conventional generators
► Transmission – Ancillary services ► Distribution – Voltage regulation and peak shaving ► Individual customers – Power quality & peak shaving
►Strategic to Xcel Energy because of the high wind and solar PV penetrations expected on our operating systems
3
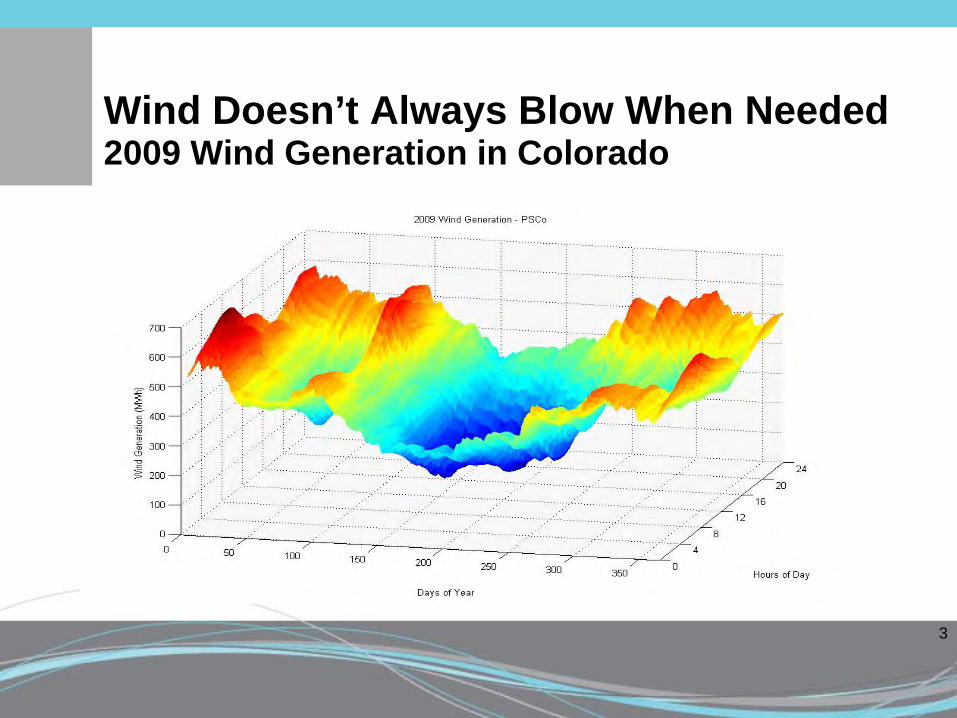
Wind Doesn’t Always Blow When Needed 2009 Wind Generation in Colorado
4
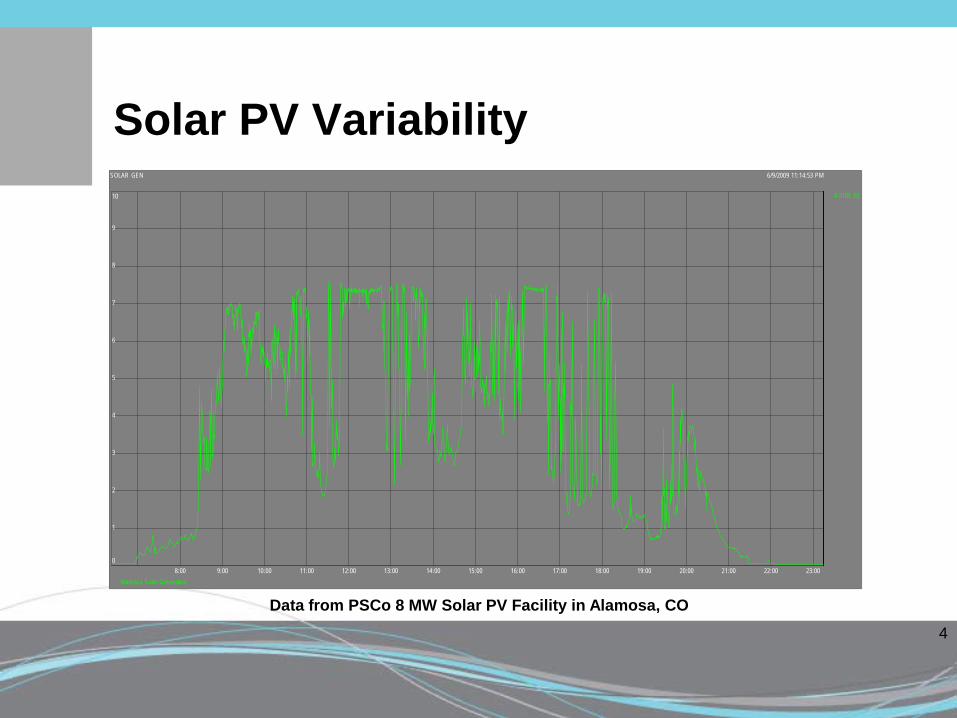
Solar PV Variability
Alamosa Solar Generation
SOLAR GEN 6/9/2009 11:14:53 PM
8:00 9:00 10:00 11:00 12:00 13:00 14:00 15:00 16:00 17:00 18:00 19:00 20:00 21:00 22:00 23:00
1
2
3
4
5
6
7
8
9
0
10 4.318E-02
Data from PSCo 8 MW Solar PV Facility in Alamosa, CO
5
Transmission Level Storage Technologies
►Wind integration – variability management
►Transmission constraint relief
►Ancillary services (e.g., frequency regulation)
►Renewables curtailment avoidance
6
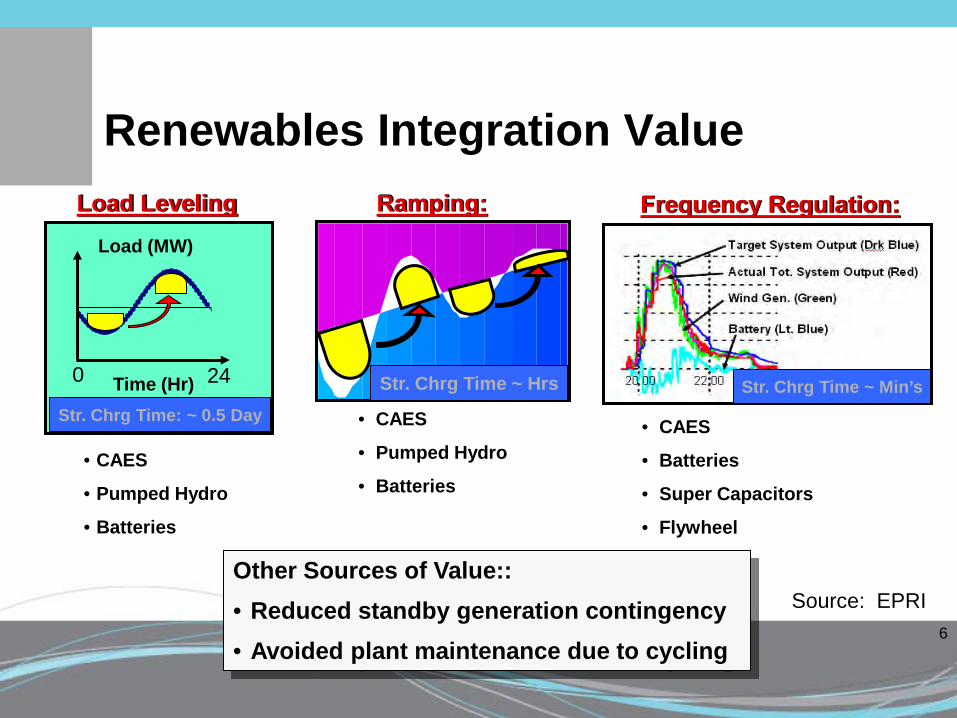
Renewables Integration Value Frequency Regulation: Ramping: Load Leveling
Time (Hr)
Load (MW)
0 24
• CAES
• Pumped Hydro
• Batteries
• CAES
• Batteries
• Super Capacitors
• Flywheel
• CAES
• Pumped Hydro
• Batteries
Str. Chrg Time ~ Hrs Str. Chrg Time ~ Min’s Str. Chrg Time: ~ 0.5 Day
Other Sources of Value:: • Reduced standby generation contingency • Avoided plant maintenance due to cycling
Source: EPRI
7
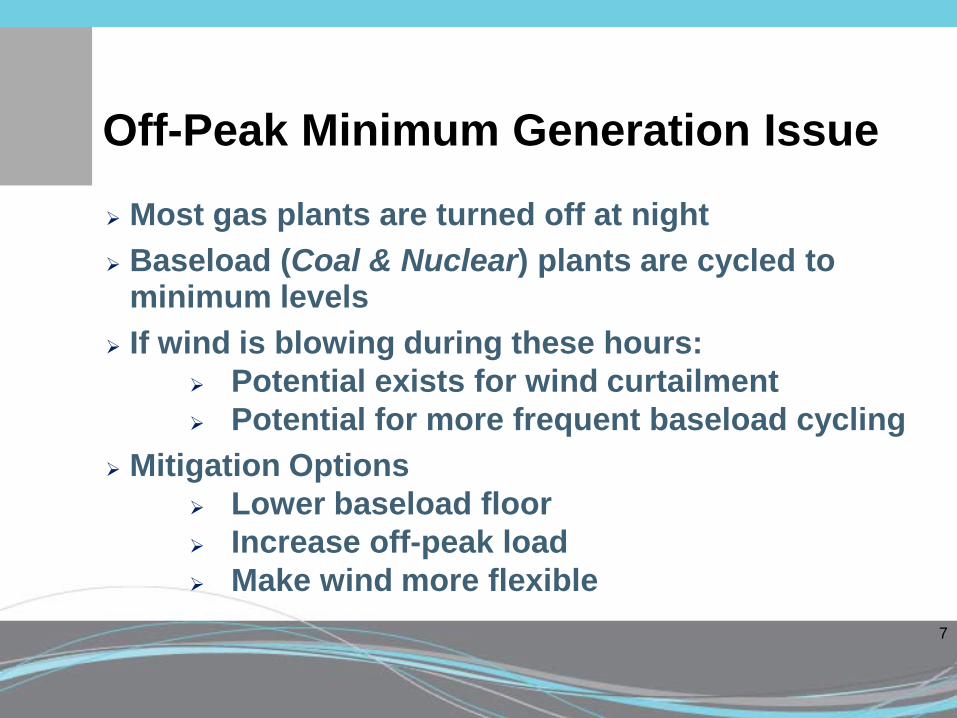
Off-Peak Minimum Generation Issue
Most gas plants are turned off at night Baseload (Coal & Nuclear) plants are cycled to
minimum levels If wind is blowing during these hours:
Potential exists for wind curtailment Potential for more frequent baseload cycling
Mitigation Options Lower baseload floor Increase off-peak load Make wind more flexible
8
Other Utility System Elements of Value
►Economic Dispatch / Arbitrage
►Reduced T&D Losses (in some situations)
►T&D Investment Deferral (in some situations)

9
Luverne Distributed Energy Storage System – Sodium Sulfur Battery ►1 MW NaS Battery System
- can deliver 1 MW for 7.2 hrs
►Power Conditioning Equipment (PCS)
►Wind farm/grid interconnection
►Partnerships ►NGK/S&C ►MinWind LLC ►NREL ►U of Minnesota ►Great Plains Institute
Located in Luverne, MN; connected to Minwind Energy LLC wind facility (11.5 MW)
10
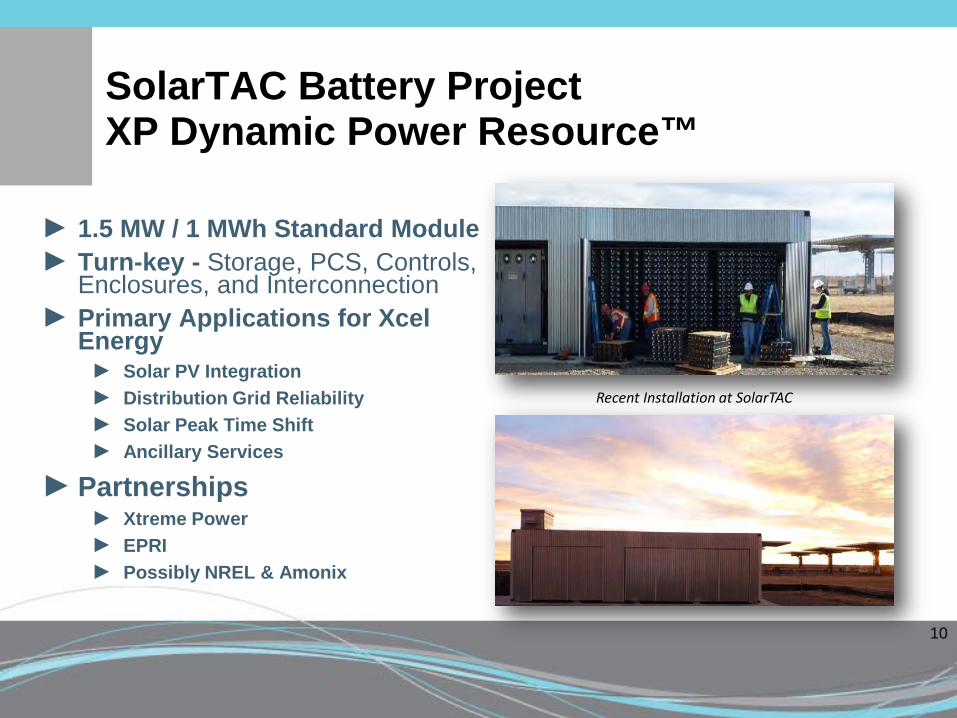
SolarTAC Battery Project XP Dynamic Power Resource™
► 1.5 MW / 1 MWh Standard Module ► Turn-key - Storage, PCS, Controls,
Enclosures, and Interconnection ► Primary Applications for Xcel
Energy ► Solar PV Integration ► Distribution Grid Reliability ► Solar Peak Time Shift ► Ancillary Services
► Partnerships ► Xtreme Power ► EPRI ► Possibly NREL & Amonix
Recent Installation at SolarTAC

11
1 MW “Solar2Battery” Project
SolarTAC Entrance
Site Aerial View (as of April, 2011)
Xcel Energy Testing Plot
A world-class facility where solar technology moves from research lab to test site
12
Other Energy Storage Activities ►Wind-To Hydrogen Project (2006 – Present)
► Two electrolyzers powered by wind and solar energy at NREL to produce and store hydrogen during off-peak hours for use in operating a 50 kW hydrogen internal combustion engine (HICE) generator set during on-peak hours
► System has been expanded to include a hydrogen fueling station (for hydrogen powered vehicles at NREL) and a 5 kW stationary fuel cell to operate in parallel with the HICE generator set.
► Location: Golden, Colorado – NREL’s National Wind Technology Center
► Partners: NREL, DOE, EPC, Proton Energy, Teledyne
►Compressed-Air Energy Storage Study (2009-2010) : Contracted with EPRI to examine the economics and technical issues of siting a CAES plant in Colorado
13
Xcel Energy Interest in MISO Energy Storage Modeling Efforts
►Value of storage from the perspective of the ISO ►Wind Integration ►General System Operations Benefits
►Approaches to modeling at finer granularity ►Techniques ►Limitations ►Pitfalls

14

Ludington Pumped Storage in MISO market
Ludington Pumped Storage Plant - Overview
• Built between 1969 - 1973. • Jointly owned by Consumers Energy and Detroit Edison.
Operated by Consumers Energy. • Sits on a 1,000-acre site along the Lake Michigan
shoreline. • Upper Reservoir sits 950 ft above sea level, with 27 billion
gallon capacity. 2.5 miles long and 1 mile wide • Lower reservoir (fuel source) is Lake Michigan, at 579 ft
above sea level
2
Ludington Pumped Storage Plant - Overview
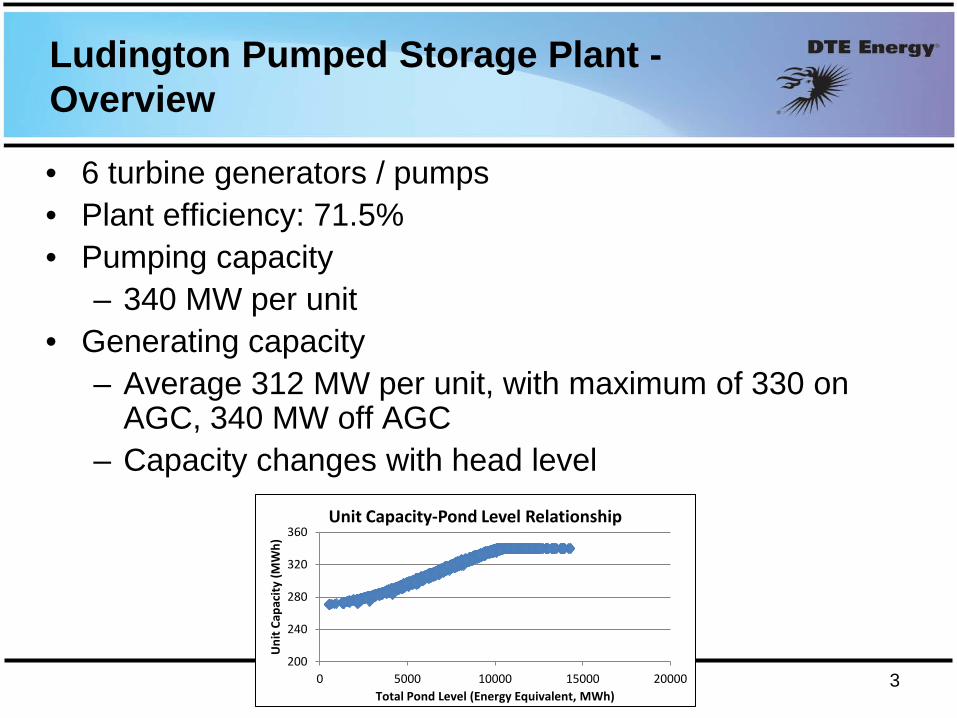
• 6 turbine generators / pumps • Plant efficiency: 71.5% • Pumping capacity
– 340 MW per unit • Generating capacity
– Average 312 MW per unit, with maximum of 330 on AGC, 340 MW off AGC
– Capacity changes with head level
3 200
240
280
320
360
0 5000 10000 15000 20000
Uni
t Cap
acity
(MW
h)
Total Pond Level (Energy Equivalent, MWh)
Unit Capacity-Pond Level Relationship
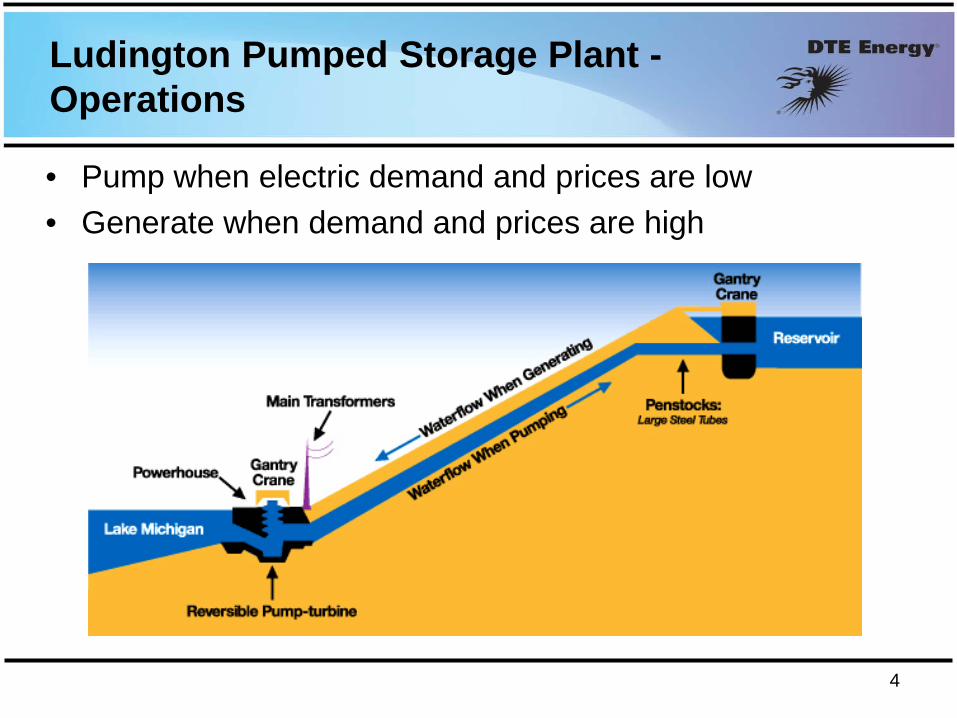
Ludington Pumped Storage Plant - Operations
• Pump when electric demand and prices are low • Generate when demand and prices are high
4
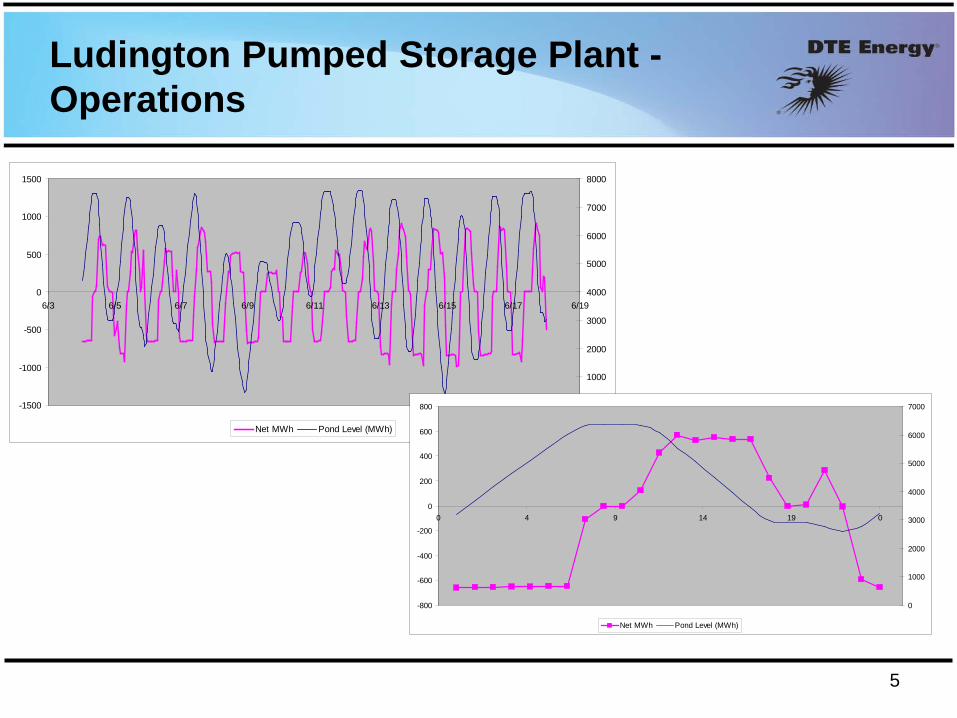
Ludington Pumped Storage Plant - Operations
5
-1500
-1000
-500
0
500
1000
1500
6/3 6/5 6/7 6/9 6/11 6/13 6/15 6/17 6/19
0
1000
2000
3000
4000
5000
6000
7000
8000
Net MWh Pond Level (MWh)
-800
-600
-400
-200
0
200
400
600
800
0 4 9 14 19 0
0
1000
2000
3000
4000
5000
6000
7000
Net MWh Pond Level (MWh)
Ludington Pumped Storage Plant - Operations
6
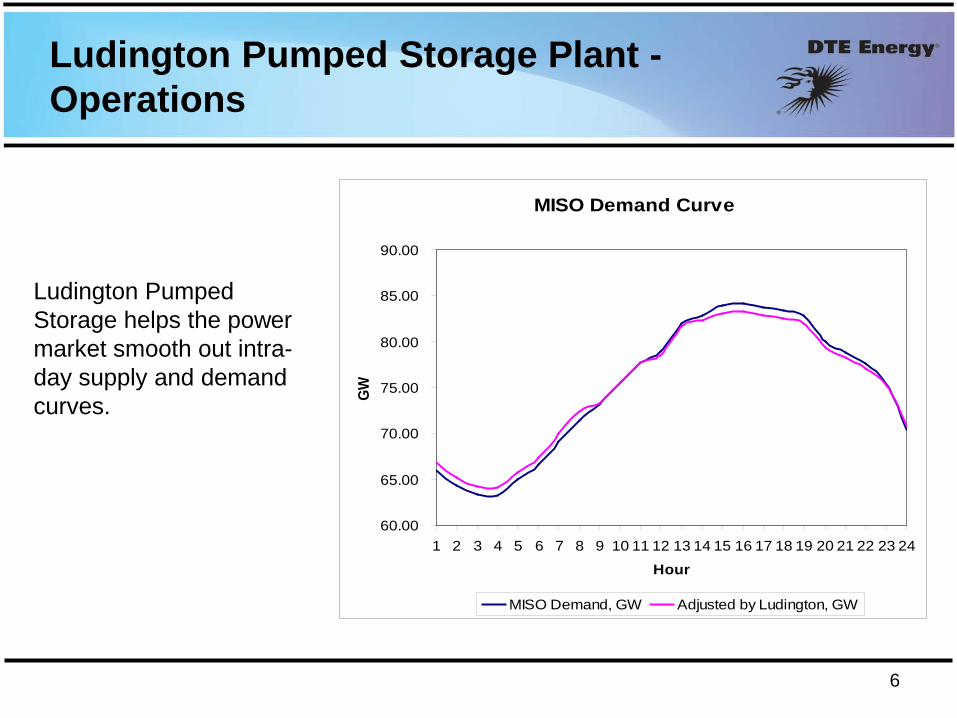
MISO Demand Curve
60.00
65.00
70.00
75.00
80.00
85.00
90.00
1 2 3 4 5 6 7 8 9 10 11 12 13 14 15 16 17 18 19 20 21 22 23 24
Hour
GW
MISO Demand, GW Adjusted by Ludington, GW
Ludington Pumped Storage helps the power market smooth out intra-day supply and demand curves.
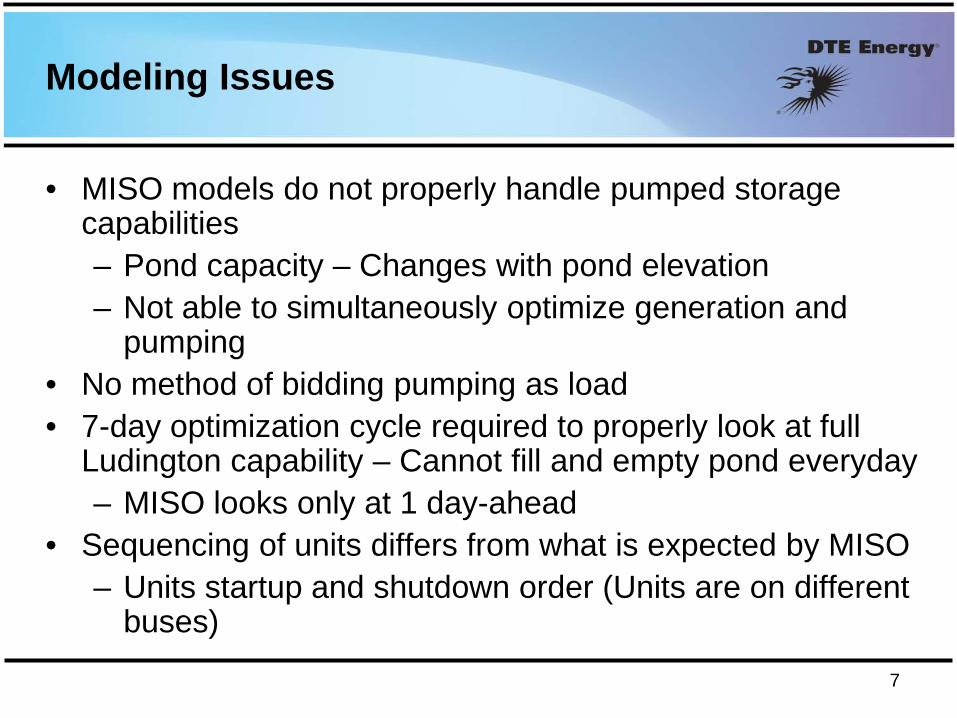
Modeling Issues
• MISO models do not properly handle pumped storage capabilities – Pond capacity – Changes with pond elevation – Not able to simultaneously optimize generation and
pumping • No method of bidding pumping as load • 7-day optimization cycle required to properly look at full
Ludington capability – Cannot fill and empty pond everyday – MISO looks only at 1 day-ahead
• Sequencing of units differs from what is expected by MISO – Units startup and shutdown order (Units are on different
buses)
7
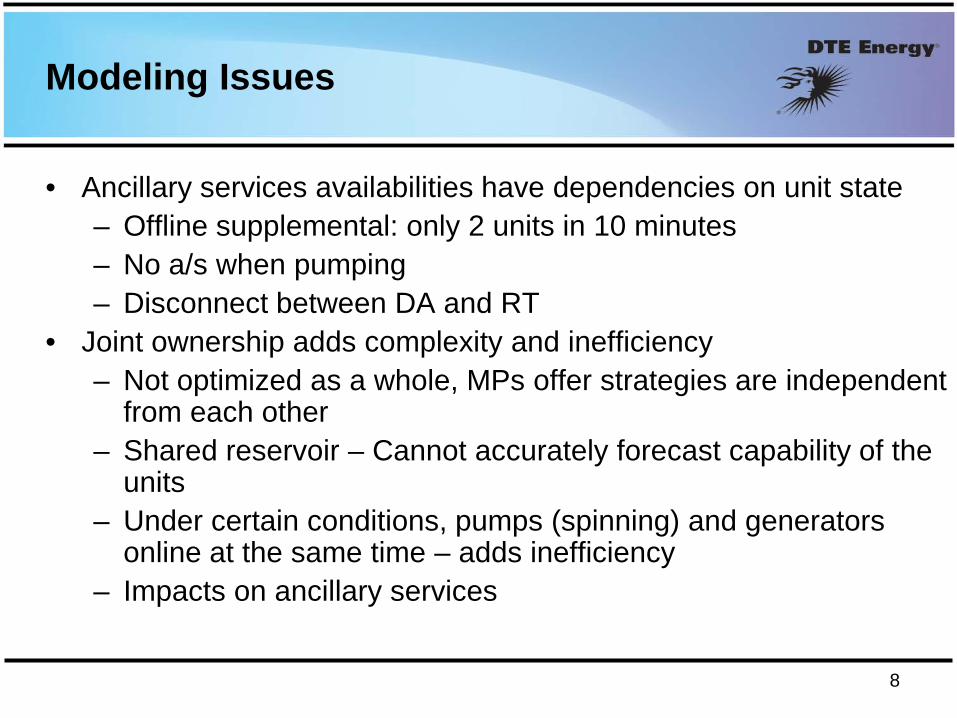
Modeling Issues
• Ancillary services availabilities have dependencies on unit state – Offline supplemental: only 2 units in 10 minutes – No a/s when pumping – Disconnect between DA and RT
• Joint ownership adds complexity and inefficiency – Not optimized as a whole, MPs offer strategies are independent
from each other – Shared reservoir – Cannot accurately forecast capability of the
units – Under certain conditions, pumps (spinning) and generators
online at the same time – adds inefficiency – Impacts on ancillary services
8
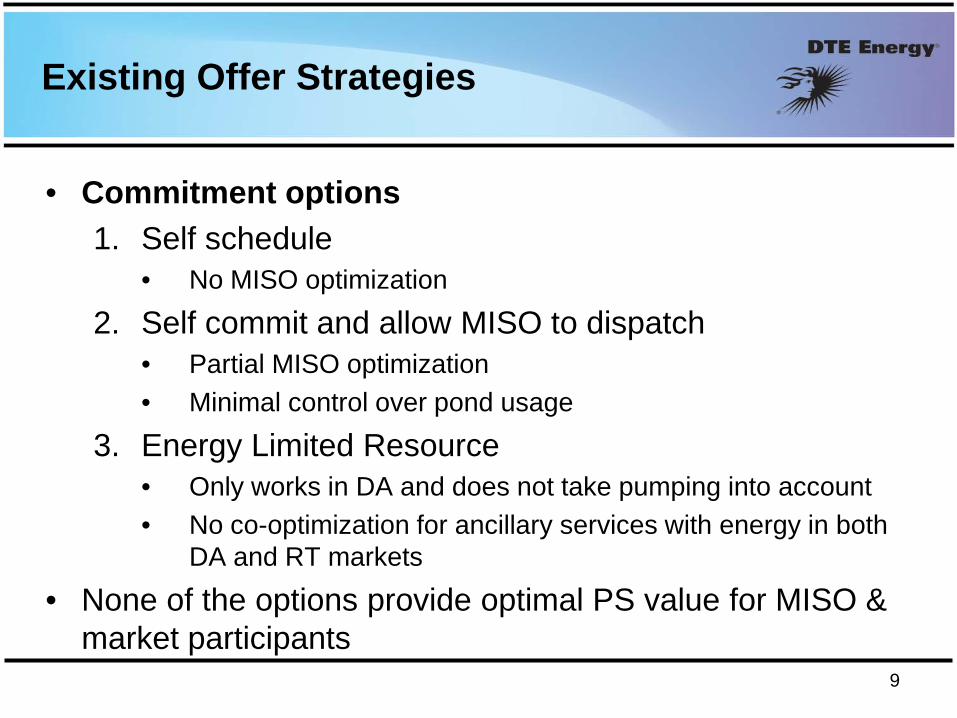
Existing Offer Strategies
• Commitment options 1. Self schedule
• No MISO optimization
2. Self commit and allow MISO to dispatch • Partial MISO optimization • Minimal control over pond usage
3. Energy Limited Resource • Only works in DA and does not take pumping into account • No co-optimization for ancillary services with energy in both
DA and RT markets
• None of the options provide optimal PS value for MISO & market participants
9
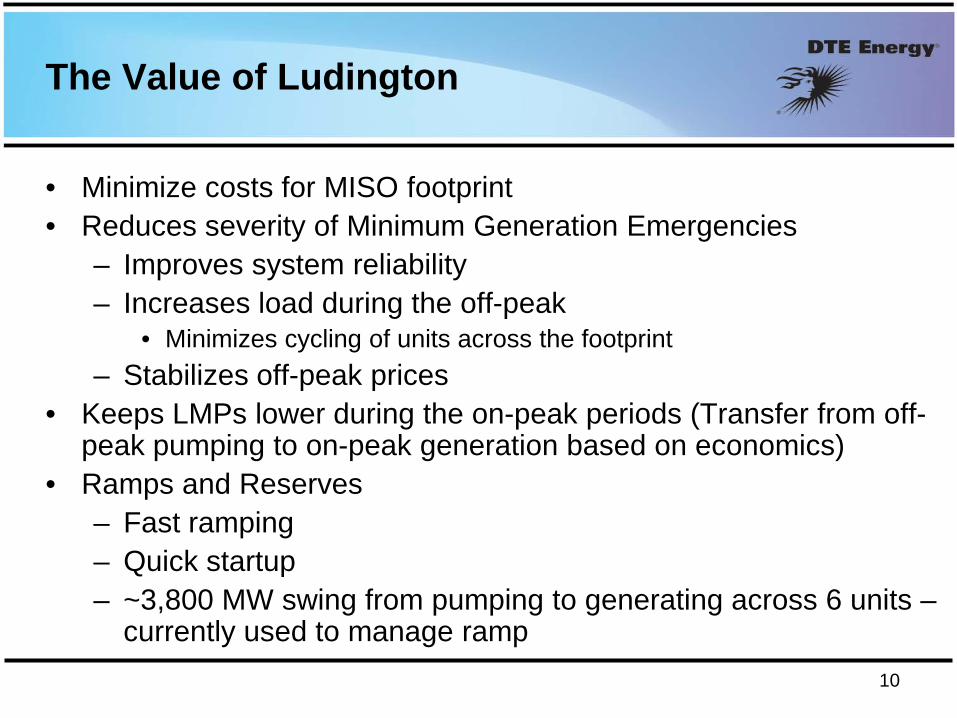
The Value of Ludington
• Minimize costs for MISO footprint • Reduces severity of Minimum Generation Emergencies
– Improves system reliability – Increases load during the off-peak
• Minimizes cycling of units across the footprint – Stabilizes off-peak prices
• Keeps LMPs lower during the on-peak periods (Transfer from off-peak pumping to on-peak generation based on economics)
• Ramps and Reserves – Fast ramping – Quick startup – ~3,800 MW swing from pumping to generating across 6 units –
currently used to manage ramp 10
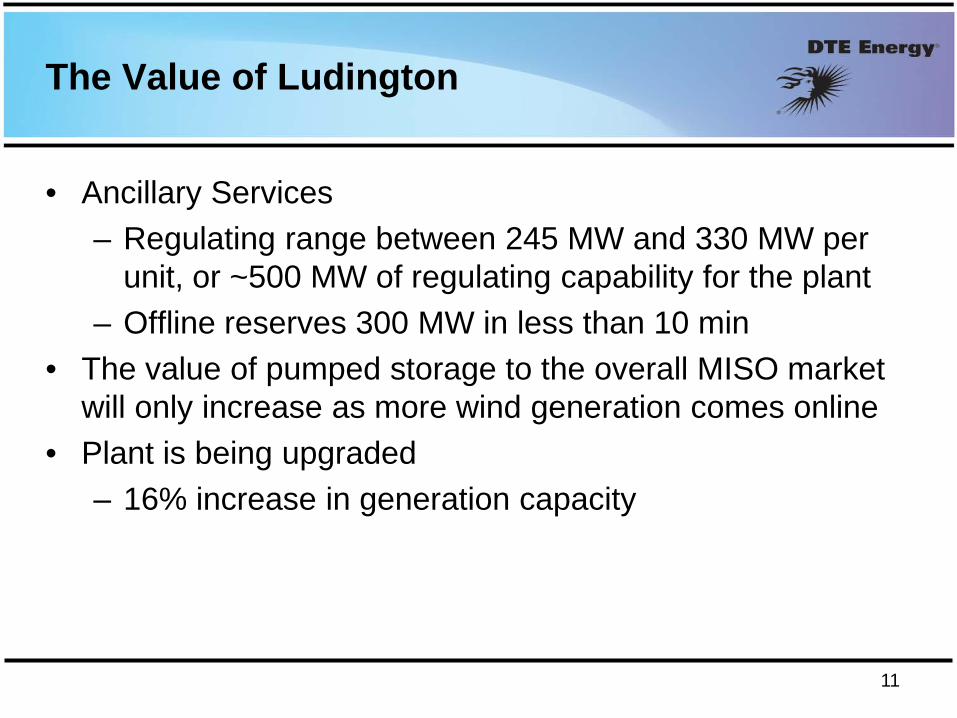
The Value of Ludington
• Ancillary Services – Regulating range between 245 MW and 330 MW per
unit, or ~500 MW of regulating capability for the plant – Offline reserves 300 MW in less than 10 min
• The value of pumped storage to the overall MISO market will only increase as more wind generation comes online
• Plant is being upgraded – 16% increase in generation capacity
11
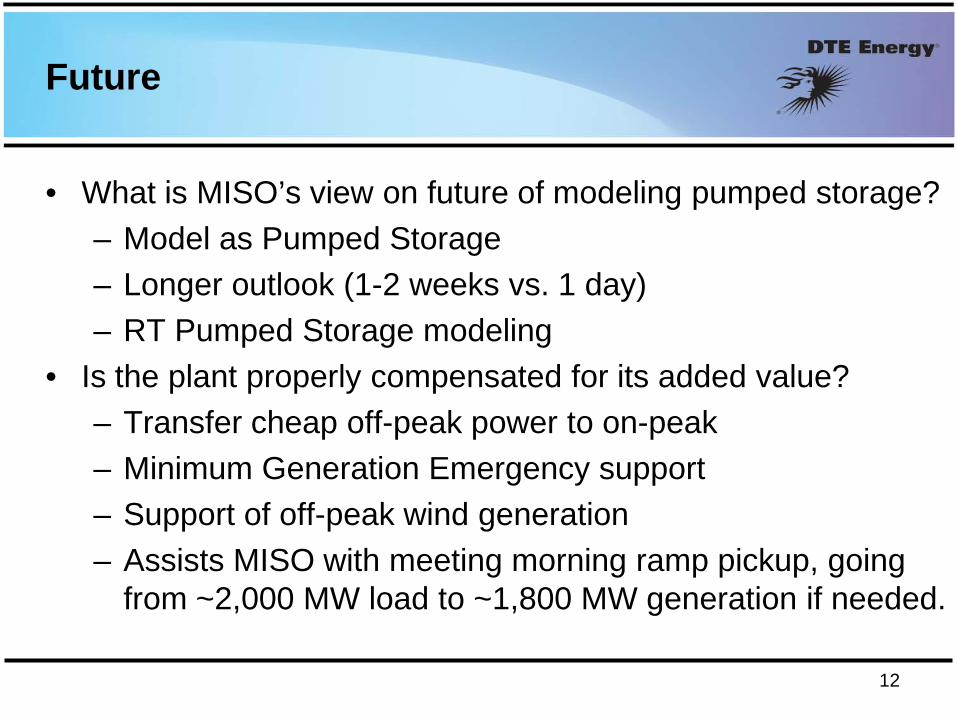
Future
• What is MISO’s view on future of modeling pumped storage? – Model as Pumped Storage – Longer outlook (1-2 weeks vs. 1 day) – RT Pumped Storage modeling
• Is the plant properly compensated for its added value? – Transfer cheap off-peak power to on-peak – Minimum Generation Emergency support – Support of off-peak wind generation – Assists MISO with meeting morning ramp pickup, going
from ~2,000 MW load to ~1,800 MW generation if needed.
12
Questions?
13

Brendan Kirby [email protected] 865-250-0753 www.consultkirby.com
Total profits increased 133% Energy profits reduced -48% Regulation profits added +41% Spinning profits added +89% Non-Spin profits added +50%
CAISO market modeled for all 2010
Very Flexible Plant: 10MW Min Gen, 195MW Reg, 390 MW Spin Total profits increased 281% Energy profits reduced -152% Regulation profits added
+156% Spinning reserve profits added
+258% Non-Spin profits added +20%
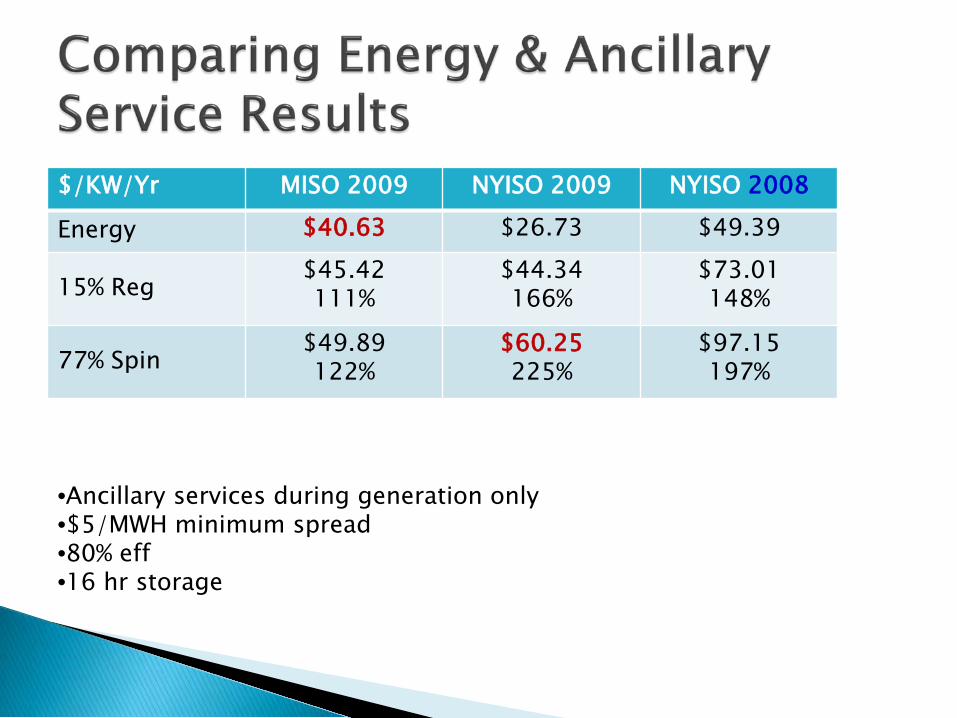
$/KW/Yr MISO 2009 NYISO 2009 NYISO 2008
Energy $40.63 $26.73 $49.39
15% Reg $45.42 111%
$44.34 166%
$73.01 148%
77% Spin $49.89 122%
$60.25 225%
$97.15 197%
•Ancillary services during generation only •$5/MWH minimum spread •80% eff •16 hr storage
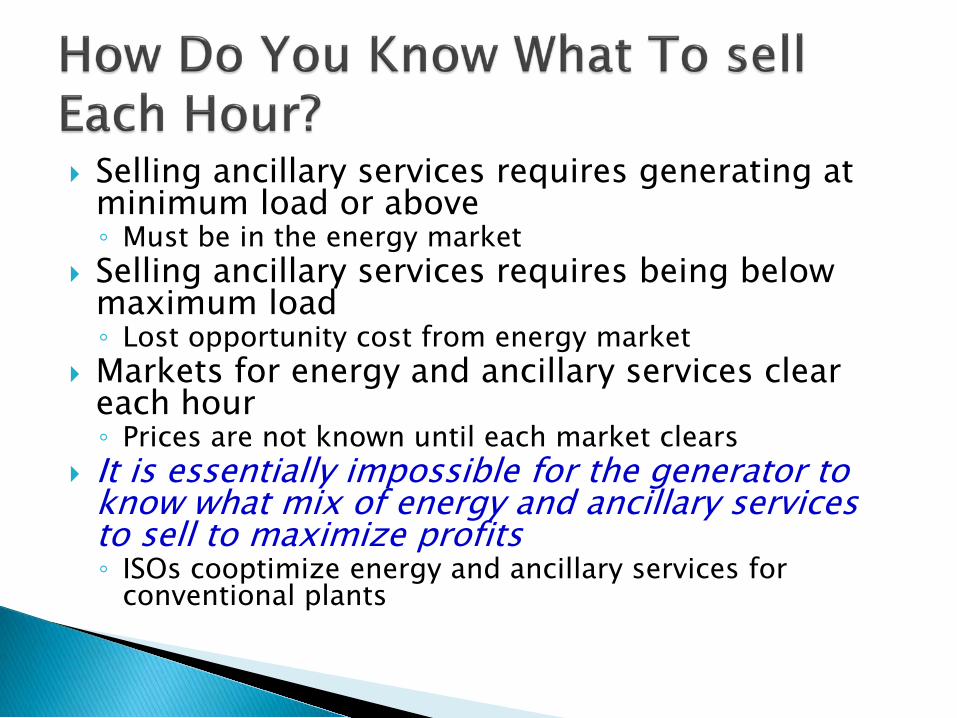
Selling ancillary services requires generating at minimum load or above ◦ Must be in the energy market
Selling ancillary services requires being below maximum load ◦ Lost opportunity cost from energy market
Markets for energy and ancillary services clear each hour ◦ Prices are not known until each market clears
It is essentially impossible for the generator to know what mix of energy and ancillary services to sell to maximize profits ◦ ISOs cooptimize energy and ancillary services for
conventional plants
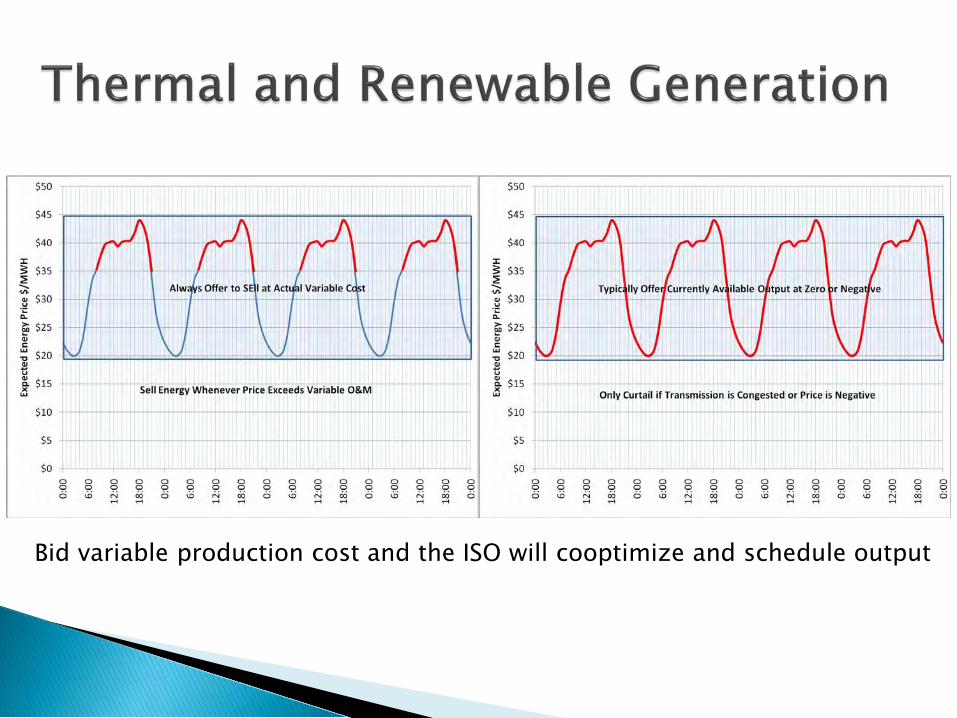
Bid variable production cost and the ISO will cooptimize and schedule output
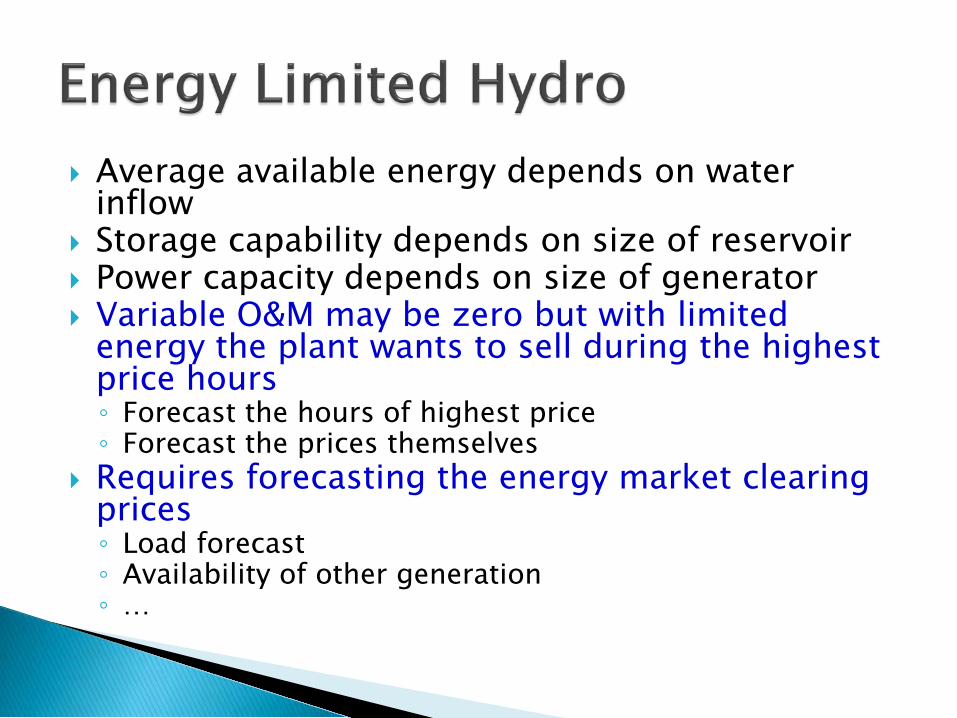
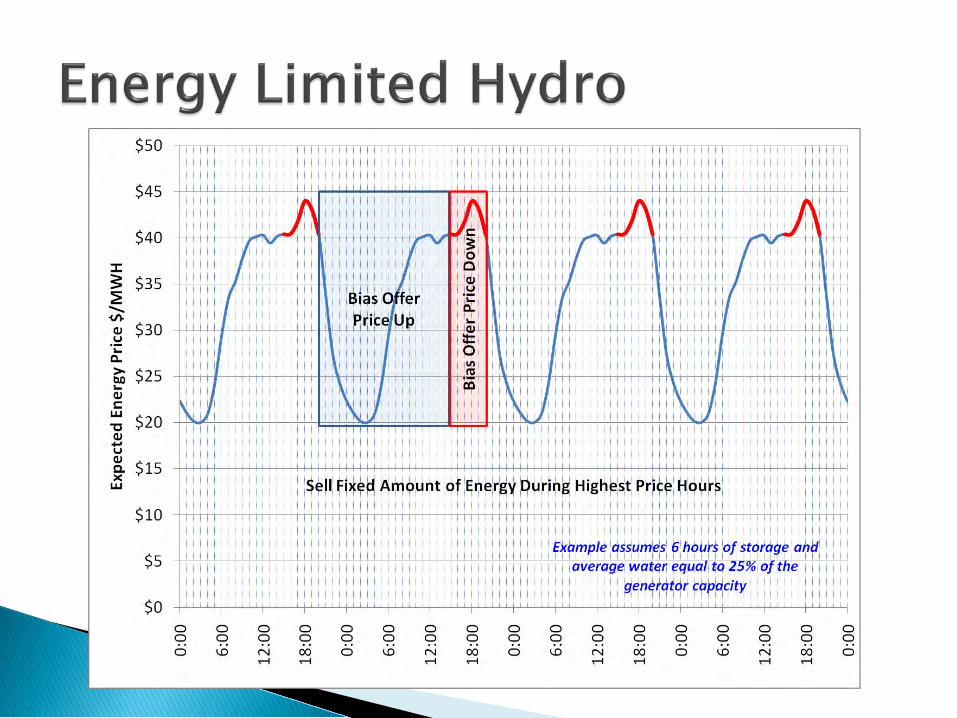
Average available energy depends on water inflow
Storage capability depends on size of reservoir Power capacity depends on size of generator Variable O&M may be zero but with limited
energy the plant wants to sell during the highest price hours ◦ Forecast the hours of highest price ◦ Forecast the prices themselves
Requires forecasting the energy market clearing prices ◦ Load forecast ◦ Availability of other generation ◦ …
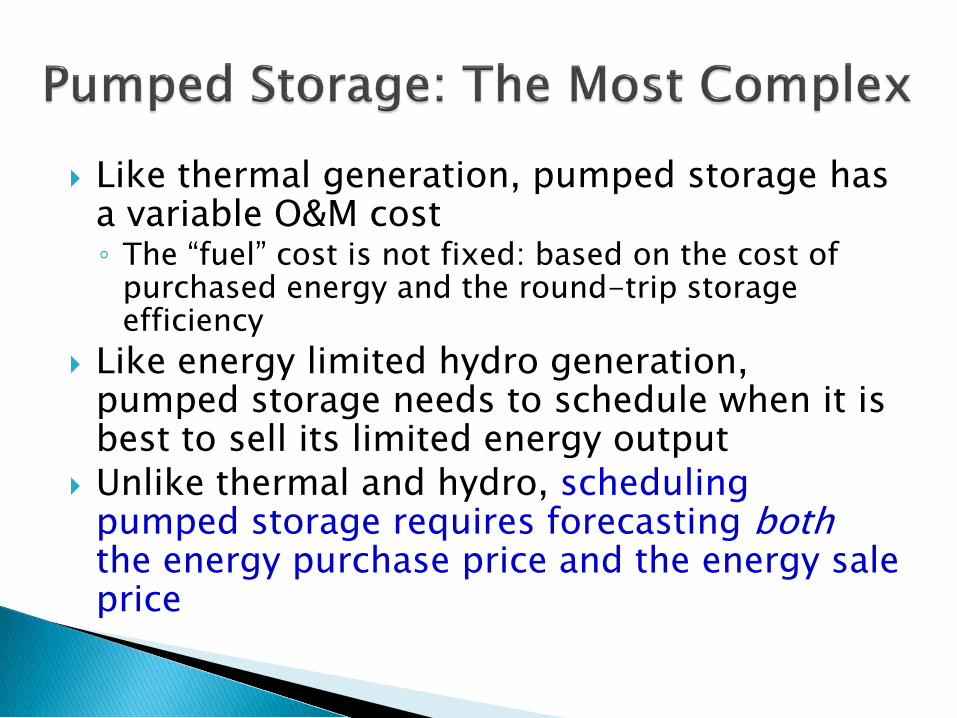
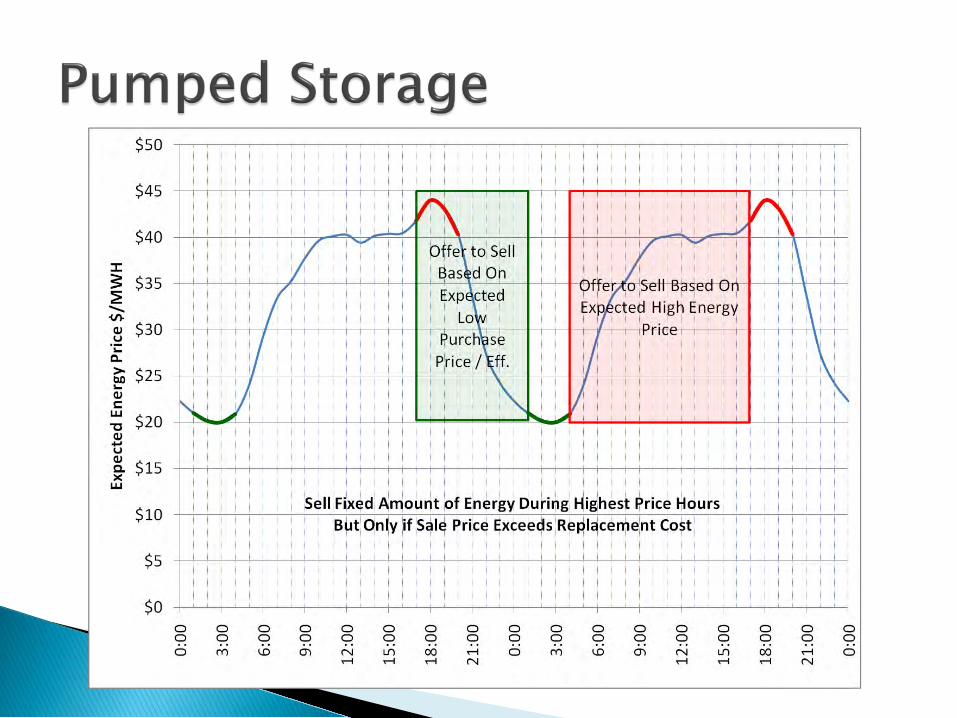
Like thermal generation, pumped storage has a variable O&M cost ◦ The “fuel” cost is not fixed: based on the cost of
purchased energy and the round-trip storage efficiency
Like energy limited hydro generation, pumped storage needs to schedule when it is best to sell its limited energy output
Unlike thermal and hydro, scheduling pumped storage requires forecasting both the energy purchase price and the energy sale price
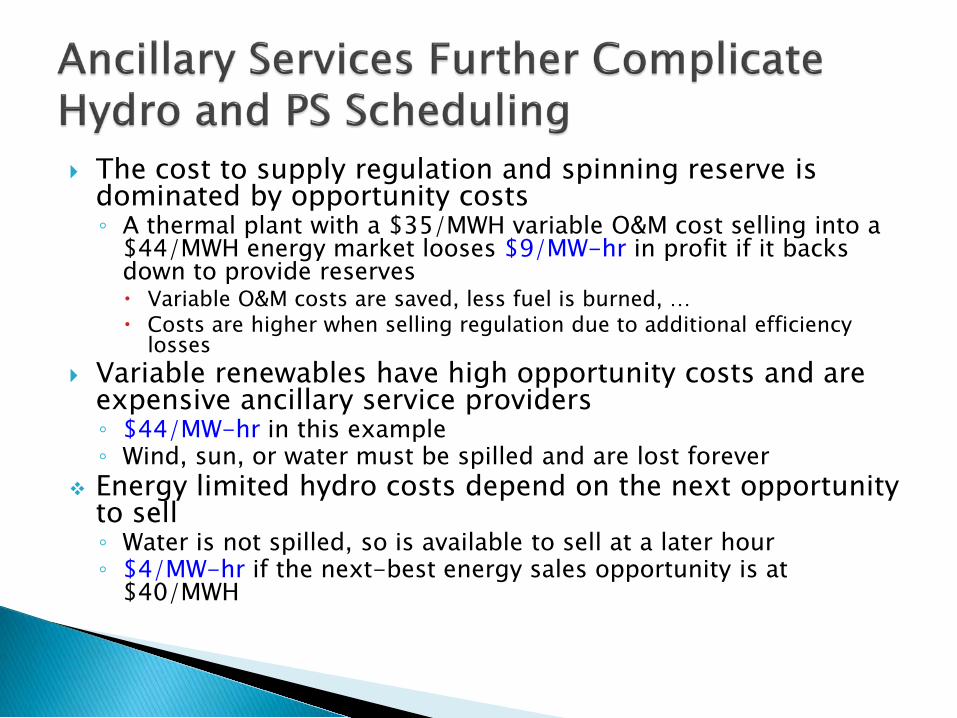
The cost to supply regulation and spinning reserve is dominated by opportunity costs ◦ A thermal plant with a $35/MWH variable O&M cost selling into a
$44/MWH energy market looses $9/MW-hr in profit if it backs down to provide reserves Variable O&M costs are saved, less fuel is burned, … Costs are higher when selling regulation due to additional efficiency
losses Variable renewables have high opportunity costs and are
expensive ancillary service providers ◦ $44/MW-hr in this example ◦ Wind, sun, or water must be spilled and are lost forever
Energy limited hydro costs depend on the next opportunity to sell ◦ Water is not spilled, so is available to sell at a later hour ◦ $4/MW-hr if the next-best energy sales opportunity is at
$40/MWH
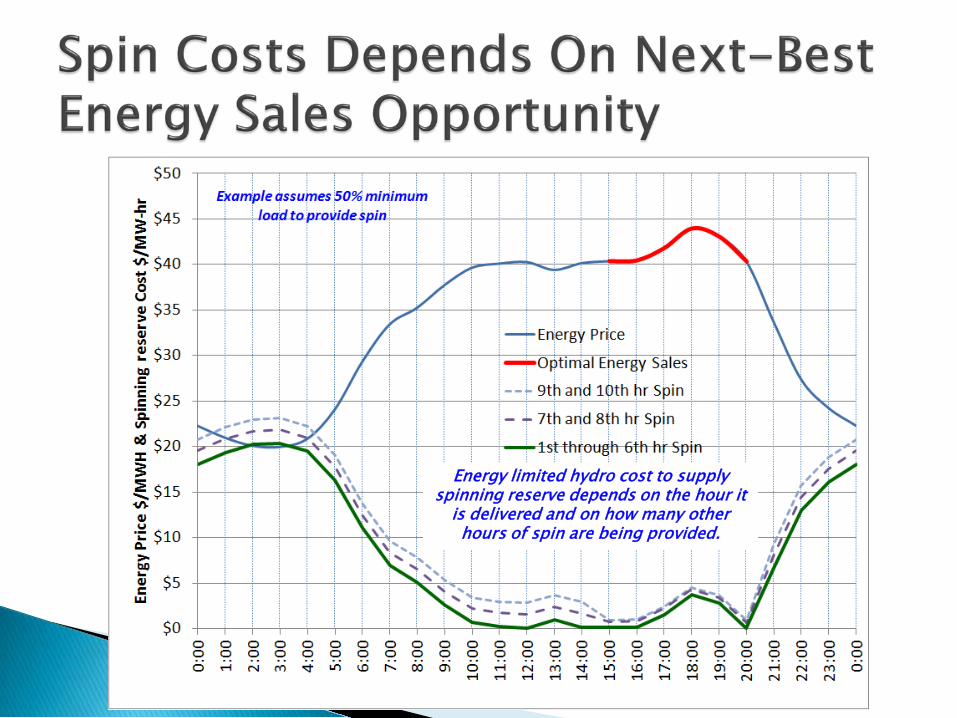
Energy limited hydro cost to supply spinning reserve depends on the hour it
is delivered and on how many other hours of spin are being provided.
ISOs cooptimize energy & AS for conventional generators each hour ◦ Resources tell ISO their capabilities & costs ◦ Consider generator limitations: min gen, min run time, min
off time, … ◦ ISO schedules energy & AS supply to simultaneously
minimize system costs and maximize supplier fair-market profits Supplier does not have to guess at opportunity costs when
bidding AS supply ◦ ISOs do not consider other inter-temporal constraints
ISOs starting to manage Energy Limited Regulation Resources (flywheels & batteries)
It may be appropriate for ISOs to consider managing Pumped Storage energy and AS
Society does not benefit from making hydro and pumped storage guess at future power prices
Allowing the system operator to schedule energy limited resources simply extends cooptimization over multiple market intervals ◦ Suppliers offer their capabilities and costs ◦ The ISO clears energy and ancillary service markets ◦ The ISO minimizes total costs while maximizing each
supplier’s profits ◦ The ISO would schedule energy limited hydro and
pumped storage based on expected future conditions as well as on the current market interval
Excellent regulation resource – very fast and very accurate
Bids very low every hour and is a price taker ◦ No opportunity cost ◦ Minimal direct variable cost (losses)
Prefers regulation: highest price Potential income is the hourly AS price With no variable cost and a near zero bid,
dedicated storage may collapse the AS market – • Regulation and spin might need to become regulated
transmission services
MISO ENERGY STORAGE WORKSHOP NHA RESPONSE TO NERC NOI ON AS
Tom Key, EPRI St. Paul, MN September 29, 2011
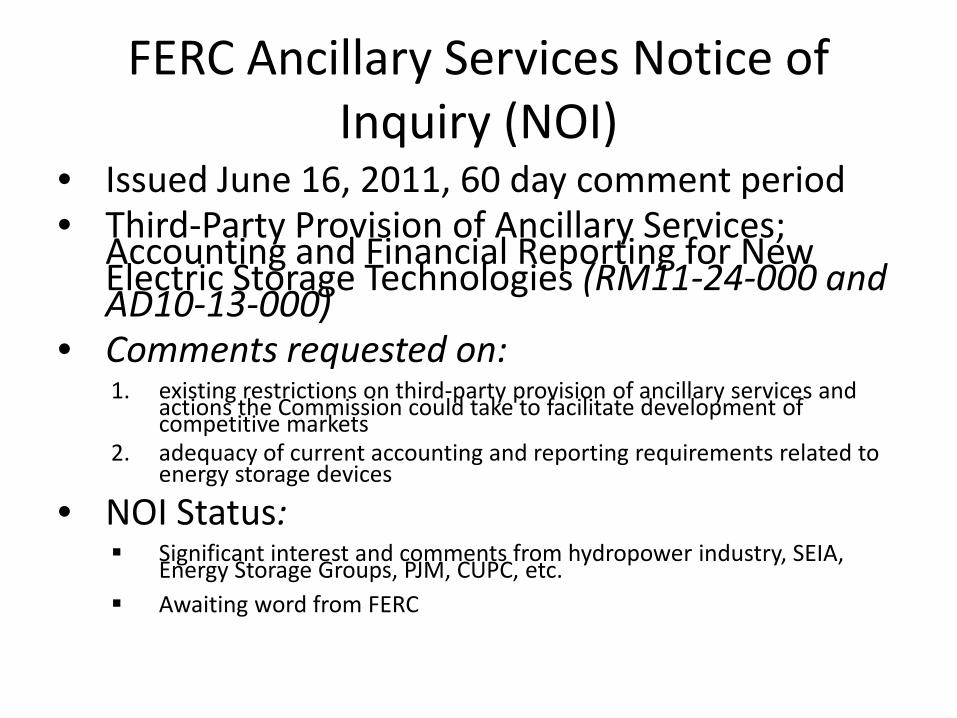
FERC Ancillary Services Notice of Inquiry (NOI)
• Issued June 16, 2011, 60 day comment period • Third-Party Provision of Ancillary Services;
Accounting and Financial Reporting for New Electric Storage Technologies (RM11-24-000 and AD10-13-000)
• Comments requested on: 1. existing restrictions on third-party provision of ancillary services and
actions the Commission could take to facilitate development of competitive markets
2. adequacy of current accounting and reporting requirements related to energy storage devices
• NOI Status: Significant interest and comments from hydropower industry, SEIA,
Energy Storage Groups, PJM, CUPC, etc. Awaiting word from FERC
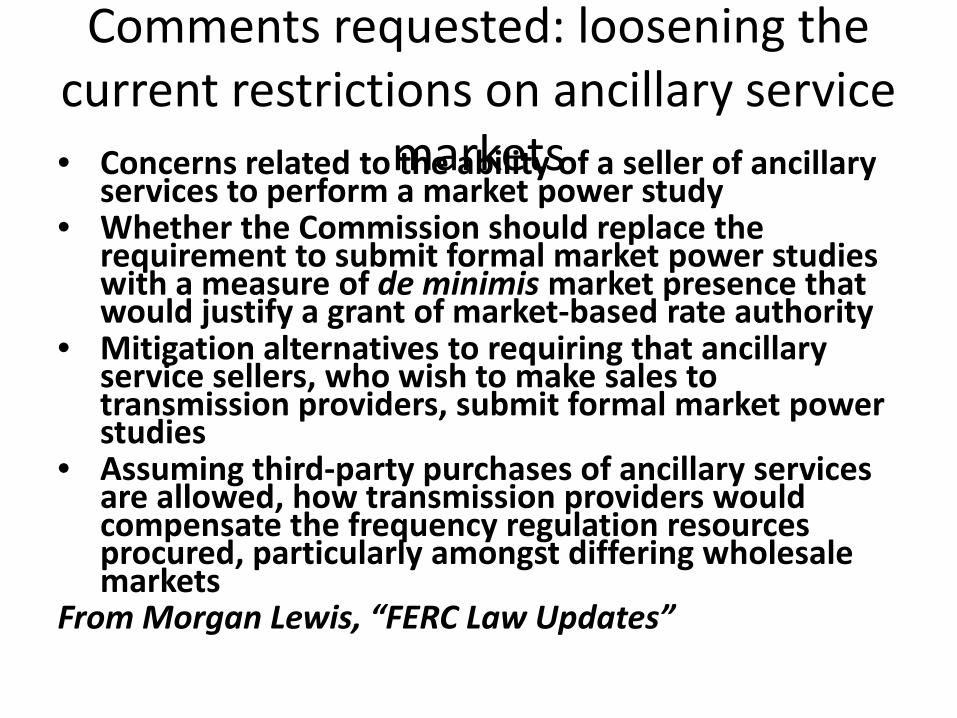
Comments requested: loosening the current restrictions on ancillary service
markets • Concerns related to the ability of a seller of ancillary services to perform a market power study
• Whether the Commission should replace the requirement to submit formal market power studies with a measure of de minimis market presence that would justify a grant of market-based rate authority
• Mitigation alternatives to requiring that ancillary service sellers, who wish to make sales to transmission providers, submit formal market power studies
• Assuming third-party purchases of ancillary services are allowed, how transmission providers would compensate the frequency regulation resources procured, particularly amongst differing wholesale markets
From Morgan Lewis, “FERC Law Updates”
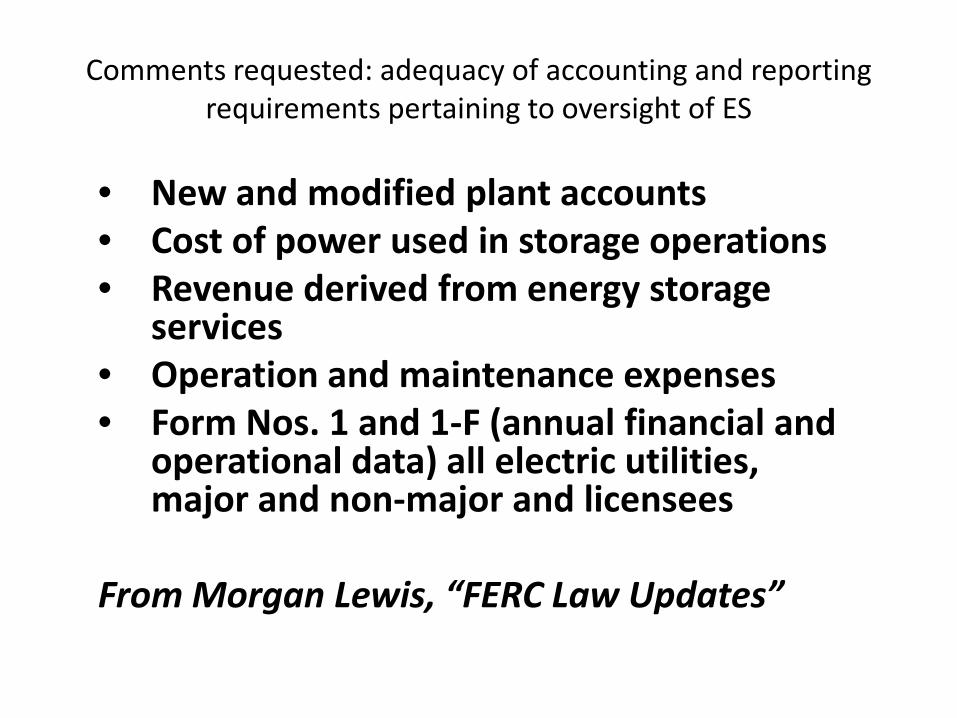
Comments requested: adequacy of accounting and reporting requirements pertaining to oversight of ES
• New and modified plant accounts • Cost of power used in storage operations • Revenue derived from energy storage
services • Operation and maintenance expenses • Form Nos. 1 and 1-F (annual financial and
operational data) all electric utilities, major and non-major and licensees
From Morgan Lewis, “FERC Law Updates”
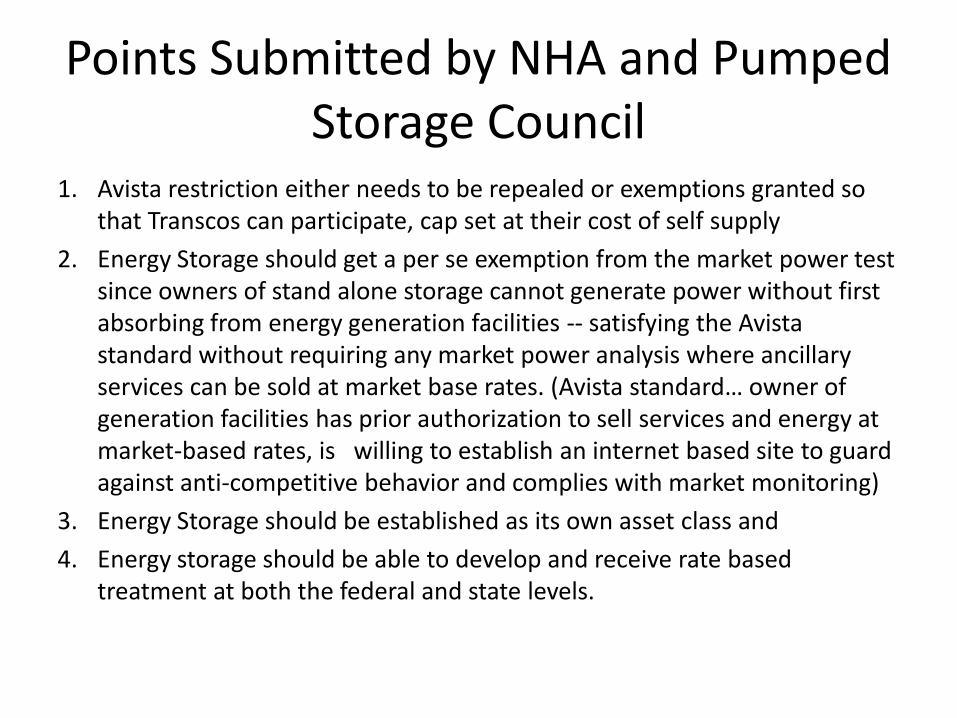
Points Submitted by NHA and Pumped Storage Council
1. Avista restriction either needs to be repealed or exemptions granted so that Transcos can participate, cap set at their cost of self supply
2. Energy Storage should get a per se exemption from the market power test since owners of stand alone storage cannot generate power without first absorbing from energy generation facilities -- satisfying the Avista standard without requiring any market power analysis where ancillary services can be sold at market base rates. (Avista standard… owner of generation facilities has prior authorization to sell services and energy at market-based rates, is willing to establish an internet based site to guard against anti-competitive behavior and complies with market monitoring)
3. Energy Storage should be established as its own asset class and 4. Energy storage should be able to develop and receive rate based
treatment at both the federal and state levels.
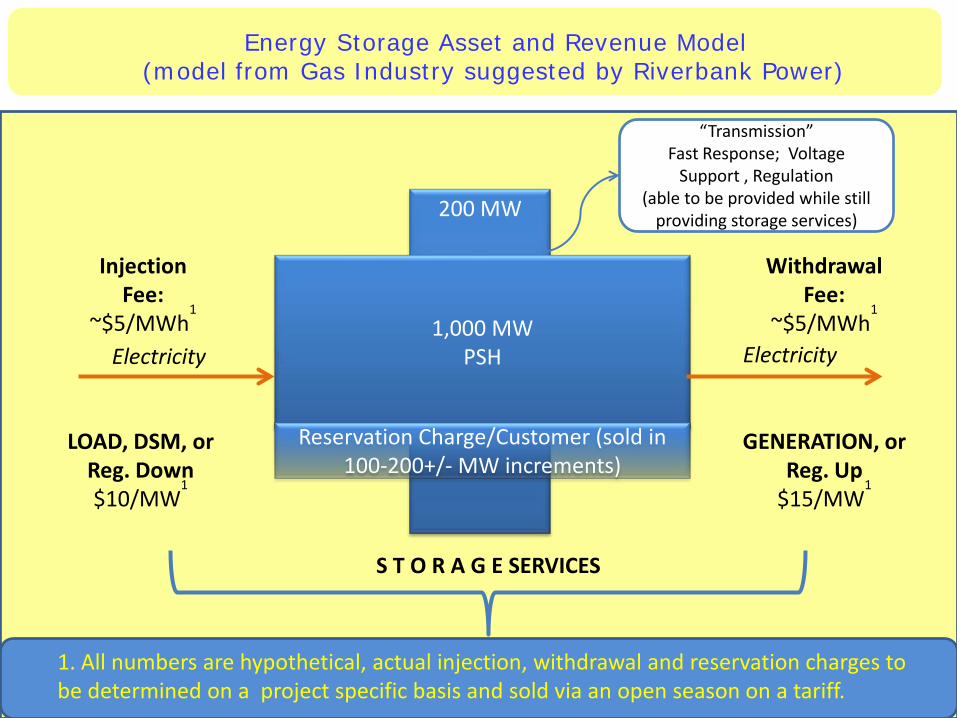
Energy Storage Asset and Revenue Model (model from Gas Industry suggested by Riverbank Power)
200 MW
1,000 MW PSH
Reservation Charge/Customer (sold in 100-200+/- MW increments)
Electricity Electricity
Injection Fee:
~$5/MWh1
Withdrawal Fee:
~$5/MWh1
LOAD, DSM, or Reg. Down $10/MW
1
GENERATION, or Reg. Up
$15/MW1
“Transmission” Fast Response; Voltage
Support , Regulation (able to be provided while still
providing storage services)
S T O R A G E SERVICES
1. All numbers are hypothetical, actual injection, withdrawal and reservation charges to be determined on a project specific basis and sold via an open season on a tariff.
Storage Resource Modeling for Load Following / Ramp
Management in MISO Markets
Technical Review Group
September 22, 2011
Outline
• Operational Landscape is changing • Opportunities to Increase Flexibility • Study Outcome • Opportunities for Storage Resources • Questions • Web Page
2

Operational Landscape is Changing
3
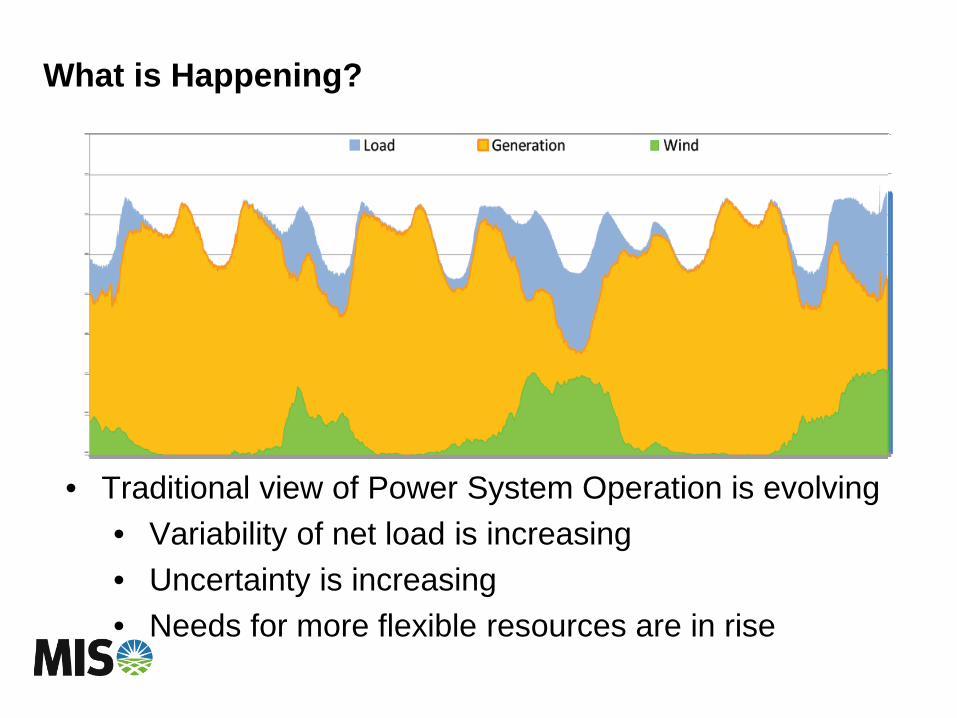
What is Happening?
• Traditional view of Power System Operation is evolving • Variability of net load is increasing • Uncertainty is increasing • Needs for more flexible resources are in rise
5
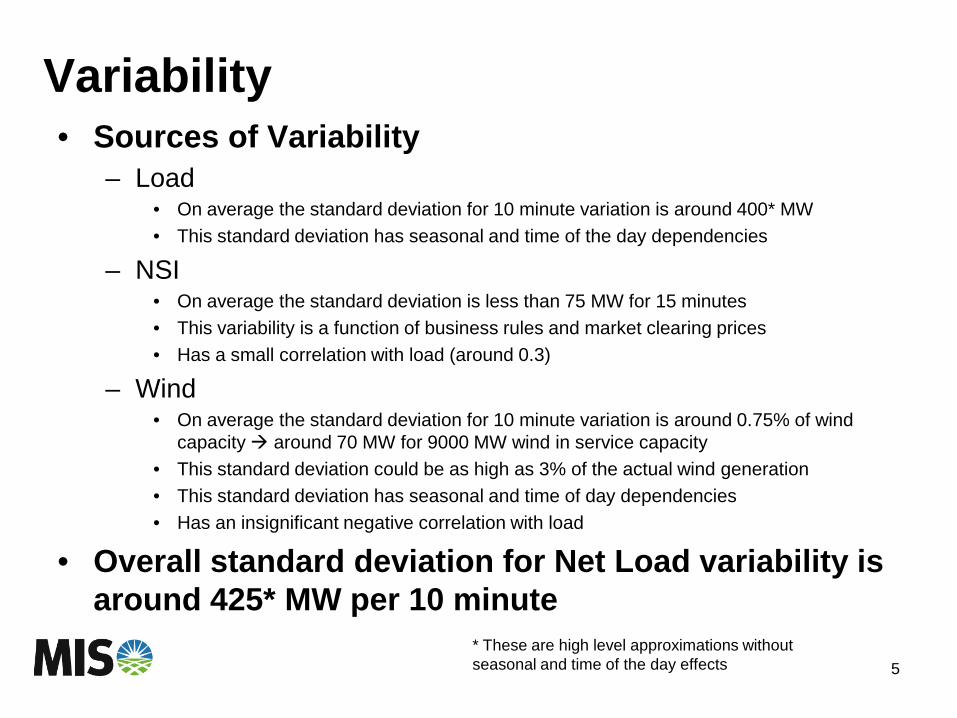
Variability • Sources of Variability
– Load • On average the standard deviation for 10 minute variation is around 400* MW • This standard deviation has seasonal and time of the day dependencies
– NSI • On average the standard deviation is less than 75 MW for 15 minutes • This variability is a function of business rules and market clearing prices • Has a small correlation with load (around 0.3)
– Wind • On average the standard deviation for 10 minute variation is around 0.75% of wind
capacity around 70 MW for 9000 MW wind in service capacity • This standard deviation could be as high as 3% of the actual wind generation • This standard deviation has seasonal and time of day dependencies • Has an insignificant negative correlation with load
• Overall standard deviation for Net Load variability is around 425* MW per 10 minute
* These are high level approximations without seasonal and time of the day effects
6
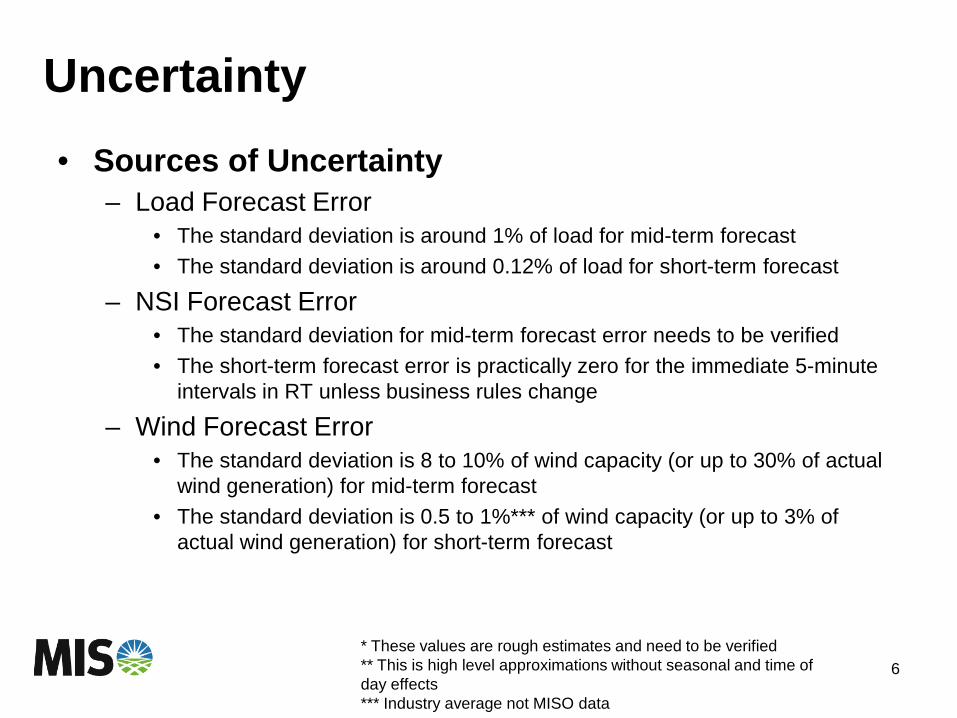
Uncertainty • Sources of Uncertainty
– Load Forecast Error • The standard deviation is around 1% of load for mid-term forecast • The standard deviation is around 0.12% of load for short-term forecast
– NSI Forecast Error • The standard deviation for mid-term forecast error needs to be verified • The short-term forecast error is practically zero for the immediate 5-minute
intervals in RT unless business rules change
– Wind Forecast Error • The standard deviation is 8 to 10% of wind capacity (or up to 30% of actual
wind generation) for mid-term forecast • The standard deviation is 0.5 to 1%*** of wind capacity (or up to 3% of
actual wind generation) for short-term forecast
* These values are rough estimates and need to be verified ** This is high level approximations without seasonal and time of day effects *** Industry average not MISO data
7
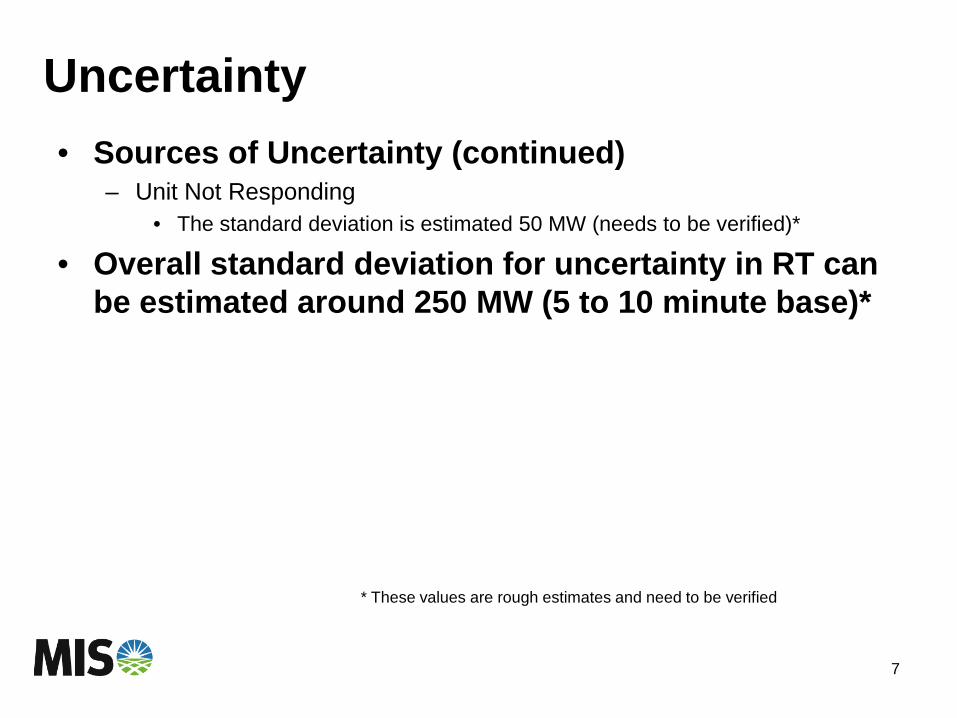
Uncertainty • Sources of Uncertainty (continued)
– Unit Not Responding • The standard deviation is estimated 50 MW (needs to be verified)*
• Overall standard deviation for uncertainty in RT can be estimated around 250 MW (5 to 10 minute base)*
* These values are rough estimates and need to be verified
8
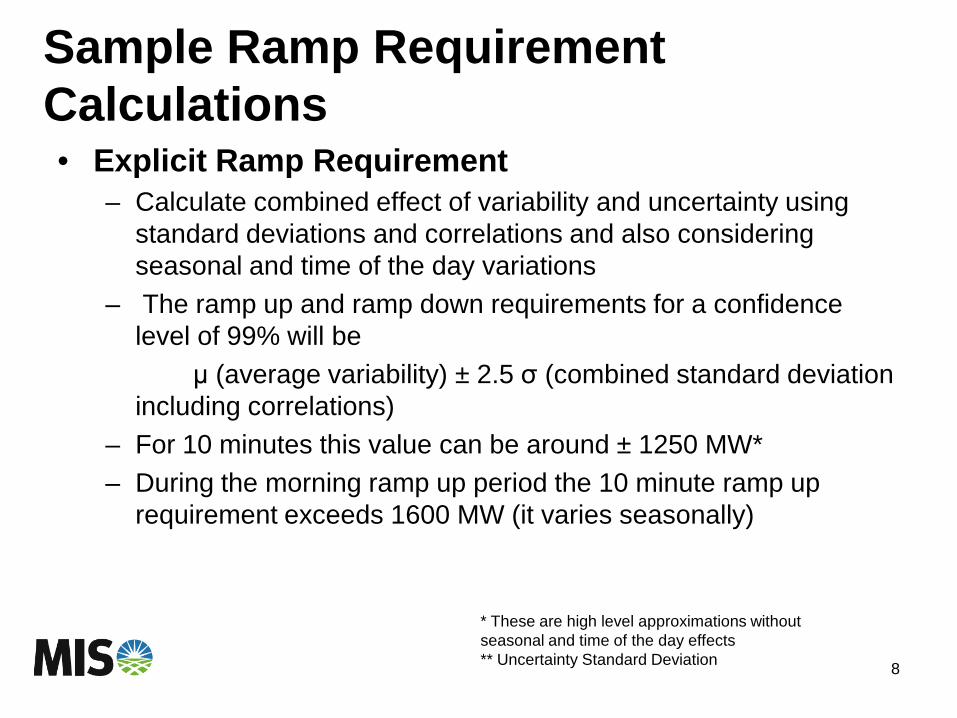
Sample Ramp Requirement Calculations • Explicit Ramp Requirement
– Calculate combined effect of variability and uncertainty using standard deviations and correlations and also considering seasonal and time of the day variations
– The ramp up and ramp down requirements for a confidence level of 99% will be
μ (average variability) ± 2.5 σ (combined standard deviation including correlations)
– For 10 minutes this value can be around ± 1250 MW* – During the morning ramp up period the 10 minute ramp up
requirement exceeds 1600 MW (it varies seasonally)
* These are high level approximations without seasonal and time of the day effects ** Uncertainty Standard Deviation
9
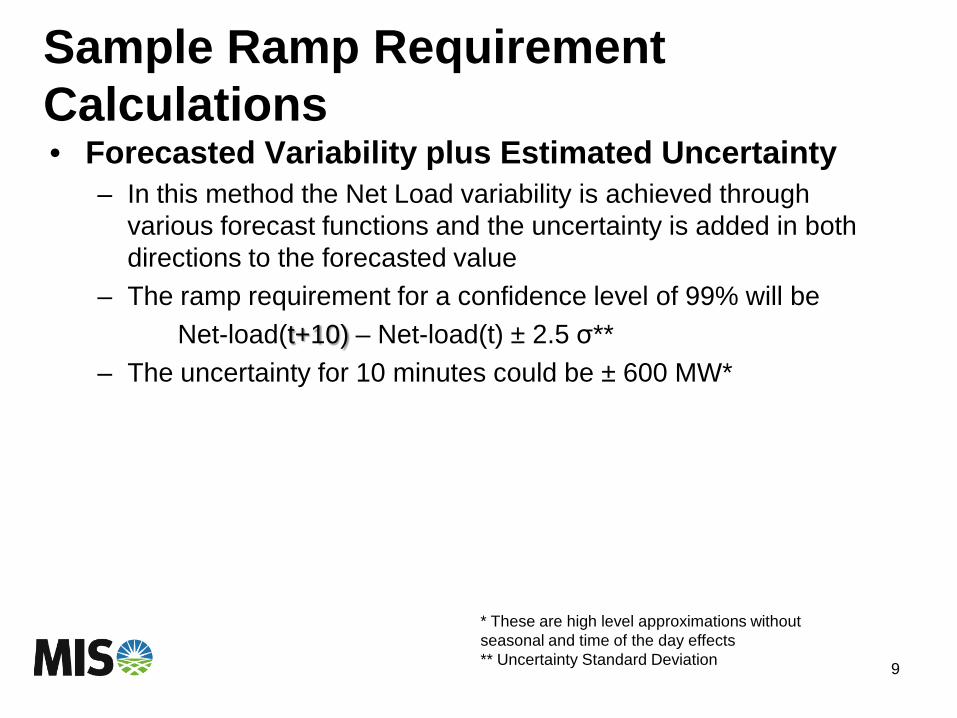
Sample Ramp Requirement Calculations • Forecasted Variability plus Estimated Uncertainty
– In this method the Net Load variability is achieved through various forecast functions and the uncertainty is added in both directions to the forecasted value
– The ramp requirement for a confidence level of 99% will be Net-load(t+10) – Net-load(t) ± 2.5 σ** – The uncertainty for 10 minutes could be ± 600 MW*
* These are high level approximations without seasonal and time of the day effects ** Uncertainty Standard Deviation

Opportunities to Increase Flexibility
10
Goals of Ramp Management / Load Following
• Aid reliable operations by keeping sufficient ramp capability available for use in RT dispatch to address variations in ramp requirements arising from forecast errors in NSI, load, intermittent resources.
• Reduce price volatility by reducing instances of transitory shortages arising from ramp shortages.
• Acquire ramp capability through a market mechanism so a price signal can be sent to the market.
11
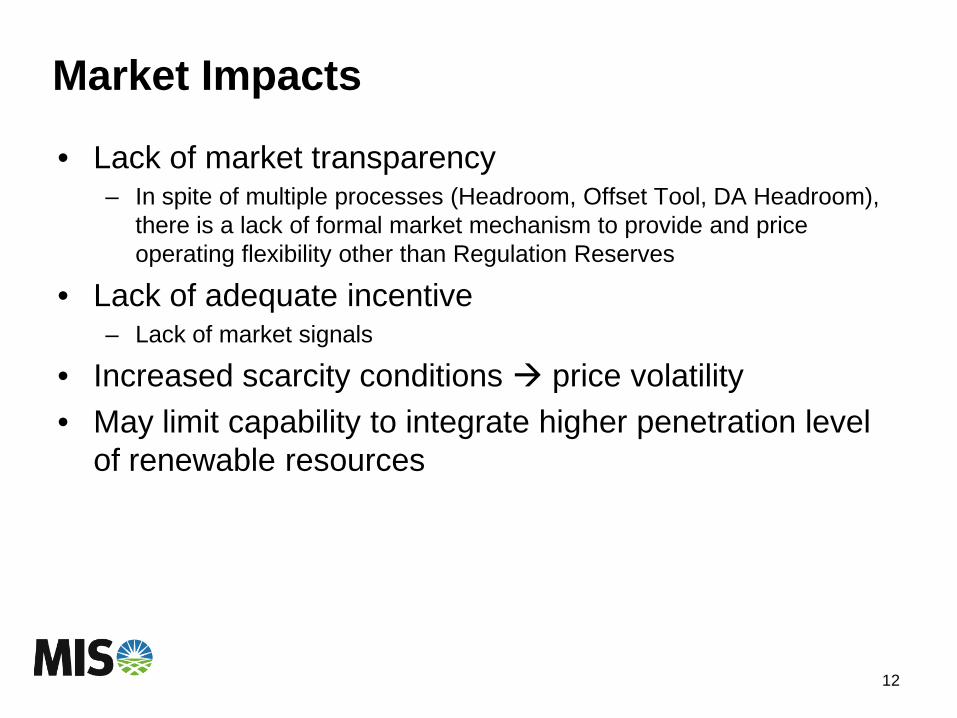
Market Impacts
• Lack of market transparency – In spite of multiple processes (Headroom, Offset Tool, DA Headroom),
there is a lack of formal market mechanism to provide and price operating flexibility other than Regulation Reserves
• Lack of adequate incentive – Lack of market signals
• Increased scarcity conditions price volatility • May limit capability to integrate higher penetration level
of renewable resources
12
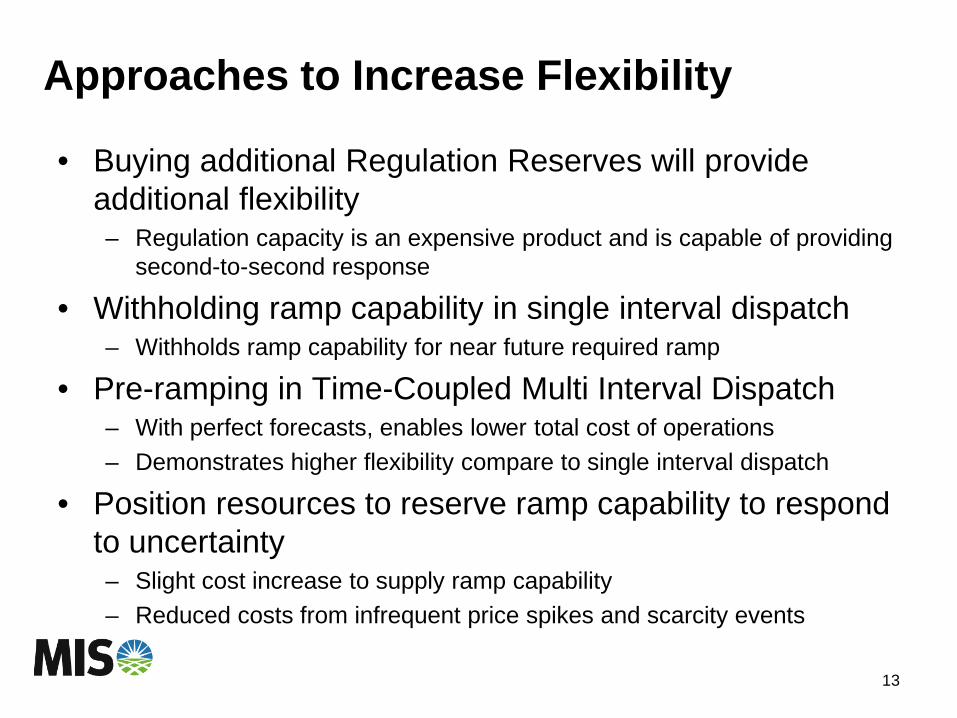
Approaches to Increase Flexibility
• Buying additional Regulation Reserves will provide additional flexibility – Regulation capacity is an expensive product and is capable of providing
second-to-second response
• Withholding ramp capability in single interval dispatch – Withholds ramp capability for near future required ramp
• Pre-ramping in Time-Coupled Multi Interval Dispatch – With perfect forecasts, enables lower total cost of operations – Demonstrates higher flexibility compare to single interval dispatch
• Position resources to reserve ramp capability to respond to uncertainty – Slight cost increase to supply ramp capability – Reduced costs from infrequent price spikes and scarcity events
13
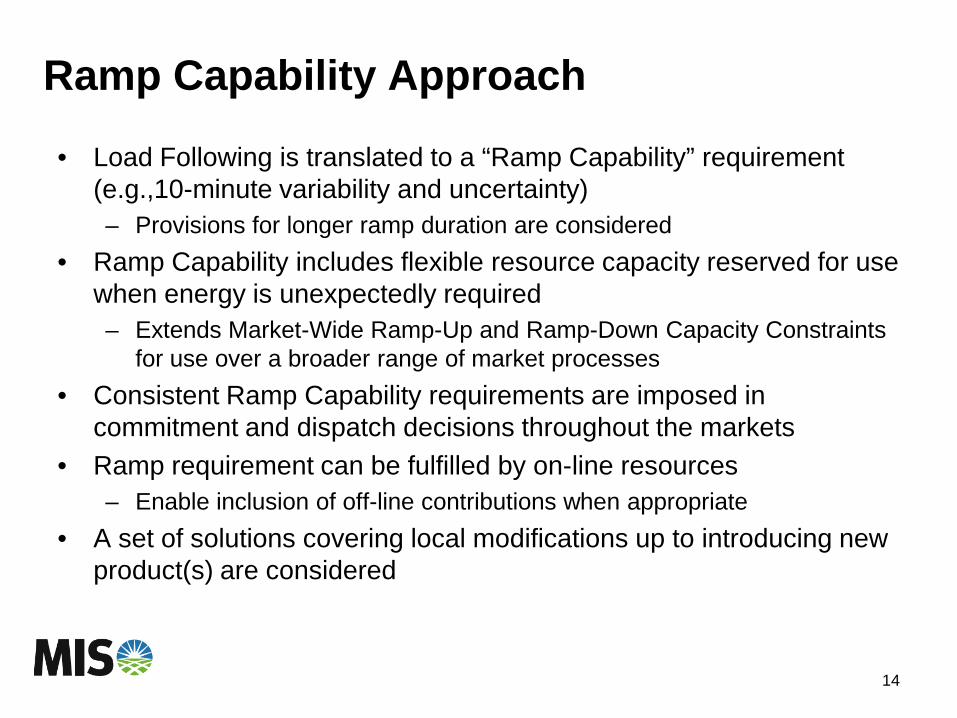
Ramp Capability Approach
• Load Following is translated to a “Ramp Capability” requirement (e.g.,10-minute variability and uncertainty) – Provisions for longer ramp duration are considered
• Ramp Capability includes flexible resource capacity reserved for use when energy is unexpectedly required – Extends Market-Wide Ramp-Up and Ramp-Down Capacity Constraints
for use over a broader range of market processes • Consistent Ramp Capability requirements are imposed in
commitment and dispatch decisions throughout the markets • Ramp requirement can be fulfilled by on-line resources
– Enable inclusion of off-line contributions when appropriate • A set of solutions covering local modifications up to introducing new
product(s) are considered
14
Look Ahead
15
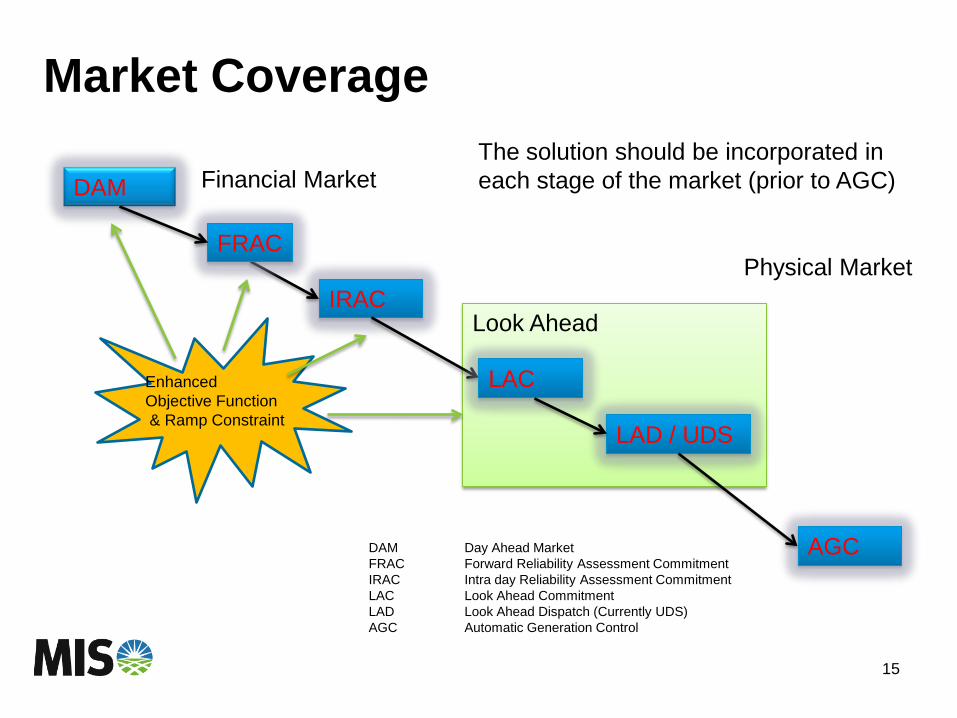
Market Coverage
DAM
IRAC
LAD / UDS
AGC
FRAC
Financial Market
Physical Market
LAC
DAM Day Ahead Market FRAC Forward Reliability Assessment Commitment IRAC Intra day Reliability Assessment Commitment LAC Look Ahead Commitment LAD Look Ahead Dispatch (Currently UDS) AGC Automatic Generation Control
The solution should be incorporated in each stage of the market (prior to AGC)
Enhanced Objective Function & Ramp Constraint
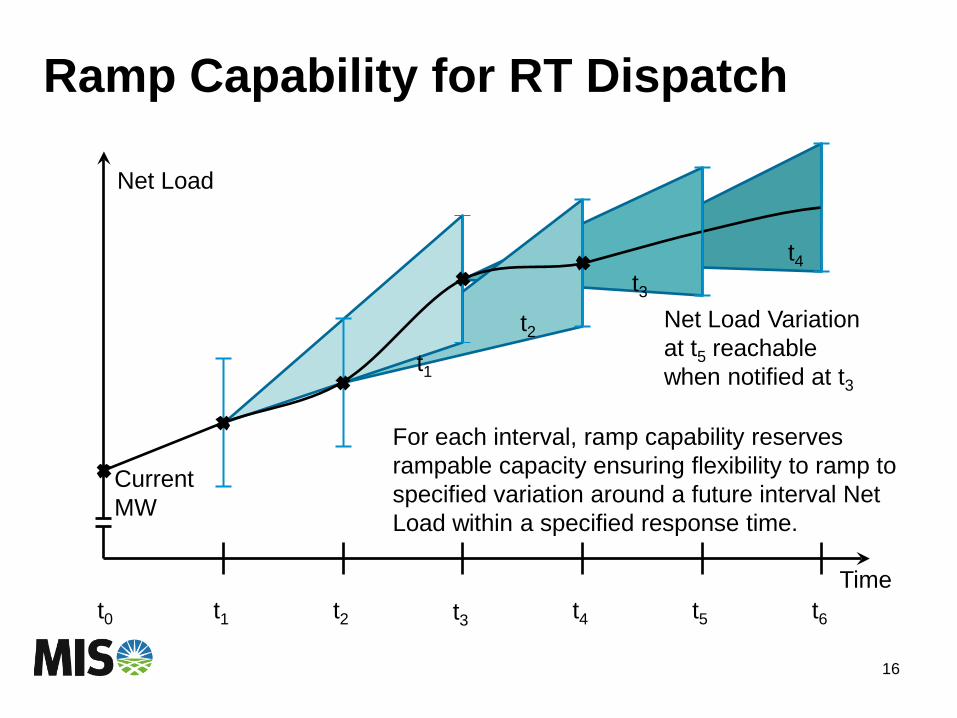
Ramp Capability for RT Dispatch
16
t0 t1 t2 t3 t4 t5 t6
t1
t2
t3
t4
Time
Net Load
Net Load Variation at t5 reachable when notified at t3
Current MW
For each interval, ramp capability reserves rampable capacity ensuring flexibility to ramp to specified variation around a future interval Net Load within a specified response time.
Ramp Capability Deployment
• RT Ramp Capability “deployment” occurs in the co-optimized dispatch with the most economic resources selected to provide energy and all ancillary services – No explicit event to signal deployment – Dispatch determines best approach to meet all requirements – Cleared Ramp Capability ensures flexibility exists but does not imply
that cleared resources will be the ones deployed
• Ramp Capability Demand Curve supports “deployment” – When existing ramp capability responds to a quick change in Net Load,
the demand curve may set the clearing price while ramp capability is scarce and the operational flexibility is restored
– Ramp Capability Demand Curve will be set in conjunction with Ancillary Service demand curve prices
17
Ramp Capability Product Pricing • Ramp Capability consists of two new products: Ramp Up
and Ramp Down – Up and Down products have symmetrical features, but clear
independent prices and quantities in each interval – Transparent market-based ramp capability products give improved
economic signals for needed operational flexibility
• Ramp Capability price is determined by the shadow price of System Ramp Up and Ramp Down Capability Constraints – Includes lost opportunity costs associated with providing ramp capability
products – Product demand curves limit prices – Ramp capability prices interact with prices of existing products
18
Ramp Capability Payments
• Cleared Ramp Capability is paid clearing price • Make-whole payments are available as a backstop
– Prefer more economical re-dispatch of on-line generation (potentially out of merit) to provide ramp capability
– Additional resources could be committed to satisfy increased rampable capacity requirement
19
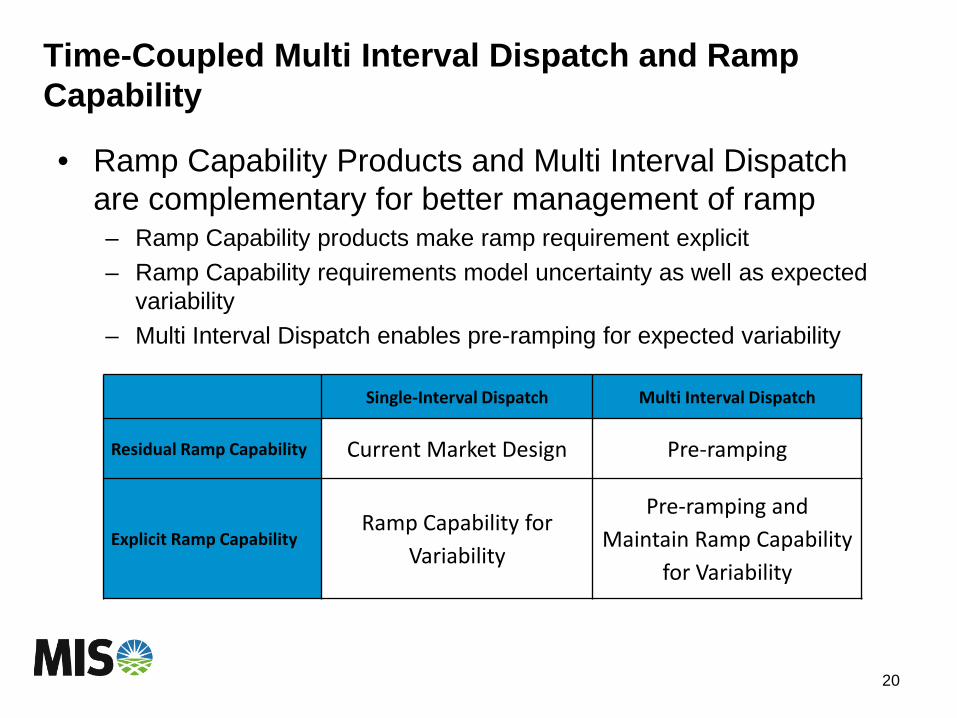
Time-Coupled Multi Interval Dispatch and Ramp Capability
• Ramp Capability Products and Multi Interval Dispatch are complementary for better management of ramp – Ramp Capability products make ramp requirement explicit – Ramp Capability requirements model uncertainty as well as expected
variability – Multi Interval Dispatch enables pre-ramping for expected variability
20
Single-Interval Dispatch Multi Interval Dispatch
Residual Ramp Capability Current Market Design Pre-ramping
Explicit Ramp Capability Ramp Capability for
Variability
Pre-ramping and Maintain Ramp Capability
for Variability

Study Outcome
21
Ramp Capability Dispatch Scenarios • Scenario 1: No Impact
– Economic dispatch naturally provides required Ramp Capability – Economic dispatch is unchanged – Ramp Capability price is 0 $/MWh
• Scenario 2: Re-dispatch for Ramp Capability – Resource dispatch altered to provide required Ramp Capability – Ramp Capability price > 0, set by resource opportunity cost
• Scenario 3: Insufficient Cost Effective Re-dispatch
– Resource re-dispatch insufficient; requirement relaxed – Ramp Capability price > 0, set by Demand Curve
22
Ramp Capability Observations
• Ramp Capability model positions resources for increased operational flexibility
• Single interval dispatch with Ramp Capability withholds flexible capacity for future variability and uncertainty
• Multi-interval dispatch enables pre-ramping and tradeoffs between intervals to achieve higher flexibility and potentially more economic operation
• Resource capacity constraints couple the Ramp Capability with Ancillary Services and impact dispatch and prices
23
Expected Impacts
• Reduction in production cost • Reduction of scarcity events • Improved reliability and response to changes • RT price spike magnitude and frequency reduction • Slight increase in LMPs and Ancillary Service prices as
capacity is reserved to provide Ramp Capability • Small operational cost increase in most cases to position
resources to provide increased flexibility • Overall reduction in production cost
24
Conclusions: The Ramp Capability Method…
• Achieves the benefits of Load Following – Reduce scarcity and smoother unit dispatch
• Offers flexible implementation at relatively low cost – Incremental change to current operational practices and systems – Settlement as a product
• Enables improved flexibility for increased variability and uncertainty (e.g., more non-controllable wind generation)
• Positions resources for ramp and more robust dispatch – Compatible with single interval or multiple interval dispatch – Multi Interval Dispatch provides a better opportunity to pre-position the
units and overall reduces the production costs including uplifts
25

Opportunities for Storage Resources
26
Existing Options
• Long-term storage resources – Shifting energy from off-peak periods to on-peak periods (Energy
transmission through time)
• Short-term storage resources – Provide ancillary services (e.g., regulation)
27
Other Opportunities
• Storage resources are capable of quick response • Ideal resource to accommodate the required flexibility by
the system • Reduction in conventional generating resource cycling • Participation of energy resources to provide ramp up and
ramp down capability is the next step • Modeling and business rule / process Challenges
28
Other Opportunities
• Storage resources are capable of reducing transmission congestion market impacts – Generating in the receiving end – Loading (pumping, compressing) in the sending end
• Storage resources are capable of reducing / eliminating the minimum generation situation
• The list goes on and on • The key is let the market clearance mechanism dispatch
(and / or commit) the storage resource • Self scheduling or bundling the operation of storage
resource with other resources (e.g., renewable generation) is limiting its operational benefits
29
Web Page
• MISO Web Page for ramp Management / Load Following – www.midwestiso.org/WhatWeDo/StrategicInitiatives/Pages/Ram
pManagement.aspx
30

Towards increasing market access
Presentation at EPRI/MISO Pumped Storage Workshop
Verne Loose, Sandia National Laboratories
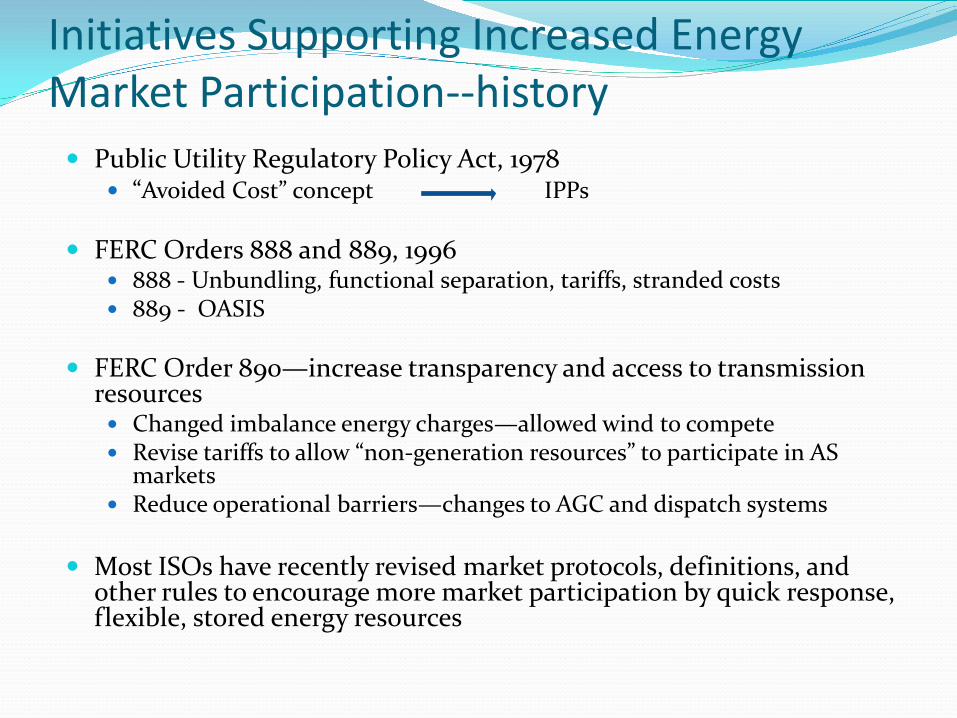
Initiatives Supporting Increased Energy Market Participation--history Public Utility Regulatory Policy Act, 1978
“Avoided Cost” concept IPPs
FERC Orders 888 and 889, 1996 888 - Unbundling, functional separation, tariffs, stranded costs 889 - OASIS
FERC Order 890—increase transparency and access to transmission resources Changed imbalance energy charges—allowed wind to compete Revise tariffs to allow “non-generation resources” to participate in AS
markets Reduce operational barriers—changes to AGC and dispatch systems
Most ISOs have recently revised market protocols, definitions, and
other rules to encourage more market participation by quick response, flexible, stored energy resources
More revisions are in order some are under active discussion Instituting “pay for performance” in regulation
markets (February 2011) FERC NOI on Ancillary Services (June 2011) Other initiatives?
Discussion of markets for flexibility Discussion of markets for ramping
Characteristics of well-functioning markets
Ease of market entry and exit Limit requirements for market participation
Absence of significant monopoly power No dominant firms
Widespread availability of information All participants should simultaneously have the same information
Absence of market externalities No uncompensated services
Achievement of public interest objectives More competition leads to lower energy prices
Takeaways As much as reasonably possible, limit definitional and
other requirements and restrictions on participation of assets in specific markets
Compensation for all services provided to the grid; focus especially on the services that result from unique technological capabilities Rotating machinery provides frequency response Energy storage provides ability to absorb energy
Look for externalities

Some recent initiatives
NYISO First to address issue, May 2009 Define Limited Energy Storage Resources
(batteries and flywheels) made regulation rule changes to accommodate performance characteristics of LESRs
Accuracy performance metric but based on conventional generator capabilities
Eliminated requirement to bid into energy market
New net energy settlement provisions (injections-withdrawals) * LMP
PJM Implemented a frequency-based signal for energy
storage resources in 2009 Defines “energy storage resources” as flywheels
and batteries; includes with PSH Excludes power to charge energy storage resource
from “station power” definition Sale of energy to be used at an energy storage
resource is FERC jurisdictional (commerce)
CAISO
Definition of “regulation energy management: service—new market
Open to limited energy storage devices and demand response
Reduced minimum AS capacity to 0.5 MW Reduced continuous energy requirement for
spin and non-spin to 30 minutes Continuous energy measured from the time a
resource reaches its award capacity rather than from the end of the 10-minute ramp period
ERCOT
Modified low and high sustained limit for LESRs in testing performance response
Modify regulation deployment-damping of regulation signals Energy neutral—signal over time should have zero
integral Frequent cycling-the direction of the signal should
change rapidly so that energy associated with that cycle in one direction is small
Reacts to real-time energy imbalances—the signal should be representative of control actions required to stabilize real-time energy imbalances on the system
ISO-NE
Main feature is “mileage payment” that compensates more fully for regulation provided than most other ISO settlement rules—pays for speed Claim is that ISO-NE procures the least amount of
regulation of any ISO Alternatives Technologies Regulation Pilot Program
Began in 2008 for both energy storage and demand response