Embed Size (px)
Citation preview
AGF MANAGEMENT LIMITED
EARNINGS CONFERENCE CALLFOURTH QUARTER 2014
JANUARY 28, 2015
CAUTION REGARDING FORWARD-LOOKING STATEMENTS
The forward looking information is provided as of January 28, 2015. Certain information presented in these remarks and in this presentation that is not historical factual information may constitute forward-looking information within the meaning of securities laws. Actual results could differ materially from a conclusion, forecast or projection contained in such forward-looking information. Forward-looking information may relate to our future outlook and anticipated events or results and may include statements about AGF Management Limited ("AGF") or the investment funds it manages (the "Funds"), including business operations, strategy and expected financial performance and condition. Forward-looking statements include statements that are predictive in nature, depend upon or refer to future events or conditions, or include words such as ‘expects,’ ‘anticipates,’ ‘intends,’ ‘plans,’ ‘believes,’ or negative versions thereof and similar expressions or future or conditional verbs such as ‘may,’ ‘will,’ ‘should,’ ‘would,’ or ‘could.’ In addition, any statement that may be made concerning future financial performance (including revenues, earnings or growth rates),ongoing business strategies or prospects, and possible future action on our part, is also a forward-looking statement.
Forward-looking statements are based on certain material factors and assumptions, including expected growth, results of operations, business prospects, business performance and opportunities. While we consider these factors and assumptions to bereasonable based on information currently available, they may prove to be incorrect. Forward-looking statements are based on current expectations and projections about future events and are inherently subject to, among other things, risks, uncertainties and assumptions about our operations, economic factors and the financial services industry generally. They are not guarantees of future performance, and actual events and results could differ materially from those expressed or implied by forward-looking statements made by us due to, but not limited to, important risk factors such as level of assets under our management, volume ofsales and redemptions of our investment products, performance of our investment funds and of our investment managers and advisors, competitive fee levels for investment management products and administration, and competitive dealer compensation levels and cost efficiency in our investment management operations, as well as interest and foreign exchange rates, taxation,changes in government regulations, unexpected judicial or regulatory proceedings, and our ability to complete strategic transactions and integrate acquisitions. We caution that the foregoing list is not exhaustive. The reader is cautioned to consider these and other factors carefully and not place undue reliance on forward-looking statements. Other than specifically required by applicable laws, we are under no obligation (and expressly disclaim any such obligation) to update or alter the forward-looking statements, whether as a result of new information, future events or otherwise. For a more complete discussion of the risk factors that may impact actual results, please refer to AGF’s most recent financial statements and MD&A and, for the Funds, to each Fund’s most recent prospectus and MRFP, as applicable, all available on www.sedar.com.
2
CONFERENCE CALL PARTICIPANTS
• Blake C. Goldring, CFA,
Chairman & Chief Executive Officer
• Kevin McCreadie, CFA,
President & Chief Investment Officer
• Robert J. Bogart,
Executive Vice-President & Chief Financial Officer
• Gregory Smith,
President & Chief Executive Officer, InstarAGF
3
• Highlights of the 4th Quarter and Fiscal 2014
• Business Updates
– Retail Business
– Investment Management
– Institutional Business
– Alternatives
• Financial Results
• Capital & Liquidity
• Focus & Priorities
TODAY’S DISCUSSION
4
Q4 AND 2014 FISCAL HIGHLIGHTS
5
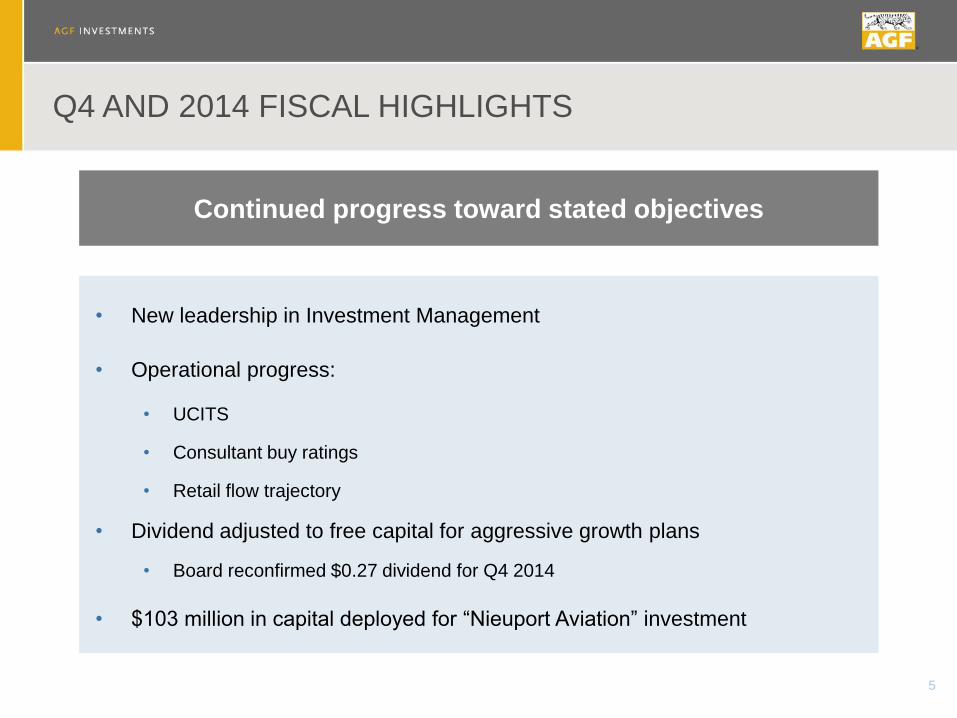
• New leadership in Investment Management
• Operational progress:
• UCITS
• Consultant buy ratings
• Retail flow trajectory
• Dividend adjusted to free capital for aggressive growth plans
• Board reconfirmed $0.27 dividend for Q4 2014
• $103 million in capital deployed for “Nieuport Aviation” investment
Continued progress toward stated objectives
RETAIL NET REDEMPTIONS TREND
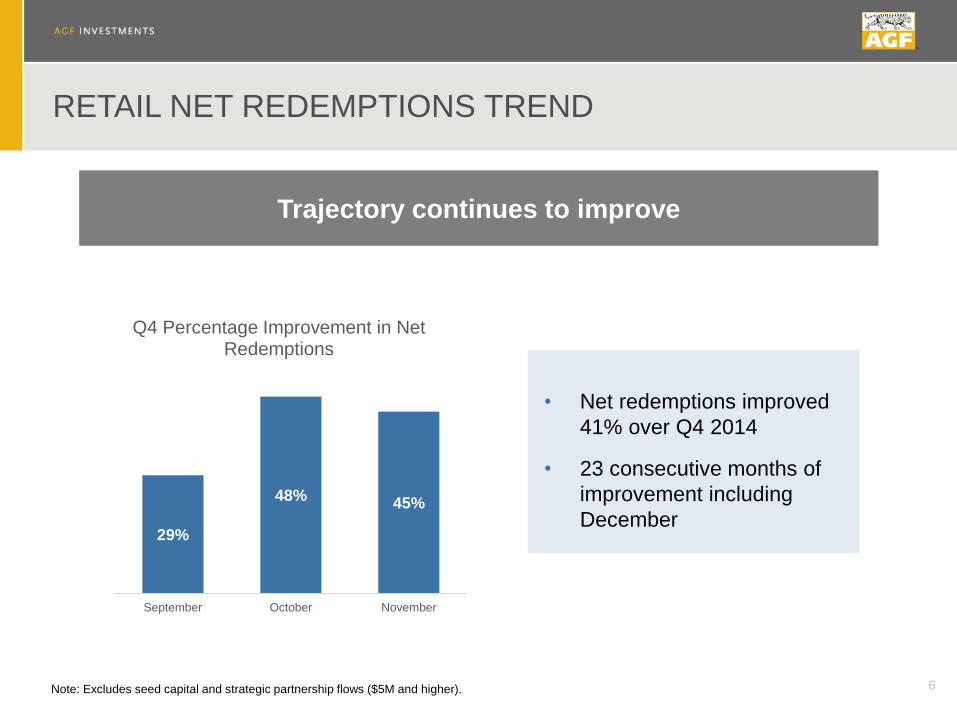
6Note: Excludes seed capital and strategic partnership flows ($5M and higher).
29%
48%45%
September October November
Q4 Percentage Improvement in Net Redemptions
• Net redemptions improved
41% over Q4 2014
• 23 consecutive months of
improvement including
December
Trajectory continues to improve
THE VALUE OF ADVICE
7
0
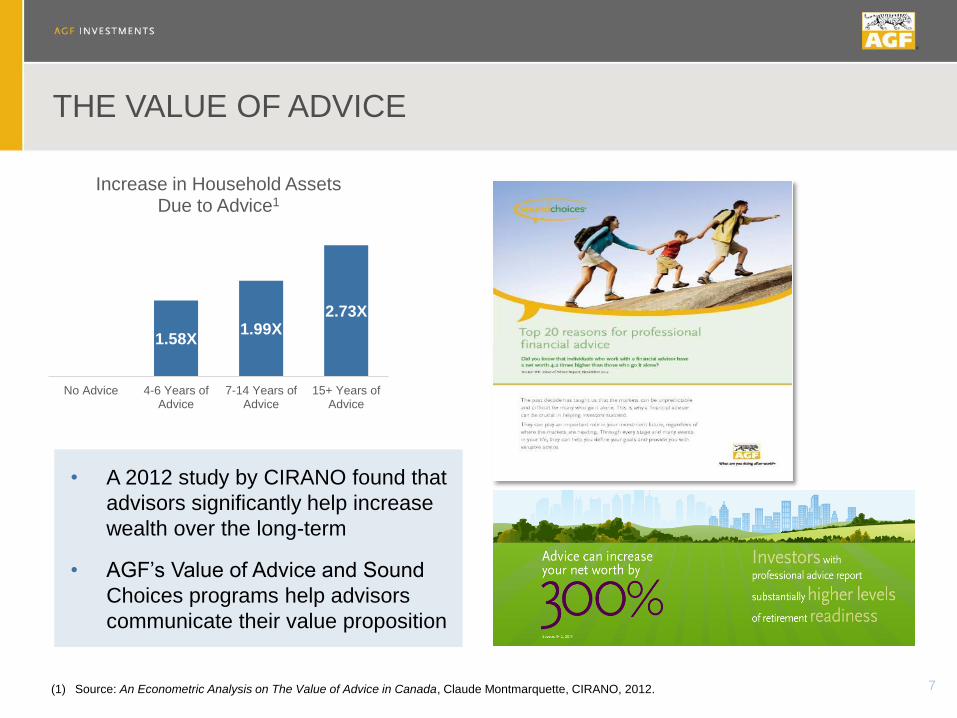
1.58X1.99X
2.73X
No Advice 4-6 Years ofAdvice
7-14 Years ofAdvice
15+ Years ofAdvice
Increase in Household Assets Due to Advice1
• A 2012 study by CIRANO found that
advisors significantly help increase
wealth over the long-term
• AGF’s Value of Advice and Sound
Choices programs help advisors
communicate their value proposition
(1) Source: An Econometric Analysis on The Value of Advice in Canada, Claude Montmarquette, CIRANO, 2012.
INVESTMENT TEAMS & PERFORMANCE
8
• Capabilities aligned well with market opportunity
• Infrastructure adds “high demand” strategy
• Strategy by strategy review is complete
• Goal is to sustain improvement in investment performance
Process and risk management work to
sustain improvement in investment performance
INSTITUTIONAL BUSINESS REVIEW & PIPELINE
9
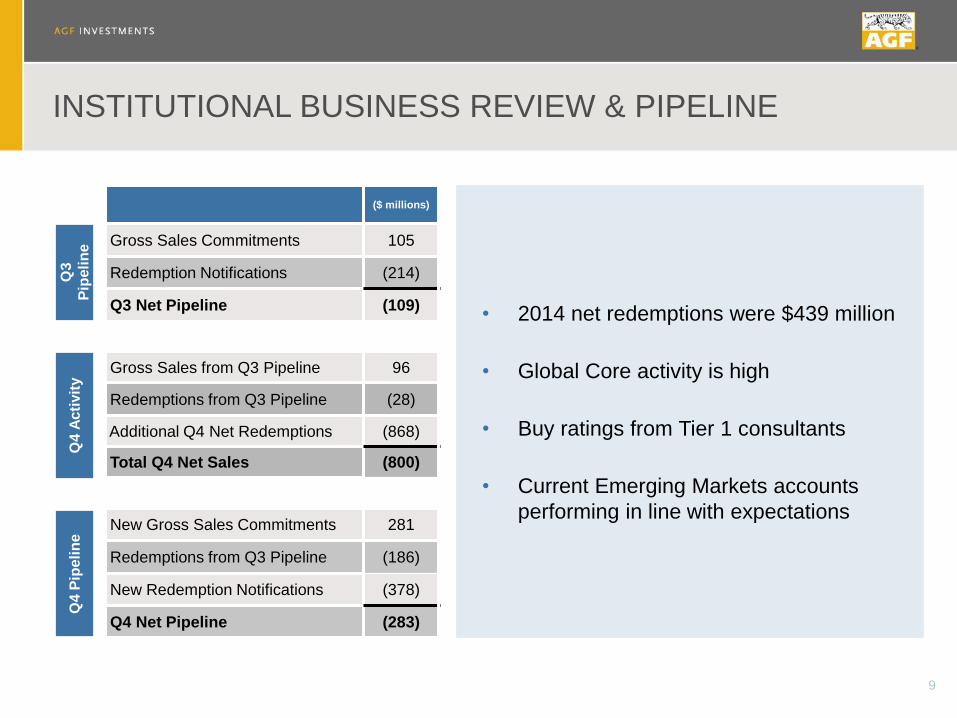
($ millions)
Gross Sales Commitments 105
Redemption Notifications (214)
Q3 Net Pipeline (109)
Gross Sales from Q3 Pipeline 96
Redemptions from Q3 Pipeline (28)
Additional Q4 Net Redemptions (868)
Total Q4 Net Sales (800)
New Gross Sales Commitments 281
Redemptions from Q3 Pipeline (186)
New Redemption Notifications (378)
Q4 Net Pipeline (283)
Q3
Pip
eli
ne
Q4
Pip
eli
ne
Q4
Ac
tivit
y
• 2014 net redemptions were $439 million
• Global Core activity is high
• Buy ratings from Tier 1 consultants
• Current Emerging Markets accounts
performing in line with expectations
INSTARAGF’S PROGRESS
10
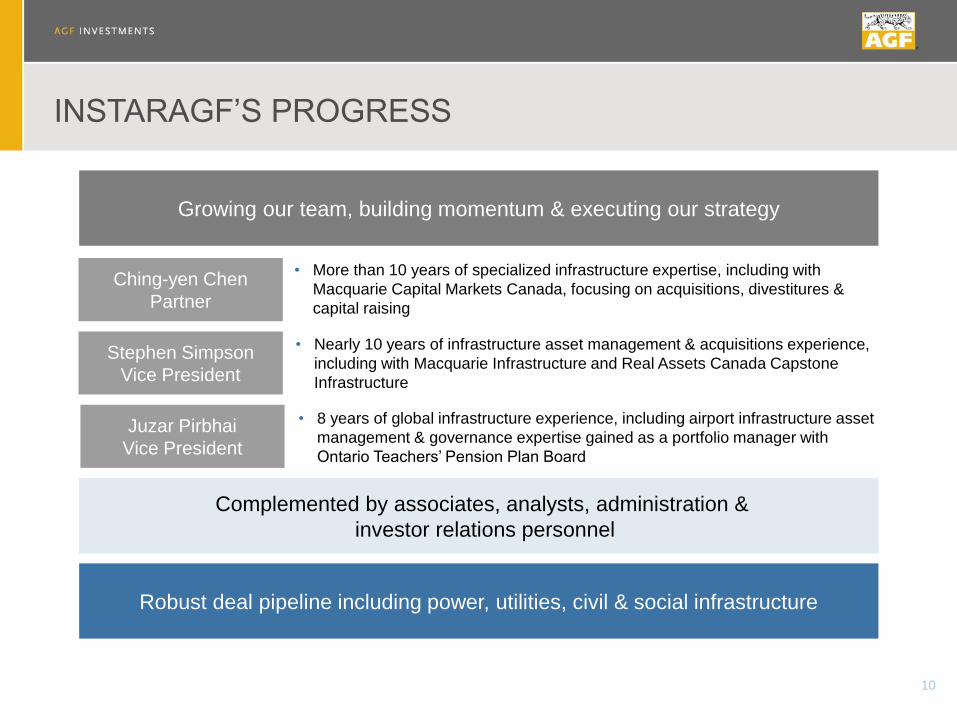
Growing our team, building momentum & executing our strategy
Ching-yen Chen
Partner
Stephen Simpson
Vice President
Juzar Pirbhai
Vice President
• More than 10 years of specialized infrastructure expertise, including with
Macquarie Capital Markets Canada, focusing on acquisitions, divestitures &
capital raising
• Nearly 10 years of infrastructure asset management & acquisitions experience,
including with Macquarie Infrastructure and Real Assets Canada Capstone
Infrastructure
• 8 years of global infrastructure experience, including airport infrastructure asset
management & governance expertise gained as a portfolio manager with
Ontario Teachers’ Pension Plan Board
Complemented by associates, analysts, administration &
investor relations personnel
Robust deal pipeline including power, utilities, civil & social infrastructure
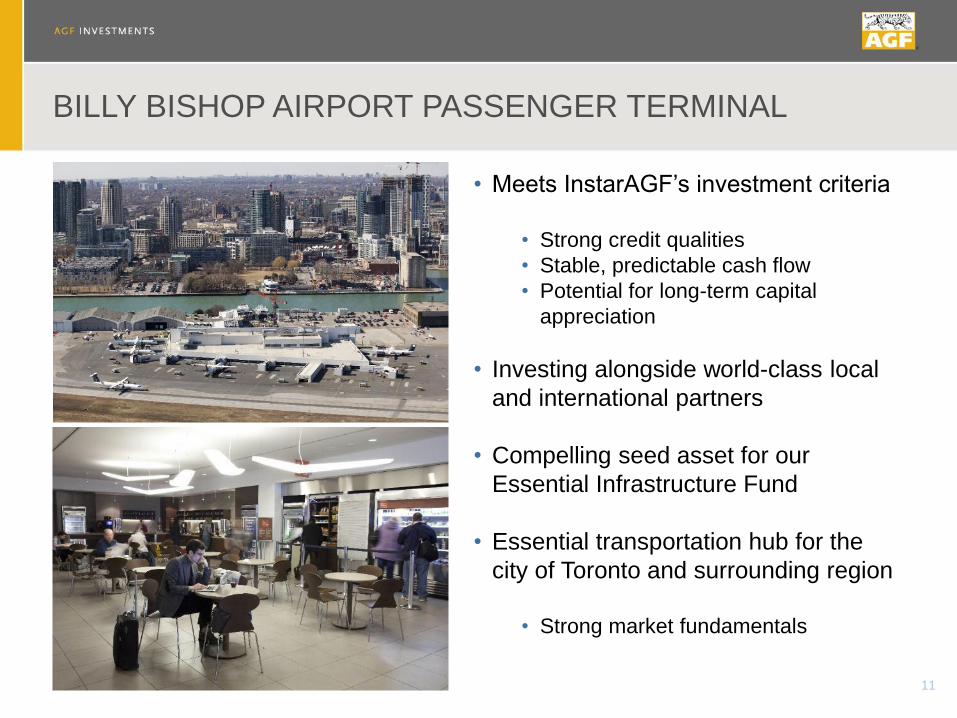
BILLY BISHOP AIRPORT PASSENGER TERMINAL
11
• Meets InstarAGF’s investment criteria
• Strong credit qualities
• Stable, predictable cash flow
• Potential for long-term capital
appreciation
• Investing alongside world-class local
and international partners
• Compelling seed asset for our
Essential Infrastructure Fund
• Essential transportation hub for the
city of Toronto and surrounding region
• Strong market fundamentals
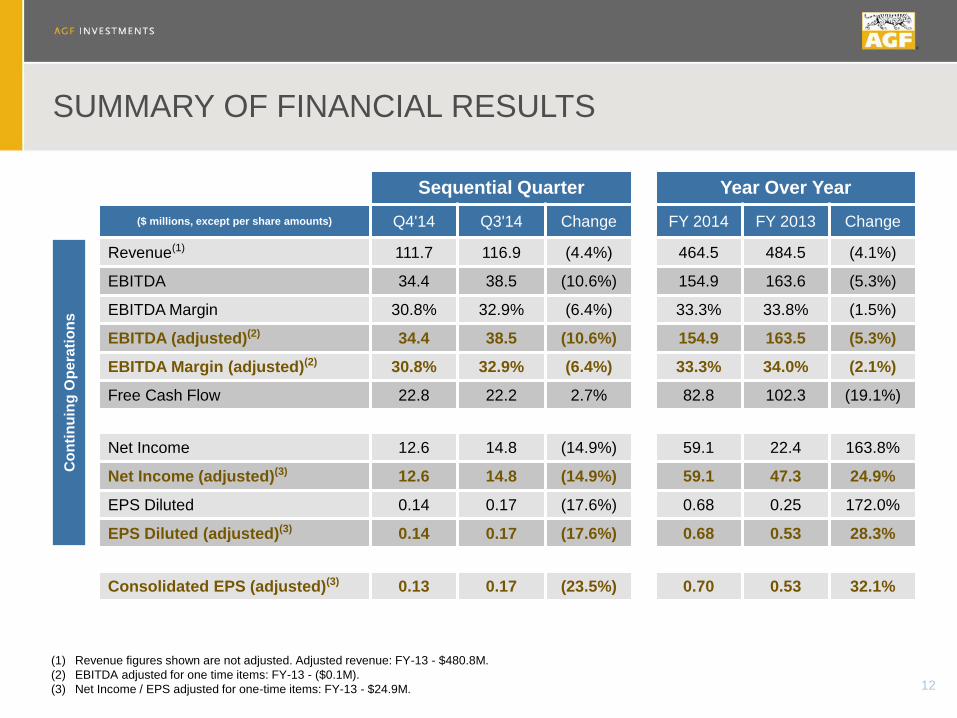
SUMMARY OF FINANCIAL RESULTS
12
Sequential Quarter Year Over Year
($ millions, except per share amounts) Q4'14 Q3'14 Change FY 2014 FY 2013 Change
Revenue(1) 111.7 116.9 (4.4%) 464.5 484.5 (4.1%)
EBITDA 34.4 38.5 (10.6%) 154.9 163.6 (5.3%)
EBITDA Margin 30.8% 32.9% (6.4%) 33.3% 33.8% (1.5%)
EBITDA (adjusted)(2) 34.4 38.5 (10.6%) 154.9 163.5 (5.3%)
EBITDA Margin (adjusted)(2) 30.8% 32.9% (6.4%) 33.3% 34.0% (2.1%)
Free Cash Flow 22.8 22.2 2.7% 82.8 102.3 (19.1%)
Net Income 12.6 14.8 (14.9%) 59.1 22.4 163.8%
Net Income (adjusted)(3) 12.6 14.8 (14.9%) 59.1 47.3 24.9%
EPS Diluted 0.14 0.17 (17.6%) 0.68 0.25 172.0%
EPS Diluted (adjusted)(3) 0.14 0.17 (17.6%) 0.68 0.53 28.3%
Consolidated EPS (adjusted)(3) 0.13 0.17 (23.5%) 0.70 0.53 32.1%
Co
nti
nu
ing
Op
era
tio
ns
(1) Revenue figures shown are not adjusted. Adjusted revenue: FY-13 - $480.8M.
(2) EBITDA adjusted for one time items: FY-13 - ($0.1M).
(3) Net Income / EPS adjusted for one-time items: FY-13 - $24.9M.
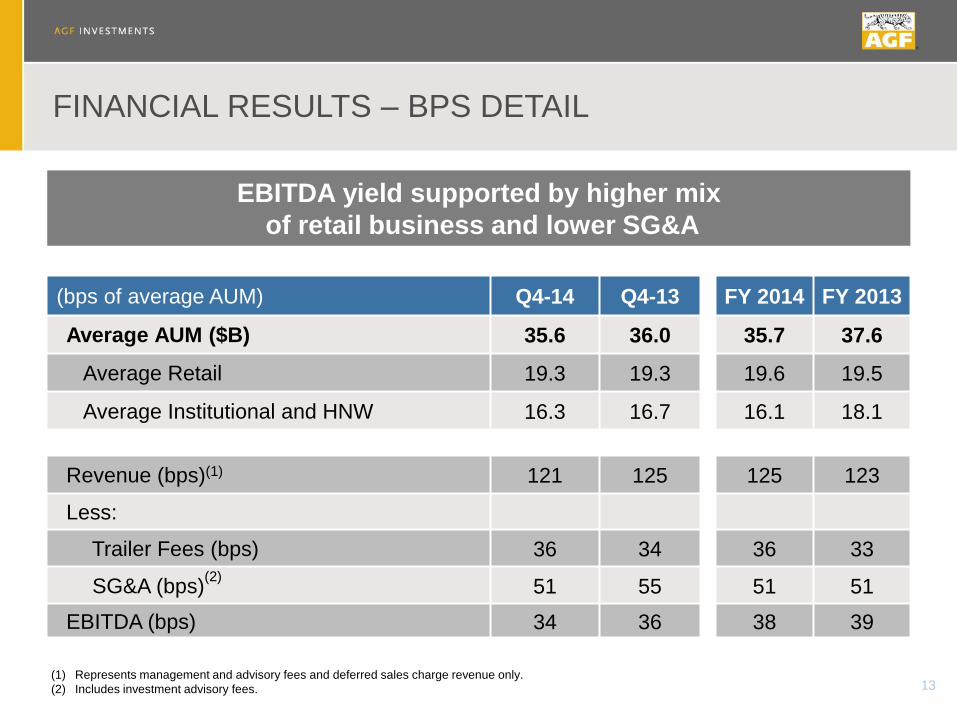
FINANCIAL RESULTS – BPS DETAIL
13
(bps of average AUM) Q4-14 Q4-13 FY 2014 FY 2013
Average AUM ($B) 35.6 36.0 35.7 37.6
Average Retail 19.3 19.3 19.6 19.5
Average Institutional and HNW 16.3 16.7 16.1 18.1
Revenue (bps)(1) 121 125 125 123
Less:
Trailer Fees (bps) 36 34 36 33
SG&A (bps)(2)
51 55 51 51
EBITDA (bps) 34 36 38 39
EBITDA yield supported by higher mix
of retail business and lower SG&A
(1) Represents management and advisory fees and deferred sales charge revenue only.
(2) Includes investment advisory fees.
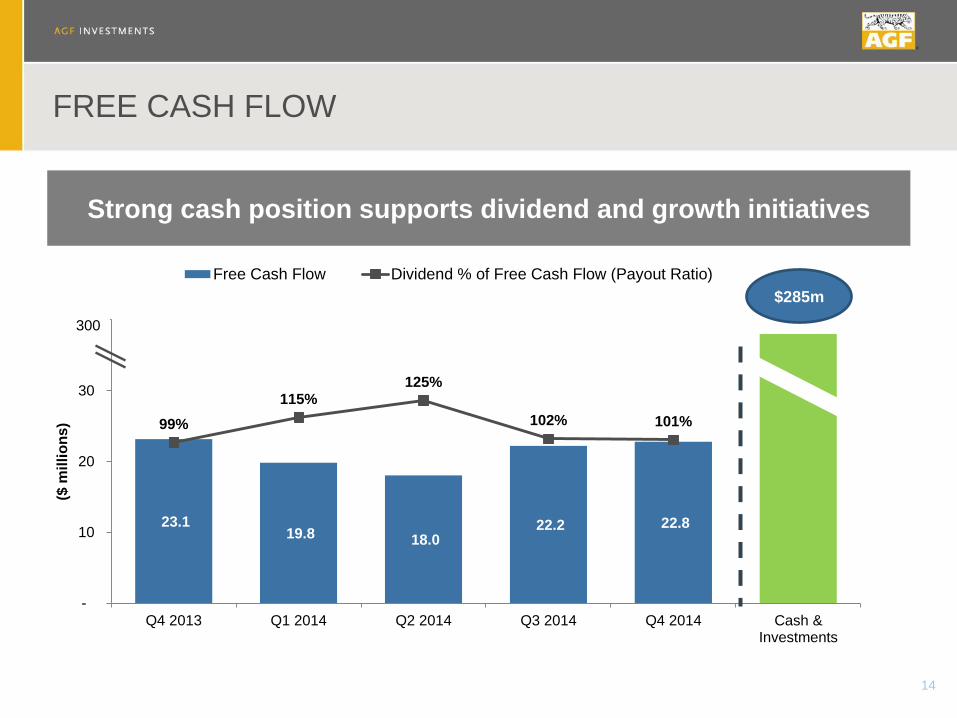
23.1 19.8 18.0
22.2 22.8
99%
115%125%
102% 101%
-
10
20
30
40
Q4 2013 Q1 2014 Q2 2014 Q3 2014 Q4 2014 Cash &Investments
($ m
illi
on
s)
Free Cash Flow Dividend % of Free Cash Flow (Payout Ratio)
FREE CASH FLOW
14
$285m
300
Strong cash position supports dividend and growth initiatives
2015 FOCUS & PRIORITIES
15
• Key Execution Points
− Investment performance improvement
− Retail product platform development
− Launch core infrastructure fund
Focus on sustaining investment performance improvement

QUESTIONS