Embed Size (px)
Citation preview
1
Aging Prison Demographics: A Study of the Ticking Time Bomb that is the North Carolina Prison System
By Sydney Johnson
Senior Honors Thesis
University of North Carolina at Chapel Hill
April 3rd, 2020
Approved:
________________________________ Dr. Frank Baumgartner, Thesis Advisor
________________________________
Dr. Isaac Unah, Reader
________________________________ Professor Carmen M. Gutierrez, Reader

2
Table of Contents
Chapter 1: Introduction (pg. 3-4)
Chapter 2: Literature Review (pg. 4-13)
Ø Policy in the Dark
Ø History of Sentencing
Ø Aging Prison Populations
Chapter 3: Data Collection and Methods (pg. 14-17)
Chapter 4: Results (pg. 17-21)
Chapter 5: Discussion (pg. 21-22)
Chapter 6: Conclusion (pg. 22-23)
Tables and Figures (pg. 24-37)
References (pg. 38-40)
3
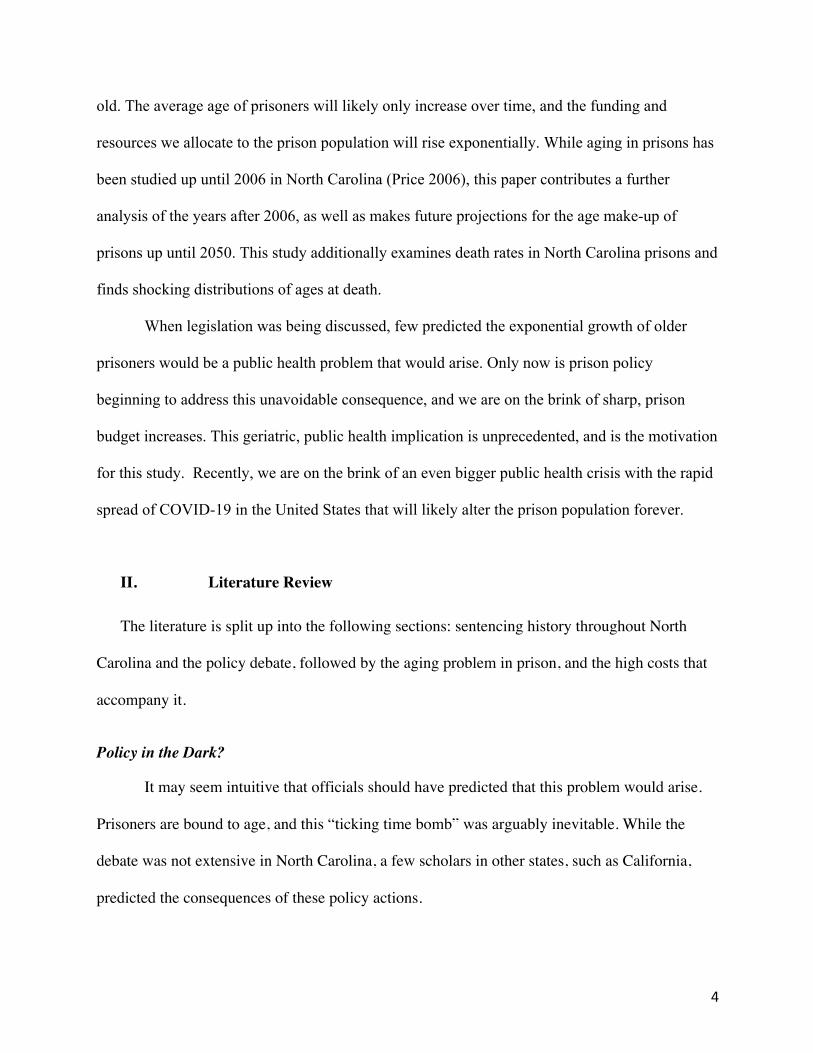
I. Introduction
I am interested in studying the following research question:
To what extent have harsh on crime policies changed the aging demographic of
prisoners? What age distribution can we expect in regard to the future?
In an era of an aging prison population as a result of past strict sentencing in the state of
North Carolina, it is important to examine both older inmates that are disproportionately
sentenced to long prison terms, as well as projected age distributions.
It is challenging to define what exactly is a “long prison term,” as well as what
constitutes an “older inmate.” A longer prison term, for the purposes of this study, is a sentence
of over 50 years. This includes life sentences, life without parole sentences, and death sentences.
Additionally, there are a number of inmates who are not explicitly set to serve a life sentence, but
have instead been sentenced to anywhere between 100 and 800 years. Harsh on crime policy
defined how we sentenced in the 1990s, with several crimes warranting life sentences or
sentences disproportionately longer than their punishment in modern day. Geriatric is another
term that can have many different definitions. Some studies calculate old age as 50 or over,
whereas others consider old to be defined at over 65 years. This begs the question: how many
people are incarcerated for crimes that no longer warrant life sentences? In what sense do these
people, at their older age, still constitute a legitimate threat to society? While prison has always
been termed a “young man’s game,” the average prisoner is not so young anymore.
The mean age of those serving a life sentence in North Carolina is 51.5. Upon closer
look at the database, there are people like Darine Bennett, who was convicted in 1979 at the age
of 19 to life in prison on an armed robbery charge. He is now 59 years old. Robert L. Smallwood
was convicted of first degree burglary in 1993, and is serving a life sentence. He is now 67 years
4
old. The average age of prisoners will likely only increase over time, and the funding and
resources we allocate to the prison population will rise exponentially. While aging in prisons has
been studied up until 2006 in North Carolina (Price 2006), this paper contributes a further
analysis of the years after 2006, as well as makes future projections for the age make-up of
prisons up until 2050. This study additionally examines death rates in North Carolina prisons and
finds shocking distributions of ages at death.
When legislation was being discussed, few predicted the exponential growth of older
prisoners would be a public health problem that would arise. Only now is prison policy
beginning to address this unavoidable consequence, and we are on the brink of sharp, prison
budget increases. This geriatric, public health implication is unprecedented, and is the motivation
for this study. Recently, we are on the brink of an even bigger public health crisis with the rapid
spread of COVID-19 in the United States that will likely alter the prison population forever.
II. Literature Review
The literature is split up into the following sections: sentencing history throughout North
Carolina and the policy debate, followed by the aging problem in prison, and the high costs that
accompany it.
Policy in the Dark?
It may seem intuitive that officials should have predicted that this problem would arise.
Prisoners are bound to age, and this “ticking time bomb” was arguably inevitable. While the
debate was not extensive in North Carolina, a few scholars in other states, such as California,
predicted the consequences of these policy actions.
5
Joe D. Whitely of the Federal Sentencing Reporter, predicted in 1994 that three strike
laws would produce more harm than good. He notes, “the ultimate result is that a great deal of
money and jail space will be spent to incarcerate people who are medically and physically no
longer a threat instead of using those resources to incarcerate people who are” (Whitley 1994).
Similarly, Jerry Zrenski of Buffalo News expected that “eventually, states would have to build
costly ‘geriatric prisons’-in essence, nursing homes with bars’” (Whitley 1994). Clearly, there
was some concern, but it was not at the top of the policy agenda.
The Deseret News Publishing Company, also ahead of its time in 1997, published an
article addressing geriatric concerns within prisons in the state of Utah. As of December 24th,
1997, there were 185 prisoners aged 55 or over. Several of these older prisoners, they noted,
were not eligible for release because they were incarcerated for sexual offenses. Donaldson, the
staff writer at Deseret News, spoke with a director of corrections in Utah that admitted that the
aging of inmates was something they would inevitably need to address. “One of the things
officials are considering is a geriatric section. That’s a concept many inmates support. One
inmate who asked not to be identified said elderly inmates are easy prey for young prisoners”
(Donaldson 1997). A few other articles were published during the time of stricter prison policy
action, including a case study on 25 elderly offenders conducted in 1992 (Aday 1994). These
offenders were interviewed on aging in prison, as well as their thoughts on dying in prison. One
notes, “I would prefer to fall dead in the street rather than die in prison… If I had to spend the
rest of my life in prison that would bring suicide quick… I would either kill myself or get in a
fight and let the other fellow do it” (Adday 1994). They also worried about their health
deteriorating and a lack of adequate response to their health needs. This was in 1992, when there
were far less elderly inmates in prison in comparison to today. While studies existed that
6
examined this issue, and predicted that the problem would deteriorate, policies hindering this
growth were not enacted. To better understand the policies that have created this dilemma, it is
important to have an extensive background on the history of sentencing in North Carolina.
History of Sentencing
Sentencing in North Carolina has had a complicated history, and has been debated
extensively. There are three key moments in North Carolina sentencing that have affected what
crimes receive certain punishments. The first sentencing period of importance occurs before the
1980s, before the Fair Sentencing Act that was developed in 1981.
North Carolina was experiencing rapid growth in its prison population due to a
significant spike in crime rates and drug offenses. Several sentences were found to suffer from
extreme disparities and there was a lack of standard for judges to rule upon. Instead, judges had
discretion in sentencing and often chose to impose longer prison terms. In 1974, North Carolina
was ranked as the state with the highest per capita imprisonment rate (Freeman 2009). In
reaction to this booming prison population and the inability for its resources to catch up, North
Carolina established the Fair Sentencing Act which set both minimum and maximum sentences
for crimes. The judge then had discretion to sentence anywhere between the presumptive
(default) and maximum sentence based upon the existence of mitigating and aggravating factors,
but could not sentence outside these limits. The maximum charge for a C level felony was 50
years or life imprisonment and/or a fine, whereas the presumptive sentence was between 7.25
and 15 years (Freeman 2009). Clearly this difference is drastic; while setting maximum and
presumptive terms could be perceived as giving judges guidelines, judges still had a large
amount of discretion under this act. With more people going to prison, the population was once
again overcrowded, resulting in credit being awarded for good behavior. If an inmate had 30
7
days of good behavior, their sentence would be shortened by 30 days. To combat inmates being
released early, judges began imposing sentences closer to the maximum sentence, and 46 percent
of felony sentences were set above the presumptive level (Freeman 2009). Fair Sentencing also
allowed judges to have discretion in deciding the punishment for offenders under the age of 21.
In this case, if a young offender is not convicted of a capital or mandatory life sentence, they can
either be classified as a “committed youthful offender” with parole eligibility, or a regular felon
without the possibility of parole (Freeman 2009). Additionally, the judge has the ability to decide
if a term should be consecutive or concurrent, and is not required to give a reason for this
decision (Freeman 2009).
With judges sentencing closer to maximum charges, prison systems became
overcrowded, there were not nearly enough beds, and a federal takeover of the North Carolina
prison system was on the horizon. The overall growing size of prisons and an inability to ensure
truth in sentencing called for the creation of the Special Committee on Prisons in December of
1985 (Freeman 2009). The first solution that the committee looked to was a prison cap on the
population, however this backfired with several violent inmates being released on parole just
because of the need to minimize the prison population. Judges reacted in frustration by handing
out longer sentences (Freeman 2009). The Special Committee planned to increase money spent
for construction and expansion of prisons and prison beds. Struggling to find a solution to the
North Carolina prison dilemma, another committee, the North Carolina Sentencing and Policy
Advisory Commission, was created in July 1990. The Commission was then divided into four
subcommittees: classifying offense structures, defendant structures, dispositional
recommendations, and durational recommendations (Freeman 2009). These committees worked
to collectively create Structured Sentencing.
8
The committee cited four key goals for sentencing in their development of Structured
Sentencing. First, the committee wanted to ensure that sentencing policies were consistent and
certain, minimizing disparities between offenders who committed similar crimes. Second, it was
important that sentence length imposed and sentence length served align. Third, the committee
thought that the most violent, habitual offenders should have a place in jail over less violent
offenders and that space should be allocated accordingly. Finally, the committee called for more
resources to create prison space and community corrections programs (Freeman 2009). One of
the important factors in classifying certain offenses was the amount of harm that was caused.
Another was the intent to harm. Offenses were assigned to letters A through I, with A being the
most serious. Prior records were taken into consideration when handing out a sentence, including
the severity of the prior offenses. Once offenses were given a corresponding letter, sentence
durations were set. Unlike previously during the time of the Fair Sentencing Act, inmates could
no longer cut more than half the time off their sentences for good behavior. Inmates were granted
both a minimum and maximum sentence, and were required to serve, at least, the minimum
sentence (Freeman 2009). Structured Sentencing was created with prison capacity in mind, and
passed by the General Assembly at the end of the 1993 session. However, with a spike in crime
in the 1990s, Governor Jim Hunt grew concerned and ordered a Special Crime Session in the
General Assembly to toughen punishments (Freeman 2009).
This Special Crime Session was held in 1994, and several stricter policies were enacted
(Freeman 2009). After over 30 days in the Session, 28 new bills were passed to Structured
Sentencing. These included the decision to build more prison beds, and raised the sentence
duration for first-degree rape and first-degree sex offense crimes. These crimes could warrant a
life without parole sentence for inmates. Additionally, life without parole sentences in the case of
9
first-degree murder were created. Sentence durations for B2, C, and D level felonies increased by
33 percent (Freeman 2009). Consequently, offenders sentenced under the time of Structured
Sentencing received harsher punishments for sex offenses than they may receive today.
Aging Prison Populations
With inmates sentenced decades ago to harsher punishments as a result of “hard on crime
sentiment,” we now see the gradual aging of these offenders, and the subsequent rise in costs.
Aging incarcerated individuals are now the “fastest growing demographic in the US prison
system” (Skarupski 2018). The number of inmates over 65 in federal and state prisons increased
63 percent between 2007 and 2010. Additionally, this study found that the number of inmates
over 55 grew by 282 percent between 1995 and 2010. Roughly ten percent of state prisoners are
incarcerated under a life sentence (HRW 2012). A different study found that inmates age 50 and
over make up 16 percent of the national prison population (ACLU 2012). This study suggests
that nationally, they expect one third of the prison population to be over 55 by 2030 (ACLU
2012).
These older inmates are experiencing more chronic diseases. Several suffer from
cardiovascular diseases, arthritis, psychiatric conditions, and more. Many inmates noted that
their health had deteriorated since entering prison (Loeb 2006). Some of these older inmates
have become so accustomed to life behind bars that they would struggle to acclimate to the
outside world. John Phillips is 85 years old and has been in prison since he was eighteen. While
he maintains his innocence, and exhibits a below-standards IQ level, he does not want to leave
where he has spent the past 66 years of his life (Neff 2019). He will likely die in prison. This is
not an uncommon fate for several offenders nowadays. In Massachusetts, a state prison is now
10
increasing the size of its graveyard, addressing the fact that its prison population will only
continue to age (Burrell 2018). With a $1,000 charge for each burial, and the excessive medical
costs that accompany an older population, the state has begun to examine geriatric and medical
parole options (Burrell 2018). One inmate, George McGrath, is now 70 years old and is hoping
to receive medical parole. Convicted in 1969, he does not view himself as a threat to society
anymore. He notes, “prison is a young man’s game… obviously I’m not a young man anymore”
(Burrell 2018).
McGrath’s situation is not unique. In an effort to combat this emerging demographic and
extreme spending, policy makers from across the country have turned to expanding elderly
assistance in prisons and enacting geriatric parole. Several prisons do not have the resources to
take care of aging inmate populations, with one issue they cite being the need for bottom bunk
beds. Elderly inmates have a difficult time climbing up to the upper bunks (HRW 2012). In a
study by the Human Rights Watch that visited various prisons across the country, they found
that, “In every state we visited, for example, officials stressed the need to develop additional
assisted living care and skilled nursing care capacity to respond to the growing population of the
elderly” (HRW 2012). As of 2008, several states began to make serious changes to accommodate
an aging population. Thirteen had specific units for aging prisoners, six had separate prisons,
nine had medical facilities, and eight offered facilities for hospice (Chiu 2010). In Fishkill, a
prison in New York, there is a unit called the “Unit for the Cognitively Impaired” for elderly
inmates. The average age of the 24 inmates housed here is 62 (Ewing 2015). Comparatively,
eleven prisons in California have implemented the “gold coats” program, assigning healthy
inmates to geriatric inmates who need help with daily tasks (Ewing 2015). Connecticut created a
specific nursing home that would be for former inmates and parolees. It opened in 2013, but not
11
without some backlash from the community. Mike Lowler, involved in criminal justice planning
for Connecticut, noted that the department, “had a growing number of inmates who met skilled
nursing home level of care criteria and were eligible to be released, but couldn’t be released until
they could get a nursing home to take them” (Thompson 2014). When expanding elderly
assistance in prisons is not enough, states turn to geriatric release, yet its use has been largely
limited. As of late 2009, there were fifteen states that had developed geriatric release options
(Rafael 2010).
Despite states beginning to pass geriatric release provisions, geriatric parole is still a very
new phenomenon and was adopted in North Carolina within the last decade. Geriatric parole
differs in each state; in North Carolina, geriatric eligibility is defined as “age 65 or older and
suffering from a chronic infirmity, illness, or disease related to aging that has progressed such
that the prisoner is incapacitated to the extent he or she no longer poses a public safety risk”
(Markham 2014). Additionally, a prisoner is excluded from eligibility if they have a capital
felony, or Class A, B1, or B2 felonies, or if they have a rape, incest, or other sexual offense.
Usually, most prisoners are not eligible to even apply, but when they do, only few people receive
medical/geriatric parole (Markham 2014).
The procedure for receiving medical release appears to be somewhat convoluted.
According to the NC General Statutes Chapter 15A Article 84B, the Department must first refer
an inmate to the Commission for medical release. “The Department may base its referral upon
either a request of petition for release filed by the inmate, the inmate’s attorney, or the inmate’s
next of kin or upon a recommendation within the Department” (NC General Statutes). A licensed
physician will then perform an assessment of the inmate, which includes eligibility requirements
and future risk that the inmate could pose to society if released. To measure whether or not an
12
inmate poses a future safety risk, a forensic/correctional psychologist provides an assessment in
which they consider the “severity of the offense for which the inmate is incarcerated, the
inmate’s prison record, and the release plan” (2019 Medical Release Report). If the Department
finds that the inmate is eligible, they forward both the referral and a medical release plan to the
Commission. This referral includes medical information, psychological information, and the risk
assessment component. The Commission then has a deadline of fifteen to twenty days to make a
decision. If anything changes regarding the inmate’s medical condition, the Commission can
return the inmate to a revocation hearing (NC General Statutes).
The ambiguity and multi-step aspect of geriatric parole has led it to be relatively
unsuccessful within the state. In 2018, there were eleven inmates referred to and considered by
the Parole Commission. Seven of these inmates received early medical release, two were denied,
and two died before they received a decision from the Commission (2019 Medical Release
Report). In 2017, 79 inmates were considered for medical/geriatric parole by prisons, yet only 24
were referred to and considered by the Parole Commission. This means that while 79 inmates
were considered by either themselves, their legal staff, or medical personnel, only 24 were
determined to be referred to the Parole Commission by the Department of Corrections. Fifteen of
the 24 were released, seven were denied, and two died before they received a decision from the
Commission (2018 Medical Release Report). If denied release, “the inmate may not reapply or
be reconsidered unless there is a demonstrated change in the inmate’s medical condition”
(Section III-Early Medical Release).
North Carolina, much like the other states previously mentioned, has instead sought out
ways to accommodate the growing aging population through expansion of facilities.
13
Central Prison in North Carolina created a new, long-term care facility for inmates with
chronic diseases. This facility is 32,930 square feet and cost six million dollars. It will be able to
house 92 inmates (Goldsmith 2019). However, what will happen once this demographic expands
even further? How many new facilities will we need to build and workers will we need to hire?
With this topic emerging several years after strict sentencing, it is now gaining more
momentum. Charlotte Price’s study, published in 2006, is similar in scope to my purposes. She
found that, as of 2006, approximately 56 percent of inmates over the age of 50 are convicted for
sex crimes (Price 2006). Her study was carried out at the request of the Director of Prisons in
2005 with the objective of planning how to respond to an aging population logistically. This
study is similar to mine in that it examines past prison populations, however, it does not have
data on more recent years. Additionally, I find some discrepancies between the exact number of
inmates age 50 and older from 1995 to 2005, however, the trend of a rapid increase in inmates
age 50 and older is evident in both cases.
By creating an age trajectory and examining trends in deaths in prison, we can better
understand what to expect from our North Carolina prison population in the future and how these
demographics will alter the way we sentence and allocate funds.
III. Data Collection and Methods
The analysis presented here draws from a database taken from the North Carolina
Department of Safety website, https://webapps.doc.state.nc.us/opi/downloads.do?method=view.
The file is titled “Inmate Profile” and has information on every inmate in North Carolina, along
with the year they were admitted, their crime, birth year and other descriptive information. From
there, I manipulated certain variables in order to be able to calculate who was in prison at what
14
exact time. For the purposes of this study, only inmates that were active and inactive were
examined, excluding those that were on parole.
First, in order to examine trends throughout history, I analyzed the age distribution of
inmates from 1980 to 2020. To do so, I determined the date of Admission, Exit Year, and
Projected Exit for currently active inmates. Admission Year was straightforward and already
coded as the year in which the inmate was admitted without manipulating the variable. In order
to determine Exit Year, I used the variable that explained the reason for the inmate’s last
movement, and assigned the year of last movement to be the Exit Year if the reason for last
movement involved leaving prison. For example, reasons for movement could be anything from
expiration of sentence, a new admission to a separate facility, death, execution, and more. If the
reason for movement was synonymous for leaving prison, I coded the year of this last movement
as the inmate’s exit year. Projected Exit was used for inmates that were admitted during or prior
to the year in question and are still active today. Projected Exit was coded as the variable that
was titled “Final Ruling Projected Release Date.” However, in cases of life sentences and death
row, the Final Ruling Projected Release Date was listed as 9999. In order to account for this, I
recoded Projected Exit for those with a life and death sentence as their Admission Year plus fifty
years.
After obtaining the Admission Year, Exit Year, and Projected Exit variables, I calculated
whether or not the inmate was active in 1980. For example, in 1980, if the inmate was currently
active, admitted to prison before 1981, and was projected to leave after 1979, InPrison1980 was
coded as 1. If the inmate was inactive, admitted to prison before 1981, and exited prison after
1979, they were coded as 1. I repeated this for every five-year increment up until 2020. Then I
determined the age of the inmate in each year by subtracting the inmate’s birth year from the
15
year in question. I made spike plots for each year’s population to show the distribution of the
number and age of inmates in said year. Next, I grouped inmates into various age groups, starting
from under 20 years old and going up in five-year increments all the way until over 80 years old.
These numbers were later used for calculating mean annual growth rates to project out into the
future.
In addition to graphing the age distribution at each increment, I calculated the age of those
incarcerated for life in prison in 1980 and 2020 to see how this number changed over the years.
Next, I calculated the age at death. Using the Exit Year variable, it could be deduced how many
people died in a given year by showing the Exit Year with the condition that their reason for
movement was death. If the inmate died in 1980, and their age in 1980 was 56, it could be
inferred that the age of death was also 56. I determined the distribution for age at death for each
five-year increment from 1980 to 2020. I also calculated the rate of deaths by dividing the
number of deaths per year by the total population that year. Then I showed the distribution of age
at death throughout time, comparing age at death between black inmates and white inmates. To
do so, I used the CICLRACE variable that depicted the inmate’s race and used it as a conditional
variable.
Next, to determine what percentage of the North Carolina prison population would be elderly
up until 2050, I used a mean annual growth rate to estimate the future, based on how the
population changed from past years. I made three separate projections: one of baseline change
from 1980 to 2020, smaller change from 2015 to 2020, and larger change from 2010 to 2015.
The period of 2005 to 2010 saw the biggest jump in inmates of over 50 years old, from 5,258 to
8,834. I did not use this rate because the mean annual growth rate slowed down substantially
from then. I calculated the mean annual growth rate by dividing the log of a population in one
16
year over the other divided by the difference in number of years, then using the current
population to start the linear progression. I showed three different projections in an effort to
show three different possibilities for the prison population in the future.
Once I determined these rates and projections, I calculated average costs per inmate based off
of the Aging in Prison Study conducted by Charlotte A. Price in 2006.
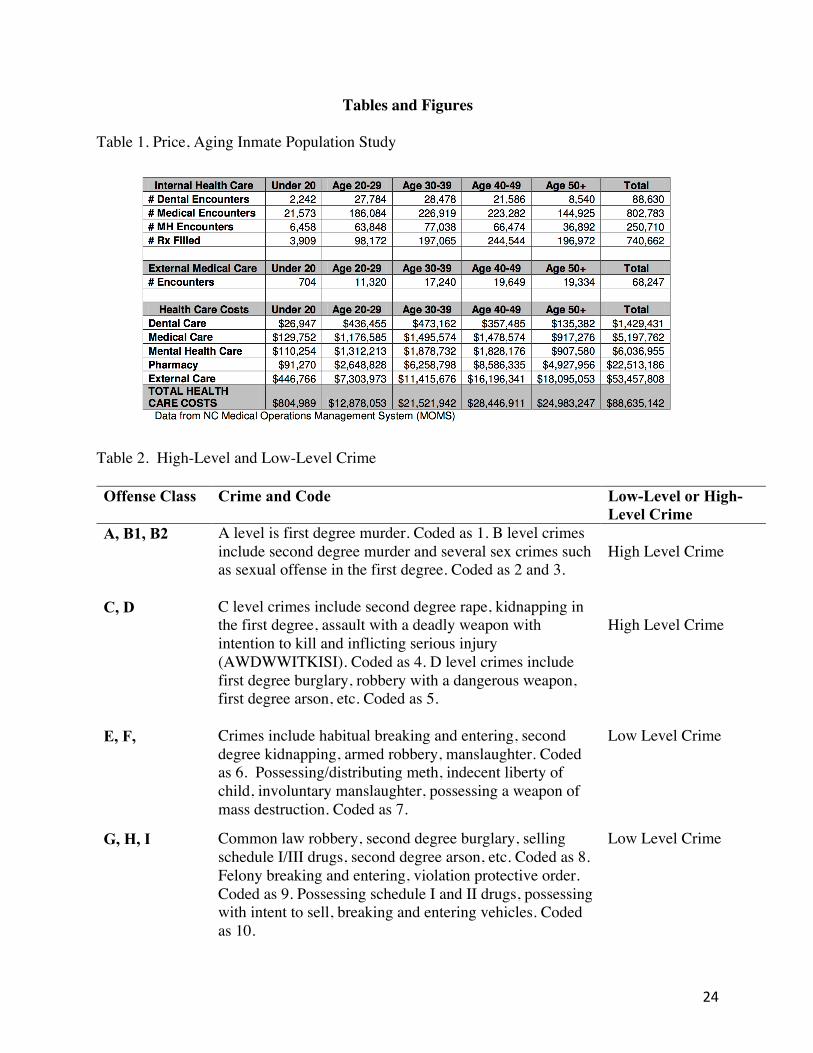
(Insert Table 1 about here)
With the estimated cost listed for each age group, this study was able to use the projected
population to approximate how health costs could increase in the future. It is important to note
that these numbers are merely estimates, and that the cost of healthcare for inmates likely has
changed drastically in North Carolina since 2006. The yearly total healthcare cost for inmates
over the age of 50 was $24,983,247, and the estimated yearly cost per inmate over the age of 50
was $7,159. It is important to note that this is merely an estimate, as costs changed over time
and some inmates may have more chronic conditions that require more money on healthcare than
others. The healthcare required for someone over the age of 80 is likely quite different than that
of a 50-year-old inmate. Because over 50 is all grouped together, I was unable to differentiate
between someone in their fifties from someone in their eighties. I used this cost per inmate
number to calculate the future expenses of the three different population projections. I multiplied
$7,159 by however many elderly prisoners there were expected to be in 2030, 2040, and 2050.
Another graph of interest was examining the age distribution of those convicted of higher
offense level crimes. I did this in an effort to determine how many elderly prisoners are currently
incarcerated for less serious charges. With the COVID-19 pandemic making its way into the
prison population, there has been a call for non-violent, elderly inmates to be released. In order
to determine whether or not the inmate committed a more serious crime, I created the variable
17
High-Level Crime. Looking at the crime the inmate committed, if the crime was of Offense
Levels 6-10, I coded the High-Level Crime variable as 0. If the offense level was Offense Levels
1-5, I coded the High-Level Crime variable as 1. There were several steps to classifying crimes
with offense levels.
I assigned crimes in the database to an offense level by using a spreadsheet on the North
Carolina Department of Justice site that lists the laws you can break in North Carolina and their
corresponding offense code and punishment class. I paired each felony crime with an Offense
Code, and then assigned each letter code to a corresponding number.
(Insert Table 2 about here)
Additionally, if the inmate was convicted of a misdemeanor crime, I coded High-Level
Crime as 0. Then I showed the age distribution for inmates convicted of a higher-level crime, as
well as those convicted of a lower level crime.
IV. Results
Past Age Distributions
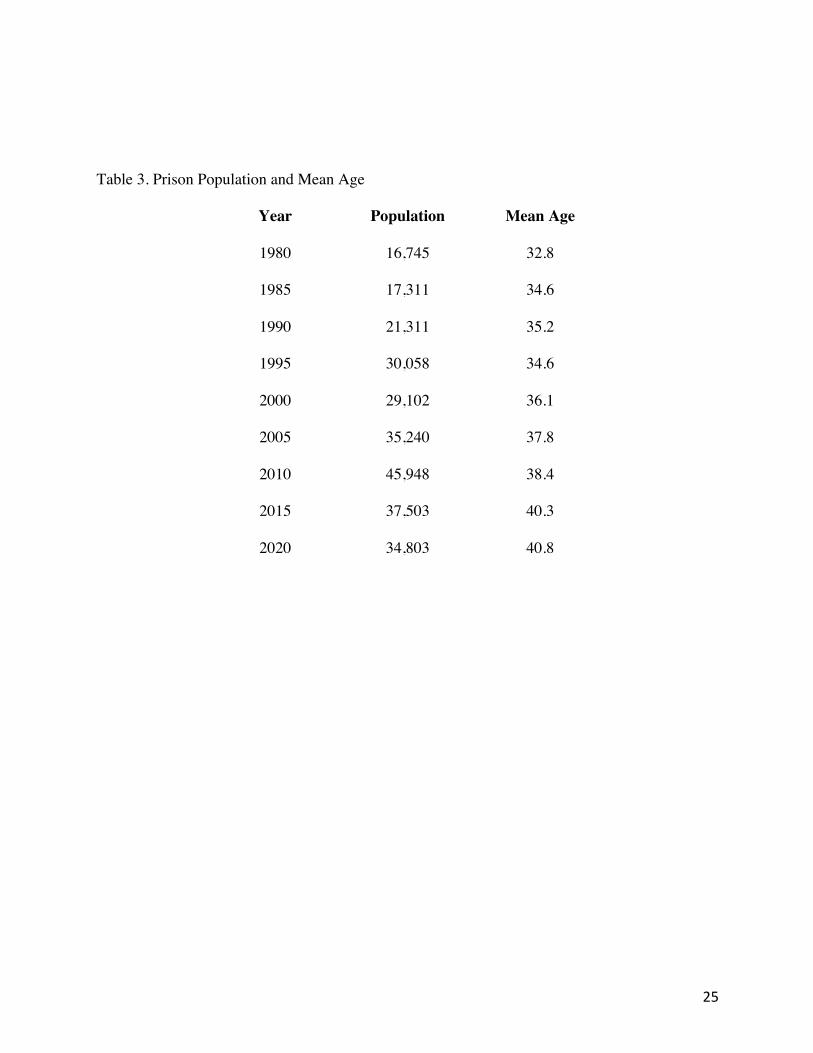
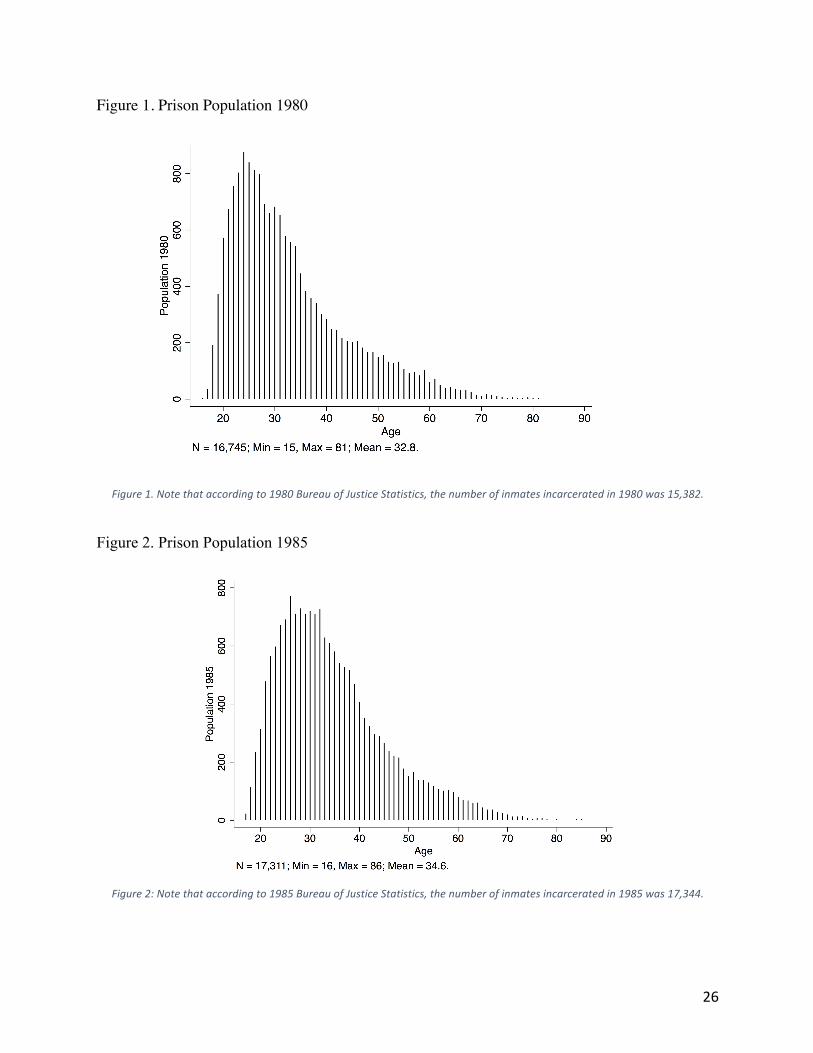
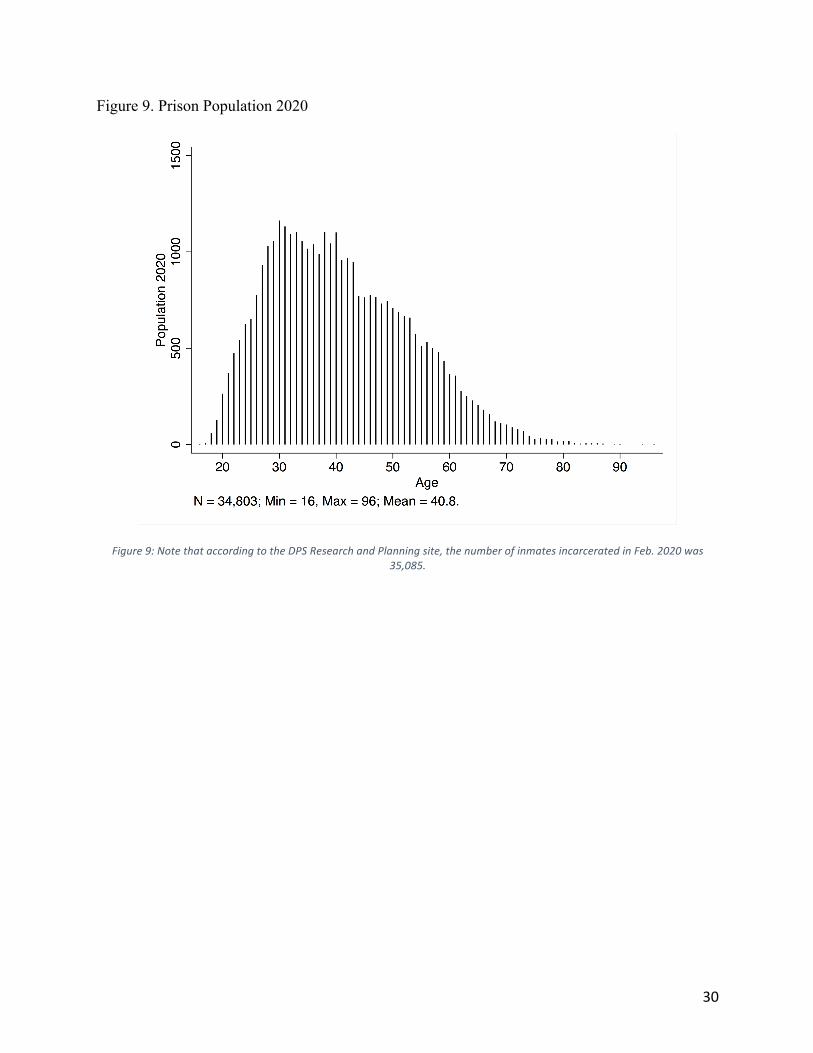
The mean age of those incarcerated in the state of North Carolina has clearly increased
over time. In 1980, the mean age was 32.8 years old. Today, we see that the mean age is 40.8 years
old. That is almost a ten-year increase. Notably, as time progresses from 1980 until 2020, the curve
shifts to the right, demonstrating that more and more inmates are aging in prison.
(Insert Table 3 and Figures 1-9 about here)
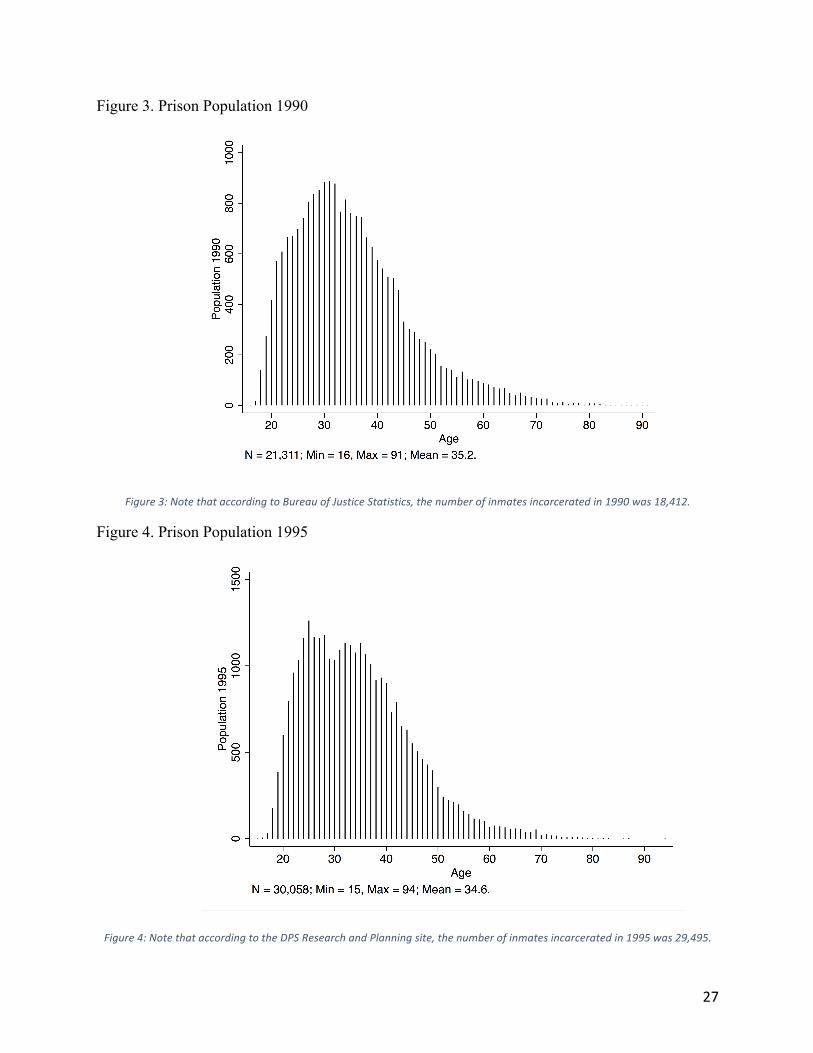
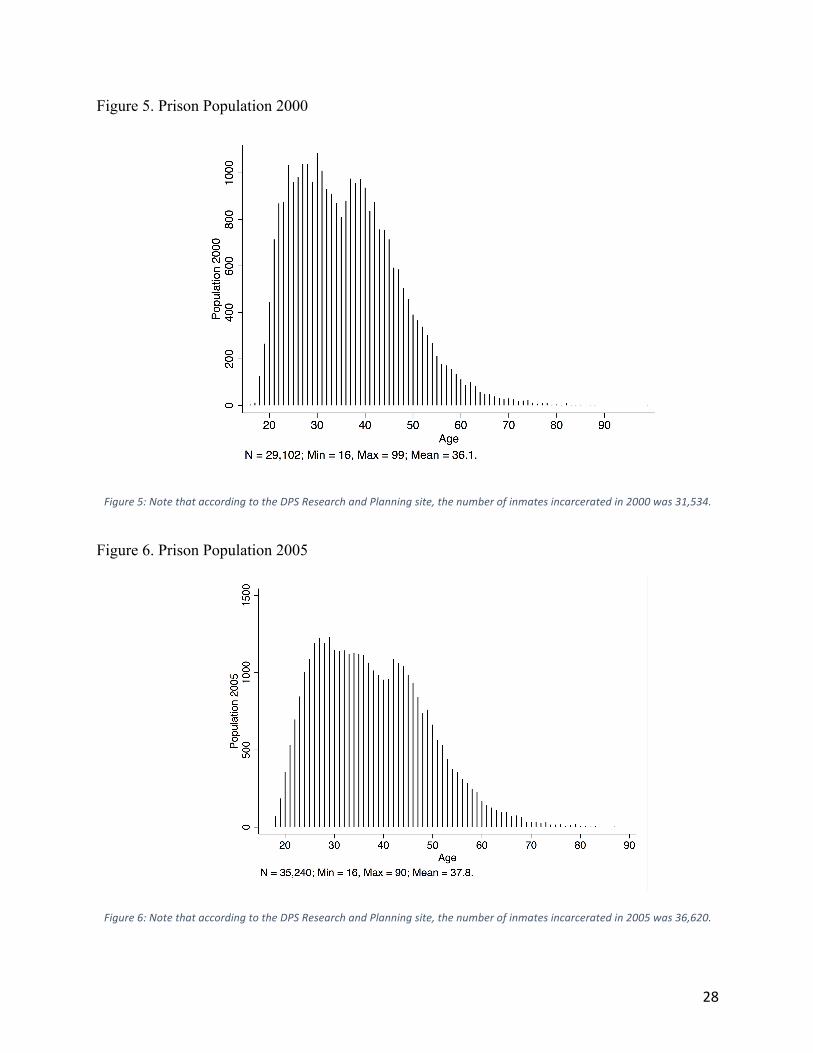
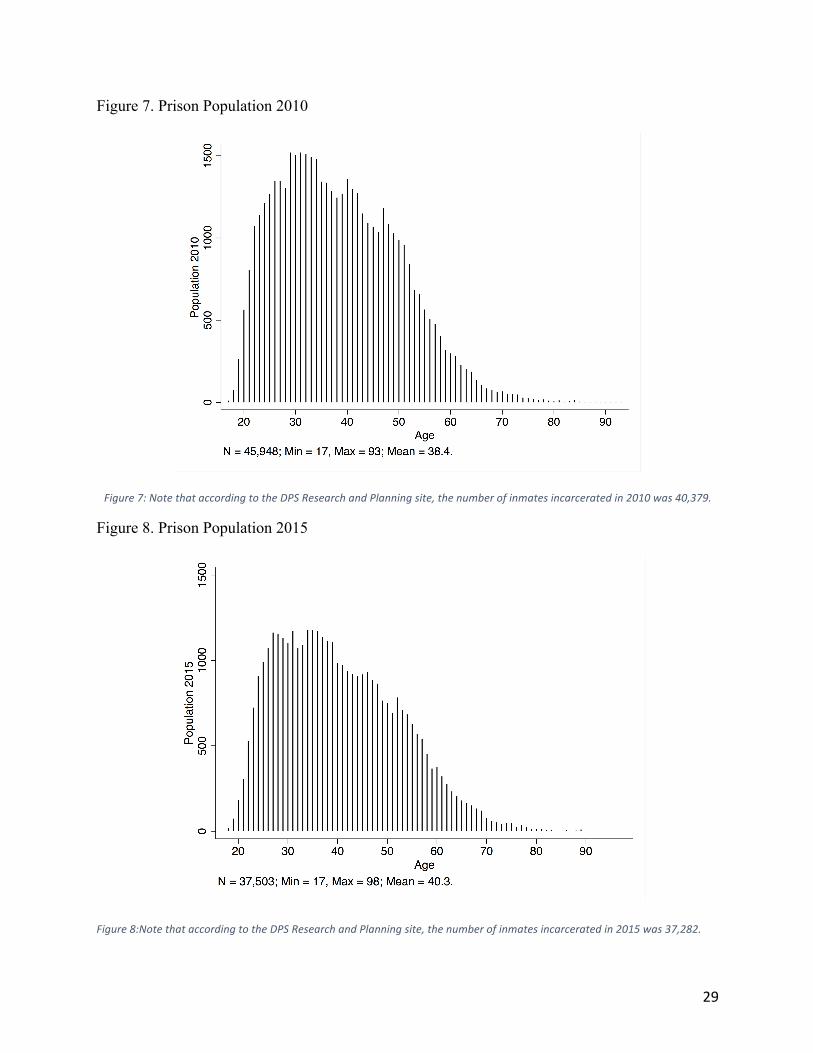
The figures below show the distributions of age for each year. While between 1980 and
1990 shows little substantial change, we can see that gradually the graphs begin to shift. There was
18
a spike in the overall prison population between 1990 and 1995, as well as the prison population
between 2005 and 2010. Overall, as the prison population expanded, we can see from these graphs
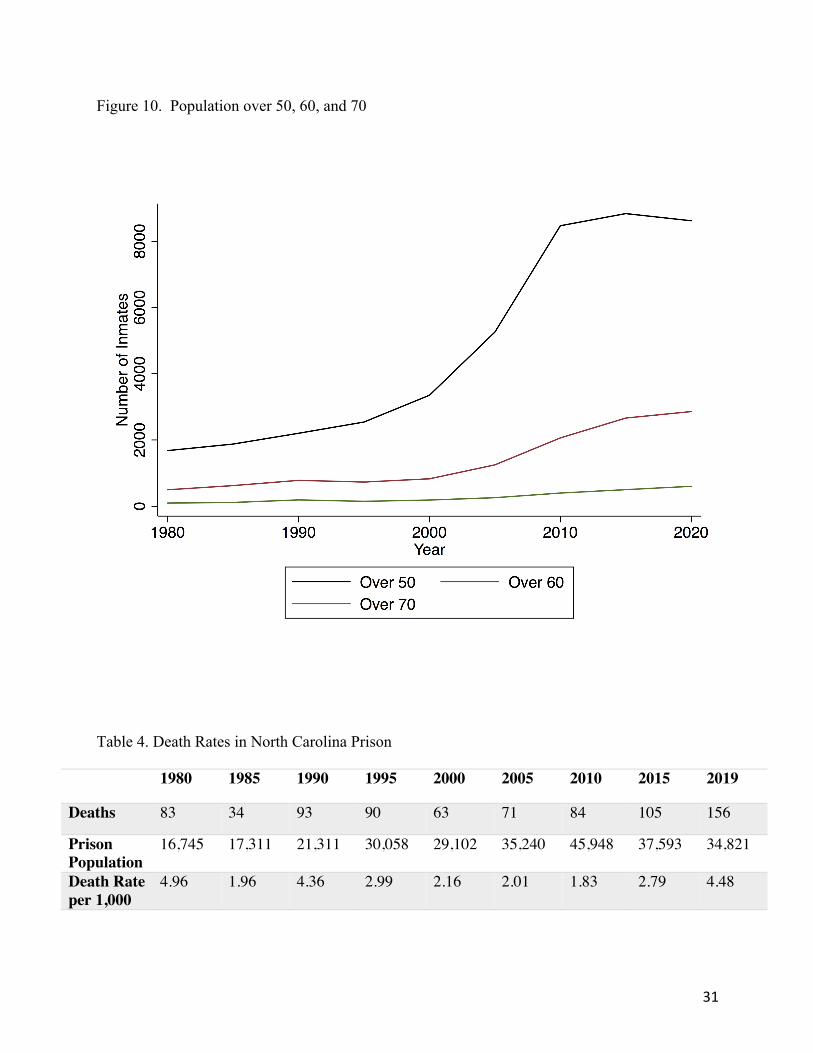
that the average age of inmate did as well. Figure 10 depicts the growth of inmates over 50, over
60, and over 70 from 1980 until 2020. There was a clear spike in the number of inmates over 50
between 2005 and 2010, leveling off more in recent years. Another interesting finding was the age
distribution of those serving a life sentence in 1980 versus those serving a life sentence in 2020.
While the mean age today for an inmate serving a life sentence is 51.5, the mean age in 1980 was
32.4.
(Insert Figure 10 about here)
Deaths in Prison
The age in which inmates die in prison was another important part of this study, because
as prisoners age, we can expect to see that deaths should increase as well, particularly in the
cohort of those over the age of 50. In North Carolina, there have been approximately 522
prisoners who have died in prison since 1954 while serving a life sentence, and 3,476 prisoners
in the regular prison population who have died while incarcerated. Thirty prisoners serving on
death row have died in prison rather than been executed. The overall death rate for each five-
year increment from 1980 until 2020 is shown in Table 4. While the initial expectation may be
that older inmates died more frequently than their younger counterparts, the distribution of those
who have died in prison over time is shockingly young when compared to the Center for Disease
Control’s U.S. mortality rate in 2010.
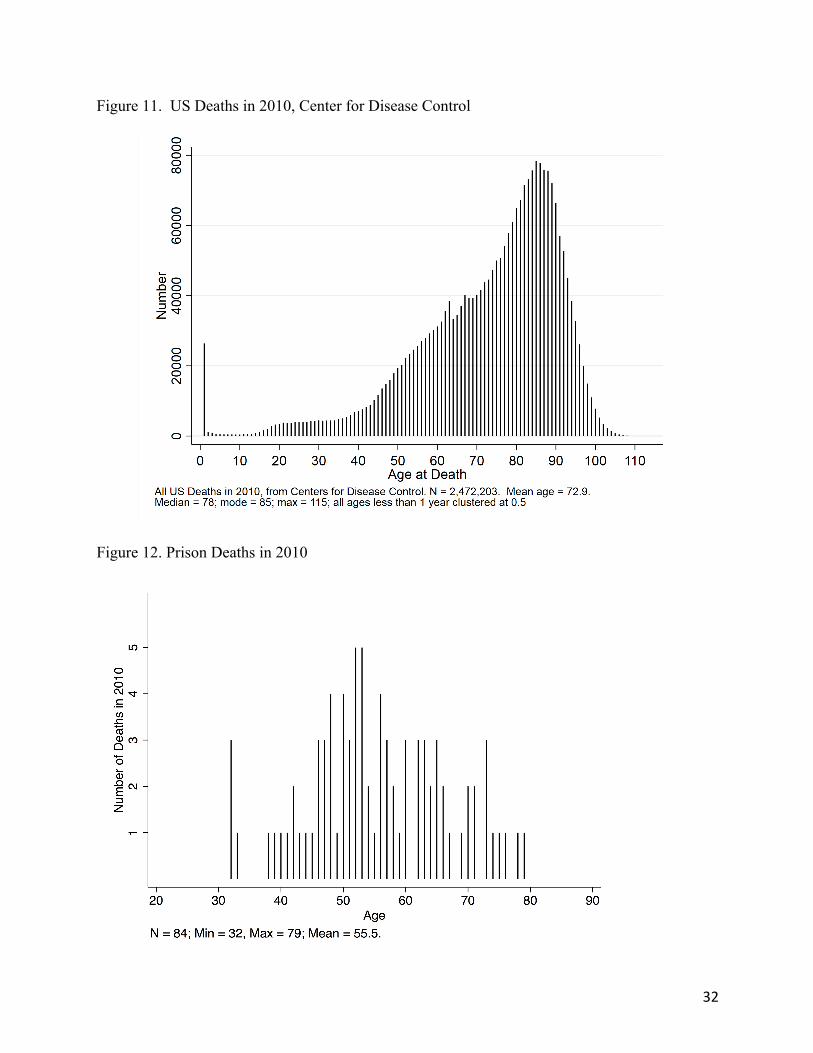
(Insert Table 4 Figures 11 and 12 about here)
Figures 11 and 12 both show numbers of deaths in 2010. When comparing, it is clear
that the two distributions vary drastically. The distribution of age of deaths in prison has no real
19
trend, and the overall mean age at death was 55.5 in 2010 in North Carolina prisons, compared to
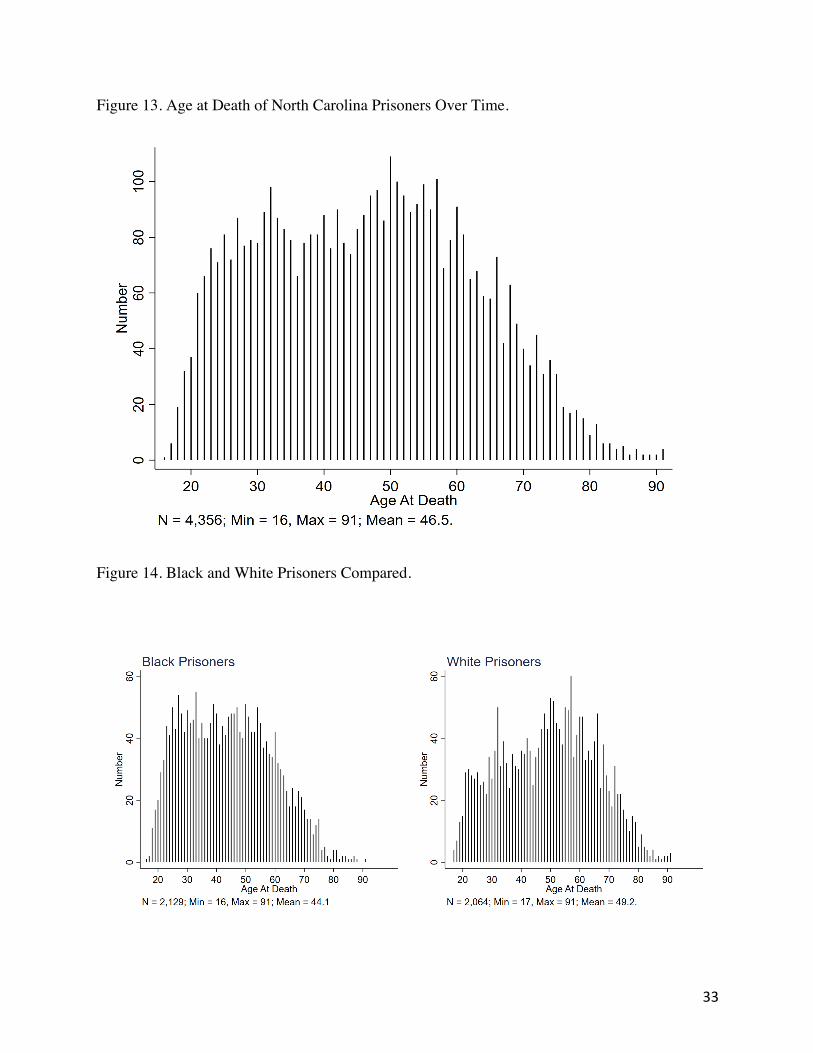
72.9 in the United States general population. Figure 13 looks at all of the deaths in the database
and the age when the inmate date, ranging from around 1973 to present day. Clearly, there is a
significant number of inmates dying over the age of 50. If the distribution of the age at death of
North Carolina prisoners is correct, and this many young people have died while in prison, this
speaks volumes about the healthcare that prisoners may receive. However, when looking to
compare age at death between races, the results are even more shocking.
(Insert Figures 13 and 14 about here)
The mean age of death for black prisoners is 44.1 years old, while the mean age for white
prisoners is 49.2 years old. The distributions also vary, with black prisoners more concentrated
towards the left dying at younger ages. Looking specifically at the age group of 20 to 40 years
old, we can see that more black prisoners are dying. These racial disparities in deaths in prison
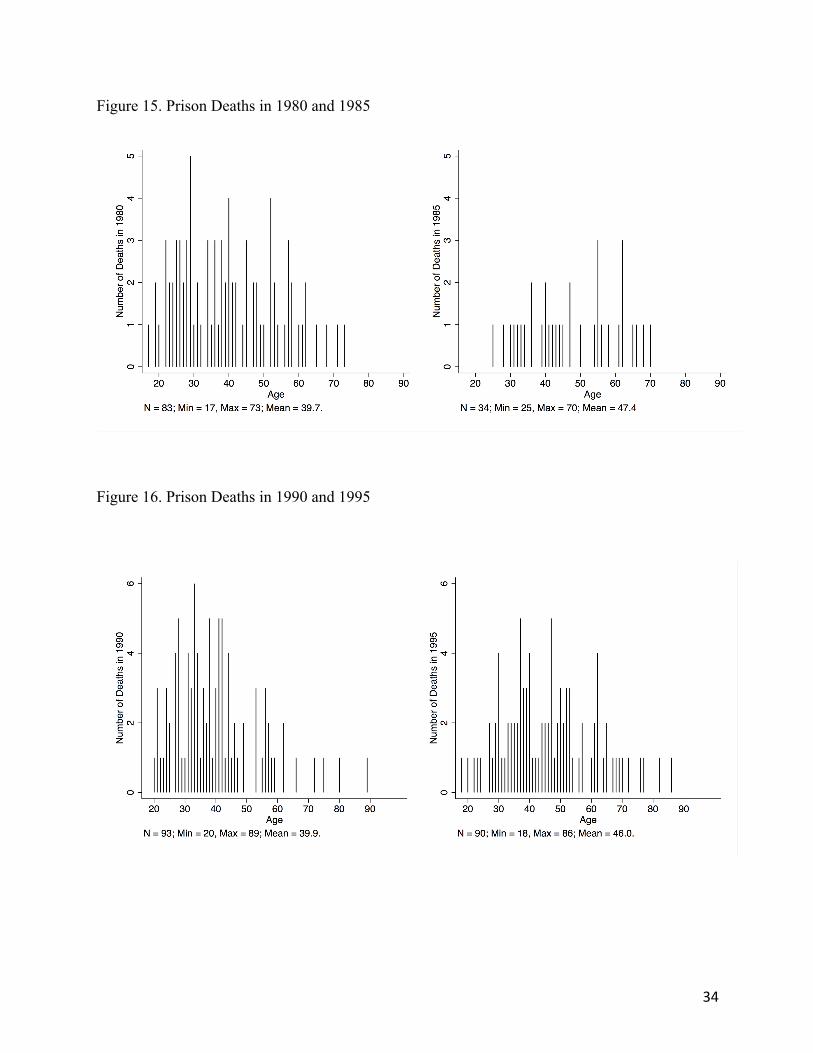
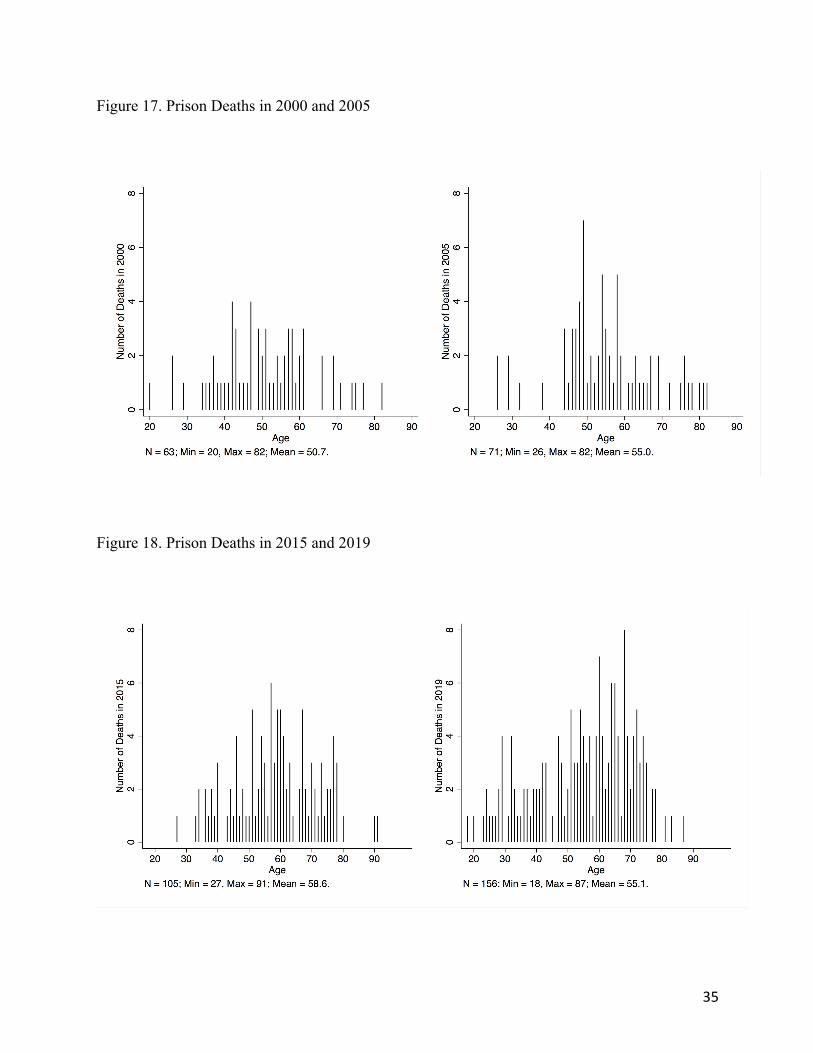
present a human rights concern. Figures 15 through 18 looked at the distribution of death from
1980 to 2020 in five year increments. When looking at deaths in prison in each of the years in
which the population distribution was examined, there seems to be some fluctuation. The overall
trend is that the average age at death, while fluctuating, increased over time from 1980 to present
day.
(Insert Figures 15-18 about here)
In 1980, there were 83 deaths and the average age was 39.7, whereas in 2019, 156
inmates died at an average age of 55.1 years old. In 1980, there were no prisoners dying over the
age of seventy, however, as time progresses, we see that more and more elderly prisoners are
showing up on the graphs. In North Carolina, of the 957 inmates that have died from 2015
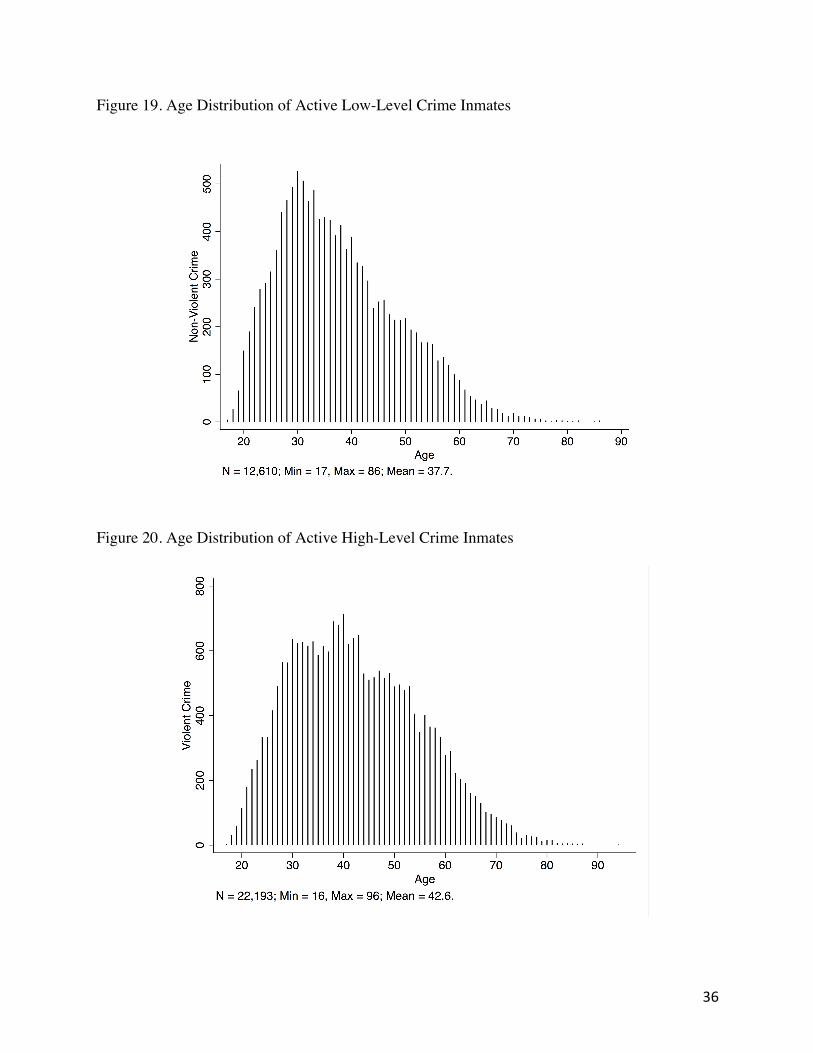
through 2020, roughly 57% were over the age of 50. Next, in Figure 19, we see the distribution
20
of ages of those convicted of a more serious crime versus those convicted of a less serious crime.
This was done in order to see, in regards to the recent COVID-19 situation and the call to release
inmates, which and how many inmates were aging and incarcerated for lower level crimes.
(Insert Figures 19 and 20 about here)
Of the 7,908 inmates over the age of 50, 1,877 are incarcerated for crimes of Offense
Levels 6-10 and misdemeanors. 6,031 are incarcerated for more serious/violent crimes, or
Crimes under Offense Levels 1-5. While the majority are incarcerated for Offense Level 1-5
crimes, roughly 24% are elderly and serving time for lower offense level crimes. This is still a
substantial amount. Figures 19 and 20 show the age distribution of those incarcerated for both
lower level and higher-level crimes.
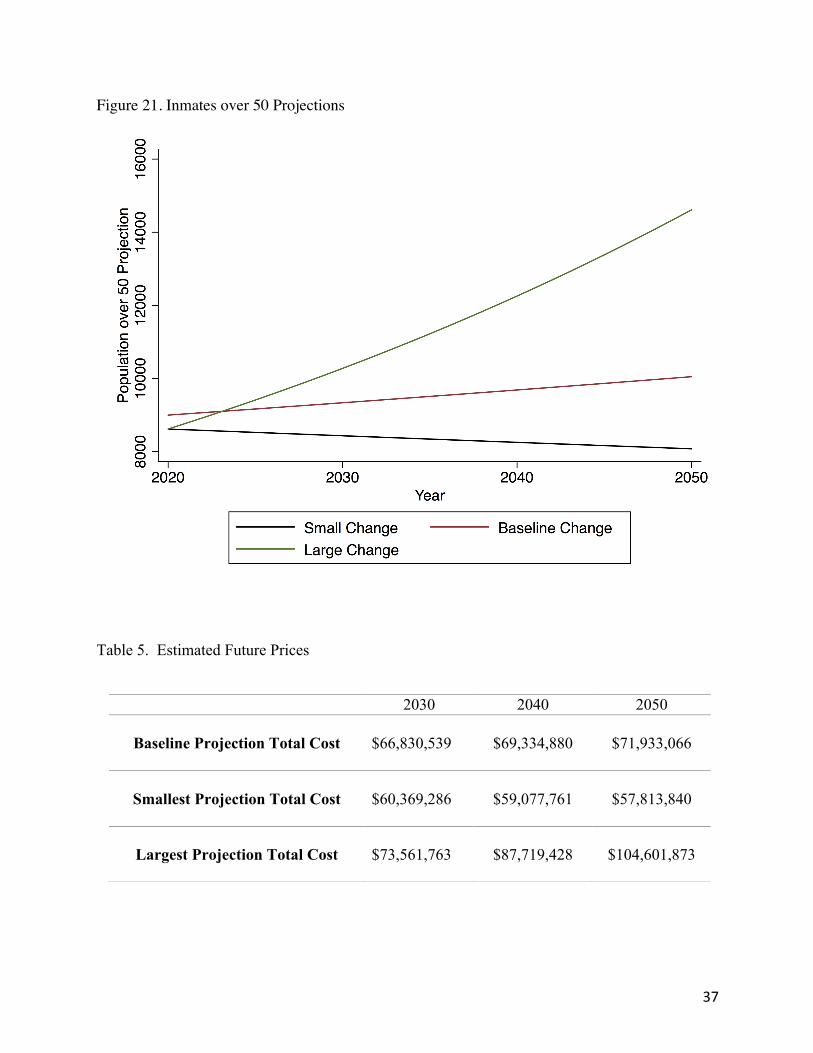
Finally, Figure 21 shows the projection of what we can expect the age group of inmates
over fifty to look like from 2020 up until 2050.
(Insert Figure 21 about here)
The larger change, from 2010 to 2015, is shown in green, and gives us an idea of what
the population over 50 could look like if the growth that occurred between that five-year
increment continued on into the future. The red line shows how the population over 50 would
increase if it increased at the increment it did between 1980 and 2020. Lastly, the blue line
predicts the population based off of the smaller change between 2015 and 2020. This depicts the
population dropping very slightly. It is hard to predict which of the three could be the most
accurate, and it is clear that there is lots of variation between them. However, the most crucial
takeaway from this figure is that the population over 50, even if it were to change how it recently
has from 2015 to 2020, will still stay significantly larger than it ever has been in the past. Table 5
shows the projected costs of healthcare for inmates over the age of 50 for all three projections.
21
(Insert Table 5 about here)
V. Discussion
This paper looked into aging patterns in the state of North Carolina up until 2020, as well as
examined deaths and made projections for what we can expect for future prison populations
within the state. It adds to the literature by examining the prison demographics of more recent
years, as well as lays the foundation for what aging demographics we can expect in the state in
the future. I find that the North Carolina prison system population has increased dramatically
throughout history, and that there has been substantial growth in elderly inmates as well. It is
important to note that during my coding of the population, my numbers differed from those given
in the Department of Safety Automated System Query. They varied in how much exactly they
differed, however none exceeded a difference of over 5,000. The discrepancies are noted below
each population figure. What is clear, despite discrepancies, is that the number of prisoners over
the age of 50, 60, and 70 has increased. Given what we know about structured sentencing and the
spike in prison populations, life sentences, and increases in sentence duration, this increase of
aging inmates makes sense.
Interestingly, the biggest jump for prisoners over the age of 50 occurred from 2005 to 2010.
When we think about how we began to sentence in 1994, this makes sense. Ten to fifteen years
after the fact, inmates are aging. A prisoner that committed a felony crime in 1994 could likely
be sentenced for longer, therefore aging within prison over the next ten to fifteen years. Clearly,
as the average inmate ages, the cost of housing these older inmates increases as well, as shown
by my projections. Even if the prison population changes at a small rate of that which it did
between 2015 and 2020, there will still be a large number of inmates aged 50 and over. Several
of these inmates are ineligible for geriatric parole because of the nature of their crime, and even
22
if they were eligible, it is given out so rarely and under specific circumstances that it cannot
make a real impact.
In this dataset, there are a number of limitations. For example, several of the data entries are
coded as merely question marks. I had to deduce what certain numbers meant, such as 9999
being coded for a life sentence, or some inmates missing birthdays. There is likely some data
entry error within this dataset as well as it is a large file that goes decades back in time.
However, the trend the data shows is clear: there are several elderly inmates in prison, and the
projections show that it will stay that way.
V1. Conclusion
This increase in aging in North Carolina prisons is clearly a human rights issue. There are
aging inmates serving life sentences for crimes such as burglary, kidnapping, or second-degree
murder. Prison is not designed for the elderly, nor is it equipped or prepared for the number of
elderly inmates it will likely have to take care of in the future. Now, there is especially a cause
for concern as we now face a global pandemic. Prisoners do not have the luxury to social
distance in their small, confined corridors. They also have worse health and suffer from more
chronic conditions than the general population, making them more susceptible to the COVID-19
virus. An elderly inmate will not have a chance against the virus if it infiltrates the prison system,
and this presents a moral question if they do not pose a risk in society anymore. The issue then
is, upon release, where will they go? With nursing homes reluctant to admit ex-prisoners and
limiting visitors, ex-inmates will not have a place to go.
It is likely that, as this virus spreads around the country, we will see more deaths in the prison
system. The concentration of elderly inmates dying has increased over time, and will continue to

23
do so. This is clearly an emerging human rights issue, and the growing elderly population in
prisons should be researched further.
24
Tables and Figures
Table 1. Price, Aging Inmate Population Study
Table 2. High-Level and Low-Level Crime
Offense Class Crime and Code Low-Level or High-Level Crime
A, B1, B2 A level is first degree murder. Coded as 1. B level crimes include second degree murder and several sex crimes such as sexual offense in the first degree. Coded as 2 and 3.
High Level Crime
C, D C level crimes include second degree rape, kidnapping in the first degree, assault with a deadly weapon with intention to kill and inflicting serious injury (AWDWWITKISI). Coded as 4. D level crimes include first degree burglary, robbery with a dangerous weapon, first degree arson, etc. Coded as 5.
High Level Crime
E, F, Crimes include habitual breaking and entering, second degree kidnapping, armed robbery, manslaughter. Coded as 6. Possessing/distributing meth, indecent liberty of child, involuntary manslaughter, possessing a weapon of mass destruction. Coded as 7.
Low Level Crime
G, H, I Common law robbery, second degree burglary, selling schedule I/III drugs, second degree arson, etc. Coded as 8. Felony breaking and entering, violation protective order. Coded as 9. Possessing schedule I and II drugs, possessing with intent to sell, breaking and entering vehicles. Coded as 10.
Low Level Crime
25
Table 3. Prison Population and Mean Age
Year Population Mean Age
1980 16,745 32.8
1985 17,311 34.6
1990 21,311 35.2
1995 30,058 34.6
2000 29,102 36.1
2005 35,240 37.8
2010 45,948 38.4
2015 37,503 40.3
2020 34,803 40.8
26
Figure 1. Prison Population 1980
Figure1.Notethataccordingto1980BureauofJusticeStatistics,thenumberofinmatesincarceratedin1980was15,382.
Figure 2. Prison Population 1985
Figure2:Notethataccordingto1985BureauofJusticeStatistics,thenumberofinmatesincarceratedin1985was17,344.
27
Figure 3. Prison Population 1990
Figure3:NotethataccordingtoBureauofJusticeStatistics,thenumberofinmatesincarceratedin1990was18,412.
Figure 4. Prison Population 1995
Figure4:NotethataccordingtotheDPSResearchandPlanningsite,thenumberofinmatesincarceratedin1995was29,495.
28
Figure 5. Prison Population 2000
Figure5:NotethataccordingtotheDPSResearchandPlanningsite,thenumberofinmatesincarceratedin2000was31,534.
Figure 6. Prison Population 2005
Figure6:NotethataccordingtotheDPSResearchandPlanningsite,thenumberofinmatesincarceratedin2005was36,620.
29
Figure 7. Prison Population 2010
Figure7:NotethataccordingtotheDPSResearchandPlanningsite,thenumberofinmatesincarceratedin2010was40,379.
Figure 8. Prison Population 2015
Figure8:NotethataccordingtotheDPSResearchandPlanningsite,thenumberofinmatesincarceratedin2015was37,282.
30
Figure 9. Prison Population 2020
Figure9:NotethataccordingtotheDPSResearchandPlanningsite,thenumberofinmatesincarceratedinFeb.2020was35,085.
31
Figure 10. Population over 50, 60, and 70
Table 4. Death Rates in North Carolina Prison
1980 1985 1990 1995 2000 2005 2010 2015 2019
Deaths 83 34 93 90 63 71 84 105 156
Prison Population
16,745 17,311 21,311 30,058 29,102 35,240 45,948 37,593 34,821
Death Rate per 1,000
4.96 1.96 4.36 2.99 2.16 2.01 1.83 2.79 4.48
32
Figure 11. US Deaths in 2010, Center for Disease Control
Figure 12. Prison Deaths in 2010
33
Figure 13. Age at Death of North Carolina Prisoners Over Time.
Figure 14. Black and White Prisoners Compared.
34
Figure 15. Prison Deaths in 1980 and 1985
Figure 16. Prison Deaths in 1990 and 1995
35
Figure 17. Prison Deaths in 2000 and 2005
Figure 18. Prison Deaths in 2015 and 2019
36
Figure 19. Age Distribution of Active Low-Level Crime Inmates
Figure 20. Age Distribution of Active High-Level Crime Inmates
37
Figure 21. Inmates over 50 Projections
Table 5. Estimated Future Prices
2030 2040 2050
Baseline Projection Total Cost
$66,830,539
$69,334,880
$71,933,066
Smallest Projection Total Cost
$60,369,286
$59,077,761
$57,813,840
Largest Projection Total Cost
$73,561,763
$87,719,428
$104,601,873
38
References
Aday, Ronald H. “Aging in Prison: A Case Study of New Elderly Offenders.” International Journal of Offender Therapy and Comparative Criminology, vol. 38, no. 1, (1994): doi:10.1177/0306624x9403800108.
A. S. Q. Select System, Department of Safety Research and Planning, webapps.doc.state.nc.us/apps/asqExt/ASQ.
American Civil Liberties Union. “At America's Expense: The Mass Incarceration of the Elderly.” American Civil Liberties Union, (June 2012): www.aclu.org/report/americas-expense-mass-incarceration-elderly
Burrell, Chris, and Jenifer McKim. “Tempering the Cost Of Aging, Dying In Prison With The Demands Of Justice.” NPR, NPR, Aug. 1, 2018. www.npr.org/2018/08/01/630515551/tempering-the-cost-of-aging-dying-in-prison-with-the-demands-of-justice.
Chiu, Tina, et al. “It's About Time.” Vera, (April 2010), www.vera.org/publications/its-about-time-aging-prisoners-increasing-costs-and-geriatric-release.
Donaldson, Amy. “Prisoners Grow Old Behind Bars.” Deseret News, Dec 24, 1997. Retrieved from: UNC Libraries Nexis Uni
Ewing, Maura. “When Prisons Need to Be More Like Nursing Homes.” The Marshall Project, Aug. 2017. www.themarshallproject.org/2015/08/27/when-prisons-need-to-be-more-like-nursing-homes.
Freeman, Lorrin. “The North Carolina Sentencing and Policy Advisory Commission: A History of Its Creation and Its Development of Structured Sentencing. .” North Carolina Sentencing and Policy Advisory Commission, 2009. www.nccourts.gov/assets/documents/publications/commission_history_aug2009.pdf?O7ZRQnnfMS8XX67WIOodhh7g8.UPWR3_.
Goldsmith, Thomas, and North Carolina Health News. “As NC Inmate Needs Persist, a $6 Million Long-Term Care Facility Sits Empty.” North Carolina Health News, Sept 16, 2019. www.northcarolinahealthnews.org/2019/09/16/central-prisons-long-term-care-facility-empty/.
39
Human Rights Watch. “Old Behind Bars: The Aging Prison Population in the United States” Human Rights Watch, (January 2012) https://www.hrw.org/sites/default/files/reports/usprisons0112webwcover_0.pdf
Loeb, Susan J., and Azza AbuDagga. “Health-Related Research on Older Inmates: An Integrative Review.” Wiley Online Library, John Wiley & Sons, Ltd, (Nov 2006) : onlinelibrary.wiley.com/doi/abs/10.1002/nur.20177.
“NC General Statutes, Article 84B medical release of inmates” https://www.ncleg.gov/EnactedLegislation/Statutes/PDF/ByArticle/Chapter_15A/Article_84B.pdf
Neff, Joseph. “At Home Behind Bars.” The Marshall Project, May 23, 2019. www.themarshallproject.org/2019/05/23/behind-bars-for-66-years.
Markham, Jamie. “Early Medical Release.” North Carolina Criminal Law Blog, January 8, 2014. https://nccriminallaw.sog.unc.edu/early-medical-release/
Price, Charlotte A. “Aging Inmate Population Study.” North Carolina Department of
Corrections Division of Provisions, May 2006. www.doc.state.nc.us/dop/Aging%20Study%20Report.pdf.
“Prisoners in 1980.” Bureau of Justice Statistics, www.bjs.gov/content/pub/pdf/p80.pdf.
“Prisoners in 1985.” Bureau of Justice Statistics, www.bjs.gov/content/pub/pdf/cpus85.pdf
Skarupski, Kimberly A. The Health of America’s Aging Prison Population (March 2018). https://academic.oup.com/epirev/article/40/1/157/49518412018 DOI 0.1093/epirev/mxx020

40
Thompson, Christie. “Ever Committed A Crime? Good Luck Finding A Place To Grow Old.” Think Progress, July 2014, thinkprogress.org/ever-committed-a-crime-good-luck-finding-a-place-to-grow-old-f5151341a095/.
Whitley, Joe D. “‘Three Strikes and You're out’: More Harm than Good.” Federal Sentencing Reporter, October, 1994,. DOI: 10.2307/20639748