Embed Size (px)
Citation preview
Agrarian Performance & Food PriceInflation in India: Pre- and Post-Economic Liberalisation
Article by: Sthanu R Nair & Leena Mary Eapen
Course : Indian Economy 2B.A. Hons Economics, Semester VI
Delhi University
Course Instructor:
Siddharth RathoreAssistant Professor
Economics Department, Gargi College
Siddharth Rathore
SPECIAL ARTICLE
Economic & Political Weekly EPW august 1, 2015 vol l no 31 49
Agrarian Performance and Food Price Inflation in IndiaPre- and Post-Economic Liberalisation
Sthanu R Nair, Leena Mary Eapen
The authors are thankful for valuable comments and suggestions from an anonymous referee of this journal and participants of seminars and conferences held at Central University of Kerala, IIM Calcutta, IIM Kozhikode, and the National Institute of Public Finance and Policy, New Delhi. The usual disclaimer applies.
Sthanu R Nair ([email protected]) and Leena Mary Eapen ([email protected]) are with the Indian Institute of Management, Kozhikode.
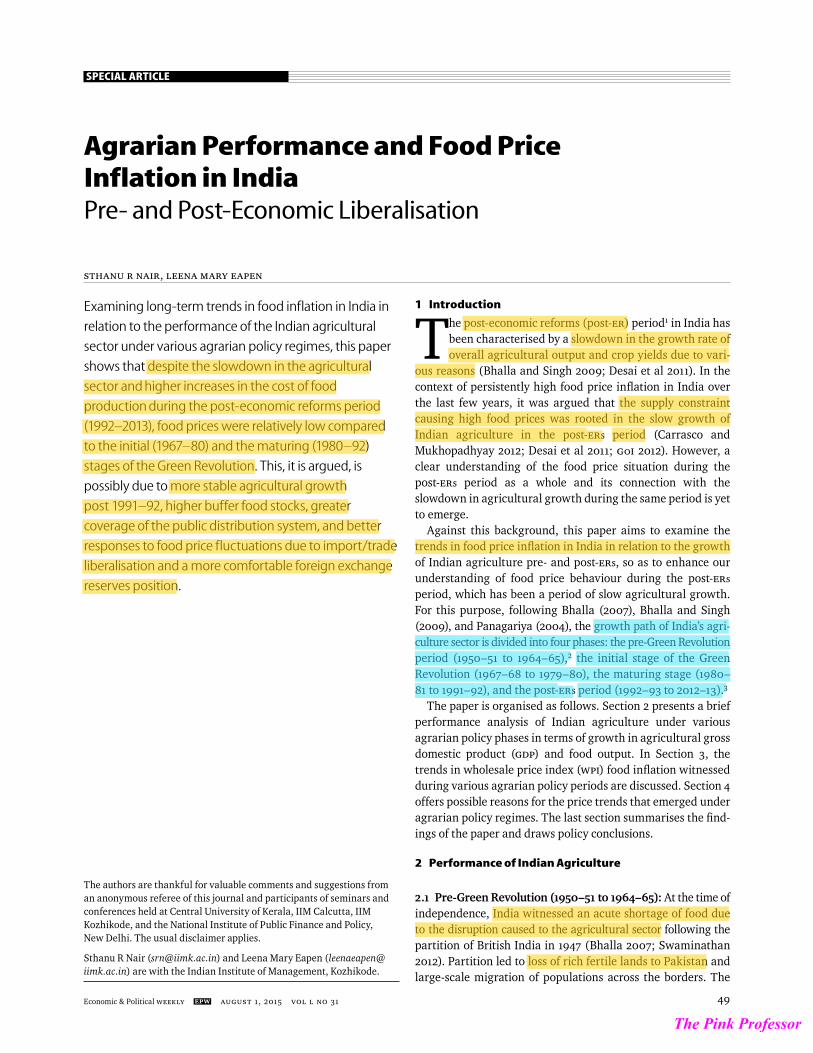
Examining long-term trends in food inflation in India in
relation to the performance of the Indian agricultural
sector under various agrarian policy regimes, this paper
shows that despite the slowdown in the agricultural
sector and higher increases in the cost of food
production during the post-economic reforms period
(1992–2013), food prices were relatively low compared
to the initial (1967–80) and the maturing (1980–92)
stages of the Green Revolution. This, it is argued, is
possibly due to more stable agricultural growth
post 1991–92, higher buffer food stocks, greater
coverage of the public distribution system, and better
responses to food price fluctuations due to import/trade
liberalisation and a more comfortable foreign exchange
reserves position.
1 Introduction
The post-economic reforms (post-ER) period1 in India has been characterised by a slowdown in the growth rate of overall agricultural output and crop yields due to vari-
ous reasons (Bhalla and Singh 2009; Desai et al 2011). In the context of persistently high food price infl ation in India over the last few years, it was argued that the supply constraint causing high food prices was rooted in the slow growth of Indian agriculture in the post-ERs period (Carrasco and Mukhopadhyay 2012; Desai et al 2011; GoI 2012). However, a clear understanding of the food price situation during the post-ERs period as a whole and its connection with the slowdown in agricultural growth during the same period is yet to emerge.
Against this background, this paper aims to examine the trends in food price infl ation in India in relation to the growth of Indian agriculture pre- and post-ERs, so as to enhance our understanding of food price behaviour during the post-ERs period, which has been a period of slow agricultural growth. For this purpose, following Bhalla (2007), Bhalla and Singh (2009), and Panagariya (2004), the growth path of India’s agri-culture sector is divided into four phases: the pre-Green Revolution period (1950–51 to 1964–65),2 the initial stage of the Green Revolution (1967–68 to 1979–80), the maturing stage (1980–81 to 1991–92), and the post-ERs period (1992–93 to 2012–13).3
The paper is organised as follows. Section 2 presents a brief performance analysis of Indian agriculture under various agrarian policy phases in terms of growth in agricultural gross domestic product (GDP) and food output. In Section 3, the trends in wholesale price index (WPI) food infl ation witnessed during various agrarian policy periods are discussed. Section 4 offers possible reasons for the price trends that emerged under agrarian policy regimes. The last section summarises the fi nd-ings of the paper and draws policy conclusions.
2 Performance of Indian Agriculture
2.1 Pre-Green Revolution (1950–51 to 1964–65): At the time of independence, India witnessed an acute shortage of food due to the disruption caused to the agricultural sector following the partition of British India in 1947 (Bhalla 2007; Swaminathan 2012). Partition led to loss of rich fertile lands to Pakistan and large-scale migration of populations across the b orders. The
The Pink Professor
SPECIAL ARTICLE
august 1, 2015 vol l no 31 EPW Economic & Political Weekly50
government met the country’s immediate food requirement through large-scale import of food aid, primarily using the PL
480 programme of the United States (US). In addition, serious attempts were made to attain self-suffi ciency in food produc-tion by way of large public investment in agricultural infra-structure, implementation of land reforms and rural develop-mental schemes (Bhalla 2007; Chandra, Mukherjee and Mukherjee 2008).
2.2 Initial Stage (1967–68 to 1979–80): The agrarian stagnation during the fi rst half of the 1960s eventually led to the introduction of a new high yielding varieties (HYV)–seed–fertiliser strategy, popularly known as the Green Revolution, starting from 1966.4 The infl uence of this new strategy on the performance parameters of Indian agriculture was not encouraging during the initial stage (1967–68 to 1979–80). This is evident from the noticeable drop in the growth rate of agricultural GDP, output and yield of all the major crops except wheat during this stage (Tables 1 and 2).5 Several factors are believed to have contributed to this out-come (Bhalla 2007; EPW 1967a, 1967b). They include mainly limited crop (only wheat) and geographical coverage (only Punjab, Haryana and Western Uttar Pradesh) of the Green Revolution strategy to start with; the after effects of the 1965 and 1971 India–Pakistan wars; and the oil crises of 1973–74 and 1978–79.
2.3 Maturing Stage (1980–81 to 1991–92): Consequent to the spread of the HYV–seed–fertiliser strategy to more crops and almost all geographical areas, India’s agrarian economy wit-nessed a revival during the 1980s. Compared to the initial stage of the Green Revolution, the growth rate of agricultural GDP, output and yield of a ma-jority of crops recorded an improvement between 1980–81 and 1991–92 (Tables 1 and 2). The GDP growth fi gure of 3.09% pa achieved by the agricultural sector during this period is the highest till date. Another landmark achievement was the emergence of yield as the predominant contributor to food-output growth.6
2.4 Post-Economic Reform (1992–93 to 2012–13): The eco-nomic liberalisation strategy introduced in India in June 1991 had no explicit mandate to liberalise the Indian agriculture sector and integrate it with the global economy (Bhalla 2007; Chand, Raju and Pandey 2007; Landes and Gulati 2004).7 This together with a host of other factors contributed to the deterio-ration in the overall performance of Indian agriculture during the post-ERs period.8 The growth rate of output and yield of a majority of food commodities decelerated signifi cantly between 1992–93 and 2012–13 (Table 2). On the other hand, the growth
rate of agricultural GDP declined slightly to 2.92% pa during the same period (Table 1).9
3 Trends in Food Prices
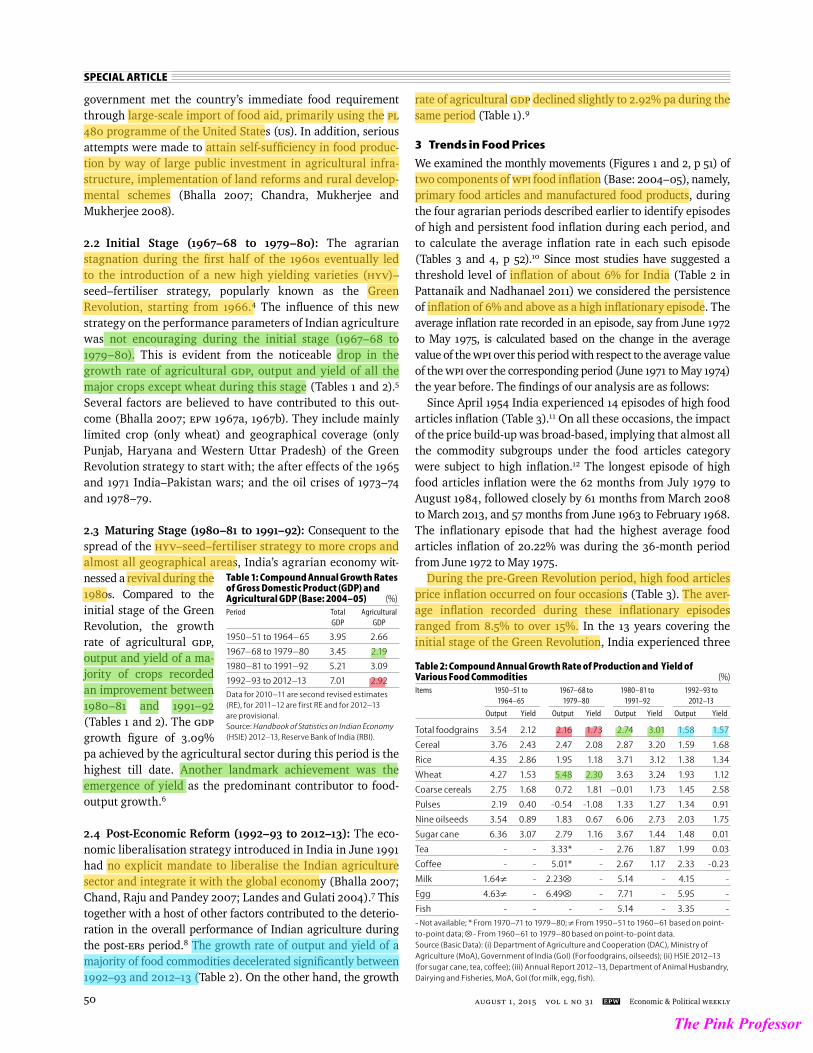
We examined the monthly movements (Figures 1 and 2, p 51) of two components of WPI food infl ation (Base: 2004–05), namely, primary food articles and manufactured food products, during the four agrarian periods described earlier to identify episodes of high and persistent food infl ation during each period, and to calculate the average infl ation rate in each such episode (Tables 3 and 4, p 52).10 Since most studies have suggested a threshold level of infl ation of about 6% for India (Table 2 in Pattanaik and Nadhanael 2011) we considered the persistence of infl ation of 6% and above as a high infl ationary episode. The average infl ation rate recorded in an episode, say from June 1972 to May 1975, is calculated based on the change in the average value of the WPI over this period with respect to the average value of the WPI over the corresponding period (June 1971 to May 1974) the year before. The fi ndings of our analysis are as follows:
Since April 1954 India experienced 14 episodes of high food articles infl ation (Table 3).11 On all these occasions, the impact of the price build-up was broad-based, implying that almost all the commodity subgroups under the food articles category were subject to high infl ation.12 The longest episode of high food articles infl ation were the 62 months from July 1979 to August 1984, followed closely by 61 months from March 2008 to March 2013, and 57 months from June 1963 to February 1968. The infl ationary episode that had the highest average food articles infl ation of 20.22% was during the 36-month period from June 1972 to May 1975.
During the pre-Green Revolution period, high food articles price infl ation occurred on four occasions (Table 3). The aver-age infl ation recorded during these infl ationary episodes ranged from 8.5% to over 15%. In the 13 years covering the initial stage of the Green Revolution, India experienced three
Table 1: Compound Annual Growth Rates of Gross Domestic Product (GDP) and Agricultural GDP (Base: 2004–05) (%)Period Total Agricultural GDP GDP
1950–51 to 1964–65 3.95 2.66
1967–68 to 1979–80 3.45 2.19
1980–81 to 1991–92 5.21 3.09
1992–93 to 2012–13 7.01 2.92
Data for 2010–11 are second revised estimates (RE), for 2011–12 are first RE and for 2012–13 are provisional.Source: Handbook of Statistics on Indian Economy (HSIE) 2012–13, Reserve Bank of India (RBI).
Table 2: Compound Annual Growth Rate of Production and Yield of Various Food Commodities (%)Items 1950–51 to 1967–68 to 1980–81 to 1992–93 to 1964–65 1979–80 1991–92 2012–13
Output Yield Output Yield Output Yield Output Yield
Total foodgrains 3.54 2.12 2.16 1.73 2.74 3.01 1.58 1.57
Cereal 3.76 2.43 2.47 2.08 2.87 3.20 1.59 1.68
Rice 4.35 2.86 1.95 1.18 3.71 3.12 1.38 1.34
Wheat 4.27 1.53 5.48 2.30 3.63 3.24 1.93 1.12
Coarse cereals 2.75 1.68 0.72 1.81 –0.01 1.73 1.45 2.58
Pulses 2.19 0.40 -0.54 -1.08 1.33 1.27 1.34 0.91
Nine oilseeds 3.54 0.89 1.83 0.67 6.06 2.73 2.03 1.75
Sugar cane 6.36 3.07 2.79 1.16 3.67 1.44 1.48 0.01
Tea - - 3.33* - 2.76 1.87 1.99 0.03
Coffee - - 5.01* - 2.67 1.17 2.33 -0.23
Milk 1.64 - 2.23 - 5.14 - 4.15 -
Egg 4.63 - 6.49 - 7.71 - 5.95 -
Fish - - - - 5.14 - 3.35 -
- Not available; * From 1970–71 to 1979–80; From 1950–51 to 1960–61 based on point-to-point data; - From 1960–61 to 1979–80 based on point-to-point data.Source (Basic Data): (i) Department of Agriculture and Cooperation (DAC), Ministry of Agriculture (MoA), Government of India (GoI) (For foodgrains, oilseeds); (ii) HSIE 2012–13 (for sugar cane, tea, coffee); (iii) Annual Report 2012–13, Department of Animal Husbandry, Dairying and Fisheries, MoA, GoI (for milk, egg, fish).
The Pink Professor
SPECIAL ARTICLE
Economic & Political Weekly EPW august 1, 2015 vol l no 31 51
episodes of high food articles infl ation. The peak average infl a-tion rate r ecorded during these episodes was 20.22% with the lowest being 10.96%. During the maturing stage of the Green Revolution that spanned 12 years, food articles price build-up occurred on three occasions with average infl ation rates ranging from 9.88% to 15.11%. Notably, the duration of the infl ationary episodes witnessed during this stage was longer compared to other stages. Since the introduction of economic reforms, India experienced four episodes of high food articles price infl ation. The average infl ation rate recorded during these episodes ranged from 9.22% to 12.99%.
Since April 1972, the period from which data is available, high infl ation of the food products group struck India on 11 occasions, the longest being the 72-month period from April 1989 to March 1995 (Table 4). The period from April 1979 to June 1981 had the highest average infl ation rate of 37.72%. E xcept for the
periods from December 1976 to June 1977 and from April 2011 to June 2012, on all other occasions, the impact of food products price build-up was spread across a majority of food items.13
The initial and maturing stages of the Green Revolution had three episodes of high food products infl ation each (Table 4). The average infl ation recorded during the three episodes of high infl ation in the initial stage of the Green Revolution ranged from 15% to 37.72%. The same fi gures for the maturing stage were 8.68% to 10.86%. During the post-ERs period, India experienced fi ve episodes of high food products price infl ation with the average infl ation rate ranging from 7.29% to 12.20%.
Our literature survey reveals that each episode of food articles and food products infl ation identifi ed were triggered by a host of factors (Table 5, p 53). In addition, our analysis of yearly movements in growth of food output and WPI infl ation rates of food reveals that on most occasions the spike in food
Figure 1: Monthly Movements in Food Articles Inflation Rate (April 1954 to March 2013) Maturing stage of Green RevolutionPre-Green Revolution Period Initial stage of Green Revolution Post-economic reforms period
See Table 3.Source (Basic Data): (i) HSIE (March 2006), RBI and Central Statistics Office (CSO) (http://eaindustry.nic.in/).
40
35
30
25
20
15
10
5
0
-5
-10
-15
-20
-25
Ap
ril-
54
May
-55
Jun
-56
Jul-
57
Au
g-5
8
Sep
-59
Oct
-60
Nov
-61
Dec
-62
Jan
-64
Feb
-65
Mar
-66
Ap
r-67
May
-68
Jun
-69
Jul-
70
Au
g-7
1
Sep
-72
Oct
-73
Nov
-74
Dec
-75
Jan
-77
Feb
-78
Mar
-79
Ap
r-80
May
-81
Jun
-82
July
-83
Au
g-8
4
Sep
-85
Oct
-86
Nov
-87
Dec
-88
Jan
-90
Feb
-91
Mar
-92
Ap
r-93
May
-94
Jun
-95
July
-96
Au
g-9
7
Sep
-98
Oct
-99
Nov
-20
00
Dec
-01
Jan
-03
Feb
-04
Mar
-05
Ap
r-06
May
-07
Jun
-08
July
-09
Au
g-1
0
Sep
-11
Oct
-12
Figure 2: Monthly Movements in Food Products Inflation Rate (April 1972 to March 2013)
Initial stage of Green Revolution Maturing Stage of Green Revolution Post-economic reforms period
See Table 4.Source: As in Figure 1.
Ap
r-72
Jan
-73
Oct
-73
Jul-
74
Ap
r-75
Jan
-76
Oct
-76
Jul-
77
Ap
r-78
Jan
-79
Oct
-79
Jul-
80
Ap
r-81
Jan
-82
Oct
-82
Jul-
83
Ap
r-8
4
Jan
-85
Oct
-85
Jul-
86
Ap
r-87
Jan
-88
Oct
-88
Jul-
89
Ap
r-90
Jan
-91
Oct
-91
Jul-
92
Ap
r-93
Jan
-94
Oct
-94
Jul-
95
Ap
r-96
Jan
-97
Oct
-97
Jul-
98
Ap
r-99
Jan
-20
00
Oct
-20
00
Jul-
01
Ap
r-02
Jan
-03
Oct
-03
Jul-
04
Ap
r-05
Jan
-06
Oct
-06
Jul-
07
Ap
r-08
Jan
-09
Oct
-09
Jul-
10
Ap
r-11
Jan
-12
Oct
-12
807570656055504540353025201510
50
-5-10-15-20-25
The Pink Professor
SPECIAL ARTICLE
august 1, 2015 vol l no 31 EPW Economic & Political Weekly52
4.1 More Stable Food Production: A striking feature of In-dia’s agrarian performance during the post-ERs period was the growth of agricultural output and GDP, though lower, was more stable. This is evident from the low standard deviation of the year-on-year growth rate of output of a majority of food commodities, and of agricultural GDP in the post-ERs period compared with earlier periods (Table 7, p 54). The implication of this fi nding is that even if the rate of agricultural growth is slow, low fl uctuations in growth cause few disruptions in food supply, thereby contributing to low food price infl ation. On the other hand, high agricultural growth may not guarantee low food prices if it is accompanied by frequent fl uctuations in growth. This is evident from the experience of the maturing stage of the Green Revolution. The high growth performance of Indian agriculture during this period was made possible due to the extraordinary growth achieved in just three years, namely, 1980–81, 1983–84 and 1988–89. The year-on-year growth of agricultural GDP during these three years was 14.44%, 10.75% and 16.85%, respectively. The same fi gure for foodgrains output was 18.13%, 17.64% and 21.07%, respec-tively. In all the other years during the maturing phase, the growth rates of agricultural GDP and foodgrain output were either negative or quite low.
4.2 Shift in Food Consumption: An analysis of food expendi-ture patterns at current prices prior to the economic reforms period (1967–68 to 1993–94), based on the household con-sumer expenditure survey conducted by the National Sample Survey Offi ce (NSSO) on a quinquennial basis, reveals that a “secular shift” in food consumption pattern in favour of high-value food items has occurred in India during the maturing stage of the Green Revolution (1983 to 1994).15 This is evident
Table 3: Average WPI Inflation Rate (Base: 2004–05) Recorded during Various Episodes of Food Articles Price Inflation Period Duration Inflation (in Months) Rate (%)
Pre-Green Revolution period (1954–55 to 1964–65) March 1956 to August 1957 18 15.02
July 1958 to May 1959 11 9.91
May 1962 to November 1962 7 8.50
June 1963 to March 1965 22 13.70
Overall period (April 1954 to March 1965) - 4.48
Initial stage of Green Revolution (1967–68 to 1979–80) June 1972 to May 1975 36 20.22
February 1977 to January 1978 12 13.15
July 1979 to March 1981 21 10.96
Overall period (April 1968 to March 1981) # - 5.98
Maturing stage of Green Revolution (1980–81 to 1991–92) April 1981 to August 1984 41 11.67
April 1986 to February 1989 35 9.88
April 1990 to February 1993 @ 35 15.11
Overall period (April 1981 to February 1993) - 10.20
Post-economic reforms period (1992–93 to 2012–13) June 1994 to April 1997 35 11.47
May 1998 to April 1999 12 12.99
October 2005 to September 2007 24 9.22
March 2008 to March 2013 61 11.16
Overall period (March 1993 to March 2013) - 7.86
The period up to March 1981 is included under initial stage of GR because the reason for high food inflation recorded during April 1980 to March 1981 was the decline in food production in 1979–80, which falls under initial stage of GR. # The year 1967–68 is not included under initial stage of GR because the high food inflation witnessed during this year was due to crop failure for two successive years in 1965–66 and 1966–67. The year 1967–68 was an excellent year for Indian agriculture. @ The period up to February 1993 is included under maturing stage of GR because the root cause of high food inflation experienced during April 1992 to February 1993 was the poor growth of agriculture sector in 1991–92, which falls under maturing stage of GR. Source (Basic Data): As in Figure 1.
Table 4: Average Inflation Rate (Base: 2004–05) during Various Episodes of Food Products Price Inflation (%)Period Duration Inflation (in Months) Rate (%)
Initial stage of Green Revolution (1972–73 to 1979–80) April 1972 to June 1975 39 15.00
December 1976 to June 1977 7 18.31
April 1979 to June 1981 27 37.72
Overall period (April 1972 to June 1981) - 12.57
Maturing stage of Green Revolution (1980–81 to 1991–92) April 1983 to August 1984 17 10.57
February 1986 to October 1988 33 8.68
April 1989 to March 1993 @ 48 10.86
Overall period (July 1981 to March 1993) - 7.24
Post-economic reforms period (1992–93 to 2012–13) April 1993 to March 1995 24 12.20
December 1996 to March 1999 28 9.46
March 2003 to January 2005 23 7.29
January 2008 to July 2010 31 10.20
April 2011 to March 2013 24 7.64
Overall period (April 1993 to March 2013) - 5.94
The period up to June 1981 is included under initial stage of GR because the cause of high food inflation recorded during April 1980 to June 1981 lies in negative growth of food production in 1979–80, which comes under initial stage of GR. @ The period up to March 1993 is included under maturing stage of GR because the root cause of high food inflation experienced during April 1992 to March 1993 was the poor growth of agriculture sector in 1991–92, which falls under maturing stage of GR. Source (Basic Data): As in Figure 1.
prices with respect to a particular food commodity was pre-ceded by a supply shortfall.
A comparison of average food articles and food products in-fl ation rates experienced during the various phases of agricul-tural growth reveal that despite the decline in agricultural GDP and food output growth rates, the post-ERs period saw lower food infl ation compared to the maturing stage of the Green Rev-olution (in case of food articles), and the initial and maturing stages of the Green Revolution (in case of food products). On an average, the food articles infl ation rate recorded during the ma-turing stage of was 10.20% against 7.86% recorded during the post-ERs period (Table 3). In the case of food products, the post-ERs period saw an average infl ation of only 5.94% as against 12.57% and 7.24 % recorded during the initial and maturing stages, respectively (Table 4).14 The prices of the majority of in-dividual food articles and food products turned out to be lower, on average, in the post-ERs period compared with the maturing stage of the Green Revolution (Table 6, p 54). Moreover, the peak average infl ation rate recorded in any given episode of high food infl ation was the lowest during the post-ERs period for food articles (12.99%) and second lowest for food products (12.20%).
4 Understanding the Food Price Trends
We offer the following explanations for the relatively low food price infl ation during the post-ERs period notwithstanding the slowdown in agricultural growth.
The Pink Professor
SPECIAL ARTICLE
Economic & Political Weekly EPW august 1, 2015 vol l no 31 53
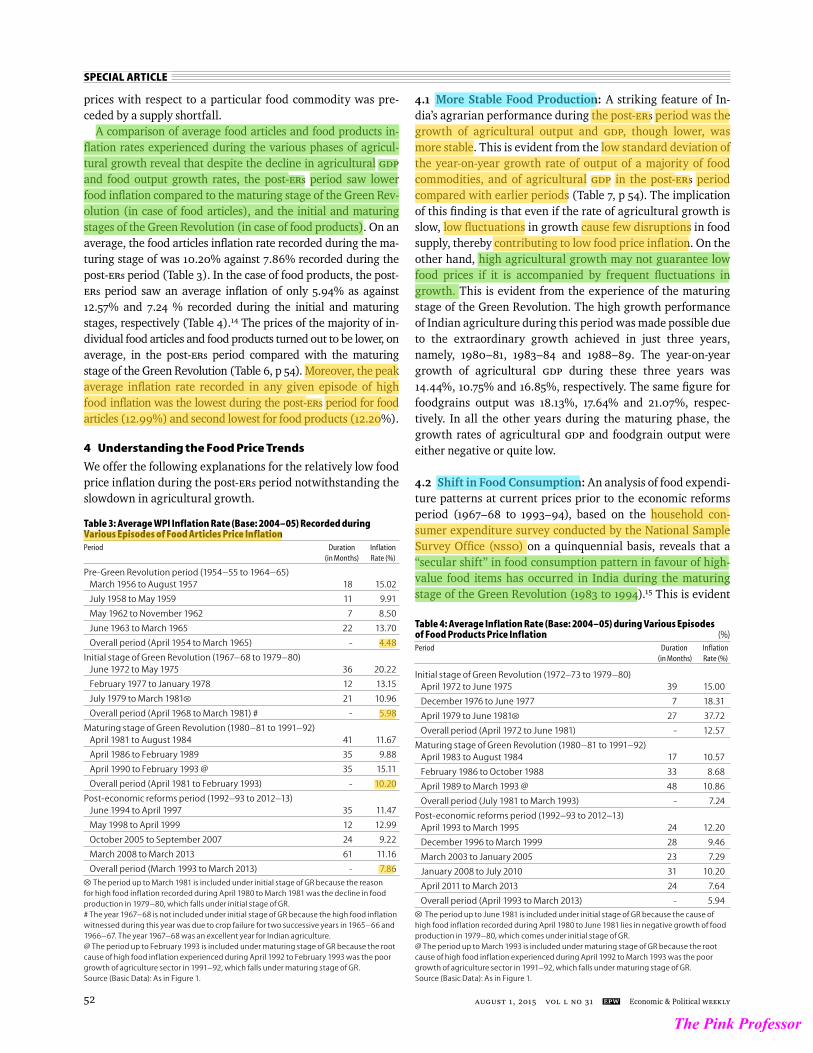
from the following three trends that emerge from Tables 8 and 9 (p 57).16 First, the drop experienced in the expenditure share of cereals both in rural and urban India during 1983–88 was not only signifi cantly more than in other periods, but were his-toric highs. Second, except sugar, all the high-value food com-modities registered highest expenditure shares both in rural and urban areas during 1983–94. Third, the highest percent-age point increase recorded in the expenditure shares of pulses, milk, sugar, edible oil, vegetables and fruits in rural India was during 1983–94. These trends suggest that the rising demand for high-value agriculture products was one of the key factors contributing to the historically high average food price infl ation rate recorded during the maturing stage of the Green Revolution. This is clearly refl ected in Figure 3, which shows that besides the important role of edible oils, the contribution of high-value food commodities, namely protein foods, fruits and vegetables to overall food infl ation has increased markedly in the maturing stage of the Green Revolution compared with the initial stage.17
The shift in food consumption demand during the maturing stage of the Green Revolution might be due to two reasons. First, as documented in literature on India’s economic growth, after experiencing low and stagnant growth during the fi rst three decades after independence, the Indian economy grew at a noticeably high rate during the 1980s (De Long 2003; Nagaraj 2000; Panagariya 2004; Rodrik and Subramanian 2008). This seems to have triggered, for the fi rst time since
independence, the diversifi cation of Indian diets. Second, the signifi cant increase in the real agricultural wages during 1980s might have pushed up rural demand for high-value food. The growth of real agricultural wages was highest during the maturing stage of the Green Revolution. For instance, real wages for male agricultural labour grew 3.75% between 1983
Table 5: Factors Contributing to Various Episodes of High Food Inflation in IndiaInflationary Episodes Reasons for High Inflation
June 1972 to May 1975 (food articles) and April 1972 to June 1975 Crop loss in 1971 due to flood situation, in 1972 due to drought and in 1974; uncertainty (food products) caused by the 1971 Indo–Pak war; additional demand for food due to influx of Bangladesh refugees resulting from 1971 Indo–Pak war; successive increases in the procurement price; higher central issue prices; absence of a robust system of government procurement, buffer stocking and public distribution; delay in importing food; panic situation created by the dwindling foreign exchange reserves; stoppage of concessional food imports using soft loans; and speculative behaviour by traders
February 1977 to January 1978 (food articles), December 1976 to June Excess liquidity in the agricultural and trading sectors leading to bullishness in the1977 and April 1979 to June 1981 (food products) grain market; short-fall in rice production due to scanty rain during 1976 kharif season; severe drought situation in 1979–80 leading to sharp drop in foodgrains production and cornering of large quantities of market arrivals by private traders.
July 1979 to August 1984 (food articles) and April 1983 to August 1984 Short-fall/unimpressive growth in foodgrains production during 1979–80, 1981–82 and (food products) 1982–83; drought during the kharif season of 1982–83; self-imposed limits on open market purchases by government; inadequate spread of public distribution system; limited food imports due to difficult foreign exchange situation; depletion of buffer stock; and high support prices
April 1986 to February 1989 (food articles) and February 1986 to Short-fall/unimpressive growth in foodgrains production during 1984–85, 1985–86,October 1988 (food products) 1986–87 and 1987–88; higher support prices; drought situation in 1987–88; and low foodgrains procurement in 1988–89 despite record production
April 1990 to February 1993, June 1994 to April 1997, May 1998 to April Short-fall/unimpressive growth in foodgrains production during 1989–90, 1990–91, 1999 (food articles), April 1989 to March 1995 and December 1996 to 1991–92, 1993–94, 1995–96, and 1997–98; large government procurement at high March 1999 (food products) support prices; large increases in the issue price of foodgrains; more export of wheat and rice; and increase in speculative hoarding by private traders due to withdrawal of monitoring of stock limits under Essential Commodities Act and RBI's decision to exempt almost all commodities from selective credit controls effective from 21 October 1996
October 2005 to September 2007 (food articles) Short-fall/unimpressive growth in foodgrains production during 2004–05 and 2005–06; higher aggregate demand; and government's failure to procure adequate quantities of wheat
March 2008 to March 2013 (Food articles), January 2008 to July 2010 Supply-side bottlenecks; large increase in minimum support prices; inadequate sale ofand April 2011 to March 2013 (food products) rice under open market sales window of government; inflationary expectations due to unfavourable climatic condition; increasing demand for food due to an increase in income, increase in cost of production; and high cost of imports and higher food exports.
Source: Economic & Political Weekly (Analysis and Editorials published in various issues); Nair and Eapen (2011 and 2012); Nair (2013); Patnaik (2007) and the authors’ analysis of year-on-year growth of production of various food commodities.
Figure 3: Contribution to Overall Food Inflation (%)
0
20
40
60
80
100
120
Per c
ent
Figure 3: Contribution to Overall Food Inflation (%)
Notes:
Source (Basic Data):
(a) Protein foods include pulses, milk, dairy products, egg, meat and fish; (b) Other food products include grain mill products and oil cake.Source (Basic Data): As in Table 3.
Initial State of GR Maturing State of GR Post-ERs Period
Cereals
Protein foods
Fruits and vegetables
Condiments and spices
Edible oils
Sugar, khandsari & gur
Other food products
The Pink Professor
SPECIAL ARTICLE
august 1, 2015 vol l no 31 EPW Economic & Political Weekly54
and 1993–94, against 1.33% and 0.59% recorded, respectively during the periods 1993–94 to 1999–2000 and 1999–2000 to 2010–11 (Himanshu 2005 and Usami 2012).18 Prior to the ma-turing stage of the Green Revolution (1964 to 1980) as well, the growth of real agricultural wages was slow as evident from the analysis presented in Chavan and Bedamatta (2006).19
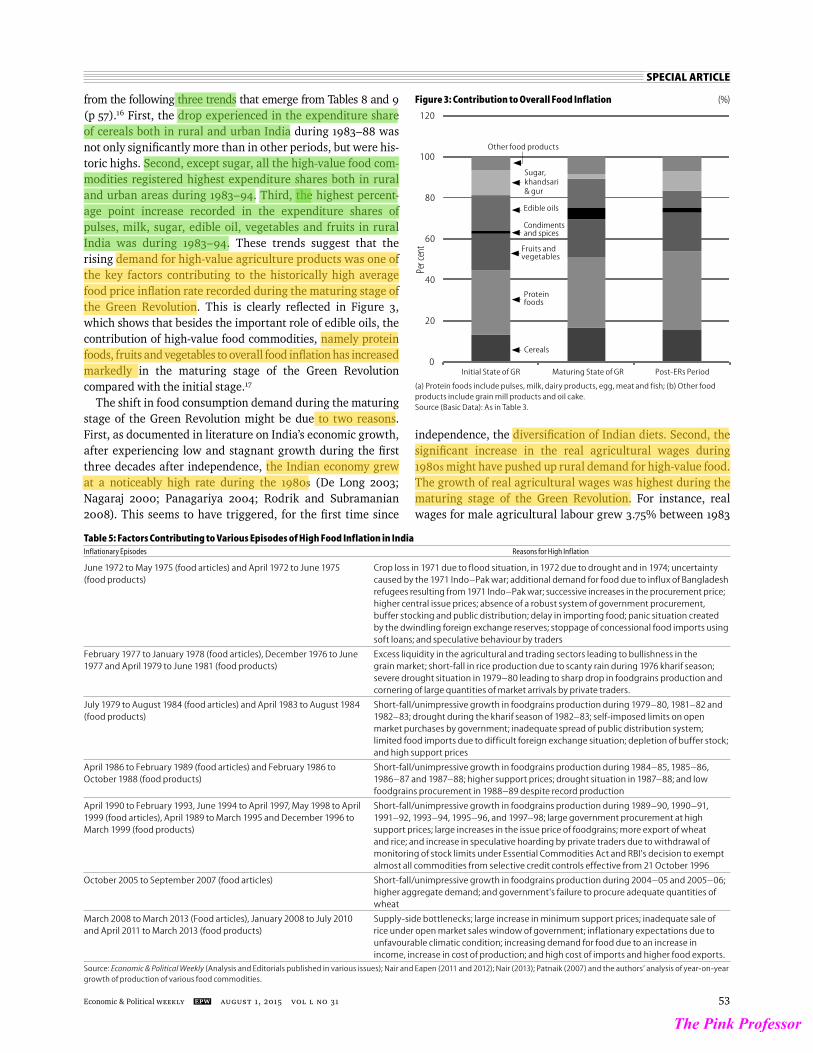
4.3 Role of Minimum Support Prices: One of the key reasons attributed to the spikes in food prices witnessed during the post-ERs period are the hefty increases in minimum support prices (MSP) of foodgrains (rice and wheat) (Balakrishnan 2000; Chand 2005; Dev and Rao 2010). The procurement of foodgrains by the government at higher MSP can cause high food infl ation due to three reasons (GoI 2000; Nair and Eapen 2011). First, it sets a higher benchmark for market prices of foodgrains thereby feeding into food price infl ation expectations. Second, it necessitates a hike in the prices of foodgrains supplied by the government through the public distribution system (PDS) and Open Market Sale Scheme (OMSS).20 Third, it edges out private trade thereby reducing the quantum of foodgrains available for consumption by ordinary consumers. The infl uence of a hike in MSP on foodgrain prices is evident from Figures 4 and 5 (p 55) which show that generally, the rate of annual increases in MSP of rice and wheat and their respective annual infl ation rates move in the same direction, indicating that a higher increase in the MSP translates into an increase in the market price of foodgrains and vice versa. Long-term trends reveal that MSP for rice and wheat in nominal terms recorded much higher increases dur-ing the post-ERs period than in the 1980s (Figure 6, p 55).21 Interestingly, however, cereals experienced lower average infl ation rates during the post-ERs period compared to the maturing stage of the Green Revolution (Table 6). We provide the following explanation for this counter-intuitive fi nding.
Overall, though, the MSP increased substantially during the post-ERs period, a closer look at the annual increases in MSP reveals that between the fi ve-year period from 2001–02 to 2005–06 in case of wheat and from 2002–03 to 2006–07 in case of rice the increase in MSP was moderate (circled portion in Figures 4 and 5). The annual increases in MSP during these periods ranged from 1.56% to 1.64% for wheat and 1.75% to 3.77% for rice.22 Both prior to and after these periods in the post-ERs period, annual increases in MSP were signifi cantly larger. For instance, from 1993–94 to 2001–02 (2000–01 in case of wheat) the annual increases in MSP ranged from 3.92% to 14.81%, and 2.86% to 25.39% for rice and wheat, respectively. In-terestingly, during this phase of moderate in-creases in MSP, infl ation rates of both rice and wheat were ruling low with a period average of 2.1% and 1.9%, respec-tively (circled portion in Figures 4 and 5). Incidentally, it is this fairly long phase of signifi cantly low rice and wheat infl ation rates which has pulled down the average cereal infl ation rate after the economic reforms.
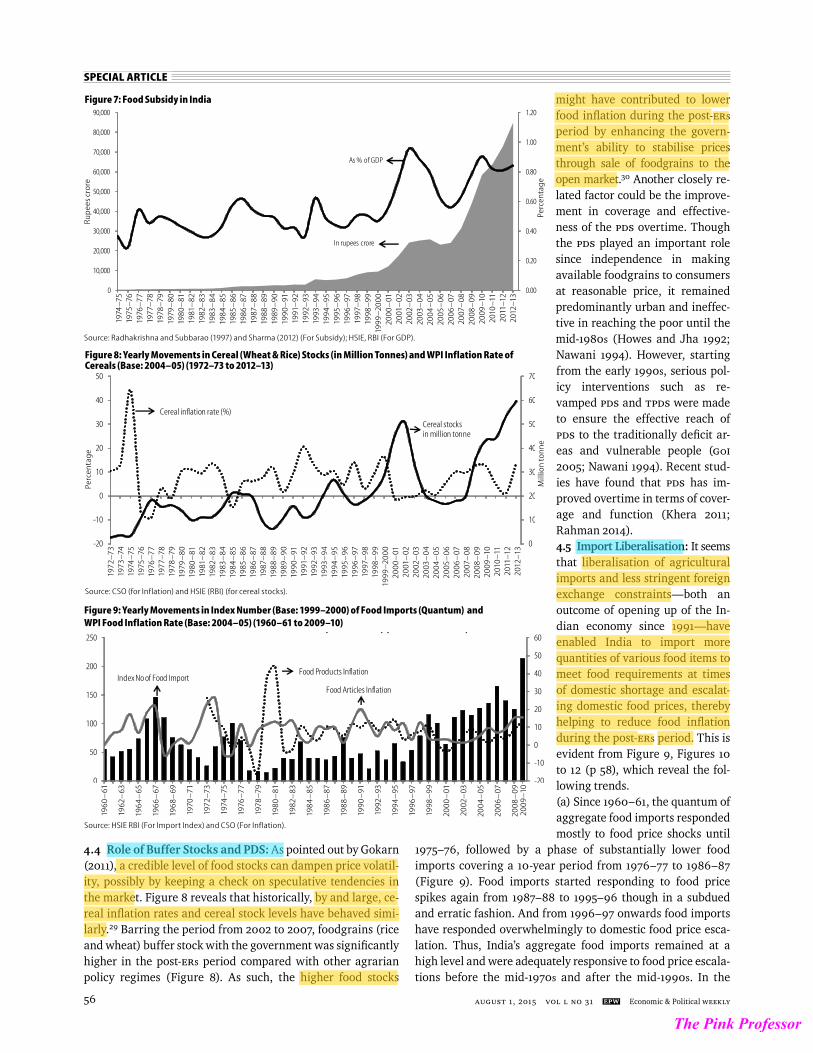
Apart from the modest increases in MSP, which might have reduced the expectation of an all pervasive increase in food prices, the other reason for low rice and wheat price infl ation between 2001–02 and 2006–07 appears to be the reduction followed by no revision in Central Issue Price (CIP) of rice and wheat since July 2000 for below poverty line (BPL) families, and since July 2001–02 for above poverty line (APL) families (Tables 10 and 11, p 57). The combined effect of the marginal increases in MSP, and reduction and no upward revision in the CIP are the following: (a) starting from 2000–01, the govern-ment’s food subsidy bill increased substantially both in absolute terms and as a percentage of GDP (at market prices) (Figure 7, p 56), (b) the offtake of rice and wheat both by BPL and APL benefi ciaries under targeted public distribution system (TPDS) increased between 2001 and 2007 (Table 12, p 58).23 Thus, it is evident that the moderate hikes in procurement prices during 2001–02 to 2006–07 coupled with reduction in and freeze on PDS prices resulted in a fall in wholesale price of cereals and increase in offtake of cereals from PDS and open market. Although increased offtake led to steep falls in foodgrains buffer stocks bet ween 2002–03 and 2006–07 (Figure 8, p 56), consumers paid lower prices for cereals thanks to modest increases in MSP and downward/no revision in CIP.24
In sharp contrast to the situation during 2001 to 2007, between the period 1993–94 and 1999–2000 (2000–01 in case of wheat) annual increases in MSP were substantial (Figures 4 and 5).
Table 7: Standard Deviation of Year-on-Year Growth Rates of Food Production and Agricultural GDP (%) 1951–52 1967–68 1980–81 1992–93 to to to to 1964–65 1979–80 1991–92 2012–13
Foodgrains 8.40 12.52 9.51 8.45
Total cereals 7.75 11.90 9.36 8.24
Rice 10.20 14.80 13.43 9.38
Wheat 12.74 14.91 8.10 6.45
Pulses 14.66 19.27 13.94 13.74
Nine oilseeds 10.32 18.91 18.00 20.68
Sugar cane 16.51 13.04 8.37 11.33
Tea – 3.49 4.34 4.21
Coffee – 24.06 46.16 10.35
Milk – – 2.19 0.96
Egg – – 3.31 4.33
Fish (total) – – 5.65 2.69
Agricultural GDP 5.05 9.05 6.49 4.65
Source (Basic Data): As in Tables 1 and 2.
Table 6: Average WPI Inflation Rate (Base: 2004–05) of Diesel and Subgroups of Food Articles and Food Products under Various Agrarian Policy Regimes (%)Items Pre-Green Initial Stage Maturing Stage Post-Economic Revolution of Green of Green Reforms Period Period Revolution Revolution Period Period
Food articles Foodgrains* – 5.10 9.89 7.32
Cereals 3.69 5.40 9.94 7.36
Pulses 8.34 7.54 9.00 8.44
Fruits and vegetables 6.62 6.87 9.81 7.68
Milk 4.09 5.07 10.28 8.04
Eggs, meat and fish 7.42 8.64 9.59 9.64
Condiments and spices* – 4.34 18.89 6.14
Fuel (diesel) – 10.57 8.39 9.82
Food productsDairy products – 8.96 10.21 6.58
Grain mill products – 6.17 9.43 5.21
Sugar, khandsari and gur – 11.39 2.32 7.16
Edible oils – 11.14 9.64 4.43
Oil cake – 10.49 8.32 8.84
Tea and coffee proccessing** – – 6.66 5.69
Fuel (diesel) – 15.81 7.87 9.79
* Prior to April 1963 foodgrains and condiments and spices classification are not available.** Tea and coffee processing classification is available only from April 1982.Source (Basic Data): As in Figure 1.
The Pink Professor
SPECIAL ARTICLE
Economic & Political Weekly EPW august 1, 2015 vol l no 31 55
Notably, there were frequent upward adjustments in the CIP consequent to the increases in the MSP (Tables 10 and 11). Though the food stock with the government was healthy
during this period (Figure 8, p 56) thanks to high levels of procure-ment, it has not translated into lower cereal prices for most years due to (a) procurement at higher MSP, and (b) increase in CIP at fre-quent intervals. In fact, the upward revision of CIP has accelerated the rate of accretion to public stocks of foodgrains, particularly in case of wheat during 1997–2001, by way of reducing the offtake of grains under the PDS (Figure 8 and Table 12).25
As regards the other important phase (2007 to 2012)26 of high MSP prevailing during the post-ERs period to overcome the situation of falling foodgrain stock from 2002–03 to 2006–07 and to incentivise farmers to increase grain production and productivity (GoI 2012) a sharp hike in MSP of rice and wheat was effected from 2007–08 and 2006–07, respectively.27 As a result, cereal prices rose despite rising grain buffer stock.28 However, since CIP remained unrevised dur-ing this period thereby widening the gap between CIP and the mar-ket price of grains, the offtake of foodgrains under TPDS, even by APL benefi ciaries, was high.
Finally, considering the matur-ing stage of GR, though in absolute terms the nominal MSP of rice and wheat was lower during this period than the post-ERs period, a major shift in the level of nominal MSP occurred since 1988–89 (circled portion in Figure 6). The average MSP offered to rice increased from Rs 131 during 1980–81 to 1987–88 to Rs 210 during 1988–89 to 1992–93, a huge increase of 60%. The MSP of wheat also increased to a similar magnitude from Rs 154 to Rs 247 during the same period. More importantly, the CIP of both rice and wheat was subject to upward revision throughout the maturing state of Green Revolution (Tables 10 and 11). Thus, it turns out that the high level of MSP in the later part
of the maturing stage of the Green Revolution and upward adjustments in the PDS issue price at regular intervals have put pressure on cereal prices.
Figure 4: Movements in Year-on-Year Growth of MSP and Inflation Rate of Rice (%)
Source: HSIE (RBI) (for MSP) and CSO (for Inflation)
-15
-5
5
15
25
35
45
MSP
Inflation Rate
1976
–77
1977
–78
1978
–79
1979
–80
1980
–81
1981
–82
1982
–83
1983
–8
4
198
4–
85
1985
–86
1986
–87
1987
–88
1988
–89
1989
–90
1990
–91
1991
–92
1992
–93
1993
–94
1994
–95
1995
–96
1996
–97
1997
–98
1998
–99
1999
–20
00
200
0–
01
2001
–02
2002
–03
2003
–0
4
200
4–
05
2005
–06
2006
–07
2007
–08
2008
–09
2009
–10
2010
–11
2011
–12
2012
–13
Figure 5: Movements in Year-on-Year Growth of MSP and Inflation Rate of Wheat (%)
Source: As in Figure 4.
-10
-5
0
5
10
15
20
25
30
35
40
MSP
Inflation Rate
1976
–77
1977
–78
1978
–79
1979
–80
1980
–81
1981
–82
1982
–83
1983
–8
4
198
4–
85
1985
–86
1986
–87
1987
–88
1988
–89
1989
–90
1990
–91
1991
–92
1992
–93
1993
–94
1994
–95
1995
–96
1996
–97
1997
–98
1998
–99
1999
–20
00
200
0–
01
2001
–02
2002
–03
2003
–0
4
200
4–
05
2005
–06
2006
–07
2007
–08
2008
–09
2009
–10
2010
–11
2011
–12
2012
–13
Figure 6: Minimum Support Price of Wheat and Rice (Rupees per quintal)
0
200
400
600
800
1000
1200
1400
Rice
Wheat
Source: HSIE (RBI).
1975
–76
1976
–77
1977
–78
1978
–79
1979
–80
1980
–81
1981
–82
1982
–83
1983
–8
4
198
4–
85
1985
–86
1986
–87
1987
–88
1988
–89
1989
–90
1990
–91
1991
–92
1992
–93
1993
–94
1994
–95
1995
–96
1996
–97
1997
–98
1998
–99
1999
–20
00
200
0–
01
2001
–02
2002
–03
2003
–0
4
200
4–
05
2005
–06
2006
–07
2007
–08
2008
–09
2009
–10
2010
–11
2011
–12
2012
–13
The Pink Professor
SPECIAL ARTICLE
august 1, 2015 vol l no 31 EPW Economic & Political Weekly56
4.4 Role of Buffer Stocks and PDS: As pointed out by Gokarn (2011), a credible level of food stocks can dampen price volatil-ity, possibly by keeping a check on speculative tendencies in the market. Figure 8 reveals that historically, by and large, ce-real infl ation rates and cereal stock levels have behaved simi-larly.29 Barring the period from 2002 to 2007, foodgrains (rice and wheat) buffer stock with the government was signifi cantly higher in the post-ERs period compared with other agrarian policy regimes (Figure 8). As such, the higher food stocks
might have contributed to lower food infl ation during the post-ERs period by enhancing the govern-ment’s ability to stabilise prices through sale of foodgrains to the open market.30 Another closely re-lated factor could be the improve-ment in coverage and effective-ness of the PDS overtime. Though the PDS played an important role since independence in making available foodgrains to consumers at reasonable price, it remained predominantly urban and ineffec-tive in reaching the poor until the mid-1980s (Howes and Jha 1992; Nawani 1994). However, starting from the early 1990s, serious pol-icy interventions such as re-vamped PDS and TPDS were made to ensure the effective reach of PDS to the traditionally defi cit ar-eas and vulnerable people (GoI 2005; Nawani 1994). Recent stud-ies have found that PDS has im-proved overtime in terms of cover-age and function (Khera 2011; Rahman 2014).4.5 Import Liberalisation: It seems that liberalisation of agricultural imports and less stringent foreign exchange constraints—both an outcome of opening up of the In-dian economy since 1991—have enabled India to import more quantities of various food items to meet food requirements at times of domestic shortage and escalat-ing domestic food prices, thereby helping to reduce food infl ation during the post-ERs period. This is evident from Figure 9, Figures 10 to 12 (p 58), which reveal the fol-lowing trends. (a) Since 1960–61, the quantum of aggregate food imports responded mostly to food price shocks until
1975–76, followed by a phase of substantially lower food imports covering a 10-year period from 1976–77 to 1986–87 (Figure 9). Food imports started responding to food price spikes again from 1987–88 to 1995–96 though in a subdued and erratic fashion. And from 1996–97 onwards food imports have responded overwhelmingly to domestic food price esca-lation. Thus, India’s aggregate food imports remained at a high level and were adequately responsive to food price escala-tions before the mid-1970s and after the mid-1990s. In the
Mill
ion
ton
ne
Figure 8: Yearly Movements in Cereal (Wheat & Rice) Stocks (in Million Tonnes) and WPI Inflation Rate of Cereals (Base: 2004–05) (1972–73 to 2012–13)
Perc
enta
ge
Source: CSO (for Inflation) and HSIE (RBI) (for cereal stocks).
0
10
20
30
40
50
60
70
-20
-10
0
10
20
30
40
50
Cereal inflation rate (%)
Cereal stocksin million tonne
1972
–73
19
73–
74
1974
–75
19
75–
76
1976
–77
19
77–
78
1978
–79
19
79–
80
1980
–81
19
81–
82
1982
–83
19
83–
84
198
4–
85
1985
–86
19
86–
87
1987
–88
19
88–
89
1989
–90
19
90–
91
1991
–92
19
92–
93
1993
–94
19
94–
95
1995
–96
19
96–
97
1997
–98
19
98–
99
1999
–20
00
200
0–
01
2001
–02
20
02–
03
2003
–0
4 20
04
–05
20
05–
06
2006
–07
20
07–
08
2008
–09
20
09–
10
2010
–11
20
11–
12
2012
–13
Source: Radhakrishna and Subbarao (1997) and Sharma (2012) (For Subsidy); HSIE, RBI (For GDP).
Figure 7: Food Subsidy in India
0.00
0.20
0.40
0.60
0.80
1.00
1.20
0
10,000
20,000
30,000
40,000
50,000
60,000
70,000
80,000
90,000
As % of GDP
In rupees crore
Ru
pee
s cr
ore
1974
–75
1975
–76
1976
–77
1977
–78
1978
–79
1979
–80
1980
–81
1981
–82
1982
–83
1983
–84
1984
–85
1985
–86
1986
–87
1987
–88
1988
–89
1989
–90
1990
–91
1991
–92
1992
–93
1993
–94
1994
–95
1995
–96
1996
–97
1997
–98
1998
–99
1999
–20
0020
00–
0120
01–
0220
02–
0320
03–
0420
04–
0520
05–
0620
06–
0720
07–
0820
08–
0920
09–
1020
10–
1120
11–
1220
12–
13
Perc
enta
ge
Figure 9: Yearly Movements in Index Number (Base: 1999–2000) of Food Imports (Quantum) and WPI Food Inflation Rate (Base: 2004–05) (1960–61 to 2009–10)
Source: HSIE RBI (For Import Index) and CSO (For Inflation).
-20
-10
0
10
20
30
40
50
60
0
50
100
150
200
250
Figure 9: Yearly Movements in Index Number (Base: 1999-00) of Food Imports (Quantum) and (WPI Food Inflation Rate (Base: 2004- ) (05) (1960-61 to 2009- )10)
Food Products Inflation
Food Articles InflationIndex No of Food Import
1960
–61
1962
–63
196
4–
65
1966
–67
1968
–69
1970
–71
1972
–73
1974
–75
1976
–77
1978
–79
1980
–81
1982
–83
198
4–
85
1986
–87
1988
–89
1990
–91
1992
–93
1994
–95
1996
–97
1998
–99
200
0–
01
2002
–03
200
4–
05
2006
–07
2008
–09
2009
–10
The Pink Professor
SPECIAL ARTICLE
Economic & Political Weekly EPW august 1, 2015 vol l no 31 57
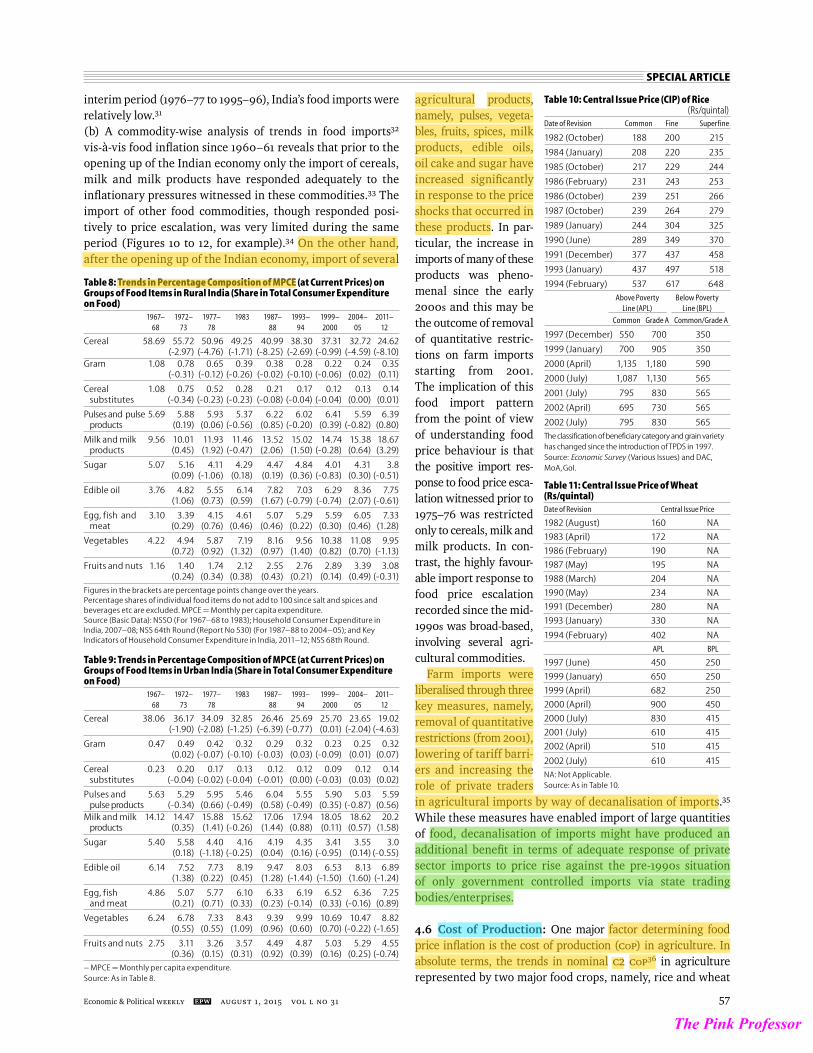
agricultural products, namely, pulses, vegeta-bles, fruits, spices, milk products, edible oils, oil cake and sugar have increased signifi cantly in response to the price shocks that occurred in these products. In par-ticular, the increase in imports of many of these products was pheno-menal since the early 2000s and this may be the outcome of removal of quantitative restric-tions on farm imports starting from 2001. The implication of this food import pattern from the point of view of understanding food price behaviour is that the positive import res-ponse to food price esca-lation witnessed prior to 1975–76 was restricted only to cereals, milk and milk products. In con-trast, the highly favour-able import response to food price escalation recorded since the mid-1990s was broad-based, involving several agri-cultural commodities.
Farm imports were liberalised through three key measures, namely, removal of quantitative restrictions (from 2001), lowering of tariff barri-ers and increasing the role of private traders in agricultural imports by way of decanalisation of imports.35 While these measures have enabled import of large quantities of food, decanalisation of imports might have produced an additional benefi t in terms of adequate response of private sector imports to price rise against the pre-1990s situation of only government controlled imports via state trading bodies/enterprises.
4.6 Cost of Production: One major factor determining food price infl ation is the cost of production (CoP) in agriculture. In absolute terms, the trends in nominal C2 CoP36 in agriculture represented by two major food crops, namely, rice and wheat
Table 8: Trends in Percentage Composition of MPCE (at Current Prices) onGroups of Food Items in Rural India (Share in Total Consumer Expenditure on Food) 1967– 1972– 1977– 1983 1987– 1993– 1999– 2004– 2011– 68 73 78 88 94 2000 05 12
Cereal 58.69 55.72 50.96 49.25 40.99 38.30 37.31 32.72 24.62 (-2.97) (-4.76) (-1.71) (-8.25) (-2.69) (-0.99) (-4.59) (-8.10)Gram 1.08 0.78 0.65 0.39 0.38 0.28 0.22 0.24 0.35 (-0.31) (-0.12) (-0.26) (-0.02) (-0.10) (-0.06) (0.02) (0.11)
Cereal 1.08 0.75 0.52 0.28 0.21 0.17 0.12 0.13 0.14 substitutes (-0.34) (-0.23) (-0.23) (-0.08) (-0.04) (-0.04) (0.00) (0.01)
Pulses and pulse 5.69 5.88 5.93 5.37 6.22 6.02 6.41 5.59 6.39 products (0.19) (0.06) (-0.56) (0.85) (-0.20) (0.39) (-0.82) (0.80)
Milk and milk 9.56 10.01 11.93 11.46 13.52 15.02 14.74 15.38 18.67 products (0.45) (1.92) (-0.47) (2.06) (1.50) (-0.28) (0.64) (3.29)
Sugar 5.07 5.16 4.11 4.29 4.47 4.84 4.01 4.31 3.8 (0.09) (-1.06) (0.18) (0.19) (0.36) (-0.83) (0.30) (-0.51)
Edible oil 3.76 4.82 5.55 6.14 7.82 7.03 6.29 8.36 7.75 (1.06) (0.73) (0.59) (1.67) (-0.79) (-0.74) (2.07) (-0.61)
Egg, fish and 3.10 3.39 4.15 4.61 5.07 5.29 5.59 6.05 7.33 meat (0.29) (0.76) (0.46) (0.46) (0.22) (0.30) (0.46) (1.28)
Vegetables 4.22 4.94 5.87 7.19 8.16 9.56 10.38 11.08 9.95 (0.72) (0.92) (1.32) (0.97) (1.40) (0.82) (0.70) (-1.13)
Fruits and nuts 1.16 1.40 1.74 2.12 2.55 2.76 2.89 3.39 3.08 (0.24) (0.34) (0.38) (0.43) (0.21) (0.14) (0.49) (-0.31)
Figures in the brackets are percentage points change over the years. Percentage shares of individual food items do not add to 100 since salt and spices and beverages etc are excluded. MPCE = Monthly per capita expenditure. Source (Basic Data): NSSO (For 1967–68 to 1983); Household Consumer Expenditure in India, 2007–08; NSS 64th Round (Report No 530) (For 1987–88 to 2004–05); and Key Indicators of Household Consumer Expenditure in India, 2011–12; NSS 68th Round.
Table 9: Trends in Percentage Composition of MPCE (at Current Prices) onGroups of Food Items in Urban India (Share in Total Consumer Expenditure on Food) 1967– 1972– 1977– 1983 1987– 1993– 1999– 2004– 2011– 68 73 78 88 94 2000 05 12
Cereal 38.06 36.17 34.09 32.85 26.46 25.69 25.70 23.65 19.02 (-1.90) (-2.08) (-1.25) (-6.39) (-0.77) (0.01) (-2.04) (-4.63)
Gram 0.47 0.49 0.42 0.32 0.29 0.32 0.23 0.25 0.32 (0.02) (-0.07) (-0.10) (-0.03) (0.03) (-0.09) (0.01) (0.07)
Cereal 0.23 0.20 0.17 0.13 0.12 0.12 0.09 0.12 0.14 substitutes (-0.04) (-0.02) (-0.04) (-0.01) (0.00) (-0.03) (0.03) (0.02)
Pulses and 5.63 5.29 5.95 5.46 6.04 5.55 5.90 5.03 5.59 pulse products (-0.34) (0.66) (-0.49) (0.58) (-0.49) (0.35) (-0.87) (0.56)Milk and milk 14.12 14.47 15.88 15.62 17.06 17.94 18.05 18.62 20.2 products (0.35) (1.41) (-0.26) (1.44) (0.88) (0.11) (0.57) (1.58)
Sugar 5.40 5.58 4.40 4.16 4.19 4.35 3.41 3.55 3.0 (0.18) (-1.18) (-0.25) (0.04) (0.16) (-0.95) (0.14) (-0.55)
Edible oil 6.14 7.52 7.73 8.19 9.47 8.03 6.53 8.13 6.89 (1.38) (0.22) (0.45) (1.28) (-1.44) (-1.50) (1.60) (-1.24)
Egg, fish 4.86 5.07 5.77 6.10 6.33 6.19 6.52 6.36 7.25 and meat (0.21) (0.71) (0.33) (0.23) (-0.14) (0.33) (-0.16) (0.89)
Vegetables 6.24 6.78 7.33 8.43 9.39 9.99 10.69 10.47 8.82 (0.55) (0.55) (1.09) (0.96) (0.60) (0.70) (-0.22) (-1.65)
Fruits and nuts 2.75 3.11 3.26 3.57 4.49 4.87 5.03 5.29 4.55 (0.36) (0.15) (0.31) (0.92) (0.39) (0.16) (0.25) (-0.74)
– MPCE = Monthly per capita expenditure. Source: As in Table 8.
Table 10: Central Issue Price (CIP) of Rice (Rs/quintal)Date of Revision Common Fine Superfine
1982 (October) 188 200 215
1984 (January) 208 220 235
1985 (October) 217 229 244
1986 (February) 231 243 253
1986 (October) 239 251 266
1987 (October) 239 264 279
1989 (January) 244 304 325
1990 (June) 289 349 370
1991 (December) 377 437 458
1993 (January) 437 497 518
1994 (February) 537 617 648
Above Poverty Below Poverty Line (APL) Line (BPL)
Common Grade A Common/Grade A
1997 (December) 550 700 350
1999 (January) 700 905 350
2000 (April) 1,135 1,180 590
2000 (July) 1,087 1,130 565
2001 (July) 795 830 565
2002 (April) 695 730 565
2002 (July) 795 830 565
The classification of beneficiary category and grain variety has changed since the introduction of TPDS in 1997.Source: Economic Survey (Various Issues) and DAC, MoA, GoI.
interim period (1976–77 to 1995–96), India’s food imports were relatively low.31
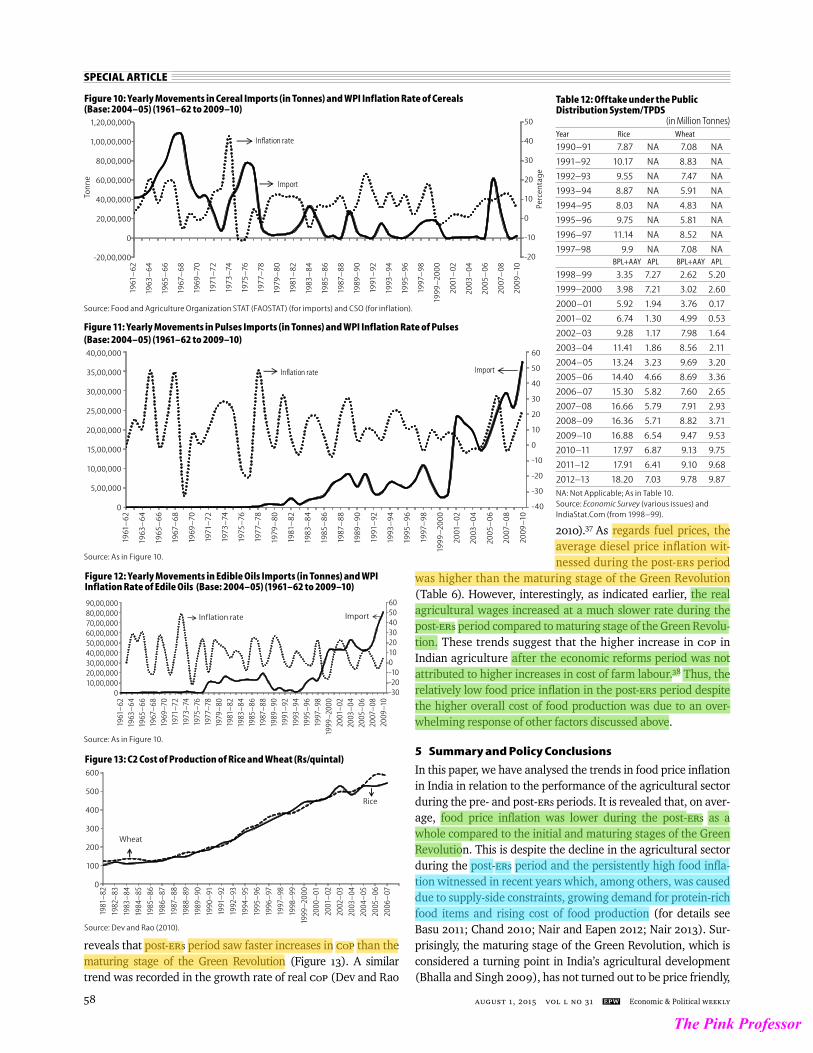
(b) A commodity-wise analysis of trends in food imports32 vis-à-vis food infl ation since 1960–61 reveals that prior to the opening up of the Indian economy only the import of cereals, milk and milk products have responded adequately to the infl ationary pressures witnessed in these commodities.33 The import of other food commodities, though responded posi-tively to price escalation, was very limited during the same period (Figures 10 to 12, for example).34 On the other hand, after the opening up of the Indian economy, import of several
Table 11: Central Issue Price of Wheat (Rs/quintal)Date of Revision Central Issue Price
1982 (August) 160 NA
1983 (April) 172 NA
1986 (February) 190 NA
1987 (May) 195 NA
1988 (March) 204 NA
1990 (May) 234 NA
1991 (December) 280 NA
1993 (January) 330 NA
1994 (February) 402 NA
APL BPL
1997 (June) 450 250
1999 (January) 650 250
1999 (April) 682 250
2000 (April) 900 450
2000 (July) 830 415
2001 (July) 610 415
2002 (April) 510 415
2002 (July) 610 415
NA: Not Applicable. Source: As in Table 10.
The Pink Professor
SPECIAL ARTICLE
august 1, 2015 vol l no 31 EPW Economic & Political Weekly58
reveals that post-ERs period saw faster increases in CoP than the maturing stage of the Green Revolution (Figure 13). A similar trend was recorded in the growth rate of real CoP (Dev and Rao
2010).37 As regards fuel prices, the average diesel price infl ation wit-nessed during the post-ERs period
was higher than the maturing stage of the Green Revolution (Table 6). However, interestingly, as indicated earlier, the real agricultural wages increased at a much slower rate during the post-ERs period compared to maturing stage of the Green Revolu-tion. These trends suggest that the higher increase in CoP in Indian agriculture after the economic reforms period was not attributed to higher increases in cost of farm labour.38 Thus, the relatively low food price infl ation in the post-ERs period despite the higher overall cost of food production was due to an over-whelming response of other factors discussed above.
5 Summary and Policy Conclusions
In this paper, we have analysed the trends in food price infl ation in India in relation to the performance of the agricultural sector during the pre- and post-ERs periods. It is revealed that, on aver-age, food price infl ation was lower during the post-ERs as a whole compared to the initial and maturing stages of the Green Revolution. This is despite the decline in the agri cultural sector during the post-ERs period and the persistently high food infl a-tion witnessed in recent years which, among others, was caused due to supply-side constraints, growing demand for protein-rich food items and rising cost of food production (for details see Basu 2011; Chand 2010; Nair and Eapen 2012; Nair 2013). Sur-prisingly, the maturing stage of the Green Revolution, which is considered a turning point in India’s agricultural development (Bhalla and Singh 2009), has not turned out to be price friendly,
Source: Food and Agriculture Organization STAT (FAOSTAT) (for imports) and CSO (for inflation).
Table 12: Offtake under the Public Distribution System/TPDS (in Million Tonnes)Year Rice Wheat
1990–91 7.87 NA 7.08 NA
1991–92 10.17 NA 8.83 NA
1992–93 9.55 NA 7.47 NA
1993–94 8.87 NA 5.91 NA
1994–95 8.03 NA 4.83 NA
1995–96 9.75 NA 5.81 NA
1996–97 11.14 NA 8.52 NA
1997–98 9.9 NA 7.08 NA BPL+AAY APL BPL+AAY APL
1998–99 3.35 7.27 2.62 5.20
1999–2000 3.98 7.21 3.02 2.60
2000–01 5.92 1.94 3.76 0.17
2001–02 6.74 1.30 4.99 0.53
2002–03 9.28 1.17 7.98 1.64
2003–04 11.41 1.86 8.56 2.11
2004–05 13.24 3.23 9.69 3.20
2005–06 14.40 4.66 8.69 3.36
2006–07 15.30 5.82 7.60 2.65
2007–08 16.66 5.79 7.91 2.93
2008–09 16.36 5.71 8.82 3.71
2009–10 16.88 6.54 9.47 9.53
2010–11 17.97 6.87 9.13 9.75
2011–12 17.91 6.41 9.10 9.68
2012–13 18.20 7.03 9.78 9.87
NA: Not Applicable; As in Table 10.Source: Economic Survey (various issues) and IndiaStat.Com (from 1998–99).
Figure 10: Yearly Movements in Cereal Imports (in Tonnes) and WPI Inflation Rate of Cereals (Base: 2004–05) (1961–62 to 2009–10)
Import
Inflation rate
Ton
ne
Perc
enta
ge
1961
–62
1963
–6
4
1965
–66
1967
–68
1969
–70
1971
–72
1973
–74
1975
–76
1977
–78
1979
–80
1981
–82
1983
–8
4
1985
–86
1987
–88
1989
–90
1991
–92
1993
–94
1995
–96
1997
–98
1999
–20
00
2001
–02
2003
–0
4
2005
–06
2007
–08
2009
–10
50
40
30
20
10
0
-10
-20
1,20,00,000
1,00,00,000
80,00,000
60,00,000
40,00,000
20,00,000
0
-20,00,000
Figure 11: Yearly Movements in Pulses Imports (in Tonnes) and WPI Inflation Rate of Pulses (Base: 2004–05) (1961–62 to 2009–10)
ImportInflation rate
Source: As in Figure 10.
1961
–62
1963
–6
4
1965
–66
1967
–68
1969
–70
1971
–72
1973
–74
1975
–76
1977
–78
1979
–80
1981
–82
1983
–8
4
1985
–86
1987
–88
1989
–90
1991
–92
1993
–94
1995
–96
1997
–98
1999
–20
00
2001
–02
2003
–0
4
2005
–06
2007
–08
2009
–10
40,00,000
35,00,000
30,00,000
25,00,000
20,00,000
15,00,000
10,00,000
5,00,000
0
60
50
40
30
20
10
0
-10
-20
-30
-40
Figure 12: Yearly Movements in Edible Oils Imports (in Tonnes) and WPI Inflation Rate of Edile Oils (Base: 2004–05) (1961–62 to 2009–10)
Source: As in Figure 10.
Inflation rate Import
90,00,00080,00,00070,00,00060,00,00050,00,00040,00,00030,00,00020,00,00010,00,000
0
6050403020100-10-20-30
1961
–62
1963
–64
1965
–66
1967
–68
1969
–70
1971
–72
1973
–74
1975
–76
1977
–78
1979
–80
1981
–82
1983
–84
1985
–86
1987
–88
1989
–90
1991
–92
1993
–94
1995
–96
1997
–98
1999
–200
020
01–
0220
03–
0420
05–
0620
07–
0820
09–1
0
Inflation rate Import
Figure 13: C2 Cost of Production of Rice and Wheat (Rs/quintal)
Source: Dev and Rao (2010).
Rice
Wheat
1981
–82
1982
–83
1983
–84
1984
–85
1985
–86
1986
–87
1987
–88
1988
–89
1989
–90
1990
–91
1991
–92
1992
–93
1994
–95
1995
–96
1996
–97
1997
–98
1998
–99
1999
–200
0
2000
–01
2001
–02
2002
–03
2003
–04
2004
–05
2005
–06
2006
–07
600
500
400
300
200
100
0
Rice
Wheat
The Pink Professor
SPECIAL ARTICLE
Economic & Political Weekly EPW august 1, 2015 vol l no 31 59
with both food articles and food products infl ation rates ruling high on average during this phase. In our view, the following factors explain these results.
First, agricultural growth was more stable during the post-ERs period than the initial and maturing stages of the Green Revolution. Second, there was a major shift in food consump-tion towards high-value food commodities during the maturing stage of the Green Revolution. Third, the moderate increases in MSP from 2001 to 2007 signifi cantly reduced cereal prices and infl ationary expectations during this period thereby help-ing achieve lower average food infl ation in the post-ERs pe-riod. Fourth, the downward revision in and freeze on CIP since the early 2000s resulted in higher offtake of foodgrains from PDS at highly subsidised prices. Fifth, the foodgrains buffer stock situation improved signifi cantly in the post-ERs period thereby strengthening the government’s capacity to release grains in the open market to check price rise. Fifth, the cover-age and performance of PDS has improved over the years. Sixth, thanks to the opening up of foreign trade, and a comfortable foreign exchange reserves position since 1992, India succeeded in importing adequate food to meet domestic shortages and to
control price shocks.39 In contrast, the periods before eco-nomic liberalisation were constrained by a restricted trade re-gime, perennial foreign exchange shortages, and an unfavour-able international com munity, all of which made it diffi cult to exercise the import option l iberally.
The policy implications of our fi ndings are as follows: (a) it seems that, in the long run, a combination of a liberal foreign trade regime and stable, but not necessarily high, agricultural growth and food output can be helpful to keep food infl ation under control;40 (b) along with the level of agricultural growth, attention must be paid to the stability of growth (Chand 2010); (c) moderate hikes in MSP and lower PDS price can have a sof-tening effect on food prices, but at the cost of an enlarged food subsidy bill; (d) a better level of buffer stock and increase in ac-cessibility of the PDS can help stabilise food prices; (e) from an infl ation angle, the concerns about the deceleration of agricul-tural growth during the post-ERs period are unfounded; and (f) the notion that economic (trade) liberalisation and the con-sequent strengthening of the foreign e xchange reserve position have led the government to be less f ocused on agricultural self-suffi ciency since 1992 (Landes and Gulati 2004) has substance.
Notes
1 Post-economic reforms period refers to the period after 1991.
2 Following literature, we exclude 1965–66 and 1966–67 as they experienced two unprece-dented droughts and a war (India–Pakistan).
3 As the economic reform programme was intro-duced from July 1991, its effect on the economy could not have been felt prior to 1992–93 (Panagariya 2004).
4 For details of this strategy, see Bhalla (2007); Swaminathan (2012).
5 It is be noted that output performance of a few food commodities, namely, milk, egg, fi sh and meat included in our analysis are not linked to the Green Revolution strategy as it was guided by sector-specifi c policy interventions such as the Operation Flood programme launched in 1970 to boost milk production and “Blue Revo-lution” efforts to modernise Indian capture fi sheries from the mid-1950s onward.
6 During 1980–81 to 1990–91, the yield growth accounted for 80.25% of growth of output, against the fi gures of 58.45% and 38.41% re-corded during 1949–50 to 1964–65 and 1967–68 to 1980–81 respectively (Bhalla 2007).
7 However, the changes introduced in India’s macroeconomic, industrial and trade policies as part of economic liberalisation have infl u-enced the agrarian environment in varied ways. For details see Landes and Gulati (2004).
8 For details about factors responsible for agrarian slowdown, see Bhalla (2007); Chand, Raju and Pandey (2007); Landes and Gulati (2004).
9 The underperformance of growth rate of agri-cultural GDP after the economic reforms is more evident from the robust overall GDP growth rate experienced during the same period.
10 The WPI available in various bases is converted into a common (2004–05) base using linking factor.
11 The data on food articles infl ation rate is avail-able only from 1954–55.
12 The complete data sets are available from the authors upon request.
13 See footnote 12.
14 We measured policy regime-wise average food infl ation rate after taking into account the spill-over effect of output shock occurring in one policy regime on the price situation in another regime. For details, see notes to Tables 3 and 4. The conclusions remain the same if average infl ation rate is measured without this adjustment.
15 After the economic reforms a similar shift in food consumption pattern was experienced between 2004 and 2012 (Tables 8 and 9). Also, see Nair (2013).
16 Being drought year we exclude MPCE data for 2009–10. As the number of years is not uni-form across the NSSO survey rounds, the per-centage point change reported in Tables 8 and 9 are not strictly comparable.
17 Interestingly, the proportion of total food infl a-tion contributed by protein foods increased further after the economic reforms, while the contribution from fruits and vegetables remained the same. The trends emanating from Figure 3 largely confi rm Gokarn’s (2011) fi nding that over the years, protein foods and fruits and vegetables emerged as the predominant con-tributor to food infl ation in India.
18 See Table 1 in Himanshu (2005) and Table 1A in Usami (2012) (for raw data).
19 In particular, see Table 6 in Chavan and Be-damatta (2006).
20 The price at which foodgrains are supplied un-der PDS is called central issue price (CIP). Un-der Open Market Sale Scheme (OMSS), the government through the Food Corporation of India (FCI) sells foodgrains at predetermined prices in the open market to check the rise in their market prices and to dispose part of sur-plus food stock with the government.
21 Similar trend was witnessed in the growth of MSP in real terms (see Dev and Rao 2010). Sev-eral factors have contributed to the higher MSP after the economic reforms. For details see Dev and Rao 2010; Landes and Gulati (2004); Saini and Kozicka (2014); Tripathi (2014).
22 This is the outcome of the policy of restraint in announcing hike in the MSP followed by the government during the fi rst half of the last decade with the goals of removing market
distortions and restoring the role of private trade in the grain market, thereby reducing the pressure on government to procure more food grains (GoI 2005: 2006).
23 The offtake under OMSS was also high during most of the years in this period.
24 The other major factor contributing to easing of buffer stock was the higher export of rice and wheat permitted by the government at a heavy discount price and lower wheat procure-ment in 2005–06 and 2006–07. For details, see Nair and Eapen (2011; 2012).
25 The offtake declined due to reduced difference between the PDS price and open market prices, which induced a large section of APL benefi ci-aries to move out of the PDS, and due to introduction of TPDS since 1997 (Chand 2005; GoI 2002).
26 2006 to 2012 in case of wheat. 27 For a detailed account of circumstances lead-
ing to the sharp increase in MSP from these periods, see Nair and Eapen (2011; 2012).
28 During 2010–11 and 2011–12 the prices of rice and wheat remained low despite high MSP. This was due to record output on the back of good monsoon (GoI 2011; 2012).
29 See Gokarn (2011) for similar trends in 1990s and 2000s.
30 In fact, long-term trends reveal that the offtake of cereals from the central pool increased signifi cantly after the economic reforms com-pared to earlier periods.
31 The decline in the food imports during this pe-riod was contributed by the signifi cant reduc-tion witnessed in the cereals imports (Figure 10). Cereal imports declined due to attainment of higher degree of foodgrain self-suffi ciency by India thanks to Green Revolution (Sathe and Deshpande 2006).
32 Except milk and milk products, the import fi g-ures analysed in this paper consists only of raw component. Milk imports contain both raw and pro cessed forms.
33 The better import response to infl ation of foodgrains, cereals, and milk is refl ected in their lower average infl ation before the Green Revo-lution and during its initial stages (Table 6).
The Pink Professor
SPECIAL ARTICLE
august 1, 2015 vol l no 31 EPW Economic & Political Weekly60
34 Only the fi gures for selected commodities are presented here. The fi gures for other commod-ities are available from the authors upon request.
35 Decanalisation involves reduction of state agencies monopoly rights over imports.
36 CoP includes actual paid out costs on pur-chased inputs plus imputed value of family la-bour, rental value of owned land and interest on value of owned fi xed capital assets (Dev and Rao 2010).
37 CoP of rice in constant prices has grown by 1.46% during 1994–95 to 2006–07, while the rate was -0.13% between 1981–82 and 1992–93. The growth fi gures for wheat respectively, are 1.41% and -1.96%.
38 It is another matter that, due to various rea-sons, real farm wages increased sharply from 2007–08 thereby pushing up the food prices in the recent times. For details, see Gulati and Saini (2013) and Gulati, Jain and Satija (2013).
39 This fi nding supports the proposition that low food output and low food prices can coexist in a liberal import policy environment (Dev and Rao 2010).
40 For similar conclusion, see Ganesh-Kumar and Parikh (1998). They, using Monte Carlo simulations, show that a trade liberalisation along with a suitable level of buffer stocks can ensure food price stability. However, too much dependence on liberal trade for meeting country’s food requirement can at any time in-vite the risks of stoppage of trade owing to “politics of trade” (Basu 2011) and of short-sup-ply in the international market due to climatic reasons. Hence, the need for maintaining some reasonable level of self-suffi ciency in food can-not be ignored.
References
Balakrishnan, Pulapre (2000): “Agriculture and Economic Reforms: Growth and Welfare,” Economic & Political Weekly, Vol 35, No 12, pp 999–1004.
Basu, Kaushik (2011): “India’s Foodgrains Policy: An Economic Theory Perspective,” Economic & Political Weekly, Vol 46, No 05, pp 37–45.
Bhalla, G S (2007): Indian Agriculture since Inde-pendence, New Delhi: National Book Trust, India.
Bhalla, G S and Gurmail Singh (2009): “Economic Liberalisation and Indian Agriculture: A State-wise Analysis,” Economic & Political Weekly, Vol 44, No 52, pp 34–44.
Carrasco, Bruno and Hiranya Mukhopadhyay (2012): “Food Price Escalation in South Asia: A Serious and Growing Concern,” Asian Develop-ment Bank South Asia Working Paper Series No 10/2012.
Chand, Ramesh (2005): “Whither India’s Food Policy: From Food Security to Food Deprivation,” Economic & Political Weekly, Vol 40, No 11, pp 1055–62.
— (2010): “Understanding the Nature and Causes of Food Infl ation,” Economic & Political Weekly, Vol 45, No 9, pp 10–13.
Chand, Ramesh, S S Raju and L M Pandey (2007): “Growth Crisis in Agriculture: Severity and Options at National and State Levels,” Economic & Political Weekly, Vol 42, No 26, pp 2528–33.
Chandra, Bipan, Mridula Mukherjee and Aditya Mukherjee (2008): India since Independence, New Delhi: Penguin Books India.
Chavan, Pallavi and Rajshree Bedamatta (2006): “Trends in Agricultural Wages in India 1964–65
to 1999–2000,” Economic & Political Weekly, Vol 41, No 38, pp 4041–51.
De Long, J Bradford (2003): “India since Independ-ence: An Analytical Growth Narrative,” In Search of Prosperity: Analytical Narratives on Economic Growth, D Rodrik (ed), Princeton: Princeton University Press, pp 184–204.
Desai, Bhupat M, Errol D’Souza, John W Mellor, Vijay Paul Sharma and Prabhakar Tamboli (2011): “Agricultural Policy Strategy, Instru-ments and Implementation: A Review and the Road Ahead,” Economic & Political Weekly, Vol 46, No 53: pp 42–50.
Dev, S Mahendra and N Chandrasekhara Rao (2010): “Agricultural Price Policy, Farm Profi t-ability and Food Security,” Economic & Political Weekly, Vol 45, Nos 26–27, pp 174–82.
EPW (1967a): “Food: The Real Problem,” Editorial, Economic & Political Weekly, Vol 2, No 13, pp 623–24.
— (1967b): “Food: Temporary Succour,” Weekly Notes, Economic & Political Weekly, Vol 2, No 26, pp 1153–54.
FAO (2003): “Trade Reforms and Food Security: Conceptualising the Linkages”, Food and Agri-culture Organization (FAO), viewed on 1 Janu-ary 2015, http://www.fao.org/ docrep/005/y4671e/ y4671e00.htm
Ganesh-Kumar, A and Kirit S Parikh (1998): “A stock-trade Policy for National Level Food Se-curiry for India,” mimeo, Mumbai: Indira Gandhi Institute of Development Research.
Gokarn, Subir (2011): “Food Infl ation: This Time it’s Different,” Kale Memorial Lecture deliv-ered at the Gokhale Institute of Politics and Economics, Pune on 9 December, viewed on 1 June 2014, http://rbidocs.rbi.org.in/rdocs/Speeches/PDFs/FIKM131211FS.pdf
GoI (2000): Economic Survey 1999–2000, Ministry of Finance.
— (2002): Economic Survey 2001–02, Ministry of Finance.
— (2005): Economic Survey 2004–05, Ministry of Finance.
— (2005): “Performance Evaluation of Targeted Public Distribution System (TPDS),” Pro-gramme Evaluation Organisation, Planning Commission, New Delhi.
— (2006): Economic Survey 2005–06, Ministry of Finance.
— (2011): Economic Survey 2010–11, Ministry of Finance.
— (2012): Economic Survey 2011–12, Ministry of Fi-nance.
Gulati, Ashok, Surbhi Jain and Nidhi Satija (2013): “Rising Farm Wages in India The ‘Pull’ and ‘Push’ Factors,” Commission for Agricul-tural Costs and Prices Discussion Paper No 5, April.
Gulati, Ashok and Shweta Saini (2013): “Taming Food Infl ation in India,” Commission for Agricultural Costs and Prices Discussion Paper No 4, April.
Himanshu (2005): “Wages in Rural India: Sources, Trends and Comparability,” Indian Journal of Labour Economics, Vol 48, No 2, pp 375–406.
Howes, Stephen and Shikha Jha (1992): “Urban Bias in Indian Public Distribution System,” Economic & Political Weekly, Vol 27, No 19, pp 1020–30.
Khera, Reetika (2011): “Revival of the Public Distri-bution System: Evidence and Explanations,” Economic & Political Weekly, Vol 46, Nos 44–45, pp 36–50.
Landes, Rip and Ashok Gulati (2004): “Farm Sector Performance and Reform Agenda,” Economic & Political Weekly, Vol 39, No 32, pp 3611–19.
Nagaraj, R (2000): “Indian Economy since 1980: Virtuous Growth or Polarisation?” Economic & Political Weekly, Vol 35, No 32, pp 2831–38.
Nair, Sthanu R and Leena Mary Eapen (2011): “Wheat Price Infl ation in Recent Times: Caus-es, Lessons and New Perspectives,” Economic & Political Weekly, Vol 46, No 36, pp 58–65.
— (2012): “Food Price Infl ation in India (2008 to 2010): A Commodity-wise Analysis of the Caus-al Factors,” Economic & Political Weekly, Vol 47, No 20, pp 46–54.
Nair, Sthanu R (2013): “Making Sense of Persist-ently High Infl ation in India,” Economic & Political Weekly, Vol 48, No 42, pp 13–16.
Nawani, N P (1994): “Indian Experience on House-hold Food and Nutrition Security,” Regional Expert Consultation, FAO-UN (Bangkok), viewed on 2 June 2014, http://www.fao.org/ docrep/x0172e/x0172e00.HTM
Panagariya, Arvind (2004): “Growth and Reforms During 1980s and 1990s,” Economic & Political Weekly, Vol 39, No 25, pp 2581–94.
Patnaik, Prabhat (2007): “Budgetary Policy in the Context of Infl ation,” Economic & Political Weekly, Vol 42, No 14, pp 1260–62.
Pattanaik, Sitikantha and G V Nadhanael (2011): “Why Persistent High Infl ation Impedes Growth? An Empirical Assessment of Thresh-old Level of Infl ation for India,” RBI Working Paper Series No 17/2011.
Rahman, Andaleeb (2014): “Revival of Rural Public Distribution System: Expansion and Out-reach,” Economic & Political Weekly, Vol 49, No 20, pp 62–68.
Radhakrishna R and K Subbarao (1997): “India’s Public Distribution System: A National and International Perspective”, World Bank Discus-sion Paper No 387, November.
Rodrik, D and A Subramanian (2008): “From Hin-du Growth to Productivity Surge: The Myth of the Indian Growth Transition,” India’s Turn: Understanding the Economic Transformation, A Subramanian (ed), New Delhi: Oxford Univer-sity Press, pp 3–49.
Saini, Shweta and Marta Kozicka (2014): “Evolu-tion and Critique of Buffer Stocking Policy of India,” ICRIER Working Paper No 283, September.
Sathe, Dhanmanjiri and R S Deshpande (2006): “Sustaining Agricultural Trade Policy and Impact,” Economic & Political Weekly, Vol 41, No 52, pp 5337–44.
Sharma, Vijay Paul (2012): “Food Subsidy in India: Trends, Causes and Policy Reform Options,” IIM Ahmedabad Working Paper No 2012-08-02, August.
Swaminathan, M S (2012): “Food as People’s Right,” Hindu, 3 January.
Tripathi, Ashutosh Kumar (2014): Agricultural Pric-es and Production in Post-reform India, New Delhi: Routledge.
Usami, Yoshifumi (2012): “Recent Trends in Wages Rates in Rural India: An Update,” Review of Agrarian Studies, Vol 2, No 1, pp 171–81.
available at
Delhi Magazine Distributors Pvt Ltd
110, Bangla Sahib Marg New Delhi 110 001
Ph: 41561062/63
The Pink Professor