Embed Size (px)
Citation preview
Occasional Paper n° 19
Agricultural Development and Nutrition:the Policies behind China’s Success
Jikun HuangCentre for Chinese Agricultural PolicyChinese Academy of Sciences
Scott RozelleStanford University
November 2009

The views expressed in this paper are the authors’and should not be attributed to WFP.
Study funded by the Bill and Melinda Gates Foundation.
Jikun HuangCentre for Chinese Agricultural PolicyChinese Academy of Sciences
Scott RozelleStanford University
November 2009
Occasional Paper n° 19
Agricultural Development and Nutrition:the Policies behind China’s Success
China’s success in economic developmentis nothing short of extraordinary and has
been the subject of countless studies.Relatively little attention, however, hasbeen paid to the fundamental role thatimprovements in agriculture and nutritionplayed in lifting hundreds of millions ofpeople out of poverty and hunger.
Thirty years ago, when the World FoodProgramme (WFP) was first invited to China,one in three Chinese citizens wasundernourished. Food shortages had plaguedthe vast nation for centuries and were at theroot of many of the dynastic changes thathave marked its history. Today, China growssufficient food to meet the needs of a fifthof the world’s population from less than atenth of its arable land. In recent years it haseven been a net exporter of cereals.
At a moment when the number of hungrypeople is rising again and when questions areraised about the world’s ability to continueto produce enough food for a growingpopulation in the face of climate change andrising costs, it is helpful to look at China’sexperience to learn lessons from its successand from areas that still requireimprovement.
Perhaps the single-most important factor inChina’s success in agricultural developmentwas a stable government that understood thefundamental importance of food security tonational stability. “With food in our hands,our hearts can be at peace.” This old Chinese
adage seems to have underpinned much ofthe government’s work on agriculture andfood production.
Starting with the shift in 1978 from a plannedagricultural economy to the householdresponsibility system (HRS), agriculturalproduction improved dramatically. That hadmultiple positive effects on individuals andthe economy: caloric intake and dietarydiversity improved, rural labourers werefreed to take more profitable off-farm work,new enterprises to process food and othergoods created jobs, and incomes rose.Limiting population growth helped to controldemand for scarce resources.
Improvements in food security and nutritionover the past 30 years have largely beenattributed to improved food supply andincomes. Surprisingly, there were very fewdirect nutritional interventions. A fewinitiatives did take place, for exampleprovision of vitamin A supplements, but theywere rarely available nationwide. China is yetto mandate the fortification of wheat flour.
Despite the tremendous progress made andcontinued government commitment to meetthe most basic needs of its people – food,clothing and shelter – a study of China’s foodsecurity status commissioned by FAO, theInternational Fund for AgriculturalDevelopment (IFAD) and WFP found that90 million people in 266 of China’s poorestcounties are vulnerable to food insecurity.Deficiencies in micronutrients such as iron
2
Foreword
and vitamin A are widespread, especially inpoor rural areas. The incidence of neural tubedefects, often caused by a lack of folic acid, isamong the highest in the world.
Reaching people at risk of malnutrition,which is increasingly difficult because theyare scattered across the poorest and mostremote areas of the country, will requirespecific nutritional interventions, promotionof exclusive breastfeeding, improvementsin health, education and sanitation andimproved food safety. These are the areastargeted in a United Nations joint programmeto improve nutrition, food safety and foodsecurity for China’s most vulnerable womenand children.
As the balance tipped towards greaterprosperity, the challenges changed too. Withhigher incomes came greater demand forbetter quality food. Arable land became evenscarcer because it was more profitable if usedfor residential or industrial purposes. Wateralso came under pressure, with increaseddemand, reduced supply, greater pollutionand the possibility that climate change willaffect its availability.
With urbanization and better livingstandards, conditions associated withsedentary lifestyles such as diabetes, cardio-vascular disease and obesity are increasing.The prevalence of diabetes in China is2.4 percent; the number of people diagnosedwith diabetes is projected to double to42 million between 2000 and 2030.
Obesity is appearing: according to the WorldHealth Organization (WHO), 3.4 percent ofChinese women over 15 are obese; the figurefor Chinese men is 2.4 percent. In 2002,9.2 percent of Chinese children under 5 wereoverweight for their age; 11 percent wereunderweight.
The Government of China recognizes themagnitude of the challenges it faces. It hasadopted a national food security strategy thataims to increase grain production to 550million mt by 2020. To do this, it plans toprotect agricultural land and invest further inscience and technology, rural infrastructureand land and water management. Reformsare under way in health and social security.
Notwithstanding the challenges China facesto ensure that its people enjoy the benefits ofrapid economic growth, its achievement –reducing the number of undernourishedpeople from one in three to less than one inten – stands as a beacon of hope that hungercan be banished within a generation.
Anthea WebbDirector, WFP China
3
Introduction . . . . . . . . . . . . . . . . . . . . . . . . . . . . . . . . . . . . . . . . . . . . . . . . . . . . . . . . . . . . . . . . . . . . . . . . . . . . . . . . . . . . . . . . . . . . . . . . . . . . . . . . . . 5
China’s Agriculture in the Context of Overall Economic Development . . . . . . . . . . . . . . . . . . 6
Overall Economic Growth . . . . . . . . . . . . . . . . . . . . . . . . . . . . . . . . . . . . . . . . . . . . . . . . . . . . . . . . . . . . . . . . . . . . . . . . . . . . . . . . . 6
Structural Changes and the Role of Agriculture in China’s Economy . . . . . . . . . . . . . . . . 6
Overall Change in Economic Structure of Agriculture, Industry
and Service sectors . . . . . . . . . . . . . . . . . . . . . . . . . . . . . . . . . . . . . . . . . . . . . . . . . . . . . . . . . . . . . . . . . . . . . . . . . . . . . . . . . . . . . . . . . 6
Move to More Liberalized Economy and Rapid Growth of External Sector . . . . . . . . . . . . . . 8
Agricultural Development . . . . . . . . . . . . . . . . . . . . . . . . . . . . . . . . . . . . . . . . . . . . . . . . . . . . . . . . . . . . . . . . . . . . . . . . . . . . . . . . . 8
Agricultural Production Growth . . . . . . . . . . . . . . . . . . . . . . . . . . . . . . . . . . . . . . . . . . . . . . . . . . . . . . . . . . . . . . . . . . . . . . . 8
Structural Changes in Agricultural Production . . . . . . . . . . . . . . . . . . . . . . . . . . . . . . . . . . . . . . . . . . . . . . . . . . . . 9
Driving Economic Forces of Agricultural Growth . . . . . . . . . . . . . . . . . . . . . . . . . . . . . . . . . . . . . . . . . . . . . . . 10
Agricultural Trade . . . . . . . . . . . . . . . . . . . . . . . . . . . . . . . . . . . . . . . . . . . . . . . . . . . . . . . . . . . . . . . . . . . . . . . . . . . . . . . . . . . . . . . . 10
Food Security and Nutrition . . . . . . . . . . . . . . . . . . . . . . . . . . . . . . . . . . . . . . . . . . . . . . . . . . . . . . . . . . . . . . . . . . . . . . . . . . . . 11
Improvement to Nutrition and Challenges . . . . . . . . . . . . . . . . . . . . . . . . . . . . . . . . . . . . . . . . . . . . . . . . . . . . . . . . . 13
The Policy Environment . . . . . . . . . . . . . . . . . . . . . . . . . . . . . . . . . . . . . . . . . . . . . . . . . . . . . . . . . . . . . . . . . . . . . . . . . . . . . . . . . . . . . . . 15
Land Policies . . . . . . . . . . . . . . . . . . . . . . . . . . . . . . . . . . . . . . . . . . . . . . . . . . . . . . . . . . . . . . . . . . . . . . . . . . . . . . . . . . . . . . . . . . . . . . . . . . . . 15
Development and Dissemination of Agricultural Technology . . . . . . . . . . . . . . . . . . . . . . . . . . 16
Policies to Encourage Market Integration and Efficiency . . . . . . . . . . . . . . . . . . . . . . . . . . . . . . . . . 17
Public Fiscal Reforms and Investment in Agriculture / Expansion
of the Rural Infrastructure and Public Services . . . . . . . . . . . . . . . . . . . . . . . . . . . . . . . . . . . . . . . . . . . . . . . 19
Investment at the Local Level . . . . . . . . . . . . . . . . . . . . . . . . . . . . . . . . . . . . . . . . . . . . . . . . . . . . . . . . . . . . . . . . . . . . . . . . . . 19
Education and Health Programs . . . . . . . . . . . . . . . . . . . . . . . . . . . . . . . . . . . . . . . . . . . . . . . . . . . . . . . . . . . . . . . . . . . . . 20
Farm Subsidies and Taxes . . . . . . . . . . . . . . . . . . . . . . . . . . . . . . . . . . . . . . . . . . . . . . . . . . . . . . . . . . . . . . . . . . . . . . . . . . . . . . 20
Improving Mobility of Labour out of Agriculture . . . . . . . . . . . . . . . . . . . . . . . . . . . . . . . . . . . . . . . . . . . . . 21
Other Policies . . . . . . . . . . . . . . . . . . . . . . . . . . . . . . . . . . . . . . . . . . . . . . . . . . . . . . . . . . . . . . . . . . . . . . . . . . . . . . . . . . . . . . . . . . . . . . . . . . 22
Summary and Lessons . . . . . . . . . . . . . . . . . . . . . . . . . . . . . . . . . . . . . . . . . . . . . . . . . . . . . . . . . . . . . . . . . . . . . . . . . . . . . . . . . . . . . . . . . 24
Main Challenges of China’s Development . . . . . . . . . . . . . . . . . . . . . . . . . . . . . . . . . . . . . . . . . . . . . . . . . . . . . . . . 24
Equity and Income Distribution . . . . . . . . . . . . . . . . . . . . . . . . . . . . . . . . . . . . . . . . . . . . . . . . . . . . . . . . . . . . . . . . . . . . . . 24
Natural Resources and the Environment . . . . . . . . . . . . . . . . . . . . . . . . . . . . . . . . . . . . . . . . . . . . . . . . . . . . . . . . . . 25
Prospects of China’s Agriculture in the Future and Lessons
for Other Nations . . . . . . . . . . . . . . . . . . . . . . . . . . . . . . . . . . . . . . . . . . . . . . . . . . . . . . . . . . . . . . . . . . . . . . . . . . . . . . . . . . . . . . . . . . . . . 25
References . . . . . . . . . . . . . . . . . . . . . . . . . . . . . . . . . . . . . . . . . . . . . . . . . . . . . . . . . . . . . . . . . . . . . . . . . . . . . . . . . . . . . . . . . . . . . . . . . . . . . . . . . . . 28
Tables . . . . . . . . . . . . . . . . . . . . . . . . . . . . . . . . . . . . . . . . . . . . . . . . . . . . . . . . . . . . . . . . . . . . . . . . . . . . . . . . . . . . . . . . . . . . . . . . . . . . . . . . . . . . . . . . . . . 33
Graphs . . . . . . . . . . . . . . . . . . . . . . . . . . . . . . . . . . . . . . . . . . . . . . . . . . . . . . . . . . . . . . . . . . . . . . . . . . . . . . . . . . . . . . . . . . . . . . . . . . . . . . . . . . . . . . . . . 40
Acronyms used in the document . . . . . . . . . . . . . . . . . . . . . . . . . . . . . . . . . . . . . . . . . . . . . . . . . . . . . . . . . . . . . . . . . . . . . . . . . . . 41
4
Table of Contents
Introduction
The emergence of China is one of the miraclegrowth stories of the last part of the20th century and the early part of the 21st
century. Its economy has been the fastestgrowing when compared with worldeconomies since 1980 (World Bank, 2002).Growth has occurred in all sectors, includingagriculture. Poverty has fallen. In the past30 years the absolute level of poverty fell from260 million in 1978 to 14.8 million in 2007 onthe basis of China’s official poverty line(National Statistical Bureau of China [NSBC],2008). The general welfare of most of thepopulation has increased markedly. Manyindicators of nutritional status have improved:for example the number of children with lowbody weight fell by more than half (Ministry ofHealth, 2004). And by the end of 2007 Chinahad achieved most of its MillenniumDevelopment Goals (MDGs).
These accomplishments are impressive, butthere are still major challenges ahead. Incomedisparity, for example, rose with economicgrowth: there are significant disparities amongregions, between urban and rural areas andamong households in the same location (Caiet al., 2002; World Bank, 2002). There arealso regional differences in nutritional status(Chen, 2004). In China’s poorest areas there isstill a high incidence of anaemia, whichimpedes educational performance and reducesphysical strength and productivity, thuscontributing to chronic poverty (Chen, 2004).
Agriculture is responsible for much of theimprovement in the incomes and nutritional
status of the poor. Since 1978 average annualgrowth in China’s agricultural sector has beenmuch higher than population growth, but highinput levels in many areas and diminishingmarginal returns may mean that increasinginputs will not provide large increases inoutput. Many have predicted that in futurealmost all gains will have to come from newtechnologies that significantly improveagricultural productivity (Fan and Pardey,1997; Huang et al., 2003; Huang et al., 2002a,2002b and 2004). Trade liberalization andtensions between the environment anddevelopment will further challenge China’sagricultural and rural economy.
How has China achieved this growth? Howwill it maintain the growth? At a time when therest of the world is struggling to prevent manyof the MDG indicators from deteriorating, howhas China been able to move so aggressivelytowards meeting its MDGs? What is the policybasis that has helped produce this success?
The aim of this paper is to examine the policiesthat China has used to develop its agriculturaleconomy, reduce poverty and improve thenutrition of the nation. To do this, we shall:i) outline the progress China has made indeveloping its agricultural sector and reviewits achievements in the reduction of nutritionalproblems; ii) review a number of policyinitiatives that the Government has used tosupport the development of agriculture andpoverty reduction; and iii) discuss the policyimplications and lessons of the findings.
5
Agricultural Development, Nutrition andthe Policies behind China’s Success*
* The statistics and observations in this paper refer to the mainland of the People’s Republic of China, excluding Hong Kong Special Autonomous
Region (SAR), Macao SAR and Taiwan.
OVERALL ECONOMIC GROWTH
China’s leaders implemented reformmeasures that have gradually liberalized theinstitutional and market structure of theeconomy. Although there is a cyclical patternin China’s growth rates, its economy has hadthe fastest growth rates in the world since1980.
In the early reform period,1 annual growthrates of gross domestic product (GDP)increased from 4.9 percent in 1970–1978 to8.8 percent in 1979–1984 (see Table 1). Highgrowth was recorded in all sectors.Institutional reforms involving a shift fromcollective agricultural production systems toindividual household production were themain source of agricultural growth in theearly reform period (Lin, 1992; Huang andRozelle, 1996). The growth of agricultureprovided the foundation for the successfultransformation of China’s reform economy.Rising income in the initial years of reformalso stimulated domestic demand; the highsavings rate was transferred into physicalcapital investments in the non-agriculturalsectors in rural and urban areas, which led toannual growth rates of 8.2 percent inindustrial GDP and 11.6 percent in services(see Table 1). During the same period, familyplanning reduced population growth,enabling rapid per capita GDP growth. Theannual growth rate of per capita GDP morethan doubled from 3.1 percent in the1970–1978 pre-reform period to 7.4 percentin 1979–1984.
Despite the Asian financial crisis, an averageannual growth rate of 8.2 percent during1996–2000 was maintained (see Table 1).
China’s economic growth accelerated at thebeginning of the 21st century. Annual GDPgrowth rose from 7.3 percent in 2001, withaverage growth of 9.9 percent in 2001–2005and 11.8 percent in 2006–2007 (see Table 1).The World Bank predicts growth for 2009 at7.5 percent (World Bank, December 2008).
STRUCTURAL CHANGES AND THEROLE OF AGRICULTURE IN CHINA’SECONOMY
Overall Change in Economic Structureof Agriculture, Industry and Servicesectors
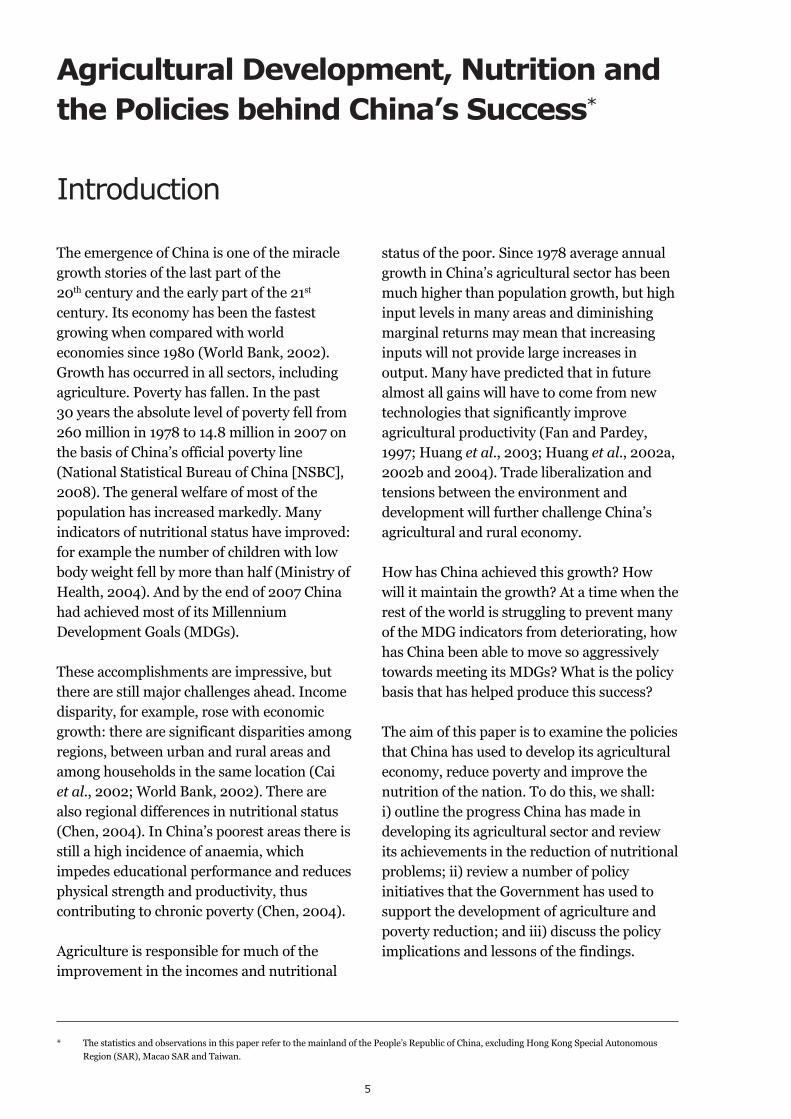
Rapid economic growth has beenaccompanied by significant structuralchanges in China’s economy. Agricultureaccounted for more than 40 percent ofGDP in 1970, but it fell to 30 percent in1980, 20 percent in 1995 and 11 percentin 2007 (see Table 2). The share of theindustrial sector in national GDPfluctuated between 1970 and 1985,gradually increasing after the late 1980sand rose from 41 percent in 1990 to49 percent in 2007. In contrast toagriculture, the service sector expandedrapidly. The share of service sector innational GDP increased from 13 percentin 1970 to 21 percent in 1980 and40 percent in 2007. This trend is expectedto persist in the coming years as Chinacontinues to promote its structuraladjustment policies and economic reformsin response to domestic demand andchanges in external trade patterns.
6
China’s Agriculture in the Context of OverallEconomic Development
1 The “reform period” refers to the years since 1978, when the Government of China instituted its policy of “reform and opening up.” The years 1979 to
1984 are known as the “early reform period”.
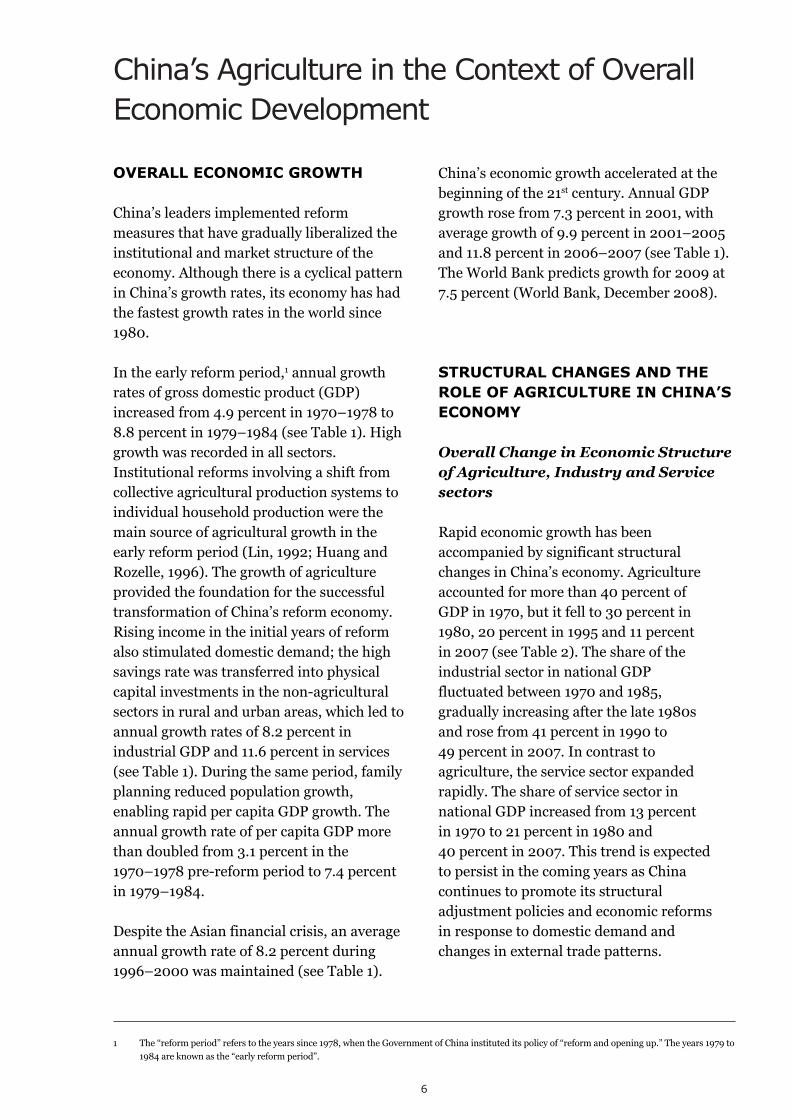
Structural changes in the economy havealso resulted in substantial changes inemployment patterns. In 1970, agricultureemployed 80 percent of the nation’sworkforce. This percentage declined to60 percent in 1990 and 41 percent –including part-time agricultural labour –in 2007 (see Table 2, row 4). The
industrial sector share of employmentdoubled in 1970–1985, steadied at20–24 percent in 1990-2005 and reached27 percent in 2007 (see Table 2, row 5).The share of employment in the servicesector rose even more rapidly, from9 percent in 1970 to 19 percent in 1990and 32 percent in 2007.
7
In rural areas, 40 percent of the labour forcewas employed in the non-agricultural sector inthe late 1990s (de Brauw et al., 2002).Expanding non-agricultural employment hascontributed substantially to the growth of farmhousehold income since the late 1980s (Rozelle,1996). Non-agricultural farm household incomeexceeded agricultural income in 2000 for thefirst time; the share rose to nearly 60 percentin 2007 (NSBC, 2008).
Numerous factors have simultaneouslycontributed to China’s structural changes in
terms of economic composition andemployment. Rapid economic growth,urbanization (Huang and Bouis, 1996),market liberalization (Lardy, 1995; Huangand Rozelle, 1998) and China’s open-doorpolicies (Branstetter and Lardy, 2005) amongothers have had significant impacts oninternal and external consumption anddemand patterns. Together with the rapiddevelopment of factor and output markets,these largely explain the changes in China’seconomic structure in the past three decades(Brandt et al., 2005; Sonntag et al., 2005).
Figure 1. Share of GDP by Sector
100%
90%
80%
70%
60%
50%
40%
30%
20%
10%
0%
100%
90%
80%
70%
60%
50%
40%
30%
20%
10%
0%
1970 1980 1985 1990 1995 2000 2005 2007
Agriculture Industry Services
1970 1980 1985 1990 1995 2000 2005 2007
Agriculture Industry Services
Figure 2. Employment by Sector
Move to More Liberalized Economyand Rapid Growth of the ExternalSector
Rapid economic growth has also beenassociated with remarkable changes inChina’s international trade. Throughout thereform era, foreign trade expanded even morerapidly than GDP. Annual growth rates forforeign trade reached 15 percent in the 1980sand early 1990s (see Table 1). China’s foreigntrade grew by 10 percent annually between1996 and 2000, when world economies werehit by the Asian economic crisis. SinceChina’s accession to the World TradeOrganization (WTO) in late 2001 the growthof imports and exports has been tremendous:the average annual growth rate for tradereached 25.3 percent in 2001–2005 and19.4 percent in 2006–2007 (see Table 1).
With the rapid growth of China’s externalsector, foreign trade has played an increasingrole in the national economy since thebeginning of the reforms. China’s export-to-GDP ratio increased from less than 6 percentin 1980 to 23 percent in 2000 and 37 percentin 2007 (see Table 2, row 8). Over the sameperiod, the import-to-GDP ratio increasedfrom 6 percent to 21 percent and 29 percent.These ratios place China among the mostopen economies in the world.
The rapid expansion of the external economyis largely explained by China’s long-termdevelopment strategy to open its economy.Prior to economic reform, China adopted ahighly centralized and planned foreign traderegime (Lardy, 2001). This system, however,has been substantially decentralized by grantsto more firms of direct foreign trading rights;export subsidies and import tariffs weresignificantly reduced after the late 1980s. By1991 all export subsidies were phased out,though China occasionally applied them forspecific products such as maize and cotton toavoid a major fall in domestic prices beforeaccession to WTO (Huang et al., 2004).Reduction of import tariffs has also beenremarkable: China’s average tariff, which was
56 percent in the early 1980s, was reducedto 47 percent in 1991, 23 percent in 1996 and15 percent on the eve of WTO accession in2001. Import protection has also beensignificantly reduced in the agriculturalsector: the simple average agricultural importtariff fell from 42.2 percent in 1992 to23.6 percent in 1998 and to 21 percent in2001 (Ministry of Foreign Trade andEconomic Cooperation, 2002).
China’s openness to imports progressed evenfaster than the decline in formal tradebarriers might indicate. This is due to themany special privileges that the Governmenthas extended to firms involved in exportprocessing and strategically importantimports to balance domestic shortages. Actualtariff revenues have thus been far belowaverage formal tariff rates: for example, tariffrevenue as a percentage of total import valueswas 17 percent in the mid-1980s and slightlymore than 2 percent in 2004 (Lardy, 2001;Branstetter and Lardy, 2005).
AGRICULTURAL DEVELOPMENT
Agricultural Production Growth
The growth of agricultural production inChina since the 1950s has been one of its maindevelopment accomplishments. Apart fromthe famine years of the late 1950s and early1960s, the country has enjoyed rates ofproduction growth that have outpaced the risein population. Although yields and totalproduction rose during the pre-reform period,total factor productivity did not, and ruralincomes were stagnant (Rozelle et al., 2008).
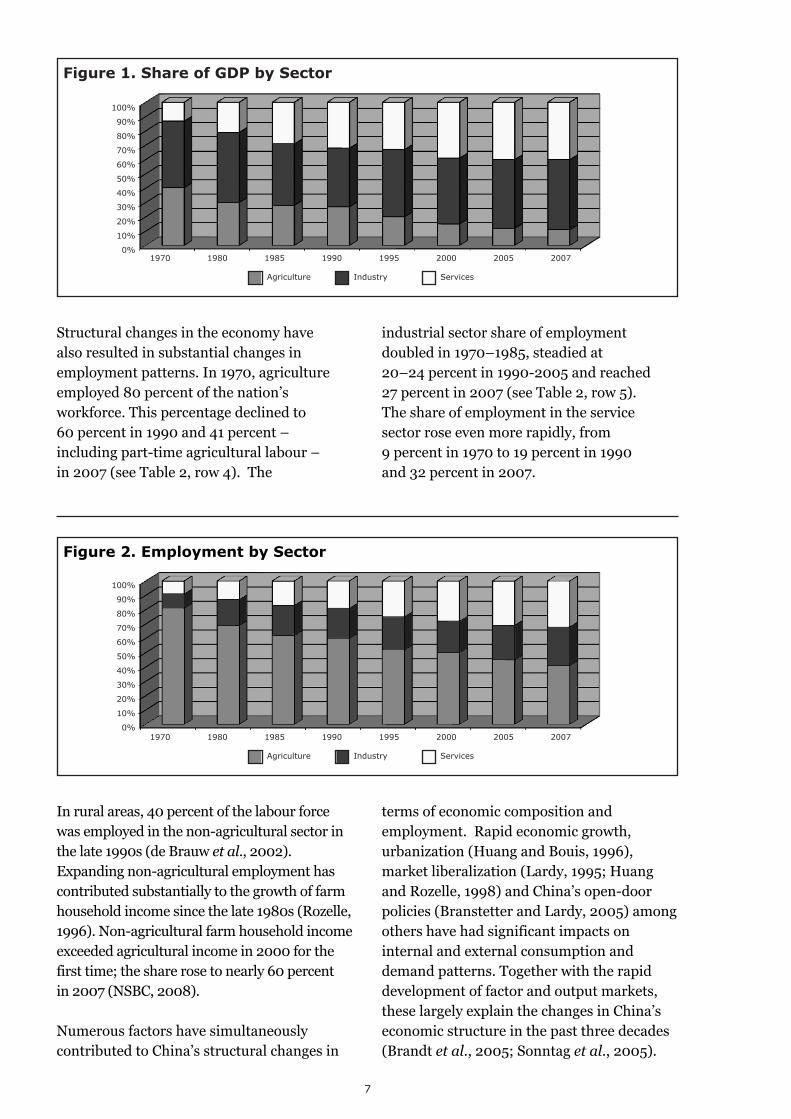
After 1978, introduction of the individualHRS, price increases and relaxation of traderestrictions on most agricultural productsaccompanied the growth of China’s foodeconomy. Between 1978 and 1984 grainproduction increased by 4.7 percent peryear; the output of fruit rose by 7.2 percent(see Table 3).
8
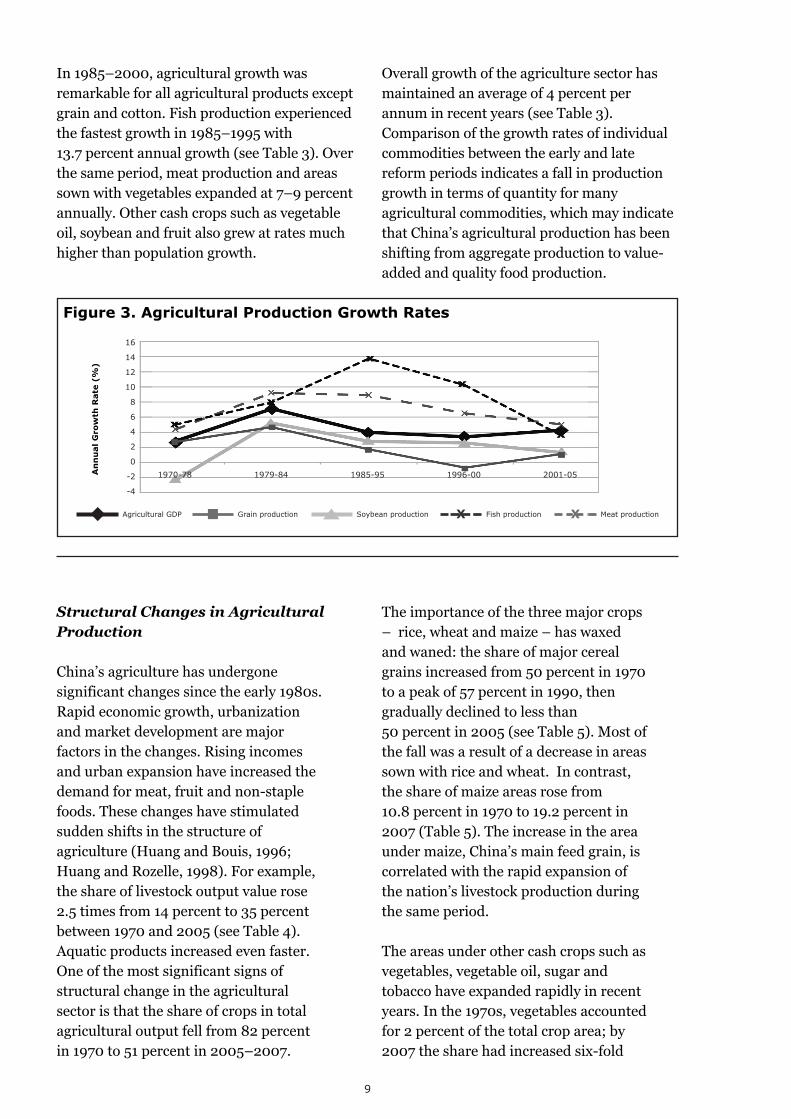
In 1985–2000, agricultural growth wasremarkable for all agricultural products exceptgrain and cotton. Fish production experiencedthe fastest growth in 1985–1995 with13.7 percent annual growth (see Table 3). Overthe same period, meat production and areassown with vegetables expanded at 7–9 percentannually. Other cash crops such as vegetableoil, soybean and fruit also grew at rates muchhigher than population growth.
Overall growth of the agriculture sector hasmaintained an average of 4 percent perannum in recent years (see Table 3).Comparison of the growth rates of individualcommodities between the early and latereform periods indicates a fall in productiongrowth in terms of quantity for manyagricultural commodities, which may indicatethat China’s agricultural production has beenshifting from aggregate production to value-added and quality food production.
9
Structural Changes in AgriculturalProduction
China’s agriculture has undergonesignificant changes since the early 1980s.Rapid economic growth, urbanizationand market development are majorfactors in the changes. Rising incomesand urban expansion have increased thedemand for meat, fruit and non-staplefoods. These changes have stimulatedsudden shifts in the structure ofagriculture (Huang and Bouis, 1996;Huang and Rozelle, 1998). For example,the share of livestock output value rose2.5 times from 14 percent to 35 percentbetween 1970 and 2005 (see Table 4).Aquatic products increased even faster.One of the most significant signs ofstructural change in the agriculturalsector is that the share of crops in totalagricultural output fell from 82 percentin 1970 to 51 percent in 2005–2007.
The importance of the three major crops– rice, wheat and maize – has waxedand waned: the share of major cerealgrains increased from 50 percent in 1970to a peak of 57 percent in 1990, thengradually declined to less than50 percent in 2005 (see Table 5). Most ofthe fall was a result of a decrease in areassown with rice and wheat. In contrast,the share of maize areas rose from10.8 percent in 1970 to 19.2 percent in2007 (Table 5). The increase in the areaunder maize, China’s main feed grain, iscorrelated with the rapid expansion ofthe nation’s livestock production duringthe same period.
The areas under other cash crops such asvegetables, vegetable oil, sugar andtobacco have expanded rapidly in recentyears. In the 1970s, vegetables accountedfor 2 percent of the total crop area; by2007 the share had increased six-fold
Figure 3. Agricultural Production Growth Rates
1970-78 1979-84 1985-95 1996-00 2001-05
16
14
12
10
8
6
4
2
0
-2
-4
Agricultural GDP Grain production Soybean production Fish productionX Meat productionX
AnnualGrowthRate(%
)
(see Table 5). Fruit experienced similarrates of expansion, and the area devotedto edible oil grew two-fold. Fieldinterviews reveal that the livelihoods ofthe poor rely more on crops thanlivestock and fisheries than those ofricher farmers. Poor farmers producemore grains, particularly maize, thancash crops. These figures suggest that thepoor have gained less from thediversification of agricultural productionduring the reform period.
Driving Economic Forces ofAgricultural Growth
Studies have demonstrated that anumber of economic factors contributedto agricultural production growth duringthe reform period. The earliest empiricalstudies focused on measuring the roleof the HRS, which gave farmers land userights, in increasing wealth andconcluded that most of the rise inproductivity in the early reform yearswas a result of institutional innovations,particularly the HRS (McMillan et al.,1989; Fan, 1991; Lin, 1992).
More recent studies show that since theHRS was completed in 1984,technological change has been theprimary engine of agricultural growth(Huang and Rozelle, 1996; Fan, 1997;Fan and Pardey, 1997; Huang et al.,1999; Jin et al., 2002). Improvements intechnology contributed by far the largestshare of crop production growth, evenduring the early reform period. Thesestudies show that reforms other thande-collectivization also potentially affectagricultural growth. Price policy hasbeen shown to have had a significantinfluence on the growth and decline ofgrain and cash crops during the post-reform period. Favourable output toinput price ratios contributed to rapidgrowth in the early 1980s, but this newmarket force is a two-edged sword: a
deteriorating price ratio caused byincreasing output prices at a time ofsharply rising input prices was animportant factor behind the slowdown inagricultural production in late 1980s andearly 1990s.
Irrigation has been critical inestablishing the highly productiveagronomic systems in China (Wang,2000): the proportion of cultivated areasunder irrigation increased from 18 percent in 1952 to approximately 50 percentin 2007 (Ministry of Water Resources,2008). But rising demand for domesticand industrial water is a seriousconstraint for irrigated agriculture, andwater scarcity is seen as a majorchallenge to China’s future food securityand people’s well-being, especially inthe north.
Agricultural Trade
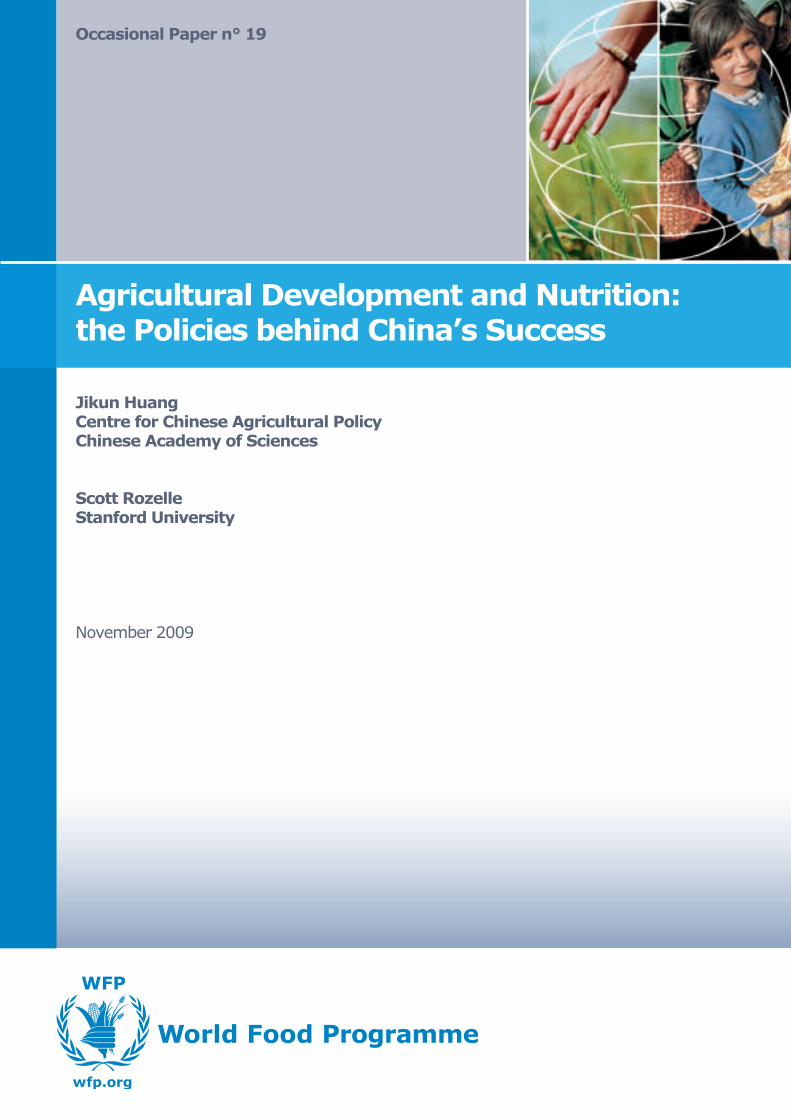
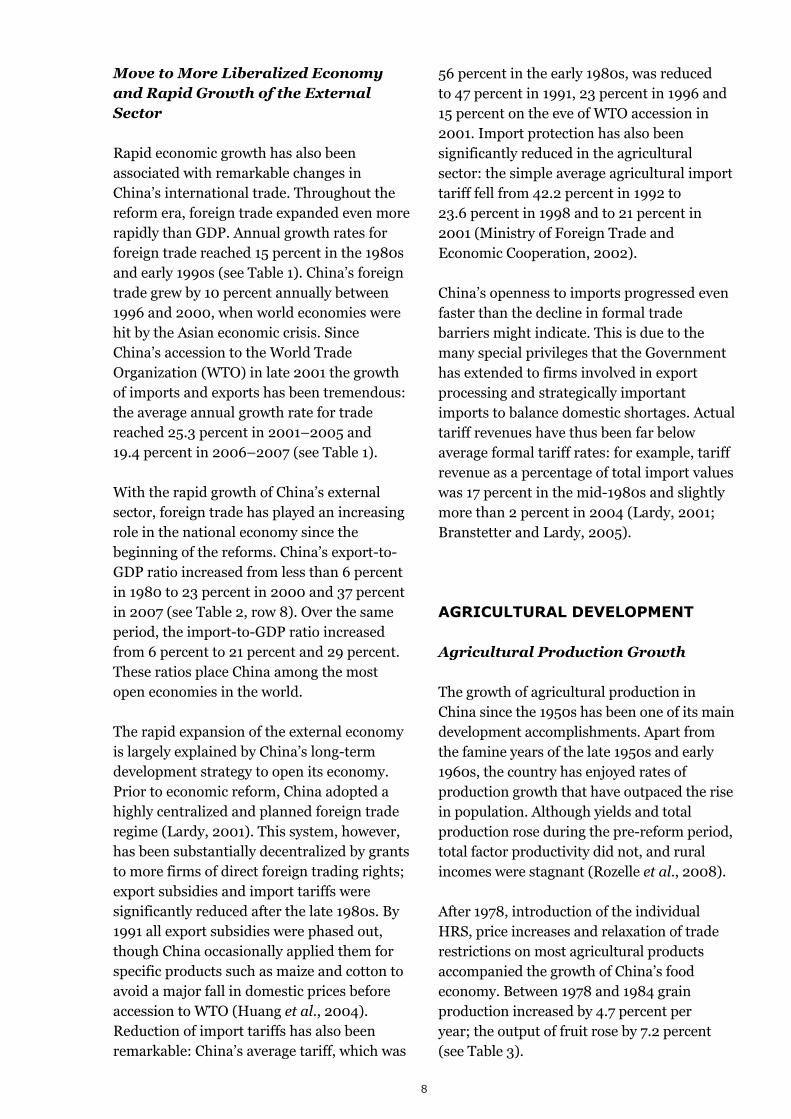
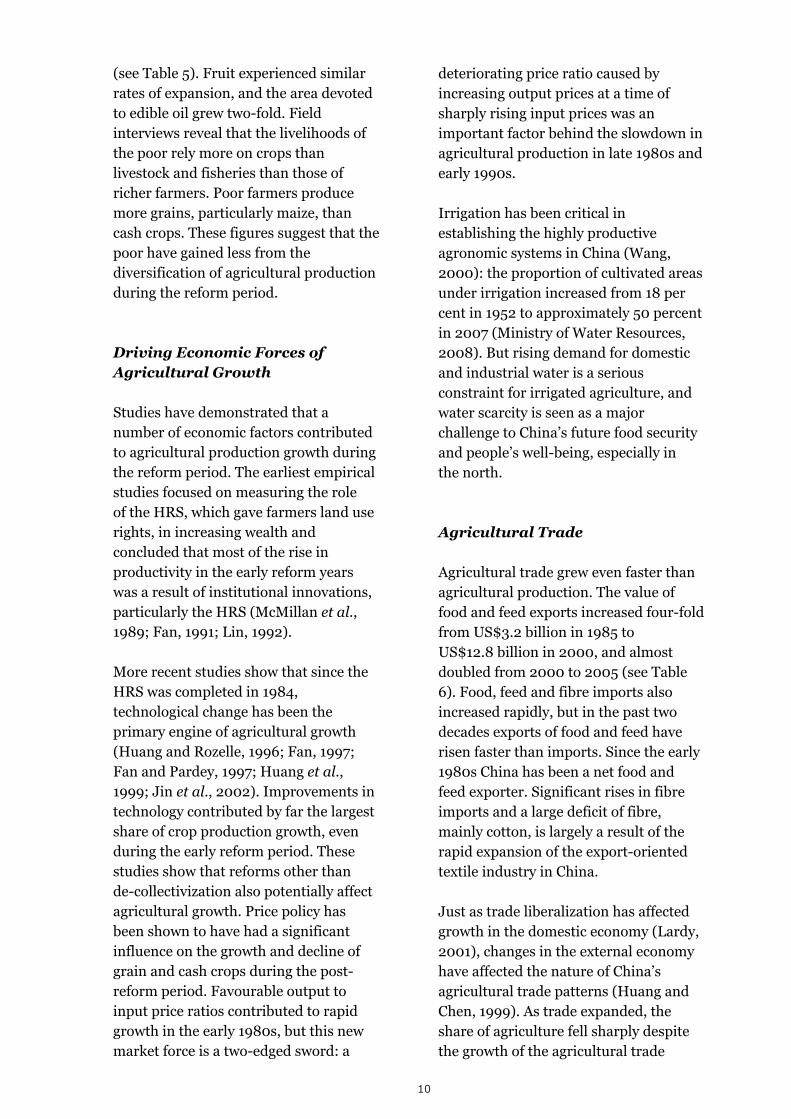
Agricultural trade grew even faster thanagricultural production. The value offood and feed exports increased four-foldfrom US$3.2 billion in 1985 toUS$12.8 billion in 2000, and almostdoubled from 2000 to 2005 (see Table6). Food, feed and fibre imports alsoincreased rapidly, but in the past twodecades exports of food and feed haverisen faster than imports. Since the early1980s China has been a net food andfeed exporter. Significant rises in fibreimports and a large deficit of fibre,mainly cotton, is largely a result of therapid expansion of the export-orientedtextile industry in China.
Just as trade liberalization has affectedgrowth in the domestic economy (Lardy,2001), changes in the external economyhave affected the nature of China’sagricultural trade patterns (Huang andChen, 1999). As trade expanded, theshare of agriculture fell sharply despitethe growth of the agricultural trade
10
11
because the growth of non-agriculturaltrade was much higher.
Disaggregated trade trends in agricultureshow equally sharp shifts (see Table 6).The data in Table 6 suggest that exportsand imports are increasingly moving in adirection consistent with China’scomparative advantages. In general, netexports of land-intensive bulkcommodities such as grains, fibres,oilseeds and sugar have fallen. At thesame time, exports of higher-value andmore intensive products such ashorticultural, animal and aquaticproducts have risen. Grain exportsaccounted for a third of food exports inthe mid-1980s, but from the late 1990shorticultural, animal and aquaticproducts accounted for 70–80 percentof food exports (see Table 6).
FOOD SECURITY ANDNUTRITION
Ensuring national food security is one of themain goals of China’s agricultural policy.China feeds 20 percent of the world’spopulation with about 9 percent of theworld’s cultivated land. By producing most ofthe food it needs for its large population,China contributes significantly to world foodsecurity and accounts for much of the declinein the number and percentage of the world’s
population who are undernourished. Theincrease in food availability and the decreasein under-nutrition were achieved primarilythrough increases in domestic agriculturalproduction.
China’s success in increasing the supply offood and fibre in the last 50 years to meet theneeds of its growing population is wellrecognized. Per capita daily energy supplyreached 2,990 kcal, well above therecommended level of 2,100 kcal in theMDGs and 14 percent higher than the averagedaily energy supply in developing countriesand 8 percent higher than the world average(FAOSTAT database, 2008).
At the national level, grain security hasreceived the attention of national leaders:in the late 1990s, a target of 95 percent grainself-sufficiency was set. To achieve this,China invested heavily in irrigation andother agricultural infrastructure (Wang,2000), research and extension (Huang et al.,2000) and domestic production andmarketing of chemical fertilizer andpesticides (Nyberg and Rozelle, 1999).
China has been a net exporter of grainsince the 1980s. Although it imports high-quality indica rice, China exports japonicarice and has been a net exporter of ricesince the early 1980s. Imports of wheathave declined from 10 million mt annuallyin the 1980s to nearly zero in recent years(NBSC, 1986–2007). China was one of the
Figure 4. China’s Food and Feed Trade
25000
20000
15000
10000
5000
0
Exports Imports
MillionUSD
1985 1990 1995 2000 2005
world’s major maize exporters during thelate 1990s and early 2000s, with annualmaize exports reaching 12 million mt in2002 and 16.4 million mt in 2003. Eventhough maize exports have declinedsignificantly in recent years, China has notyet become a net maize importer. In thecoming decade China will probably have toimport maize to help to meet growingdemand for feed resulting from expansionof the livestock sector.
At the household and individual levels,food security depends on a number offactors that are largely related to variousforms of entitlement to income and food-production assets. The links betweendomestic and external markets and accessto external markets by small low-incomeand resource-poor producers andconsumers are also important.
Access to food in rural China has changedover time. In the early years of reform,de-collectivization policies gave all farmhouseholds the right to use a piece of land.But markets did not function well duringthis time and most farmers producedmainly for subsistence. Access to food wasprimarily through the land allocated tofarmers by the state.
As China has changed, so has the ruraleconomy. And nowhere has the changebeen more noticeable than in access tofood. From a largely subsistence economyChina has in recent years developed a ruraleconomy that is one of the mostcommercialized in comparison with otherdeveloping economies. On average, theshares of marketed products in totalproduction ranged from 54 percent forgrain to 90 percent for fish (Huang et al.,2004). Even the poorest of the poormarketed most of what they produced,though the rate of commercialization islower than among richer Chinese farmers.
China’s rural consumers still faceuncertainties in access to food. The
nature of these uncertainties is probablydifferent from those in other developingcountries, where production risk is oftenone of the most significant sources of riskaffecting rural residents; in China this isless likely to be the case. A much highershare of China’s land – 48 percent – isirrigated (Ministry of Water Resources,2008), and 80 percent of householdshave at least one family member earningan income in the off-farm market (deBrauw et al., 2004). Giles (2000) showsthat risks in China come from a numberof non-traditional sources such as wageand policy risks. With an increasingnumber of households relying on marketsto procure their food, they also face risingmarket price risks.
Stability of food supplies and access tofood by the poor are the other dimensionsof food security. In this regard, theGovernment has developed its owndisaster-relief programme and has run anational food-for-work scheme with a viewto long-term investments. China’s capacityto deal with emergencies wasdemonstrated repeatedly during thereform period: for example theGovernment responded massively andrapidly during the Yangtze river floods inthe 1990s and the Sichuan earthquakein 2008. Through such actions, theGovernment showed that its capacity todeal with the consequences of naturaldisasters is adequate.
During the 1980s and early 1990s, a majorconstraint affecting the stabilization offood supplies was poor market andtransport infrastructures (Nyberg andRozelle, 1999), but these have improvedmarkedly since the early 1990s. Huangand Rozelle (2006) showed that China’sdomestic food markets have been highlyintegrated since the late 1990s. Thepercentage change in price for every1,000 km from the port of entry was only5 percent, which is comparable withthe United States.
12
13
Improvement to Nutrition andChallenges2
China’s agricultural reforms had a hugeimpact on the capacity of farmers to feed itspopulation. The rural standard of living wassignificantly improved, leading to a dramaticfall in poverty. On the basis of China’s officialpoverty line, the incidence of rural povertyfell from 31 percent in 1978 to 1.6 percentin 2007. According to the US$1 per daypurchasing power parity (PPP) exchange rate,it fell from 31.5 percent in 1990 to10.4 percent in 2005 (United NationsDevelopment Programme [UNDP], 2008).In 2002, China’s households spent an averageof 40 percent of expenditure on food,compared with 55 percent in 1990,indicating a significant improvement in thestandard of living.
Agricultural reforms had huge consequencesfor food security and the improvement of thenutritional status of Chinese citizens.According to FAO estimates, the number ofundernourished people decreased from304 million in 1979–1981, 30 percent of thepopulation, to 123 million in 2003–2005,9 percent of the population.
During this time, the nutritional status of theChinese population has improvedsubstantially. Rapid economic growth and thedevelopment of food markets have increaseddemand for food and resulted in increasedquantity, quality and diversity of foods suchas vegetables, fruit and meat.
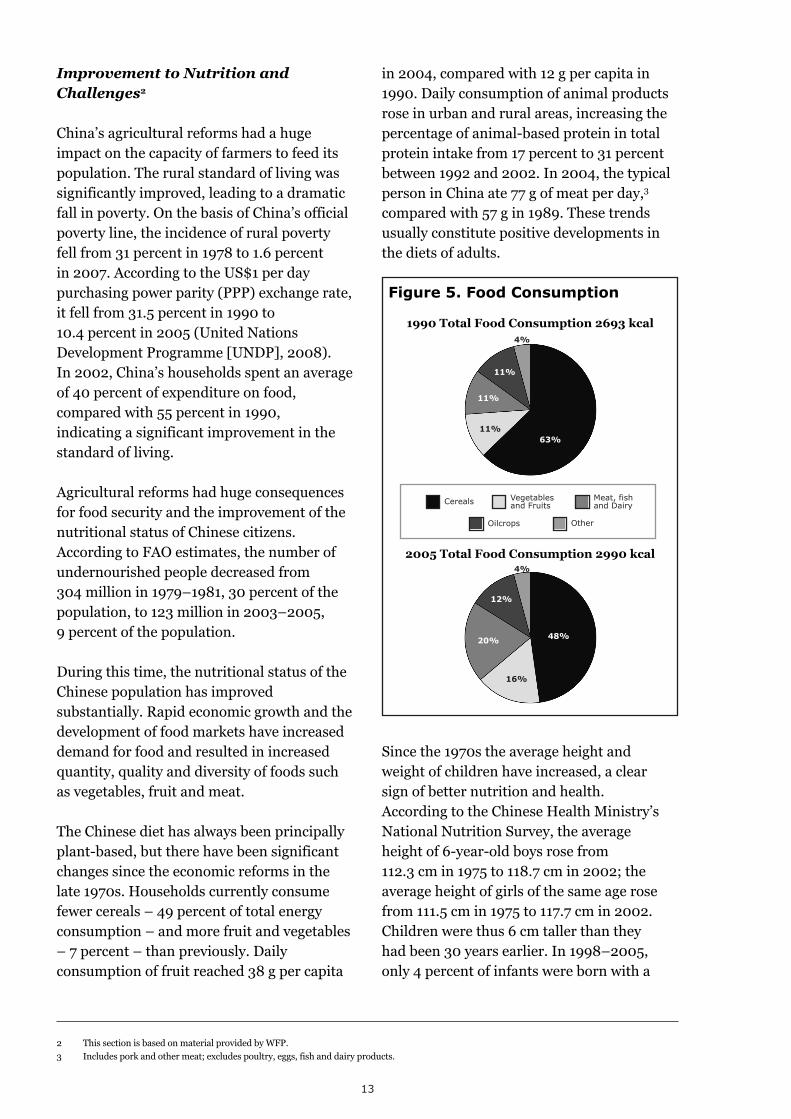
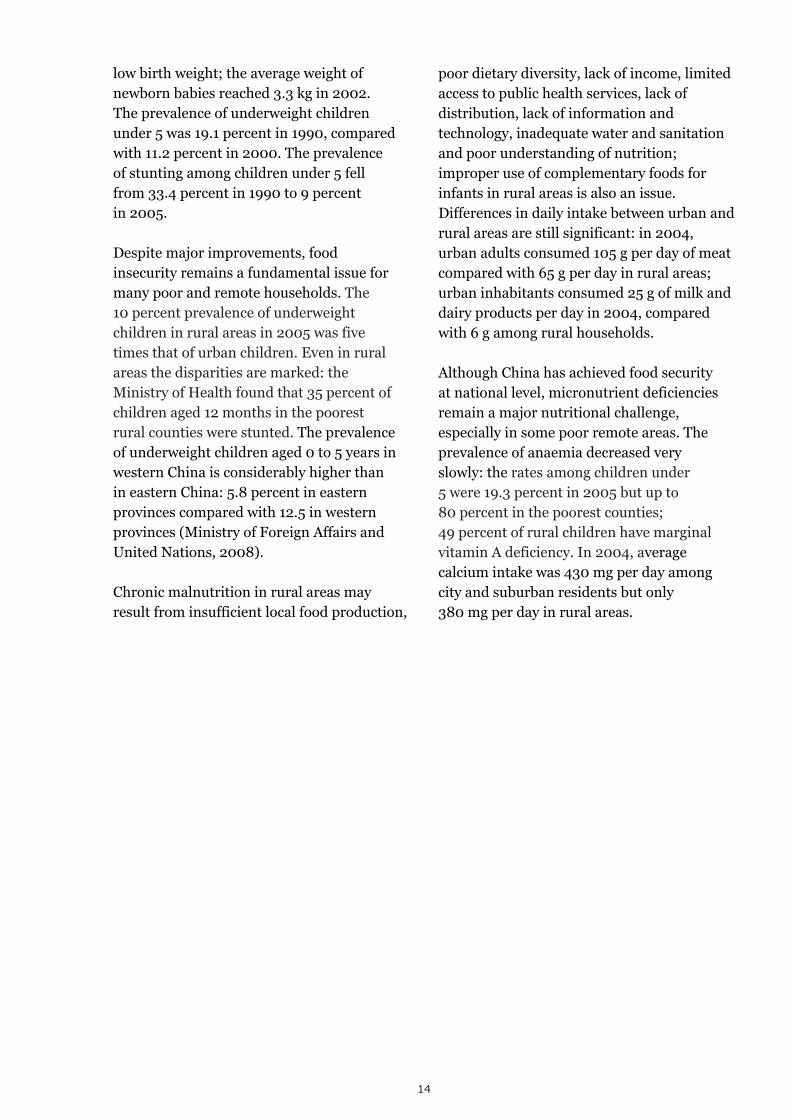
The Chinese diet has always been principallyplant-based, but there have been significantchanges since the economic reforms in thelate 1970s. Households currently consumefewer cereals – 49 percent of total energyconsumption – and more fruit and vegetables– 7 percent – than previously. Dailyconsumption of fruit reached 38 g per capita
in 2004, compared with 12 g per capita in1990. Daily consumption of animal productsrose in urban and rural areas, increasing thepercentage of animal-based protein in totalprotein intake from 17 percent to 31 percentbetween 1992 and 2002. In 2004, the typicalperson in China ate 77 g of meat per day,3
compared with 57 g in 1989. These trendsusually constitute positive developments inthe diets of adults.
Since the 1970s the average height andweight of children have increased, a clearsign of better nutrition and health.According to the Chinese Health Ministry’sNational Nutrition Survey, the averageheight of 6-year-old boys rose from112.3 cm in 1975 to 118.7 cm in 2002; theaverage height of girls of the same age rosefrom 111.5 cm in 1975 to 117.7 cm in 2002.Children were thus 6 cm taller than theyhad been 30 years earlier. In 1998–2005,only 4 percent of infants were born with a
2 This section is based on material provided by WFP.
3 Includes pork and other meat; excludes poultry, eggs, fish and dairy products.
Figure 5. Food Consumption
1990 Total Food Consumption 2693 kcal
2005 Total Food Consumption 2990 kcal
63%
48%
11%
20%
11%
12%
11%
4%
4%
16%
Cereals Vegetablesand Fruits
Meat, fishand Dairy
Oilcrops Other
low birth weight; the average weight ofnewborn babies reached 3.3 kg in 2002.The prevalence of underweight childrenunder 5 was 19.1 percent in 1990, comparedwith 11.2 percent in 2000. The prevalenceof stunting among children under 5 fellfrom 33.4 percent in 1990 to 9 percentin 2005.
Despite major improvements, foodinsecurity remains a fundamental issue formany poor and remote households. The10 percent prevalence of underweightchildren in rural areas in 2005 was fivetimes that of urban children. Even in ruralareas the disparities are marked: theMinistry of Health found that 35 percent ofchildren aged 12 months in the poorestrural counties were stunted. The prevalenceof underweight children aged 0 to 5 years inwestern China is considerably higher thanin eastern China: 5.8 percent in easternprovinces compared with 12.5 in westernprovinces (Ministry of Foreign Affairs andUnited Nations, 2008).
Chronic malnutrition in rural areas mayresult from insufficient local food production,
poor dietary diversity, lack of income, limitedaccess to public health services, lack ofdistribution, lack of information andtechnology, inadequate water and sanitationand poor understanding of nutrition;improper use of complementary foods forinfants in rural areas is also an issue.Differences in daily intake between urban andrural areas are still significant: in 2004,urban adults consumed 105 g per day of meatcompared with 65 g per day in rural areas;urban inhabitants consumed 25 g of milk anddairy products per day in 2004, comparedwith 6 g among rural households.
Although China has achieved food securityat national level, micronutrient deficienciesremain a major nutritional challenge,especially in some poor remote areas. Theprevalence of anaemia decreased veryslowly: the rates among children under5 were 19.3 percent in 2005 but up to80 percent in the poorest counties;49 percent of rural children have marginalvitamin A deficiency. In 2004, averagecalcium intake was 430 mg per day amongcity and suburban residents but only380 mg per day in rural areas.
14
15
The Policy Environment
The rapid growth and radical transformationof China’s economy and agriculture werelinked to government policy. In this sectionwe explore five of the main policy areas thathave enabled China’s economic change andagricultural development: cultivated landmanagement, agricultural research anddevelopment (R&D), marketing and pricing,fiscal policy and investment in infrastructureand public services, and labour mobility.
LAND POLICIES
Before the economic reforms in 1978, China’scultivated land was farmed by groups offarmers called collectives. The head of eachcollective assigned work to the members, whojointly carried out tasks such as ploughing,planting, fertilizing and harvesting. Memberswere given work points for the number oflabour days and at the end of the year, afterpaying an in-kind tax to the state, theydivided the harvest among themselves on thebasis of the number of work points earned byeach member. The system was put in place totry to take advantage of economies of scale,but during the socialist period from 1950 to1978 the increase in total factor productivityin agriculture was essentially zero (Rozelle etal., 2008) and per capita income in ruralChina was the same in 1978 as it had been inthe early 1950s.
In response to the perception that the systemof collective agriculture was not working,China initiated HRS in 1979. This reformradically altered the organization ofproduction in agriculture and the incentivesfor rural households (Rozelle et al., 2008).The HRS reforms dismantled agriculturalcollectives and contracted agricultural land tohouseholds, mainly on the basis of family sizeand the number of labourers in eachhousehold. Significantly, control and incomerights belonged to individuals after the HRS
reforms. Land was not privatized, however:ownership remained with villages of about300 households or small groups of 15–30households. Even if they did not own theland, farmers were able to keep all of thegrain earnings. In economic terms, farmhouseholds became the residual claimantsto their effort.
By 1984, 99 percent of agricultural land wascontracted to individual households for15 years; average farm size was about 0.6 ha,but this varied among regions from morethan 1 ha in the northeast and nearly 1 ha innorthern China to 0.5 ha in southwest Chinaand 0.2–0.3 ha in the south. Because thenumber of crop seasons per year on a singleplot of land increases from one in thenortheast to two or three in the south,variations in sown areas in China’s regionsare less than those of farm size.
The impact of the HRS reforms could nothave been more dramatic (Lin, 1992).Productivity rose. Output rose. Incomes rose.It is often thought that this rise in thevibrancy of the rural economy was one of thetriggers of the rest of the economic reforms inChina (Rozelle et al., 2008).
During the 1980s and 1990s there wereconcerns about the long-term sustainabilityof the reforms. Some people worried that landrights were not secure. Contracts were onlyfor 15 years in the early 1980s and wouldexpire in the late 1990s. There was concernthat productivity was flagging because of poorland rights (Wen, 1995). Researchsummarized in Brandt et al. (2002) showedthat the system of land rights initiated by theHRS reforms was mainly beneficial tofarmers and that the cost of insecure tenurewas not too serious for agricultural output, atleast in the short term.
After several years of policy debate, leadersseemed to come to a consensus. One of the
most important changes in recent years hasbeen the renewal of land-use contracts for anadditional 30 years. By 2000, 98 percent ofvillages had amended their contracts withfarmers to reflect these long-term rights(Ministry of Agriculture, 2001). Cultivatedland is not private, but the right to use landwas granted until 2028.
With the issue of use rights resolved, theGovernment is seeking a mechanism thatwould permit the remaining full-time farmersto gain access to additional arable land andincrease their incomes and competitiveness.A major new policy is established by theRural Land Contract Law (RLCL) approved in2006 by the Standing Committee of theNational People’s Congress, according towhich ownership of land remains with thecollectives but other rights are given tocontract holders such as they would haveunder a private property system. Inparticular, RLCL clarifies the rights oftransfer and exchange of contracted land: thismay be taking effect already, becauseresearchers are finding that more land inChina is being rented. The law also allowsfamily members to inherit land during thecontract period. The aim is to encouragefarmers to use their land to increase short-term and long-term productivity.
Even after the enactment of RLCL, villageauthorities in some parts of China havecontinued to interfere with the conferredrights (Rozelle et al., 2008); other groupshave wanted to strengthen the rights offarmers with respect to their cultivated land(Zhang et al., 2008). In response to thisdebate, China’s central leadership has begunto increase the rights of rural families overtheir cultivated land. The recentpronouncements at the Third Plenary Sessionof the 17th Central Committee of theCommunist Party of China try to bringforward implementation of RLCL. There is aperception that despite RLCL, tenure securityis still weak, and as a result farm size and thequality of investments in land are limited.Without secure tenure, rural residents do not
have the asset base to access finance thatwould permit them to move to cities, improvetheir land or expand off-farm businesses. Thedebate in China is now whether or not therural economy is ready for indefinite, titledland security. Fully secure tenure willprobably not occur immediately, but with thecontinued effort of reformers it will graduallybecome stronger.
DEVELOPMENT ANDDISSEMINATION OFAGRICULTURAL TECHNOLOGY
The importance of agricultural research andextension in increasing agriculturalproductivity in developing countries is nowwidely recognized. Successful developmenthas been shown to be tied to productivitygrowth in the agricultural sector (WorldBank, 2008). In a country such as Chinawhere agriculture is dominated by smallfarms, it is even more important.
During the reform era, it was not alwaysclear whether China would be able tomaintain the pace of technological advanceneeded to maintain farm incomes in adynamic economy. HRS was fundamentalin increasing productivity (Lin, 1992), but inthe early stages of reform it provided only aone-off boost. The evidence suggests thatafter1985 technological advances were themain engine of productivity growth (Huangand Rozelle, 1996). China was one of the firstcountries to develop and extend GreenRevolution technology in the 1960s, 1970sand 1980s. China’s scientists developedhybrid rice in the late 1970s, and until themid-1990s China was the only country tohave commercialized this new technology.
Despite these and other successes, China’ssystem of agricultural research faced majorchallenges by the late 1980s (Pray et al.,1997). Research investment, almost entirelypublicly funded, was declining; incentiveswere poor, and funding was being allocated in
16
17
ways that did not always reward excellence.The system was not responding to manydemands for new technologies, and theextension system was chaotic.
Nationwide reform of research was launchedin the mid-1980s (Pray et al., 1997) toincrease research productivity by shiftingfunding from institutional support tocompetitive grants, supporting researchuseful for economic development andencouraging applied research institutes tosupport themselves by selling the technologythey produced. In the late 1980s and early1990s, new horticultural seeds, improvedbreeding livestock (Rae et al., 2006) andnew dairy technologies were imported(Ma et al., 2006).
After a decline from the early 1980s to themid-1990s (Pray et al., 1997), investment inR&D began to rise. Funding for plantbiotechnology was increased, but to date onlyBacillus thuringiensis (Bt) cotton has beencommercialized in a major way (Huang et al.,2002, 2003). China is now a global leader inagricultural biotechnology: in the late 1990s,China invested more in agriculturalbiotechnology research than all otherdeveloping countries combined, and its publicspending on agricultural biotechnology wassecond only to the United States. Investmentin government-sponsored R&D increased by5.5 percent annually between 1995 and 2000and by 15 percent per year after 2000 (Hu etal., 2007). During the past decade theincrease in investment in rural R&D has beenthe most rapid of any large nation.
The investment in R&D has paid off. DuringChina’s early reform period, yields of majorfood crops rose steadily (see Table 8, column1). Although some of that yield increase arosefrom greater efficiency in input use,technological improvements appear to haveaccounted for some of it, because indices ofaggregated inputs – measures of land, labourand material inputs – for rice, wheat andmaize actually fell during the early 1980s(column 2).
Although there was concern about the effectof the slowdown on R&D spending during the1980s and early 1990s, Table 8 columns 3and 4 show that the growth of outputcontinued to outpace the growth of inputs;Table 9 column 2 shows that productivitytrends continued to rise. During this time andduring the early reform period, China’s totalfactor productivity (TFP) rose at the healthyrate of 2 percent per year. Such a rise, whichoccurred in all provinces and with all crops,must have increased the incomes of allfarmers regardless of whether the crop wasbeing protected or taxed.
It is possible that the extension of newtechnologies might have favoured wealthierfarmers at the expense of poorer farmers, butthis does not seem to have happened inChina. Huang et al. (2002 and 2007) showthat when new technologies are released,poor farmers are just as likely to adopt themas wealthier farmers; Jin et al. (2001) showedthat TFP in poorer areas also rose very fast.There is no measurable negative impact ofthe extension of new agricultural technologieson the poor in China.
POLICIES TO ENCOURAGE MARKETINTEGRATION AND EFFICIENCY
Price and marketing reforms have beenimportant components of China’s transitionfrom a centrally planned to a market-orientedeconomy. These policies were implemented ina gradual way (Sicular, 1995). In the initialyears there was little effort to create aneconomy in which most resources and factorswere allocated according to market pricesignals. But as officials in charge of economicreform began to be committed to usingmarkets as the primary means of allocatingresources for the economy, commitment toallowing markets in agriculture also increased(Sicular, 1995).
As markets began to emerge, China’s leadersencouraged market efficiency and, more
important, stepped aside and allowed them toexpand in an environment with minimumdistortions. National and provincialgovernments invested in roads, landlinetelephones and cellular technology, whichreduced transaction costs and accelerated theflow of information and goods (Park et al.,2002). Many regional and local governmentsinvested in internet marketing sites and triedto attract commercial interests to set upbusinesses. Except for a short period in thelate 1990s, government officials have steppedback and allowed the entry of private tradersand private transport and done little tointerfere with markets. Licensing fees andtaxes are low or non-existent. Markets wereencouraged for agricultural outputs andinputs.
In assessing the health of the rural economyit is important to understand how China’smarkets function. Markets, whether classicalcompetitive markets or some workablesubstitute, increase efficiency by facilitatingtransactions among agents to allowspecialization and trade and by providingproducers and consumers with informationabout the relative scarcity of resourcesthrough a pricing mechanism. With bettermarkets, producers can begin to specialize,become more efficient and increase theirincomes.
According to price data from private sourcesand information firms, it appears that China’smarkets function relatively well: maize pricesin four different cities in northeast China, forexample, track each other closely (Rozelleand Huang, 2003, graph 1). Soybean prices inmarkets in different regions move in almostperfect concert (Rozelle and Huang, 2004,figure 2). Systematic study of the integrationof markets over time shows that the share ofmarkets that are integrated has risen from50 percent in the early 1990s to virtually100 percent in the early 2000s (Huang et al.,2004, table 10). Rice markets have also beenshown to function as well as or better thanthose in the United States in terms of theefficiency of moving commodities between
China’s producing and consuming regions(Huang et al., 2004). Horticultural, dairyand livestock markets are dominated bymillions of small traders operating inextremely competitive environments (Rozelleet al., 2008).
The improvement in markets has allowedindividual producers to specialize as neverbefore. According to one national survey thenumber of villages that have becomespecialized producers of a single commodityrose from 20 percent in 1995 to 40 percent in2004 (Rosen et al., 2004). Such integrationhas allowed small farmers to participate inemerging markets and to accrue thesubstantial income gains associated withmoving from subsistence to marketing (Wanget al., 2007; Balat and Porto, 2006). A recentsurvey of the Beijing area found that smallfarmers living in poor villages were the mainbeneficiaries of new demand for horticulturalproducts.
Most important, when markets in Chinabegan to become more competitive andefficient they led to increased productivityand efficiency (de Brauw et al., 2004). Evenwhere market and trade liberalizationreduced protection and adversely affectedincomes, the effects of rising productivity andefficiency have at least partly offset thesenegative impacts. This interpretation issupported by the modelling in Huang and Li(2003), which finds that trade policypositively affects some prices, for examplehorticultural crops, but negatively affectsothers such as wheat and causes farmers tomitigate the downside effects by transferringproduction into commodities with risingprices.
Since 2004, in the wake of China’s domesticmarket liberalization, policymakers have beenconcerned about the possible effects onincomes of a possible severe drop inagricultural prices. The Government, fearingthat low prices might adversely affect nationalfood production and farmers’ incomes,began to plan for such a contingency by
18
19
announcing a “minimum agricultural pricingpolicy”. This is intended to work byauthorizing managers of grain reserves to buyrice, wheat and maize aggressively whenmarket prices reach a set minimum and placethem in storage. The policy does notauthorize the grain managers to give farmersa certain price for any grain sold to them, aspricing policy in the United States once did.With less grain on the market, prices shouldstabilize.
Unfortunately, it is impossible to know howwell this policy works because it has neverbeen tried: since its inception, price pressurehas been high. The biggest issue in China’sagricultural pricing was how to preventprices from rising, so it is not clear how thepolicy will work when prices begin to fall.Those interested in China’s pricemanagement during the food price volatilityof 2007 and 2008 should study Yang et al.(forthcoming).
PUBLIC FISCAL REFORMSAND INVESTMENT INAGRICULTURE/EXPANSIONOF RURAL INFRASTRUCTUREAND PUBLIC SERVICES
China has made several reforms to increasefiscal revenue and public investment. TheGovernment has made considerable progressin supporting public finances since the early1990s. If extra budgetary and social securityfunds are included, government spending was25 percent of GDP by 2006, comparable withlower-income Organisation of EconomicCo-operation and Development (OECD)countries and higher than most East Asiancountries. China has maintained a prudentfiscal policy with low deficits and debt interms of GDP while higher governmentspending stimulated the economy.
Government expenditures in most areas ofagriculture increased gradually during thereform period, but the ratio of agricultural
investment to agricultural GDP steadilydeclined from the late 1970s to the mid-1990s. In 1978, officials invested 7.6 percentof GDP in the agricultural sector; by 1995 theproportion of GDP committed to suchinvestment had fallen to 3.6 percent (NSBC,2001). There was significant capital outflowfrom agriculture to industry and from rural tourban areas during the 1980s and 1990sthrough the financial system and governmentagricultural procurement (Huang et al.,2006; Nyberg and Rozelle, 1999). From themid-1990s, China significantly increased itsinvestment in agriculture and ruraldevelopment and reduced the agriculturetax; this was eliminated in 2005/06.
Investment at the Local Level
Any visitor to rural China is struck by onething: agriculture is still being carried out inmany places in a manner that can only bedescribed as backward. Apart from a fewsuburban and coastal regions,infrastructure in rural China is poor: roads,bridges, irrigation, drainage, drinkingwater, schools and health facilities aredecades behind the infrastructure in cities.Yet development economists know that if acountry is to modernize its infrastructuremust be able to support the production andmarketing activities of a complex economy.
But there have been improvements inrecent years. Research shows that onaverage each village in China had oneinfrastructure project during the late 1990s,far more than most other developingnations in Asia. Investment activity hasincreased sharply in recent years to almostone project per year (Luo et al., 2007, table10). Most of these projects are public goodsand not activities, such as orchards, inwhich governments frequently investedduring the 1980s. Research also suggeststhat this investment is being targeted well,with increasing amounts going to poorpeople, minorities and remote partsof China.
Although the level of per capita investmentin public goods has risen from US$40 toUS$100 in PPP terms, it is still far belowthe levels enjoyed by rural residents inJapan during the 1950s and in SouthKorea during the 1970s (Luo et al., 2007).Quality is rising, but it is still low in manyvillages (Liu et al., 2007). China is justbeginning to narrow the gap between ruraland urban infrastructures; an enormoussustained effort will be required totransform the rural economy.
Education and Health Programs
Rural services, particularly education andhealth, may be the weakest part of therural economy, despite recognition of theirimportance by development economists.Rural education is very poor by anystandards. China is close to achievinguniversal compulsory education for nineyears, but until recently fees were high,even for elementary schools (see nextparagraph for discussion of recent feeexemptions); buildings and equipment areoutdated and the quality of teaching ispoor. There is evidence that China is notproviding enough education for its ruralpopulation, even as it accelerates its drivetowards industrialization and urbanizationand as agriculture becomes more complexand demanding. School fees accounted foran estimated 25 percent of totalexpenditure for many poor households,which is partly why attendance rates athigh school grades 10–12 are less than15 percent among poor rural people. Anational survey found that nearly half ofrural residents believe that education hasnot improved in recent years (Liu et al.,2007).
There has been renewed governmentinterest in improving education andreducing the cost, especially in poor ruralareas. In 2005, fees for elementary schoolswere eliminated in poor areas; in 2006this was extended to the entire rural
economy and by 2007 all compulsoryeducation was free. The income effects ofsuch policies are potentially enormous:Huang et al. (2004) show that theelimination of government tuition feesprovided a benefit twice as large as thelosses resulting from tariff reductions forChina’s protected crops. China has alsolaunched a massive investment effort toimprove the quality of facilities andteachers. There is still a long way to go, butprogress is being made in building thefoundation of tomorrow’s labour force inagriculture and other sectors.
The national and regional governmentshave also begun to build a rural healthcaresystem: the New Cooperative MedicalSystem was in high demand in its initialyears, when funding was scarce; by 2007,the Government was investing up toCNY40 (US$5.3; US$22 in PPP term) percapita in the system and in 2008 it wasannounced that investment would riseeven further. But the programme covers asmall fraction of rural out-of-pocketmedical costs, and many rural peoplereport that they do not seek healthcarebecause it is too expensive. Keeping thepopulation healthy and well nourished hasbeen a fundamental part of China’ssuccess, and it remains a significantchallenge. Readers interested in thisshould study Yi et al. (2008).
Farm Subsidies and Taxes
The Government launched a majorprogramme of direct subsidies in 2004and is debating the extent to which theseshould be increased. The national grainsubsidy system, which is designed toincrease the production of grain fornational food self-sufficiency and to be arural income-transfer programme, is acombination of four elements: i) subsidiesfor farmers in areas that grow grain;ii) nation-wide agricultural seed subsidies;iii) input subsidies – payments to help
20
21
farmers to cope with the rising costs offertilizer and other inputs; and iv) ageneral transfer programme.
Nearly 80 percent of farm householdsreceive subsidies. Participation in theprogramme is as high in poor areas as it isin wealthier areas (Tan et al., 2006).Payments were relatively small in the firstyear of the programme, but by the secondyear many farmers were receiving CNY20–30 (US$3.50, or US$11–17 in PPP terms)permu (15 mu = 1 ha).
The Government has also eliminatedalmost all taxes and fees in villages. In2001 and 2002, fees were converted to asingle agricultural tax that was not toexceed 8.5 percent of the gross value ofagricultural output of a household orvillage. But no sooner had this beenimplemented than the tax was eliminatedaltogether. Surveys show that by 2007farmers were paying almost no taxes.
A new low-income programme is alsobeing launched across China with a view todeveloping a social safety net system forpeople in the rural economy. The currentannual payments – CNY200 (US$26.3, orUS$111 in PPP terms) – are low, butcoverage is broad. A recent survey by theCentre for Chinese Agricultural Policyfound that 6 percent of rural householdsand 10 percent of households in poor ruralareas are receiving these transfers.Possible future increases in the annualamounts would help to eliminate much ofthe remaining absolute poverty andundernutrition in China.
Taken together, the recent policyinnovations in rural infrastructure, freetuition in rural schools, agriculturalsubsidies, tax reductions and healthinsurance subsidies are substantial: theyhave contributed significantly to theobserved improvements in householdincomes in rural areas.
IMPROVING MOBILITY OF LABOUROUT OF AGRICULTURE
China began the reform period with most ofits workforce in agriculture and, accordingto Gillis et al. (1996) and others China willhave to reduce this to a few percent by thetime it reaches high-income status if it is tobe considered successful in itsmodernization. In the early years of China’sreforms, the 1980s and early 1990s, therewere those who resisted this idea: someofficials thought that it would be moreattractive if China could keep most of itsrural labour force on the land and resist themassive urbanization that occurred in otherdeveloping countries.
In recent years there has been a clearacceptance of the need to shift most ofChina’s agricultural labour force to theindustrial and service sectors and most ofthe rural population to towns. Thisconsensus can be seen in many recentpolicies such as those aiming to givemigrants legal status in cities, those aimingto increase protection in the labour forceand those aiming to facilitate migrants’access to health and education services.These changes are driven largely by aleadership that has accepted the fact thatmost of the labour force in developedcountries is in the industrial and servicesectors and most of the populations arein towns.
Can this shift in policy be associated withchanges to the rural labour force? The rate ofmigration out of agriculture is consistent withChina’s growth and is one of the most rapidever observed. A study by the Centre forChinese Agricultural Policy showed that80 percent of rural labourers have shiftedtheir employment into the off-farm sector(Zhang et al., 2008, table 12). More and moreemployment opportunities for the migrantlabour force are in cities; there are probably170 million rural migrants in China’s cities.The self-employed sector in rural China,which employs 80 million people, is
becoming more profitable and capital-intensive as it shifts to more sophisticatedindustrial and service sectors.
Have farmers benefited? Migration is withoutdoubt one of the driving forces in the increasein the well-being in the rural economy.Rozelle (1996) showed that obtaining accessto off-farm jobs was the most effective wayfor rural households to raise their incomes.De Brauw and Giles (2008) link migrationwith rising rural incomes and a fallingpoverty rate.
At one time in the 1990s there was adownside to the rise in off-farm employmentand migration: when some families got off-farm jobs and increased their incomes morethan others, inequality in the rural sectorincreased; Rozelle (1996) demonstrates thislinkage clearly for the 1980s and early 1990s.Most households now have at least oneperson working off-farm. Rozelle et al.(2008) report that income inequality in ruralareas is now falling because of migration.
Are there still problems? Yes, there are many.Although 60 percent of the rural labour forcehave off-farm jobs, there are still 200 millionpeople who do not. Many of the jobs areunskilled. Wages are still low.
What are the constraints to making morepermanent shifts in labour from rural tourban areas and from the agricultural to theindustrial and service sectors? Having enoughjobs, as always, is one constraint. Beyond thecreation of more jobs, which is not a ruralpolicy issue, there are other barriers. In mostrapidly growing economies, poor humancapital is frequently seen as the most seriousconstraint. The usual resistances to out-migration of labour are compounded by anumber of China-specific factors: one is thehukou residence permit system, which hasrestricted the movement of labour into towns(Zhao, 1999); another is the land tenuresystem, where households leaving theagricultural sector are not able to collateralizetheir land; and despite official policies that
state otherwise, there are still some villagesin which families migrating to cities arepressured to relinquish their land (Zhao,1999). Other China-specific resistance comesfrom institutional barriers that keep rural andurban populations separate: for example,there are still inequities in levels of spendingand access with regard to education, healthand welfare services.
OTHER POLICIES
In addition to these policies on cultivatedland, agricultural technology, promotion ofmarkets, investment in agriculture and therural economy and labour market initiatives,there are many others that we are unableto address because of space limitations. In therest of this section we touch on some of themore obvious omissions and suggest otherpapers that might enhance understandingof them.
The most glaring omission concerns theagricultural trade policy. Trade is importantbecause it provides export opportunities forfarmers and is a way to increase access tobetter and less expensive commodities. It isalso a way to allow world markets to sendsignals to China’s policymakers, agriculturalproducers and others as to the commoditiesin which China has a comparative advantageand those in which it does not. If such signalsare allowed to get through to farmers throughliberalized trade policies in addition to thedomestic market reforms discussed above,the economy will become more efficient andincrease incomes. It is important to note,however, that trade liberalization will hurtsome groups in China.
China has been very successful in its effortsto liberalize agricultural trade. Trade barriershave fallen. Rights to import have beenextended in the case of most commodities tothousands of private traders and tradingenterprises. Non-tariff barriers have beenreduced. On the one hand there is evidence
22
23
that China has responded to signals fromworld markets and made adjustments in itsproduction structure to reflect itscomparative advantage; on the other, Chinahas tried to minimize the impact on thosehurt by trade liberalization. Readers shouldconsult Huang et al., (2004) for more details.
A great deal of work has also been done onwater policy. Before economic reform thestate focused largely on building dams andcanal networks, and China today has one ofthe most irrigated agriculture’s in the world.China’s surface water management isadvanced, and flood control is beingmaintained.
After the 1970s there was greater focus onincreasing the use of China’s vastgroundwater resources (Wang et al., 2005),but the country had little experience ofmanaging them. By 2005 China had moretube wells than any country in the worldexcept possibly India. Investment wasinitially put up by local governments withsupport from county and provincial waterbureaux, but by the 1990s the Governmentwas encouraging the huge shift in ownershipthat was occurring as pumps, wells and otherirrigation equipment went largely into thehands of private farming families (Wang,2000). At the same time private watermarkets, in which farmers pumped waterfrom their wells and sold it to other farmers,were also encouraged. After the mid-1990s,the main policy initiative in the surface water
sector was management reform with the goalof trying to make water use more efficient.
This investment in groundwater is a tale ofgood news and bad news. New sources ofgroundwater are increasing agriculturalcultivated area and have been shown toincrease farmers’ incomes and productivity(Huang et al., 2006), and the privatizationmovement has made water managementmore efficient (Wang et al., 2008). ButChina’s groundwater is currently in crisis inmany places: groundwater tables are fallingand many wells are being pumped dry. Thereis no immediate danger in these areas ofChina, but in the longer term thesesustainability issues need to be addressed.Interested readers should study Wang et al.(2008) for a summary of China’s agriculturalwater management policies, successes andchallenges.
Other rural policies, for example those thatgovern the emergence of village enterprises,privatization and rural governance, almostcertainly have a large indirect effect onagriculture. Urban employment policies,residence restrictions, exchange ratemanagement and other policy initiatives alsohave an impact on agriculture by affectingrelative prices in the economy, access to off-farm jobs and the attractiveness of staying onfarms. Brandt and Rawski (eds., 2008) isperhaps the best source today on theeconomic reforms and current and futureeconomic policy issues.
Together, the policies discussed above havehad a dramatic effect on China’s agriculturalsector: they have increased the output offood, driven prices down and improvedsupplies of non-grain food and rawmaterials for industry. The mix of policies –pricing, improved property rights, marketliberalization, investment and trade – hasmade producers more efficient and has freedthe labour and resources behind thestructural transformation of the agriculturaleconomy and the broader rural economy.
One of the most convincing indications thatagriculture is beginning to have an effect inChina’s development is that the importanceof grain is declining in the crop sector, theimportance of cereal crops is declining inthe agricultural sector and the share ofagriculture is shrinking in the nationaleconomy. But food prices remain low, thecalories available for the population aremore than sufficient, and rural productivityand incomes are increasing.
Many of the improvements in welfare,however, are being generated by the200 million individuals who have beenable to move from grain into high-valuecrops, from crop production into livestockand fisheries and, most important, fromagriculture and the rural economy intojobs in cities.
THE MAIN CHALLENGES TOCHINA’S DEVELOPMENT
Despite these successes, many challengesremain. There are challenges of equity andincome distribution affecting people whohave not been able to participate in China’soverall economic growth. And althoughoverall success on the economic front isclear, the impact of development on theenvironment and natural resources is yet
to be determined. Finally, there are foodsecurity concerns in terms of the impact ofthe new policies on long-term nutrition andaccess to food.
Equity and Income Distribution.
Despite the notable progress in agriculture,there are many lessons and challengesahead. The transition to a market-orientedrural economy is largely complete, butChina’s main challenge has shifted tobroader development issues: in the comingyears the development process will have tobe fundamentally different from earlierefforts, whose goals were meeting thenation’s food needs, poverty reduction andeconomic growth.
China’s rapid economic growth and theincrease in the nation’s wealth have beenaccompanied by increasing incomeinequality. Regional income disparity hasbeen enlarging since 1980s (Cai et al.,2002; World Bank, 2002), with easternChina growing faster than central andwestern China. After the one-time impactof the rural institutional reforms, incomegrowth in towns has been consistentlyhigher than in rural areas: by 2004 percapita income in towns was 3.21 timesgreater than in the rural areas (NSBC,2005). Rising income disparity in ruralareas has also emerged: Gini coefficients inrural areas, for example, increased from0.24 in 1980 to 0.37 in 2003 (NSBC RuralSurvey Department, 2004).
In the coming years these concerns haveto be faced. The policies of investment inagriculture and infrastructure, theincrease in labour mobility and thedevelopment of a set of public serviceswill have a part to play.
24
Summary and Lessons
25
Natural Resources and theEnvironment.
Innovations in technology will help Chinato increase its agricultural productivity,but it must address water scarcity. Watershortages and increasing competition fromindustry and domestic use offer little hopefor large increases in the areas underirrigation and related increased output(Lohmar et al., 2003). This is particularlyimportant in the North China Plain, wheremost of China’s wheat and some of itsmaize are produced. Although China’s landpolicy helped to increase agriculturalproductivity in the early reform period andcontributed significantly to the reductionof rural poverty, land holdings are so smallthat farming alone cannot continue toraise the incomes of most ruralhouseholds. The challenge is to establishlinkages between rural and urban areasand encourage a large shift of labour outof agriculture. There is also a danger thatpoor under-educated small farmers maynot have the means or the incentive tomake farming decisions that contributeto long-term sustainable development.
Trends in environmental degradationsuggest that there is considerable stress onthe agricultural land base. Judicious useof modern technologies is essential forthe efficient production of food, butinappropriate use of technologies such asexcessive application of fertilizers andpesticides or imbalances in thecombination of inputs can result in seriousenvironmental problems and food safetyconcerns. China is now the world’s largestconsumer of chemical fertilizer andpesticide – but intensive use of theseproducts can have adverse effects. There isgrowing concern about contaminationof farm produce and damage to theagro-ecosystem and human health.Environmental stresses are evident interms of soil erosion, salination, loss ofcultivated land and declining land quality(Huang and Rozelle, 1995). Deng et al.
(2006) show that although China did notrecord a decline in total cultivated landfrom the late 1980s to the late 1990s,average potential productivity of cultivatedland – or bioproductivity – declined by2.2 percent over the same period. And alarge decline in cultivated land wasrecorded after the late 1990s as a result ofindustrial development and urbanexpansion.
These amount to concerns about futurefood security in that the pressures on theenvironment will undermine past progressin food production. Policies must thereforebe evaluated in terms of the balancebetween current and future foodproduction.
PROSPECTS FOR CHINA’SAGRICULTURE IN THE FUTUREAND LESSONS FOR OTHERNATIONS
Nearly three decades of economic reformin China have achieved remarkableeconomic growth and structural changes.During the 1980s, 1990s and early 2000sChina became one of the fastest growingeconomies in the world, with GDP growingby 10 percent annually. Over the course ofthe reform period, rural and urbanincomes increased noticeably. Risingincome was also associated with asubstantial reduction of poverty andsignificant improvements in food security.
China’s rapid growth would not have beenpossible without its economictransformation and its “open-door” policy.Growth in the agricultural sectorfacilitated the transition from a rural,agriculture-based economy to one basedon urban industry and services. Thegrowth in agricultural productivity enabledChina to convert its large pool of rurallabour into cheap labour forindustrialization. Increasing international
trade and foreign direct investment wasthe other engine of economic growth andstructural shifts to more competitivesectors.
Food security is a central aim of China’sagricultural policy. Since the early 1980sreforms to increase agricultural growthand farm incomes have covered mostaspects of the economy: these started withland reform and gradually moved to inputand output markets and from agriculture-specific policies to macroeconomic policy.The reforms had significant impacts on theeconomy: China was able to feed itsgrowing population from limited naturalresources and developed itself as anexporter of food and agricultural products.Per capita availability of food, for whichincreased domestic production is almostsolely responsible, household food securityand nutrition have all improvedsignificantly.
China’s experience demonstrates theimportance of technological development,institutional change, market liberalization,public investment and policies to improveagricultural productivity, farmers’ incomesand food security in a nation with limitedland and natural resources. Technology hasbeen the engine of growth in China’sagricultural economy. Institutionalarrangements and government policies alsoplay an important part in making foodavailable for the whole Chinese population.
Challenges related to the agriculturalsector remain, but we are optimistic withregard to China’s future growth. China hasestablished land policies, R&D policies andmarketing policies and has invested ininfrastructure, but future policies will needto balance growth, efficiency and equityand address the need for sustainable foodsecurity for China and the rest of theworld.
This study also suggests significant policyimplications for other developing
countries, which can learn a great dealfrom the set of policies underlying China’sprogress. There are also possible gainsfrom interaction: countries withagricultural economic structurescomplementary to China’s may benefitfrom China’s increasing imports of land-intensive agricultural products and exportsof labour-intensive agricultural products.But countries with similar agriculturalexport structures, and therefore incompetition with China, will have to workto reduce the costs of production andmarketing.
Challenges in policy-making includedeciding not only which policies to adoptbut the order in which they should beadopted. Study of China’s reforms revealsa clear order in the reform anddevelopment policies behind its growthduring the past 30 years. China led with aset of reforms that provided incentives forfarmers to increase their output and thatgave them the benefits of their work. Landwas not privatized, but use and incomerights were. Farmers saw and exploited theopportunities to improve their lives.During and after the early reform period inthe 1980s, the Government invested inagricultural technology and made sure itwas available to all farmers, large andsmall, rich and poor. The second stage ofreform saw improvements in markets anddomestic prices. There were few marketsin the 1980s, but throughout the 1990smarkets were encouraged by removingregulation for entry, building transportand communication infrastructures andeliminating state activities in domestictrade. Labour markets were liberalized,and farmers were encouraged to search foroff-farm employment outside villages andfor self-employment. As domestic marketsdeveloped it became clear that betterincentives and clearer price signals wouldbe produced if China’s external sector wereliberalized. During this second period,state investments were mainly in regionalprojects for roads and communications. As
26
27
markets began to mature and the economy– which now had good incentives and sentout efficient price signals – China decidedin the 2000s that its enormousrural/agricultural sector needed furtherencouragement. It therefore initiated localinvestment in poor communities in roads,irrigation, drinking water, publiceducation and health services, and directsubsidy programmes.
The order in which development policiesare implemented is subject to country-specific factors that cannot be discussedhere. Swinnen and Rozelle (2006),however, examine the development recordof 20 nations in transition between theearly 1980s and the 2000s: they consider
why some were successful and others werenot and try to identify the various politicaland economic factors involved. Theirargument is that at least four groups offactors determine the order and pace ofdevelopment policy implementation: i) thenature of a nation’s agriculturaltechnology; ii) the extent to which the statecommands fiscal resources; iii) the politicsof the country and the extent of politicalsupport for reform and development; andiv) cultural and other factors such as thenature of ties with developed regions.Policymaking is more of an art than ascience, and good governance is anecessary condition for launching asuccessful development or transitionprocess.
Balat, J. & G. Porto. 2006. The WTO DohaRound, Cotton Sector Dynamics, and PovertyTrends in Zambia. InHertel, T. and L.A.Winters (eds.) Poverty and theWTO: Impactsof the Doha Development Agenda.Basingstoke, UK, and Washington DC,Palgrave Macmillan and the World Bank.
Brandt, L. & Rawski, T.G. (eds). 2008. China’sGreat Economic Transformation. CambridgeUniversity Press, Cambridge, UK.
Brandt, L., Huang, J., Li, G. & Rozelle, S. 2002.Land Rights in China: Fact, Fiction, andIssues. China Journal, 47(1):67–97.
Brandt, L., Rawski, T.G. & Lin, G. 2005.China’s Economy: Retrospect and Prospect(edited ). Asian Program Special Report no.129. Woodrow Wilson International Center forScholars, Washington DC.
Branstetter, L. & Lardy, N. 2005. China’sEmbrace of Globalization. In: China’sEconomy: Retrospect and Prospect (edited ).Asian Program Special Report no. 129.Woodrow Wilson International Center forScholars, Washington DC.
Cai, F., Wang, D. & Du, Y. 2002. RegionalDisparity and Economic Growth in China: theImpact of Labour Market Distortions. ChinaEconomic Review, 13(2–3):197–212.
Chen , C. 2004. Ten Years: Tracks of ChinaNutrition Situation in 1990–2000. Beijing,People’s Health Press.
de Brauw, A. & Giles, J. 2008.Migrant LabourMarkets and theWelfare of Rural Householdsin the DevelopingWorld: Evidence fromChina. Policy Research Working Paper Series4585. Washington DC, World Bank.
de Brauw, A., Huang, J. & Rozelle, S. 2004. TheSequencing of Reform Policies in China’sAgricultural Transition. The Economics ofTransition 12(3):427–465.
de Brauw, A., Huang, J., Rozelle, S., Zhang,L. & Zhang, Y. 2002. China’s Rural LabourMarkets. The China Business Review (3–4):2–8.
Deng, X., Huang, J., Rozelle, S. & Uchida,E. 2006. Cultivated Land Conversion andPotential Agricultural Productivity in China.Land Use Policy 23:372–384.
Fan, S. 1991. Effects of Technological Changeand Institutional Reform on ProductionGrowth in Chinese Agriculture. AmericanJournal of Agricultural Economics 73:266–275.
Fan, S. 1997. Production and ProductivityGrowth in Chinese Agriculture: NewMeasurement and Evidence. Food Policy 22(3):213–228.
Fan, S. & Pardey, P. 1997. ResearchProductivity and Output Growth in ChineseAgriculture. Journal of DevelopmentEconomics 53(6):115–137.
FAO. 2002. The State of Food Insecurity inthe World 2001. Rome.
Giles, J. 2000. Risk and Rural Responses inChina. Working paper. Michigan StateUniversity, East Lansing, MI, USA.
Gillis, M., Perkins, D., Roemer, M. &Snodgrass, D. 1996. Economics ofDevelopment. New York, W.W. Norton,4th edition.
Hu, R., Shi, K., Cui, Y. & Huang, J. 2007.China’s Agricultural Research Investmentand International Comparison. China’s Soft-Science 2:53–65.
28
References
29
Huang, J. & Bouis, H. 1996. StructuralChanges in Demand for Food in Asia. Food,agriculture and the environment discussionpaper. Washington DC, International FoodPolicy Research Institute.
Huang, J. & Chen, C. 1999. Effects of TradeLiberalization on Agriculture in China:Institutional and Structural Aspects. Bogor,Indonesia, United Nations Economic andSocial Committee for Asia and the PacificRegional Coordination Centre for Research andDevelopment of Coarse Grains, Pulses, Rootsand Tuber Crops in the Humid Tropics of Asiaand the Pacific.
Huang, J., Hu, R. & Rozelle, S. 2003.Agricultural Research Investment in China:Challenges and Prospects. China Finance andEconomy Press, Beijing.
Huang, J. & Li, N. 2003. China’s AgriculturalPolicy Analysis and Simulation Model –CAPSiM. Journal of Nanjing AgriculturalUniversity 3(2):30–41.
Huang, J., Qiao, F., Zhang, L. & Rozelle, S.2000. Farm Pesticides, Rice Production andthe Environment. EEPSEA research report,2001–RR3. Singapore, InternationalDevelopment Research Centre.
Huang, J. & Rozelle, S. 1995. EnvironmentalStress and Grain Yields in China. AmericanJournal of Agricultural Economics 77:853–864.
Huang, J. & Rozelle, S. 1996. TechnologicalChange: Rediscovery of the Engine ofProductivity Growth in China’s RuralEconomy. Journal of Development Economics49(2):337–369.
Huang, J. & Rozelle, S. 1998. MarketDevelopment and Food Consumption in RuralChina. China Economic Review 9:25–45.Huang, J. & Rozelle, S. 2003. Trade Reform,WTO and China’s Food Economy in the 21stCentury. Pacific Economic Review 8(2):143–156.
Huang, J. & Rozelle, S. 2006. The Emergenceof Agricultural Commodity Markets in China.China Economic Review 17:266–280.
Huang, J., Rozelle, S. & Chang, M. 2004.Tracking Distortions in Agriculture: China andits Accession to the World Trade Organization.World Bank Economic Review 18(1):59–84.
Huang, J., Rozelle, S. & Pray, C. 2002.Enhancing the Crops to Feed the Poor.Nature418(8):678–684.
Huang, J., Hu, R., Rozelle, S. & Pray, C. 2005.Insect-Resistant GM Rice in Farmer Fields:Assessing Productivity and Health Effects inChina. Science 308:688–690.
Huang, J., Rozelle, S., Pray, C. & Wang, Q.2002. Plant Biotechnology in China. Science295:674–677.
Huang, J, Rozelle, S. & Rosegrant,M. 1999.China’s Food Economy to the 21st Century:Supply, Demand and Trade.EconomicDevelopment and Cultural Change 47:737–766.
Huang, J., Rozelle, S. & Wang, H. 2006.Fostering or Stripping Rural China:Modernizing Agriculture and Rural to UrbanCapital Flows. The Developing EconomiesXLIV–1:1–26.
Huang, Q., Lohmar, B., Rozelle, S., Huang,J. & Wang, J. 2006. Irrigation, AgriculturalPerformance and Poverty Reduction in China.Food Policy 31:32–52.
Jin, S., Huang, J., Hu, R. & Rozelle, S. 2002.The Creation and Spread of Technology andTotal Factor Productivity in China’sAgriculture. American Journal of AgriculturalEconomics 84(4):916–939.
Jin, S., Ma, H., Huang, J., Hu, R. & Rozelle,S. 2007. Productivity, Efficiency and TechnicalChange: Measuring the Performance ofChina’s Transforming Agriculture. Paper forconference: Trends and Forces in InternationalAgricultural Productivity Growth, WashingtonDC.
Lardy, N.R. 2001. Integrating China into theGlobal Economy. Washington DC, BrookingsInstitution.
Lardy, N.R. 1995. The Role of Foreign Tradeand Investment in China’s EconomicTransition. China Quarterly 144:1065–1082.
Lin, J.Y. 1992. Rural Reforms and AgriculturalGrowth in China. American Economic Review82:34–51.
Liu, C., Zhang, L., Huang, J. & Rozelle, S. 2007.Quality and Quantity Trade-Offs in the PublicGoods Investments in Rural China. Workingpaper, Centre for Chinese Agricultural Policy.Beijing, Institute of Geographical Sciences andNatural Resource Research, Chinese Academyof Sciences.
Lohmar, B., Wang, J., Rozelle, S., Huang,J. & Dawe, D. 2003. China’s AgriculturalWater Policy Reforms: Increasing Investment,Resolving Conflicts and Revising Incentives.Agriculture Information Bulletin no. 782.Washington DC, United States Department ofAgriculture Economic Research Service.
Luo, R., Liu, C., Zhang, L. & Rozelle, S. 2007.Investing in Rural China: a Report on aSurvey of Public Infrastructure Investment.Working paper. Beijing, Centre for ChineseAgricultural Policy, Institute of GeographicalSciences and Natural Resource Research,Chinese Academy of Sciences.
Ma, H., Rae, A., Huang, J. & Rozelle, S. 2006.Enhancing Productivity on Suburban DairyFarms in China. Working paper. Palo Alto, CA,USA, Stanford University Freeman SpogliInstitute for International Studies.McMillan, J., Walley, J. & Zhu, L. 1989. TheImpact of China’s Economic Reforms onAgricultural Productivity Growth. Journal ofPolitical Economy 97:781–807.
Ministry of Agriculture. China AgriculturalDevelopment Report, 2000 and 2002. Beijing,China Agricultural Press.
Ministry of Foreign Affairs and United Nations.2008. China’s Progress towards theMillenniumDevelopment Goals. Beijing.
Ministry of Foreign Trade and EconomicCooperation. 2002. Foreign Trade andEconomic Yearbook of China. Beijing, ChinaStatistical Press.
National Statistical Bureau of China. 1985–2008. China Statistical Yearbook. Variousissues. Beijing, China Statistical Press.
National Statistical Bureau of China RuralSurvey Department. 1982–2008. China RuralHousehold Survey Yearbook. Various issues.Beijing, China Statistical Press.
Nyberg, A. & Rozelle, S. 1999. AcceleratingChina’s Rural Transformation. WashingtonDC, World Bank.
Park, A., Jin, H., Rozelle, S. & Huang, J. 2002.Market Emergence and Transition: Arbitrage,Transition Costs and Autarky in China’s GrainMarket. American Journal of AgriculturalEconomics 84(1):67–82.
Pray C., Rozelle, S. & Huang, J. 1997. CanChina’s Agricultural Research System FeedChina?Working paper. New Brunswick, NJ,USA, Rutgers University Department ofAgricultural Economics.
30
31
Rae, A.N., Ma, H., Huang, J. & Rozelle, S.2006. Livestock in China: Commodity-SpecificTotal Factor Productivity Decomposition UsingNew Panel Data. American Journal ofAgricultural Economics 88(3):680–695.
Rosen, D., Huang, J. & Rozelle, S. 2004. Rootsof Competitiveness: China’s EvolvingAgriculture Interests. Policy Analysis inInternational Economics, vol. 72. WashingtonDC, Institute for International Economics.
Rozelle, S. 1996. Stagnation Without Equity:Patterns of Growth and Inequality in China’sRural Economy. China Journal 35(1):63–96.Rozelle, S., Huang, J. & Otsuka, K. 2008.Agriculture in China’s Development: PastDisappointments, Recent Successes and FutureChallenges. In Brandt, L. & Rawski, T. (eds)China’s Great Economic Transformation.Cambridge, UK, Cambridge University Press.
Rozelle, S. & Huang, J. 2003. China’s MaizeEconomy: Supply, Demand and Trade. Reportfor the United States Grains Council. Beijing.Rozelle, S. & Huang, J. 2004. China’s SoybeanEconomy: Supply, Demand and Trade.Report for the American Soybean Association.Beijing. Sicular, T. 1995. Redefining State,Plan and Market: China’s Reforms inAgricultural Commerce. The China Quarterly144:1020–46.
Sonntag, B.H., Huang, J., Rozelle, S. & Skerritt,J.H. 2005. China’s Agricultural and RuralDevelopment in the Early 21st Century.Canberra, Australian Centre for InternationalAgricultural Research.
Swinnen, J. & Rozelle, S. 2006. FromMarxandMao to theMarket: the Economics andPolitics of Agrarian Transition. Oxford, UK,Oxford University Press.
Tan, X., Luo, R. & Rozelle, S. 2006. The Effectsof Direct Farm Subsidies on the Income ofFarmers in China. Working paper, Center forChinese Agricultural Policy. Beijing, Institute ofGeographical Sciences and Natural ResourceResearch, Chinese Academy of Sciences.
Turgis, C. 2008. Food Security in China.Working paper, United Nations World FoodProgramme. Beijing.
United Nations. 2005.World PopulationProspects. New York.
United Nations Development Programme.2008. China Human Development Report2007/08: Basic Public Services for 1.3 BillionPeople. Beijing.
Wang, J. 2000. Property Right Innovation,Technical Efficiency and GroundwaterManagement: Case Study of GroundwaterIrrigation System in Hebei, China. Ph.D.thesis. Beijing, Chinese Academy ofAgricultural Sciences.
Wang, J., Huang, J., Huang, Q. & Rozelle,S. 2006. Privatization of Tubewells in NorthChina: Determinants and Impacts on IrrigatedArea, Productivity and the Water Table.Hydrogeology Journal 14(3):275–285.
Wang, J., Huang, J., Rozelle, S., Huang,Q. & Zhang, L. 2008.Understanding theWater Crisis in Northern China:What are theGovernment and Farmers Doing?Workingpaper, Centre for Chinese Agricultural Policy.Beijing, Institute of Geographical Sciences andNatural Resource Research, Chinese Academyof Sciences.
Wang, H., Dong, X., Huang, J., Reardon,T. & Rozelle, S. 2007. Small Traders and SmallFarmers: the Evolution of China’sHorticulture Economy. Working paper, Centrefor Chinese Agricultural Policy. Beijing,Institute of Geographical Sciences and NaturalResource Research, Chinese Academy ofSciences.
World Bank. 2002.World DevelopmentIndicators 2002.Washington DC.
World Bank. 2008a.World DevelopmentReport 2008.Washington DC.
World Bank. 2008b. China Quarterly Update(1 December 2008).Washington DC.
Yang, J., Huanguang, Q., Huang, J. & Rozelle,S. 2008. Fighting Global Food Price Rises inthe Developing World: the Response of Chinaand its Effect on Domestic and World Markets.Agricultural Economics. Forthcoming.
Yi, H., Zhang, L., Rozelle, S. & Atlas, S. 2008.China’s New Cooperative Medical System:Trends, Successes and Challenges. Workingpaper, Centre for Chinese Agricultural Policy.Beijing, Institute of Geographical Sciences andNatural Resource Research, Chinese Academyof Sciences.
Zhang, L., Li, X., Rozelle, S. & Huang, J. 2008.Rural Labour and Educational Challenges inRural China. Working paper, Centre forChinese Agricultural Policy. Beijing, Institute ofGeographical Sciences and Natural ResourceResearch, Chinese Academy of Sciences.
Zhao, Y. 1999. Leaving the Countryside: Rural-to-Urban Migration Decisions in China.American Economic Review 89(2):281–286.
32
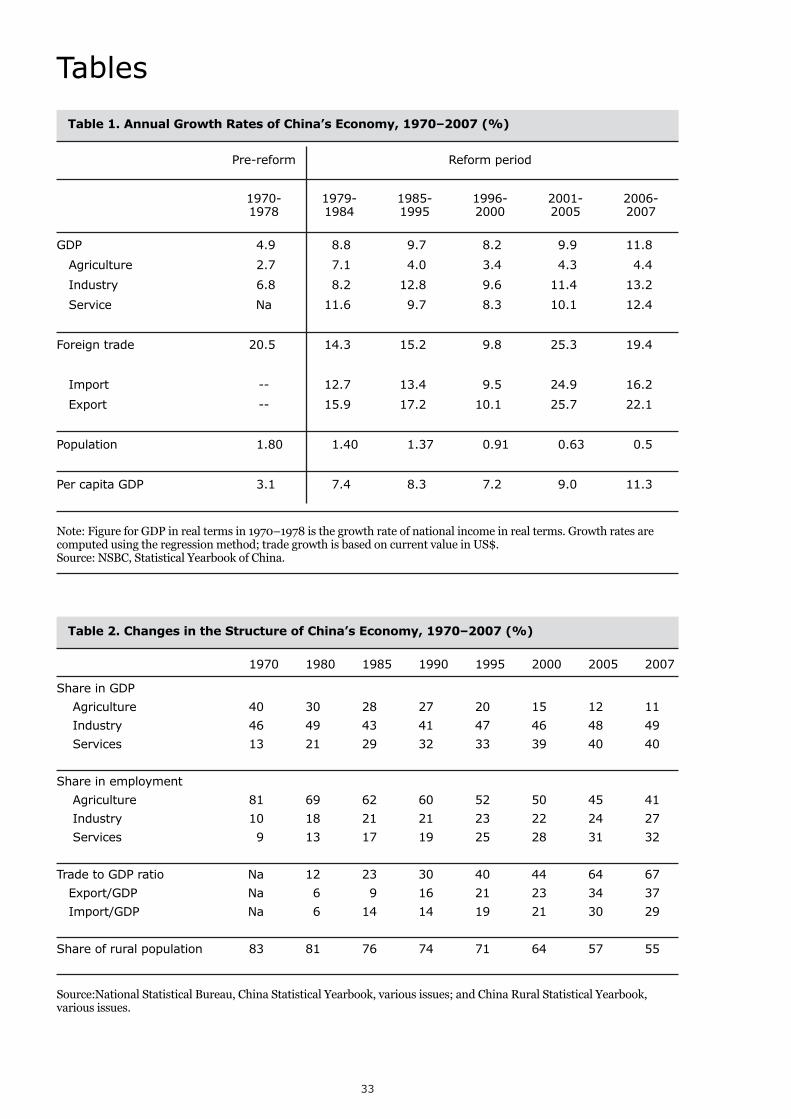
Table 1. Annual Growth Rates of China’s Economy, 1970–2007 (%)
Pre-reform Reform period
1970- 1979- 1985- 1996- 2001- 2006-1978 1984 1995 2000 2005 2007
GDP 4.9 8.8 9.7 8.2 9.9 11.8
Agriculture 2.7 7.1 4.0 3.4 4.3 4.4
Industry 6.8 8.2 12.8 9.6 11.4 13.2
Service Na 11.6 9.7 8.3 10.1 12.4
Foreign trade 20.5 14.3 15.2 9.8 25.3 19.4
Import -- 12.7 13.4 9.5 24.9 16.2
Export -- 15.9 17.2 10.1 25.7 22.1
Population 1.80 1.40 1.37 0.91 0.63 0.5
Per capita GDP 3.1 7.4 8.3 7.2 9.0 11.3
Note: Figure for GDP in real terms in 1970–1978 is the growth rate of national income in real terms. Growth rates arecomputed using the regression method; trade growth is based on current value in US$.Source: NSBC, Statistical Yearbook of China.
33
Tables
Table 2. Changes in the Structure of China’s Economy, 1970–2007 (%)
1970 1980 1985 1990 1995 2000 2005 2007
Share in GDP
Agriculture 40 30 28 27 20 15 12 11
Industry 46 49 43 41 47 46 48 49
Services 13 21 29 32 33 39 40 40
Share in employment
Agriculture 81 69 62 60 52 50 45 41
Industry 10 18 21 21 23 22 24 27
Services 9 13 17 19 25 28 31 32
Trade to GDP ratio Na 12 23 30 40 44 64 67
Export/GDP Na 6 9 16 21 23 34 37
Import/GDP Na 6 14 14 19 21 30 29
Share of rural population 83 81 76 74 71 64 57 55
Source:National Statistical Bureau, China Statistical Yearbook, various issues; and China Rural Statistical Yearbook,various issues.
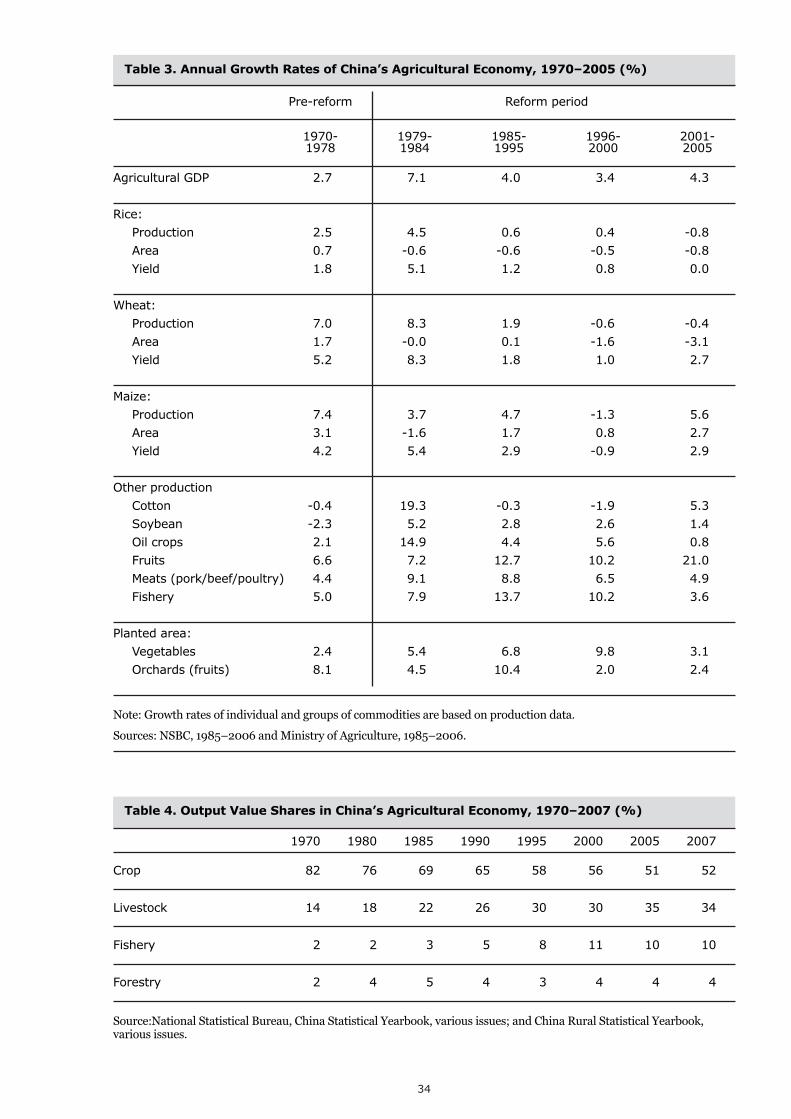
34
Table 3. Annual Growth Rates of China’s Agricultural Economy, 1970–2005 (%)
Pre-reform Reform period
1970- 1979- 1985- 1996- 2001-1978 1984 1995 2000 2005
Agricultural GDP 2.7 7.1 4.0 3.4 4.3
Rice:
Production 2.5 4.5 0.6 0.4 -0.8
Area 0.7 -0.6 -0.6 -0.5 -0.8
Yield 1.8 5.1 1.2 0.8 0.0
Wheat:
Production 7.0 8.3 1.9 -0.6 -0.4
Area 1.7 -0.0 0.1 -1.6 -3.1
Yield 5.2 8.3 1.8 1.0 2.7
Maize:
Production 7.4 3.7 4.7 -1.3 5.6
Area 3.1 -1.6 1.7 0.8 2.7
Yield 4.2 5.4 2.9 -0.9 2.9
Other production
Cotton -0.4 19.3 -0.3 -1.9 5.3
Soybean -2.3 5.2 2.8 2.6 1.4
Oil crops 2.1 14.9 4.4 5.6 0.8
Fruits 6.6 7.2 12.7 10.2 21.0
Meats (pork/beef/poultry) 4.4 9.1 8.8 6.5 4.9
Fishery 5.0 7.9 13.7 10.2 3.6
Planted area:
Vegetables 2.4 5.4 6.8 9.8 3.1
Orchards (fruits) 8.1 4.5 10.4 2.0 2.4
Note: Growth rates of individual and groups of commodities are based on production data.
Sources: NSBC, 1985–2006 and Ministry of Agriculture, 1985–2006.
Table 4. Output Value Shares in China’s Agricultural Economy, 1970–2007 (%)
1970 1980 1985 1990 1995 2000 2005 2007
Crop 82 76 69 65 58 56 51 52
Livestock 14 18 22 26 30 30 35 34
Fishery 2 2 3 5 8 11 10 10
Forestry 2 4 5 4 3 4 4 4
Source:National Statistical Bureau, China Statistical Yearbook, various issues; and China Rural Statistical Yearbook,various issues.
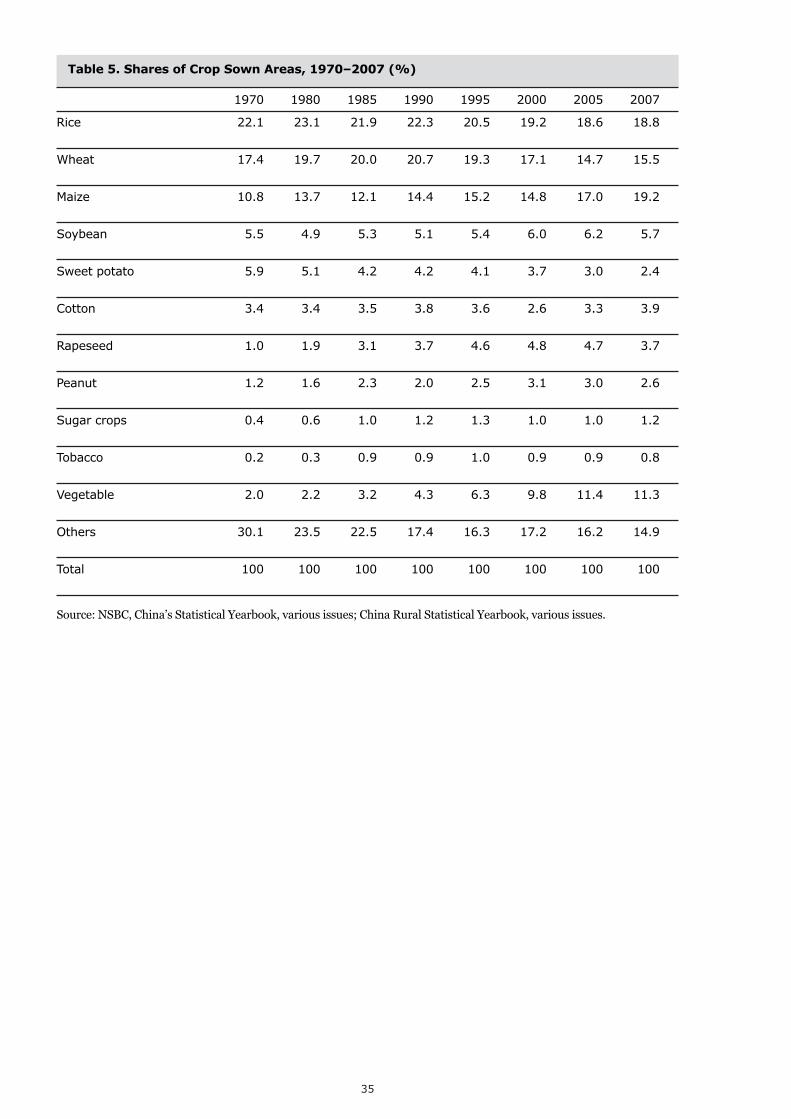
35
Table 5. Shares of Crop Sown Areas, 1970–2007 (%)
1970 1980 1985 1990 1995 2000 2005 2007
Rice 22.1 23.1 21.9 22.3 20.5 19.2 18.6 18.8
Wheat 17.4 19.7 20.0 20.7 19.3 17.1 14.7 15.5
Maize 10.8 13.7 12.1 14.4 15.2 14.8 17.0 19.2
Soybean 5.5 4.9 5.3 5.1 5.4 6.0 6.2 5.7
Sweet potato 5.9 5.1 4.2 4.2 4.1 3.7 3.0 2.4
Cotton 3.4 3.4 3.5 3.8 3.6 2.6 3.3 3.9
Rapeseed 1.0 1.9 3.1 3.7 4.6 4.8 4.7 3.7
Peanut 1.2 1.6 2.3 2.0 2.5 3.1 3.0 2.6
Sugar crops 0.4 0.6 1.0 1.2 1.3 1.0 1.0 1.2
Tobacco 0.2 0.3 0.9 0.9 1.0 0.9 0.9 0.8
Vegetable 2.0 2.2 3.2 4.3 6.3 9.8 11.4 11.3
Others 30.1 23.5 22.5 17.4 16.3 17.2 16.2 14.9
Total 100 100 100 100 100 100 100 100
Source: NSBC, China’s Statistical Yearbook, various issues; China Rural Statistical Yearbook, various issues.
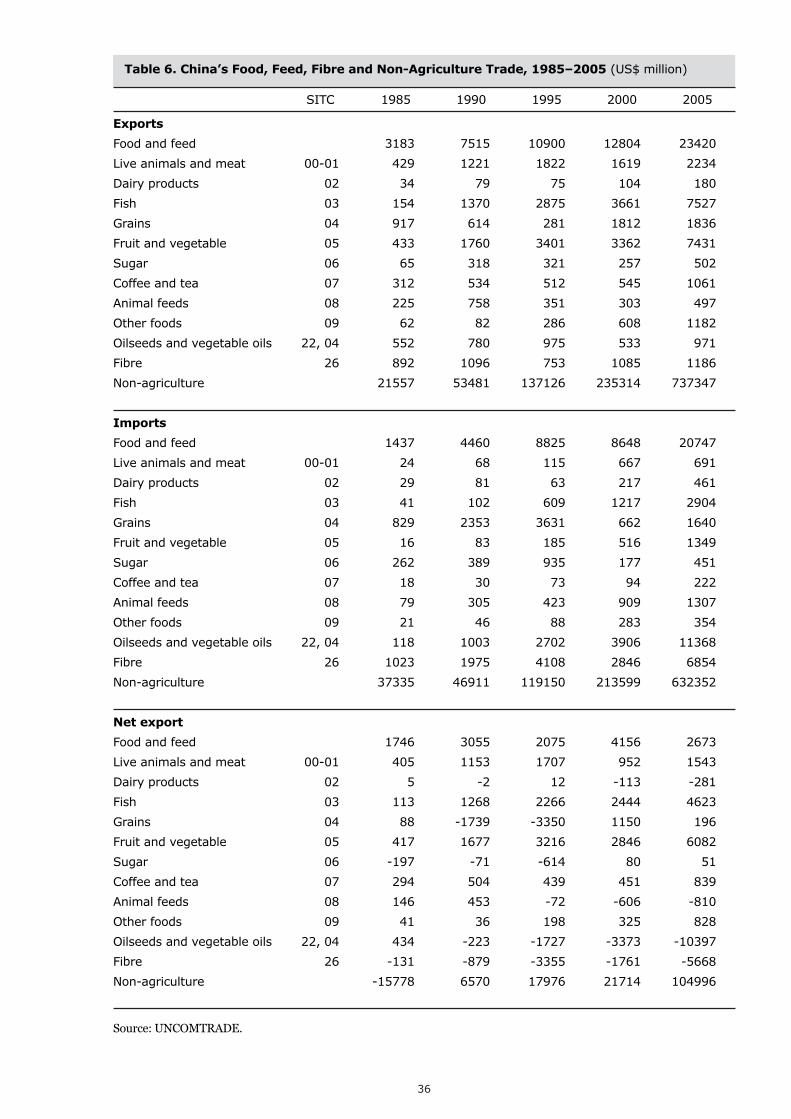
36
Table 6. China’s Food, Feed, Fibre and Non-Agriculture Trade, 1985–2005 (US$ million)
SITC 1985 1990 1995 2000 2005
Exports
Food and feed 3183 7515 10900 12804 23420
Live animals and meat 00-01 429 1221 1822 1619 2234
Dairy products 02 34 79 75 104 180
Fish 03 154 1370 2875 3661 7527
Grains 04 917 614 281 1812 1836
Fruit and vegetable 05 433 1760 3401 3362 7431
Sugar 06 65 318 321 257 502
Coffee and tea 07 312 534 512 545 1061
Animal feeds 08 225 758 351 303 497
Other foods 09 62 82 286 608 1182
Oilseeds and vegetable oils 22, 04 552 780 975 533 971
Fibre 26 892 1096 753 1085 1186
Non-agriculture 21557 53481 137126 235314 737347
Imports
Food and feed 1437 4460 8825 8648 20747
Live animals and meat 00-01 24 68 115 667 691
Dairy products 02 29 81 63 217 461
Fish 03 41 102 609 1217 2904
Grains 04 829 2353 3631 662 1640
Fruit and vegetable 05 16 83 185 516 1349
Sugar 06 262 389 935 177 451
Coffee and tea 07 18 30 73 94 222
Animal feeds 08 79 305 423 909 1307
Other foods 09 21 46 88 283 354
Oilseeds and vegetable oils 22, 04 118 1003 2702 3906 11368
Fibre 26 1023 1975 4108 2846 6854
Non-agriculture 37335 46911 119150 213599 632352
Net export
Food and feed 1746 3055 2075 4156 2673
Live animals and meat 00-01 405 1153 1707 952 1543
Dairy products 02 5 -2 12 -113 -281
Fish 03 113 1268 2266 2444 4623
Grains 04 88 -1739 -3350 1150 196
Fruit and vegetable 05 417 1677 3216 2846 6082
Sugar 06 -197 -71 -614 80 51
Coffee and tea 07 294 504 439 451 839
Animal feeds 08 146 453 -72 -606 -810
Other foods 09 41 36 198 325 828
Oilseeds and vegetable oils 22, 04 434 -223 -1727 -3373 -10397
Fibre 26 -131 -879 -3355 -1761 -5668
Non-agriculture -15778 6570 17976 21714 104996
Source: UNCOMTRADE.
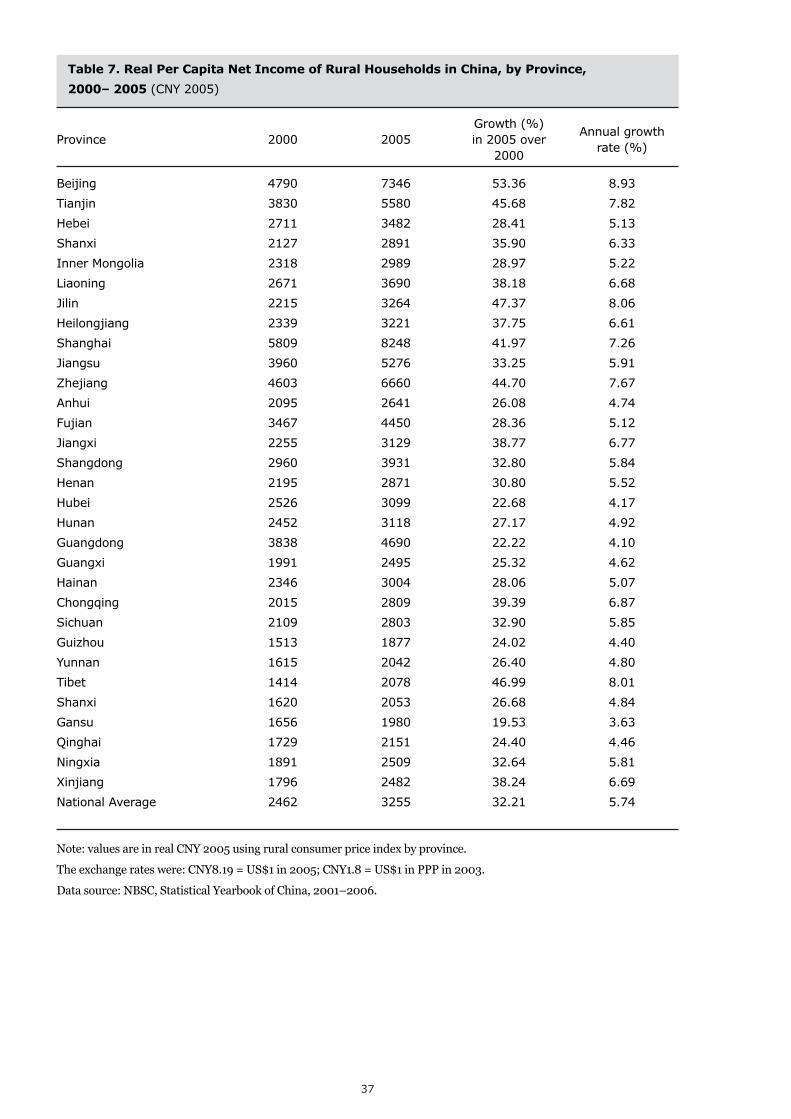
37
Table 7. Real Per Capita Net Income of Rural Households in China, by Province,
2000– 2005 (CNY 2005)
Growth (%)Province 2000 2005 in 2005 over
Annual growth
2000rate (%)
Beijing 4790 7346 53.36 8.93
Tianjin 3830 5580 45.68 7.82
Hebei 2711 3482 28.41 5.13
Shanxi 2127 2891 35.90 6.33
Inner Mongolia 2318 2989 28.97 5.22
Liaoning 2671 3690 38.18 6.68
Jilin 2215 3264 47.37 8.06
Heilongjiang 2339 3221 37.75 6.61
Shanghai 5809 8248 41.97 7.26
Jiangsu 3960 5276 33.25 5.91
Zhejiang 4603 6660 44.70 7.67
Anhui 2095 2641 26.08 4.74
Fujian 3467 4450 28.36 5.12
Jiangxi 2255 3129 38.77 6.77
Shangdong 2960 3931 32.80 5.84
Henan 2195 2871 30.80 5.52
Hubei 2526 3099 22.68 4.17
Hunan 2452 3118 27.17 4.92
Guangdong 3838 4690 22.22 4.10
Guangxi 1991 2495 25.32 4.62
Hainan 2346 3004 28.06 5.07
Chongqing 2015 2809 39.39 6.87
Sichuan 2109 2803 32.90 5.85
Guizhou 1513 1877 24.02 4.40
Yunnan 1615 2042 26.40 4.80
Tibet 1414 2078 46.99 8.01
Shanxi 1620 2053 26.68 4.84
Gansu 1656 1980 19.53 3.63
Qinghai 1729 2151 24.40 4.46
Ningxia 1891 2509 32.64 5.81
Xinjiang 1796 2482 38.24 6.69
National Average 2462 3255 32.21 5.74
Note: values are in real CNY 2005 using rural consumer price index by province.
The exchange rates were: CNY8.19 = US$1 in 2005; CNY1.8 = US$1 in PPP in 2003.
Data source: NBSC, Statistical Yearbook of China, 2001–2006.
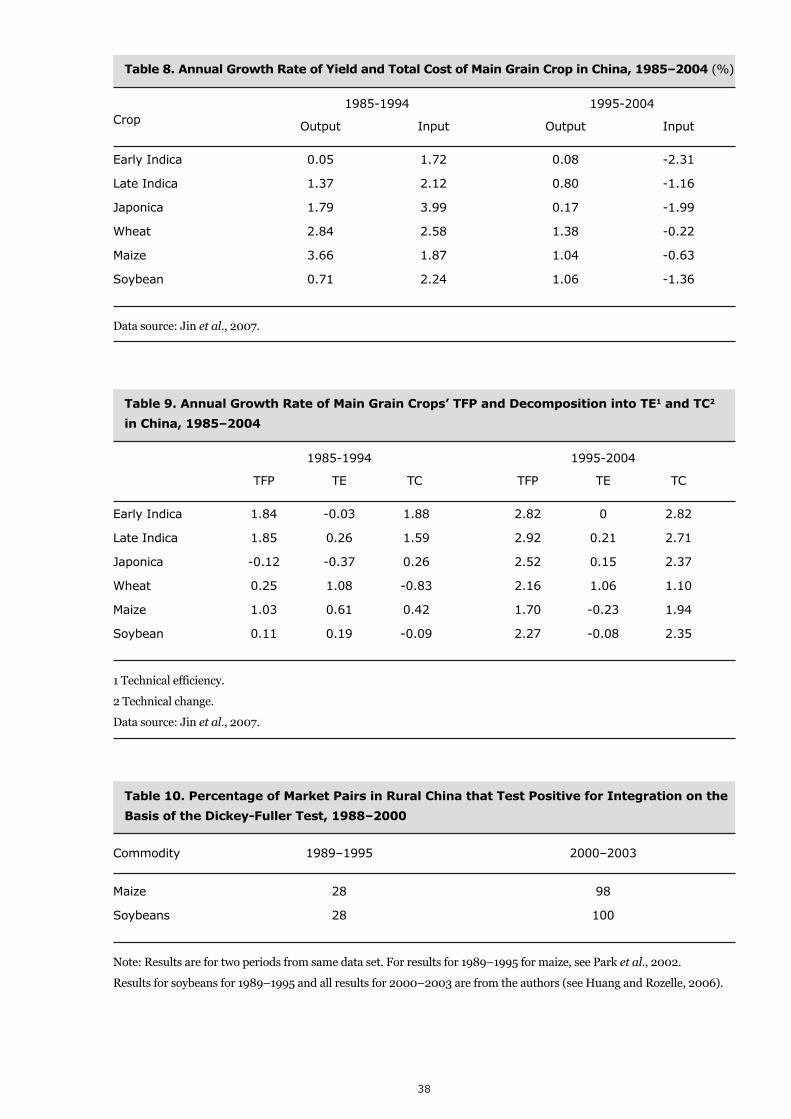
38
Table 8. Annual Growth Rate of Yield and Total Cost of Main Grain Crop in China, 1985–2004 (%)
1985-1994 1995-2004Crop Output Input Output Input
Early Indica 0.05 1.72 0.08 -2.31
Late Indica 1.37 2.12 0.80 -1.16
Japonica 1.79 3.99 0.17 -1.99
Wheat 2.84 2.58 1.38 -0.22
Maize 3.66 1.87 1.04 -0.63
Soybean 0.71 2.24 1.06 -1.36
Data source: Jin et al., 2007.
Table 9. Annual Growth Rate of Main Grain Crops’ TFP and Decomposition into TE1 and TC2
in China, 1985–2004
1985-1994 1995-2004
TFP TE TC TFP TE TC
Early Indica 1.84 -0.03 1.88 2.82 0 2.82
Late Indica 1.85 0.26 1.59 2.92 0.21 2.71
Japonica -0.12 -0.37 0.26 2.52 0.15 2.37
Wheat 0.25 1.08 -0.83 2.16 1.06 1.10
Maize 1.03 0.61 0.42 1.70 -0.23 1.94
Soybean 0.11 0.19 -0.09 2.27 -0.08 2.35
1 Technical efficiency.
2 Technical change.
Data source: Jin et al., 2007.
Table 10. Percentage of Market Pairs in Rural China that Test Positive for Integration on the
Basis of the Dickey-Fuller Test, 1988–2000
Commodity 1989–1995 2000–2003
Maize 28 98
Soybeans 28 100
Note: Results are for two periods from same data set. For results for 1989–1995 for maize, see Park et al., 2002.
Results for soybeans for 1989–1995 and all results for 2000–2003 are from the authors (see Huang and Rozelle, 2006).
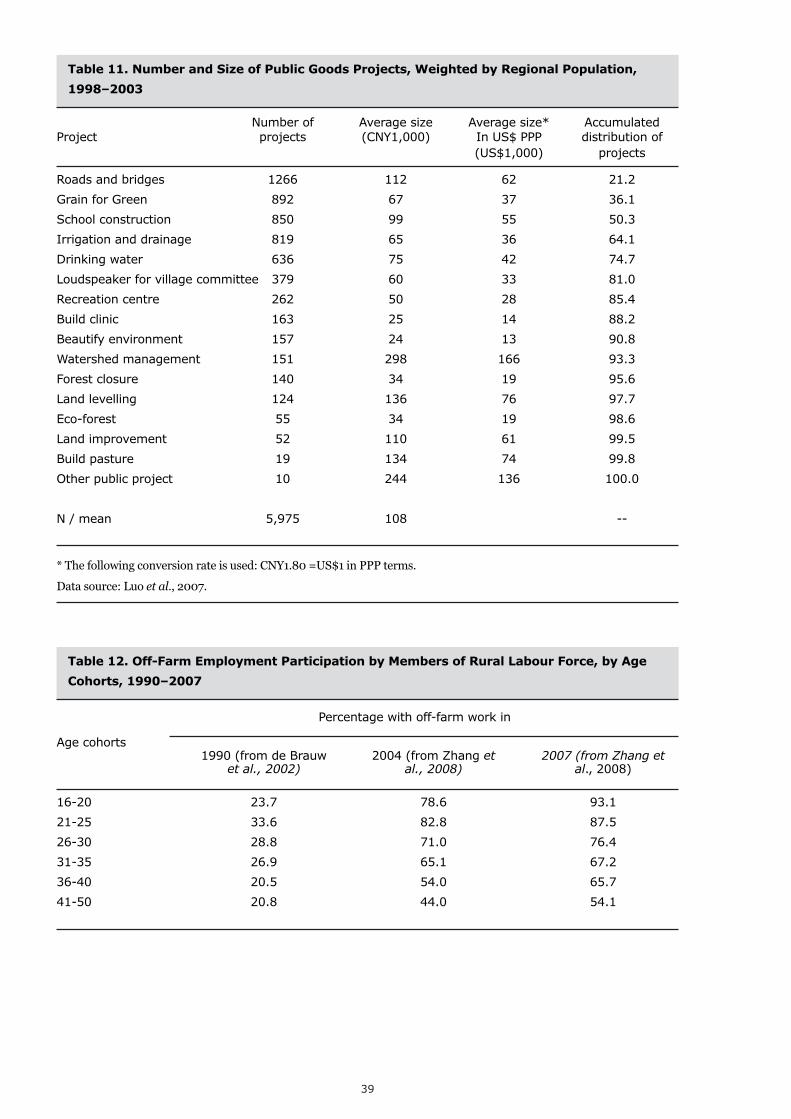
39
Table 12. Off-Farm Employment Participation by Members of Rural Labour Force, by Age
Cohorts, 1990–2007
Percentage with off-farm work in
Age cohorts1990 (from de Brauw 2004 (from Zhang et 2007 (from Zhang et
et al., 2002) al., 2008) al., 2008)
16-20 23.7 78.6 93.1
21-25 33.6 82.8 87.5
26-30 28.8 71.0 76.4
31-35 26.9 65.1 67.2
36-40 20.5 54.0 65.7
41-50 20.8 44.0 54.1
Table 11. Number and Size of Public Goods Projects, Weighted by Regional Population,
1998–2003
Number of Average size Average size* AccumulatedProject projects (CNY1,000) In US$ PPP distribution of
(US$1,000) projects
Roads and bridges 1266 112 62 21.2
Grain for Green 892 67 37 36.1
School construction 850 99 55 50.3
Irrigation and drainage 819 65 36 64.1
Drinking water 636 75 42 74.7
Loudspeaker for village committee 379 60 33 81.0
Recreation centre 262 50 28 85.4
Build clinic 163 25 14 88.2
Beautify environment 157 24 13 90.8
Watershed management 151 298 166 93.3
Forest closure 140 34 19 95.6
Land levelling 124 136 76 97.7
Eco-forest 55 34 19 98.6
Land improvement 52 110 61 99.5
Build pasture 19 134 74 99.8
Other public project 10 244 136 100.0
N / mean 5,975 108 --
* The following conversion rate is used: CNY1.80 =US$1 in PPP terms.
Data source: Luo et al., 2007.
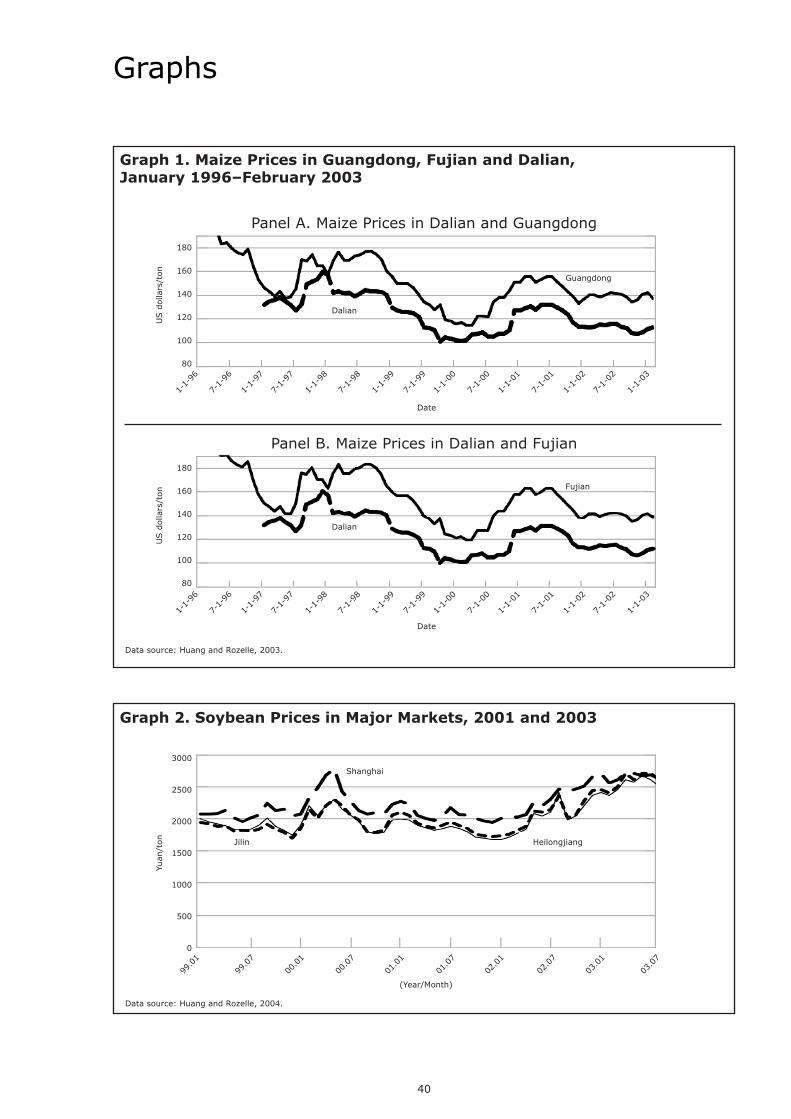
40
Graphs
Graph 1. Maize Prices in Guangdong, Fujian and Dalian,January 1996–February 2003
Graph 2. Soybean Prices in Major Markets, 2001 and 2003
Panel A. Maize Prices in Dalian and Guangdong
180
160
140
120
100
80
1-1-96
7-1-96
1-1-97
7-1-97
1-1-98
7-1-98
1-1-99
7-1-99
1-1-00
7-1-00
1-1-01
7-1-01
1-1-02
7-1-02
1-1-03
USdollars/ton
Guangdong
Dalian
Panel B. Maize Prices in Dalian and Fujian
180
160
140
120
100
80
1-1-96
7-1-96
1-1-97
7-1-97
1-1-98
7-1-98
1-1-99
7-1-99
1-1-00
7-1-00
1-1-01
7-1-01
1-1-02
7-1-02
1-1-03
USdollars/ton
Date
Date
Data source: Huang and Rozelle, 2003.
Yuan/ton
3000
2500
2000
1500
1000
500
0
(Year/Month)
Shanghai
HeilongjiangJilin
99.01
99.07
00.01
00.07
01.01
01.07
02.01
02.07
03.01
03.07
Data source: Huang and Rozelle, 2004.
Fujian
Dalian
41
Acronyms used in the document
FAO Food and Agriculture Organization of the United Nations
GDP gross domestic product
HRS household responsibility system
IFAD International Fund for Agricultural Development
MDG Millennium Development Goal
OECD Organisation of Economic Co-operation and Development
RLCL Rural Land Contract Law
SAR Special Autonomous Region
TFP total factor productivity
UNDP United Nations Development Programme
WFP World Food Programme
WHO World Health Organization
World Food ProgrammeChina OfficeUN Building2 Liangmahe NanluBeijing 100600P.R. China
wfp.org.cn
Prin
ted:N
ovember
2009
-Layou
tim
ages:fromleft
torigh
t,Imageban
k;WFP/T
omH
askell