Embed Size (px)
Citation preview
Agricultural Engineering
MODELLING A SUCiARCANE TRANSPORTATION SYSTEM FOR SIMULATION IN THE PHILIPPINES
O.S. Libunao
Philippine Sugar Institute, Philippines
ABSTRACT
Sugarcane transportation management requires maximum utili- zation of equipment and minimization of resources. This complex system is subject to delays caused by stochastic variables like rainfall and equipment breakdown. A computer simulation model was de- veloped capable of testing alternatives, strategies and decisions in sugarcane transportation management from harvesting to the trans- loading in the mill. The model considered the weather, travel times, equipment capacity and equipment breakdown.
Before any operations, rainfall is generated on a basis of its frequency. The plantations are then tested to determine whether har- vesting operations which are dependent on previous and current rainfall will be possible. This model considers only the rainfall for the last 24 hours and keeps account of the number of deliveries made by plantations per week, the trucks' round trips of about 1087 trips a day from field to mill, queueing of trucks to the mill yard until the derrick or unloader is ready to serve the truck. The model gives basic in- formation after simulation as enumerated in the output.
INTRODUCTION
Philippine sugarcane transportation systems generally require imported equipment and source of power, such as oil. The fixed and variable costs are high. Thus, in 1974, the Philippines had the second highest production cost among sugar producing nations, 30% of which represents haulage cost.
Proper sugarcane transportation management requires an understand- ing of the interaction a m n g the various factors affecting equipment utilization such as weather, harvesting policies, harvesting rate, delivery rate, queueing time, unloading time and travel time. This study is con- centrated on the development of a model from field data, which would mimic a given transportation system for evaluation of alternatives that may be developed under a given situation. Hence, decisions can be made with confidence and use of the traditional trial and error method is minimized.
In the Philippines, there are various sugarcane transportation operation systems. Some were changed for more economical methods, but the desire for further change still exists. A sugarcane transportation system calls for total
2082 AGRICULTURAL ENGINEERING
farm planning and mill synchronization. The various factors affecting the transportation system are the resources of the district, farm sizes, rela- tionship between planters and millers, social and labor conditions, roads, and the present facilities available. These factors are compounded further by crises like increase of fuel cost, scarcity of labor, high prices of com- modities and unfavorable weather conditions.
To survive the agricultural and industrial evolution, there is a need to anticipate and plan for change. The iildustry must define its future systems requirements and develop the alternatives that will balance the industry. It must manage the change.
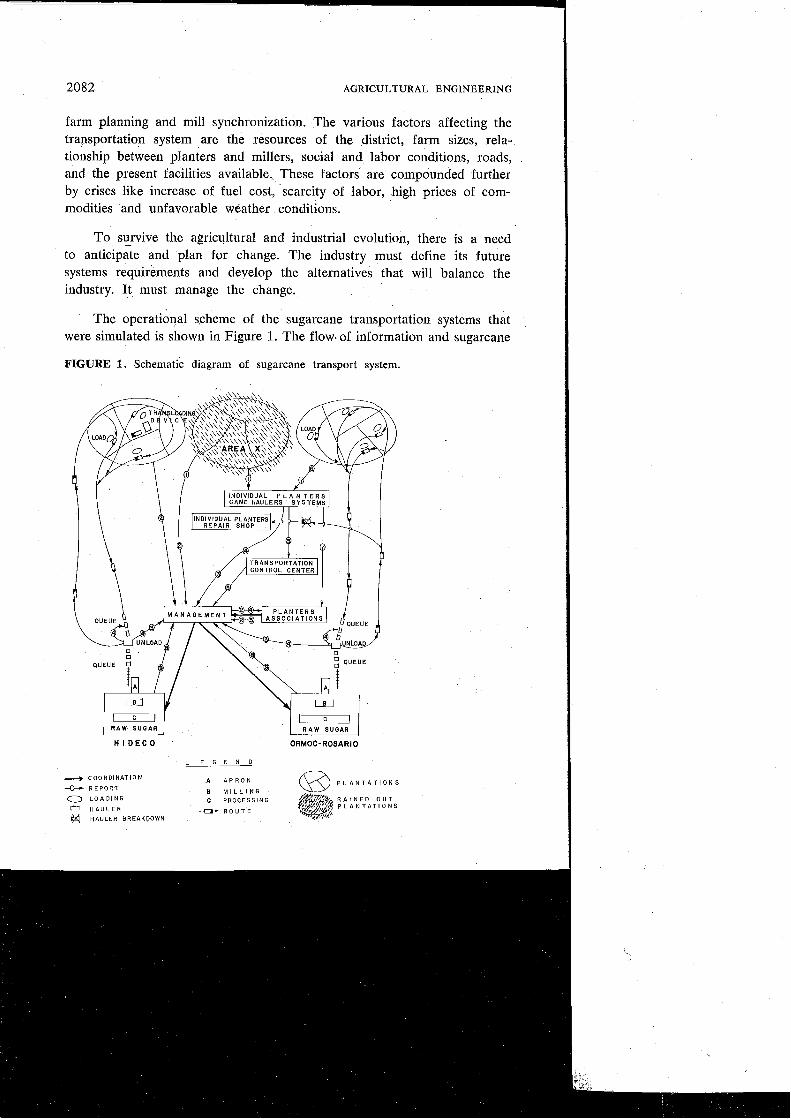
The operational scheme of the sugarcane trailsportation systems that were simulated is shown in Figure 1. The flow. of information and sugarcane
FIGURE 1. Schematic diagram of sugarcane transport system.
1 , ': ,I R A W S U G A R R A W SUGAR
ORMOC-ROSARIO
I L E G E N D 1 + C O O R D l N A T l O N
R E P O R T
0 L O A D I N G
H A U L E R
H A U L E R B R E A K D O W N
A A P R O N
B M I L L I N G
C P R O C E S S I N G
R O U T E
O.S. LIBUNAO , , 2083
transportation from field to mill is illustrated. The conditions that may cause delays in the operations and processing of sugarcane handling are included. The "situations" show that harvesting operations in Plantation "X" are stopped because of rain which limited the accessibility of the field to harvesting facilities.
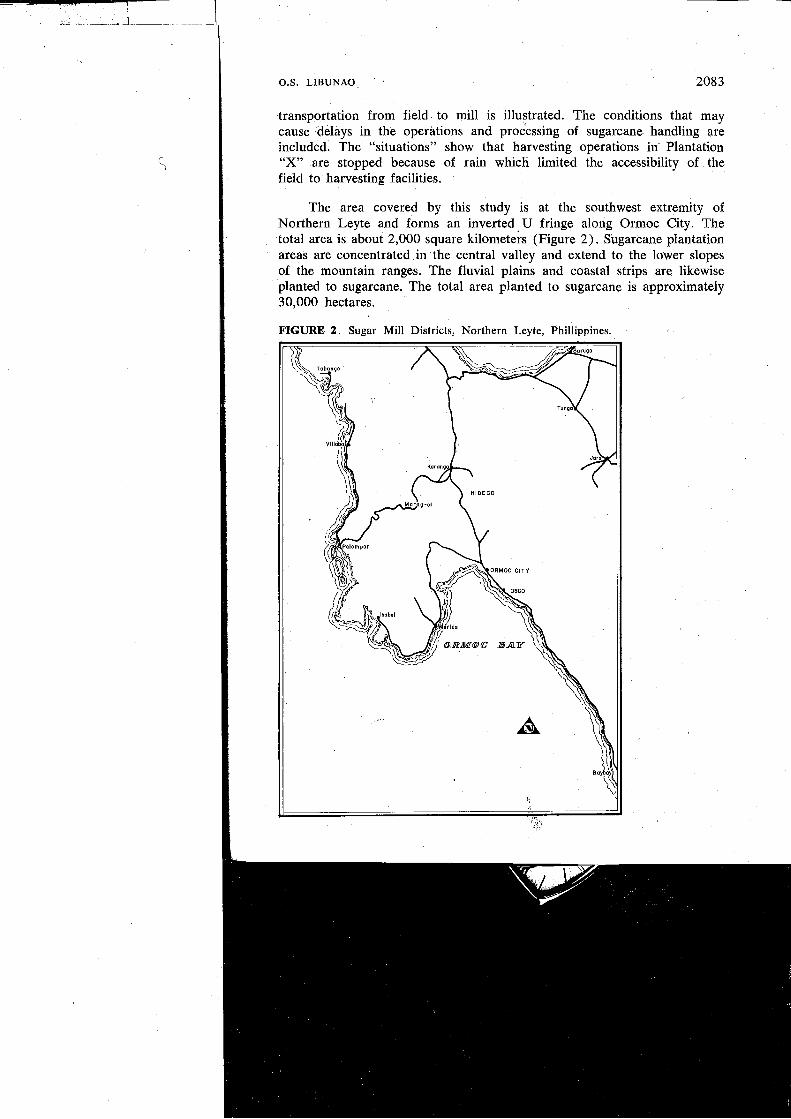
The area covered by this study is at the southwest extremity of Northern Leyte and forms an inverted U fringe along Ormoc City. The total area is about 2,000 square kilometeis (Figure 2) . Sugarcane plantation areas are concentrated in the central valley and extend to the lower slopes of the mountain ranges. The Iluvial plains and coastal strips are likewise planted to sugarcane. The total area planted to sugarcane is approximately 30,000 hectares.
FIGURE 2 . Sugar Mill Districts, Northern Leyte, Phillippines.
AGRICULTURAL ENGINEERING
SUGARCANE HARVESTING AND TRANSPORTATION SYSTEM
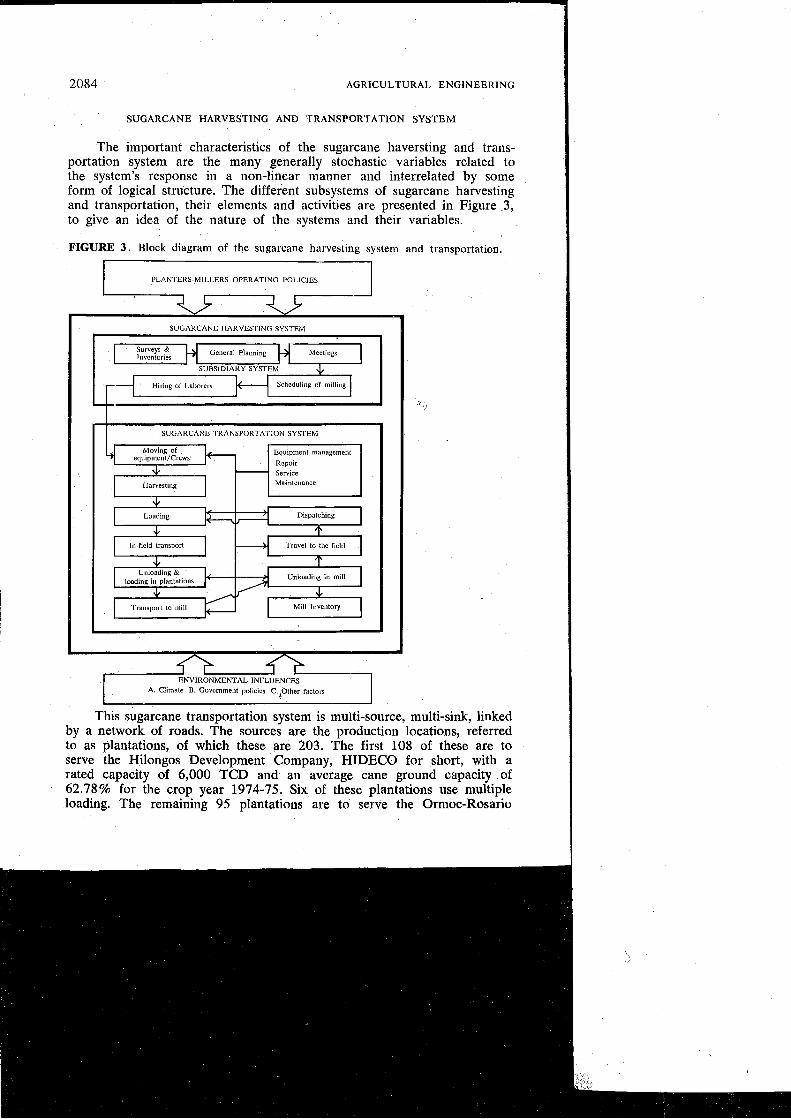
The important characteristics of the sugarcane haversting and trans- portation system are the many generally stochastic variables related to the system's response in a non-linear manner and interrelated by some form of logical structure. The different subsystems of sugarcane harvesting and transportation, their elements and activities are presented in Figure 3, to give an idea of the nature of the systems and their variables.
FIGURE 3 . Block diagram of the sugarcane harvesting system and transportation.
I PLANTERS-MILLERS OPERATING POLICIES
SUGARCANE HARVESTING SYSTEM
lnvenlarles General Planning
SUBSIDLAKY SYSTEM
Hir~ng oI Laboren Schedul~ng of rnllltng
SUGARCANE TRANSPORTATION SYSTEM
Repotr
Harvesting Ma~ntenance
Travel to the field
I Uuloading &
loadxng 111 plantations I Unlaad~ng in mill
Transport to mill Mill Inventory
A Cltmate B Government pollcles C Other factors t
This sugarcane transportation system is multi-source, multi-sink, linked by a network of roads. The sources are the production locations, referred to as plantations, of which these are 203. The first 108 of these are to serve the Hilongos Development Company, HIDECO for short, with a rated capacity of 6,000 TCD and an average cane ground capacity of 62.78% for the crop year 1974-75. Six of these plantations use multiple loading. The remaining 95 plantations are to serve the Ormoc-Rosario
Sugar Company, OSCO for short with a rated capacity of 2,500 TCD and an average cane ground capacity of 95.66% for the crop year 1974-75.
I This policy is based on distance to the mill that minimizes costs. Each
I plantation has harvesting crews who also load and clean the sugarcane.
In some cases, in-field transportation is used so that another transload- ing is required before sugarcane is delivered to the mill. The sinks are the sugar mills, where sugarcane is delivered as soon as possible for milling. The intermediate nodes are the repair shops and truck service facilities for oil, water, tires, and repair for the trucks. These are usually within the vicinity of the garage.
The plantation management transported their produce to the mill in their own trucking facilities consisting of 1,304 single loaders and 65 multiple loaders. The activities connected with this responsibility are clas- sified into: (1 ) sugarcane harvesting, (2) cleaning, loading and sugarcane transportation, (3) subsidiary activities. The static aspects of the different subsystems include the elements ol the sugarcane handling subsystem, their
I attributes, processing states and activities. I
I SUGARCANE HARVESTING
Sugarcane is harvested manually by cutters who are paid by weight in tons of canes harvested. Sugarcane is cut fresh or burnt. Cutters with knives strip top the cane, then pile the cane in rows parallel to the direction of the furrows. This activity is adequately described by average values. These appear in the model as constant. Harvesting stops when there .is rain, lunch, break, end of the working day, transfer of crew to another field or other delay.
I SUGARCANE CLEANING, LOADING AND TRANSPORTATION
The transportation of sugarcane from the different fields to the mill is done with trucks, with bull carts for in-field transport. The trucking could involve one-loader or multiple-loader trucks. The one-loader refers to trucks whose capacity is approximately 4.5 tons load. The multiple- loader trucks are usually assigned to haul sugarcane only from the trans- loader (derrick) in the plantation to the mill, while some one-loader trucks are sometimes assigned only from field to plantation transloader, especially if the terrain in the plantation prohibits the movement of a larger trucking system.
Sugarcane is loaded manually in trucks or carts for in-field transport. Cane loaders carry on their shoulders about ten to twenty cane stalks, from the ground to the trucks, through a ladder or ramp placed on any of the sides of the truck. Manual loading compliments sugarcane cleaning in the field which is also done manually.
2086 AGRICULTURAL ENGINEERING
The bull cart loads for in-field transport are dumped in the station, usually a loading point for railcars in the plantation. The same loading and cleaning procedures as in the trucks are used. The rail transport method is limited in quantity in these districts, and is used only in OSCO mill. This was not included in the analysis, to simplify the model. The variability of factors such as loader's rate, sugarcane size, field conditions, time to load a truck and the volume of load are assumed to be constant.
Travel time from the field to the transloading station in the plantation, and to the mill, for a particular truck and state (i.e. loaded or empty) is a random variable. However, for simplicity of the model, average values were used. These activities depend on human factors, road conditions and traffic.
Unloading of sugarcane from the truck to the cane car in the mill yard is done by derricks installed in parallel. Queue is generally formed at this stage because of the arrival of the trucks from different sources in the district. Unloading in the derrick is done on a first-in-first-out basis
' except in cases of trucks loaded with burnt cane which is given high priority. Unloading is influenced by shift time, characteristics of the operator and loading characteristics in the truck, but it is adequately described by average value.
The empty trucks return to the farm for instruction or are appropriately dispatched for loading of sugarcane.
The cane cars in the mill yard follow the railroad network and are pulled or pushed by rail locomotives. They are weighed individually on a scale and pushed or pulled near the mill apron for unloading. During these procedures, trash in the cane is determined by occular inspection and the corresponding deductions are noted in the cane card of the in- dividual loads. The scaling, unloading and trash deductions are influenced by the idiosyncracies of the inspectors. The mill receives the cane from the inventories stored at the inill apron. The remaining steps are parallel operations assumed to be of sufficient capacity to maintain the production flow. These subsystems are not included in the model developed.
'
SUBSIDIARY ACTIVITIES
No machine is perfect. It is subject to failures and stops. Minor repairs of trucks are normally undertaken in the farm, but major repairs that may last for 2 to 3 days are normally done in the major repair shop in the town or city. Repair is done on a first-in-first-out basis.
Activities in the plantations start at the beginning of each day and end at the end of thq day, except on Sundays which are rest days. Transpor- tation of sugarcane to the mill ends at curfew hours. The work in the mill begins on Monday morning and ends at noon on Sundays and operates at 3 shifts a day for 7 days a week, except on holidays as previously agreed upon by the planters associations and the millers.
C.S. LIBUNAO 2087
SUGARCANE HARVESTING PROCESS FOR A TYPICAL SIMULATED DAY'S OPERATIONS
The model was developed in the continuous time form and simulated 2 days7 operations. The 2400 m5nutes was compressed to only 10.83 min- utes, giving a compression ratio of 1:221 using an IBM GPSS language.
At the start of each day, data concerning all fields to be harvested are fed into the model. The amount of rain for each day and for, each plantation is calculated, which is an input to the rainout model and gives a list of plantations not rained out. In a real situation, sugarcane harvesting- loading and trucking logistics may be represented by: (1) trucking facilities are less than or equal to harvesting-loading capability, representing small sugarcane planters who do not have their own trucking facilities; (2) truck- ing facilities are greater than or equal to harvesting-loading capability, re- presenting big sugarcane planters who have their own logistics for transportation of sugarcane. Both situations are assumed to have the same rate of harvesting and loading viz. 0.2813 tons per man-hour. To avoid unnecessary detais and to model the physical system with more clarity for manipulation in the computer, there is a need to aggregate the 'loading activity. Loading of sugarcane in Northern Leyte districts is constrained by the size of the truck, capacity of cane car and load limit on the highway. The loading-time-volume relationships are assumed to be of average value. These characteristics appear in the model as constant.
TRAVEL TIME
The road network in sugarcane transportation is divided into distinct sectidns having different sets oi road conditions and standards but, for simplicity, average travel times from fields to mills under different loading states were estimated and given their corresponding functions. Traffic density, which is low in the district, was not considered in the model.
SERVICE DELAY
Service delays are relatively small in magnitude considering the total round trip time of sugarcane transportation. These facilities, to include other delays such as are due to the personal idiosyncracies of the drivers, are generally pooled in the terminal points such as the garage and the mill yards. This is represented in the model in percent probability.
TRUCK DISPATCHING
Truck dispatching from the mill to the garage is estimated by average travel time. The routes require information on distance, inventory of harvested cane, number of trucks assigned to haul in the field, field pro- ductivity and length of queues. Recent information is easily provided to
., .';

2088 AGRICULTURAL ENGINEERING
the plantation owner by the "encargados", truck drivers and workers on the farm. This follows the normal intention of the owner to maximize production subject to the available resources. Therefore, enough trucks must be assigned to the harvesting crews, and truck delays due to waiting and queueing must be minimized. This is represented in the model as constant for individual plantations.
Unloading of sugarcane in the mill yard is done according to a set of rules to give equitable service to all planters. These rules are:
1 . Unloading follows the first-in-first-out rule. 2 . Burnt cane, when proper notice is given, is accorded special privi-
lege in unloading directly to the apron and bypassing the derrick system.
Unloading of canes is dependent on grinding rate, the available cane cars and the rate of truck arrival. For efficient operation of derrick facilities, the use depends on the queue length so that, 'if the rate of arrival of trucks is low, only a few of the five derricks are operated. This minimizes the power and man-hours required lo operate the facilities and the use of the crew required.
In the model, it is assumed that the unloading rate is adequately described by a constant. This is also the finding of Sorensen et a1 and Cochran et al, on unloading sugarcane in Hawaii and Louisiana, respectively.
EQUIPMENT BREAKDOWN
Equipment breakdown depends on the age of the equipment, char- acteristic of the driver, road conditions and equipment. Since, the trucks are owned by sugarcane planters and repairs are done by them, there are no available records that show these repairs and breakdown frequency. Previous studies show that the frequency of breakdown follows a Poisson distribution. This model used the percentage of probability breakdown which was estimated from available information that, after repairs, the resumption of duties for the trucks follows immediately.
MODEL VALIDATION
Analysis of the real-world system through a model involves the re- presentation of the components and parameters, and their interrelationship. The insights developed from the model, based on the conclusioas drawn from the actual system require the existence of true and valid correspondence between the behavior of the model and the real-world system. Otherwise, the insights derived from the model will be meaningless.
Much information is generated by the real system and the model. This includes the truck arrival rale, percent utilization of the trucks, weather generation and total deliveries for the day. The truck arrival rate is interesting to analyse as the other relationships in production are traceable. (Figure 4).

2090 AGRICULTURAL ENGINEERING
OUTPUT AND APPLICATION
A 2-day simulation of the whole system was made. The following results were obtained:
1 . The average rainfall is 14.052 k 16.75 nlm. There are 21 rained- out plantations for the last 2 days;
2 . One complete transit time is 5.243 + 3.187 hours; 3 . Average percentage utilization 01 the single loader trucks is
81.232% + 21.625%; 4 . Average percentage utilization for multiple loader trucks is
72.515% + 27.875%; 5 . Unproductive time 1.385 & 0.233 hours; 6 . Mean arrival rate for HIDECO is 15.862 + 13.386 trucks per
30 minutes; 7 . Mean arrival rate for OSCO is '11.524 f 12.48 trucks per 30
minutes ; 8 . Average delay time at HIDECO is 1.2825 +- 2.54 hours; 9 . Average delay time at OSCO is 0.021 * 1.922 hours;
10. Maximum queue length at HIDECO is 202 trucks and the average content of the queue is 40 trucks;
11 . Maximum queue length at OSCO is 13 1 trucks and the average content is 21 trucks;
12. At the end of simulation, 42 trucks are loaded with sugarcane in the plantations, ready for delivery to the mill;
13. Thirty-six trucks loaded with sugarcane on their way to the mills, 20 for HIDECO and 16 for OSCO;
14. Thirty trucks are in the repair shop for minor repair, and 4 trucks for major repairs; and
15. Sixteen trucks are at HIDECO yard, ready to be dispatched but unable to go to the plantations because of curfew hours.
The model can be manipulated to seek information on any of the subsystems, or the whole of the system, for decision-making. It' can be placed under a given situation for future decision. It is easily manageable and decisions can be made with confidence, without the need for trial and error. The program was designed for easy manipulation, so that probably only one or two cards will be changed to manipul$e a certain component of the whole system. It can be used with ease to evaluate the following:
Balancing of operations, utilization and investment for hauling equipment.
Balancing of the need for field workers. Testing of the effect of increasing the capacity of the different facilities
in the mill. Testing of the effect of improving the road network. Optimizing the number of canehaulers and drivers, and Testing the effect of increasing or decreasing the hauling facilities.
I O.S. LIBUNAO 209 1
I CONCLUSION 5
The model developed gives various items of information that can be used for decision-making. An example is one complete transit time, where we can estimate that 3 complete cycles ol: the truck can be made per day, since the total truck entry is 2,174, therefore the use of 724 trucks for all districts is sufficient for the two mills, in contrast to the more than 1,300
i trucks available. Hence, a decision can be made that there is no need to increase these facilities.
Finally, the model needs further development. The components and parameters of the system were simplified for easy manipulation in the computer.
I REFERENCES
1 . Bonita, M.L. (1972). A Simulation Model for Planning and Control of Forest Harvesting Operations. Ph.D. Thesis, University of British Columbia.
2 . Cochran, B.J. and Whitney, R.W. (1975). Economics of Transporting Sugarcane to Mill. The Sugar Journal, October 1975.
3 . Panol, F.Y. (1972). Modeling Yield and Weather for Sugarcane Production Simula- tion. Ph.D. Thesis, Michigan State University.
4 . Sorensen, E. and Gilheany, J. (1970). A Simulation Model for Harvest Operations Under Stochastic Conditions. Management Science, Vol. 16 No. 8, USA.
I MODELADO POR SIMULACION DE UN SISTEMA DE TRANSPORTE PARA CANA EN FILIPINAS
O.S. Libunao
RESUMEN
El modelo considera el tiempo, veces de viajes, capacidad del equipo y minimizaci6n de recursos. Este sistema cornpleto esta su- jeto a demoras causadas por variables como lluvias y averias del equipo. Se desarroll6 un modelo simulado de computadora capaz de probar alternativas, estrategias y decisiones en el manejo de trans- porte de caiia, desde la cosecha hasta el transbordo en la fabrica.
El modelo considera el tiempo, veces de viajes, capacidad del equipo y averias del equipo.
Antes de cualquier operacibn, la lluvia es generada en base a su frecuencia. Las plantaciones son luego probadas para determinar si seran posibles las operaciones de cosecha que dependen de las lluvias previas y corrientes. Este modelo conside$a solo la lluvia de las llltimas 24 horas y mantiene un registro del nljmero de entregas
AGRICULTURAL ENGINEERING
hechas por las plantacioiies por semana, de 10s viajes de ida y vuelta de camiones, cerca de 1.087 viajes por dia del carnpo a la fabrica, de la espera de camiones en el patio del ingenio hasta que la grua este lista para atender el camion. El modelo da inforrnacion basica despues de la simulaci6n como fue enurnerado en la producci6n total.