Embed Size (px)
Citation preview
Pr 1 (12-09)
Agricultural Prices
Washington, D.C.
Released December 30, 2009, by the National Agricultural Statistics Service (NASS), Agricultural Statistics Board, U.S. Department of Agriculture.
For information on Agricultural Prices see page 41, office hours 7:30 a.m. to 4:00 p.m. ET.
December Farm Prices Received Index Unchanged From Last Month
The preliminary All Farm Products Index of Prices Received by Farmers in December, at 136 percent, based on
1990-92=100, was unchanged from November. The Crop Index is down 2 points (1.3 percent) but the Livestock Index
increased 3 points (2.6 percent). Producers received higher prices for milk, soybeans, grapes, and strawberries and lower
prices for oranges, cattle, corn, and broccoli. In addition to prices, the overall index is also affected by the seasonal change
based on a 3-year average mix of commodities producers sell. Increased monthly marketings of wheat, milk, oranges, and
lettuce offset decreased marketings of soybeans, corn, cattle, and grapes.
The preliminary All Farm Products Index is up 1 point (0.7 percent) from December 2008. The Food Commodities Index, at
138, increased 2 points (1.5 percent) from last month and increased 5 points (3.8 percent) from December 2008.
Prices Paid Index Unchanged
The December Index of Prices Paid for Commodities and Services, Interest, Taxes, and Farm Wage Rates (PPITW) is
177 percent of the 1990-92 average. The index is unchanged from November but 1 point (0.6 percent) below December 2008.
Lower prices in December for diesel, feeder cattle, other services, and potash & phosphate offset higher prices for herbicides,
feeder pigs, supplements, and LP gas.
Index Summary Table
Index
1990-92=100
2008 2009
Nov Dec Nov Dec
Prices Received
Prices Paid
Ratio 1
142
182
78
135
178
76
136
177
77
136
177
77
1 Ratio of index of prices received by farmers to index of prices paid by farmers.
Agricultural Prices Agricultural Statistics Board December 2009 2 NASS, USDA
Prices Received by Farmers
The December All Farm Products Index is 136 percent of its 1990-92 base, unchanged from the November index but
0.7 percent above the December 2008 index.
ALL CROPS: The December index is 152, down 1.3 percent from November but 1.3 percent above December 2008. Index
decreases for fruits & nuts, feed grains & hay, cotton, and food grains more than offset increases for commercial vegetables,
oil-bearing crops, and potatoes & dry beans.
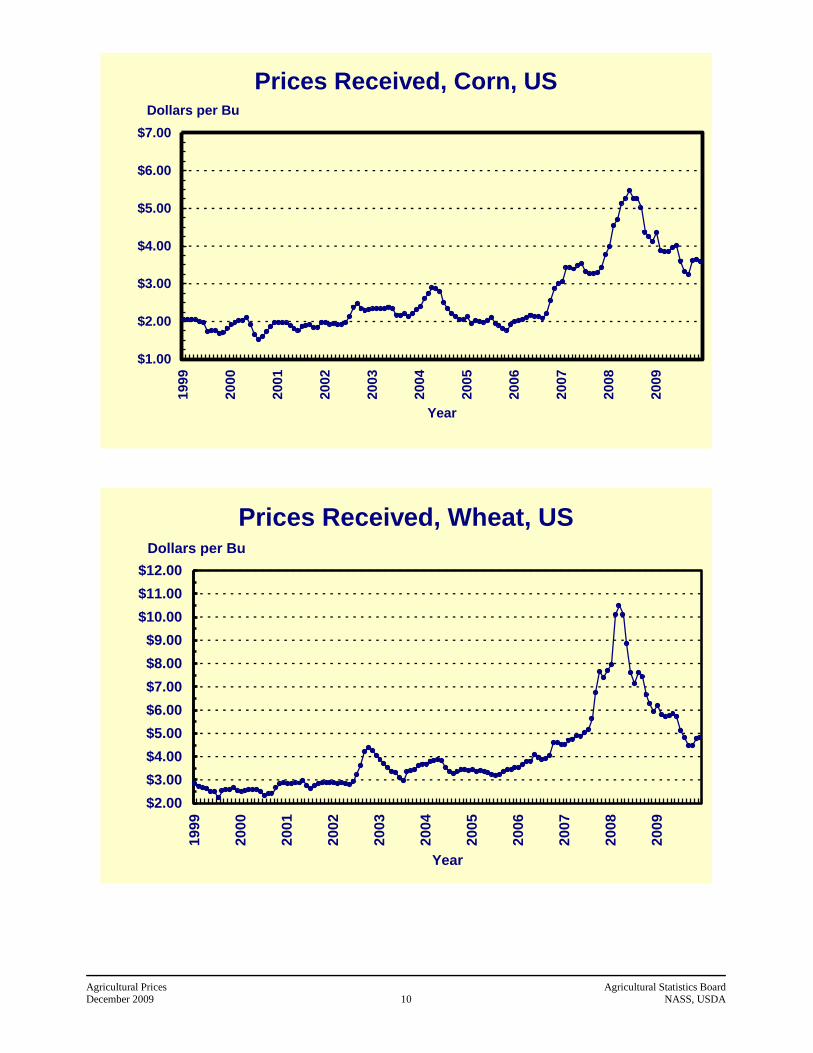
Food Grains: The December index, at 169, is 0.6 percent below the previous month and 20 percent below a year ago. The
December all wheat price, at $4.81 per bushel, is up 2 cents from November but $1.14 below December 2008.
Feed Grains & Hay: The December index is 155, down 1.3 percent from last month and 13 percent below a year ago. The
corn price, at $3.59 per bushel, is down 6 cents from last month and 52 cents below December 2008. The all hay price, at
$107.00 per ton, is unchanged from November but down $31.00 from last December. Sorghum grain, at $5.86 per cwt, is
19 cents above November and 73 cents above December last year.
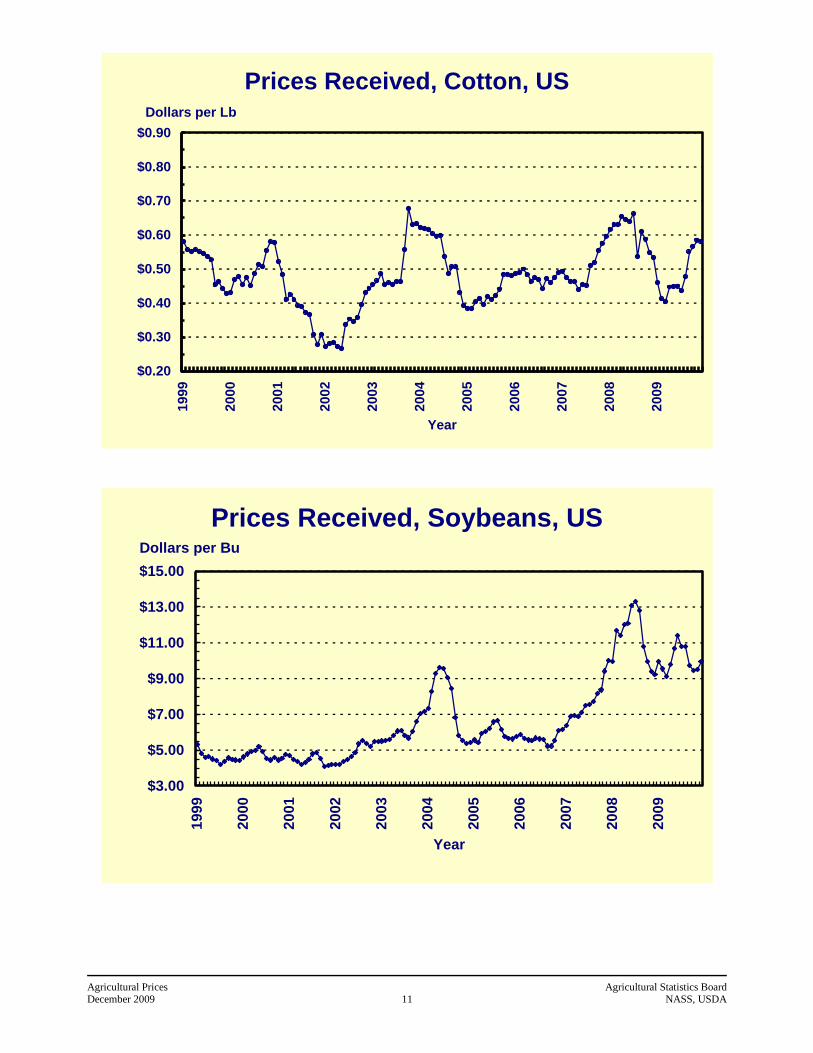
Cotton: The December index, at 96, is down 1.0 percent from November but 9.1 percent above last year. The December
price, at 58.2 cents per pound, is down 0.3 cent from the previous month but 4.9 cents above last December.
Oil-Bearing Crops: The December index, at 175, is up 6.1 percent from November and 1.7 percent higher than
December 2008. The soybean price, at $9.96 per bushel, increased 43 cents from November and is 72 cents above
December 2008.
Fruits & Nuts: The December index, at 139, is down 11 percent from November but 12 percent higher than a year ago.
Price decreases for oranges, lemons, grapefruit, and apples more than offset price increases for grapes and strawberries.
Commercial Vegetables: The December index, at 239, is up 10 percent from last month and 54 percent above
December 2008. Price increases during December for celery, lettuce, tomatoes, and snap beans more than offset price
declines for broccoli, cauliflower, onions, and sweet corn.
Potatoes & Dry Beans: The December index, at 131, is up 1.6 percent from last month but 20 percent below
December 2008. The all potato price, at $7.16 per cwt, is up 7 cents from November but down $2.14 from last December.
The all dry bean price, at $31.80 per cwt, is up $1.70 from the previous month but $2.40 below December 2008.
LIVESTOCK & PRODUCTS: The December index, at 118, is 2.6 percent above last month but down 0.8 percent from
December 2008. Compared with a year ago, prices are higher for milk, turkeys, hogs, eggs, and calves. Prices for broilers
and cattle are down from last year.
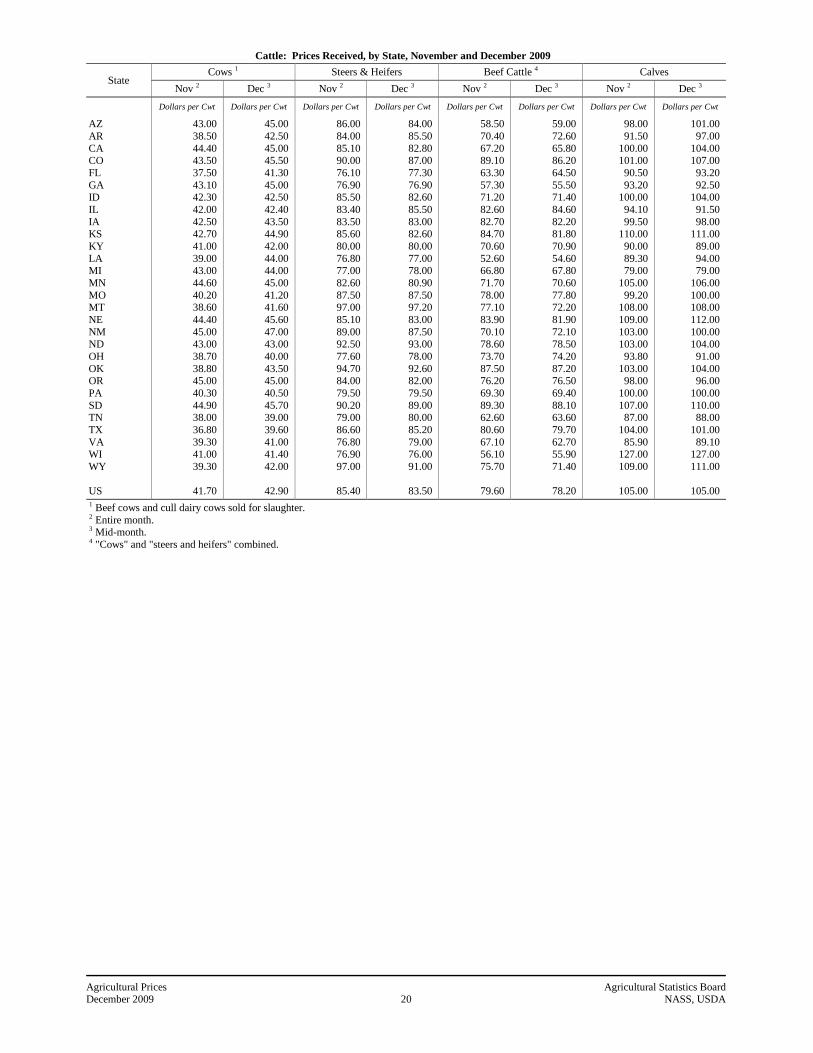
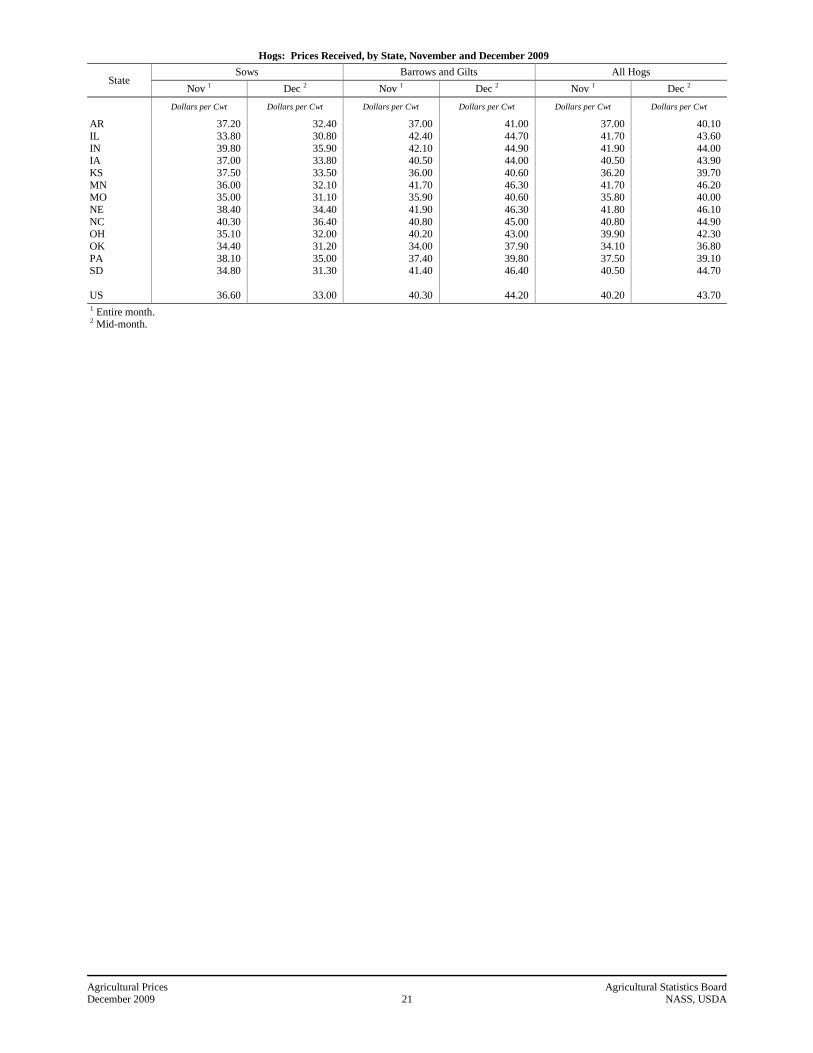
Meat Animals: The December index, at 104, is unchanged from last month and unchanged from last year. The December
hog price, at $43.70 per cwt, is up $3.50 from November and $1.80 higher than a year ago. The December beef cattle price of
$78.20 per cwt is down $1.40 from last month and $1.50 lower than December 2008.
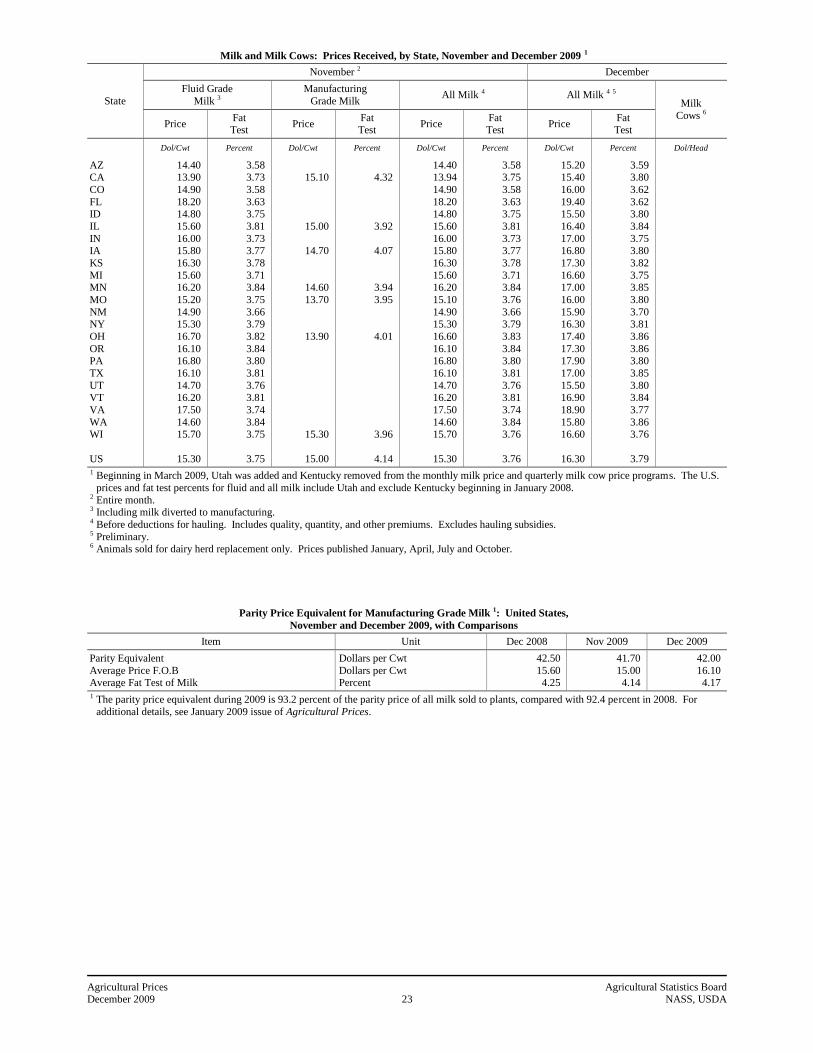
Dairy Products: The December index, at 125, is up 6.8 percent from a month ago and 5.0 percent higher than December last
year. The December all milk price of $16.30 per cwt is up $1.00 from last month and 80 cents from December 2008. The
fluid grade milk price is $1.00 higher and the manufacturing grade milk price increased $1.10 from the previous month.
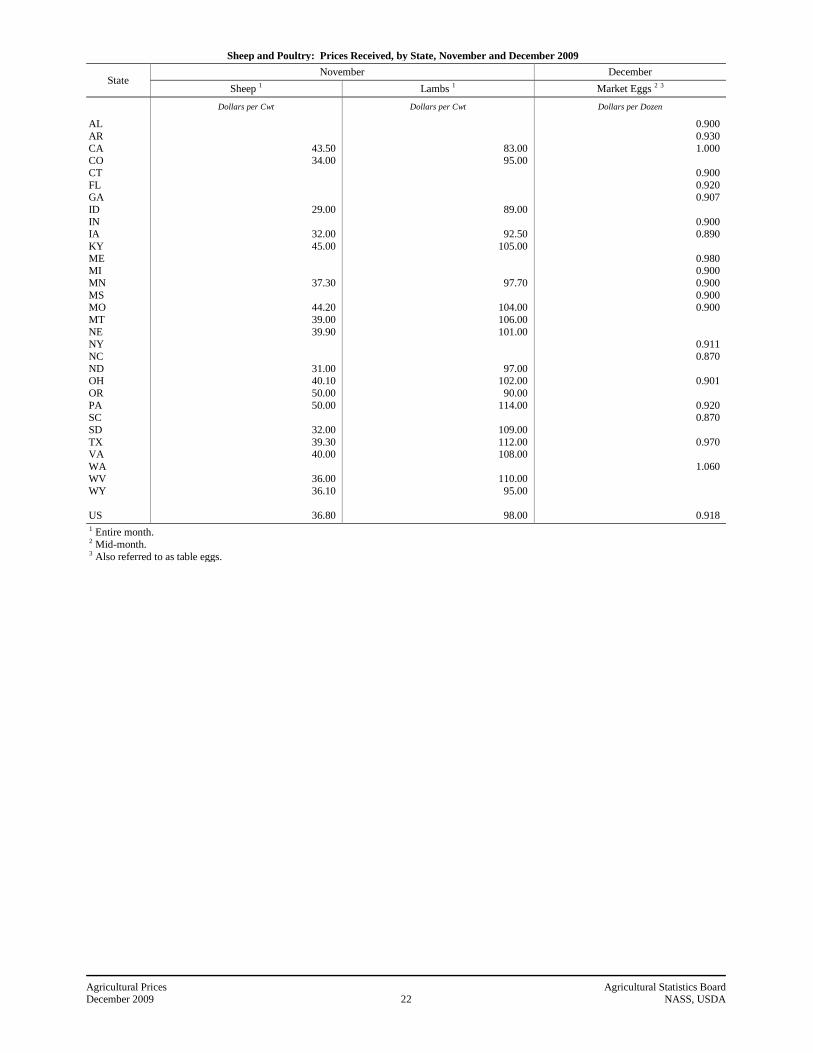
Poultry & Eggs: The December index, at 138, is up 0.7 percent from November but 6.8 percent below a year ago. The
December market egg price, at 91.8 cents per dozen, increased 3.9 cents from November and is 5.8 cents above
December 2008. The December broiler price, at 41.0 cents per pound, is unchanged from November but 7.0 cents below a
year ago. The December turkey price, at 53.9 cents per pound, is down 0.2 cent from the previous month but up 9.4 cents
from a year earlier.
Agricultural Prices Agricultural Statistics Board December 2009 3 NASS, USDA
Contents
U.S. Prices Received and Indexes Page
Narrative ................................................................................................................................................................................. 2
Price Indexes .......................................................................................................................................................................... 5
Index Charts ........................................................................................................................................................................... 6
U.S. Prices Received Summary ............................................................................................................................................. 8
Price Charts .......................................................................................................................................................................... 10
Selected Commodities .......................................................................................................................................................... 14
Upland Cotton & Rice Marketings ...................................................................................................................................... 17
Parity Prices ........................................................................................................................................................................ 24
Reliability Statement ............................................................................................................................................................ 26
Monthly State Prices Received
Apples .................................................................................................................................................................................. 17
Barley ................................................................................................................................................................................... 15
Beans, Dry Edible ................................................................................................................................................................ 16
Beef Cattle, All .................................................................................................................................................................... 20
Calves ................................................................................................................................................................................ 20
Cows, Beef ........................................................................................................................................................................ 20
Steers and Heifers .............................................................................................................................................................. 20
Canola .................................................................................................................................................................................. 16
Citrus Fruit ........................................................................................................................................................................... 18
Corn ..................................................................................................................................................................................... 15
Cotton .................................................................................................................................................................................. 17
Cottonseed ........................................................................................................................................................................... 17
Eggs ..................................................................................................................................................................................... 22
Flaxseed ............................................................................................................................................................................... 16
Hay ....................................................................................................................................................................................... 17
Hogs, All .............................................................................................................................................................................. 21
Barrows and Gilts .............................................................................................................................................................. 21
Sows ................................................................................................................................................................................... 21
Milk ...................................................................................................................................................................................... 23
Milk Cows ............................................................................................................................................................................ 23
Manufacturing Grade & Parity Price Equivalent ................................................................................................................. 23
Oats ...................................................................................................................................................................................... 15
Peanuts ................................................................................................................................................................................. 16
Potatoes ................................................................................................................................................................................ 19
Sheep .................................................................................................................................................................................... 22
Lambs .................................................................................................................................................................................. 22
Sorghum Grain ..................................................................................................................................................................... 15
Soybeans .............................................................................................................................................................................. 15
Sunflower, All ...................................................................................................................................................................... 16
Wheat, All Classes ............................................................................................................................................................... 14
Marketing Year Average Prices by State and U.S.
Hops .................................................................................................................................................................................... 26
Calendar of Prices Received Features in the 2009 Agricultural Price Reports ............................................................. 37
Agricultural Prices Agricultural Statistics Board December 2009 4 NASS, USDA
Table of Contents (continued)
U.S. Prices Paid, Prices Paid Indexes and Ratios Page
Narrative ....................................................................................................................................................................... 27
Indexes and Parity Ratios ............................................................................................................................................. 28
Charts ........................................................................................................................................................................... 30
Feed Price Ratios .......................................................................................................................................................... 33
Reliability Statement .................................................................................................................................................... 36
U.S. Average Prices
Prices Used to Calculate Feed Price Ratios .................................................................................................................. 33
Feeder Livestock .......................................................................................................................................................... 33
Special Features
Feed: April Prices Paid, U.S. 2004-2009 ...................................................................................................................... 34
Feeder Livestock: Annual Average Prices Paid, U.S., 2004-2009 ............................................................................... 34
Prices Paid Index for Beef Cattle Production ............................................................................................................... 35
Beef Cattle Prices Received, Selected Regions ............................................................................................................ 35
Calendar of Prices Paid Features in the 2009 Agricultural Price Reports ............................................................ 40
Information Contacts ................................................................................................................................................. 41
Agricultural Prices Agricultural Statistics Board December 2009 5 NASS, USDA
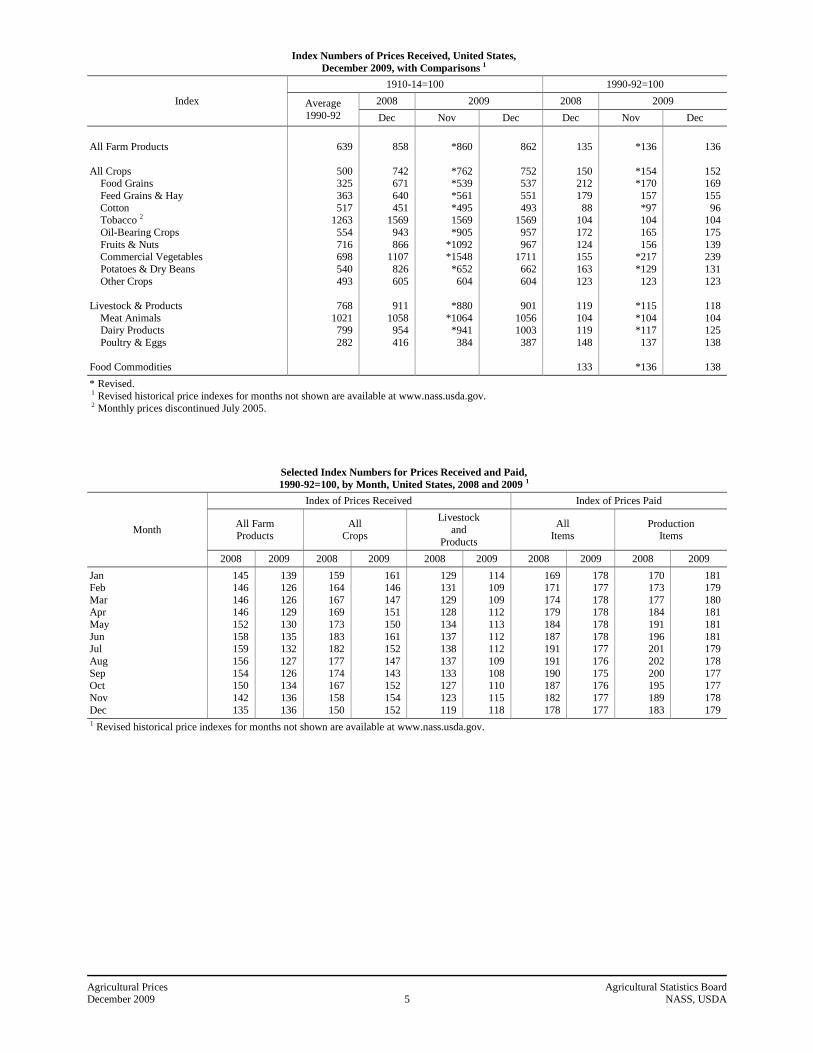
Index Numbers of Prices Received, United States,
December 2009, with Comparisons 1
Index
1910-14=100 1990-92=100
Average
1990-92
2008 2009 2008 2009
Dec Nov Dec Dec Nov Dec
All Farm Products
All Crops Food Grains
Feed Grains & Hay
Cotton Tobacco 2
Oil-Bearing Crops
Fruits & Nuts Commercial Vegetables
Potatoes & Dry Beans
Other Crops
Livestock & Products
Meat Animals Dairy Products
Poultry & Eggs
Food Commodities
639
500 325
363
517 1263
554
716 698
540
493
768
1021 799
282
858
742 671
640
451 1569
943
866 1107
826
605
911
1058 954
416
*860
*762 *539
*561
*495 1569
*905
*1092 *1548
*652
604
*880
*1064 *941
384
862
752 537
551
493 1569
957
967 1711
662
604
901
1056 1003
387
135
150 212
179
88 104
172
124 155
163
123
119
104 119
148
133
*136
*154 *170
157
*97 104
165
156 *217
*129
123
*115
*104 *117
137
*136
136
152 169
155
96 104
175
139 239
131
123
118
104 125
138
138
* Revised. 1 Revised historical price indexes for months not shown are available at www.nass.usda.gov. 2 Monthly prices discontinued July 2005.
Selected Index Numbers for Prices Received and Paid,
1990-92=100, by Month, United States, 2008 and 2009 1
Month
Index of Prices Received Index of Prices Paid
All Farm Products
All Crops
Livestock
and
Products
All Items
Production Items
2008 2009 2008 2009 2008 2009 2008 2009 2008 2009
Jan Feb
Mar Apr
May
Jun Jul
Aug
Sep Oct
Nov
Dec
145 146
146 146
152
158 159
156
154 150
142
135
139 126
126 129
130
135 132
127
126 134
136
136
159 164
167 169
173
183 182
177
174 167
158
150
161 146
147 151
150
161 152
147
143 152
154
152
129 131
129 128
134
137 138
137
133 127
123
119
114 109
109 112
113
112 112
109
108 110
115
118
169 171
174 179
184
187 191
191
190 187
182
178
178 177
178 178
178
178 177
176
175 176
177
177
170 173
177 184
191
196 201
202
200 195
189
183
181 179
180 181
181
181 179
178
177 177
178
179 1 Revised historical price indexes for months not shown are available at www.nass.usda.gov.

Agricultural Prices Agricultural Statistics Board December 2009 6 NASS, USDA
Prices Received, Major Indexes, US
80
90
100
110
120
130
140
150
160
170
180
190
200
1999
2000
2001
2002
2003
2004
2005
2006
2007
2008
2009
Year
Perc
en
t (1
990-9
2=
100)
Livestock Product All Farm Product All Crop
Prices Received, Food, Feed, & Oil Crop
Indexes, US
60
90
120
150
180
210
240
270
300
330
360
1999
2000
2001
2002
2003
2004
2005
2006
2007
2008
2009
Year
Perc
en
t (1
990-9
2=
100)
Food Grain Feed Grain & Hay Oil Crop

Agricultural Prices Agricultural Statistics Board December 2009 7 NASS, USDA
Prices Received, Fruit and Vegetable
Indexes, US
60
90
120
150
180
210
240
270
300
330
1999
2000
2001
2002
2003
2004
2005
2006
2007
2008
2009
Year
Perc
en
t (1
990-9
2=
100)
Fruit & Nut Commercial Vegetable
Prices Received, Livestock Product Indexes,
US
60
70
80
90
100
110
120
130
140
150
160
170
180
1999
2000
2001
2002
2003
2004
2005
2006
2007
2008
2009
Year
Perc
en
t (1
990-9
2=
100)
Meat Animal Dairy Product Poultry & Egg
Agricultural Prices Agricultural Statistics Board December 2009 8 NASS, USDA
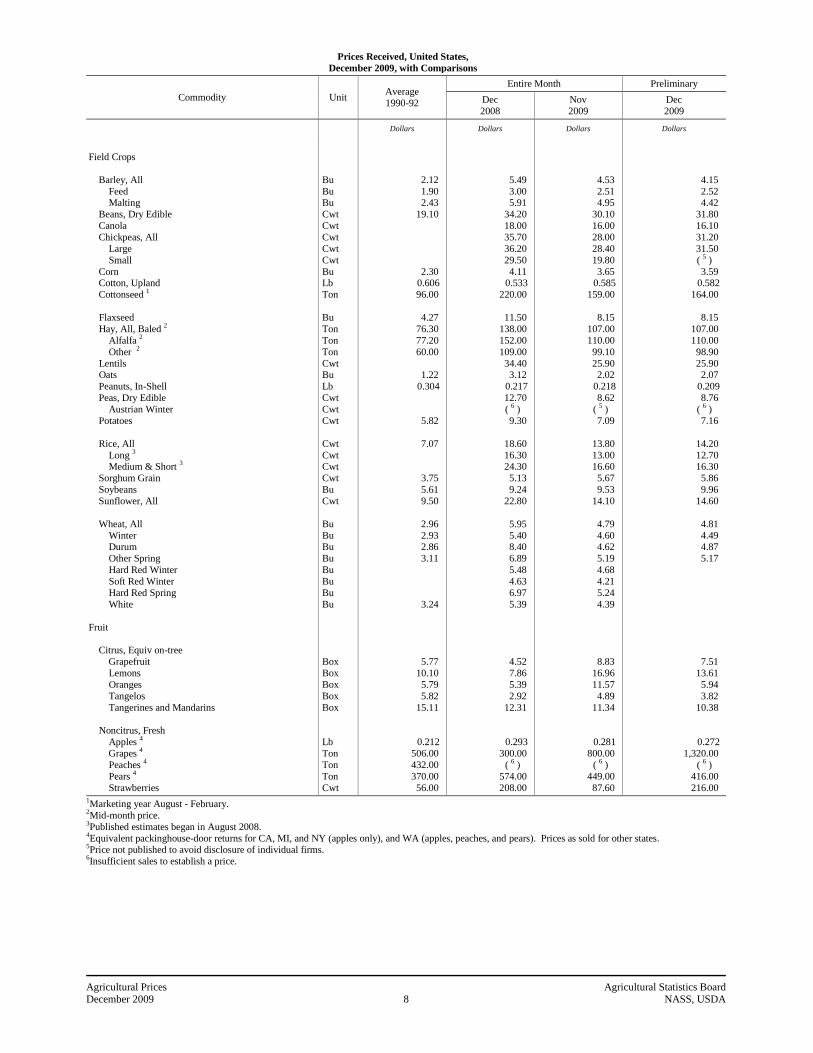
Prices Received, United States,
December 2009, with Comparisons
Commodity Unit Average
1990-92
Entire Month Preliminary
Dec
2008
Nov
2009
Dec
2009
Dollars Dollars Dollars Dollars
Field Crops
Barley, All
Feed Malting
Beans, Dry Edible
Canola
Chickpeas, All
Large
Small
Corn Cotton, Upland
Cottonseed 1
Flaxseed
Hay, All, Baled 2
Alfalfa 2
Other 2
Lentils Oats
Peanuts, In-Shell
Peas, Dry Edible
Austrian Winter
Potatoes
Rice, All
Long 3
Medium & Short 3
Sorghum Grain
Soybeans
Sunflower, All
Wheat, All
Winter Durum
Other Spring
Hard Red Winter
Soft Red Winter
Hard Red Spring
White
Fruit
Citrus, Equiv on-tree
Grapefruit
Lemons
Oranges
Tangelos
Tangerines and Mandarins
Noncitrus, Fresh
Apples 4
Grapes 4
Peaches 4
Pears 4
Strawberries
Bu
Bu Bu
Cwt
Cwt
Cwt
Cwt
Cwt
Bu Lb
Ton
Bu
Ton
Ton
Ton
Cwt Bu
Lb
Cwt
Cwt
Cwt
Cwt
Cwt Cwt
Cwt
Bu
Cwt
Bu
Bu Bu
Bu
Bu
Bu
Bu
Bu
Box
Box
Box
Box
Box
Lb
Ton
Ton
Ton
Cwt
2.12
1.90 2.43
19.10
2.30 0.606
96.00
4.27
76.30
77.20
60.00
1.22
0.304
5.82
7.07
3.75
5.61
9.50
2.96
2.93 2.86
3.11
3.24
5.77
10.10
5.79
5.82
15.11
0.212
506.00
432.00
370.00
56.00
5.49
3.00 5.91
34.20
18.00
35.70
36.20
29.50
4.11 0.533
220.00
11.50
138.00
152.00
109.00
34.40 3.12
0.217
12.70
( 6 )
9.30
18.60
16.30 24.30
5.13
9.24
22.80
5.95
5.40 8.40
6.89
5.48
4.63
6.97
5.39
4.52
7.86
5.39
2.92
12.31
0.293
300.00
( 6 )
574.00
208.00
4.53
2.51 4.95
30.10
16.00
28.00
28.40
19.80
3.65 0.585
159.00
8.15
107.00
110.00
99.10
25.90 2.02
0.218
8.62
( 5 )
7.09
13.80
13.00 16.60
5.67
9.53
14.10
4.79
4.60 4.62
5.19
4.68
4.21
5.24
4.39
8.83
16.96
11.57
4.89
11.34
0.281
800.00
( 6 )
449.00
87.60
4.15
2.52 4.42
31.80
16.10
31.20
31.50
( 5 )
3.59 0.582
164.00
8.15
107.00
110.00
98.90
25.90 2.07
0.209
8.76
( 6 )
7.16
14.20
12.70 16.30
5.86
9.96
14.60
4.81
4.49 4.87
5.17
7.51
13.61
5.94
3.82
10.38
0.272
1,320.00
( 6 )
416.00
216.00 1Marketing year August - February.
2Mid-month price.
3Published estimates began in August 2008.
4Equivalent packinghouse-door returns for CA, MI, and NY (apples only), and WA (apples, peaches, and pears). Prices as sold for other states.
5Price not published to avoid disclosure of individual firms.
6Insufficient sales to establish a price.
Agricultural Prices Agricultural Statistics Board December 2009 9 NASS, USDA
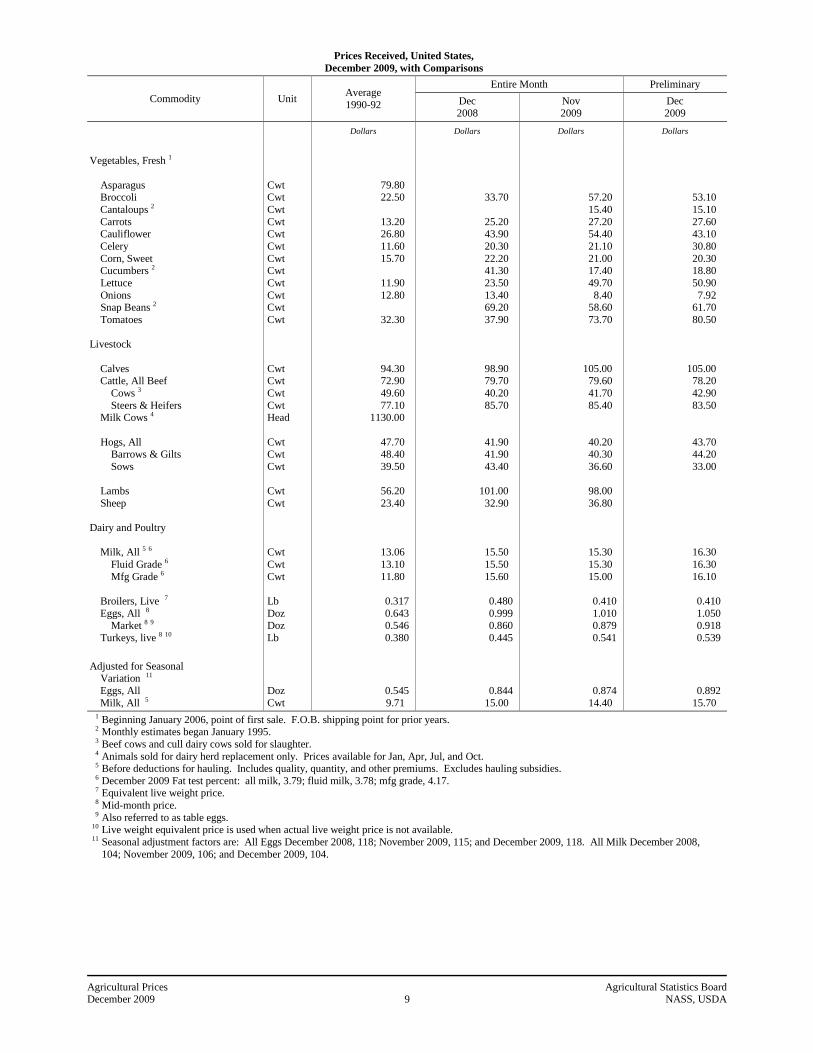
Prices Received, United States,
December 2009, with Comparisons
Commodity Unit Average
1990-92
Entire Month Preliminary
Dec
2008
Nov
2009
Dec
2009
Dollars Dollars Dollars Dollars
Vegetables, Fresh 1
Asparagus Broccoli
Cantaloups 2
Carrots Cauliflower
Celery
Corn, Sweet Cucumbers 2
Lettuce
Onions Snap Beans 2
Tomatoes
Livestock
Calves Cattle, All Beef
Cows 3
Steers & Heifers Milk Cows 4
Hogs, All Barrows & Gilts
Sows
Lambs
Sheep
Dairy and Poultry
Milk, All 5 6
Fluid Grade 6
Mfg Grade 6
Broilers, Live 7
Eggs, All 8 Market 8 9
Turkeys, live 8 10
Cwt Cwt
Cwt
Cwt Cwt
Cwt
Cwt Cwt
Cwt
Cwt Cwt
Cwt
Cwt Cwt
Cwt
Cwt Head
Cwt Cwt
Cwt
Cwt
Cwt
Cwt
Cwt
Cwt
Lb
Doz Doz
Lb
79.80 22.50
13.20 26.80
11.60
15.70
11.90
12.80
32.30
94.30 72.90
49.60
77.10 1130.00
47.70 48.40
39.50
56.20
23.40
13.06
13.10
11.80
0.317
0.643 0.546
0.380
33.70
25.20 43.90
20.30
22.20 41.30
23.50
13.40 69.20
37.90
98.90 79.70
40.20
85.70
41.90 41.90
43.40
101.00
32.90
15.50
15.50
15.60
0.480
0.999 0.860
0.445
57.20
15.40
27.20 54.40
21.10
21.00 17.40
49.70
8.40 58.60
73.70
105.00 79.60
41.70
85.40
40.20 40.30
36.60
98.00
36.80
15.30
15.30
15.00
0.410
1.010 0.879
0.541
53.10
15.10
27.60 43.10
30.80
20.30 18.80
50.90
7.92 61.70
80.50
105.00 78.20
42.90
83.50
43.70 44.20
33.00
16.30
16.30
16.10
0.410
1.050 0.918
0.539
Adjusted for Seasonal Variation 11
Eggs, All
Milk, All 5
Doz
Cwt
0.545
9.71
0.844
15.00
0.874
14.40
0.892
15.70 1 Beginning January 2006, point of first sale. F.O.B. shipping point for prior years. 2 Monthly estimates began January 1995. 3 Beef cows and cull dairy cows sold for slaughter. 4 Animals sold for dairy herd replacement only. Prices available for Jan, Apr, Jul, and Oct. 5 Before deductions for hauling. Includes quality, quantity, and other premiums. Excludes hauling subsidies. 6 December 2009 Fat test percent: all milk, 3.79; fluid milk, 3.78; mfg grade, 4.17. 7 Equivalent live weight price. 8 Mid-month price. 9 Also referred to as table eggs. 10 Live weight equivalent price is used when actual live weight price is not available. 11 Seasonal adjustment factors are: All Eggs December 2008, 118; November 2009, 115; and December 2009, 118. All Milk December 2008,
104; November 2009, 106; and December 2009, 104.
Agricultural Prices Agricultural Statistics Board December 2009 10 NASS, USDA
Prices Received, Corn, US
$1.00
$2.00
$3.00
$4.00
$5.00
$6.00
$7.00
1999
2000
2001
2002
2003
2004
2005
2006
2007
2008
2009
Year
Dollars per Bu
Prices Received, Wheat, US
$2.00
$3.00
$4.00
$5.00
$6.00
$7.00
$8.00
$9.00
$10.00
$11.00
$12.00
1999
2000
2001
2002
2003
2004
2005
2006
2007
2008
2009
Year
Dollars per Bu
Agricultural Prices Agricultural Statistics Board December 2009 11 NASS, USDA
Prices Received, Cotton, US
$0.20
$0.30
$0.40
$0.50
$0.60
$0.70
$0.80
$0.90
1999
2000
2001
2002
2003
2004
2005
2006
2007
2008
2009
Year
Dollars per Lb
Prices Received, Soybeans, US
$3.00
$5.00
$7.00
$9.00
$11.00
$13.00
$15.00
1999
2000
2001
2002
2003
2004
2005
2006
2007
2008
2009
Year
Dollars per Bu

Agricultural Prices Agricultural Statistics Board December 2009 12 NASS, USDA
Prices Received, Cattle, US
$20
$40
$60
$80
$100
$120
$140
$160
$180
1999
2000
2001
2002
2003
2004
2005
2006
2007
2008
2009
Year
Dollars per Cwt
Calves Steer/Heifer All Beef Cattle Cows
Prices Received, Milk, US
$10
$12
$14
$16
$18
$20
$22
$24
1999
2000
2001
2002
2003
2004
2005
2006
2007
2008
2009
Year
Dollars per Cwt

Agricultural Prices Agricultural Statistics Board December 2009 13 NASS, USDA
Prices Received, Hogs, US
$10
$20
$30
$40
$50
$60
$70
19
99
20
00
20
01
20
02
20
03
20
04
20
05
20
06
20
07
20
08
20
09
Year
Dollars per Cwt
Prices Received,Turkeys & Broilers, US
$0.20
$0.30
$0.40
$0.50
$0.60
$0.70
19
99
20
00
20
01
20
02
20
03
20
04
20
05
20
06
20
07
20
08
20
09
Year
Dollars per Lb
Turkeys Broilers
Agricultural Prices Agricultural Statistics Board December 2009 14 NASS, USDA
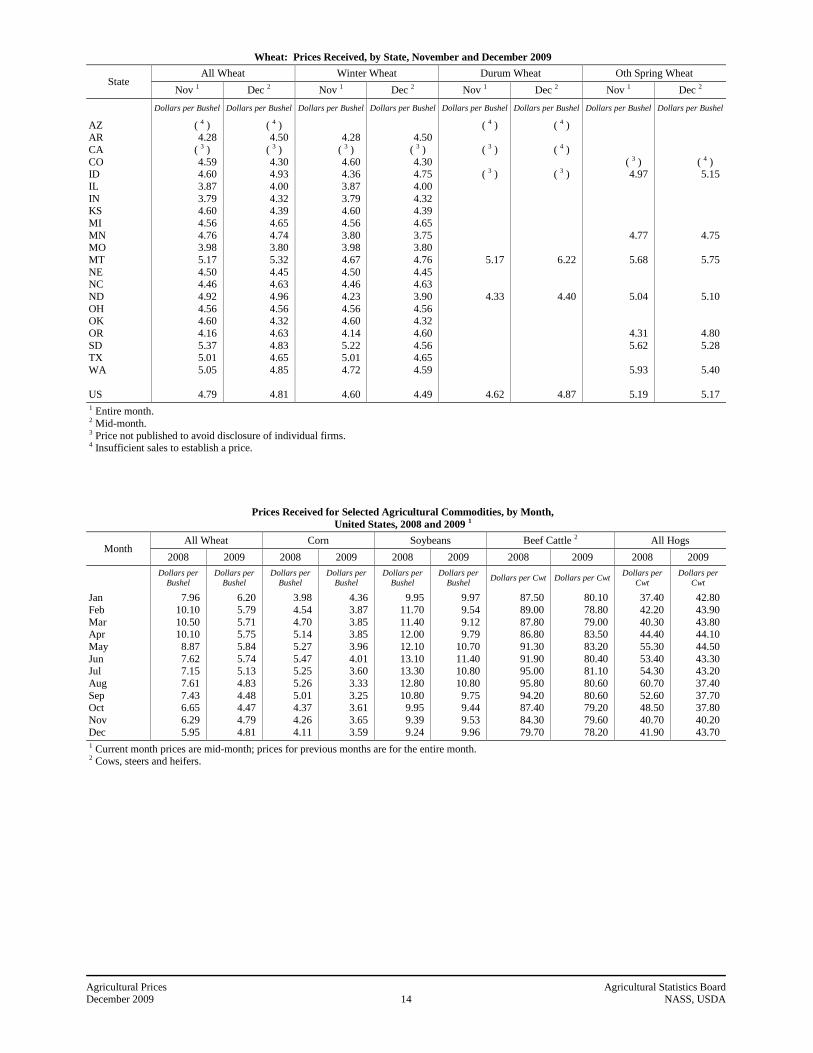
Wheat: Prices Received, by State, November and December 2009
State All Wheat Winter Wheat Durum Wheat Oth Spring Wheat
Nov 1 Dec 2 Nov 1 Dec 2 Nov 1 Dec 2 Nov 1 Dec 2
Dollars per Bushel Dollars per Bushel Dollars per Bushel Dollars per Bushel Dollars per Bushel Dollars per Bushel Dollars per Bushel Dollars per Bushel
AZ AR
CA
CO ID
IL
IN KS
MI
MN MO
MT
NE NC
ND
OH OK
OR
SD TX
WA
US
( 4 ) 4.28
( 3 )
4.59 4.60
3.87
3.79 4.60
4.56
4.76 3.98
5.17
4.50 4.46
4.92
4.56 4.60
4.16
5.37 5.01
5.05
4.79
( 4 ) 4.50
( 3 )
4.30 4.93
4.00
4.32 4.39
4.65
4.74 3.80
5.32
4.45 4.63
4.96
4.56 4.32
4.63
4.83 4.65
4.85
4.81
4.28
( 3 )
4.60 4.36
3.87
3.79 4.60
4.56
3.80 3.98
4.67
4.50 4.46
4.23
4.56 4.60
4.14
5.22 5.01
4.72
4.60
4.50
( 3 )
4.30 4.75
4.00
4.32 4.39
4.65
3.75 3.80
4.76
4.45 4.63
3.90
4.56 4.32
4.60
4.56 4.65
4.59
4.49
( 4 )
( 3 )
( 3 )
5.17
4.33
4.62
( 4 )
( 4 )
( 3 )
6.22
4.40
4.87
( 3 ) 4.97
4.77
5.68
5.04
4.31
5.62
5.93
5.19
( 4 ) 5.15
4.75
5.75
5.10
4.80
5.28
5.40
5.17
1 Entire month. 2 Mid-month. 3 Price not published to avoid disclosure of individual firms. 4 Insufficient sales to establish a price.
Prices Received for Selected Agricultural Commodities, by Month,
United States, 2008 and 2009 1
Month All Wheat Corn Soybeans Beef Cattle 2 All Hogs
2008 2009 2008 2009 2008 2009 2008 2009 2008 2009
Dollars per
Bushel
Dollars per
Bushel
Dollars per
Bushel
Dollars per
Bushel
Dollars per
Bushel
Dollars per
Bushel Dollars per Cwt Dollars per Cwt
Dollars per
Cwt
Dollars per
Cwt
Jan
Feb
Mar Apr
May
Jun Jul
Aug
Sep Oct
Nov
Dec
7.96
10.10
10.50 10.10
8.87
7.62 7.15
7.61
7.43 6.65
6.29
5.95
6.20
5.79
5.71 5.75
5.84
5.74 5.13
4.83
4.48 4.47
4.79
4.81
3.98
4.54
4.70 5.14
5.27
5.47 5.25
5.26
5.01 4.37
4.26
4.11
4.36
3.87
3.85 3.85
3.96
4.01 3.60
3.33
3.25 3.61
3.65
3.59
9.95
11.70
11.40 12.00
12.10
13.10 13.30
12.80
10.80 9.95
9.39
9.24
9.97
9.54
9.12 9.79
10.70
11.40 10.80
10.80
9.75 9.44
9.53
9.96
87.50
89.00
87.80 86.80
91.30
91.90 95.00
95.80
94.20 87.40
84.30
79.70
80.10
78.80
79.00 83.50
83.20
80.40 81.10
80.60
80.60 79.20
79.60
78.20
37.40
42.20
40.30 44.40
55.30
53.40 54.30
60.70
52.60 48.50
40.70
41.90
42.80
43.90
43.80 44.10
44.50
43.30 43.20
37.40
37.70 37.80
40.20
43.70 1 Current month prices are mid-month; prices for previous months are for the entire month. 2 Cows, steers and heifers.
Agricultural Prices Agricultural Statistics Board December 2009 15 NASS, USDA
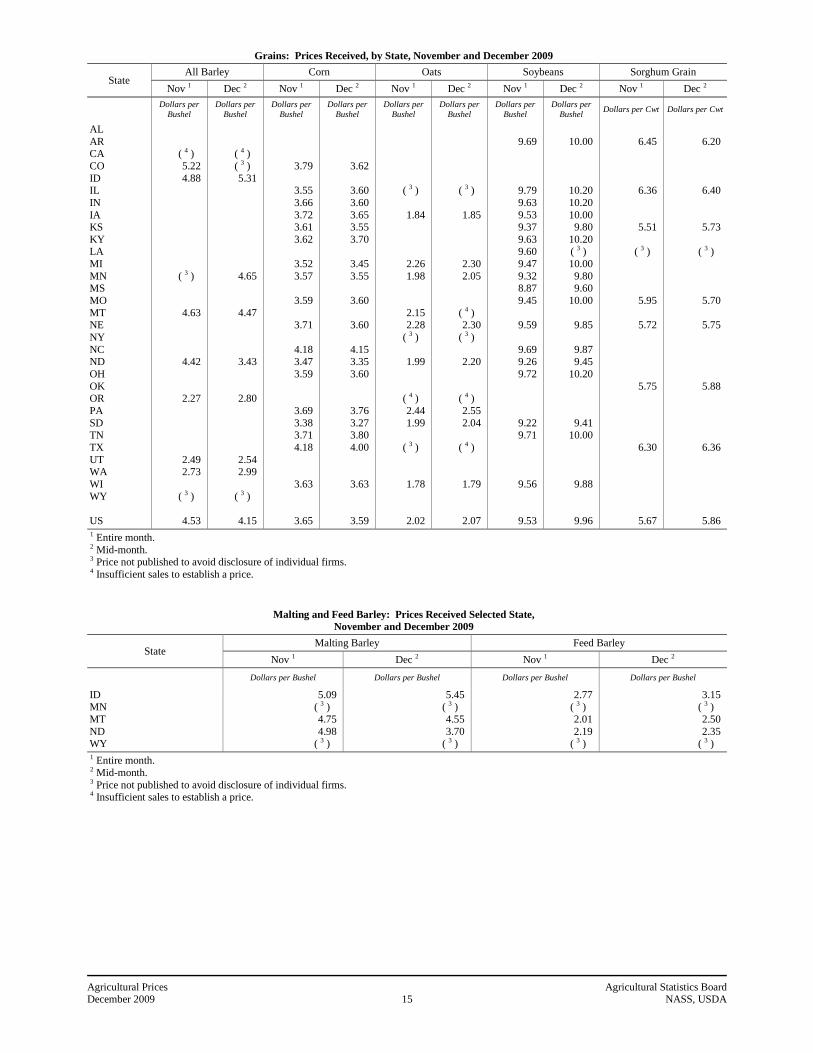
Grains: Prices Received, by State, November and December 2009
State All Barley Corn Oats Soybeans Sorghum Grain
Nov 1 Dec 2 Nov 1 Dec 2 Nov 1 Dec 2 Nov 1 Dec 2 Nov 1 Dec 2
Dollars per
Bushel
Dollars per
Bushel
Dollars per
Bushel
Dollars per
Bushel
Dollars per
Bushel
Dollars per
Bushel
Dollars per
Bushel
Dollars per
Bushel Dollars per Cwt Dollars per Cwt
AL
AR CA
CO
ID IL
IN
IA KS
KY LA
MI
MN MS
MO
MT NE
NY
NC ND
OH
OK OR
PA
SD TN
TX
UT WA
WI
WY
US
( 4 )
5.22
4.88
( 3 )
4.63
4.42
2.27
2.49 2.73
( 3 )
4.53
( 4 )
( 3 )
5.31
4.65
4.47
3.43
2.80
2.54 2.99
( 3 )
4.15
3.79
3.55
3.66
3.72 3.61
3.62
3.52
3.57
3.59
3.71
4.18 3.47
3.59
3.69
3.38 3.71
4.18
3.63
3.65
3.62
3.60
3.60
3.65 3.55
3.70
3.45
3.55
3.60
3.60
4.15 3.35
3.60
3.76
3.27 3.80
4.00
3.63
3.59
( 3 )
1.84
2.26
1.98
2.15 2.28
( 3 )
1.99
( 4 )
2.44
1.99
( 3 )
1.78
2.02
( 3 )
1.85
2.30
2.05
( 4 ) 2.30
( 3 )
2.20
( 4 )
2.55
2.04
( 4 )
1.79
2.07
9.69
9.79
9.63
9.53 9.37
9.63 9.60
9.47
9.32 8.87
9.45
9.59
9.69 9.26
9.72
9.22 9.71
9.56
9.53
10.00
10.20
10.20
10.00 9.80
10.20 ( 3 )
10.00
9.80 9.60
10.00
9.85
9.87 9.45
10.20
9.41 10.00
9.88
9.96
6.45
6.36
5.51
( 3 )
5.95
5.72
5.75
6.30
5.67
6.20
6.40
5.73
( 3 )
5.70
5.75
5.88
6.36
5.86 1 Entire month. 2 Mid-month. 3 Price not published to avoid disclosure of individual firms. 4 Insufficient sales to establish a price.
Malting and Feed Barley: Prices Received Selected State,
November and December 2009
State Malting Barley Feed Barley
Nov 1 Dec 2 Nov 1 Dec 2
Dollars per Bushel Dollars per Bushel Dollars per Bushel Dollars per Bushel
ID MN
MT
ND WY
5.09 ( 3 )
4.75
4.98 ( 3 )
5.45 ( 3 )
4.55
3.70 ( 3 )
2.77 ( 3 )
2.01
2.19 ( 3 )
3.15 ( 3 )
2.50
2.35 ( 3 )
1 Entire month. 2 Mid-month. 3 Price not published to avoid disclosure of individual firms. 4 Insufficient sales to establish a price.

Agricultural Prices Agricultural Statistics Board December 2009 16 NASS, USDA
Field Crops: Prices Received, by State, November and December 2009
State
Dry Edible
Beans
All
Sunflower Canola Flaxseed Peanuts 4 5
Nov 1 Dec 2 Nov 1 Dec 2 Nov 1 Dec 2 Nov 1 Dec 2 Nov 1 Dec 3
Dollars per
Cwt
Dollars per
Cwt
Dollars per
Cwt
Dollars per
Cwt
Dollars per
Cwt
Dollars per
Cwt
Dollars per
Bushel
Dollars per
Bushel
Dollars per
Pound
Dollars per
Pound
AL CA
CO
FL GA
ID
KS MI
MN MS
NE
NM NC
ND
OK SC
SD
TX VA
US
54.70
30.40
32.40
33.30
30.50
30.90
28.50
30.10
56.80
31.00
32.80
34.00
( 6 )
30.70
28.00
31.80
( 7 )
18.80
19.10
13.80
12.50
14.10
( 7 )
19.00
19.30
14.40
12.80
14.60
( 6 )
16.00
16.00
( 7 )
16.10
16.10
8.15
8.15
8.15
8.15
( 6 )
0.205 0.186
0.189
0.338 0.222
0.186 0.217
0.246 0.244
0.218
( 6 )
0.165 0.194
0.176
( 7 ) 0.224
0.198 0.212
0.231 0.216
0.209 1 Entire month. 2 Mid-month. 3 Based on sales through first half of month. 4 In-Shell. 5 Monthly published estimates for MS, NM, OK, and SC began in August 2009. 6 Price not published to avoid disclosure of individual firms. 7 Insufficient sales to establish a price.

Agricultural Prices Agricultural Statistics Board December 2009 17 NASS, USDA
Field Crops and Apples: Prices Received, by State, November and December 2009
State
Cotton, Upland December
Cotton- seed
5
Hay, Baled 3 Apples
Fresh
Use 2 4 Nov
1 Dec
2 All Alfalfa Other
Dollars per Pound Dollars per Pound Dollars per Ton Dollars per Ton Dollars per Ton Dollars per Ton Dol/Lb
AL
AZ AR
CA
CO
GA
ID
IL
IA
KS KY
LA
MI
MN
MS
MO
MT NE
NV
NM
NY
NC
ND
OH
OK OR
PA
SD
TN
TX
UT
VA
WA WI
WY
US
0.669
( 6 )
0.611
( 6 )
0.657
0.644
0.610
0.555
0.629
0.553
0.585
0.700
( 6 )
0.595
( 6 )
0.655
0.595
0.665
0.577
0.641
0.542
0.582
133.00
198.00 182.00
279.00
126.00
( 7 )
161.00
160.00
174.00
156.00
164.00
105.00
98.00
128.00
109.00
112.00
106.00
104.00 94.00
142.00
104.00
82.00
91.00 76.00
102.00
144.00
129.00
62.00
113.00
105.00 139.00
135.00
82.00
115.00
99.00
136.00 105.00
98.00
107.00
105.00
103.00
130.00
110.00
123.00
111.00
107.00 155.00
145.00
120.00
130.00
93.00 78.00
102.00
146.00
145.00
68.00
162.00
124.00 128.00
156.00
85.00
183.00
100.00
120.00 110.00
100.00
110.00
110.00
79.00
110.00
79.00
90.00
77.00
74.00 80.00
130.00
80.00
65.00
83.00 61.00
99.00
119.00
125.00
46.00
94.00
79.00 170.00
129.00
70.00
106.00
90.00
170.00 80.00
93.00
98.90
0.323
0.185
0.215
0.350
0.278
0.320
0.291
0.272 1 Entire month.
2 Based on sales during the first half of the month.
3 Mid-month.
4 Equivalent packinghouse-door returns for CA, MI, NY, and WA. Price at point of first sale for other States.
5 Marketing year August - February.
6 Price not published to avoid disclosure of individual firms.
7 Insufficient sales to establish a price.
Upland Cotton and Rice: Prices Received and Marketings,
United States, December 2009, with Comparisons
Item Unit Dec 2008 1 Nov 2009
1 Dec 2009
2
Cotton, Upland
Average Price Marketings
3
Rice, All
Average Price
Marketings 4
Rice, Long Average Price
Marketings 4
Rice, Medium & Short
Average Price
Marketings 4
Dollars per Pound 1,000 Bales
Dollars per Cwt
1,000 Cwt
Dollars per Cwt
1,000 Cwt
Dollars per Cwt
1,000 Cwt
0.533 782
18.60
11,717
16.30
8,461
24.30
3,256
0.585 1,611
13.80
13,277
13.00
10,274
16.60
3,003
0.582 NA
14.20
NA
12.70
NA
16.30
NA 1 Entire month.
2 Based on purchases for the first half of the month.
3 Marketings based on a survey of cotton buyers in the major producing States - AL, AZ, AR, CA, GA, LA, MS, NC, TN, and TX.
4 Purchases by private firms and rice (rough equivalent) shipped by cooperatives.

Agricultural Prices Agricultural Statistics Board December 2009 18 NASS, USDA
Citrus Fruit: Prices and Equivalent Returns, by Utilization,
by State and United States, December 2009
Commodity,
State
and Type
F.O.B.
Packed
Fresh
Equivalent Returns 1
Packinghouse-door On-tree
All Fresh Process All Fresh Process
Dollars per Box Dollars per Box Dollars per Box Dollars per Box Dollars per Box Dollars per Box Dollars per Box
Grapefruit
CA FL
White
Colored TX
US
Lemons
AZ CA
US
Oranges
CA Navel and Misc
FL Early and Mids
US
Tangelos
FL
Tangerines and Mandarins
AZ
CA FL
US
19.30 22.40
27.20
21.50 26.20
22.10
38.90 39.30
39.20
24.10
23.70
24.00
20.30
( 3 )
( 3 ) 30.10
31.10
9.50 10.04
10.20
10.00 10.50
10.02
18.98 19.44
19.36
14.23
7.37
8.48
6.94
( 3 )
( 3 ) 13.43
14.42
9.50 13.02
17.85
12.15 15.95
12.45
28.21 28.61
28.54
15.71
13.80
15.17
10.05
( 3 )
( 3 ) 18.10
19.32
( 2 ) 4.81
3.60
5.35 1.60
3.94
( 3 ) ( 3 )
( 3 )
( 3 )
6.90
6.79
2.80
( 3 )
( 3 ) 2.65
2.60
6.40 7.39
7.50
7.37 9.07
7.51
13.23 13.69
13.61
11.58
4.85
5.94
3.82
( 3 )
( 3 ) 9.33
10.38
6.40 10.62
15.20
9.80 14.50
10.00
22.46 22.86
22.79
13.06
11.00
12.48
6.80
( 3 )
( 3 ) 14.10
15.38
( 2 ) 1.71
0.85
2.10 0.20
1.30
( 3 ) ( 3 )
( 3 )
( 3 )
4.40
4.29
-0.15
( 3 )
( 3 ) -1.70
-1.69 1 Net lbs. per box: Grapefruit - AZ & CA-67, FL-85, TX-80; Lemons - 76; Oranges - AZ & CA-75, FL-90, TX-85; Tangelos - 90; Tangerines and
Mandarins- AZ & CA-75, FL-95. 2 Processed sales insignificant and included in fresh sales. 3 Price not published to avoid disclosure of individual firms.

Agricultural Prices Agricultural Statistics Board December 2009 19 NASS, USDA
Potatoes: Prices Received, by State, November and December 2009 1
State Nov Dec 2 State Nov Dec 2
Dollars per Cwt Dollars per Cwt Dollars per Cwt Dollars per Cwt
CA - All 3
- Winter - Spring
- Summer
- Fall CO - All 3
- Fresh 4
FL ID - All 3
- Fresh 4
- Processing ME
MI
MN NY
9.05
9.05 6.50
6.65
5.85
4.80
7.00 9.55
10.30
7.30 12.10
8.90
8.90 6.50
NA
5.65
NA
NA 9.70
10.60
7.25 12.10
NC
ND - All 3 - Fresh 4
- Processing
OR TX
VA
WA - All 3 - Processing
WI - All 3
- Fresh 4 - Processing
US - All 3 - Fresh 4
- Processing
9.80 9.70
9.65
6.80
6.30 6.20
7.95
6.95 8.80
7.09 6.52
7.41
9.25 NA
NA
6.50
6.50 NA
8.25
NA NA
7.16 NA
NA 1 Missing data indicate no potatoes being marketed. 2 Preliminary price reflecting prices received for the entire month. 3 Average price of potatoes sold for all uses, including table stocks, processing, seed, and livestock feed. 4 Fresh market prices only, includes table stock prices.
Agricultural Prices Agricultural Statistics Board December 2009 20 NASS, USDA
Cattle: Prices Received, by State, November and December 2009
State Cows 1 Steers & Heifers Beef Cattle 4 Calves
Nov 2 Dec 3 Nov 2 Dec 3 Nov 2 Dec 3 Nov 2 Dec 3
Dollars per Cwt Dollars per Cwt Dollars per Cwt Dollars per Cwt Dollars per Cwt Dollars per Cwt Dollars per Cwt Dollars per Cwt
AZ
AR
CA CO
FL
GA ID
IL
IA KS
KY
LA MI
MN
MO MT
NE
NM
ND
OH
OK OR
PA
SD TN
TX
VA WI
WY
US
43.00
38.50
44.40 43.50
37.50
43.10 42.30
42.00
42.50 42.70
41.00
39.00 43.00
44.60
40.20 38.60
44.40
45.00
43.00
38.70
38.80 45.00
40.30
44.90 38.00
36.80
39.30 41.00
39.30
41.70
45.00
42.50
45.00 45.50
41.30
45.00 42.50
42.40
43.50 44.90
42.00
44.00 44.00
45.00
41.20 41.60
45.60
47.00
43.00
40.00
43.50 45.00
40.50
45.70 39.00
39.60
41.00 41.40
42.00
42.90
86.00
84.00
85.10 90.00
76.10
76.90 85.50
83.40
83.50 85.60
80.00
76.80 77.00
82.60
87.50 97.00
85.10
89.00
92.50
77.60
94.70 84.00
79.50
90.20 79.00
86.60
76.80 76.90
97.00
85.40
84.00
85.50
82.80 87.00
77.30
76.90 82.60
85.50
83.00 82.60
80.00
77.00 78.00
80.90
87.50 97.20
83.00
87.50
93.00
78.00
92.60 82.00
79.50
89.00 80.00
85.20
79.00 76.00
91.00
83.50
58.50
70.40
67.20 89.10
63.30
57.30 71.20
82.60
82.70 84.70
70.60
52.60 66.80
71.70
78.00 77.10
83.90
70.10
78.60
73.70
87.50 76.20
69.30
89.30 62.60
80.60
67.10 56.10
75.70
79.60
59.00
72.60
65.80 86.20
64.50
55.50 71.40
84.60
82.20 81.80
70.90
54.60 67.80
70.60
77.80 72.20
81.90
72.10
78.50
74.20
87.20 76.50
69.40
88.10 63.60
79.70
62.70 55.90
71.40
78.20
98.00
91.50
100.00 101.00
90.50
93.20 100.00
94.10
99.50 110.00
90.00
89.30 79.00
105.00
99.20 108.00
109.00
103.00
103.00
93.80
103.00 98.00
100.00
107.00 87.00
104.00
85.90 127.00
109.00
105.00
101.00
97.00
104.00 107.00
93.20
92.50 104.00
91.50
98.00 111.00
89.00
94.00 79.00
106.00
100.00 108.00
112.00
100.00
104.00
91.00
104.00 96.00
100.00
110.00 88.00
101.00
89.10 127.00
111.00
105.00 1 Beef cows and cull dairy cows sold for slaughter. 2 Entire month. 3 Mid-month. 4 "Cows" and "steers and heifers" combined.
Agricultural Prices Agricultural Statistics Board December 2009 21 NASS, USDA
Hogs: Prices Received, by State, November and December 2009
State Sows Barrows and Gilts All Hogs
Nov 1 Dec 2 Nov 1 Dec 2 Nov 1 Dec 2
Dollars per Cwt Dollars per Cwt Dollars per Cwt Dollars per Cwt Dollars per Cwt Dollars per Cwt
AR
IL
IN IA
KS
MN MO
NE
NC OH
OK
PA SD
US
37.20
33.80
39.80 37.00
37.50
36.00 35.00
38.40
40.30 35.10
34.40
38.10 34.80
36.60
32.40
30.80
35.90 33.80
33.50
32.10 31.10
34.40
36.40 32.00
31.20
35.00 31.30
33.00
37.00
42.40
42.10 40.50
36.00
41.70 35.90
41.90
40.80 40.20
34.00
37.40 41.40
40.30
41.00
44.70
44.90 44.00
40.60
46.30 40.60
46.30
45.00 43.00
37.90
39.80 46.40
44.20
37.00
41.70
41.90 40.50
36.20
41.70 35.80
41.80
40.80 39.90
34.10
37.50 40.50
40.20
40.10
43.60
44.00 43.90
39.70
46.20 40.00
46.10
44.90 42.30
36.80
39.10 44.70
43.70 1 Entire month. 2 Mid-month.
Agricultural Prices Agricultural Statistics Board December 2009 22 NASS, USDA
Sheep and Poultry: Prices Received, by State, November and December 2009
State November December
Sheep 1 Lambs 1 Market Eggs 2 3
Dollars per Cwt Dollars per Cwt Dollars per Dozen
AL
AR
CA CO
CT
FL GA
ID
IN IA
KY
ME MI
MN
MS MO
MT
NE
NY
NC
ND OH
OR
PA SC
SD
TX VA
WA WV
WY
US
43.50 34.00
29.00
32.00
45.00
37.30
44.20
39.00
39.90
31.00 40.10
50.00
50.00
32.00
39.30 40.00
36.00
36.10
36.80
83.00 95.00
89.00
92.50
105.00
97.70
104.00
106.00
101.00
97.00 102.00
90.00
114.00
109.00
112.00 108.00
110.00
95.00
98.00
0.900
0.930
1.000
0.900
0.920 0.907
0.900 0.890
0.980 0.900
0.900
0.900 0.900
0.911
0.870
0.901
0.920 0.870
0.970
1.060
0.918
1 Entire month. 2 Mid-month. 3 Also referred to as table eggs.
Agricultural Prices Agricultural Statistics Board December 2009 23 NASS, USDA
Milk and Milk Cows: Prices Received, by State, November and December 2009 1
State
November 2 December
Fluid Grade
Milk 3
Manufacturing
Grade Milk All Milk 4 All Milk 4 5
Milk
Cows 6 Price
Fat Test
Price Fat Test
Price Fat Test
Price Fat Test
Dol/Cwt Percent Dol/Cwt Percent Dol/Cwt Percent Dol/Cwt Percent Dol/Head
AZ CA
CO
FL ID
IL
IN IA
KS
MI MN
MO
NM NY
OH
OR PA
TX
UT VT
VA
WA WI
US
14.40 13.90
14.90
18.20 14.80
15.60
16.00 15.80
16.30
15.60 16.20
15.20
14.90 15.30
16.70
16.10 16.80
16.10
14.70 16.20
17.50
14.60 15.70
15.30
3.58 3.73
3.58
3.63 3.75
3.81
3.73 3.77
3.78
3.71 3.84
3.75
3.66 3.79
3.82
3.84 3.80
3.81
3.76 3.81
3.74
3.84 3.75
3.75
15.10
15.00
14.70
14.60
13.70
13.90
15.30
15.00
4.32
3.92
4.07
3.94
3.95
4.01
3.96
4.14
14.40 13.94
14.90
18.20 14.80
15.60
16.00 15.80
16.30
15.60 16.20
15.10
14.90 15.30
16.60
16.10 16.80
16.10
14.70 16.20
17.50
14.60 15.70
15.30
3.58 3.75
3.58
3.63 3.75
3.81
3.73 3.77
3.78
3.71 3.84
3.76
3.66 3.79
3.83
3.84 3.80
3.81
3.76 3.81
3.74
3.84 3.76
3.76
15.20 15.40
16.00
19.40 15.50
16.40
17.00 16.80
17.30
16.60 17.00
16.00
15.90 16.30
17.40
17.30 17.90
17.00
15.50 16.90
18.90
15.80 16.60
16.30
3.59 3.80
3.62
3.62 3.80
3.84
3.75 3.80
3.82
3.75 3.85
3.80
3.70 3.81
3.86
3.86 3.80
3.85
3.80 3.84
3.77
3.86 3.76
3.79
1 Beginning in March 2009, Utah was added and Kentucky removed from the monthly milk price and quarterly milk cow price programs. The U.S.
prices and fat test percents for fluid and all milk include Utah and exclude Kentucky beginning in January 2008. 2 Entire month. 3 Including milk diverted to manufacturing. 4 Before deductions for hauling. Includes quality, quantity, and other premiums. Excludes hauling subsidies. 5 Preliminary. 6 Animals sold for dairy herd replacement only. Prices published January, April, July and October.
Parity Price Equivalent for Manufacturing Grade Milk 1: United States,
November and December 2009, with Comparisons
Item Unit Dec 2008 Nov 2009 Dec 2009
Parity Equivalent
Average Price F.O.B Average Fat Test of Milk
Dollars per Cwt
Dollars per Cwt Percent
42.50
15.60 4.25
41.70
15.00 4.14
42.00
16.10 4.17
1 The parity price equivalent during 2009 is 93.2 percent of the parity price of all milk sold to plants, compared with 92.4 percent in 2008. For
additional details, see January 2009 issue of Agricultural Prices.
Agricultural Prices Agricultural Statistics Board December 2009 24 NASS, USDA
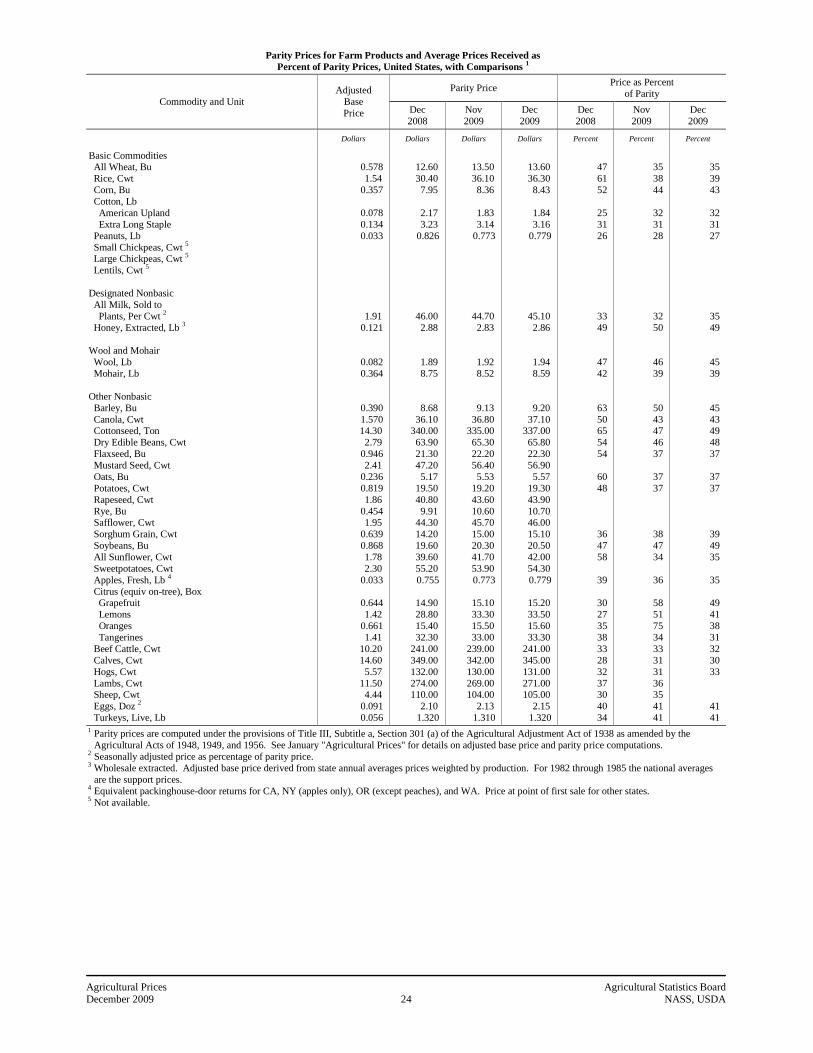
Parity Prices for Farm Products and Average Prices Received as
Percent of Parity Prices, United States, with Comparisons 1
Commodity and Unit
Adjusted
Base
Price
Parity Price Price as Percent
of Parity
Dec
2008
Nov
2009
Dec
2009
Dec
2008
Nov
2009
Dec
2009
Dollars Dollars Dollars Dollars Percent Percent Percent
Basic Commodities All Wheat, Bu
Rice, Cwt
Corn, Bu
Cotton, Lb
American Upland
Extra Long Staple
Peanuts, Lb
Small Chickpeas, Cwt 5
Large Chickpeas, Cwt 5
Lentils, Cwt 5
Designated Nonbasic
All Milk, Sold to
Plants, Per Cwt 2
Honey, Extracted, Lb 3
Wool and Mohair
Wool, Lb
Mohair, Lb
Other Nonbasic
Barley, Bu
Canola, Cwt Cottonseed, Ton
Dry Edible Beans, Cwt
Flaxseed, Bu
Mustard Seed, Cwt
Oats, Bu
Potatoes, Cwt
Rapeseed, Cwt
Rye, Bu Safflower, Cwt
Sorghum Grain, Cwt
Soybeans, Bu
All Sunflower, Cwt
Sweetpotatoes, Cwt
Apples, Fresh, Lb 4
Citrus (equiv on-tree), Box Grapefruit
Lemons
Oranges
Tangerines
Beef Cattle, Cwt
Calves, Cwt
Hogs, Cwt
Lambs, Cwt Sheep, Cwt
Eggs, Doz 2
Turkeys, Live, Lb
0.578
1.54
0.357
0.078
0.134
0.033
1.91
0.121
0.082
0.364
0.390
1.570 14.30
2.79
0.946
2.41
0.236
0.819
1.86
0.454 1.95
0.639
0.868
1.78
2.30
0.033
0.644
1.42
0.661
1.41
10.20
14.60
5.57
11.50 4.44
0.091
0.056
12.60
30.40
7.95
2.17
3.23
0.826
46.00
2.88
1.89
8.75
8.68
36.10 340.00
63.90
21.30
47.20
5.17
19.50
40.80
9.91 44.30
14.20
19.60
39.60
55.20
0.755
14.90
28.80
15.40
32.30
241.00
349.00
132.00
274.00 110.00
2.10
1.320
13.50
36.10
8.36
1.83
3.14
0.773
44.70
2.83
1.92
8.52
9.13
36.80 335.00
65.30
22.20
56.40
5.53
19.20
43.60
10.60 45.70
15.00
20.30
41.70
53.90
0.773
15.10
33.30
15.50
33.00
239.00
342.00
130.00
269.00 104.00
2.13
1.310
13.60
36.30
8.43
1.84
3.16
0.779
45.10
2.86
1.94
8.59
9.20
37.10 337.00
65.80
22.30
56.90
5.57
19.30
43.90
10.70 46.00
15.10
20.50
42.00
54.30
0.779
15.20
33.50
15.60
33.30
241.00
345.00
131.00
271.00 105.00
2.15
1.320
47
61
52
25
31
26
33
49
47
42
63
50 65
54
54
60
48
36
47
58
39
30
27
35
38
33
28
32
37 30
40
34
35
38
44
32
31
28
32
50
46
39
50
43 47
46
37
37
37
38
47
34
36
58
51
75
34
33
31
31
36 35
41
41
35
39
43
32
31
27
35
49
45
39
45
43 49
48
37
37
37
39
49
35
35
49
41
38
31
32
30
33
41
41 1 Parity prices are computed under the provisions of Title III, Subtitle a, Section 301 (a) of the Agricultural Adjustment Act of 1938 as amended by the
Agricultural Acts of 1948, 1949, and 1956. See January "Agricultural Prices" for details on adjusted base price and parity price computations. 2 Seasonally adjusted price as percentage of parity price.
3 Wholesale extracted. Adjusted base price derived from state annual averages prices weighted by production. For 1982 through 1985 the national averages
are the support prices. 4 Equivalent packinghouse-door returns for CA, NY (apples only), OR (except peaches), and WA. Price at point of first sale for other states.
5 Not available.
Agricultural Prices Agricultural Statistics Board December 2009 25 NASS, USDA
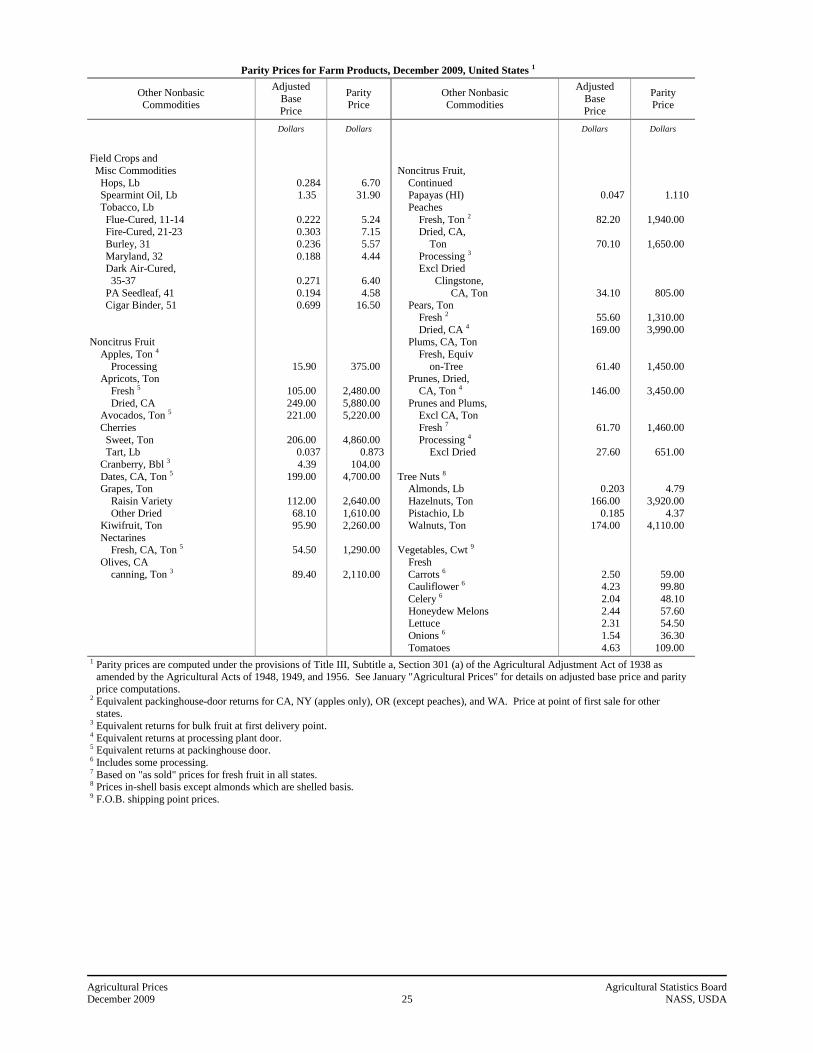
Parity Prices for Farm Products, December 2009, United States 1
Other Nonbasic Commodities
Adjusted
Base
Price
Parity Price
Other Nonbasic Commodities
Adjusted
Base
Price
Parity Price
Dollars Dollars Dollars Dollars
Field Crops and
Misc Commodities
Hops, Lb Spearmint Oil, Lb
Tobacco, Lb
Flue-Cured, 11-14 Fire-Cured, 21-23
Burley, 31
Maryland, 32 Dark Air-Cured,
35-37
PA Seedleaf, 41 Cigar Binder, 51
Noncitrus Fruit
Apples, Ton 4
Processing Apricots, Ton
Fresh 5
Dried, CA Avocados, Ton 5
Cherries
Sweet, Ton Tart, Lb
Cranberry, Bbl 3
Dates, CA, Ton 5 Grapes, Ton
Raisin Variety
Other Dried Kiwifruit, Ton
Nectarines Fresh, CA, Ton 5
Olives, CA
canning, Ton 3
0.284 1.35
0.222 0.303
0.236
0.188
0.271
0.194 0.699
15.90
105.00
249.00 221.00
206.00 0.037
4.39
199.00
112.00
68.10 95.90
54.50
89.40
6.70 31.90
5.24 7.15
5.57
4.44
6.40
4.58 16.50
375.00
2,480.00
5,880.00 5,220.00
4,860.00 0.873
104.00
4,700.00
2,640.00
1,610.00 2,260.00
1,290.00
2,110.00
Noncitrus Fruit,
Continued Papayas (HI)
Peaches
Fresh, Ton 2 Dried, CA,
Ton
Processing 3 Excl Dried
Clingstone,
CA, Ton Pears, Ton
Fresh 2
Dried, CA 4
Plums, CA, Ton
Fresh, Equiv
on-Tree Prunes, Dried,
CA, Ton 4
Prunes and Plums, Excl CA, Ton
Fresh 7
Processing 4 Excl Dried
Tree Nuts 8 Almonds, Lb
Hazelnuts, Ton
Pistachio, Lb Walnuts, Ton
Vegetables, Cwt 9
Fresh
Carrots 6 Cauliflower 6
Celery 6
Honeydew Melons Lettuce
Onions 6
Tomatoes
0.047
82.20
70.10
34.10
55.60
169.00
61.40
146.00
61.70
27.60
0.203
166.00
0.185 174.00
2.50 4.23
2.04
2.44 2.31
1.54
4.63
1.110
1,940.00
1,650.00
805.00
1,310.00
3,990.00
1,450.00
3,450.00
1,460.00
651.00
4.79
3,920.00
4.37 4,110.00
59.00 99.80
48.10
57.60 54.50
36.30
109.00 1 Parity prices are computed under the provisions of Title III, Subtitle a, Section 301 (a) of the Agricultural Adjustment Act of 1938 as
amended by the Agricultural Acts of 1948, 1949, and 1956. See January "Agricultural Prices" for details on adjusted base price and parity
price computations. 2 Equivalent packinghouse-door returns for CA, NY (apples only), OR (except peaches), and WA. Price at point of first sale for other
states. 3 Equivalent returns for bulk fruit at first delivery point. 4 Equivalent returns at processing plant door. 5 Equivalent returns at packinghouse door. 6 Includes some processing. 7 Based on "as sold" prices for fresh fruit in all states. 8 Prices in-shell basis except almonds which are shelled basis. 9 F.O.B. shipping point prices.
Agricultural Prices Agricultural Statistics Board December 2009 26 NASS, USDA
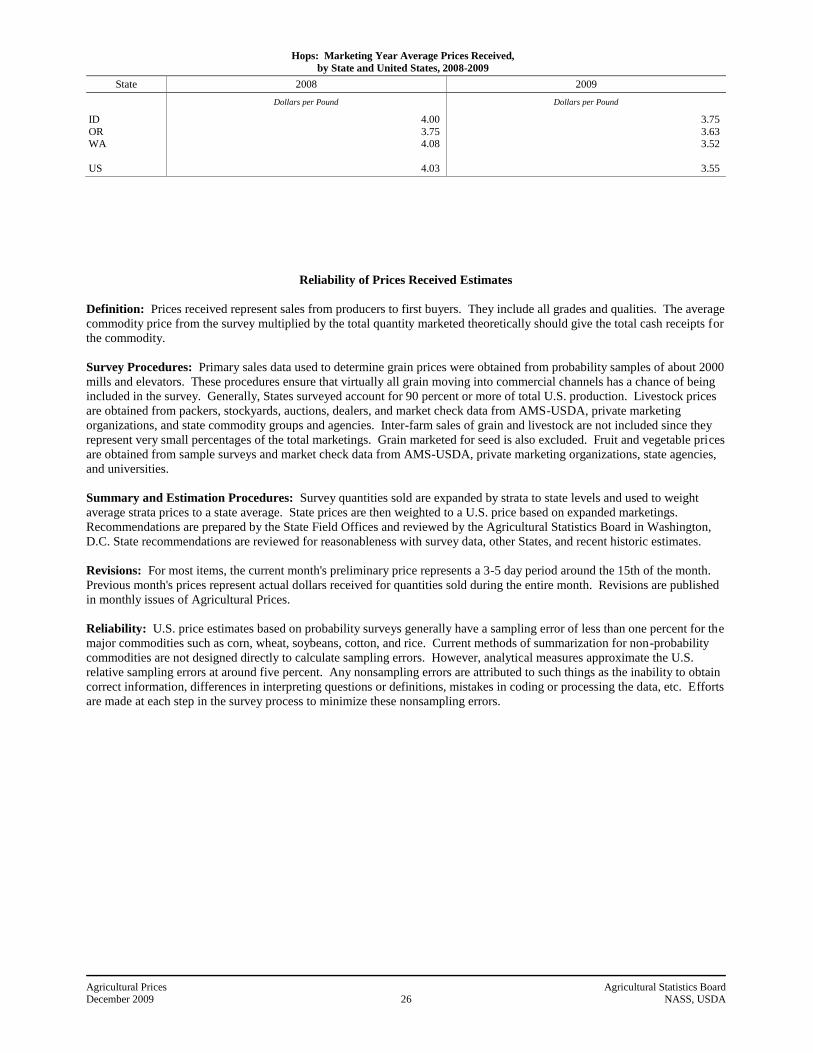
Hops: Marketing Year Average Prices Received,
by State and United States, 2008-2009
State 2008 2009
Dollars per Pound Dollars per Pound
ID
OR WA
US
4.00
3.75 4.08
4.03
3.75
3.63 3.52
3.55
Reliability of Prices Received Estimates
Definition: Prices received represent sales from producers to first buyers. They include all grades and qualities. The average
commodity price from the survey multiplied by the total quantity marketed theoretically should give the total cash receipts for
the commodity.
Survey Procedures: Primary sales data used to determine grain prices were obtained from probability samples of about 2000
mills and elevators. These procedures ensure that virtually all grain moving into commercial channels has a chance of being
included in the survey. Generally, States surveyed account for 90 percent or more of total U.S. production. Livestock prices
are obtained from packers, stockyards, auctions, dealers, and market check data from AMS-USDA, private marketing
organizations, and state commodity groups and agencies. Inter-farm sales of grain and livestock are not included since they
represent very small percentages of the total marketings. Grain marketed for seed is also excluded. Fruit and vegetable prices
are obtained from sample surveys and market check data from AMS-USDA, private marketing organizations, state agencies,
and universities.
Summary and Estimation Procedures: Survey quantities sold are expanded by strata to state levels and used to weight
average strata prices to a state average. State prices are then weighted to a U.S. price based on expanded marketings.
Recommendations are prepared by the State Field Offices and reviewed by the Agricultural Statistics Board in Washington,
D.C. State recommendations are reviewed for reasonableness with survey data, other States, and recent historic estimates.
Revisions: For most items, the current month's preliminary price represents a 3-5 day period around the 15th of the month.
Previous month's prices represent actual dollars received for quantities sold during the entire month. Revisions are published
in monthly issues of Agricultural Prices.
Reliability: U.S. price estimates based on probability surveys generally have a sampling error of less than one percent for the
major commodities such as corn, wheat, soybeans, cotton, and rice. Current methods of summarization for non-probability
commodities are not designed directly to calculate sampling errors. However, analytical measures approximate the U.S.
relative sampling errors at around five percent. Any nonsampling errors are attributed to such things as the inability to obtain
correct information, differences in interpreting questions or definitions, mistakes in coding or processing the data, etc. Efforts
are made at each step in the survey process to minimize these nonsampling errors.
Agricultural Prices Agricultural Statistics Board December 2009 27 NASS, USDA
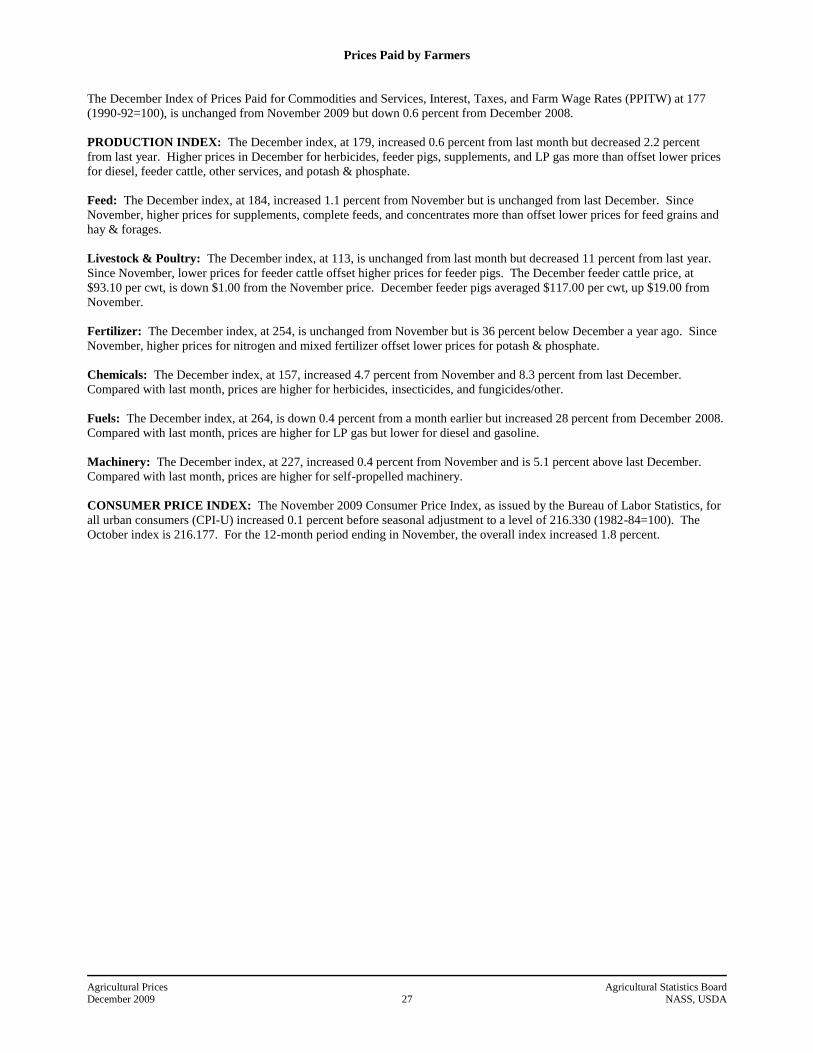
Prices Paid by Farmers
The December Index of Prices Paid for Commodities and Services, Interest, Taxes, and Farm Wage Rates (PPITW) at 177
(1990-92=100), is unchanged from November 2009 but down 0.6 percent from December 2008.
PRODUCTION INDEX: The December index, at 179, increased 0.6 percent from last month but decreased 2.2 percent
from last year. Higher prices in December for herbicides, feeder pigs, supplements, and LP gas more than offset lower prices
for diesel, feeder cattle, other services, and potash & phosphate.
Feed: The December index, at 184, increased 1.1 percent from November but is unchanged from last December. Since
November, higher prices for supplements, complete feeds, and concentrates more than offset lower prices for feed grains and
hay & forages.
Livestock & Poultry: The December index, at 113, is unchanged from last month but decreased 11 percent from last year.
Since November, lower prices for feeder cattle offset higher prices for feeder pigs. The December feeder cattle price, at
$93.10 per cwt, is down $1.00 from the November price. December feeder pigs averaged $117.00 per cwt, up $19.00 from
November.
Fertilizer: The December index, at 254, is unchanged from November but is 36 percent below December a year ago. Since
November, higher prices for nitrogen and mixed fertilizer offset lower prices for potash & phosphate.
Chemicals: The December index, at 157, increased 4.7 percent from November and 8.3 percent from last December.
Compared with last month, prices are higher for herbicides, insecticides, and fungicides/other.
Fuels: The December index, at 264, is down 0.4 percent from a month earlier but increased 28 percent from December 2008.
Compared with last month, prices are higher for LP gas but lower for diesel and gasoline.
Machinery: The December index, at 227, increased 0.4 percent from November and is 5.1 percent above last December.
Compared with last month, prices are higher for self-propelled machinery.
CONSUMER PRICE INDEX: The November 2009 Consumer Price Index, as issued by the Bureau of Labor Statistics, for
all urban consumers (CPI-U) increased 0.1 percent before seasonal adjustment to a level of 216.330 (1982-84=100). The
October index is 216.177. For the 12-month period ending in November, the overall index increased 1.8 percent.

Agricultural Prices Agricultural Statistics Board December 2009 28 NASS, USDA
Indexes of Prices Paid by Farmers and Related Parity Ratios
United States, December 2009 with Comparisons 1
Indexes
and
Ratios
1910-14 = 100 1990-92 = 100
2008 2009 2008 2009
Dec Nov Dec Dec Nov Dec
Prices Paid by Farmers for Commodities & Services,
Interest, Taxes, & Wage
Rates (PPITW) Production
Feed
Livestock & Poultry Seeds
Fertilizer
Chemicals Fuels
Supplies & Repairs
Autos & Trucks Machinery
Building Materials
Services & Rent Services
Rent
Interest 2 Taxes 3
Wage Rates
Production, Interest, Taxes, & Wage Rates (PITW)
Family Living-CPI 4
2366 1777
901
1617 2722
1452
899 1601
1115
2818 5431
2272
1779
3542 5670
6914
2450
1997
2354 1730
891
1441 3008
931
927 2043
1110
2987 5682
2201
1809
3862 6273
7049
2420
2055
2360 1736
898
1449 3008
932
973 2037
1111
3017 5688
2196
1805
3862 6273
7049
2427
2056
178 183
184
127 275
396
145 207
157
106 216
167
147
154
141 212
185
182
156
177 178
182
113 304
254
150 265
156
112 226
162
147
160
154 234
188
180
160
177 179
184
113 304
254
157 264
157
113 227
162
147
160
154 234
188
181
161
Ratio (Received\Paid) Parity Ratio 5
Parity Ratio Adjusted 6
PPITW Adjusted for Productivity 7
36
38
1445
37
38
1457
37
38
1459
76
77
77
Crop Sector (PPITW)
Livestock Sector (PPITW)
188
168
187
167
187
168
Farm Sector (Production)
Non-Farm Sector (Production)
179
185
178
178
179
179 1 Revised historical price indexes for months not shown are available at www.nass.usda.gov. 2 Interest per acre on farm real estate debt and interest rate on farm non-real estate debt. 3 Farm real estate taxes payable per acre. 4 Bureau of Labor Statistics, Consumer Price Index for all urban consumers (CPI-U), for the previous month converted by the USDA. 5 Ratio of index of prices received to PPITW (1910-14=100). 6 Based on estimated cash receipts, from marketings and government payments, the preliminary adjustment factor is 1.044 for 2009 and the revised
factor is 1.041 for 2008. 7 PPITW is adjusted based on productivity trend for the prior 15 years.

Agricultural Prices Agricultural Statistics Board December 2009 29 NASS, USDA
Prices Paid Indexes and Annual Weights for Input Components and
Sub-Components United States, December 2009 with Comparisons 1
Index
Relative Weights
5-Year Moving Average 2
Input Indexes
2008 2009
2008 2009 Dec Nov Dec
Percent Percent (1990-92=100) (1990-92=100) (1990-92=100)
Production Items
Feed
Feed Grains
Complete Feeds Hay/Forage
Concentrates
Supplements Livestock & Poultry
Feeder Cattle
Feeder Pigs Milk Cow Replacements
Poultry
Seeds Field Crops
Grasses/Legumes
Fertilizer Mixed Fertilizer
Nitrogen
Potash & Phosphate Chemicals
Herbicides
Insecticides Fungicides/Other
Fuels
Diesel Gasoline
LP Gas Supplies & Repairs
Supplies
Repairs Autos & Trucks
Autos
Trucks Machinery
Tractors
Self-Propelled Other Machinery
Building Materials
Services Custom Rates
Other Services
Rent Cash
Share
Interest Taxes
Wage Rates
Family Living-CPI
67.9
10.9
1.6
5.3 1.4
1.7
0.9 8.0
6.2
0.6 0.6
0.5
3.8 3.5
0.4
4.4 2.0
1.9
0.6 3.3
2.1
0.8 0.5
3.3
2.1 0.8
0.4 4.7
1.6
3.1 1.7
0.2
1.5 4.5
1.0
1.8 1.7
4.5
12.2 1.3
10.9
6.6 3.5
3.0
3.8 2.9
7.8
17.6
68.9
11.4
1.6
5.6 1.4
1.8
1.0 8.2
6.4
0.7 0.7
0.5
3.8 3.5
0.4
4.7 2.1
2.0
0.7 3.3
2.1
0.8 0.5
3.6
2.3 0.8
0.4 4.6
1.5
3.1 1.6
0.2
1.4 4.4
1.0
1.8 1.7
4.6
12.2 1.3
11.0
6.4 3.4
3.0
3.7 3.0
7.6
16.9
183
184
173
184 180
192
202 127
119
145 170
145
275 287
157
396 364
396
497 145
138
157 159
207
231 145
199 157
156
158 106
108
106 216
182
217 236
167
147 144
147
154 197
103
141 212
185
156
178
182
156
196 143
175
224 113
111
107 110
145
304 319
161
254 256
239
294 150
144
158 165
265
257 227
374 156
152
159 112
112
112 226
185
231 245
162
147 145
148
160 217
95
154 234
188
160
179
184
154
197 142
176
235 113
110
127 110
145
304 319
161
254 257
241
285 157
151
166 174
264
253 224
395 157
152
159 113
114
113 227
185
232 245
162
147 145
147
160 217
95
154 234
188
161 1 Revised historical price indexes for months not shown are available at www.nass.usda.gov. 2 Weights may not add due to rounding.
Agricultural Prices Agricultural Statistics Board December 2009 30 NASS, USDA
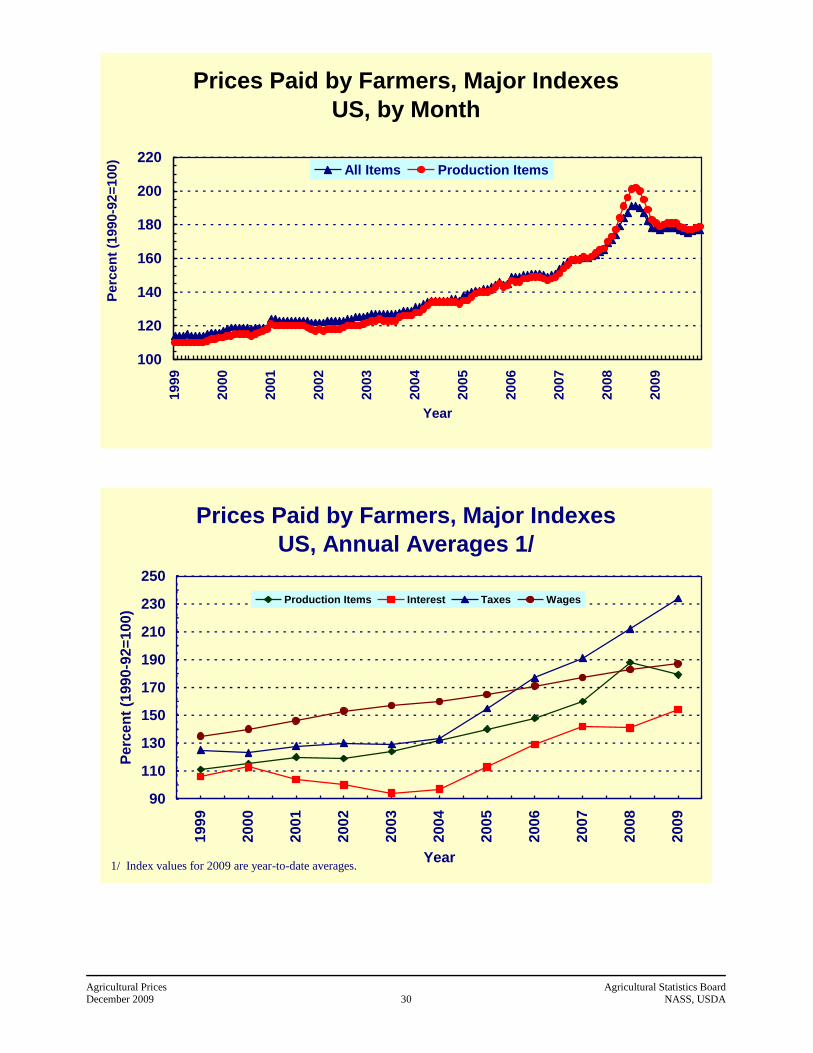
Prices Paid by Farmers, Major Indexes
US, by Month
100
120
140
160
180
200
2201999
2000
2001
2002
2003
2004
2005
2006
2007
2008
2009
Year
Perc
en
t (1
990-9
2=
100)
All Items Production Items
Prices Paid by Farmers, Major Indexes
US, Annual Averages 1/
90
110
130
150
170
190
210
230
250
1999
2000
2001
2002
2003
2004
2005
2006
2007
2008
2009
Year
Perc
en
t (1
990-9
2=
100)
Production Items Interest Taxes Wages
1/ Index values for 2009 are year-to-date averages.

Agricultural Prices Agricultural Statistics Board December 2009 31 NASS, USDA
Prices Paid by Farmers, Indexes, All Items
US, by Farm Type
105
115
125
135
145
155
165
175
185
195
205
215
1999
2000
2001
2002
2003
2004
2005
2006
2007
2008
2009
Year
Perc
en
t (1
990-9
2=
100)
All Crop Livestock
Prices Paid by Farmers, Indexes,
All Production Items
US, by Sector Origin
90100110120130140150160170180190200210220
1999
2000
2001
2002
2003
2004
2005
2006
2007
2008
2009
Year
Perc
en
t (1
990-9
2=
100)
All Nonfarm Farm

Agricultural Prices Agricultural Statistics Board December 2009 32 NASS, USDA
Prices Paid by Farmers, Indexes,
Selected Production Indexes
US, by Non-Farm Sector
40
80
120
160
200
240
280
320
360
400
440
480
520
1999
2000
2001
2002
2003
2004
2005
2006
2007
2008
2009
Year
Perc
en
t (1
990-9
2=
100)
Farm Supplies & Repairs FertilizerFarm Machinery Fuel
Prices Paid by Farmers,
Selected Production Indexes
US, by Farm Sector
70
90
110
130
150
170
190
210
230
1999
2000
2001
2002
2003
2004
2005
2006
2007
2008
2009
Year
Perc
en
t (1
990-9
2=
100) Feed Livestock

Agricultural Prices Agricultural Statistics Board December 2009 33 NASS, USDA
Feed Price Ratios: United States, December 2009 with Comparisons
Feed Price Ratio 1
2008 2009
Dec Nov Dec
Broiler-Feed: Pounds of Broiler Grower Feed equal
in value to 1 pound of broiler, live weight 2
Market Egg Feed: Pounds of Laying Feed equal in value to 1 dozen eggs
3
Hog-Corn: Bushels of Corn equal in value to
100 pounds of hog, live weight
Milk-Feed: Pounds of 16% Mixed Dairy Feed equal
in value to 1 pound of Whole Milk 4
Steer & Heifer-Corn: Bushels of Corn equal
in value to 100 pounds of Steer & Heifers,
live weight
Turkey-Feed: Pounds of Turkey Grower equal in
value to 1 pound of Turkey, live weight 5
4.5
9.2
10.2
1.92
20.9
4.4
3.9
*9.9
11.0
*2.23
*23.4
*5.7
3.8
10.2
12.2
2.38
23.3
5.6
* Revised. 1
Effective January 1995, prices of commercial prepared feeds are based on current U.S. prices received for corn, soybeans, alfalfa hay, and all wheat. 2
The price of commercial prepared broiler feed is based on current U.S. prices received for corn and soybeans. The modeled feed uses 58 percent corn and
42 percent soybeans. 3
The price of commercial prepared layer feed is based on current U.S. prices received for corn and soybeans. The modeled feed uses 75 percent corn and
25 percent soybeans. 4
The price of commercial prepared dairy feed is based on current U.S. prices received for corn, soybeans, and alfalfa. The modeled feed uses 51 percent
corn, 8 percent soybeans, and 41 percent alfalfa. 5
The price of commercial prepared turkey feed is based on current U.S. prices received for corn, soybeans, and wheat. The modeled feed used 51 percent
corn, 28 percent soybeans, and 21 percent wheat.
Prices Used to Calculate Feed Price Ratios:
United States, December 2009 with Comparisons
Commodity Unit
Entire Month Preliminary
Dec
2008
Nov
2009
Dec
2009
Dollars Dollars Dollars
Broilers, Live
Eggs, Market
Hogs, All
Milk, All
Steers and Heifers
Turkeys, Live
Corn
Hay, Alfalfa, Baled
Soybeans
Wheat, All
Lb
Doz
Cwt
Cwt
Cwt
Lb
Bu
Ton
Bu
Bu
0.480
41.90
15.50
85.70
0.445
4.11
152.00
9.24
5.95
0.410
0.879
40.20
15.30
85.40
0.541
3.65
110.00
9.53
4.79
0.410
0.918
43.70
16.30
83.50
0.539
3.59
110.00
9.96
4.81
Feeder Livestock: Prices Paid, United States
December 2009 with Comparisons
Commodity Unit 2008 2009
Dec Nov Dec
Dollars Dollars Dollars
Feeders and Stockers Cattle and Calves
Feeder Pigs
Cwt
Cwt
100.50
133.00
94.10
*98.00
93.10
117.00
* Revised.

Agricultural Prices Agricultural Statistics Board December 2009 34 NASS, USDA
Feed: April Prices Paid, United States, 2004-2009 1
Item Unit 2004 2005 2006 2007 2008 2009
Dollars Dollars Dollars Dollars Dollars Dollars
Alfalfa Meal
Alfalfa Pellets
Bran Beef Cattle Conc.,
32-36% Protein
Corn Meal Cottonseed Meal, 41%
Dairy Feed
14% Protein 2 16% Protein 2
18% Protein 2
20% Protein 2 32-38% Protein Conc.
Hog Feed
14-18% Protein 2 3 38-42% Protein Conc.
Molasses, Liquid Poultry Feed
Broiler Grower 2
Chick Starter 2 Laying Feed 2
Turkey Grower 2
Soybean Meal, 44%
Soybean Meal, over 44%
Stock Salt Trace Mineral Blocks
Cwt
Cwt
Cwt
Ton
Cwt Cwt
Ton Ton
Ton
Ton Ton
Ton Ton
Cwt
Ton
Ton Ton
Ton
Cwt
Cwt
50 Lb 50 Lb
14.90
15.20
14.80
342
9.84 18.40
200 218
229
233 381
256 415
14.20
278
299 249
315
19.60
19.30
4.53 5.53
15.40
15.20
15.00
316
9.57 17.20
220 197
206
206 331
219 398
14.80
237
268 226
315
16.10
14.90
4.78 5.52
16.40
16.40
16.10
336
10.10 18.20
189 210
221
226 341
228 361
17.90
255
273 240
302
16.90
15.30
4.67 5.68
18.20
18.70
17.40
370
12.30 20.00
239 249
267
258 378
305 398
19.20
306
327 278
337
18.20
16.90
5.02 6.15
21.10
21.30
19.10
433
13.70 23.00
301 313
324
320 469
345 490
17.50
387
416 371
434
23.40
22.40
5.45 6.60
23.90
24.10
23.20
488
13.40 25.60
285 293
297
295 458
328 493
22.20
464
501 391
466
23.20
22.00
5.93 7.09
Index (1990-92=100)
Feed
Prices Paid Index 4
Pct
121
117
124
149
194
186 1 April survey only, quarterly surveys discontinued January 1995. 2 Complete ration feed, fed without mixing or supplementation. 3 Excluding pig starter. 4 Annual average for all years.
Feeder Livestock: Annual Average Prices Paid, United States, 2004-2009
Item Unit 2004 2005 2006 2007 2008 2009
Dollars Dollars Dollars Dollars Dollars Dollars
Broiler Chicks
Egg-Type Chicks Feeders and Stockers
Cattle and Calves
Feeder Pigs Turkey Poults
100
100
Cwt
Cwt Each
20.60
53.90
109.20
115.00 1.10
20.60
53.50
115.00
143.00 1.13
22.90
66.50
111.10
129.00 1.20
25.60
69.40
107.40
120.00 1.32
26.30
75.60
88.50
93.00 1.44
( 1 )
( 1 )
95.10
100.40 ( 1 )
Index (1990-92=100)
Livestock and Poultry
Prices Paid Index 2
Pct
128
138
134
131
124
115 1 Annual average data are published in April 2010. 2 Annual average.
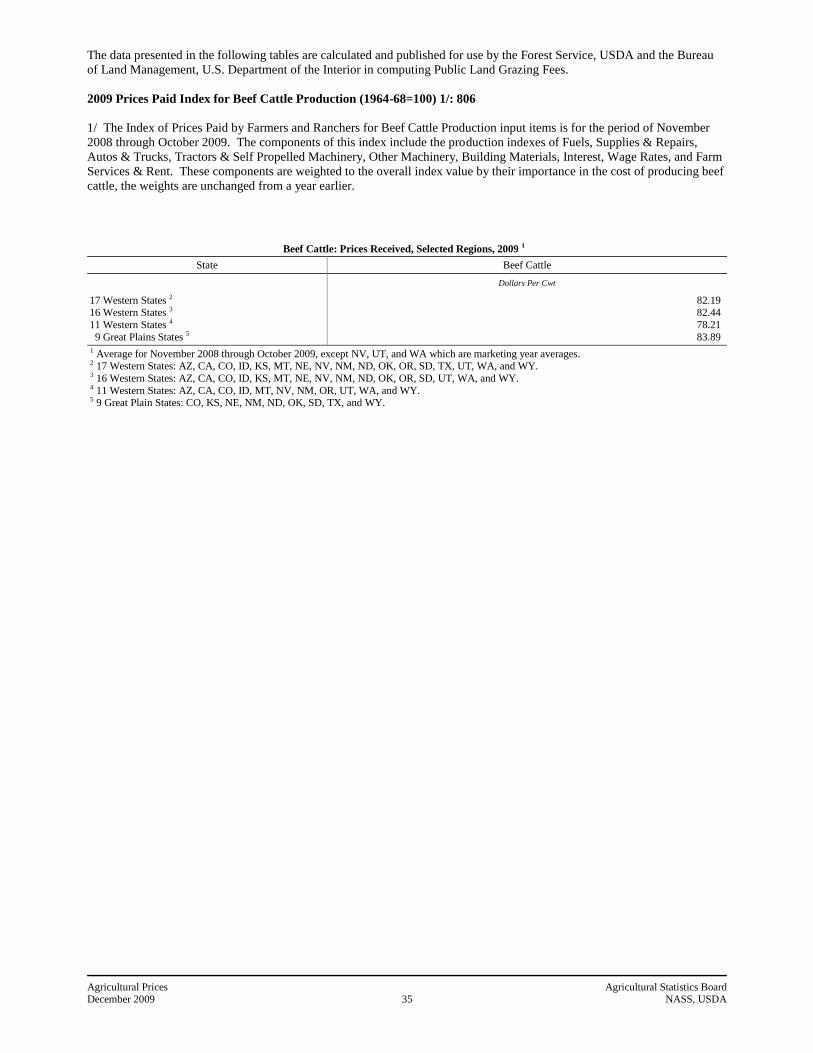
Agricultural Prices Agricultural Statistics Board December 2009 35 NASS, USDA
The data presented in the following tables are calculated and published for use by the Forest Service, USDA and the Bureau
of Land Management, U.S. Department of the Interior in computing Public Land Grazing Fees.
2009 Prices Paid Index for Beef Cattle Production (1964-68=100) 1/: 806
1/ The Index of Prices Paid by Farmers and Ranchers for Beef Cattle Production input items is for the period of November
2008 through October 2009. The components of this index include the production indexes of Fuels, Supplies & Repairs,
Autos & Trucks, Tractors & Self Propelled Machinery, Other Machinery, Building Materials, Interest, Wage Rates, and Farm
Services & Rent. These components are weighted to the overall index value by their importance in the cost of producing beef
cattle, the weights are unchanged from a year earlier.
Beef Cattle: Prices Received, Selected Regions, 2009 1
State Beef Cattle
Dollars Per Cwt
17 Western States 2 16 Western States 3
11 Western States 4
9 Great Plains States 5
82.19 82.44
78.21
83.89
1 Average for November 2008 through October 2009, except NV, UT, and WA which are marketing year averages. 2 17 Western States: AZ, CA, CO, ID, KS, MT, NE, NV, NM, ND, OK, OR, SD, TX, UT, WA, and WY. 3 16 Western States: AZ, CA, CO, ID, KS, MT, NE, NV, NM, ND, OK, OR, SD, UT, WA, and WY. 4 11 Western States: AZ, CA, CO, ID, MT, NV, NM, OR, UT, WA, and WY. 5 9 Great Plain States: CO, KS, NE, NM, ND, OK, SD, TX, and WY.

Agricultural Prices Agricultural Statistics Board December 2009 36 NASS, USDA
Reliability of Prices Paid Estimates
Definition: Prices paid by farmers represent the average costs of inputs purchased by farmers and ranchers to produce
agricultural commodities. Conceptually, the average price when multiplied by quantity purchased should equal total producer
expenditures for the item.
Survey Procedures: The prices paid data are obtained from establishments that sell goods and services to farmers and
ranchers. Annually, about 8,500 firms are randomly selected from lists by type of item sold with an average response rate in
the range of 75-80 percent. Firms are asked to report the price for the specified item "most commonly bought by farmers" or
that was the "volume seller". Approximately 135 items are surveyed each March to represent all production input items
purchased. The survey reference period for most items is the 5 business days centered around the 15th of the month.
Separate prices paid surveys are conducted for agricultural chemicals, fuels, feed, fertilizer, machinery, and seed.
Summary and Estimation Procedures: The annual March Prices Paid Survey is summarized as a nonprobability survey.
Average prices reported are aggregated to the region and U.S. level using weights available from expenditure data and other
administrative sources. Price recommendations are prepared by the State Field Offices and Headquarters for review by the
Agricultural Statistics Board in Washington, D.C. Also, the change in price level for individual items surveyed are combined
to the regional and U.S. levels, and are published as prices paid indexes referenced to a specific base period. Prices paid
indexes for new autos and trucks, building materials, farm supplies, motor supplies, and marketing containers are updated
based on price changes measured in selected Bureau of Labor Statistics (BLS) indexes.
Revisions: Any revisions are published in the monthly and in annual issues of Agricultural Prices. The basis for revision
must be supported by additional data that directly affect the level of the estimate. More revisions are likely for March when
separate prices paid surveys are conducted, in lieu of BLS indexes, by the USDA to measure price change.
Reliability: Current methods of summarization for the March data are not designed directly to calculate sampling errors.
However, analytical measures approximate the U.S. relative sampling errors for major items around 10 percent. Any
nonsampling errors are attributed to such things as the inability to obtain correct information, differences in interpreting
questions or definitions, mistakes in coding or processing the data, etc. Efforts are made at each step in the survey process to
minimize these nonsampling errors.
Program Change: Effective January 1, 1995, the National Agricultural Statistics Service updated the weights and changed
the construction of its prices paid and received by farmers indexes. A Federal Register Notice dated October 28, 1994
discussed these program modifications.
A 1990-92 reference and base period replaced the 1977 reference and 1971-73 base weight period. Five-year moving average
weights replaced the current fixed 1971-73 base period weights. The 1910-14=100 price indexes, required by statute for
computing parity prices, were linked forward based on the changes in the new 1990-92=100 indexes. The new indexes were
constructed by multiplying the ratios of the current prices to the base period prices by the moving average weights (adjusted
for seasonal marketing patterns for the prices received indexes).

Agricultural Prices Agricultural Statistics Board December 2009 37 NASS, USDA
Calendar of Prices Received Features in the 2009 Agricultural Price Reports
Annual or Marketing Year Average Prices: Month Published
Austrian Winter Peas, U.S. .............................................................................................................................. Sep
Barley, U.S . ..................................................................................................................................................... Jun
by State and U.S. ............................................................................................................................... Aug
Broilers, by State and U.S . .............................................................................................................................. Apr
Canola, by State and U.S . ............................................................................................................................... Nov
Cattle, by State and U.S. .................................................................................................................................. Feb
Chickens, Other by State and U.S. ................................................................................................................... Apr
Chickpeas, by State and U.S. ........................................................................................................................... Nov
Corn, U.S. ........................................................................................................................................................ Sep
by State and U.S. ............................................................................................................................... Nov
Cotton, by Type, State and U.S. ....................................................................................................................... Oct
Cottonseed, by State and U.S. .......................................................................................................................... Oct
Dry Beans, by State and U.S. ........................................................................................................................... Nov
Dry Edible Peas, U.S. ...................................................................................................................................... Sep
Eggs, by State and U.S. .................................................................................................................................... Apr
Flaxseed, by State and U.S. .............................................................................................................................. Nov
Goats, by State and U.S. .................................................................................................................................. Feb
Hay, by State and U.S. ..................................................................................................................................... Aug
Other Hay, 3-year Average by Region .............................................................................................. Feb
Hogs, by State and U.S. ................................................................................................................................... Feb
Hops, by State and U.S. ................................................................................................................................... Dec
Lentils, U.S. ..................................................................................................................................................... Sep
Milk, Sold to Plants, by Grade, Price and Fat Test, by State and U.S. ............................................................. Apr
Mohair, by State and U.S. ................................................................................................................................ Feb
Mustard Seed, U.S . ......................................................................................................................................... Nov
Oats, U.S. ......................................................................................................................................................... Jun
by State and U.S. ............................................................................................................................... Aug
Peanuts, by State and U.S. ............................................................................................................................... Aug
Potatoes, by State and U.S., Preliminary .......................................................................................................... Feb
Proso Millet, by State and U.S. ........................................................................................................................ Nov
Rapeseed, U.S. ................................................................................................................................................. Nov
Rice, U.S. (year-to-date) .................................................................................................................................. Aug
by State and U.S., by Length of Grain .............................................................................................. Jan
Safflower, U.S. ................................................................................................................................................. Nov
Sheep and Lambs, by State and U.S. ............................................................................................................... Feb
Sorghum, by State and U.S. ............................................................................................................................. Sep
Soybeans, by State and U.S. ............................................................................................................................ Sep
Sweetpotatoes, by State and U.S., Preliminary ................................................................................................ Jan
Final and Revised .............................................................................................................................. Jun
Sugarbeets, U.S. ............................................................................................................................................... Jul
Sugarcane, U.S. ................................................................................................................................................ Jul
Sunflower, by State and U.S. ........................................................................................................................... Nov
Turkeys, by State and U.S. ............................................................................................................................... Apr
Wheat, by Class, U.S. ...................................................................................................................................... Jun
by State and U.S. ............................................................................................................................... Aug
Wool, by State and U.S. ................................................................................................................................... Feb
--continued

Agricultural Prices Agricultural Statistics Board December 2009 38 NASS, USDA
Calendar of Prices Received Features in the 2009 Agricultural Price Reports (Continued)
Monthly Prices Received - Revised: Month Published
Austrian Winter Peas, U.S. ............................................................................................................................... Sep
Barley, by State and U.S. ................................................................................................................................. Aug
Broilers, U.S. .................................................................................................................................................... Apr
Cattle, by State and U.S. ................................................................................................................................... Feb
Chickens, by State and U.S. ............................................................................................................................. Apr
Chickpeas, by State and U.S. ........................................................................................................................... Nov
Corn, by State and U.S. .................................................................................................................................... Nov
Cotton, by Type, State and U.S. ....................................................................................................................... Oct
Cottonseed, by State and U.S. .......................................................................................................................... Oct
Dry Beans, by State and U.S. ........................................................................................................................... Nov
Dry Edible Peas, U.S. ....................................................................................................................................... Sep
Eggs, by State and U.S. .................................................................................................................................... Apr
Flaxseed, by State and U.S. .............................................................................................................................. Nov
Hay, by State and U.S. ..................................................................................................................................... Aug
Hogs, by State and U.S. .................................................................................................................................... Feb
Hops, by State and U.S. .................................................................................................................................... Dec
Lentils, U.S. ...................................................................................................................................................... Sep
Milk, Sold to Plants, by Grade, Price and Fat Test by State and U.S. .............................................................. Apr
Milk Cows, by Quarter, by State and U.S. ....................................................................................................... Feb
Oats, by State and U.S. ..................................................................................................................................... Aug
Peanuts, by State and U.S. ................................................................................................................................ Aug
Potatoes, by State and U.S., Preliminary .......................................................................................................... Feb
Rice, U.S. (year-to-date) ................................................................................................................................... Aug
by State and U.S., by Length of Grain ............................................................................................... Jan
Sheep and Lambs, by State and U.S. ................................................................................................................ Feb
Sorghum, by State and U.S. ............................................................................................................................. Sep
Soybeans, by State and U.S. ............................................................................................................................. Sep
Sunflower, by State and U.S. ........................................................................................................................... Nov
Wheat, by State and U.S. .................................................................................................................................. Aug
--continued
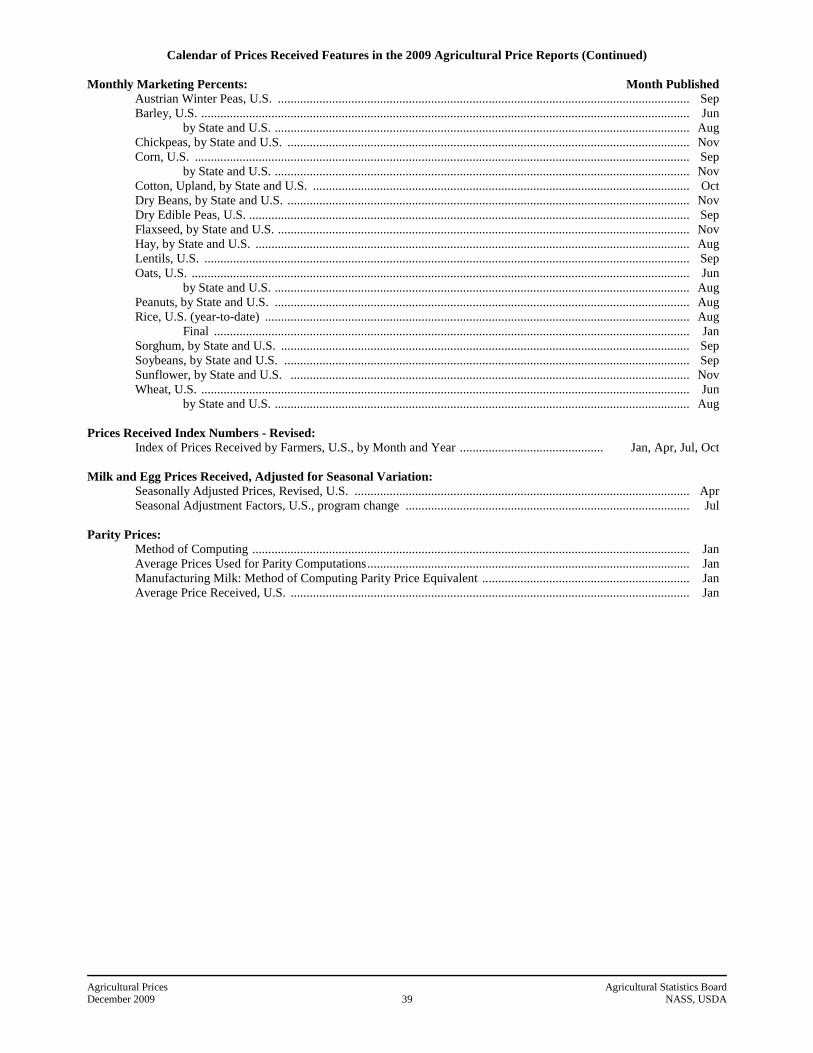
Agricultural Prices Agricultural Statistics Board December 2009 39 NASS, USDA
Calendar of Prices Received Features in the 2009 Agricultural Price Reports (Continued)
Monthly Marketing Percents: Month Published
Austrian Winter Peas, U.S. ................................................................................................................................. Sep
Barley, U.S. ......................................................................................................................................................... Jun
by State and U.S. .................................................................................................................................. Aug
Chickpeas, by State and U.S. .............................................................................................................................. Nov
Corn, U.S. ........................................................................................................................................................... Sep
by State and U.S. .................................................................................................................................. Nov
Cotton, Upland, by State and U.S. ...................................................................................................................... Oct
Dry Beans, by State and U.S. .............................................................................................................................. Nov
Dry Edible Peas, U.S. .......................................................................................................................................... Sep
Flaxseed, by State and U.S. ................................................................................................................................. Nov
Hay, by State and U.S. ........................................................................................................................................ Aug
Lentils, U.S. ........................................................................................................................................................ Sep
Oats, U.S. ............................................................................................................................................................ Jun
by State and U.S. .................................................................................................................................. Aug
Peanuts, by State and U.S. .................................................................................................................................. Aug
Rice, U.S. (year-to-date) ..................................................................................................................................... Aug
Final ..................................................................................................................................................... Jan
Sorghum, by State and U.S. ................................................................................................................................ Sep
Soybeans, by State and U.S. ............................................................................................................................... Sep
Sunflower, by State and U.S. ............................................................................................................................. Nov
Wheat, U.S. ......................................................................................................................................................... Jun
by State and U.S. .................................................................................................................................. Aug
Prices Received Index Numbers - Revised:
Index of Prices Received by Farmers, U.S., by Month and Year ............................................. Jan, Apr, Jul, Oct
Milk and Egg Prices Received, Adjusted for Seasonal Variation:
Seasonally Adjusted Prices, Revised, U.S. ......................................................................................................... Apr
Seasonal Adjustment Factors, U.S., program change ......................................................................................... Jul
Parity Prices:
Method of Computing ......................................................................................................................................... Jan
Average Prices Used for Parity Computations ..................................................................................................... Jan
Manufacturing Milk: Method of Computing Parity Price Equivalent ................................................................. Jan
Average Price Received, U.S. ............................................................................................................................. Jan
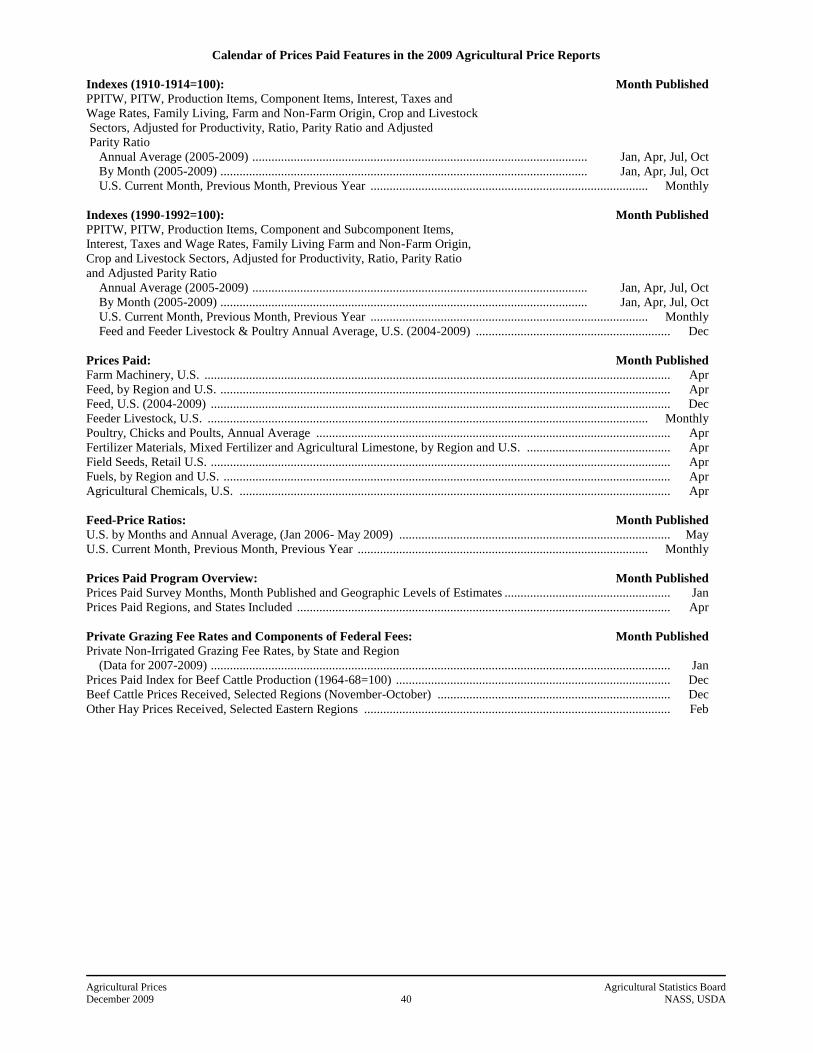
Agricultural Prices Agricultural Statistics Board December 2009 40 NASS, USDA
Calendar of Prices Paid Features in the 2009 Agricultural Price Reports
Indexes (1910-1914=100): Month Published
PPITW, PITW, Production Items, Component Items, Interest, Taxes and
Wage Rates, Family Living, Farm and Non-Farm Origin, Crop and Livestock
Sectors, Adjusted for Productivity, Ratio, Parity Ratio and Adjusted
Parity Ratio
Annual Average (2005-2009) ......................................................................................................... Jan, Apr, Jul, Oct
By Month (2005-2009) ................................................................................................................... Jan, Apr, Jul, Oct
U.S. Current Month, Previous Month, Previous Year ....................................................................................... Monthly
Indexes (1990-1992=100): Month Published
PPITW, PITW, Production Items, Component and Subcomponent Items,
Interest, Taxes and Wage Rates, Family Living Farm and Non-Farm Origin,
Crop and Livestock Sectors, Adjusted for Productivity, Ratio, Parity Ratio
and Adjusted Parity Ratio
Annual Average (2005-2009) ......................................................................................................... Jan, Apr, Jul, Oct
By Month (2005-2009) ................................................................................................................... Jan, Apr, Jul, Oct
U.S. Current Month, Previous Month, Previous Year ....................................................................................... Monthly
Feed and Feeder Livestock & Poultry Annual Average, U.S. (2004-2009) ............................................................. Dec
Prices Paid: Month Published
Farm Machinery, U.S. .................................................................................................................................................. Apr
Feed, by Region and U.S. ............................................................................................................................................. Apr
Feed, U.S. (2004-2009) ................................................................................................................................................ Dec
Feeder Livestock, U.S. .......................................................................................................................................... Monthly
Poultry, Chicks and Poults, Annual Average ............................................................................................................... Apr
Fertilizer Materials, Mixed Fertilizer and Agricultural Limestone, by Region and U.S. ............................................. Apr
Field Seeds, Retail U.S. ................................................................................................................................................ Apr
Fuels, by Region and U.S. ............................................................................................................................................ Apr
Agricultural Chemicals, U.S. ....................................................................................................................................... Apr
Feed-Price Ratios: Month Published
U.S. by Months and Annual Average, (Jan 2006- May 2009) ..................................................................................... May
U.S. Current Month, Previous Month, Previous Year ........................................................................................... Monthly
Prices Paid Program Overview: Month Published
Prices Paid Survey Months, Month Published and Geographic Levels of Estimates .................................................... Jan
Prices Paid Regions, and States Included ..................................................................................................................... Apr
Private Grazing Fee Rates and Components of Federal Fees: Month Published
Private Non-Irrigated Grazing Fee Rates, by State and Region
(Data for 2007-2009) ................................................................................................................................................ Jan
Prices Paid Index for Beef Cattle Production (1964-68=100) ...................................................................................... Dec
Beef Cattle Prices Received, Selected Regions (November-October) ......................................................................... Dec
Other Hay Prices Received, Selected Eastern Regions ................................................................................................ Feb
Agricultural Prices Agricultural Statistics Board December 2009 41 NASS, USDA
Information Contacts
General questions should be directed to Kevin Barnes, Chief, Environmental, Economics and Demographics Branch at
(202) 720-6146. Below are the commodity specialists to contact for additional information.
Crop Prices Received
Lance Honig, Chief, Crops Branch .............................................................................................. (202) 720-2127
Jacqueline Moore, Field Crops Section ........................................................................................ (202) 720-2127
Nick Schauer - Wheat, Rye ....................................................................................................... (202) 720-8068
Anthony Prillaman - Corn, Proso Millet, Flaxseed ................................................................... (202) 720-9526
Shiela Corley - Cotton, Cottonseed ........................................................................................... (202) 720-5944
Travis Thorson - Soybeans, Sunflower, Canola, Other Oilseeds............................................... (202) 720-7369
Bryan Durham - Hay, Oats, Sorghum ....................................................................................... (202) 690-3234
Suzanne Avilla - Peanuts, Rice ................................................................................................. (202) 720-7688
Julie Schmidt - Sugarcane, Sugarbeets, Barley ......................................................................... (202) 720-7621
Jorge Garcia-Pratts, Fruits, Vegetables & Special Crops Section ................................................ (202) 720-2127
Dan Norris - Dry Edible Beans, Peaches, Pears, Hops, Pulses, Mint ........................................ (202) 720-3250
Suzanne Avilla - Citrus, Grapes, Tropical Fruits....................................................................... (202) 720-5412
Fred Granja - Apples, Apricots, Cherries, Plums, Prunes, Tobacco .......................................... (202) 720-4288
Debbie Flippin - Vegetables, Onions, Strawberries .................................................................. (202) 720-2157
Dawn Keen - Tree Nuts ............................................................................................................. (202) 720-4215
Mike Jacobsen - Cranberries ..................................................................................................... (202) 720-9085
Tierra Mobley - Potatoes, Sweet Potatoes ................................................................................. (202) 720-4285
Livestock Prices Received
Dan Kerestes, Chief, Livestock Branch ....................................................................................... (202) 720-3570
Scott Hollis, Livestock Section .................................................................................................... (202) 720-3570
Everett Olbert - Sheep, Lambs, Goats, Wool, Mohair ............................................................... (202) 720-4751
Mike Miller - Milk, Milk Cows ................................................................................................. (202) 720-3278
Nicholas Streff - Hogs ............................................................................................................... (202) 720-3106
Jason Hardegree - Cattle ............................................................................................................ (202) 720-3040
Bruce Boess, Poultry and Specialty Commodities Section .......................................................... (202) 720-3570
Doug Bounds - Turkeys ............................................................................................................ (202) 690-3237
Troy Marshall - Broilers, Honey ............................................................................................... (202) 720-3244
Kim Linonis - Eggs ................................................................................................................ (202) 690-8632
Indexes, Prices Paid, and Parity Prices
Kevin Barnes, Chief, Environmental, Economics and
Demographics Branch ............................................................................................................... (202) 720-6146
Kevin Hintzman, Economics Section........................................................................................... (202) 720-6146
Jennifer Sissom - Prices Paid Indexes, Prices Paid for Feed, Fertilizer,
Agricultural Chemicals, Seeds, Farm Supplies and Repairs,
Farm Machinery, Fuels, Feeder Livestock, Poultry Chicks,
Feed Price Ratios, Autos & Trucks, Grazing Fees ................................................................. (202) 690-3229
Daryl Brinkman - Prices Received Indexes, Parity Prices ......................................................... (202) 720-8844
ACCESS TO REPORTS!!
For your convenience, there are several ways to obtain NASS reports, data products, and services:
INTERNET ACCESS
All NASS reports are available free of charge. For free access, connect to the Internet and go to the NASS Home Page at:
www.nass.usda.gov.
E-MAIL SUBSCRIPTION
All NASS reports are available by subscription free of charge direct to your e-mail address. Starting with the NASS Home
Page at www.nass.usda.gov, under the right navigation, Receive reports by Email, click on National or State. Follow the
instructions on the screen.
- - - - - - - - - - - - - - - - - - - - - - - - - - - - - - - - -
PRINTED REPORTS OR DATA PRODUCTS
CALL OUR TOLL-FREE ORDER DESK: 800-999-6779 (U.S. and Canada)
Other areas, please call 703-605-6220 FAX: 703-605-6880
(Visa, MasterCard, check, or money order acceptable for payment.)
- - - - - - - - - - - - - - - - - - - - - - - - - - - - - - - - - -
ASSISTANCE
For assistance with general agricultural statistics or further information about NASS or its products or services, contact the
Agricultural Statistics Hotline at 800-727-9540, 7:30 a.m. to 4:00 p.m. ET, or e-mail: [email protected].
The U.S. Department of Agriculture (USDA) prohibits discrimination in all its programs and activities on the basis of race,
color, national origin, age, disability, and where applicable, sex, marital status, familial status, parental status, religion, sexual
orientation, genetic information, political beliefs, reprisal, or because all or a part of an individual’s income is derived from
any public assistance program. (Not all prohibited bases apply to all programs.) Persons with disabilities who require
alternative means for communication of program information (Braille, large print, audiotape, etc.) should contact USDA’s
TARGET Center at (202) 720-2600 (voice and TDD).
To file a complaint of discrimination, write to USDA, Director, Office of Civil Rights, 1400 Independence Avenue, S.W.,
Washington, D.C. 20250-9410, or call (800) 795-3272 (voice) or (202) 720-6382 (TDD). USDA is an equal opportunity
provider and employer.