Embed Size (px)
Citation preview

Agricultural Prices
ISSN: 1937-4216
Released October 31, 2013, by the National Agricultural Statistics Service (NASS), Agricultural Statistics Board, United States Department
of Agriculture (USDA).
Special Note
USDA’s National Agricultural Statistics Service is updating the price index methodology beginning with the January
2014 Agricultural Prices release. Methodological changes include updating the current base reference (1990-1992) to
2011; increasing vegetable, fruit, and nut commodity coverage; reclassification of the prices received commodity groups;
and updating monthly commodity market weights.
USDA’s National Agricultural Statistics Service is suspending a number of statistical surveys and reports resulting from
reduced funding. Suspended commodity programs impacting the Agricultural Prices report are non-citrus fruit, tree nuts,
and vegetables. Check the NASS website at www.nass.usda.gov for any future updates to these programs
October Farm Prices Received Index Up 1 Point
The preliminary All Farm Products Index of Prices Received by Farmers in October, at 187 percent, based on
1990-1992=100, increased 1 point (0.5 percent) from September. The Crop Index is down 3 points (1.5 percent) but the
Livestock Index is unchanged. Producers received higher prices for wheat and lower prices for corn, soybeans, and
potatoes. In addition to prices, the overall index is also affected by the seasonal change based on a 3-year average mix of
commodities producers sell. Increased monthly movement of soybeans, corn, cottonseed, and cotton offset the decreased
marketing of wheat, milk, hogs, and hay.
The preliminary All Farm Products Index is down 23 points (11 percent) from October 2012. The Food Commodities
Index, at 189, increased 8 points (4.4 percent) from last month but decreased 7 points (3.6 percent) from October 2012.
Prices Paid Index up 1 Point
The October Index of Prices Paid for Commodities and Services, Interest, Taxes, and Farm Wage Rates (PPITW) is
218 percent of the 1990-1992 average. The index is up 1 point (0.5 percent) from September but unchanged from
October 2012. Higher prices in October for concentrates, feeder cattle, feeder pigs, and nitrogen offset lower prices for
feed grains, complete feeds, diesel, and gasoline.
Prices Received, Prices Paid, and Ratio of Prices Received to Prices Paid Indexes 1990-1992 Base – United States: October 2013 with Comparisons
Index October September October
2012 2013 2013
Prices received by farmers ......................................................................... Prices paid by farmers ................................................................................ Ratio of prices received to prices paid ........................................................
210
218
96
186
217
86
187
218
86

2 Agricultural Prices (October 2013) USDA, National Agricultural Statistics Service
Contents
Prices Received by Farmers .................................................................................................................................................... 4
Prices Received Indexes – United States: October 2013 with Comparisons .......................................................................... 5
Prices Received and Prices Paid Indexes by Month for Selected Groups – United States: 2012 and 2013,
1990-1992 Base ................................................................................................................................................................... 5
Received and Paid Indexes, Annual Average – United States: 1990-1992=100 Chart ........................................................... 6
Crop Farm Received and Paid Indexes, All Items by Quarter – United States: 1990-1992=100 Chart ................................. 7
Livestock Farm Received and Paid Indexes, All Items by Quarter – United States: 1990-1992=100 Chart .......................... 7
Received Indexes by Month, Livestock Products, All Products, and All Crops –
United States: 1990-1992=100 Chart................................................................................................................................... 8
Received Indexes by Month, Food Grains, Feed Grains & Hay, and Oilseeds –
United States: 1990-1992=100 Chart................................................................................................................................... 8
Received Indexes by Month, Fruit & Nut and Commercial Vegetables –
United States: 1990-1992=100 Chart................................................................................................................................... 9
Received Indexes by Month, Meat Animal, Dairy Product, and Poultry & Egg –
United States: 1990-1992=100 Chart................................................................................................................................... 9
Prices Received for Field Crops and Fruits – United States: October 2013 with Comparisons ........................................... 10
Prices Received for Vegetables and Livestock – United States: October 2013 with Comparisons ...................................... 11
Prices Received for Corn by Month – United States Chart ................................................................................................... 12
Prices Received for Wheat by Month – United States Chart ................................................................................................ 12
Prices Received for Upland Cotton by Month – United States Chart ................................................................................... 13
Prices Received for Soybeans by Month – United States Chart ........................................................................................... 13
Prices Received for Cattle by Month – United States Chart ................................................................................................. 14
Prices Received for Milk by Month – United States Chart ................................................................................................... 14
Prices Received for Hogs by Month – United States Chart .................................................................................................. 15
Prices Received for Poultry by Month – United States Chart ............................................................................................... 15
Prices Received for All Wheat, Corn, and Soybeans by Month – United States: 2013 with Comparisons .......................... 16
Prices Received for Beef Cattle and All Hogs by Month – United States: 2013 with Comparisons .................................... 16
Prices Received for All Wheat – States and United States: October 2013 with Comparisons ............................................. 17
Prices Received for Winter Wheat – States and United States: October 2013 with Comparisons ....................................... 17
Prices Received for Durum Wheat – States and United States: October 2013 with Comparisons ....................................... 18
Prices Received for Spring Wheat – States and United States: October 2013 with Comparisons ........................................ 18
Prices Received for All Barley – States and United States: October 2013 with Comparisons ............................................. 19
Prices Received for Malting Barley – States: October 2013 with Comparisons ................................................................... 19
Prices Received for Feed Barley – States: October 2013 with Comparisons ........................................................................ 19
Prices Received for Corn – States and United States: October 2013 with Comparisons ...................................................... 20
Prices Received for Soybeans – States and United States: October 2013 with Comparisons ............................................... 20
Prices Received for Oats – States and United States: October 2013 with Comparisons ....................................................... 21
Prices Received for Sorghum Grain – States and United States: October 2013 with Comparisons ..................................... 21
Prices Received for Dry Beans – States and United States: October 2013 with Comparisons ............................................. 22
Prices Received for Peanuts (in shell) – States and United States: October 2013 with Comparisons .................................. 22
Prices Received for Sunflower – States and United States: October 2013 with Comparisons ............................................. 23
Prices Received for Canola – States and United States: October 2013 with Comparisons ................................................... 23
Prices Received for Flaxseed – States and United States: October 2013 with Comparisons ................................................ 23
Prices Received for Upland Cotton and Cottonseed – States and United States: October 2013 with Comparisons ............. 24
Prices Received and Farm Marketings for Upland Cotton and Rice – United States: October 2013
with Comparisons .............................................................................................................................................................. 24
Prices Received for Hay by Type – States and United States: October 2013 with Comparisons ......................................... 25
Prices Received for Apples – States and United States: October 2013 with Comparisons ................................................... 25
Prices Received for Citrus Fruits by Utilization – States and United States: October 2012 ................................................. 26
Prices Received for Citrus Fruits by Utilization – States and United States: September 2013 ............................................. 27
Prices Received for Citrus Fruits by Utilization – States and United States: October 2013 ................................................. 28
Prices Received for Potatoes – States and United States: October 2013 with Comparisons ................................................ 29

Agricultural Prices (October 2013) 3 USDA, National Agricultural Statistics Service
Prices Received for All Milk – States and United States: October 2013 with Comparisons ................................................ 30
Prices Received for Milk Cows – States and United States: October 2013 with Comparisons ............................................ 31
Commodity Parity Prices and Price as Percent of Parity Price – United States: October 2013 with Comparisons .............. 32
Commodity Parity Prices – United States: October 2013 with Comparisons ....................................................................... 33
Marketing Year for Specified Commodities ......................................................................................................................... 35
Cotton and Cottonseed Market Year Average Prices Received – States and United States: Marketing Years
2011 and 2012 ................................................................................................................................................................... 35
Prices Received for Upland Cotton by Month – States and United States: Marketing Years 2011-2012
and 2012-2013 ................................................................................................................................................................... 36
Prices Received for Cottonseed by Month – States and United States: Marketing Year 2012-2013 ................................... 38
Percent of Upland Cotton Farm Marketings by Month – States and United States: Marketing Years 2011-2012
and 2012-2013 ................................................................................................................................................................... 39
Upland Cotton Monthly Marketings – Marketing Years 2011-2012 and 2012-2013 ........................................................... 40
Prices Received Indexes as a Percent of 1990-1992 Base, Monthly and Annual Average –
United States: 2009-2013 ................................................................................................................................................ 41
Prices Received Indexes as a Percent of 1910-1914 Base, Monthly and Annual Average – United States:
2009-2013 ....................................................................................................................................................................... 43
Reliability of Prices Received Estimates .............................................................................................................................. 45
Prices Paid by Farmers .......................................................................................................................................................... 46
Prices Paid Indexes and Related Parity Ratios – United States: October 2013 with Comparisons ...................................... 47
Prices Paid Indexes and Annual Weights for Input Components and Sub-components – United States:
October 2013 with Comparisons ....................................................................................................................................... 48
Paid Indexes by Month, All Items and Production Items –
United States: 1990-1992=100 Chart ................................................................................................................................ 49
Paid Indexes, Annual Averages, Production Items, Interest, Taxes, and Wages –
United States: 1990-1992=100 Chart ................................................................................................................................ 49
Paid Indexes by Farm Type, All Items – United States: 1990-1991=100 Chart ................................................................... 50
Paid Indexes by Origin, All Production Items – United States: 1990-1992=100 Chart ....................................................... 50
Paid Indexes by Non-Farm Sector, Supplies & Repairs, Fertilizer, Machinery, and Fuel –
United States: 1990-1992=100 Chart ................................................................................................................................ 51
Paid Indexes by Month, Feed and Replacement Livestock – United States: 1990-1992=100 Chart .................................... 51
Feed Price Ratios – United States: October 2013 with Comparisons ................................................................................... 52
Prices Received Used to Calculate Feed Price Ratios – United States: October 2013 with Comparisons ........................... 52
Prices Paid for Feeder Livestock – United States: October 2013 with Comparisons ........................................................... 52
Prices Paid Indexes as a Percent of 1990-1992 Base, Monthly and Annual Average – United States: 2009-2013 ........... 53
Prices Paid Indexes as a Percent of 1910-1914 Base, Monthly and Annual Average – United States:
2009-2013 ....................................................................................................................................................................... 56
Prices Paid Index Sub-Components as a Percent of 1990-1992 Base, Monthly and Annual Average –
United States: 2009-2013 ................................................................................................................................................ 59
Reliability of Prices Paid Estimates ...................................................................................................................................... 65
Information Contacts ............................................................................................................................................................ 66

4 Agricultural Prices (October 2013) USDA, National Agricultural Statistics Service
Prices Received by Farmers
The October All Farm Products Index is 187 percent of its 1990-1992 base, up 0.5 percent from the September index but
11 percent below the October 2012 index.
All crops: The October index, at 203, decreased 1.5 percent from September and is 15 percent below October 2012. Index
decreases for feed grains & hay, oilseeds, and potatoes & dry beans more than offset the index increases for commercial
vegetables, food grains, fruits & nuts, and upland cotton.
Food grains: The October index, at 237, is 3.9 percent above the previous month but 11 percent below a year ago. The
October price for all wheat, at $7.09 per bushel, is up 29 cents from September but $1.29 below October 2012.
Feed grains & hay: The October index, at 199, is down 15 percent from last month and 32 percent below a year ago. The
corn price, at $4.49 per bushel, is down 91 cents from last month and $2.29 below October 2012. The all hay price, at
$177 per ton, is up $1.00 from September but down $14.00 from last October. Sorghum grain, at $7.34 per cwt, is
76 cents below September and $5.06 below October last year.
Cotton, Upland: The October index, at 129, is up 4.9 percent from September and 12 percent above last year. The
October price, at 77.9 cents per pound, is up 3.3 cents from the previous month and 8.1 cents above last October.
Oilseeds: The October index, at 225, is down 3.0 percent from September and 8.5 percent lower than October 2012. The
soybean price, at $12.60 per bushel, decreased 70 cents from September and is $1.60 below October 2012.
Fruits & nuts: The October index, at 212, is up 2.4 percent from September but 5.4 percent lower than a year ago. Price
increases for lemons and oranges more than offset the lower price for grapefruit.
Commercial vegetables: The October index, at 206, is up 23 percent from last month and 36 percent above
October 2012.
Potatoes & dry beans: The October index, at 152, is down 7.9 percent from last month but 12 percent above
October 2012. The all potato price, at $8.01 per cwt, is down 77 cents from September but up 99 cents from last October.
The all dry bean price, at $39.00 per cwt, is down 10 cents from the previous month but $1.30 above October 2012.
Livestock and products: The October index, at 163, is unchanged from last month but up 0.6 percent from October 2012.
Compared with a year ago, prices are higher for broilers, hogs, and calves. Prices for milk, turkeys, cattle, and market
eggs are down from last year.
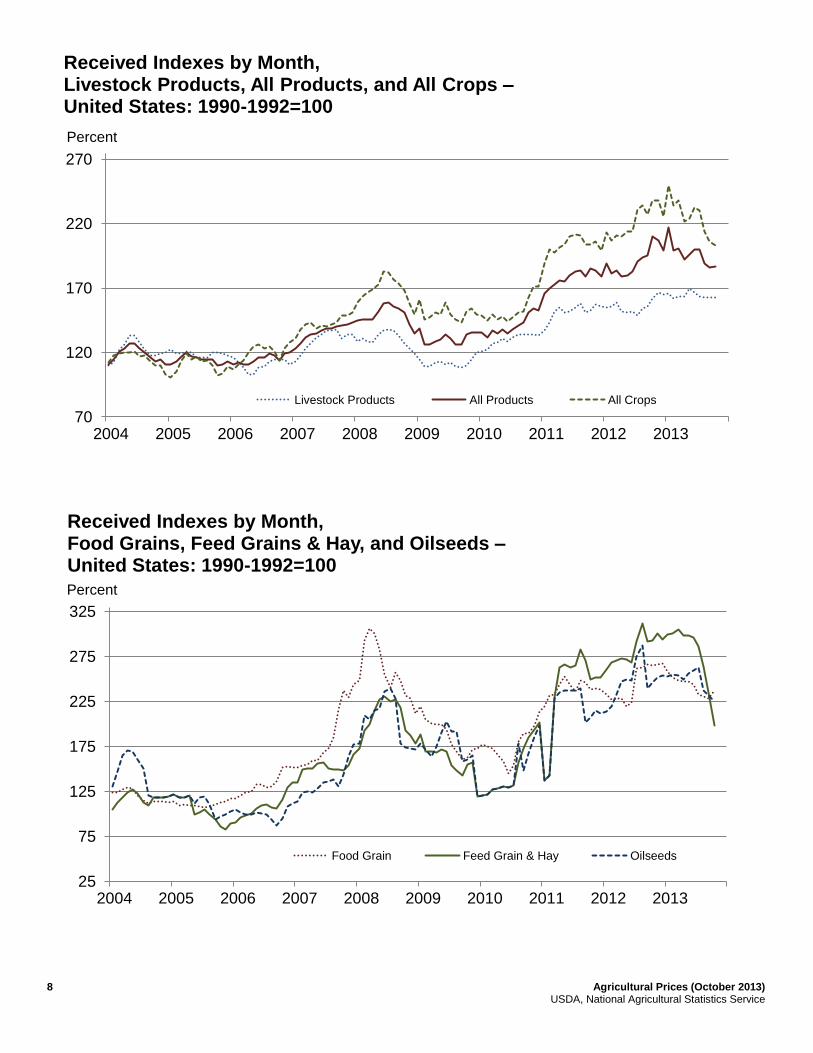
Meat animals: The October index, at 164, is down 0.6 percent from last month but 1.9 percent higher than last year. The
October hog price, at $69.70 per cwt, is down $1.00 from September but $7.70 higher than a year ago. The October beef
cattle price of $122 per cwt is down $1.00 from last month and October 2012.
Dairy products: The October index, at 155, is up 0.6 percent from a month ago but 6.1 percent lower than October last
year. The October all milk price of $20.30 per cwt is up 20 cents from last month but down $1.30 from October 2012.
Poultry & eggs: The October index, at 168, is down 1.2 percent from September but 3.7 percent above a year ago. The
October market egg price, at 83.6 cents per dozen, increased 1.3 cents from September but is 0.1 cents below
October 2012. The October broiler price, at 53.0 cents per pound, is down 1.0 cent from September but 4.0 cents above a
year ago. The October turkey price, at 70.1 cents per pound, is up 2.2 cents from the previous month but down 6.8 cents
from a year earlier.

Agricultural Prices (October 2013) 5 USDA, National Agricultural Statistics Service
Prices Received Indexes – United States: October 2013 with Comparisons [Revised historical price indexes for months not shown are available at www.nass.usda.gov]
Index
1910-1914 Base 1990-1992 Base
1990-1992 Average
October 2012
September 2013
October 2013
October 2012
September 2013
October 2013
(percent) (percent) (percent) (percent) (percent) (percent) (percent)
All products ............................................ All crops ................................................. Food grains ........................................ Feed grains & hay .............................. Cotton, Upland ................................... Tobacco ............................................. Oilseeds ............................................ Fruits & nuts ...................................... Commercial vegetables ..................... Potatoes & dry beans ......................... Other crops ........................................ Livestock and products .......................... Meat animals ..................................... Dairy products ................................... Poultry & eggs ................................... Food commodities .................................
639
500 325 363 517
1263 554 716 698 540 493
768
1021 799 282
(NA)
1332
1182 839
1045 591
1559 1350 1563 1077 687 643
1242 1637 1329 455
(NA)
1180
1021 723 837 631
1760 1273 1447 1201 835 645
1253 1679 1237 477
(NA)
1189
1004 751 710 659
1760 1233 1479 1471 771 645
1252 1671 1249 473
(NA)
210
238 265 293 115 103 246 224 151 136 131
162 161 165 162
196
186
206 228 235 123 116 232 207 168 165 131
163 165 154 170
181
187
203 237 199 129 116 225 212 206 152 131
163 164 155 168
189
(NA) Not available.
Prices Received and Prices Paid Indexes by Month for Selected Groups – United States: 2012 and 2013, 1990-1992 Base [Revised historical price indexes for months not shown are available at www.nass.usda.gov. Blank data cells indicate estimation period has not yet begun]
Month
Index of prices received Index of prices paid
All farm products
All crops
Livestock and
products
All items
Production items
2012 2013 2012 2013 2012 2013 2012 2013 2012 2013
(percent) (percent) (percent) (percent) (percent) (percent) (percent) (percent) (percent) (percent)
January ............................ February ........................... March ............................... April .................................. May .................................. June ................................. July ................................... August .............................. September ........................ October ............................ November ......................... December .........................
189 181 184 179 180 183 191 194 195 210 207 199
217 199 201 192 196 200 200 189 186 187
213 207 211 210 214 214 231 234 227 238 238 226
250 234 238 222 224 233 230 214 206 203
155 156 159 152 151 152 149 154 156 162 167 165
166 162 164 164 170 167 164 163 163 163
210 211 215 215 214 214 213 216 217 218 217 217
219 220 220 219 219 219 220 216 217 218
222 223 229 228 228 227 227 231 232 232 231 231
233 234 234 233 233 233 234 229 230 230

6 Agricultural Prices (October 2013) USDA, National Agricultural Statistics Service
70
90
110
130
150
170
190
210
230
2004 2005 2006 2007 2008 2009 2010 2011 2012 2013
Percent
Received and Paid Indexes, Annual Average – United States: 1990-1992=100
Paid Received

Agricultural Prices (October 2013) 7 USDA, National Agricultural Statistics Service
80
100
120
140
160
180
200
220
240
260
2004 2005 2006 2007 2008 2009 2010 2011 2012 2013
Percent
Crop Farm Received and Paid Indexes, All Items by Quarter – United States: 1990-1992=100
Paid Received
80
100
120
140
160
180
200
220
2004 2005 2006 2007 2008 2009 2010 2011 2012 2013
Percent
Livestock Farm Received and Paid Indexes, All Items by Quarter – United States: 1990-1992=100
Paid Received
8 Agricultural Prices (October 2013) USDA, National Agricultural Statistics Service
70
120
170
220
270
2004 2005 2006 2007 2008 2009 2010 2011 2012 2013
Percent
Received Indexes by Month, Livestock Products, All Products, and All Crops – United States: 1990-1992=100
Livestock Products All Products All Crops
25
75
125
175
225
275
325
2004 2005 2006 2007 2008 2009 2010 2011 2012 2013
Percent
Received Indexes by Month, Food Grains, Feed Grains & Hay, and Oilseeds – United States: 1990-1992=100
Food Grain Feed Grain & Hay Oilseeds

Agricultural Prices (October 2013) 9 USDA, National Agricultural Statistics Service
50
100
150
200
250
300
2004 2005 2006 2007 2008 2009 2010 2011 2012 2013
Percent
Received Indexes by Month, Fruit & Nuts and Commercial Vegetables – United States: 1990-1992=100
Fruit & Nuts Commercial Vegetables
50
70
90
110
130
150
170
190
210
2004 2005 2006 2007 2008 2009 2010 2011 2012 2013
Percent
Received Indexes by Month, Meat Animal, Dairy Product, and Poultry & Egg – United States: 1990-1992=100
Meat Animal Dairy Product Poultry & Egg

10 Agricultural Prices (October 2013) USDA, National Agricultural Statistics Service
Prices Received for Field Crops and Fruits – United States: October 2013 with Comparisons
Commodity Average
1990-1992 October 2012 September 2013
Preliminary October 2013
Field crops Austrian winter peas ............................................ dollars/cwt Barley, all ....................................................... dollars/bushel Feed ............................................................ dollars/bushel Malting ......................................................... dollars/bushel Beans, dry edible ................................................ dollars/cwt Canola ................................................................ dollars/cwt Chickpeas, all ..................................................... dollars/cwt Large ................................................................ dollars/cwt Small ................................................................. dollars/cwt Corn ............................................................... dollars/bushel Cotton, Upland ................................................ dollars/pound Cottonseed .......................................................... dollars/ton Flaxseed ........................................................ dollars/bushel Hay, all, baled ...................................................... dollars/ton Alfalfa ................................................................. dollars/ton Other .................................................................. dollars/ton Lentils ................................................................. dollars/cwt Oats ............................................................... dollars/bushel Peanuts, in-shell ............................................. dollars/pound Peas, dry edible .................................................. dollars/cwt Potatoes ............................................................. dollars/cwt Rice, all ............................................................... dollars/cwt Long .................................................................. dollars/cwt Medium and short ............................................. dollars/cwt Sorghum grain .................................................... dollars/cwt Soybeans ....................................................... dollars/bushel Sunflowers, all ..................................................... dollars/cwt Wheat, all ....................................................... dollars/bushel Winter .......................................................... dollars/bushel Durum .......................................................... dollars/bushel Other spring ................................................. dollars/bushel Hard red winter
1 .......................................... dollars/bushel
Soft red winter 1 ............................................ dollars/bushel
Hard red spring 1 .......................................... dollars/bushel
White 1 ......................................................... dollars/bushel
Fruits Citrus, equivalent on-tree Grapefruit .......................................................... dollars/box Lemons ............................................................. dollars/box Oranges ............................................................ dollars/box Tangelos ........................................................... dollars/box Tangerines and mandarins ................................ dollars/box Noncitrus, fresh Apples
2 ........................................................ dollars/pound
Grapes 2 ............................................................. dollars/ton
Peaches 2 ........................................................... dollars/ton
Pears 2 ............................................................... dollars/ton
Strawberries ...................................................... dollars/cwt
(NA) 2.12 1.90 2.43
19.10 (NA) (NA) (NA) (NA) 2.30
0.606 96.00 4.27
76.30 77.20 60.00 (NA) 1.22
0.304 (NA)
5.82 7.07 (NA) (NA) 3.75 5.61 9.50
2.96 2.93 2.86 3.11 (NA) (NA) (NA) 3.24
5.77 10.10 5.79 5.82
15.11
0.212 506.00 432.00 370.00 56.00
20.90 6.49 5.72 6.65
37.70 26.60 33.50 37.90 26.60 6.78
0.698
254.00 13.50
191.00 212.00 144.00 22.30 3.93
0.337 15.30
7.02
14.40 13.90 16.80 12.40 14.20 25.90
8.38 8.33 7.61 8.56 8.43 8.35 8.60 8.10
12.49 16.38 9.57
(S) 12.70
0.535 1,540.00
(S) 692.00 90.10
(D) 5.81 4.28 6.44
39.10 20.70 33.50 34.00 24.00 5.40
0.746
190.00 13.10
176.00 194.00 136.00 23.30 3.57
0.255 14.40
8.78
15.60 15.30 18.10 8.10
13.30 22.60
6.80 6.79 7.90 6.71 6.92 6.19 6.72 6.71
8.76 29.99 12.39
(S) (S)
(NA) (NA) (NA) (NA) (NA)
(D) 5.48 3.70 6.24
39.00 19.80
(D) (D) (D)
4.49
0.779 281.00 13.20
177.00 193.00 141.00 21.10 3.51
0.254 12.70
8.01
16.20 15.60 18.80 7.34
12.60 19.30
7.09 7.09 7.33 7.06 (NA) (NA) (NA) (NA)
(D) 33.71 12.94
(S) (D)
(NA) (NA) (NA) (NA) (NA)
(D) Withheld to avoid disclosing data for individual operations. (NA) Not available. (S) Insufficient number of reports to establish an estimate. 1
Preliminary estimates not set for this item. 2
Equivalent packinghouse-door returns for California, Michigan, New York (apples only), and Washington (apples, peaches, and pears). Prices as sold for other states.

Agricultural Prices (October 2013) 11 USDA, National Agricultural Statistics Service
Prices Received for Vegetables and Livestock – United States: October 2013 with Comparisons [Price data source for livestock and poultry commodities is United States Department of Agriculture's Agricultural Marketing Service]
Commodity Average
1990-1992 October 2012 September 2013
Preliminary October 2013
Vegetables, fresh
1
Asparagus ........................................................... dollars/cwt Beans, snap
2 ...................................................... dollars/cwt
Broccoli ................................................................ dollars/cwt Cantaloupes
2 ...................................................... dollars/cwt
Carrots ................................................................. dollars/cwt Cauliflower ........................................................... dollars/cwt Celery .................................................................. dollars/cwt Corn, sweet ......................................................... dollars/cwt Cucumbers
2 ........................................................ dollars/cwt
Lettuce ................................................................. dollars/cwt Onions
3 ............................................................... dollars/cwt
Tomatoes ............................................................ dollars/cwt Livestock Calves ................................................................. dollars/cwt Cattle, all beef ...................................................... dollars/cwt Cows
4 ............................................................... dollars/cwt
Steers and heifers .............................................. dollars/cwt Milk cows
5 ........................................................ dollars/head
Hogs, all .............................................................. dollars/cwt Barrows and gilts ............................................... dollars/cwt Sows ................................................................. dollars/cwt Dairy and poultry Milk, all
6 .............................................................. dollars/cwt
Fat test .................................................................. percent Broilers, live
7 .................................................. dollars/pound
Eggs, all 8 ....................................................... dollars/dozen
Market 8 9 ...................................................... dollars/dozen
Turkeys, live 8 10
.............................................. dollars/pound
79.80 (NA)
22.50 (NA)
13.20 26.80 11.60 15.70 (NA)
11.90 12.80 32.30
94.30 72.90 49.60 77.10
1130.00 47.70 48.40 39.50
13.06 3.66
0.317 0.643 0.546 0.380
(S) 46.90 30.30 25.20 26.00 27.40 19.10 25.60 16.80 17.70 10.10 20.90
164.00 123.00 77.30
127.00 1390.00
62.00 62.70 43.30
21.60 3.80
0.490 1.020 0.837 0.769
(NA) (NA) (NA) (NA) (NA) (NA) (NA) (NA) (NA) (NA) (NA) (NA)
182.00 123.00 82.50
127.00 (NA)
70.70 70.60 74.40
20.10 3.68
0.540 1.040 0.823 0.679
(NA) (NA) (NA) (NA) (NA) (NA) (NA) (NA) (NA) (NA) (NA) (NA)
176.00 122.00 79.70
128.00 1400.00
69.70 69.40 77.40
20.30 3.77
0.530 1.040 0.836 0.701
Adjusted for seasonal variation Eggs, all .......................................................... dollars/dozen Seasonal factor ...................................................... percent Milk, all
6 .............................................................. dollars/cwt
Seasonal factor ...................................................... percent
0.545
100 9.71 100
1.010
101 19.90
109
1.070
97 19.20
105
1.030
101 18.70
109
(NA) Not available. (S) Insufficient number of reports to establish an estimate. 1
Beginning January 2006, point of first sale. FOB shipping point for prior years. 2
Monthly estimates began January 1995. 3
Includes some processing. 4
Beef cows and cull dairy cows sold for slaughter. 5
Animals sold for dairy herd replacement only. Prices available for January, April, July, and October. 6
Before deductions for hauling. Includes quality, quantity, and other premiums. Excludes hauling subsidies. 7
Live weight equivalent price. 8
Mid-month price. 9
Also referred to as table eggs. 10
Live weight equivalent price is used when actual live weight price is not available. Beginning January 2011, price reflects FOB shipping point basis. Prior year price reflects delivered basis.

12 Agricultural Prices (October 2013) USDA, National Agricultural Statistics Service
1
2
3
4
5
6
7
8
2004 2005 2006 2007 2008 2009 2010 2011 2012 2013
Dollars per bushel
Prices Received for Corn by Month – United States
2
4
6
8
10
12
2004 2005 2006 2007 2008 2009 2010 2011 2012 2013
Dollars per bushel
Prices Received for Wheat by Month – United States

Agricultural Prices (October 2013) 13 USDA, National Agricultural Statistics Service
0.3
0.4
0.5
0.6
0.7
0.8
0.9
1.0
2004 2005 2006 2007 2008 2009 2010 2011 2012 2013
Dollars per pound
Prices Received for Upland Cotton by Month – United States
3
5
7
9
11
13
15
17
2004 2005 2006 2007 2008 2009 2010 2011 2012 2013
Dollars per bushel
Prices Received for Soybeans by Month – United States

14 Agricultural Prices (October 2013) USDA, National Agricultural Statistics Service
0
20
40
60
80
100
120
140
160
180
200
2004 2005 2006 2007 2008 2009 2010 2011 2012 2013
Dollars per cwt
Prices Received for Cattle by Month – United States
Calves Steers & Heifers All Beef Cattle Cows
10
12
14
16
18
20
22
24
2004 2005 2006 2007 2008 2009 2010 2011 2012 2013
Dollars per cwt
Prices Received for Milk by Month – United States
Agricultural Prices (October 2013) 15 USDA, National Agricultural Statistics Service
30
40
50
60
70
80
2004 2005 2006 2007 2008 2009 2010 2011 2012 2013
Dollars per cwt
Prices Received for Hogs by Month – United States
0.2
0.3
0.4
0.5
0.6
0.7
0.8
0.9
2004 2005 2006 2007 2008 2009 2010 2011 2012 2013
Dollars per pound
Prices Received for Poultry by Month – United States
Turkeys Broilers

16 Agricultural Prices (October 2013) USDA, National Agricultural Statistics Service
Prices Received for All Wheat, Corn, and Soybeans by Month – United States: 2013 with Comparisons [Current month prices are mid-month; prices for previous months and years are for the entire month. Blank data cells indicate estimation period has not yet begun]
Month
All wheat Corn Soybeans
2011 2012 Preliminary
2013 2011 2012
Preliminary 2013
2011 2012 Preliminary
2013
(dollars per
bushel) (dollars per
bushel) (dollars per
bushel) (dollars per
bushel) (dollars per
bushel) (dollars per
bushel) (dollars per
bushel) (dollars per
bushel) (dollars per
bushel)
January ........ February ...... March ........... April ............. May .............. June ............. July .............. August ......... September ... October ........ November .... December ....
6.69 7.42 7.55 8.01 8.16 7.41 7.10 7.59 7.54 7.27 7.30 7.20
7.05 7.10 7.20 7.11 6.67 6.70 7.89 8.04 8.27 8.38 8.47 8.30
8.12 7.97 7.79 7.71 7.68 7.32 6.93 6.87 6.80 7.09
4.94 5.65 5.53 6.36 6.32 6.38 6.33 6.88 6.38 5.73 5.83 5.86
6.07 6.28 6.35 6.34 6.34 6.37 7.14 7.63 6.89 6.78 7.01 6.87
6.96 7.04 7.13 6.97 6.97 6.97 6.79 6.21 5.40 4.49
11.60 12.70 12.70 13.10 13.20 13.20 13.20 13.40 12.20 11.80 11.70 11.50
11.90 12.20 13.00 13.80 14.00 13.90 15.40 16.20 14.30 14.20 14.30 14.30
14.30 14.60 14.60 14.40 14.90 15.10 15.30 14.10 13.30 12.60
Prices Received for Beef Cattle and All Hogs by Month – United States: 2013 with Comparisons [Current month prices are mid-month; prices for previous months and years are for the entire month. Blank data cells indicate estimation period has not yet begun]
Month
Beef cattle 1 All hogs
2
2011 2012 Preliminary
2013 2011 2012
Preliminary 2013
(dollars per cwt) (dollars per cwt) (dollars per cwt) (dollars per cwt) (dollars per cwt) (dollars per cwt)
January ............. February ........... March ................ April .................. May ................... June .................. July ................... August .............. September ........ October ............. November ......... December .........
107.00 108.00 115.00 119.00 112.00 107.00 111.00 111.00 112.00 117.00 120.00 120.00
125.00 127.00 128.00 124.00 122.00 121.00 114.00 117.00 121.00 123.00 123.00 124.00
126.00 123.00 124.00 124.00 124.00 121.00 120.00 122.00 123.00 122.00
56.00 61.40 62.90 67.80 68.60 69.70 71.70 75.80 67.10 68.70 64.40 63.50
63.50 65.50 65.20 62.80 62.80 70.20 72.10 66.90 55.70 62.00 61.10 62.40
63.80 64.50 59.20 61.80 68.60 74.40 75.80 74.20 70.70 69.70
1 Cows and steers & heifers.
2 Barrows & gilts and sows.

Agricultural Prices (October 2013) 17 USDA, National Agricultural Statistics Service
Prices Received for All Wheat – States and United States: October 2013 with Comparisons
State October 2012 September 2013 Preliminary
October 2013
(dollars per bushel) (dollars per bushel) (dollars per bushel)
Arizona ............................................ Arkansas ......................................... California ......................................... Colorado .......................................... Idaho ............................................... Illinois .............................................. Indiana ............................................ Kansas ............................................ Michigan .......................................... Minnesota ........................................ Missouri ........................................... Montana .......................................... Nebraska ......................................... North Carolina ................................. North Dakota ................................... Ohio ................................................. Oklahoma ........................................ Oregon ............................................ South Dakota ................................... Texas .............................................. Washington ..................................... United States ...................................
(D) (D) (D)
8.24 8.27 7.81 8.97 8.55 8.29 8.63
8.02 8.45 8.74 8.99 8.25 8.17 8.34 7.99 8.41 8.62 8.35
8.38
(D) (D) (D)
6.76 7.03 6.36 6.25 6.98 6.53 6.66
6.29 6.92 6.67 5.46 6.78 6.19 6.89 6.79 6.60 7.14 6.76
6.80
(D) (S) (D)
7.12 6.99 6.40 6.25 7.33 6.65 7.00
6.50 7.32 7.20 5.25 6.91 6.60 7.39 7.25 6.97 (D)
7.05
7.09
(D) Withheld to avoid disclosing data for individual operations. (S) Insufficient number of reports to establish an estimate.
Prices Received for Winter Wheat – States and United States: October 2013 with Comparisons
State October 2012 September 2013 Preliminary
October 2013
(dollars per bushel) (dollars per bushel) (dollars per bushel)
Arkansas ......................................... California ......................................... Colorado .......................................... Idaho ............................................... Illinois .............................................. Indiana ............................................ Kansas ............................................ Michigan .......................................... Minnesota ........................................ Missouri ........................................... Montana .......................................... Nebraska ......................................... North Carolina ................................. North Dakota ................................... Ohio ................................................. Oklahoma ........................................ Oregon ............................................ South Dakota ................................... Texas .............................................. Washington ..................................... United States ...................................
(D) (D)
8.24 8.23 7.81 8.97 8.55 8.29
(S) 8.02
8.23 8.74 8.99 7.82 8.17 8.34 7.99 8.28 8.62 8.24
8.33
(D) (D)
6.84 6.95 6.36 6.25 6.98 6.53 6.61 6.29
7.07 6.67 5.46 6.52 6.19 6.89 6.72 6.43 7.14 6.71
6.79
(S) (D)
7.31 6.75 6.40 6.25 7.33 6.65
(S) 6.50
7.39 7.20 5.25 6.60 6.60 7.39 7.21 6.85 (D)
6.94
7.09
(D) Withheld to avoid disclosing data for individual operations. (S) Insufficient number of reports to establish an estimate.

18 Agricultural Prices (October 2013) USDA, National Agricultural Statistics Service
Prices Received for Durum Wheat – States and United States: October 2013 with Comparisons
State October 2012 September 2013 Preliminary
October 2013
(dollars per bushel) (dollars per bushel) (dollars per bushel)
Arizona ........................................... California ........................................ Idaho ............................................... Montana .......................................... North Dakota ................................... United States ..................................
(D) (S) (D)
8.13 7.41
7.61
(D) (S) (D) (D)
7.92
7.90
(D) (S) (S)
7.75 7.25
7.33
(D) Withheld to avoid disclosing data for individual operations. (S) Insufficient number of reports to establish an estimate.
Prices Received for Spring Wheat – States and United States: October 2013 with Comparisons
State October 2012 September 2013 Preliminary
October 2013
(dollars per bushel) (dollars per bushel) (dollars per bushel)
Colorado ......................................... Idaho ............................................... Minnesota ....................................... Montana .......................................... North Dakota ................................... Oregon ............................................ South Dakota .................................. Washington ..................................... United States ..................................
(D) 8.39 8.63 8.68 8.50 8.02 8.51 8.79
8.56
(D) 7.20 6.66 6.77 6.63 7.28 6.66 7.03
6.71
(D) 7.25 7.00 7.22 6.85 7.52 7.01 7.32
7.06
(D) Withheld to avoid disclosing data for individual operations.

Agricultural Prices (October 2013) 19 USDA, National Agricultural Statistics Service
Prices Received for All Barley – States and United States: October 2013 with Comparisons
State October 2012 September 2013 Preliminary
October 2013
(dollars per bushel) (dollars per bushel) (dollars per bushel)
California ......................................... Colorado .......................................... Idaho ............................................... Minnesota ........................................ Montana .......................................... North Dakota ................................... Oregon ............................................ Utah ................................................. Washington ..................................... Wyoming ......................................... United States ...................................
(D) 6.74 6.56 (D)
6.48 6.58 6.36 5.80 5.40 (D)
6.49
(D) 6.26 6.18 6.18 6.25 6.33 4.22 (D)
4.42 (D)
5.81
(S) (D)
6.27 (S)
5.67 5.83
(S) (D)
3.46 (D)
5.48
(D) Withheld to avoid disclosing data for individual operations. (S) Insufficient number of reports to establish an estimate.
Prices Received for Malting Barley – States: October 2013 with Comparisons
State October 2012 September 2013 Preliminary
October 2013
(dollars per bushel) (dollars per bushel) (dollars per bushel)
Idaho ............................................... Minnesota ........................................ Montana .......................................... North Dakota ................................... Wyoming .........................................
6.64 (D)
6.61 6.64 (D)
6.48 6.19 6.50 6.49 (D)
(D) (S)
5.81 6.30 (D)
(D) Withheld to avoid disclosing data for individual operations. (S) Insufficient number of reports to establish an estimate.
Prices Received for Feed Barley – States: October 2013 with Comparisons
State October 2012 September 2013 Preliminary
October 2013
(dollars per bushel) (dollars per bushel) (dollars per bushel)
Idaho ............................................... Minnesota ........................................ Montana .......................................... North Dakota ................................... Wyoming .........................................
5.97 5.67 5.54 6.13 (D)
4.06 (D)
3.80 3.61 (D)
3.57 (S)
3.75 3.15 (D)
(D) Withheld to avoid disclosing data for individual operations. (S) Insufficient number of reports to establish an estimate.

20 Agricultural Prices (October 2013) USDA, National Agricultural Statistics Service
Prices Received for Corn – States and United States: October 2013 with Comparisons
State October 2012 September 2013 Preliminary
October 2013
(dollars per bushel) (dollars per bushel) (dollars per bushel)
Colorado ......................................... Illinois .............................................. Indiana ............................................ Iowa ................................................ Kansas ............................................ Kentucky ......................................... Michigan ......................................... Minnesota ....................................... Missouri .......................................... Nebraska ........................................ North Carolina ................................. North Dakota ................................... Ohio ................................................ Pennsylvania .................................. South Dakota .................................. Tennessee ...................................... Texas .............................................. Wisconsin ....................................... United States ..................................
6.45 6.84 7.22 6.82 7.13 6.82 6.81 6.56 7.47 6.59
7.52 6.33 7.06 7.37 6.61 7.36 7.11 6.40
6.78
6.07 5.25 5.22 5.66 5.13 5.11 5.37 5.69 5.06 5.64
4.92 5.67 5.47 5.15 5.46 5.07 5.46 5.68
5.40
5.13 4.60 4.25 4.50 4.45 4.60 4.20 4.50 4.50 4.55
4.70 4.25 4.45 4.40 4.30 4.60 5.01 4.25
4.49
Prices Received for Soybeans – States and United States: October 2013 with Comparisons
State October 2012 September 2013 Preliminary
October 2013
(dollars per bushel) (dollars per bushel) (dollars per bushel)
Arkansas ......................................... Illinois .............................................. Indiana ............................................ Iowa ................................................ Kansas ............................................ Kentucky ......................................... Louisiana ........................................ Michigan ......................................... Minnesota ....................................... Mississippi ...................................... Missouri .......................................... Nebraska ........................................ North Carolina ................................. North Dakota ................................... Ohio ................................................ South Dakota .................................. Tennessee ...................................... Wisconsin ....................................... United States ..................................
14.30 14.40 14.50 14.10 14.30 14.30 14.80 14.00 14.10 13.90
14.40 14.00 14.30 13.90 14.30 13.80 14.50 13.90
14.20
13.40 13.50 13.40 13.90 13.10 13.30 13.40 13.00 13.30 13.20
13.50 13.00 13.20 12.60 13.00 12.80 13.00 12.90
13.30
13.20 12.90 12.70 12.60 12.10 12.90 13.20 12.30 12.60 13.20
12.80 12.40 12.50 12.10 12.70 12.20 12.60 12.30
12.60

Agricultural Prices (October 2013) 21 USDA, National Agricultural Statistics Service
Prices Received for Oats – States and United States: October 2013 with Comparisons
State October 2012 September 2013 Preliminary
October 2013
(dollars per bushel) (dollars per bushel) (dollars per bushel)
Illinois .............................................. Iowa ................................................. Michigan .......................................... Minnesota ........................................ Montana .......................................... Nebraska ......................................... New York ......................................... North Dakota ................................... Oregon ............................................ Pennsylvania ................................... South Dakota ................................... Texas .............................................. Wisconsin ........................................ United States ...................................
(S) 4.00 4.05 3.57 (D) (D) (D) (D) (D)
4.01 4.30
(S) 4.11
3.93
(S) 4.02 3.24 3.43 (D)
4.04 3.27 3.23 (D) (D)
3.45 (S)
3.89
3.57
(S) 4.10 3.25 3.50
(S) 3.75 (D)
3.30 (S) (D)
3.54 (S)
3.80
3.51
(D) Withheld to avoid disclosing data for individual operations. (S) Insufficient number of reports to establish an estimate.
Prices Received for Sorghum Grain – States and United States: October 2013 with Comparisons
State October 2012 September 2013 Preliminary
October 2013
(dollars per cwt) (dollars per cwt) (dollars per cwt)
Arkansas ......................................... Illinois .............................................. Kansas ............................................ Louisiana ......................................... Missouri ........................................... Nebraska ......................................... Oklahoma ........................................ Texas .............................................. United States ...................................
10.10 (D)
12.20 10.90 11.90 12.40 12.00 12.70
12.40
(D) (D)
8.70 8.84 8.09 8.45 7.77 7.88
8.10
(D) (S)
7.34 (D)
7.60 7.60 7.30 7.26
7.34
(D) Withheld to avoid disclosing data for individual operations. (S) Insufficient number of reports to establish an estimate.

22 Agricultural Prices (October 2013) USDA, National Agricultural Statistics Service
Prices Received for Dry Beans – States and United States: October 2013 with Comparisons
State October 2012 September 2013 Preliminary
October 2013
(dollars per cwt) (dollars per cwt) (dollars per cwt)
California ........................................ Colorado ......................................... Idaho ............................................... Michigan ......................................... Minnesota ....................................... Nebraska ........................................ North Dakota ................................... United States ..................................
51.70 45.40 32.80 39.00
(D) 38.10 35.90
37.70
43.00 39.60 34.10
(D) (S)
42.40 37.60
39.10
(D)
40.00 31.00
(D) (S)
44.60 37.20
39.00
(D) Withheld to avoid disclosing data for individual operations. (S) Insufficient number of reports to establish an estimate.
Prices Received for Peanuts (in shell) – States and United States: October 2013 with Comparisons
State October 2012 September 2013 Preliminary
October 2013
(dollars per pound) (dollars per pound) (dollars per pound)
Alabama ......................................... Florida ............................................. Georgia ........................................... Mississippi ...................................... New Mexico .................................... North Carolina ................................. Oklahoma ....................................... South Carolina ................................ Texas .............................................. Virginia ............................................ United States ..................................
0.332 0.279 0.340 0.357 0.375 0.361 0.359 0.349 0.365 0.306
0.337
0.224 0.252 0.239 0.272
(S) 0.322 0.232 0.291 0.247 0.298
0.255
0.239 0.250 0.242 0.246 0.346 0.280
(S) 0.275 0.323 0.269
0.254
(S) Insufficient number of reports to establish an estimate.

Agricultural Prices (October 2013) 23 USDA, National Agricultural Statistics Service
Prices Received for Sunflower – States and United States: October 2013 with Comparisons
State October 2012 September 2013 Preliminary
October 2013
(dollars per cwt) (dollars per cwt) (dollars per cwt)
Colorado .......................................... Kansas ............................................ Minnesota ........................................ North Dakota ................................... South Dakota ................................... United States ...................................
(D) 28.10 29.90 28.30 24.30
25.90
(S) (D) (D)
24.30 19.70
22.60
(S) 28.40
(S) 20.50 17.40
19.30
(D) Withheld to avoid disclosing data for individual operations. (S) Insufficient number of reports to establish an estimate.
Prices Received for Canola – States and United States: October 2013 with Comparisons
State October 2012 September 2013 Preliminary
October 2013
(dollars per cwt) (dollars per cwt) (dollars per cwt)
Minnesota ........................................ North Dakota ................................... United States ...................................
(D) 26.60
26.60
(D) 20.70
20.70
(S) 19.80
19.80
(D) Withheld to avoid disclosing data for individual operations. (S) Insufficient number of reports to establish an estimate.
Prices Received for Flaxseed – States and United States: October 2013 with Comparisons
State October 2012 September 2013 Preliminary
October 2013
(dollars per bushel) (dollars per bushel) (dollars per bushel)
North Dakota ................................... United States ...................................
13.50
13.50
13.10
13.10
13.20
13.20

24 Agricultural Prices (October 2013) USDA, National Agricultural Statistics Service
Prices Received for Upland Cotton and Cottonseed – States and United States: October 2013 with Comparisons [Cottonseed marketing year August - February]
State
Cotton, Upland Cottonseed
October 2012
September 2013
Preliminary October
2013
October 2012
September 2013
Preliminary October
2013
(dollars per pound) (dollars per pound) (dollars per pound) (dollars per ton) (dollars per ton) (dollars per ton)
Alabama ............................ Arizona .............................. Arkansas ............................ California ........................... Georgia .............................. Louisiana ........................... Mississippi ......................... North Carolina .................... Tennessee ......................... Texas ................................. United States .....................
0.682 0.785 0.644 0.921 0.797 0.677 0.661 0.757 0.791 0.674
0.698
(S) (D) (D) (D) (D) (D) (D) (D) (D)
0.748
0.746
(S) (S) (S) (S)
0.813 (S) (S) (S) (S)
0.772
0.779
189.00 (D)
256.00 390.00 223.00 266.00 265.00 232.00 255.00 257.00
254.00
(S) (S) (S) (S) (S)
272.00 (S) (S) (S)
185.00
190.00
196.00 (D)
255.00 376.00 198.00 245.00 235.00 236.00
(S) 353.00
281.00
(D) Withheld to avoid disclosing data for individual operations. (S) Insufficient number of reports to establish an estimate.
Prices Received and Farm Marketings for Upland Cotton and Rice – United States: October 2013 with Comparisons
Item October 2012 September 2013 Preliminary
October 2013
Cotton, Upland Average price ..................................... dollars/pound Marketings
1 .......................................... 1,000 bales
Rice, all Average price .......................................... dollars/cwt Marketings
2 ............................................. 1,000 cwt
Rice, long Average price .......................................... dollars/cwt Marketings
2 ............................................. 1,000 cwt
Rice, medium and short Average price .......................................... dollars/cwt Marketings
2 ............................................. 1,000 cwt
0.698 1,137
14.40 14,110
13.90 11,849
16.80 2,261
0.746 208
15.60 11,218
15.30 10,021
18.10 1,197
0.779 (NA)
16.20 (NA)
15.60 (NA)
18.80 (NA)
(NA) Not available. 1
Marketings based on a survey of cotton buyers in the major producing States - Alabama, Arizona, Arkansas, California, Georgia, Louisiana, Mississippi, North Carolina, Tennessee, and Texas.
2 Purchases by private firms and rice (rough equivalent) shipped by cooperatives.

Agricultural Prices (October 2013) 25 USDA, National Agricultural Statistics Service
Prices Received for Hay by Type – States and United States: October 2013 with Comparisons
State
All hay Alfalfa hay Other hay
October 2012
September 2013
Preliminary October
2013
October 2012
September 2013
Preliminary October
2013
October 2012
September 2013
Preliminary October
2013
(dollars per
ton) (dollars per
ton) (dollars per
ton) (dollars per
ton) (dollars per
ton) (dollars per
ton) (dollars per
ton) (dollars per
ton) (dollars per
ton)
Arizona ............ California ......... Colorado .......... Idaho ............... Illinois .............. Iowa ................. Kansas ............ Kentucky .......... Michigan .......... Minnesota ........ Missouri ........... Montana .......... Nebraska ......... Nevada ............ New Mexico ..... New York ......... North Dakota ... Ohio ................. Oklahoma ........ Oregon ............ Pennsylvania ... South Dakota ... Texas .............. Utah ................. Washington ..... Wisconsin ........ Wyoming ......... United States ...
192.00 204.00 233.00 195.00 156.00 187.00 199.00 107.00 197.00 161.00
127.00 144.00 207.00 201.00 254.00 140.00 129.00 218.00 131.00 223.00
147.00 208.00 120.00 187.00 232.00 164.00 212.00
191.00
180.00 194.00 234.00 180.00 161.00 195.00 193.00 120.00 166.00 160.00
123.00 139.00 168.00 196.00 239.00 152.00 113.00 163.00 128.00 200.00
161.00 128.00 126.00 183.00 210.00 182.00 190.00
176.00
185.00 195.00 237.00 189.00 155.00 176.00 171.00 119.00 176.00 151.00
124.00 129.00 154.00 209.00 242.00 153.00 105.00 166.00 139.00 205.00
182.00 159.00 123.00 173.00 205.00 180.00 185.00
177.00
190.00 210.00 235.00 200.00 170.00 211.00 230.00 195.00 200.00 200.00
220.00 147.00 230.00 202.00 264.00 191.00 141.00 256.00 230.00 232.00
180.00 234.00 246.00 187.00 235.00 180.00 215.00
212.00
180.00 201.00 235.00 180.00 175.00 210.00 225.00 195.00 180.00 190.00
235.00 140.00 181.00 196.00 246.00 205.00 118.00 185.00 190.00 200.00
178.00 135.00 235.00 187.00 200.00 200.00 195.00
194.00
185.00 198.00 238.00 190.00 180.00 195.00 198.00 195.00 185.00 180.00
220.00 130.00 166.00 208.00 250.00 208.00 108.00 190.00 199.00 202.00
194.00 166.00 236.00 175.00 195.00 200.00 190.00
193.00
215.00 184.00 210.00 140.00 120.00 133.00 125.00 90.00
190.00 120.00
110.00 127.00 150.00 180.00 197.00 112.00 87.00
182.00 119.00 205.00
140.00 152.00 99.00
147.00 225.00 115.00 200.00
144.00
200.00 161.00 230.00 180.00 125.00 130.00 119.00 95.00
140.00 120.00
105.00 130.00 136.00 190.00 191.00 137.00 76.00
140.00 95.00
200.00
156.00 105.00 95.00
150.00 235.00 120.00 175.00
136.00
190.00 182.00 229.00 180.00 125.00 130.00 109.00 100.00 150.00 120.00
90.00
125.00 126.00 212.00 186.00 137.00 68.00
150.00 82.00
210.00
177.00 121.00 96.00
155.00 230.00 120.00 170.00
141.00
Prices Received for Apples – States and United States: October 2013 with Comparisons [Equivalent packinghouse-door returns for California, Michigan, New York, and Washington. Prices at point of first sale for other States]
State
Apples, fresh use
October 2012 September 2013 Preliminary
October 2013
(dollars per pound) (dollars per pound) (dollars per pound)
California ......................................... Michigan .......................................... New York ......................................... Ohio ................................................. Pennsylvania ................................... Virginia ............................................ Washington ..................................... United States ...................................
0.448 0.650 0.561 0.770 0.624 0.580 0.517
0.535
(NA) (NA) (NA) (NA) (NA) (NA) (NA)
(NA)
(NA) (NA) (NA) (NA) (NA) (NA) (NA)
(NA)
(NA) Not available.

26 Agricultural Prices (October 2013) USDA, National Agricultural Statistics Service
Prices Received for Citrus Fruits by Utilization – States and United States: October 2012 [Net pounds per box: grapefruit in California-80, Florida-85, Texas-80; lemons-80; oranges in California-80, Florida-90, Texas-85; tangelos-90; tangerines and mandarins in Arizona and California-80, Florida-95]
Commodity, State,
and type
FOB packed fresh
Equivalent returns
Packinghouse door On-tree
All Fresh Process All Fresh Process
(dollars per
box) (dollars per
box) (dollars per
box) (dollars per
box) (dollars per
box) (dollars per
box) (dollars per
box)
Grapefruit California
1 ........................................
Florida ............................................... White ............................................. Colored ......................................... Texas ................................................ United States .................................... Lemons Arizona ............................................. California ........................................... United States .................................... Oranges California ........................................... Valencia ........................................ Florida ............................................... Early and mids .............................. United States .................................... Tangerines and mandarins Florida ............................................... United States ....................................
17.80 29.60 31.20 29.40 32.20
29.00
(D) 34.10
34.40
23.40 23.40
(S) (S)
23.40
33.50 33.50
11.27 14.94 13.16 15.29 20.80
14.91
(D) 21.72
22.10
12.07 12.07
(S) (S)
12.07
16.45 16.45
11.27 18.86 20.25 18.65 20.80
18.50
(D) 25.02
25.37
14.59 14.59
(S) (S)
14.59
20.10 20.10
(D)
2.60 2.60 2.60 (NA)
2.60
(D) (D)
(D)
(D) (D)
(S) (S)
(D)
4.50 4.50
9.13
12.48 10.72 12.83 19.22
12.49
(D) 16.00
16.38
9.57 9.57
(S) (S)
9.57
12.70 12.70
9.13
16.62 18.05 16.40 19.22
16.28
(D) 19.12
19.47
12.13 12.13
(S) (S)
12.13
16.55 16.55
(D)
-0.53 -0.20 -0.65 (NA)
-0.53
(D) (D)
(D)
(D) (D)
(S) (S)
(D)
0.10 0.10
(D) Withheld to avoid disclosing data for individual operations. (NA) Not available. (S) Insufficient number of reports to establish an estimate. 1
Some processed sales included in fresh sales.

Agricultural Prices (October 2013) 27 USDA, National Agricultural Statistics Service
Prices Received for Citrus Fruits by Utilization – States and United States: September 2013 [Net pounds per box: grapefruit in California-80, Florida-85, Texas-80; lemons-80; oranges in California-80, Florida-90, Texas-85; tangelos-90; tangerines and mandarins in Arizona and California-80, Florida-95]
Commodity, State,
and type
FOB packed fresh
Equivalent returns
Packinghouse door On-tree
All Fresh Process All Fresh Process
(dollars per
box) (dollars per
box) (dollars per
box) (dollars per
box) (dollars per
box) (dollars per
box) (dollars per
box)
Grapefruit California
1 ........................................
United States .................................... Lemons California .......................................... United States .................................... Oranges California .......................................... Valencia ........................................ United States ....................................
17.60
17.60
47.70
47.70
26.30 26.30
26.30
10.94
10.94
35.92
35.92
14.93 14.93
14.93
10.94
10.94
38.44
38.44
17.31 17.31
17.31
(D)
(D)
(D)
(D)
(D) (D)
(D)
8.76
8.76
29.99
29.99
12.39 12.39
12.39
8.76
8.76
32.42
32.42
14.80 14.80
14.80
(D)
(D)
(D)
(D)
(D) (D)
(D)
(D) Withheld to avoid disclosing data for individual operations. 1
Some processed sales included in fresh sales.
28 Agricultural Prices (October 2013) USDA, National Agricultural Statistics Service
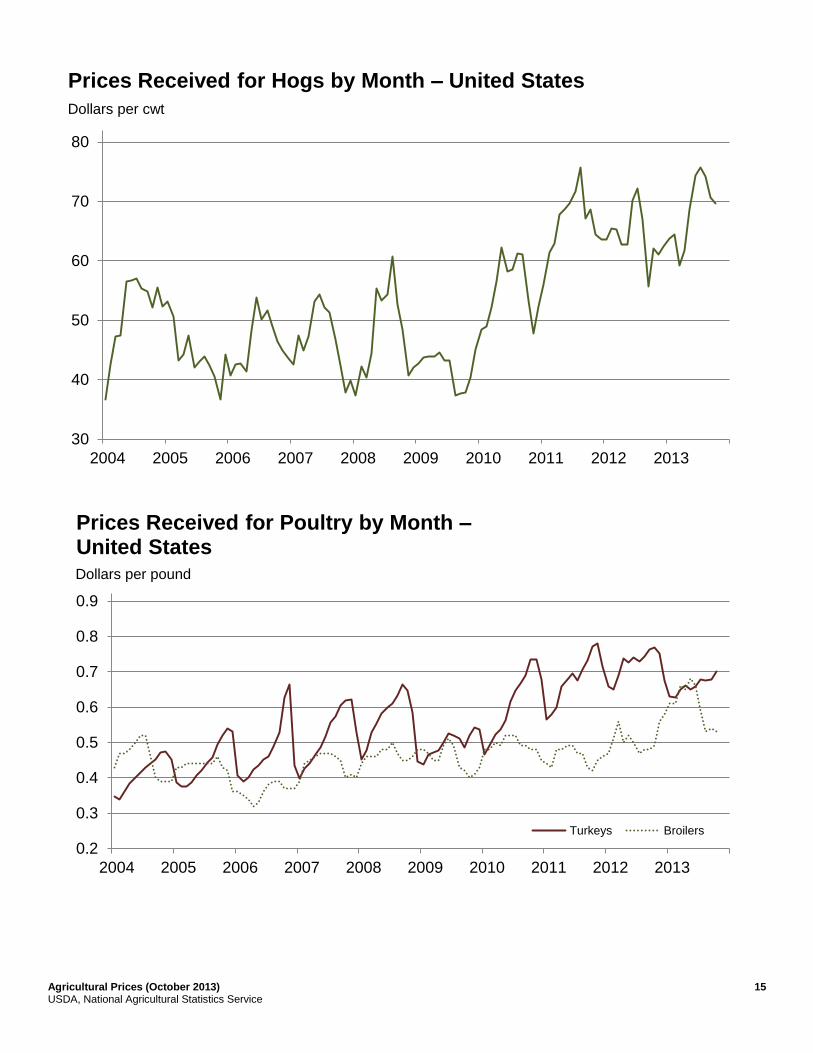
Prices Received for Citrus Fruits by Utilization – States and United States: October 2013 [Net pounds per box: grapefruit in California-80, Florida-85, Texas-80; lemons-80; oranges in California-80, Florida-90, Texas-85; tangelos-90; tangerines and mandarins in Arizona and California-80, Florida-95]
Commodity, State,
and type
FOB packed fresh
Equivalent returns
Packinghouse door On-tree
All Fresh Process All Fresh Process
(dollars per
box) (dollars per
box) (dollars per
box) (dollars per
box) (dollars per
box) (dollars per
box) (dollars per
box)
Grapefruit California
1 ........................................
Florida ............................................... White ............................................. Colored ......................................... United States .................................... Lemons Arizona ............................................. California ........................................... United States .................................... Oranges California ........................................... Valencia ........................................ Florida ............................................... Early and mids .............................. United States .................................... Tangerines and mandarins .................... California ........................................... Florida ............................................... United States ....................................
(D) (S) (S) (S)
(D)
(D) 50.00
50.70
26.80 26.80
(S) (S)
26.80
(D) (S)
(D)
(D) (S) (S) (S)
(D)
(D) 39.03
39.67
15.48 15.48
(S) (S)
15.48
(D) (S)
(D)
(D) (S) (S) (S)
(D)
(D) 40.74
41.46
17.81 17.81
(S) (S)
17.81
(D) (S)
(D)
(D) (S) (S) (S)
(D)
(D) (D)
(D)
(D) (D)
(S) (S)
(D)
(D) (S)
(D)
(D) (S) (S) (S)
(D)
(D) 33.07
33.71
12.94 12.94
(S) (S)
12.94
(D) (S)
(D)
(D) (S) (S) (S)
(D)
(D) 34.72
35.44
15.30 15.30
(S) (S)
15.30
(D) (S)
(D)
(D) (S) (S) (S)
(D)
(D) (D)
(D)
(D) (D)
(S) (S)
(D)
(D) (S)
(D)
(D) Withheld to avoid disclosing data for individual operations. (S) Insufficient number of reports to establish an estimate. 1
Some processed sales included in fresh sales.

Agricultural Prices (October 2013) 29 USDA, National Agricultural Statistics Service
Prices Received for Potatoes – States and United States: October 2013 with Comparisons
State October 2012 September 2013 Preliminary
October 2013
(dollars per cwt) (dollars per cwt) (dollars per cwt)
California Spring .......................................... Fall .............................................. All
1 ..............................................
Colorado Fresh
2 .........................................
All 1 ..............................................
Florida ............................................. Idaho Fresh
2 .........................................
Processing ................................... All
1 ..............................................
Maine .............................................. Michigan .......................................... Minnesota ........................................ New York ......................................... North Carolina ................................. North Dakota Fresh
2 .........................................
Processing ................................... All
1 ..............................................
Oregon ............................................ Texas .............................................. Virginia ............................................ Washington Processing ................................... All
1 ..............................................
Wisconsin Fresh
2 .........................................
Processing ................................... All
1 ..............................................
United States Fresh
2 .........................................
Processing ................................... All
1 ..............................................
(S)
6.75 6.75
6.35 5.85
(S)
4.60 7.30 6.55 9.95
10.10 6.10
13.40 (S)
8.10 8.15 8.20 6.85
(S) (S)
6.50 6.50
8.50 7.65 8.00
6.71 7.13 7.02
(S) (S) (S)
13.60 12.60
(S)
8.80 7.50 7.70 (D)
9.85 11.40 16.00
(S)
(D) (D) (D)
8.45 (S) (S)
6.30 7.75
12.90 8.45
11.00
12.72 7.55 8.78
(S) (S) (S)
(D) (D)
(S)
(D) (D)
7.65 (D)
9.70 (D)
15.80 (S)
(D) (D) (D)
8.00 (S) (S)
(D) 6.80
(D) (D) (D)
(D) (D)
8.01
(D) Withheld to avoid disclosing data for individual operations. (S) Insufficient number of reports to establish an estimate. 1
Average price of potatoes sold for all uses, including table stock, processing, seed, and livestock feed. 2
Fresh market prices only. Includes table stock prices.

30 Agricultural Prices (October 2013) USDA, National Agricultural Statistics Service
Prices Received for All Milk – States and United States: October 2013 with Comparisons [Before deduction for hauling. Includes quality, quantity, and other premiums. Excludes hauling subsidies]
State October 2012 September 2013
Preliminary October 2013
Price Fat test Price Fat test Price Fat test
(dollars per cwt) (percent) (dollars per cwt) (percent) (dollars per cwt) (percent)
Arizona ................................ California ............................. Colorado .............................. Florida .................................. Idaho .................................... Illinois ................................... Indiana ................................. Iowa ..................................... Kansas ................................. Michigan .............................. Minnesota ............................ Missouri ............................... New Mexico ......................... New York ............................. Ohio ..................................... Oregon ................................. Pennsylvania ....................... Texas ................................... Utah ..................................... Vermont ............................... Virginia ................................. Washington .......................... Wisconsin ............................ United States .......................
20.40 19.73 21.20 24.20 21.30 22.80 21.60 22.50 22.30 21.60
23.50 21.50 20.20 21.90 22.20 23.50 22.80 21.50 21.00 22.30
23.20 21.20 23.10
21.60
3.59 3.78 3.62 3.72 3.77 3.90 3.77 3.88 3.80 3.75
3.92 3.80 3.70 3.80 3.82 3.87 3.79 3.89 3.79 4.01
3.81 3.87 3.85
3.80
19.90 18.50 20.30 24.20 19.10 20.90 20.90 20.40 20.00 20.60
20.10 20.80 18.90 21.40 21.10 21.30 21.70 20.50 19.50 21.60
23.40 20.60 20.20
20.10
3.51 3.68 3.49 3.62 3.74 3.68 3.64 3.70 3.52 3.62
3.78 3.65 3.49 3.73 3.65 3.82 3.68 3.76 3.71 3.73
3.63 3.82 3.70
3.68
20.20 18.90 20.40 24.30 19.10 21.00 21.20 20.50 20.20 20.90
20.20 21.00 19.30 21.70 21.30 21.50 22.00 20.60 19.70 21.90
23.80 21.00 20.30
20.30
3.55 3.73 3.55 3.70 3.80 3.82 3.74 3.82 3.67 3.70
3.89 3.76 3.60 3.83 3.75 3.91 3.75 3.85 3.77 3.85
3.76 3.91 3.81
3.77

Agricultural Prices (October 2013) 31 USDA, National Agricultural Statistics Service
Prices Received for Milk Cows – States and United States: October 2013 with Comparisons [Animals sold for dairy herd replacement only. Prices estimated in January, April, July, and October]
State October 2012 July 2013 October 2013
(dollars per head) (dollars per head) (dollars per head)
Arizona ............................................ California ......................................... Colorado .......................................... Florida ............................................. Idaho ............................................... Illinois .............................................. Indiana ............................................ Iowa ................................................. Kansas ............................................ Michigan .......................................... Minnesota ........................................ Missouri ........................................... New Mexico ..................................... New York ......................................... Ohio ................................................. Oregon ............................................ Pennsylvania ................................... Texas .............................................. Utah ................................................. Vermont ........................................... Virginia ............................................ Washington ..................................... Wisconsin ........................................ United States ...................................
1,450 1,300 1,430 1,470 1,400 1,420 1,350 1,420 1,300 1,500
1,350 1,100 1,400 1,410 1,380 1,360 1,430 1,370 1,240 1,550
1,470 1,300 1,460
1,390
(NA) (NA) (NA) (NA) (NA) (NA) (NA) (NA) (NA) (NA)
(NA) (NA) (NA) (NA) (NA) (NA) (NA) (NA) (NA) (NA)
(NA) (NA) (NA)
(NA)
1,500 1,300 1,520 1,550 1,300 1,420 1,450 1,380 1,350 1,600
1,350 1,200 1,440 1,410 1,400 1,300 1,450 1,450 1,290 1,510
1,490 1,300 1,490
1,400
(NA) Not available.

32 Agricultural Prices (October 2013) USDA, National Agricultural Statistics Service
Commodity Parity Prices and Price as Percent of Parity Price – United States: October 2013 with Comparisons [Parity prices are computed under the provisions of Title III, Subtitle a, Section 301 (a) of the Agricultural Adjustment Act of 1938 as amended by the Agricultural Acts of 1948, 1949, and 1956. See January Agricultural Prices for details on adjusted base price and parity price computations. Parity data not available for blank cells. Primary source of data for livestock and milk prices is United States Department of Agriculture's Agricultural Marketing Service]
Commodity and unit Adjusted
base price
Parity price Price as percent
of parity
October 2012
September 2013
October 2013
October 2012
September 2013
October 2013
(dollars) (dollars) (dollars) (dollars) (percent) (percent) (percent)
Basic commodities All wheat ....................................... bushel Rice ................................................... cwt Corn .............................................. bushel Cotton Upland ...................................... pound American Pima .......................... pound Peanuts ......................................... pound Designated nonbasic All milk, to plants
1 ................................ cwt
Honey, extracted 2 ......................... pound
Wool and mohair Wool ............................................. pound Mohair ........................................... pound Other nonbasic Apples, fresh
3 ............................... pound
Barley ........................................... bushel Canola ............................................... cwt Cottonseed ........................................ ton Dry edible beans ................................ cwt Flaxseed ....................................... bushel Oats .............................................. bushel Potatoes ............................................. cwt Sorghum grain ................................... cwt Soybeans ...................................... bushel Sunflower, all ..................................... cwt Citrus (equivalent on-tree) Grapefruit ........................................... box Lemons .............................................. box Oranges ............................................. box Tangerines ......................................... box Livestock and poultry Beef cattle .......................................... cwt Calves ................................................ cwt Hogs .................................................. cwt Eggs
1 ............................................ dozen
Turkeys, live .................................. pound
0.636 1.65
0.434
0.072 0.133 0.027
1.75 0.141
0.107 0.336
0.032 0.444 1.880 17.80 3.01
1.110 0.265 0.822 0.758 1.030 2.10
0.697 1.32
0.711 1.49
10.00 13.70 5.48
0.089 0.057
18.60 42.70 12.10
2.11 4.13
0.761
52.70 4.07
3.05 9.75
0.966 12.80 53.30
509.00 88.10 32.20 7.70
25.00 21.30 29.30 60.30
20.20 40.10 20.40 43.60
296.00 407.00 162.00
2.66 1.670
18.00 46.70 12.30
2.04 3.77
0.764
49.50 3.99
3.03 9.51
0.906 12.60 53.20
504.00 85.20 31.40 7.50
23.30 21.50 29.20 59.50
19.70 37.40 20.10 42.20
283.00 388.00 155.00
2.52 1.610
18.40 47.80 12.60
2.09 3.85
0.782
50.70 4.09
3.10 9.74
0.927 12.90 54.50
516.00 87.20 32.20 7.68
23.80 22.00 29.80 60.90
20.20 38.30 20.60 43.20
290.00 397.00 159.00
2.58 1.650
45 34 56
33 35 44
38 42
55 43
55 51 50 50 43 42 51 28 58 48 43
62 41 47 29
42 40 38 38 46
38 33 44
37 33 33
39 43
50 41
55 46 39 38 46 42 48 38 38 46 38
44 80 62
139
43 47 46 42 42
39 34 36
37 32 32
37 42
49 40
46 42 36 54 45 41 46 34 33 42 32
39 98 63
129
42 44 44 40 42
1 Seasonally adjusted price as percentage of parity price.
2 Wholesale extracted. Adjusted base price derived from state annual averages prices weighted by production. For 1982 through 1985 the national averages are the support prices.
3 Equivalent packinghouse-door returns for California, New York, Oregon, and Washington. Price at point of first sale for other states.

Agricultural Prices (October 2013) 33 USDA, National Agricultural Statistics Service
Commodity Parity Prices – United States: October 2013 with Comparisons [Parity prices are computed under the provisions of Title III, Subtitle a, Section 301 (a) of the Agricultural Adjustment Act of 1938 as amended by the Agricultural Acts of 1948, 1949, and 1956. See January Agricultural Prices for details on adjusted base price and parity price computations]
Commodity and unit Adjusted
base price
Parity price
October 2012
September 2013
October 2013
(dollars) (dollars) (dollars) (dollars)
Field crops and miscellaneous Hops ............................................................................ pound Mustard seed .................................................................... cwt Rapeseed ......................................................................... cwt Rye .............................................................................. bushel Safflower .......................................................................... cwt Spearmint oil ................................................................ pound Sweet potatoes ................................................................. cwt Tobacco Flue-cured, 11-14 .................................................... pound Fire-cured, 21-23 ..................................................... pound Burley, 31 ................................................................ pound Maryland, 32 ............................................................ pound Dark air-cured, 35-37 ............................................... pound Pennsylvania seedleaf, 41 ....................................... pound Cigar binder, 51 ....................................................... pound Noncitrus fruit Apples, processing
1 ......................................................... ton
Apricots Fresh
2 .......................................................................... ton
Dried (California) ........................................................... ton Avocados
2 ....................................................................... ton
Cherries Sweet ........................................................................... ton Tart .......................................................................... pound Cranberry
3 ................................................................... barrel
Dates (California) 2 ............................................................ ton
Grapes Raisin variety ................................................................ ton Other dried .................................................................... ton Kiwifruit ............................................................................. ton Nectarines, fresh (California)
2 .......................................... ton
Olives, canning (California) 3 ............................................. ton
0.303 2.85 2.25
0.535 2.04 1.50 2.08
0.185 0.267 0.188 0.167 0.240 0.176 0.610
16.60
111.00 252.00 189.00
205.00 0.033 4.68
161.00
133.00 61.70 88.60 54.60 87.70
8.96
82.60 65.30 15.40 59.10 43.90 64.70
5.74 8.29 5.91 5.09 7.50 5.39
18.80
483.00
3,600.00 7,580.00 5,970.00
6,300.00
0.996 142.00
5,180.00
3,660.00 1,640.00 2,760.00 1,580.00 2,620.00
8.58
80.70 63.70 15.10 57.80 42.50 58.90
5.24 7.56 5.32 4.73 6.79 4.98
17.30
470.00
3,140.00 7,130.00 5,350.00
5,800.00
0.934 132.00
4,560.00
3,770.00 1,750.00 2,510.00 1,550.00 2,480.00
8.78
82.60 65.20 15.50 59.10 43.50 60.30
5.36 7.74 5.45 4.84 6.96 5.10
17.70
481.00
3,220.00 7,300.00 5,480.00
5,940.00
0.956 136.00
4,670.00
3,850.00 1,790.00 2,570.00 1,580.00 2,540.00
See footnote(s) at end of table. --continued

34 Agricultural Prices (October 2013) USDA, National Agricultural Statistics Service
Commodity Parity Prices – United States: October 2013 with Comparisons (continued) [Parity prices are computed under the provisions of Title III, Subtitle a, Section 301 (a) of the Agricultural Adjustment Act of 1938 as amended by the Agricultural Acts of 1948, 1949, and 1956. See January Agricultural Prices for details on adjusted base price and parity price computations]
Commodity and unit Adjusted
base price
Parity price
October 2012
September 2013
October 2013
(dollars) (dollars) (dollars) (dollars)
Noncitrus fruit - continued Papayas (Hawaii) ....................................................... pound Peaches Fresh
4 ........................................................................ ton
Dried (California) ......................................................... ton Processing, excludes dried Clingstone (California)
3 ......................................... ton
Pears Fresh
4 ........................................................................ ton
Dried (California) 1 ....................................................... ton
Plums (California) Fresh, equivalent on-tree ............................................ ton Prunes, dried (California)
1 .............................................. ton
Prunes and plums Fresh, excludes California
5 ......................................... ton
Processing, excludes dried 1 ....................................... ton
Tree nuts
6
Almonds ..................................................................... pound Hazelnuts ........................................................................ ton Pistachios .................................................................. pound Walnuts ........................................................................... ton Vegetables, fresh
7
Carrots 8 .......................................................................... cwt
Cauliflower 8 .................................................................... cwt
Celery 8 ........................................................................... cwt
Honeydew melons ........................................................... cwt Lettuce ............................................................................ cwt Onions
8 .......................................................................... cwt
Tomatoes ........................................................................ cwt
0.038
80.20 48.50
31.60
54.70 150.00
58.10
143.00
61.90 23.80
0.211 191.00 0.194
185.00
2.57 4.04 1.94 1.97 2.09 1.41 4.30
1.29
2,400.00 1,570.00
975.00
1,630.00 5,010.00
1,720.00 4,330.00
1,830.00
738.00
6.24 5,740.00
5.74 5,240.00
78.80 126.00 58.90 61.20 67.10 43.60
137.00
1.08
2,270.00 1,370.00
895.00
1,550.00 4,250.00
1,640.00 4,050.00
1,750.00
674.00
5.97 5,410.00
5.49 5,240.00
72.80 114.00 54.90 55.80 59.20 39.90
122.00
1.10
2,320.00 1,410.00
916.00
1,590.00 4,350.00
1,680.00 4,140.00
1,790.00
690.00
6.11 5,540.00
5.62 5,360.00
74.50 117.00 56.20 57.10 60.60 40.90
125.00 1 Equivalent returns at processing plant door.
2 Equivalent returns at packinghouse door.
3 Equivalent returns for bulk fruit at first delivery point.
4 Equivalent packinghouse-door returns for California, New York (apples only), Oregon (except peaches), and Washington. Price at point of first sale for other states.
5 Based on "as sold" prices for fresh fruit in all states.
6 Prices In-Shell basis except almonds which are shelled basis.
7 FOB shipping point prices.
8 Includes some processing.
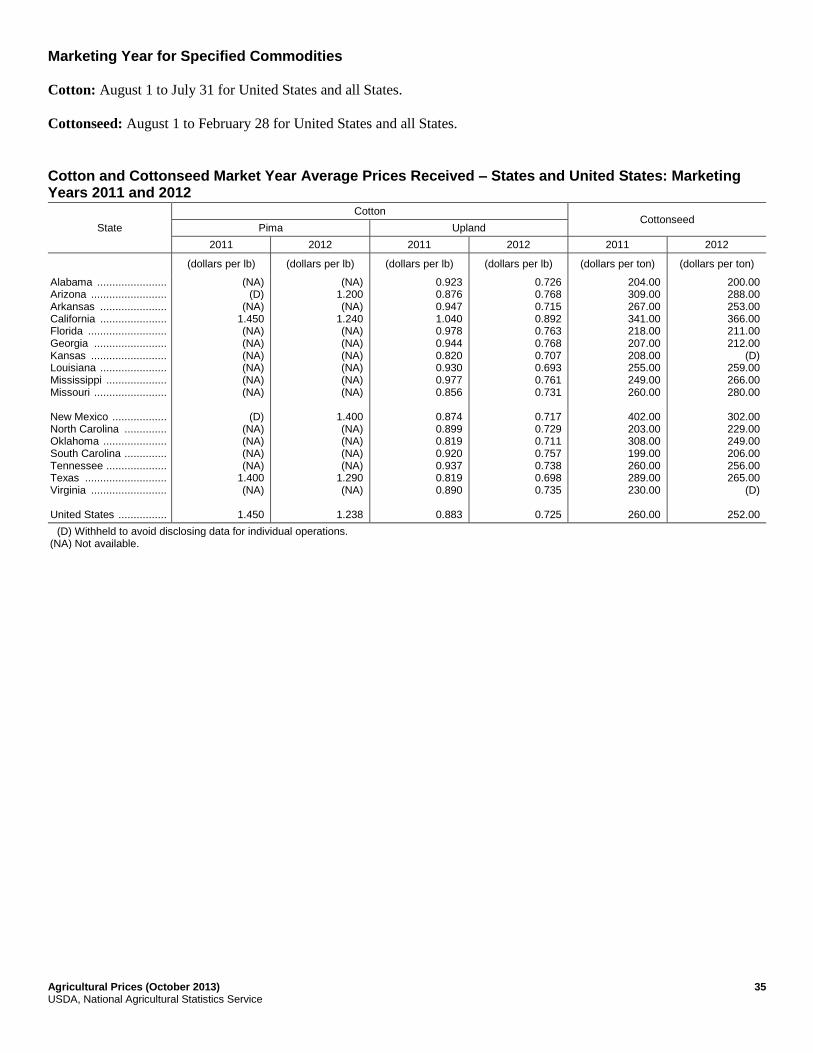
Agricultural Prices (October 2013) 35 USDA, National Agricultural Statistics Service
Marketing Year for Specified Commodities
Cotton: August 1 to July 31 for United States and all States.
Cottonseed: August 1 to February 28 for United States and all States.
Cotton and Cottonseed Market Year Average Prices Received – States and United States: Marketing Years 2011 and 2012
State
Cotton Cottonseed
Pima Upland
2011 2012 2011 2012 2011 2012
(dollars per lb) (dollars per lb) (dollars per lb) (dollars per lb) (dollars per ton) (dollars per ton)
Alabama ....................... Arizona ......................... Arkansas ...................... California ...................... Florida .......................... Georgia ........................ Kansas ......................... Louisiana ...................... Mississippi .................... Missouri ........................ New Mexico .................. North Carolina .............. Oklahoma ..................... South Carolina .............. Tennessee .................... Texas ........................... Virginia ......................... United States ................
(NA) (D)
(NA) 1.450 (NA) (NA) (NA) (NA) (NA) (NA)
(D)
(NA) (NA) (NA) (NA)
1.400 (NA)
1.450
(NA) 1.200 (NA)
1.240 (NA) (NA) (NA) (NA) (NA) (NA)
1.400 (NA) (NA) (NA) (NA)
1.290 (NA)
1.238
0.923 0.876 0.947 1.040 0.978 0.944 0.820 0.930 0.977 0.856
0.874 0.899 0.819 0.920 0.937 0.819 0.890
0.883
0.726 0.768 0.715 0.892 0.763 0.768 0.707 0.693 0.761 0.731
0.717 0.729 0.711 0.757 0.738 0.698 0.735
0.725
204.00 309.00 267.00 341.00 218.00 207.00 208.00 255.00 249.00 260.00
402.00 203.00 308.00 199.00 260.00 289.00 230.00
260.00
200.00 288.00 253.00 366.00 211.00 212.00
(D) 259.00 266.00 280.00
302.00 229.00 249.00 206.00 256.00 265.00
(D)
252.00
(D) Withheld to avoid disclosing data for individual operations. (NA) Not available.

36 Agricultural Prices (October 2013) USDA, National Agricultural Statistics Service
Prices Received for Upland Cotton by Month – States and United States: Marketing Years 2011-2012 and 2012-2013
State 2011-2012
August September October November December January 1
(dollars per pound) (dollars per pound) (dollars per pound) (dollars per pound) (dollars per pound) (dollars per pound)
Alabama .......................... Arizona ............................ Arkansas .......................... California ......................... Georgia ............................ Louisiana ......................... Mississippi ....................... North Carolina .................. Tennessee ....................... Texas ............................... United States ...................
(S) (S) (S) (S) (S) (D) (S) (S) (S)
0.940
0.940
0.864 (D) (D) (S) (D)
0.934 (D)
0.941 (D)
0.939
0.935
0.953 0.894 0.940 1.090 0.943 0.924 0.901 0.893 0.924 0.925
0.922
0.960 0.937 0.928 1.190 0.955 0.923 0.976 0.902 0.939 0.890
0.926
0.855 0.941 0.939 1.180 0.945 0.886 0.948 0.889 0.913 0.830
0.889
0.906 0.914 0.966 0.963 0.930 0.925 0.952 0.897 0.901 0.862
0.901
State 2012-2013
August September October November December January 1
(dollars per pound) (dollars per pound) (dollars per pound) (dollars per pound) (dollars per pound) (dollars per pound)
Alabama .......................... Arizona ............................ Arkansas .......................... California ......................... Georgia ............................ Louisiana ......................... Mississippi ....................... North Carolina .................. Tennessee ....................... Texas ............................... United States ...................
(D) 0.670
(D) (S) (D)
0.747 (D) (D) (D)
0.715
0.714
(D) (D) (D) (S)
0.818 0.691
(D) (D) (D)
0.708
0.709
0.682 0.785 0.644 0.921 0.797 0.677 0.661 0.757 0.791 0.674
0.698
0.676 0.782 0.692
(D) 0.749 0.646 0.711 0.718 0.742 0.672
0.692
0.674 0.803 0.730 0.930 0.739 0.684 0.727 0.712 0.694 0.713
0.718
0.749 (D)
0.694 (D)
0.753 0.730 0.739 0.729 0.709 0.705
0.729
See footnote(s) at end of table. --continued

Agricultural Prices (October 2013) 37 USDA, National Agricultural Statistics Service
Prices Received for Upland Cotton by Month – States and United States: Marketing Years 2011-2012 and 2012-2013 (continued)
State 2011-2012
February March April May June July
(dollars per pound) (dollars per pound) (dollars per pound) (dollars per pound) (dollars per pound) (dollars per pound)
Alabama .......................... Arizona ............................ Arkansas ......................... California ......................... Georgia ........................... Louisiana ......................... Mississippi ....................... North Carolina ................. Tennessee ....................... Texas .............................. United States ...................
0.944 0.886 0.985
(D) 0.927 0.992 0.985 0.906 0.964 0.831
0.923
0.954 (D)
0.922 (D)
0.930 0.929 0.970 0.916 0.943 0.831
0.900
(D) (D) (D) (D)
0.962 0.919
(D) 0.975 0.905 0.792
0.904
1.010 (D)
1.010 (D)
0.973 1.010 1.010 1.010
(D) 0.777
0.844
1.010 (D) (D) (D)
0.972 (D)
1.010 1.010 1.010 0.704
0.771
1.020 (D)
1.020 (D)
1.010 1.020 1.020 1.020
(D) 0.705
0.766
State 2012-2013
February March April May June July
(dollars per pound) (dollars per pound) (dollars per pound) (dollars per pound) (dollars per pound) (dollars per pound)
Alabama .......................... Arizona ............................ Arkansas ......................... California ......................... Georgia ........................... Louisiana ......................... Mississippi ....................... North Carolina ................. Tennessee ....................... Texas .............................. United States ...................
0.799 0.746 0.764 0.898 0.775 0.768 0.773 0.764 0.756 0.727
0.769
0.797 (D) (D) (D)
0.808 (D) (D) (D)
0.786 0.721
0.775
0.791 (D) (D) (D)
0.798 0.767
(D) 0.797 0.794 0.684
0.784
0.802 (D)
0.800 (D)
0.802 (D) (D)
0.801 0.791
(D)
0.783
0.806 (D)
0.796 (D)
0.812 0.805 0.806 0.806 0.808 0.688
0.793
0.813 (D)
0.814 (D)
0.812 0.814 0.813 0.814 0.814 0.680
0.809
(D) Withheld to avoid disclosing data for individual operations. (S) Insufficient number of reports to establish an estimate. 1
Second year.

38 Agricultural Prices (October 2013) USDA, National Agricultural Statistics Service
Prices Received for Cottonseed by Month – States and United States: Marketing Year 2012-2013 [Monthly prices available only for major cotton producing States]
State August September October November December January 1 February
(dollars per ton) (dollars per ton) (dollars per ton) (dollars per ton) (dollars per ton) (dollars per ton) (dollars per ton)
Alabama ..................... Arizona ....................... Arkansas ..................... California .................... Georgia ....................... Louisiana .................... Mississippi .................. North Carolina ............. Tennessee .................. Texas .......................... United States ..............
(NA) (S)
(NA) (NA) (NA) (NA) (NA) (NA) (NA)
235.00
235.00
(S) 360.00 275.00
(S) 219.00 222.00
(S) (S) (S)
252.00
254.00
189.00 (D)
256.00 390.00 223.00 266.00 265.00 232.00 255.00 257.00
254.00
198.00 269.00 246.00 365.00 213.00
(S) 267.00 233.00 258.00 268.00
255.00
206.00 280.00
(S) 369.00 210.00
(S) (S)
222.00 260.00 269.00
252.00
195.00 314.00
(S) 352.00 212.00
(S) (S)
217.00 (S)
268.00
249.00
205.00 (S) (S) (S)
209.00 (S) (S)
222.00 (S)
271.00
217.00
(D) Withheld to avoid disclosing data for individual operations. (NA) Not available. (S) Insufficient number of reports to establish an estimate. 1
Second year.

Agricultural Prices (October 2013) 39 USDA, National Agricultural Statistics Service
Percent of Upland Cotton Farm Marketings by Month – States and United States: Marketing Years 2011-2012 and 2012-2013 [Monthly farm marketings, based on a sample survey, as a percent of total used for calculating marketing year average prices]
State and marketing
year August September October November December January February March April May June July
(percent) (percent) (percent) (percent) (percent) (percent) (percent) (percent) (percent) (percent) (percent) (percent)
Alabama 2011-2012 ... 2012-2013 ... Arizona 2011-2012 ... 2012-2013 ... Arkansas 2011-2012 ... 2012-2013 ... California 2011-2012 ... 2012-2013 ... Georgia 2011-2012 ... 2012-2013 ... Louisiana 2011-2012 ... 2012-2013 ... Mississippi 2011-2012 ... 2012-2013 ... North Carolina 2011-2012 ... 2012-2013 ... Tennessee 2011-2012 ... 2012-2013 ... Texas 2011-2012 ... 2012-2013 ... United States 2011-2012 ... 2012-2013 ...
0.2 0.2
- 1.2
- -
- -
- 0.1
- 0.3
- 0.1
- 0.2
- 0.3
9.6 5.3
4.2 2.5
0.8
-
0.4 1.1
1.3 -
- -
0.1 0.1
6.7 2.2
0.1 -
2.0 0.1
0.2 -
6.7 7.0
3.6 3.3
9.2
10.7
5.4 10.4
14.2 24.3
10.2 2.8
6.1 4.4
40.7 38.8
6.9 4.7
23.0 9.6
15.4 7.1
4.6 7.1
9.5 9.1
17.0 18.9
12.6 16.4
35.3 13.9
14.4 6.6
10.7 14.7
18.7 24.6
12.3 13.7
24.0 33.2
24.4 11.4
8.8 28.1
14.1 22.2
29.3 23.5
22.3 19.0
11.6 5.9
28.3 10.5
16.8 21.9
8.8 11.1
11.4 12.5
26.7 32.9
13.6 24.7
14.1 34.2
16.4 26.5
16.2 17.0
18.8 20.1
4.5 23.6
5.8 23.0
21.9 19.1
5.9 5.0
10.1 13.7
18.3 13.1
10.8 26.3
10.1 11.7
12.7 15.1
8.8
11.3
13.4 11.2
12.0 7.4
6.3 23.4
14.6 13.4
4.5 3.9
14.4 11.1
2.0 3.2
8.8 7.0
2.9 3.0
7.1 6.8
6.8 4.5
9.1 4.4
9.4 4.7
18.3 6.4
12.6 7.1
5.6 2.5
13.7 9.0
1.7 1.6
8.1 9.9
3.5 2.0
6.7 4.1
2.3 4.2
5.4 4.4
2.6 5.7
4.2 7.6
4.2 5.4
2.9 4.2
5.3 10.2
0.4 1.8
5.8 3.3
1.1 0.4
2.5 3.0
3.6 2.7
5.9 4.0
4.2 3.9
6.5 7.0
5.3 3.5
2.7 2.0
8.4 6.8
0.5 1.1
4.9 3.1
9.2 0.5
6.5 2.1
2.3 2.0
3.5 4.0
2.7 3.1
3.0 6.3
3.5 3.0
1.8 1.5
5.5 5.0
0.3 0.8
2.8 2.4
10.0 0.5
6.0 1.8
3.7 5.0
3.2 3.8
2.2 7.5
3.0 6.4
4.2 7.3
1.7 3.9
11.9 13.2
1.1 2.4
5.2 4.5
19.4 0.2
10.7 3.5
- Represents zero.

40 Agricultural Prices (October 2013) USDA, National Agricultural Statistics Service
Upland Cotton Monthly Marketings – Marketing Years 2011-2012 and 2012-2013 [Marketings based on a survey of cotton buyers in the major producing States - Alabama, Arizona, Arkansas, California, Georgia, Louisiana, Mississippi, North Carolina, Tennessee, and Texas. Total may not add due to rounding]
Month Upland Cotton
2011-2012 2012-2013
(1,000 bales) (1,000 bales)
August ................................................................ September .......................................................... October ............................................................... November ........................................................... December ........................................................... January
1 .............................................................
February ............................................................. March .................................................................. April .................................................................... May ..................................................................... June .................................................................... July ..................................................................... Year ....................................................................
506 432
1,155 1,706 1,990 1,541
857 808 300 793 725
1,300
12,113
316 416
1,137 2,769 3,278 1,885
848 516 368 266 219 437
12,455
1 Second year.

Agricultural Prices (October 2013) 41 USDA, National Agricultural Statistics Service
Prices Received Indexes as a Percent of 1990-1992 Base, Monthly and Annual Average – United States: 2009-2013 [Revised historical price indexes for months not shown are available at www.nass.usda.gov. Blank data cells indicate estimation period has not begun]
Year All products
January February March April May June July August September October November December Average 1
2009 ... 2010 ... 2011 ... 2012 ... 2013 ...
139 136 166 189 217
126 132 170 181 199
126 137 173 184 201
129 135 176 179 192
130 138 175 180 196
134 135 180 183 200
131 138 183 191 200
126 141 184 194 189
126 143 179 195 186
134 151 185 210 187
136 154 184 207
136 153 179 199
131 141 178 191 197
Year All crops
January February March April May June July August September October November December Average 1
2009 ... 2010 ... 2011 ... 2012 ... 2013 ...
161 149 189 213 250
146 145 200 207 234
147 150 198 211 238
151 146 202 210 222
150 148 204 214 224
159 144 210 214 233
150 147 212 231 230
146 151 211 234 214
143 152 204 227 206
152 163 204 238 203
154 171 206 238
150 171 199 226
151 153 203 222 225
Year Food grains
January February March April May June July August September October November December Average 1
2009 ... 2010 ... 2011 ... 2012 ... 2013 ...
220 177 220 233 259
205 175 232 227 252
201 173 233 229 248
200 166 244 229 247
200 158 253 219 247
194 145 243 224 244
177 154 236 262 233
170 181 248 263 231
161 189 246 266 228
163 190 238 265 237
172 199 239 266
173 214 238 267
186 177 239 246 243
Year Feed grains & hay
January February March April May June July August September October November December Average 1
2009 ... 2010 ... 2011 ... 2012 ... 2013 ...
188 158 209 261 300
169 153 232 268 301
169 153 230 271 305
168 148 263 273 299
172 152 266 272 299
169 148 263 268 296
154 151 265 292 286
148 157 283 312 264
143 173 271 292 235
155 185 250 293 199
157 194 252 301
155 202 252 294
162 165 253 283 278
Year Cotton
January February March April May June July August September October November December Average 1
2009 ... 2010 ... 2011 ... 2012 ... 2013 ...
76 100 135 149 120
68 107 153 152 127
67 107 139 149 128
74 110 143 149 129
74 110 137 139 129
74 113 137 127 131
72 113 136 126 133
82 125 155 118 127
88 123 154 117 123
97 128 152 115 129
98 134 153 114
105 134 147 118
81 117 145 131 128
Year Tobacco
January February March April May June July August September October November December Average 1
2009 ... 2010 ... 2011 ... 2012 ... 2013 ...
104 103 99
103 116
104 103 99
103 116
104 103 99
103 116
104 103 99
103 116
104 103 99
103 116
104 103 99
103 116
104 103 99
103 116
104 103 99
103 116
104 103 99
103 116
104 103 99
103 116
104 103 99
103
103 99
103 116
104 103 83
104 116
Year Oilseeds
January February March April May June July August September October November December Average 1
2009 ... 2010 ... 2011 ... 2012 ... 2013 ...
179 173 207 214 253
172 168 228 220 255
164 167 228 233 254
175 169 235 247 250
191 168 237 250 256
203 168 237 249 260
192 174 237 275 263
192 178 239 287 237
158 149 202 240 232
161 167 207 246 225
165 186 215 252
172 199 212 254
177 172 224 247 249
Fruits & nuts
Year January February March April May June July August September October November December Average 1
2009 ... 2010 ... 2011 ... 2012 ... 2013 ...
121 135 152 166 177
122 143 141 163 180
123 144 148 171 178
123 131 153 174 161
135 142 158 213 169
146 142 167 191 190
148 147 184 185 188
146 152 186 194 192
158 154 181 215 207
162 161 182 224 212
156 171 178 215
140 149 168 189
140 148 167 192 185
See footnote(s) at end of table. --continued

42 Agricultural Prices (October 2013) USDA, National Agricultural Statistics Service
Prices Received Indexes as a Percent of 1990-1992 Base, Monthly and Annual Average – United States: 2009-2013 (continued) [Revised historical price indexes for months not shown are available at www.nass.usda.gov. Blank data cells indicate estimation period has not begun]
Year Commercial vegetables
January February March April May June July August September October November December Average 1
2009 ... 2010 ... 2011 ... 2012 ... 2013 ...
173 148 197 118 264
139 147 276 113 212
151 210 220 123 230
176 190 165 140 167
141 172 175 158 166
155 152 167 162 165
135 150 161 153 178
140 151 136 156 192
135 149 138 172 168
167 142 124 151 206
216 183 159 167
208 155 136 135
161 162 171 146 195
Year Potatoes & dry beans
January February March April May June July August September October November December Average 1
2009 ... 2010 ... 2011 ... 2012 ... 2013 ...
164 135 150 171 150
156 137 156 171 149
162 138 181 185 157
163 146 184 203 167
160 152 182 188 219
162 141 186 176 213
152 141 213 176 231
149 137 174 163 194
142 127 154 142 165
128 123 145 136 152
130 138 160 144
135 163 168 147
150 140 171 167 180
Year Other crops
January February March April May June July August September October November December Average 1
2009 ... 2010 ... 2011 ... 2012 ... 2013 ...
123 125 131 132 131
123 125 131 132 131
123 125 131 132 131
123 125 131 132 131
123 125 131 132 131
123 125 131 132 131
123 125 131 133 131
123 125 131 133 131
124 127 131 131 131
125 130 132 131 131
125 130 132 131
125 130 132 131
124 126 131 132 131
Year Food commodities
January February March April May June July August September October November December Average 1
2009 ... 2010 ... 2011 ... 2012 ... 2013 ...
134 134 158 172 197
122 131 163 167 183
122 137 168 172 184
127 135 167 166 178
126 138 166 169 182
131 135 171 172 186
129 139 174 178 188
125 142 173 179 181
126 141 167 182 181
133 146 174 196 189
136 149 173 191
137 148 169 186
129 140 169 178 185
Year Livestock and products
January February March April May June July August September October November December Average 1
2009 ... 2010 ... 2011 ... 2012 ... 2013 ...
115 121 137 155 166
109 122 143 156 162
109 127 152 159 164
112 128 155 152 164
113 131 151 151 170
111 129 152 152 167
112 132 155 149 164
109 134 158 154 163
108 134 151 156 163
110 134 153 162 163
115 134 157 167
120 133 156 165
112 130 152 157 165
Year Meat animals
January February March April May June July August September October November December Average 1
2009 ... 2010 ... 2011 ... 2012 ... 2013 ...
106 110 140 163 163
105 113 143 166 161
105 120 151 166 158
110 128 158 162 160
110 130 151 159 163
106 124 146 162 163
107 125 152 155 163
104 128 153 156 165
103 128 149 154 165
103 124 156 161 164
104 122 158 160
105 127 156 160
106 123 151 160 163
Year Dairy products
January February March April May June July August September October November December Average 1
2009 ... 2010 ... 2011 ... 2012 ... 2013 ...
102 123 128 145 152
89 121 146 135 149
90 113 156 132 146
91 112 150 129 149
89 115 150 124 151
87 118 162 125 149
87 122 167 129 145
93 128 169 139 149
100 136 162 151 154
109 142 153 165 155
118 137 157 169
126 128 151 159
98 125 154 142 150
Poultry & eggs
Year January February March April May June July August September October November December Average 1
2009 ... 2010 ... 2011 ... 2012 ... 2013 ...
149 150 139 149 184
141 147 140 157 180
137 161 148 172 197
140 146 156 157 187
142 150 153 161 203
147 151 155 159 192
145 155 150 154 181
133 151 158 161 169
129 147 145 166 170
127 152 147 162 168
137 163 154 181
142 152 160 181
139 152 150 163 183
1 Simple average required for parity regulations. Weighted 1990-1992 average equals 100. Average is year-to-date for current year.

Agricultural Prices (October 2013) 43 USDA, National Agricultural Statistics Service
Prices Received Indexes as a Percent of 1910-1914 Base, Monthly and Annual Average – United States: 2009-2013 [Revised historical price indexes for months not shown are available at www.nass.usda.gov. Blank data cells indicate estimation period has not begun]
Year All products
January February March April May June July August September October November December Average 1
2009 ... 2010 ... 2011 ... 2012 ... 2013 ...
882 862
1054 1197 1377
799 840
1081 1148 1261
800 870
1100 1168 1274
820 857
1117 1133 1217
823 875
1113 1145 1242
848 859
1143 1158 1269
829 879
1163 1212 1269
801 896
1167 1228 1201
802 906
1137 1236 1180
852 955
1171 1332 1189
862 976
1169 1316
863 968
1138 1261
832 895
1129 1211 1248
Year All crops
January February March April May June July August September October November December Average 1
2009 ... 2010 ... 2011 ... 2012 ... 2013 ...
797 738 937
1056 1237
725 719 993
1023 1162
730 745 983
1047 1181
747 723 999
1039 1102
743 732
1012 1060 1110
789 713
1042 1063 1153
746 728
1049 1147 1139
724 749
1048 1160 1062
707 752
1009 1125 1021
753 808
1013 1182 1004
764 849
1022 1178
744 845 988
1118
747 758
1008 1100 1117
Year Food grains
January February March April May June July August September October November December Average 1
2009 ... 2010 ... 2011 ... 2012 ... 2013 ...
698 559 696 737 821
649 556 735 720 800
638 547 739 727 786
633 525 774 725 784
633 502 801 694 782
616 459 771 710 774
559 487 747 830 738
537 575 787 834 733
509 598 780 844 723
516 603 754 839 751
547 630 758 842
548 677 753 846
590 560 758 779 769
Year Feed grains & hay
January February March April May June July August September October November December Average 1
2009 ... 2010 ... 2011 ... 2012 ... 2013 ...
671 564 745 932
1069
604 544 828 955
1073
602 546 820 968
1089
599 527 938 972
1066
612 540 948 971
1066
604 529 938 955
1056
551 539 944
1043 1021
527 559
1008 1114 941
511 617 965
1041 837
553 660 892
1045 710
560 692 900
1075
552 721 900
1048
579 587 902
1010 993
Year Cotton
January February March April May June July August September October November December Average 1
2009 ... 2010 ... 2011 ... 2012 ... 2013 ...
389 515 695 763 617
349 550 786 781 651
342 550 714 762 656
378 565 734 765 664
380 564 704 714 663
381 580 705 653 671
369 580 698 648 685
419 640 796 604 651
450 633 791 600 631
495 654 780 591 659
504 690 784 586
537 687 752 608
416 601 745 673 655
Year Tobacco
January February March April May June July August September October November December Average 1
2009 ... 2010 ... 2011 ... 2012 ... 2013 ...
1569 1563 1491 1559 1760
1569 1563 1491 1559 1760
1569 1563 1491 1559 1760
1569 1563 1491 1559 1760
1569 1563 1491 1559 1760
1569 1563 1491 1559 1760
1569 1563 1491 1559 1760
1569 1563 1491 1559 1760
1569 1563 1491 1559 1760
1569 1563 1491 1559 1760
1569 1563 1491 1559
1563 1491 1559 1760
1569 1557 1497 1576 1760
Year Oilseeds
January February March April May June July August September October November December Average 1
2009 ... 2010 ... 2011 ... 2012 ... 2013 ...
981 951
1132 1173 1389
945 920
1248 1208 1396
899 918
1250 1279 1390
960 925
1288 1354 1370
1048 919
1296 1371 1404
1113 923
1301 1364 1427
1055 956
1299 1506 1442
1055 976
1311 1574 1300
867 816
1105 1314 1273
884 917
1133 1350 1233
905 1017 1178 1383
942 1092 1164 1394
971 944
1225 1356 1362
Year Fruits & nuts
January February March April May June July August September October November December Average 1
2009 ... 2010 ... 2011 ... 2012 ... 2013 ...
846 939
1059 1161 1234
851 1000 988
1139 1259
859 1003 1033 1196 1241
856 915
1069 1215 1124
939 994
1101 1490 1182
1017 992
1166 1335 1328
1034 1029 1284 1293 1312
1018 1059 1298 1352 1338
1101 1075 1264 1502 1447
1133 1122 1273 1563 1479
1092 1197 1239 1503
979 1040 1172 1320
977 1030 1162 1339 1294
See footnote(s) at end of table. --continued

44 Agricultural Prices (October 2013) USDA, National Agricultural Statistics Service
Prices Received Indexes as a Percent of 1910-1914 Base, Monthly and Annual Average – United States: 2009-2013 (continued) [Revised historical price indexes for months not shown are available at www.nass.usda.gov. Blank data cells indicate estimation period has not begun]
Year Commercial vegetables
January February March April May June July August September October November December Average 1
2009 ... 2010 ... 2011 ... 2012 ... 2013 ...
1239 1060 1405 841
1888
992 1054 1973 804
1516
1077 1501 1573 879
1643
1256 1357 1181 999
1193
1010 1226 1247 1128 1187
1106 1087 1193 1158 1176
967 1069 1152 1094 1275
1001 1079 972
1118 1373
963 1061 989
1226 1201
1196 1018 888
1077 1471
1544 1311 1134 1196
1489 1106 975 965
1153 1161 1224 1040 1392
Year Potatoes & dry beans
January February March April May June July August September October November December Average 1
2009 ... 2010 ... 2011 ... 2012 ... 2013 ...
831 683 761 868 762
791 696 792 868 756
819 697 917 938 797
824 738 931
1031 848
812 768 923 953
1108
821 712 942 894
1080
769 713
1078 892
1168
756 694 881 825 985
718 643 781 722 835
647 624 734 687 771
661 699 813 731
682 828 853 743
761 708 867 846 911
Year Other crops
January February March April May June July August September October November December Average 1
2009 ... 2010 ... 2011 ... 2012 ... 2013 ...
607 614 643 651 645
607 614 643 651 645
607 614 643 651 645
607 614 643 651 645
607 614 643 651 645
607 614 643 651 645
607 614 643 652 645
607 614 643 652 645
610 627 646 647 645
614 640 649 643 645
614 640 649 643
614 640 649 643
609 622 645 649 645
Year Livestock and products
January February March April May June July August September October November December Average 1
2009 ... 2010 ... 2011 ... 2012 ... 2013 ...
878 930
1048 1190 1269
836 937
1099 1199 1245
832 974
1162 1219 1259
861 978
1191 1165 1254
863 1004 1158 1155 1306
854 987
1169 1163 1280
859 1008 1186 1141 1254
833 1024 1211 1180 1246
831 1028 1159 1196 1253
843 1024 1176 1242 1252
882 1030 1204 1283
917 1022 1196 1268
857 996
1163 1200 1262
Year Meat animals
January February March April May June July August September October November December Average 1
2009 ... 2010 ... 2011 ... 2012 ... 2013 ...
1075 1119 1422 1655 1663
1067 1156 1461 1694 1637
1067 1218 1538 1695 1605
1120 1300 1607 1647 1626
1117 1325 1537 1624 1661
1078 1260 1490 1648 1660
1086 1274 1543 1578 1661
1060 1308 1559 1591 1683
1050 1308 1521 1564 1679
1048 1261 1593 1637 1671
1064 1243 1611 1630
1067 1296 1594 1627
1075 1256 1540 1633 1655
Year Dairy products
January February March April May June July August September October November December Average 1
2009 ... 2010 ... 2011 ... 2012 ... 2013 ...
818 991
1028 1163 1224
714 972
1175 1083 1200
720 911
1255 1058 1175
732 898
1206 1034 1200
714 923
1206 997
1212
695 948
1298 1003 1200
695 978
1341 1040 1169
745 1028 1360 1120 1200
800 1089 1298 1212 1237
880 1138 1231 1329 1249
948 1101 1261 1360
1015 1028 1212 1280
790 1000 1239 1140 1207
Year Poultry & eggs
January February March April May June July August September October November December Average 1
2009 ... 2010 ... 2011 ... 2012 ... 2013 ...
419 422 389 418 516
395 413 394 441 507
384 452 415 484 554
394 409 438 441 526
399 420 428 451 571
412 424 435 447 538
407 434 421 433 507
372 424 444 453 474
362 412 408 465 477
357 426 412 455 473
384 457 434 509
400 426 448 508
390 427 422 459 514
1 Simple average required for parity regulations. Weighted 1910-1914 average equals 100. Average is year-to-date for current year.

Agricultural Prices (October 2013) 45 USDA, National Agricultural Statistics Service
Reliability of Prices Received Estimates
Definition: Prices received represent sales from producers to first buyers. They include all grades and qualities. The
average commodity price from the survey multiplied by the total quantity marketed theoretically should give the total cash
receipts for the commodity.
Survey procedures: Primary sales data used to determine grain prices were obtained from probability samples of about
1900 mills and elevators. These procedures ensure that virtually all grain moving into commercial channels has a chance
of being included in the survey. Generally, States surveyed account for 90 percent or more of total United States
production. Livestock prices are obtained from packers, stockyards, auctions, dealers, and market check data from
AMS-USDA, private marketing organizations, and state commodity groups and agencies. Inter-farm sales of grain and
livestock are not included since they represent very small percentages of the total sales. Grain marketed for seed is also
excluded. Fruit and vegetable prices are obtained from sample surveys and market check data from AMS-USDA, private
marketing organizations, state agencies, and universities.
Summary and estimation procedures: Survey quantities sold are expanded by strata to state levels and used to weight
average strata prices to a state average. State prices are then weighted to a United States price based on expanded sales.
Recommendations are prepared by the State Field Offices and reviewed by the Agricultural Statistics Board in
Washington, D.C. State recommendations are reviewed for reasonableness with survey data, other States, and recent
historic estimates.
Revisions: For most items, the current month's preliminary price represents a 3-5 day period around the 15th of the
month. Previous month's prices represent actual dollars received for quantities sold during the entire month. Revisions are
published in monthly issues of Agricultural Prices.
Reliability: United States price estimates based on probability surveys generally have a sampling error of less than one
percent for the major commodities such as corn, wheat, soybeans, cotton, and rice. Current methods of summarization for
non-probability commodities are not designed directly to calculate sampling errors. However, analytical measures
approximate the United States relative sampling errors at around five percent. Any non-sampling errors are attributed to
such things as the inability to obtain correct information, differences in interpreting questions or definitions, mistakes in
coding or processing the data, etc. Efforts are made at each step in the survey process to minimize these non-sampling
errors.

46 Agricultural Prices (October 2013) USDA, National Agricultural Statistics Service
Prices Paid by Farmers
The October Index of Prices Paid for Commodities and Services, Interest, Taxes, and Farm Wage Rates (PPITW), at
218 (1990-1992=100), is up 0.5 percent from September but unchanged from October 2012.
Production index: The October index, at 230, is unchanged from last month but decreased 0.9 percent from last year.
Higher prices in October for concentrates, feeder cattle, feeder pigs, and nitrogen offset lower prices for feed grains,
complete feeds, diesel, and gasoline.
Feed: The October index, at 255, increased 0.4 percent from September but decreased 8.9 percent from last October.
Since September, higher prices for concentrates and hay & forages offset lower prices for feed grains, complete feeds, and
supplements.
Livestock and poultry: The October index, at 184, increased 5.1 percent from last month and 13 percent from last year.
Since September, prices for feeder cattle, feeder pigs, and milk cows are higher. The October feeder cattle price, at
$162.00 per cwt, is up $6.40 per cwt from the September price. October feeder pigs averaged $174.00 per cwt, up
$30.00 per cwt from September.
Fertilizer: The October index, at 282, is up 0.4 percent from September but 13 percent below October a year ago. Since
September, higher prices for nitrogen offset lower prices for potash & phosphate and mixed fertilizer.
Chemicals: The October index, at 160, increased 0.6 percent from September and 3.9 percent from last October.
Compared with last month, prices for herbicides, insecticides, and fungicides/other are higher.
Fuels: The October index, at 359, is down 1.6 percent from a month earlier and 3.0 percent below October 2012.
Compared with last month, prices are lower for diesel and gasoline but higher for LP gas.
Machinery: The October index, at 263, is unchanged from September but is 1.5 percent above last October.
Consumer price index: The September 2013 Consumer Price Index, as issued by the Bureau of Labor Statistics, for all
urban consumers (CPI-U) increased 0.1 percent before seasonal adjustment to a level of 234.149 (1982-1984=100). The
August index is 233.877. For the 12 month period ending in September, the overall index increased 1.2 percent.

Agricultural Prices (October 2013) 47 USDA, National Agricultural Statistics Service
Prices Paid Indexes and Related Parity Ratios – United States: October 2013 with Comparisons [Revised historical price indexes for months not shown are available at www.nass.usda.gov]
Indexes and
ratios
1910-1914 Base 1990-1992 Base
October 2012
September 2013
October 2013
October 2012
September 2013
October 2013
(percent) (percent) (percent) (percent) (percent) (percent)
Prices paid by farmers for commodities, services, interest, taxes, and wage rates (PPITW) ......................................... Production .......................................... Feed ............................................... Livestock and poultry ...................... Seeds ............................................. Fertilizer .......................................... Chemicals ....................................... Fuels ............................................... Supplies and repairs ....................... Autos and trucks ............................. Machinery ....................................... Building materials ........................... Services and rent ............................ Services .......................................... Rent ................................................ Interest
1 .............................................
Taxes 2 ...............................................
Wage rates ......................................... Production, interest, taxes, and wage rates (PITW) ................... Family living-CPI
3 ...............................
2897 2250 1365 2084 3606 1196 954
2852 1220
3130 6505 2395 2183 (NA) (NA)
3684 6080 7599
3034 2197
2888 2227 1239 2242 3776 1031 981
2818 1220
3177 6603 2443 2246 (NA) (NA)
3594 6273 7696
3016 2224
2898 2236 1244 2354 3776 1034 987
2771 1219
3184 6603 2448 2247 (NA) (NA)
3594 6273 7696
3027 2226
218 232 280 163 364 326 154 370 172
118 259 176
(NA) 167 212
147 227 203
226 172
217 230 254 175 381 281 159 365 172
119 263 180
(NA) 172 217
143 234 206
225 174
218 230 255 184 381 282 160 359 172
120 263 180
(NA) 172 217
143 234 206
225 174
Ratio (received/paid) ........................... Parity ratio
4 ........................................
Parity ratio adjusted 5 ..........................
PPITW adjusted for productivity
6 ...................................
(NA) 46 47
1518
(NA) 41 42
1487
(NA) 41 42
1489
96 (NA) (NA)
(NA)
86 (NA) (NA)
(NA)
86 (NA) (NA)
(NA)
Crop sector (PPITW) ........................... Livestock sector (PPITW) ...................
(NA) (NA)
(NA) (NA)
(NA) (NA)
223 212
223 210
223 212
Farm sector (production) ..................... Non-farm sector (production) ..............
(NA) (NA)
(NA) (NA)
(NA) (NA)
256 219
251 217
255 217
(NA) Not available. 1
Interest per acre on farm real estate debt and interest rate on farm non-real estate debt. 2
Farm real estate taxes payable per acre. 3
Bureau of Labor Statistics, Consumer Price Index for all urban consumers (CPI-U), for the previous month converted by the USDA. 4
Ratio of index of prices received to PPITW (1910-1914=100). 5
Based on estimated cash receipts, from marketings and government payments, the preliminary adjustment factor is 1.044 for 2013 and the revised factor is 1.041 for 2012.
6 PPITW is adjusted based on productivity trend for the prior 15 years.

48 Agricultural Prices (October 2013) USDA, National Agricultural Statistics Service
Prices Paid Indexes and Annual Weights for Input Components and Sub-components – United States: October 2013 with Comparisons [Revised historical price indexes for months not shown are available at www.nass.usda.gov. Relative weights are a five year moving average]
Relative weights Indexes (1990-1992=100)
2012 2013 October
2012 September
2013 October
2013
(percent) (percent) (percent) (percent) (percent)
Production items ................................................... Feed ................................................................. Feed grains ................................................... Complete feeds ............................................. Hay and forages ............................................ Concentrates ................................................. Supplements ................................................. Livestock and poultry ........................................ Feeder cattle ................................................. Feeder pigs ................................................... Milk cow replacements .................................. Poultry ........................................................... Seeds ............................................................... Field crops .................................................... Grasses and legumes ................................... Fertilizer ............................................................ Mixed fertilizer ............................................... Nitrogen ........................................................ Potash and phosphate .................................. Chemicals ......................................................... Herbicides ..................................................... Insecticides ................................................... Fungicides and other ..................................... Fuels ................................................................. Diesel ............................................................ Gasoline ........................................................ LP gas ........................................................... Supplies and repairs ......................................... Supplies ........................................................ Repairs ......................................................... Autos and trucks ............................................... Autos ............................................................. Trucks ........................................................... Machinery ......................................................... Tractors ......................................................... Self-propelled ................................................ Other machinery ............................................ Building materials .............................................. Services ............................................................ Custom rates ................................................. Other services ............................................... Rent .................................................................. Cash ............................................................. Share ............................................................ Interest .................................................................. Taxes .................................................................... Wage rates ........................................................... Family living-CPI ...................................................
71.1
12.7 1.8 6.2 1.6 2.0 1.1 8.3 6.5 0.7 0.7 0.5
4.3 3.9 0.4 5.7 2.5 2.4 0.8 3.2 2.0 0.7 0.5
4.0 2.5 0.8 0.7 4.6 1.5 3.0 1.2 0.2 1.1
4.3 0.9 1.7 1.6 4.2
12.0 1.2
10.7 6.6 3.5 3.0
3.4 3.1 7.2
15.3
71.9
13.4 1.9 6.6 1.7 2.1 1.1 8.0 6.3 0.6 0.7 0.5
4.4 4.0 0.4 6.1 2.7 2.6 0.9 3.2 2.0 0.7 0.5
4.0 2.5 0.8 0.7 4.5 1.5 3.0 1.2 0.2 1.1
4.5 1.0 1.8 1.7 4.1
11.7 1.2
10.5 6.7 3.6 3.1
3.2 3.1 6.9
15.0
232
280 294 286 246 273 282 163 176 76
123 166
364 384 178 326 288 345 392 154 139 178 185
370 415 324 257 172 167 174 118 115 118
259 215 275 268 176 167 157 168 212 270 145
147 227 203 172
230
254 230 258 227 296 229 175 184 157 121 166
381 402 184 281 267 282 322 159 142 185 191
365 396 306 324 172 167 174 119 115 120
263 216 280 273 180 172 157 174 217 278 147
143 234 206 174
230
255 195 253 230 348 229 184 191 189 124 166
381 402 184 282 266 287 316 160 143 186 193
359 389 291 332 172 167 174 120 115 120
263 216 280 273 180 172 157 174 217 278 147
143 234 206 174

Agricultural Prices (October 2013) 49 USDA, National Agricultural Statistics Service
100
120
140
160
180
200
220
240
2004 2005 2006 2007 2008 2009 2010 2011 2012 2013
Percent
Paid Indexes by Month, All Items and Production Items – United States: 1990-1992=100
All Items Production Items
30
80
130
180
230
280
2004 2005 2006 2007 2008 2009 2010 2011 2012 2013
Percent
Paid Indexes, Annual Averages, Production Items, Interest, Taxes, and Wages – United States: 1990-1992=100
Production Items Interest Taxes Wages

50 Agricultural Prices (October 2013) USDA, National Agricultural Statistics Service
100
120
140
160
180
200
220
240
2004 2005 2006 2007 2008 2009 2010 2011 2012 2013
Percent
Paid Indexes by Farm Type and Month, All Items – United States: 1990-1992=100
All Farms Crop Farms Livestock Farms
90
110
130
150
170
190
210
230
250
270
2004 2005 2006 2007 2008 2009 2010 2011 2012 2013
Percent
Paid Indexes by Origin and Month, All Production Items – United States: 1990-1992=100
All Nonfarm Farm

Agricultural Prices (October 2013) 51 USDA, National Agricultural Statistics Service
0
100
200
300
400
500
2004 2005 2006 2007 2008 2009 2010 2011 2012 2013
Percent
Paid Indexes by Non-Farm Sector and Month, Supplies & Repairs, Fertilizer, Machinery, and Fuel – United States: 1990-1992=100
Supplies & Repairs Fertilizer
Machinery Fuel
50
100
150
200
250
300
2004 2005 2006 2007 2008 2009 2010 2011 2012 2013
Percent
Paid Indexes by Month, Feed and Livestock & Poultry – United States: 1990-1992=100
Feed Livestock & Poultry

52 Agricultural Prices (October 2013) USDA, National Agricultural Statistics Service
Feed Price Ratios – United States: October 2013 with Comparisons
Feed price ratio 1 October 2012 September 2013
Preliminary October 2013
Broiler-feed: pounds of broiler grower feed equal in value to 1 pound of broiler, live weight
2 ..........................................................
Market egg feed: pounds of laying feed equal in value to 1 dozen eggs
3 ......................................................................................
Hog-corn: bushels of corn equal in value to 100 pounds of hog, live weight ........................................................................... Milk-feed: pounds of 16% mixed dairy feed equal in value to 1 pound of whole milk
4 .....................................................................
Steer and heifer-corn: bushels of corn equal in value to 100 pounds of steer & heifers, live weight ...................................................... Turkey-feed: pounds of turkey grower equal in value to 1 pound of turkey, live weight
5 .............................................................
2.9
5.6
9.1
1.74
18.7
4.9
3.6
6.4
13.1
1.88
23.5
5.0
3.9
7.4
15.5
2.09
28.5
5.6 1 Effective January 1995, prices of commercial prepared feeds are based on current United States prices received for corn, soybeans, alfalfa hay, and all wheat.
2 The price of commercial prepared broiler feed is based on current United States prices received for corn and soybeans. The modeled feed uses 58 percent corn and 42 percent soybeans.
3 The price of commercial prepared layer feed is based on current United States prices received for corn and soybeans. The modeled feed uses 75 percent corn and 25 percent soybeans.
4 The price of commercial prepared dairy feed is based on current United States prices received for corn, soybeans, and alfalfa hay. The modeled feed uses 51 percent corn, 41 percent alfalfa hay, and 8 percent soybeans.
5 The price of commercial prepared turkey feed is based on current United States prices received for corn, soybeans, and wheat. The modeled feed uses 51 percent corn, 28 percent soybeans, and 21 percent wheat.
Prices Received Used to Calculate Feed Price Ratios – United States: October 2013 with Comparisons [Price data source for livestock and poultry commodities is United States Department of Agriculture's Agricultural Marketing Service]
Item October 2012 September 2013 Preliminary
October 2013
(dollars) (dollars) (dollars)
Broilers, live ...........................................................pound Eggs, market .......................................................... dozen Hogs, all ..................................................................... cwt Milk, all ....................................................................... cwt Steers and heifers ...................................................... cwt Turkeys, live ...........................................................pound Corn ...................................................................... bushel Hay, alfalfa ................................................................. ton Soybeans .............................................................. bushel Wheat, all .............................................................. bushel
0.490 0.837
62.00 21.60
127.00 0.769
6.78
212.00
14.20 8.38
0.540 0.823
70.70 20.10
127.00 0.679
5.40
194.00
13.30 6.80
0.530 0.836
69.70 20.30
128.00 0.701
4.49
193.00
12.60 7.09
Prices Paid for Feeder Livestock – United States: October 2013 with Comparisons [Price data source is United States Department of Agriculture's Agricultural Marketing Service]
Item October 2012 September 2013 Preliminary
October 2013
(dollars) (dollars) (dollars)
Feeder cattle and calves ............................................ cwt Feeder pigs ................................................................ cwt
149.00 70.00
155.60 144.00
162.00 174.00

Agricultural Prices (October 2013) 53 USDA, National Agricultural Statistics Service
Prices Paid Indexes as a Percent of 1990-1992 Base, Monthly and Annual Average – United States: 2009-2013 [Revised historical price indexes for months not shown are available at www.nass.usda.gov. Blank data cells indicate estimation period has not begun]
Year
Commodities, services, interest, taxes, and wage rates (PPITW)
January February March April May June July August September October November December Average 1
2009 ... 2010 ... 2011 ... 2012 ... 2013 ...
179 180 195 210 219
178 180 198 211 220
179 181 201 215 220
179 182 204 215 219
179 182 204 214 219
179 181 204 214 219
177 181 205 213 220
176 182 205 216 216
175 183 205 217 217
176 185 206 218 218
177 187 207 217
177 189 206 217
178 183 203 215 219
Year
Items used for production, interest, taxes, and wage rates (PITW)
January February March April May June July August September October November December Average 1
2009 ... 2010 ... 2011 ... 2012 ... 2013 ...
183 184 201 217 227
182 183 204 218 228
183 184 208 223 228
183 186 210 222 227
183 186 211 222 228
183 185 210 221 227
181 185 212 221 228
179 185 212 224 224
178 187 212 225 225
179 190 212 226 225
180 192 214 225
181 194 213 225
181 187 210 222 227
Year Items used for production
January February March April May June July August September October November December Average 1
2009 ... 2010 ... 2011 ... 2012 ... 2013 ...
184 185 204 222 233
183 184 207 223 234
184 185 212 229 234
185 187 215 228 233
184 187 216 228 233
184 186 215 227 233
182 186 217 227 234
180 187 217 231 229
179 188 218 232 230
179 191 217 232 230
181 194 219 231
181 197 218 231
182 188 215 228 232
Year Feed
January February March April May June July August September October November December Average 1
2009 ... 2010 ... 2011 ... 2012 ... 2013 ...
189 185 204 226 267
187 178 212 229 268
185 175 212 244 269
185 171 223 246 264
192 171 230 250 268
196 170 232 251 268
190 172 233 265 275
184 174 239 288 255
180 180 241 285 254
181 188 231 280 255
183 195 227 276
183 200 225 275
186 180 226 260 264
Year Livestock & poultry
January February March April May June July August September October November December Average 1
2009 ... 2010 ... 2011 ... 2012 ... 2013 ...
120 121 151 179 173
119 126 155 186 169
119 131 159 184 160
122 140 160 176 158
119 137 149 173 154
112 134 146 170 154
113 135 152 148 162
111 133 147 151 171
109 130 146 157 175
110 132 156 163 184
113 134 165 167
114 142 168 171
115 133 155 169 166
Year Seeds
January February March April May June July August September October November December Average 1
2009 ... 2010 ... 2011 ... 2012 ... 2013 ...
275 304 311 336 364
275 304 311 336 364
304 311 336 364 381
304 311 336 364 381
304 311 336 364 381
304 311 336 364 381
304 311 336 364 381
304 311 336 364 381
304 311 336 364 381
304 311 336 364 381
304 311 336 364
304 311 336 364
299 310 332 359 378
Year Fertilizer
January February March April May June July August September October November December Average 1
2009 ... 2010 ... 2011 ... 2012 ... 2013 ...
340 232 305 347 323
325 236 304 333 326
320 238 318 336 327
322 246 326 338 332
301 250 327 343 335
271 249 328 345 329
258 247 333 340 313
240 247 331 320 280
234 255 332 322 281
232 266 342 326 282
230 276 349 324
231 286 346 323
275 252 328 333 313
Year Chemicals
January February March April May June July August September October November December Average 1
2009 ... 2010 ... 2011 ... 2012 ... 2013 ...
142 143 144 149 157
148 143 145 152 157
150 143 145 152 158
152 144 144 151 157
153 144 144 152 158
148 145 143 153 157
149 145 144 153 158
145 146 145 154 158
146 146 146 154 159
148 146 148 154 160
153 144 147 156
154 144 148 156
149 144 145 153 158
See footnote(s) at end of table. --continued

54 Agricultural Prices (October 2013) USDA, National Agricultural Statistics Service
Prices Paid Indexes as a Percent of 1990-1992 Base, Monthly and Annual Average – United States: 2009-2013 (continued) [Revised historical price indexes for months not shown are available at www.nass.usda.gov. Blank data cells indicate estimation period has not begun]
Year Fuels
January February March April May June July August September October November December Average 1
2009 ... 2010 ... 2011 ... 2012 ... 2013 ...
204 279 320 356 345
198 271 335 364 365
191 276 363 384 365
200 288 380 382 356
207 289 383 361 352
238 275 373 337 348
232 272 371 336 351
243 278 368 359 360
246 279 368 371 365
252 291 360 370 359
265 299 369 355
267 309 359 346
229 284 362 360 357
Year Supplies & repairs
January February March April May June July August September October November December Average 1
2009 ... 2010 ... 2011 ... 2012 ... 2013 ...
158 158 162 169 172
157 158 163 170 172
157 159 163 170 172
157 159 165 171 172
156 159 166 171 172
156 160 166 171 172
157 160 167 172 173
157 161 168 171 172
157 161 169 172 172
157 161 169 172 172
157 161 169 172
157 161 169 172
157 160 166 171 172
Year Autos & trucks
January February March April May June July August September October November December Average 1
2009 ... 2010 ... 2011 ... 2012 ... 2013 ...
107 113 114 117 119
108 113 115 118 119
109 113 115 118 119
109 113 116 118 120
109 112 116 118 120
110 112 116 118 120
110 112 116 117 120
109 112 116 117 119
109 112 116 117 119
111 112 116 118 120
112 113 116 118
113 113 116 119
110 113 116 118 120
Year Machinery
January February March April May June July August September October November December Average 1
2009 ... 2010 ... 2011 ... 2012 ... 2013 ...
214 226 237 251 261
219 226 238 252 263
220 226 239 254 262
220 227 240 255 263
220 228 242 256 263
220 228 242 257 263
226 230 243 257 264
226 230 245 258 263
226 231 247 259 263
225 232 249 259 263
225 235 250 259
225 235 251 261
222 230 244 257 263
Year Building materials
January February March April May June July August September October November December Average 1
2009 ... 2010 ... 2011 ... 2012 ... 2013 ...
167 163 168 173 178
165 164 169 174 179
164 165 170 175 179
163 166 171 176 180
163 167 171 176 179
163 166 172 176 179
162 166 173 176 179
162 166 173 176 179
163 166 173 176 180
162 166 172 176 180
162 166 172 177
163 167 172 177
163 166 171 176 179
Year Services
2
January February March April May June July August September October November December Average 1
2009 ... 2010 ... 2011 ... 2012 ... 2013 ...
157 160 163 167 170
157 159 163 167 170
156 160 164 167 170
156 160 163 167 170
156 160 164 167 171
158 162 165 169 172
156 162 165 168 172
156 162 165 168 172
156 162 165 168 172
156 161 164 167 172
156 161 164 167
156 161 164 167
156 161 164 167 171
Year Rent
2
January February March April May June July August September October November December Average 1
2009 ... 2010 ... 2011 ... 2012 ... 2013 ...
184 190 205 212 217
184 190 205 212 217
184 190 205 212 217
184 190 205 212 217
184 190 205 212 217
184 190 205 212 217
184 190 205 212 217
184 190 205 212 217
184 190 205 212 217
184 190 205 212 217
184 190 205 212
184 190 205 212
184 190 205 212 217
Year Ratio
January February March April May June July August September October November December Average 1
2009 ... 2010 ... 2011 ... 2012 ... 2013 ...
78 76 85 90 99
71 73 86 86 90
70 76 86 86 91
72 74 86 83 88
73 76 86 84 89
75 75 88 86 91
74 76 89 90 91
72 77 90 90 88
72 78 87 90 86
76 82 90 96 86
77 82 89 95
77 81 87 92
74 77 87 89 90
See footnote(s) at end of table. --continued

Agricultural Prices (October 2013) 55 USDA, National Agricultural Statistics Service
Prices Paid 1990-1992 Base Indexes Monthly and Annual Average – United States: 2009-2013 (continued) [Revised historical price indexes for months not shown are available at www.nass.usda.gov. Blank data cells indicate estimation period has not begun]
Year January February March April May June July August September October November December Average
1
Interest
2009 ... 2010 ... 2011 ... 2012 ... 2013 ...
137 133 145 147 143
137 133 145 147 143
137 133 145 147 143
137 133 145 147 143
137 133 145 147 143
137 133 145 147 143
137 133 145 147 143
137 133 145 147 143
137 133 145 147 143
137 133 145 147 143
137 133 145 147
137 133 145 147
137 133 145 147 143
Year January February March April May June July August September October November December Average
1
Taxes
2009 ... 2010 ... 2011 ... 2012 ... 2013 ...
204 213 222 227 234
204 213 222 227 234
204 213 222 227 234
204 213 222 227 234
204 213 222 227 234
204 213 222 227 234
204 213 222 227 234
204 213 222 227 234
204 213 222 227 234
204 213 222 227 234
204 213 222 227
204 213 222 227
204 213 222 227 234
Year January February March April May June July August September October November December Average
1
Wage rates
2009 ... 2010 ... 2011 ... 2012 ... 2013 ...
189 191 195 199 208
189 191 195 199 208
189 191 195 199 208
188 187 189 197 206
188 187 189 197 206
188 187 189 197 206
184 186 189 196 206
184 186 189 196 206
184 186 189 196 206
189 192 193 203 206
189 192 193 203
189 192 193 203
188 189 192 199 207
Year January February March April May June July August September October November December Average
1
Family living
2009 ... 2010 ... 2011 ... 2012 ... 2013 ...
157 161 163 168 171
157 161 164 169 172
158 161 166 170 173
158 162 167 171 173
159 162 168 170 173
160 162 167 170 173
160 162 168 170 173
160 162 168 171 173
160 162 168 172 174
160 162 168 172 174
160 162 168 171
160 163 167 170
159 162 167 170 173
Year January February March April May June July August September October November December Average
1
Production items with farm origin 3
2009 ... 2010 ... 2011 ... 2012 ... 2013 ...
179 182 203 229 255
177 180 209 233 254
181 181 214 245 254
182 183 220 243 251
185 182 220 244 252
185 180 220 243 252
181 181 222 244 258
178 182 224 256 250
176 184 224 256 251
176 188 222 256 255
178 192 224 255
179 197 224 256
180 184 219 247 253
Year January February March April May June July August September October November December Average
1
Production items with non-farm origin 4
2009 ... 2010 ... 2011 ... 2012 ... 2013 ...
187 186 204 218 220
186 186 206 218 222
185 187 210 220 222
186 189 213 220 222
184 190 214 220 223
183 189 213 218 222
182 189 214 218 220
181 190 214 217 217
180 191 214 219 217
181 193 215 219 217
182 195 216 218
182 197 215 217
183 190 212 219 220
Year January February March April May June July August September October November December Average
1
Crop sector (PPITW)
2009 ... 2010 ... 2011 ... 2012 ... 2013 ...
189 191 206 219 225
188 191 207 219 226
190 192 212 223 227
191 193 213 223 227
189 193 214 222 227
188 193 213 221 227
187 193 214 221 226
186 193 214 221 223
185 194 214 222 223
186 196 215 223 223
187 197 216 222
187 199 216 221
188 194 213 221 225
Year January February March April May June July August September October November December Average
1
Livestock Sector (PPITW)
2009 ... 2010 ... 2011 ... 2012 ... 2013 ...
169 170 185 200 212
168 169 188 202 213
168 170 190 207 212
168 171 194 206 210
169 171 194 206 211
170 170 194 205 211
168 170 195 205 214
166 171 196 212 209
165 172 196 212 210
166 175 195 212 212
167 177 197 211
167 180 196 212
168 172 193 208 211
1 Simple average and is year-to-date for current year.
2 For the 1990-92=100 base period, the Services & Rent Index is separated.
3 Feed, livestock & poultry purchases, and seed.
4 Fertilizer, agricultural chemicals, fuels, supplies & repairs, autos & trucks, machinery, building materials, and services & rent.

56 Agricultural Prices (October 2013) USDA, National Agricultural Statistics Service
Prices Paid Indexes as a Percent of 1910-1914 Base, Monthly and Annual Average – United States: 2009-2013 [Revised historical price indexes for months not shown are available at www.nass.usda.gov. Blank data cells indicate estimation period has not begun]
Year
Commodities, services, interest, taxes, and wage rates (PPITW)
January February March April May June July August September October November December Average 1
2009 ... 2010 ... 2011 ... 2012 ... 2013 ...
2381 2402 2601 2794 2913
2369 2396 2631 2806 2926
2377 2407 2679 2862 2931
2386 2421 2710 2856 2918
2383 2424 2716 2855 2922
2381 2412 2714 2844 2918
2359 2415 2726 2839 2929
2342 2420 2732 2880 2881
2332 2433 2736 2892 2888
2342 2467 2736 2897 2898
2355 2493 2751 2885
2358 2522 2743 2883
2364 2434 2706 2858 2912
Year
Items used for production, interest, taxes, and wage rates (PITW)
January February March April May June July August September October November December Average 1
2009 ... 2010 ... 2011 ... 2012 ... 2013 ...
2463 2473 2703 2921 3053
2447 2465 2737 2933 3065
2455 2477 2790 2996 3069
2465 2493 2825 2988 3054
2460 2496 2830 2987 3058
2454 2483 2828 2974 3052
2428 2485 2842 2970 3066
2406 2492 2848 3015 3008
2394 2507 2852 3029 3016
2405 2546 2853 3034 3027
2422 2578 2870 3022
2425 2612 2862 3021
2435 2509 2820 2991 3047
Year Items used for production
January February March April May June July August September October November December Average 1
2009 ... 2010 ... 2011 ... 2012 ... 2013 ...
1788 1792 1977 2156 2256
1774 1785 2006 2166 2266
1782 1796 2052 2221 2270
1791 1814 2088 2216 2259
1787 1816 2092 2215 2262
1782 1805 2091 2204 2257
1763 1808 2103 2201 2269
1744 1813 2108 2240 2220
1734 1826 2112 2252 2227
1738 1854 2109 2250 2236
1752 1882 2124 2239
1755 1912 2117 2238
1766 1825 2082 2217 2252
Year Feed
January February March April May June July August September October November December Average 1
2009 ... 2010 ... 2011 ... 2012 ... 2013 ...
921 905 996
1105 1306
911 868
1035 1119 1308
903 854
1037 1190 1315
901 835
1089 1199 1290
937 836
1121 1223 1307
959 831
1133 1225 1307
925 841
1135 1295 1341
900 849
1169 1405 1244
881 881
1175 1393 1239
883 917
1126 1365 1244
894 952
1110 1346
891 974
1096 1344
909 879
1102 1267 1290
Year Livestock & poultry
January February March April May June July August September October November December Average 1
2009 ... 2010 ... 2011 ... 2012 ... 2013 ...
1539 1547 1930 2287 2212
1517 1611 1984 2378 2156
1518 1674 2032 2356 2042
1565 1786 2040 2252 2023
1516 1750 1909 2208 1968
1436 1709 1866 2171 1971
1445 1724 1939 1896 2074
1418 1704 1880 1930 2186
1399 1662 1866 2004 2242
1409 1684 1988 2084 2354
1444 1717 2104 2131
1463 1811 2152 2188
1472 1698 1974 2157 2123
Year Seeds
January February March April May June July August September October November December Average 1
2009 ... 2010 ... 2011 ... 2012 ... 2013 ...
2722 3008 3082 3327 3606
2722 3008 3082 3327 3606
3008 3082 3327 3606 3776
3008 3082 3327 3606 3776
3008 3082 3327 3606 3776
3008 3082 3327 3606 3776
3008 3082 3327 3606 3776
3008 3082 3327 3606 3776
3008 3082 3327 3606 3776
3008 3082 3327 3606 3776
3008 3082 3327 3606
3008 3082 3327 3606
2960 3070 3286 3560 3742
Year Fertilizer
January February March April May June July August September October November December Average 1
2009 ... 2010 ... 2011 ... 2012 ... 2013 ...
1246 851
1119 1270 1186
1191 866
1116 1220 1196
1173 871
1165 1232 1199
1181 903
1195 1238 1216
1102 918
1197 1257 1228
992 914
1203 1263 1205
944 904
1220 1248 1147
881 907
1214 1173 1028
856 935
1217 1180 1031
849 975
1253 1196 1034
845 1010 1279 1189
848 1049 1270 1184
1009 925
1204 1221 1147
Year Chemicals
January February March April May June July August September October November December Average 1
2009 ... 2010 ... 2011 ... 2012 ... 2013 ...
877 885 891 919 972
915 885 895 942 969
930 887 894 938 974
941 892 892 931 972
944 893 890 938 974
913 895 886 947 973
919 899 891 948 977
895 900 894 951 974
906 903 902 954 981
914 900 912 954 987
943 893 910 967
954 887 918 966
921 893 898 946 975
See footnote(s) at end of table. --continued

Agricultural Prices (October 2013) 57 USDA, National Agricultural Statistics Service
Prices Paid Indexes as a Percent of 1910-1914 Base, Monthly and Annual Average – United States: 2009-2013 (continued) [Revised historical price indexes for months not shown are available at www.nass.usda.gov. Blank data cells indicate estimation period has not begun]
Year Fuels
January February March April May June July August September October November December Average 1
2009 ... 2010 ... 2011 ... 2012 ... 2013 ...
1575 2151 2468 2745 2661
1526 2093 2589 2813 2815
1476 2133 2801 2966 2813
1546 2224 2931 2949 2744
1600 2229 2959 2786 2718
1835 2125 2875 2598 2683
1788 2100 2863 2594 2709
1874 2147 2843 2771 2779
1897 2152 2841 2859 2818
1948 2245 2778 2852 2771
2048 2305 2850 2741
2061 2387 2769 2670
1765 2191 2797 2779 2751
Year Supplies & repairs
January February March April May June July August September October November December Average 1
2009 ... 2010 ... 2011 ... 2012 ... 2013 ...
1119 1120 1151 1203 1222
1116 1124 1154 1204 1222
1114 1125 1155 1207 1221
1114 1127 1169 1212 1223
1109 1131 1176 1212 1222
1106 1133 1179 1214 1224
1111 1138 1187 1218 1226
1111 1139 1193 1217 1222
1111 1140 1198 1220 1220
1114 1141 1198 1220 1219
1114 1142 1198 1220
1114 1143 1198 1218
1113 1134 1180 1214 1222
Year Autos & trucks
January February March April May June July August September October November December Average 1
2009 ... 2010 ... 2011 ... 2012 ... 2013 ...
2841 2996 3026 3109 3168
2874 3004 3053 3133 3172
2892 3003 3067 3136 3175
2901 2996 3076 3138 3184
2909 2985 3089 3132 3180
2924 2979 3091 3132 3185
2932 2976 3084 3123 3179
2895 2975 3074 3121 3170
2903 2980 3071 3124 3177
2958 2989 3078 3130 3184
2987 3003 3084 3142
2993 3014 3090 3151
2917 2992 3074 3131 3177
Year Machinery
January February March April May June July August September October November December Average 1
2009 ... 2010 ... 2011 ... 2012 ... 2013 ...
5380 5677 5937 6304 6557
5501 5678 5982 6315 6585
5527 5674 6002 6360 6582
5523 5694 6029 6390 6589
5517 5717 6067 6411 6594
5508 5726 6083 6436 6589
5660 5769 6108 6456 6622
5662 5782 6150 6468 6603
5658 5802 6190 6493 6603
5655 5825 6237 6505 6603
5655 5894 6259 6509
5652 5907 6287 6537
5575 5762 6111 6432 6593
Year Building materials
January February March April May June July August September October November December Average 1
2009 ... 2010 ... 2011 ... 2012 ... 2013 ...
2263 2211 2277 2353 2418
2239 2224 2290 2370 2429
2232 2236 2305 2376 2434
2221 2253 2318 2386 2442
2217 2267 2326 2395 2436
2208 2258 2336 2395 2433
2207 2255 2347 2388 2433
2203 2254 2346 2391 2438
2208 2251 2345 2396 2443
2207 2251 2344 2395 2448
2205 2255 2341 2399
2208 2263 2341 2404
2218 2248 2326 2387 2435
Year Services & rent
2
January February March April May June July August September October November December Average 1
2009 ... 2010 ... 2011 ... 2012 ... 2013 ...
1980 2027 2112 2179 2228
1978 2025 2114 2181 2229
1977 2031 2119 2180 2229
1974 2030 2118 2181 2229
1974 2033 2123 2184 2234
1985 2043 2132 2195 2245
1976 2043 2132 2191 2245
1975 2044 2132 2191 2245
1975 2043 2133 2193 2246
1974 2040 2125 2183 2247
1970 2037 2121 2182
1970 2038 2120 2182
1976 2036 2123 2185 2238
See footnote(s) at end of table. --continued

58 Agricultural Prices (October 2013) USDA, National Agricultural Statistics Service
Prices Paid Indexes as a Percent of 1910-1914 Base, Monthly and Annual Average – United States: 2009-2013 (continued) [Revised historical price indexes for months not shown are available at www.nass.usda.gov. Blank data cells indicate estimation period has not begun]
Year Interest
January February March April May June July August September October November December Average 1
2009 ... 2010 ... 2011 ... 2012 ... 2013 ...
3436 3339 3646 3684 3594
3436 3339 3646 3684 3594
3436 3339 3646 3684 3594
3436 3339 3646 3684 3594
3436 3339 3646 3684 3594
3436 3339 3646 3684 3594
3436 3339 3646 3684 3594
3436 3339 3646 3684 3594
3436 3339 3646 3684 3594
3436 3339 3646 3684 3594
3436 3339 3646 3684
3436 3339 3646 3684
3436 3339 3646 3684 3594
Year Taxes
January February March April May June July August September October November December Average 1
2009 ... 2010 ... 2011 ... 2012 ... 2013 ...
5453 5694 5935 6080 6273
5453 5694 5935 6080 6273
5453 5694 5935 6080 6273
5453 5694 5935 6080 6273
5453 5694 5935 6080 6273
5453 5694 5935 6080 6273
5453 5694 5935 6080 6273
5453 5694 5935 6080 6273
5453 5694 5935 6080 6273
5453 5694 5935 6080 6273
5453 5694 5935 6080
5453 5694 5935 6080
5453 5694 5935 6080 6273
Year Wage rates
January February March April May June July August September October November December Average 1
2009 ... 2010 ... 2011 ... 2012 ... 2013 ...
7062 7159 7301 7444 7767
7062 7159 7301 7444 7767
7062 7159 7301 7444 7767
7017 6991 7075 7372 7696
7017 6991 7075 7372 7696
7017 6991 7075 7372 7696
6888 6972 7062 7340 7696
6888 6972 7062 7340 7696
6888 6972 7062 7340 7696
7062 7192 7205 7599 7696
7062 7192 7205 7599
7062 7192 7205 7599
7007 7079 7161 7439 7717
Year Family living
January February March April May June July August September October November December Average 1
2009 ... 2010 ... 2011 ... 2012 ... 2013 ...
2005 2058 2092 2153 2187
2015 2059 2102 2162 2205
2020 2067 2122 2179 2211
2025 2071 2136 2185 2209
2031 2072 2146 2183 2212
2049 2070 2144 2180 2218
2045 2071 2146 2176 2219
2050 2073 2152 2188 2221
2051 2075 2155 2198 2224
2053 2077 2150 2197 2226
2055 2078 2149 2187
2051 2082 2143 2181
2038 2071 2136 2181 2213
Year
Commodities, services, interest, taxes, and wage rates Adjusted for productivity
January February March April May June July August September October November December Average 1
2009 ... 2010 ... 2011 ... 2012 ... 2013 ...
1421 1411 1457 1486 1491
1420 1410 1463 1489 1495
1422 1413 1473 1500 1497
1421 1403 1464 1495 1490
1421 1404 1466 1494 1491
1424 1402 1465 1492 1491
1410 1401 1466 1489 1493
1408 1402 1468 1496 1486
1407 1404 1469 1500 1487
1421 1425 1478 1518 1489
1424 1430 1480 1515
1424 1434 1478 1514
1419 1412 1469 1499 1491
Year Parity ratio
3
January February March April May June July August September October November December Average 1
2009 ... 2010 ... 2011 ... 2012 ... 2013 ...
37 36 41 43 47
34 35 41 41 43
34 36 41 41 43
34 35 41 40 42
35 36 41 40 43
36 36 42 41 43
35 36 43 43 43
34 37 43 43 42
34 37 42 43 41
36 39 43 46 41
37 39 42 46
37 38 41 44
35 37 42 43 43
Year Adjusted parity ratio (PPITW)
4
January February March April May June July August September October November December Average 1
2009 ... 2010 ... 2011 ... 2012 ... 2013 ...
39 37 42 44 49
35 36 42 42 44
35 38 42 42 45
36 37 42 41 43
36 38 42 41 44
37 37 43 42 45
37 38 44 44 45
36 38 44 44 43
36 39 43 44 42
38 40 44 47 42
38 41 44 47
38 40 43 45
37 38 43 44 44
1 Simple average and is year-to-date for current year.
2 For the 1990-1992=100 base reference period, the Services & Rent Index is separated.
3 Ratio of index of prices received to index of prices paid for commodities, services, interest, taxes, and wage rates.
4 Ratio of the index of prices received after adjustment for government payments to the index of prices paid for commodities, services, interest, taxes, and wage rates.

Agricultural Prices (October 2013) 59 USDA, National Agricultural Statistics Service
Prices Paid Index Sub-Components as a Percent of 1990-1992 Base, Monthly and Annual Average – United States: 2009-2013 [Revised historical price indexes for months not shown are available at www.nass.usda.gov. Blank data cells indicate estimation period has not begun]
Year Feed grains
January February March April May June July August September October November December Average 1
2009 ... 2010 ... 2011 ... 2012 ... 2013 ...
183 157 215 261 299
163 152 245 269 302
164 153 240 272 306
164 146 273 271 298
169 150 271 271 298
171 146 270 268 296
154 151 268 300 285
145 157 289 320 261
142 176 271 294 230
154 186 250 294 195
156 197 252 302
155 208 253 296
160 165 258 285 277
Year Complete feeds
January February March April May June July August September October November December Average 1
2009 ... 2010 ... 2011 ... 2012 ... 2013 ...
188 195 208 226 272
193 187 212 226 270
193 183 217 250 269
191 178 222 251 267
200 178 227 257 263
206 177 231 256 266
206 178 229 264 268
199 179 234 285 264
196 182 239 290 258
191 189 231 286 253
191 198 229 282
191 202 224 279
195 186 225 263 265
Year Hay & forages
January February March April May June July August September October November December Average 1
2009 ... 2010 ... 2011 ... 2012 ... 2013 ...
177 142 150 224 251
171 139 155 231 254
170 142 166 239 256
166 143 184 245 254
164 147 215 244 258
153 147 213 232 253
146 148 228 233 246
139 146 228 237 234
141 148 226 239 227
141 147 233 246 230
141 147 219 248
140 149 225 248
154 145 204 239 246
Year Concentrates
January February March April May June July August September October November December Average 1
2009 ... 2010 ... 2011 ... 2012 ... 2013 ...
190 190 213 194 241
183 187 214 201 241
179 183 204 203 247
186 176 204 212 230
197 182 207 224 276
215 184 213 241 274
199 190 212 267 327
198 193 211 301 252
188 187 216 297 296
190 197 201 273 348
193 209 192 254
194 208 184 260
193 191 206 244 273
Year Supplements
January February March April May June July August September October November December Average 1
2009 ... 2010 ... 2011 ... 2012 ... 2013 ...
215 230 230 234 263
222 206 238 232 267
206 200 225 245 268
210 204 236 232 267
219 182 242 240 243
214 182 240 235 242
204 180 240 258 241
208 181 257 302 229
200 215 268 288 229
210 225 250 282 229
225 220 257 276
223 229 251 285
213 205 245 259 248
Year Feeder Cattle
January February March April May June July August September October November December Average 1
2009 ... 2010 ... 2011 ... 2012 ... 2013 ...
112 115 149 182 177
110 120 153 190 171
109 125 157 188 163
116 134 159 182 162
117 131 151 182 157
113 129 150 178 159
116 132 156 157 169
114 132 151 163 179
111 127 151 171 184
109 130 162 176 191
111 134 171 174
111 141 173 176
112 129 157 177 171
Year Feeder pigs
January February March April May June July August September October November December Average 1
2009 ... 2010 ... 2011 ... 2012 ... 2013 ...
159 160 199 207 195
156 174 220 223 200
162 189 221 215 165
160 209 200 174 155
109 201 152 138 144
66 181 121 134 131
62 169 124 73
137
49 150 112 50
146
65 152 108 46
157
89 148 114 76
189
107 140 145 138
127 162 172 174
109 170 157 137 162
Year Milk cow replacements
January February March April May June July August September October November December Average 1
2009 ... 2010 ... 2011 ... 2012 ... 2013 ...
145 119 115 129 121
145 119 115 129 121
145 119 115 129 121
123 118 126 128 121
123 118 126 128 121
123 118 126 128 121
113 117 131 126 121
113 117 131 126 121
113 117 131 126 121
110 118 131 123 124
110 118 131 123
110 118 131 123
123 118 126 127 121
See footnote(s) at end of table. --continued

60 Agricultural Prices (October 2013) USDA, National Agricultural Statistics Service
Prices Paid Index Sub-Components as a Percent of 1990-1992 Base, Monthly and Annual Average – United States: 2009-2013 (continued) [Revised historical price indexes for months not shown are available at www.nass.usda.gov. Blank data cells indicate estimation period has not begun]
Year Poultry
January February March April May June July August September October November December Average 1
2009 ... 2010 ... 2011 ... 2012 ... 2013 ...
149 151 158 166 166
149 151 158 166 166
149 151 158 166 166
149 151 158 166 166
149 151 158 166 166
149 151 158 166 166
149 151 158 166 166
149 151 158 166 166
149 151 158 166 166
149 151 158 166 166
149 151 158 166
149 151 158 166
149 151 158 166 166
Year Field crop seeds
January February March April May June July August September October November December Average 1
2009 ... 2010 ... 2011 ... 2012 ... 2013 ...
287 319 329 356 384
287 319 329 356 384
319 329 356 384 402
319 329 356 384 402
319 329 356 384 402
319 329 356 384 402
319 329 356 384 402
319 329 356 384 402
319 329 356 384 402
319 329 356 384 402
319 329 356 384
319 329 356 384
314 327 352 379 398
Year Grass & legume seeds
January February March April May June July August September October November December Average 1
2009 ... 2010 ... 2011 ... 2012 ... 2013 ...
157 161 139 145 178
157 161 139 145 178
161 139 145 178 184
161 139 145 178 184
161 139 145 178 184
161 139 145 178 184
161 139 145 178 184
161 139 145 178 184
161 139 145 178 184
161 139 145 178 184
161 139 145 178
161 139 145 178
160 143 144 173 183
Year Mixed fertilizer
January February March April May June July August September October November December Average 1
2009 ... 2010 ... 2011 ... 2012 ... 2013 ...
337 230 292 319 283
331 229 305 322 284
298 225 310 311 293
293 233 313 311 292
281 238 310 310 293
272 241 310 312 292
260 245 310 306 292
251 250 308 285 268
247 256 310 286 267
241 263 318 288 266
240 275 321 286
237 284 319 284
274 247 311 302 283
Year Nitrogen
January February March April May June July August September October November December Average 1
2009 ... 2010 ... 2011 ... 2012 ... 2013 ...
333 220 284 355 346
276 227 286 327 355
295 229 311 339 348
308 242 323 352 360
291 244 330 369 367
263 241 337 372 354
250 231 344 366 324
219 229 343 336 278
211 237 337 340 282
215 255 348 345 287
215 260 356 342
212 273 355 343
257 241 330 349 330
Year Potash & phosphate
January February March April May June July August September October November December Average 1
2009 ... 2010 ... 2011 ... 2012 ... 2013 ...
369 275 410 408 386
453 287 357 386 372
463 301 361 405 372
456 304 379 380 369
394 310 368 371 372
289 301 362 366 368
274 298 370 373 347
271 295 368 380 328
261 306 387 382 322
251 308 399 392 316
247 326 416 391
272 332 407 385
333 304 382 385 355
Year Herbicides
January February March April May June July August September October November December Average 1
2009 ... 2010 ... 2011 ... 2012 ... 2013 ...
135 133 130 133 141
141 132 130 137 140
144 132 130 138 141
145 133 130 137 140
145 133 129 138 141
140 132 129 139 141
141 133 129 139 141
137 133 130 139 141
138 133 131 139 142
138 132 132 139 143
142 131 132 141
144 130 133 140
141 132 130 138 141
Year Insecticides
January February March April May June July August September October November December Average 1
2009 ... 2010 ... 2011 ... 2012 ... 2013 ...
152 159 166 172 182
157 160 167 177 182
158 161 167 171 184
161 163 167 170 183
163 163 166 172 184
158 164 166 174 183
160 165 167 175 184
157 166 167 176 184
160 167 169 177 185
162 166 171 178 186
168 165 171 180
171 165 172 181
161 164 168 175 184
See footnote(s) at end of table. --continued

Agricultural Prices (October 2013) 61 USDA, National Agricultural Statistics Service
Prices Paid Index Sub-Components as a Percent of 1990-1992 Base, Monthly and Annual Average – United States: 2009-2013 (continued) [Revised historical price indexes for months not shown are available at www.nass.usda.gov. Blank data cells indicate estimation period has not begun]
Year Fungicides & other
January February March April May June July August September October November December Average 1
2009 ... 2010 ... 2011 ... 2012 ... 2013 ...
156 163 172 179 189
163 164 174 183 189
165 165 174 181 190
167 166 174 179 190
169 167 173 181 190
164 168 172 183 190
166 170 173 183 191
162 170 174 184 190
164 172 175 185 191
166 172 177 185 193
173 171 177 188
175 171 178 188
166 168 174 183 190
Year Diesel
January February March April May June July August September October November December Average 1
2009 ... 2010 ... 2011 ... 2012 ... 2013 ...
215 279 347 393 393
204 275 369 406 412
192 290 403 426 407
206 305 419 424 393
208 307 417 409 387
237 296 405 385 385
240 293 402 380 387
250 299 397 406 391
251 298 395 419 396
257 310 390 415 389
271 320 407 405
268 331 397 400
233 300 396 406 394
Year Gasoline
January February March April May June July August September October November December Average 1
2009 ... 2010 ... 2011 ... 2012 ... 2013 ...
154 237 269 293 288
165 231 278 310 317
169 242 308 334 320
177 249 328 338 308
195 248 338 323 312
226 239 318 307 313
218 238 316 298 310
226 238 315 322 309
221 236 313 333 306
222 244 299 324 291
231 249 294 299
227 260 284 287
203 243 305 314 307
Year LP Gas
January February March April May June July August September October November December Average 1
2009 ... 2010 ... 2011 ... 2012 ... 2013 ...
242 339 282 293 237
226 312 284 279 248
226 263 284 291 262
216 265 299 282 275
228 262 316 230 273
261 231 319 194 253
214 221 325 220 269
234 238 328 231 311
262 248 339 238 324
284 268 323 257 332
302 269 324 242
337 275 313 221
253 266 311 248 278
Year Supplies
January February March April May June July August September October November December Average 1
2009 ... 2010 ... 2011 ... 2012 ... 2013 ...
156 153 158 164 166
155 153 158 164 166
154 153 158 165 166
154 154 159 165 167
153 154 162 165 167
152 154 162 166 168
152 155 163 166 168
152 155 164 165 167
152 156 164 167 167
152 156 164 167 167
153 156 164 167
153 156 164 166
153 155 162 166 167
Year Repairs
January February March April May June July August September October November December Average 1
2009 ... 2010 ... 2011 ... 2012 ... 2013 ...
158 160 164 172 175
158 161 165 172 175
158 161 165 173 175
159 161 168 174 175
158 162 168 174 175
158 162 168 174 175
159 163 169 175 175
159 163 170 175 175
159 163 171 174 174
159 163 171 174 174
159 163 171 174
159 163 171 174
159 162 168 174 175
Year Autos
January February March April May June July August September October November December Average 1
2009 ... 2010 ... 2011 ... 2012 ... 2013 ...
109 112 111 115 117
109 111 112 116 117
109 111 112 115 117
109 111 113 116 117
109 110 114 116 116
109 110 115 116 116
110 110 115 115 116
108 110 115 115 116
108 110 115 115 115
110 110 115 115 115
112 111 115 116
112 111 115 116
110 111 114 116 116
Year Trucks
January February March April May June July August September October November December Average 1
2009 ... 2010 ... 2011 ... 2012 ... 2013 ...
107 113 114 117 119
108 113 115 118 120
109 113 116 118 120
109 113 116 118 120
109 113 116 118 120
110 112 116 118 120
110 112 116 118 120
109 112 116 118 120
109 112 116 118 120
111 113 116 118 120
112 113 116 119
113 114 116 119
110 113 116 118 120
See footnote(s) at end of table. --continued

62 Agricultural Prices (October 2013) USDA, National Agricultural Statistics Service
Prices Paid Index Sub-Components as a Percent of 1990-1992 Base, Monthly and Annual Average – United States: 2009-2013 (continued) [Revised historical price indexes for months not shown are available at www.nass.usda.gov. Blank data cells indicate estimation period has not begun]
Year Tractors
January February March April May June July August September October November December Average 1
2009 ... 2010 ... 2011 ... 2012 ... 2013 ...
184 188 201 209 214
183 189 202 209 216
185 189 203 208 216
186 190 203 209 216
186 191 203 210 216
186 191 203 210 216
186 194 204 211 216
187 195 204 211 216
188 197 208 214 216
188 198 208 215 216
189 199 209 216
189 200 209 214
186 193 205 211 216
Year Self-propelled
January February March April May June July August September October November December Average 1
2009 ... 2010 ... 2011 ... 2012 ... 2013 ...
218 234 248 267 279
229 234 249 269 278
229 234 250 270 279
229 235 252 270 279
229 236 253 271 279
229 236 254 272 278
230 237 255 273 281
230 238 257 274 280
230 239 259 274 280
230 240 263 275 280
231 247 265 275
231 247 266 278
229 238 256 272 279
Year Other machinery
January February March April May June July August September October November December Average 1
2009 ... 2010 ... 2011 ... 2012 ... 2013 ...
228 240 245 259 270
230 240 248 258 273
231 240 249 263 272
230 240 250 265 272
230 241 253 266 273
229 241 253 267 273
244 243 254 268 273
243 243 256 268 273
242 243 256 268 273
242 243 256 268 273
241 244 257 269
241 244 259 269
236 242 253 266 273
Year Custom rates
January February March April May June July August September October November December Average 1
2009 ... 2010 ... 2011 ... 2012 ... 2013 ...
145 145 148 157 157
145 145 148 157 157
145 145 148 157 157
145 145 148 157 157
145 145 148 157 157
145 145 148 157 157
145 145 148 157 157
145 145 148 157 157
145 145 148 157 157
145 145 148 157 157
145 145 148 157
145 145 148 157
145 145 148 157 157
Year Other services
January February March April May June July August September October November December Average 1
2009 ... 2010 ... 2011 ... 2012 ... 2013 ...
158 161 164 168 171
158 161 164 168 171
158 162 165 168 171
157 162 165 168 171
157 162 166 169 172
159 164 167 170 174
158 164 167 169 174
157 164 167 170 174
158 164 167 170 174
157 163 166 168 174
157 163 166 168
157 163 165 168
158 163 166 169 173
Year Cash rent
January February March April May June July August September October November December Average 1
2009 ... 2010 ... 2011 ... 2012 ... 2013 ...
236 243 262 270 278
236 243 262 270 278
236 243 262 270 278
236 243 262 270 278
236 243 262 270 278
236 243 262 270 278
236 243 262 270 278
236 243 262 270 278
236 243 262 270 278
236 243 262 270 278
236 243 262 270
236 243 262 270
236 243 262 270 278
Year Share rent
January February March April May June July August September October November December Average 1
2009 ... 2010 ... 2011 ... 2012 ... 2013 ...
124 129 139 145 147
124 129 139 145 147
124 129 139 145 147
124 129 139 145 147
124 129 139 145 147
124 129 139 145 147
124 129 139 145 147
124 129 139 145 147
124 129 139 145 147
124 129 139 145 147
124 129 139 145
124 129 139 145
124 129 139 145 147
1 Simple average and is year-to-date for current year.

Agricultural Prices (October 2013) 63 USDA, National Agricultural Statistics Service
Prices Paid Indexes as a Percent of 1990-1992 Base, Monthly and Annual Average – United States: 2009-2013 (continued) [Revised historical price indexes for months not shown are available at www.nass.usda.gov. Blank data cells indicate estimation period has not begun]
Year Interest
January February March April May June July August September October November December Average 1
2009 ... 2010 ... 2011 ... 2012 ... 2013 ...
137 133 145 147 143
137 133 145 147 143
137 133 145 147 143
137 133 145 147 143
137 133 145 147 143
137 133 145 147 143
137 133 145 147 143
137 133 145 147 143
137 133 145 147 143
137 133 145 147 143
137 133 145 147
137 133 145 147
137 133 145 147 143
Year Taxes
January February March April May June July August September October November December Average 1
2009 ... 2010 ... 2011 ... 2012 ... 2013 ...
204 213 222 227 234
204 213 222 227 234
204 213 222 227 234
204 213 222 227 234
204 213 222 227 234
204 213 222 227 234
204 213 222 227 234
204 213 222 227 234
204 213 222 227 234
204 213 222 227 234
204 213 222 227
204 213 222 227
204 213 222 227 234
Year Wage rates
January February March April May June July August September October November December Average 1
2009 ... 2010 ... 2011 ... 2012 ... 2013 ...
189 191 195 199 208
189 191 195 199 208
189 191 195 199 208
188 187 189 197 206
188 187 189 197 206
188 187 189 197 206
184 186 189 196 206
184 186 189 196 206
184 186 189 196 206
189 192 193 203 206
189 192 193 203
189 192 193 203
188 189 192 199 207
Year Family living
January February March April May June July August September October November December Average 1
2009 ... 2010 ... 2011 ... 2012 ... 2013 ...
157 161 163 168 171
157 161 164 169 172
158 161 166 170 173
158 162 167 171 173
159 162 168 170 173
160 162 167 170 173
160 162 168 170 173
160 162 168 171 173
160 162 168 172 174
160 162 168 172 174
160 162 168 171
160 163 167 170
159 162 167 170 173
See footnote(s) at end of table. --continued

64 Agricultural Prices (October 2013) USDA, National Agricultural Statistics Service
Prices Paid Indexes as a Percent of 1990-1992 Base, Monthly and Annual Average – United States: 2009-2013 (continued) [Revised historical price indexes for months not shown are available at www.nass.usda.gov. Blank data cells indicate estimation period has not begun]
Year Production items with farm origin
3
January February March April May June July August September October November December Average 1
2009 ... 2010 ... 2011 ... 2012 ... 2013 ...
179 182 203 229 255
177 180 209 233 254
181 181 214 245 254
182 183 220 243 251
185 182 220 244 252
185 180 220 243 252
181 181 222 244 258
178 182 224 256 250
176 184 224 256 251
176 188 222 256 255
178 192 224 255
179 197 224 256
180 184 219 247 253
Year Production items with non-farm origin
4
January February March April May June July August September October November December Average 1
2009 ... 2010 ... 2011 ... 2012 ... 2013 ...
187 186 204 218 220
186 186 206 218 222
185 187 210 220 222
186 189 213 220 222
184 190 214 220 223
183 189 213 218 222
182 189 214 218 220
181 190 214 217 217
180 191 214 219 217
181 193 215 219 217
182 195 216 218
182 197 215 217
183 190 212 219 220
Year Crop sector (PPITW)
January February March April May June July August September October November December Average 1
2009 ... 2010 ... 2011 ... 2012 ... 2013 ...
189 191 206 219 225
188 191 207 219 226
190 192 212 223 227
191 193 213 223 227
189 193 214 222 227
188 193 213 221 227
187 193 214 221 226
186 193 214 221 223
185 194 214 222 223
186 196 215 223 223
187 197 216 222
187 199 216 221
188 194 213 221 225
Year Livestock Sector (PPITW)
January February March April May June July August September October November December Average 1
2009 ... 2010 ... 2011 ... 2012 ... 2013 ...
169 170 185 200 212
168 169 188 202 213
168 170 190 207 212
168 171 194 206 210
169 171 194 206 211
170 170 194 205 211
168 170 195 205 214
166 171 196 212 209
165 172 196 212 210
166 175 195 212 212
167 177 197 211
167 180 196 212
168 172 193 208 211
1 Simple average and is year-to-date for current year.
2 For the 1990-92=100 base period, the Services & Rent Index is separated.
3 Feed, livestock & poultry purchases, and seed.
4 Fertilizer, agricultural chemicals, fuels, supplies & repairs, autos & trucks, machinery, building materials, and services & rent.

Agricultural Prices (October 2013) 65 USDA, National Agricultural Statistics Service
Reliability of Prices Paid Estimates
Definition: Prices paid by farmers represent the average costs of inputs purchased by farmers and ranchers to produce
agricultural commodities. Conceptually, the average price when multiplied by quantity purchased should equal total
producer expenditures for the item.
Survey procedures: The prices paid data are obtained from establishments that sell goods and services to farmers and
ranchers. Annually, about 8,500 firms are randomly selected from lists by type of item sold with an average response rate
in the range of 75-80 percent. Firms are asked to report the price for the specified item "most commonly bought by
farmers" or that was the "volume seller". Approximately 135 items are surveyed each March to represent all production
input items purchased. The survey reference period for most items is the five business days centered at the 15th of the
month. Separate prices paid surveys are conducted for agricultural chemicals, fuels, feed, fertilizer, machinery, and seed.
Summary and estimation procedures: The annual March Prices Paid Survey is summarized as a non-probability survey.
Average prices reported are aggregated to the region and United States level using weights available from expenditure
data and other administrative sources. Price recommendations are prepared by the State Field Offices and Headquarters
for review by the Agricultural Statistics Board in Washington, D.C. Also, the change in price level for individual items
surveyed are combined to the regional and United States levels, and are published as prices paid indexes referenced to a
specific base period. Prices paid indexes for new autos and trucks, building materials, farm supplies, motor supplies, and
marketing containers are updated based on price changes measured in selected Bureau of Labor Statistics (BLS) indexes.
Revisions: Any revisions are published in the monthly and in annual issues of Agricultural Prices. The basis for revision
must be supported by additional data that directly affect the level of the estimate. More revisions are likely for March
when separate prices paid surveys are conducted, in lieu of BLS indexes, by the USDA to measure price change.
Reliability: Current methods of summarization for the March data are not designed directly to calculate sampling errors.
However, analytical measures approximate the United States relative sampling errors for major items around 10 percent.
Any non-sampling errors are attributed to such things as the inability to obtain correct information, differences in
interpreting questions or definitions, mistakes in coding or processing the data, etc. Efforts are made at each step in the
survey process to minimize these non-sampling errors.
Program change: Effective January 1, 1995, the National Agricultural Statistics Service updated the weights and
changed the construction of its prices paid and received by farmers’ indexes. A Federal Register Notice dated
October 28, 1994 discussed these program modifications.
A 1990-1992 reference and base period replaced the 1977 reference and 1971-1973 base weight period. Five-year moving
average weights replaced the current fixed 1971-1973 base period weights. The 1910-1914=100 price indexes, required by
statute for computing parity prices, were linked forward based on the changes in the new 1990-1992=100 indexes. The
new indexes were constructed by multiplying the ratios of the current prices to the base period prices by the moving
average weights (adjusted for seasonal marketing patterns for the prices received indexes).

66 Agricultural Prices (October 2013) USDA, National Agricultural Statistics Service
Information Contacts General Troy Joshua, Chief, Environmental, Economics and Demographics Branch .................................................. (202) 720-6146 Below are the commodity specialists to contact for additional information. Crop Prices Received Lance Honig, Chief, Crops Branch ................................................................................................................. (202) 720-2127 Anthony Prillaman, Head, Field Crops Section ............................................................................................... (202) 720-2127 Angie Considine – Peanuts, Rice ................................................................................................................... (202) 720-7688 Brent Chittenden – Oats, Rye, Wheat ........................................................................................................... (202) 720-8068 Angie Considine – Cotton, Cotton Ginnings, Sorghum ................................................................................. (202) 720-7688 Chris Hawthorn – Corn, Proso Millet, Flaxseed ............................................................................................ (202) 720-9526 Cody Brokmeyer – Crop Weather, Barley, Hay ............................................................................................ (202) 720-5944 Travis Thorson – Soybeans, Sunflower, Other Oilseeds ................................................................................ (202) 720-7369 Jorge Garcia-Pratts, Head, Fruits, Vegetables and Special Crops Section ....................................................... (202) 720-2127 Debbie Flippin – Fresh and Processing Vegetables, Onions, Strawberries.................................................... (202) 720-2157 Fred Granja – Apples, Apricots, Cherries, Plums, Prunes, Tobacco ............................................................. (202) 720-4288 Jorge Garcia-Pratts – Floriculture, Maple Syrup, Nursery, Tree Nuts .......................................................... (202) 720-2127 Lakeya Jones – Citrus, Coffee, Sugar Crops, Grapes, Tropical Fruits ........................................................... (202) 720-5412 Daphne Schauber – Berries, Cranberries, Potatoes, Sweet Potatoes ............................................................. (202) 720-4285 Dan Norris – Austrian Winter Peas, Dry Edible Peas, Lentils, Mints, Mushrooms, Peaches, Pears, Wrinkled Seed Peas, Dry Beans .................................................................................................................. (202) 720-3250 Livestock Prices Received Dan Kerestes, Chief, Livestock Branch ........................................................................................................... (202) 720-3570 Scott Hollis, Head, Livestock Section .............................................................................................................. (202) 720-3570 Travis Averill – Cattle .................................................................................................................................... (202) 720-3040 Mike Miller – Milk, Milk Cows .................................................................................................................... (202) 720-3278 Doug Bounds – Hogs ..................................................................................................................................... (202) 720-3106 Alissa Cowell-Mytar – Sheep, Lambs, and Goats ......................................................................................... (202) 720-4751 Bruce Boess, Head, Poultry and Specialty Commodities Section.................................................................... (202) 720-3570 Doug Boline – Turkeys ................................................................................................................................... (202 720-0585 Tom Kruchten – Honey ................................................................................................................................. (202) 690-4870 Kim Linonis – Eggs........................................................................................................................................ (202) 690-8632 Miste Salmon – Broilers ................................................................................................................................. (202) 720-3244 Indexes, Prices Paid, and Parity Prices Troy Joshua, Chief, Environmental, Economics and Demographics Branch .................................................................................................................................... (202) 720-6146 Tony Dorn, Head, Economics Section ............................................................................................................. (202) 690-3223 Daryl Brinkman – Prices Received Indexes, Parity Prices ............................................................................ (202) 720-8844 Chris Dickerson – Prices Received Indexes, Parity Prices, Grazing Fees ..................................................... (202) 690-1348 Vincent Davis – Prices Paid Indexes, Prices Paid for Feed, Fertilizer, Agricultural Chemicals, Seeds, Farm Supplies and Repairs, Farm Machinery, Fuels, Feeder Livestock, Poultry Chicks, Feed Price Ratios, Autos & Trucks .............................................................................................................. (202) 690-3229

Access to NASS Reports For your convenience, you may access NASS reports and products the following ways:
All reports are available electronically, at no cost, on the NASS web site: http://www.nass.usda.gov
Both national and state specific reports are available via a free e-mail subscription. To set-up this free
subscription, visit http://www.nass.usda.gov and in the “Follow NASS” box under “Receive reports by Email,”
click on “National” or “State” to select the reports you would like to receive.
For more information on NASS surveys and reports, call the NASS Agricultural Statistics Hotline at (800) 727-9540,
7:30 a.m. to 4:00 p.m. ET, or e-mail: [email protected].
The U.S. Department of Agriculture (USDA) prohibits discrimination against its customers, employees, and applicants for
employment on the bases of race, color, national origin, age, disability, sex, gender identity, religion, reprisal, and where
applicable, political beliefs, marital status, familial or parental status, sexual orientation, or all or part of an individual's
income is derived from any public assistance program, or protected genetic information in employment or in any program
or activity conducted or funded by the Department. (Not all prohibited bases will apply to all programs and/or
employment activities.)
If you wish to file a Civil Rights program complaint of discrimination, complete the USDA Program Discrimination
Complaint Form (PDF), found online at http://www.ascr.usda.gov/complaint_filing_cust.html, or at any USDA office, or
call (866) 632-9992 to request the form. You may also write a letter containing all of the information requested in the
form. Send your completed complaint form or letter to us by mail at U.S. Department of Agriculture, Director, Office of
Adjudication, 1400 Independence Avenue, S.W., Washington, D.C. 20250-9410, by fax (202) 690-7442 or email at